the state university of new york summary of findings …...flacs iii in 2014. in 2017, flacs ii...
TRANSCRIPT

SUMMARY OF FINDINGS AND RECOMMENDATIONS
Charter Schools InstituteThe State University of New York
MARCH 1, 2019
PROPOSAL TO AUTHORIZE FAMILY LIFE ACADEMY CHARTER SCHOOLS TO OPERATE THE PROPOSEDFAMILY LIFE ACADEMY CHARTER SCHOOL IV

EXECUTIVE SUMMARYThe board of trustees of Family Life Academy Charter Schools (“FLACS” or the “education corporation”), a not-for-profit charter school education corporation authorized by the State University of New York Board of Trustees (the “SUNY Trustees”) to operate three schools, Family Life Academy Charter School (“FLACS I”), Family Life Academy Charter School II (“FLACS II”), and Family Life Academy Charter School III (“FLACS III”), seeks the authority to operate one additional charter school to be located in a private building in New York City Community School District (“CSD”) 9 in the Bronx. The education corporation submitted the proposal for authority to operate Family Life Academy Charter School IV (“FLACS IV”) to the SUNY Charter Schools Institute (the “Institute”) on January 9, 2019, in response to the Institute’s 2019 Request for Proposals (the “RFP”) (available at: http://www.newyorkcharters.org/suny-releases-final-2019-rfp/), released on behalf of the SUNY Trustees on December 12, 2018. The Institute makes copies of applications available at: http://www.newyorkcharters.org/request-for-proposals/2019-suny-request-for-proposals-round-1-spring-cycle/.
FLACS IV will open in September 2020 with 156 students in Kindergarten – 1st grade and ultimately grow serve 702 students in Kindergarten – 8th grade during its first charter term. FLACS IV will add a 2nd grade in Year 2. In its third year, FLACS IV will launch its middle school by adding 6th grade as well as 3rd grade. In each subsequent year, the school will grow both the elementary and middle schools by one grade so that by the end of its charter term the school will offer Kindergarten – 8th grade. FLACS IV will fill all seats that become available through attrition in all grades throughout the year. The school will replicate the highly effective instructional program implemented at the other schools operated by the education corporation. Information regarding the renewal history, academic performance, and student discipline for the existing schools is presented in Appendix B.
FLACS will work in partnership with the Latino Pastoral Action Center, Inc. (“LPAC”), which provides organizational support to community- and faith-based organizations. LPAC will support FLACS IV in recruiting and retaining students who are economically disadvantaged and/or ELLs via outreach to its extensive network in the local community. LPAC will also provide FLACS IV students after school homework help and recreational programs, as well as offer direct access to its family and community support programs. LPAC may also be involved in facilities financing solutions for the school.
After a thorough review process consistent with the New York Charter Schools Act of 1998 (as amended, the “Act”), the Institute finds that the proposal for FLACS’s authority to operate FLACS IV rigorously demonstrates the criteria detailed in the Institute’s 2019 RFP, which align with the Act.
Based on the proposal, as amended by the applicant, and the foregoing:
The Institute recommends that the SUNY Trustees approve the proposal to authorize Family Life Academy Charter Schools to operate Family Life Academy Charter School IV.

TABLE OF
CONTENTS
FINDINGS
2
BACKGROUND & DESCRIPTION
4
NOTIFICATION & PUBLIC COMMENTS
11
PREFERENCE SCORING
11
CONCLUSION & RECOMMENDATIONS
13
APPENDIX A Summary of Public Comments Received APPENDIX B Existing School Performance APPENDIX C Fiscal Dashboard

2
FINDINGS Based on the comprehensive review of the proposal and interviews of the applicant and the education corporation board of trustees, the Institute makes the following findings.
1. The charter school described in the proposal meets the requirements of the Act and other applicable laws, rules, and regulations as reflected in (among other things):
• the inclusion of appropriate policies and procedures for the provision of services and programs for students with disabilities and English language learners (“ELLs”);
• the required policies for addressing the issues related to student discipline, personnel matters, and health services;
• an admissions policy that complies with the Act and federal law; • the inclusion of by-laws for the operation of the education corporation; and,• the inclusion of an analysis of the projected fiscal and programmatic impact of the school on
surrounding public and private schools.
2. The applicant has demonstrated the ability to operate the school in an educationally and fiscally sound manner as reflected in (among other things):
• the provision of an educational program that meets or exceeds the state performance standards;• the articulation of a culture of self-evaluation and accountability at both the administrative and
board level;• the student achievement goals articulated by the applicant;• appropriate rosters of educational personnel;• a sound mission statement;• a comprehensive assessment plan;• the provision of sound startup, first-year, and five-year budget plans;• a plan to acquire comprehensive general liability insurance to include any vehicles, employees,
and property;• evidence of adequate community support for, and interest in, the charter school sufficient to
allow the school to reach anticipated enrollment;• the inclusion of descriptions of programmatic and independent fiscal audits, with fiscal audits
occurring at least annually;• the inclusion of a school calendar and school day schedule that provide at least as much
instruction time during the school year as required of other public schools; and,• the inclusion of methods and strategies for serving students with disabilities in compliance with
federal laws and regulations.
3. Granting the proposal is likely to: a) have a significant educational benefit to the students expected to attend the proposed charter school; b) improve student learning and achievement; and, c) materially further the purposes of the Act. This finding is supported by (among other things):
• a strong board that has consistently provided rigorous oversight to the schools as the organization has grown and has a demonstrated track record of strong ties to local community- and faith-based organizations;

3
• the support of a network team (employees of FLACS who work across schools) and a community partner, LPAC, which provides capacity building and leadership development services and is deeply rooted in the community from which FLACS IV will draw its student population;
• an extended school day that provides more than 1,200 hours of instruction, or 33% more than the state minimum of 900 hours required for 1st – 6th grades and 21% more than the 990 hours required for 7th – 12th grade;
• a rigorous, network-created curriculum that has resulted in exceptional student outcomes and full term renewals for FLACS I, FLACS II, and FLACS III; and,
• an instructional program focused on the whole child that includes activities and programs aimed at supporting students’ physical and mental wellness.
4. The proposed charter school would meet or exceed enrollment and retention targets, as prescribed by the SUNY Trustees, of students with disabilities, ELLs, and students who are eligible applicants for the federal Free and Reduced Price Lunch (“FRPL”) program as required by Education Law § 2852(9-a)(b)(i).
5. The applicants have conducted public outreach for the school, in conformity with a thorough and meaningful public review process prescribed by the SUNY Trustees, to solicit community input regarding the proposed charter school and to address comments received from the impacted community concerning the educational and programmatic needs of students in conformity with Education Law § 2852(9-a)(b)(ii).
6. The Institute has determined that the proposal rigorously demonstrates the criteria and best satisfies the objectives contained within the RFP, and, therefore, is a “qualified application” within the meaning of Education Law § 2852(9-a)(d) that should be submitted to the New York State Board of Regents (the “Board of Regents”) for approval.
The Institute developed the RFP “in a manner that facilitate[d] a thoughtful review of charter school applications, consider[ed] the demand for charter schools by the community, and s[ought] to locate charter schools in a region or regions where there may be a lack of alternatives and access to charter schools would provide new alternatives within the local public education system that would offer the greatest educational benefit to students,” in accordance with Education Law § 2852(9-a)(b). The Institute also posted the draft RFP for public comment and responded to same.
The Institute conducted a rigorous evaluation of the proposal under consideration including academic and fiscal soundness, and legal reviews. In addition, the Institute engaged independent consultants to evaluate the proposal based on the criteria set forth in the RFP. Pursuant to its protocols, the Institute conducted an interview with the founding team including the applicants, the FLACS board of trustees, and key FLACS IV leadership. Trustee Joseph Belluck, Chairman of the SUNY Trustees’ Charter Schools Committee, also met with the founding team.
Amendments to the Act in 2015 restricted the total number of charter schools the SUNY Trustees and the Board of Regents may approve to open in New York City. Since then the SUNY Trustees and the Board of Regents have approved all except for seven charters for that area.

4
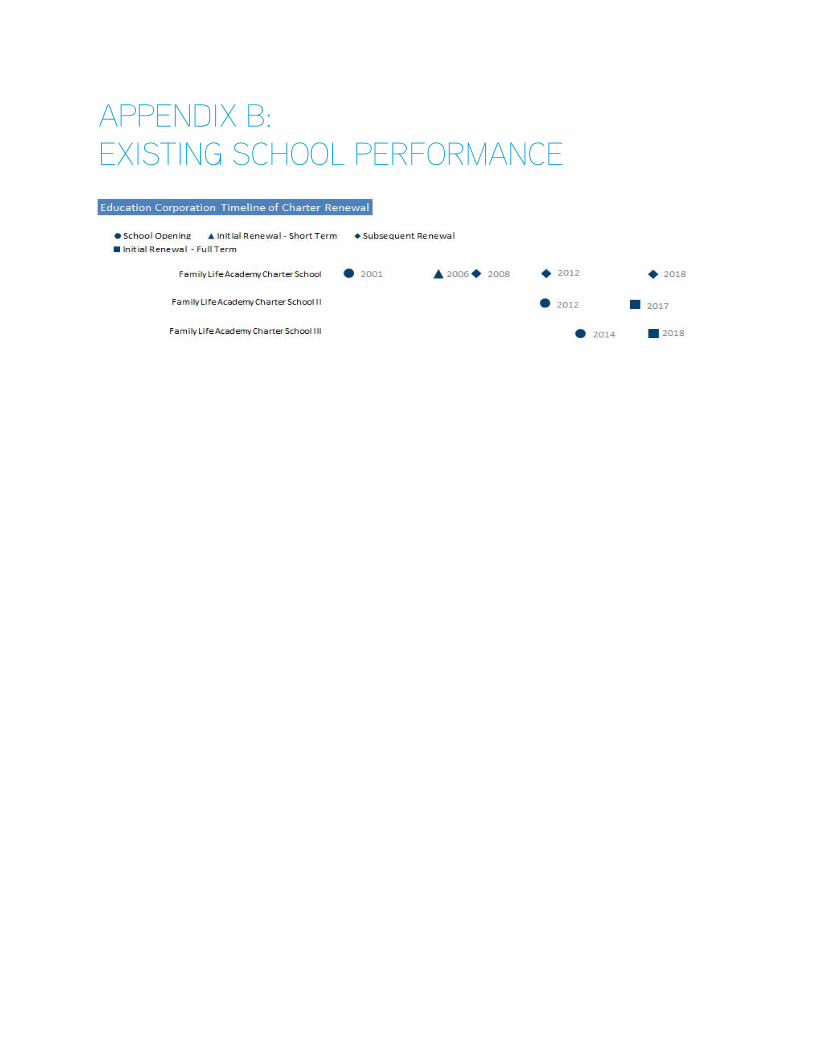
BACKGROUND & DESCRIPTION The original FLACS school, FLACS I, opened its doors in 2001 initially serving 99 students in Kindergarten – 1st grade and growing to 5th grade during its first charter term. The school earned a two-year renewal in 2006 followed by a full term renewal in 2008, when it expanded its enrollment to 8th grade, and two subsequent full term renewals in 2012 and 2018. FLACS II opened as an independent education corporation in 2012, and merged into FLACS effective July 1, 2014. FLACS applied for and then opened FLACS III in 2014. In 2017, FLACS II became a Kindergarten – 8th grade school with two campuses, an elementary school and a middle school, that serves all FLACS middle school students.
FLACS I currently serves 286 students in Kindergarten – 5th grade, with a projected total enrollment of 416 students at the end of its current charter term. FLACS II, which earned a full term renewal in 2017, currently serves 624 students in Kindergarten – 8th grade and anticipates serving 832 students at the end of its charter term. FLACS III is in its first charter term, serving 260 students in Kindergarten – 4th grade, and earned a full-term renewal in October 2018.
FLACS seeks to open an additional school to replicate the highly effective academic program currently in operation at the existing schools. The applicants propose to open a school in CSD 9, located in the congressional district with the highest percentage of residents living in poverty, in response to an overwhelming demand from local families, particularly for a middle school program. In 2017-18, FLACS received applications far in excess of the seats available; at FLACS I, there were 912 applicants for 26 Kindergarten seats, at FLACS II there were 638 applicants for 52 Kindergarten seats, and at FLACS III there were 474 applicants for 52 Kindergarten seats. The schools received approximately 4,500 total applications for all grades.
MISSION, PHILOSOPHY, AND KEY DESIGN ELEMENTSFLACS IV will share the same mission as other FLACS schools:
Family Life Academy Charter Schools, in partnership with the Latino Pastoral Action Center and parents, seeks to create the conditions for self-empowerment for all its K-8 students to achieve high academic standards, help them take responsibility for their own learning, and encourage them to explore and affirm human values. Like a family – and in collaboration with each family – the school will create an orderly, nurturing, and dynamic environment where learning is engaging, meaningful, and joyful. All members of the school community (students, parents, and teachers) will develop the knowledge, skills, and enthusiasm to continue throughout their lives, expand their understanding of what is possible for themselves and their world, and lead productive and satisfying lives.

5
FLACS IV will implement the following key design elements:
• Active School Leadership. The principal, supported by an assistant principal and instructional team, will ensure that instruction is rigorous, evaluate student performance, and oversee alignment of the instructional program with the school’s mission.
• Rigorous Academic Curriculum With a Focus on Literacy. The FLACS curriculum, driven by clearly articulated and demanding student achievement standards, aims to challenge students’ innate intellectual curiosity. In addition to a daily literacy block, literacy instruction is integrated into in all subject areas.
• Extended School Day and Year. FLACS IV’s extended calendar and schedule will enable the school to provide extra instruction to close the achievement gap. In addition, the school supplements its offerings with after school and/or Saturday programming, which include enrichment and intervention.
• Data-Driven Planning Fueled by a Rigorous System of Assessment and Accountability. Teachers, school administrators, and network administrators will analyze assessment data to formulate action plans for instruction and programming. This will drive effective instruction that closes the achievement gap, ensuring all students will have high academic achievement.
• Intentional Approaches to the Instruction of ELLs. FLACS IV will serve a community with a high proportion of ELLs and immigrant families, and the school specifically seeks to attract and retain ELLs. FLACS employs a sheltered English immersion (“SEI”) approach, in which all staff members receive training in strategies to support ELLs within their individual classrooms, and certified English teachers provide additional instruction to help students reach proficiency in English.
• Commitment to Meeting the Needs of All Learners. In order to ensure that all students meet high academic standards, FLACS IV will monitor students using assessment data, which teachers will use to differentiate instruction. The school will hold regular child study meetings to identify the specific needs of individual students and to create action plans to address these needs.
• Professional Development and Professional Learning Communities that Enrich Teaching. FLACS IV will invest significant time and resources to ensure that teachers can effectively implement the curriculum in order to help students achieve high standards. The professional learning launched during the annual two-week summer institute will continue throughout the school year via weekly professional development and common planning time. In addition, instructional coaches support individual teachers in improving their instructional practice.
• Consistent and Caring Discipline. FLACS IV has a strong commitment to caring and strategic classroom management that values scholarly behavior and aims to empower students to take responsibility for their own learning. The school will teach schoolwide and classroom procedures reinforced by all staff members.
• Family Involvement and Shared Responsibility for Learning. FLACS’s name, mission statement, and approach illustrate its founders’ belief that all parents must be informed and empowered participants in their children’s learning. Students’ learning plans will reflect a shared responsibility for learning among students, school, and parents. An active Parent Association (“PA”) will hold monthly meetings, and the FLACS board of trustees reserves a seat for each school’s PA president.

6
• Shared School Culture, Traditions, and Core Values Focused on Excellence. FLACS IV’s school culture will further high expectations for children and encourage core values, such as respect for other people and cultures, self-discipline, active citizenship, volunteerism, school pride, fairness, caring, responsibility, and trustworthiness. FLACS IV will celebrate scholars in various school-wide traditions including award ceremonies, essay contests, and community projects.
• Focus on Preparation for High School and Beyond. Beginning in 6th grade, FLACS IV students will meet with guidance counselors to identify areas of interest and ability, match these interests and abilities to high school programs, and prepare to apply to these programs.
• Continued Use of Community Resources. FLACS IV will make use of community resources provided by its community sponsor, LPAC, including after school programs, mentoring opportunities, food drives, services for families, and social justice activities.
CALENDAR AND SCHEDULEFLACS IV will offer approximately 184 days of instruction each year. The first day of instruction for the 2020-21 school year will be on or around September 7, 2020, and the last day will be on or around June 29, 2021. Subsequent school years will follow a similar calendar. The school day will begin each morning at 8:00 A.M. and end at 3:30 P.M. FLACS IV will provide students with more than 1,200 hours of instruction per year, a 33% increase over the state minimum of 900 hours for 1st – 6th grade and a 21% increase over the state minimum of 990 hours for 7th – 12th grade as mandated by Education Law § 2851(2)(n) and 8 NYCRR § 175.5, and provided at the majority of schools within the New York City Department of Education (“NYCDOE” or the “district”).
ACADEMIC PROGRAMFLACS IV will provide a rigorous curriculum in which students actively engage in their own learning by adopting the same standards-based academic program that has proven to be effective at the existing FLACS schools. FLACS IV will implement a curriculum that reflects a balance between teacher- and student-guided learning. The approach will emphasize student engagement by cultivating students’ excitement about, ownership of, and independence in learning. The curriculum will allow differentiation to meet the needs of all students, particularly the target population of ELLs, which benefits all students. Teachers will integrate literacy instruction in every subject area including explicit vocabulary development and infusion of literacy standards across the academic program. FLACS IV will likewise implement a holistic approach to teaching students; while academic development is at the core of the mission, the physical, artistic, social, and emotional development of each student is a critical element of the FLACS approach.
English Language Arts (“ELA”) (Reading and Writing) FLACS IV will provide 750 minutes of weekly ELA instruction. The school intends to utilize a balanced approach to teaching literacy, which includes instruction in phonemic awareness, phonics, fluency, vocabulary, comprehension, writing process, and grammar conventions. The ELA curriculum is aligned with the New York State Next Generation Learning Standards. In the elementary grades, FLACS IV will utilize network developed units of study built around authentic texts incorporating read aloud, direct

7
instruction, and close reading opportunities. FLACS IV will use Curriculum Associates Ready NY to support the development of reading comprehension and Open Court for explicit phonics instruction. The elementary grades will also implement Heinemann Units of Study in Opinion, Information, and Narrative Writing for writing instruction. In the middle school, FLACS IV will use EngageNY for reading and writing instruction.
Mathematics FLACS IV will provide 375 minutes of weekly mathematics instruction. At FLACS IV, students will gain a deep conceptual understanding of mathematics through a curriculum that has problem solving at its core. Learning will progress through concrete, pictorial, and abstract representations. There will be an emphasis on hands on experiences and problems and the interconnection between mathematics and real world applications. To address all learning standards, FLACS IV will implement two commercial curricula: Math in Focus and Houghton-Mifflin Harcourt’s Everyday Counts.
Science FLACS IV students will participate in 125 minutes of weekly science instruction. FLACS IV will use Amplify Science, a curriculum aligned to the New York State Next Generation Science Standards. The curriculum utilizes scientific phenomena to motivate students’ engagement in scientific inquiry and research and support them in understanding why the phenomena take place. In this inquiry-based approach, students will engage in experimentation, modeling, and reading about science.
Social Studies FLACS IV will provide 125 minutes of social studies instruction each week. In social studies, FLACS IV students will learn about how they are part of many different communities, how these communities function today, and how these communities have grown and changed throughout history. Students will analyze primary source documents, such as journals, letters, political cartoons, and photographs, and participate in project- and inquiry-based learning. FLACS IV will use a network developed curriculum based on the state standards and the College, Career, and Civic Life Framework for Social Studies.
Arts To help foster self-expression, build awareness of various cultures and traditions, and encourage students to think creatively, all FLACS IV students will receive instruction in art and music from specialists in these areas. FLACS teachers have developed the curriculum for these subjects with the support of the network and aligned them with the New York State Learning Standards in the arts.
Physical Education To help ensure that students learn to take care of and develop their bodies, all students will engage in physical education and take health courses in 6th – 8th grade. The FLACS network has developed a curriculum that will support students in meeting the New York State Learning Standards in physical education and health.
Foreign Language To help prepare students to be global citizens, FLACS IV will offer foreign language instruction in the middle school. This curriculum will ensure that students master basic language skills, which include following and participating in simple conversations and reading and writing short, informal texts. Prior to launching its 6th grade in the third year of the charter term, FLACS IV will determine which languages the school will teach.

8
EXISTING SCHOOL PERFORMANCEInformation regarding the renewal history, academic performance, and student discipline for the existing schools is presented in Appendix B.
SCHOOL CULTURE AND DISCIPLINEFLACS believes that school culture and climate have a profound impact on students’ academic progress, as well as on their relationships with peers and adults. As such, FLACS IV aims to promote a positive school culture that provides students with a supportive, caring learning environment in which they will grow socially, emotionally, and academically. The school’s commitment to proactive classroom management values scholarly behavior and nurtures students’ pro-social behaviors. FLACS IV will utilize the FLACS network-wide framework of behavioral supports and interventions to implement a progressive discipline program focused on preventing the recurrence of negative behavior by helping students learn from their mistakes.
ORGANIZATIONAL CAPACITYThe application presents clearly articulated lines of accountability in which FLACS IV school staff report to the principal and assistant principals, who in turn report to the FLACS chief operating officer (“COO”) and chief executive officer (“CEO”). This structure empowers each principal with autonomy over the day to day decision making in the school while ensuring that each school is are aligned with the overall FLACS vision, mission, and educational program. The FLACS network will provide significant administrative and operational support in finance, technology, human resources, professional learning, special education, and curriculum, as well as data management and analysis. At the site level, the administrative team grows over the life of the charter to include instructional coaches and a data specialist. The first assistant principal, who begins in Year 1, is joined by a second assistant principal who will focus on the upper grades in Year 4.
GOVERNANCEThe by-laws of FLACS indicate that the education corporation board will consist of no fewer than seven and no more than 21 voting members. The current members of the board of trustees are set forth below:
1. Miguel Peña, Board Chair
Mr. Peña was parent association president and a founding member of the board of trustees for FLACS I. He currently works for FedEx where his responsibilities include staff training, evaluation, and the role of floor supervisor.
2. Susana Rivera-Leon, Vice-Chair
Ms. Rivera is the current COO for LPAC and oversees day to day program operations including contract management, program administration, partnerships, and sub-contracts.
3. Hilda Sanchez, Treasurer
Ms. Sanchez has been an educator for over 30 years in the NYCDOE. She has been a teacher, director of funded programs, director of program development and school restructuring, director of special projects, and consultant. She earned a bachelor of arts degree from the University of Wisconsin, a master’s degree in Spanish from Middlebury College, a master’s degree in teaching English as a second language from Hunter College.

9
4. Pedro Alvarez, Secretary
Mr. Alvarez founded the company P. Alvarez & Associates, which serves over 7,000 clients throughout the Bronx. He provides consulting and tax services to individuals and local small businesses. He earned a bachelor of arts degree in accounting from Monroe College.
5. Marvin Dutton, Trustee
Mr. Dutton is a long-time resident of the Bronx and a businessman and entrepreneur. He earned a bachelor’s degree ion business management from Binghamton University SUNY.
6. Kevin Kearns, Trustee
Mr. Kearns is LPAC’s chief financial officer. He has experience in finance including as an investment banker and director at Wertheim Schroder & Co.
7. Joseph Holland, Trustee
Mr. Holland is the CEO of a real estate development company and has over 35 years of experience as a developer and attorney. He is a former Commissioner of the New York State Department of Housing and Community Renewal. He also served on the board of trustees of Cornell University for 12 years. He received both bachelor of arts and master of arts degrees from Cornell University, and a juris doctorate from Harvard Law School.
8. Dr. Janet M. Lerner, Trustee
Dr. Lerner has held positions in the mental health field for over 38 years. She is currently the executive director of Damon House New York. She holds a bachelor of science degree in social work from the Ohio State University College of Social Work; a master of arts degree from Ohio State in counseling, anthropology, and performing arts; and, a doctor of philosophy in social work from the Columbia University School of Social Work.
9. Francisco Lugoviña, Trustee
Mr. Lugoviña is a founding member and former board chairman of FLACS I. He is an entrepreneur, having launched several successful businesses since 1968. He has a long history as a community organizer and civil rights activist. He earned a bachelor of business administration degree in finance from Iona College.
10. Bryan Rivera, Trustee
Mr. Rivera has over 25 years of management experience including work for the U.S. Departments of Commerce and Labor. He is currently the president of Learn Enterprises, LLC, a consultancy firm. Mr. Rivera serves as a board member of LPAC. He earned a bachelor of arts degree in philosophy from Siena College.
11. Rev. Raymond Rivera, Trustee
Rev. Rivera led the team to develop FLACS I and has a long history of community activism. In 1992, he founded LPAC and has provided leadership development and technical assistance to hundreds of churches and faith-based and secular organizations, and dozens have developed holistic community-based ministries.

10
12. Wanda Torres-Mercado, Trustee
Ms. Torres-Mercado has 27 years of experience in management and supervision of youth educational programs including being the director of youth programs for the United Way of New York City. She earned a bachelor of arts degree in sociology from Union College.
13. Florence G. Wolpoff, Trustee
Ms. Wolpoff has been an educator for 54 years. Currently she provides technical assistance for Teach for America students at Fordham University. She earned a bachelor of arts degree in sociology from Hunter College and a master of arts in education administration and supervision from Manhattan College.
14. Kelly Nuñez, Trustee
Kelly Nuñez is the PA president at FLACS I and a current ex-officio voting member.
15. Raphael McDonald, Trustee
Raphael McDonald is the PA president at FLACS II elementary school and a current ex-officio voting member.
16. Marina Salazar, Trustee
Marina Salazar is the PA president at FLACS II middle school and a current ex-officio voting member.
17. Jorge Torres, Trustee
Jorge Torres is the PA president at FLACS III and a current ex-officio voting member.
FACILITIESDuring its first two years of operation FLACS IV will co-locate with the FLACS II middle school building located at 316 165th St. in CSD 9, which will be at about two-thirds capacity at the time of FLACS IV’s proposed opening. This building is new construction due for completion in winter 2019. Over the next 42 months, FLACS intends to seek rental space or secure funding for the construction of a new facility to house FLACS IV starting in the 2022-23 school year. The board has formed an ad hoc committee to support this effort. As it has in the past, FLACS will work with its community partner, LPAC, to secure space for new school construction.

11
FISCAL IMPACTThe fiscal impact of FLACS IV on the district is summarized below.
A. B. C. D. E. F. G.
Charter Year
Expected Number of Students
Basic Charter School Per Pupil Aid
Projected Per Pupil Revenue (AxB)
Other District Revenue (SPED, Food Service, Grants, etc.)
Total Project Funding from District to Charter School (C+D)
New York City School District Budget
Projected District Impact (E/F)
Year 1 (2020-21)
155 15,307 2,372,585 1,282,184 3,654,769 25,600,000,000 0.01%
Year 5 (2024-25)
702 15,307 10,745,514 5,664,005 16,409,519 25,600,000,000 0.06%
*The NYCDOE budget was derived from the NYCDOE’s website: https://www.schools.nyc.gov/about-us/funding/funding-our-schools.
The Institute finds that the fiscal impact of the proposed school on the district, public charter, public district, and nonpublic schools in the same geographic area will be minimal. In the event that the school opens with a slightly higher enrollment, the Institute has determined that the fiscal impact of the proposed school on the district, public charter, public district, and nonpublic schools in the same geographic area will also be minimal.
The Institute reviewed the school’s proposed startup and fiscal plans and supporting evidence for each year of the proposed charter term. The Institute finds the budgets and fiscal plans are sound and that sufficient startup funds will be available to the new charter school.
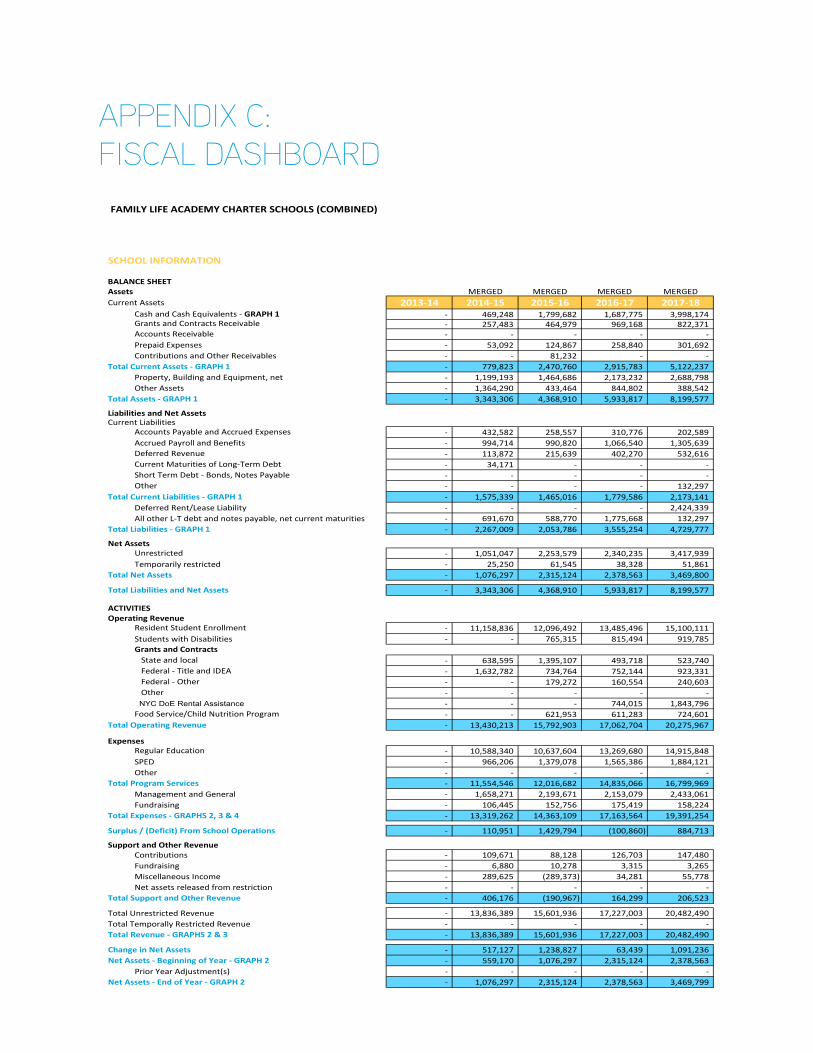
The Institute analyzed the existing education corporation with the authority to operate three schools, and each individual school is operating at a surplus or breakeven with the overall merged education corporation reporting fiscal strength for the last four years with $3.4 million in net assets. The financial profile is available on the SUNY Fiscal Dashboard at www.newyorkcharters.org/progress/fiscal-dashboard/ and is presented in Appendix C of this report.
NOTIFICATION & PUBLIC COMMENTS The Institute notified the district as well as public and private schools in the same geographic area of the proposed school about receipt of the proposal, and the proposal was posted on the Institute’s website for public review. The district scheduled a public hearing pertaining to the proposed school for February 27, 2019, and and provided the Institute with a summary of comments made at the hearing. The Institute carefully reviews and considers all public comments received prior to finalizing its recommendation. Additional information about public comments is provided in Appendix A.

12
PREFERENCE SCORING Education Law § 2852(9-a) requires authorizers to establish a scoring rubric and grant priority to applications meeting both statutory and authorizer standards. The purpose of the preference criteria is to prioritize proposals in the event that the number of proposals meeting the SUNY Trustees’ requirements exceeds the maximum number of charters to be issued, or issued in New York City in 2019. The RFP identified the minimum eligibility requirements and mandated preference criteria required by Education Law § 2852(9-a), as described in greater detail below, as well as SUNY’s additional criteria. (See 2019 RFP at 10 or Replication RFP at 9.) The FLACS IV proposal met the eligibility requirements, as evidenced by the following:
• the proposal was sufficiently complete, i.e., it included a Transmittal and Summary form, ProposalSummary, and responses to all RFP requests as prescribed by the Institute;
• the proposal included a viable plan to meet the enrollment and retention targets established bythe SUNY Trustees for students with disabilities, ELLs, and students who are eligible to participatein the FRPL program (as detailed in Request 5); and,
• the proposal provided evidence of public outreach that conforms to the Act and the processprescribed by the SUNY Trustees for the purpose of soliciting and incorporating community inputregarding the proposed charter school and its academic program (as detailed in Request 4).
As FLACS IV ’s proposal submission met the eligibility criteria, the Institute’s evaluation continued with a full review of the proposal, an interview of the application team and board of trustees, and requests for clarification and/or amendments to the proposal. The review process then continued with an evaluation of the proposal in relation to the nine Preference Criteria contained in the RFP for which proposals can earn credit as described in the RFP’s Preference Scoring Guidance. The Preference Criteria, which in addition to eligibility criteria and the overall high standards established by the SUNY Trustees, include the demonstration of the following in compliance with Education Law §§ 2852(9-a)(c)(i)-(viii):
• increasing student achievement and decreasing student achievement gaps in reading/languagearts and mathematics;
• increasing high school graduation rates and focusing on serving specific high school studentpopulations including, but not limited to, students at risk of not obtaining a high school diploma,re-enrolled high school dropouts, and students with academic skills below grade level;
• focusing on the academic achievement of middle school students and preparing them for asuccessful transition to high school;
• utilizing high-quality assessments designed to measure a student’s knowledge, understanding of,and ability to apply critical concepts through the use of a variety of item types and formats;
• increasing the acquisition, adoption, and use of local instructional improvement systems thatprovide teachers, principals, and administrators with the information and resources they need toinform and improve their instructional practices, decision-making, and overall effectiveness;
• partnering with low-performing public schools in the area to share best educational practices andinnovations;
• demonstrating the management and leadership techniques necessary to overcome initial start-up problems to establish a thriving, financially viable charter school; and,
• demonstrating the support of the school district in which the proposed charter school will belocated and the intent to establish an ongoing relationship with such school district.
13
Pursuant to the RFP, in compliance with the requirements for new charter applications set forth in Education Law § 2852(9-a)(b)(i-ii), (g), the Institute recommends the SUNY Trustees approve the application for one new charter as proposed. Family Life Academy Charter School IV earned a score of 32 preference points out of a maximum of 45. Based on this score and the other information and findings set forth herein, the Institute recommends that the SUNY Trustees approve the authority of Family Life Academy Charter Schools to operate Family Life Academy Charter School IV.
CONCLUSION & RECOMMENDATIONS Based on its review and findings, the Institute recommends that the SUNY Trustees approve the proposal to grant Family Life Academy Charter Schools the authority to operate Family Life Academy Charter School IV to open in September 2020.

APPENDIX A: SUMMARY OF PUBLIC COMMENTS RECEIVED SUMMARY OF PUBLIC COMMENTS RECEIVED DURING THE SUNY PUBLIC COMMENT PERIOD THROUGH MARCH 1, 2019
On or about January 16, 2019, in accordance with Education Law § 2857(1), the Institute notified the district as well as public and private schools in the same geographic area of the proposed school about receipt of the proposal to establish FLACS IV. The notice reminded the district that the New York State Commissioner of Education’s regulations require the school district to hold a public hearing within 30 days of the notice for each new charter application. The district scheduled a public hearing pertaining to the proposed school for February 27, 2019, and provided the Insitute with an overview of comments made at the hearing, which is summarized below. A redacted copy of the initial FLACS IV proposal was also posted on the Institute’s website for public review at: http://www.newyorkcharters.org/request-for-proposals/2019-suny-request-for-proposals-round-1-spring-cycle/family-life-academy-charter-school-iv/.
26 people attended the public hearing held on February 27, 2019 at P.S. 102, 1827 Archer St. in the Bronx. 14 of the attendees spoke in support of the proposed school, three of whom are FLACS founders, nine of whom are the parents of FLACS students, and two of whom are current FLACS students. The founders cited the high demand for its existing schools, its desire to serve ELLs, and the outcomes of FLACS graduates in their advocacy for the proposed school. The parents and students shared stories about the excellent edcuation and support they have received from the schools particularly the kindness and compassion of school staff members. None of the attendees spoke in opposition to the proposed school.
The Institute received letters of support for the proposed school from several elected officials including Bronx Borough President Reuben Diaz, Jr.; State Assembly Members Marcos A. Crespo and Michael Blake; and, New York City Council Member Vanessa Gibson, all of whom cite FLACS’s strong academic outcomes and the degree to which the schools are embedded in the local community in their advocacy of the proposed school. The Institute also received letters of support from multiple community-based organizations, faith-based organizations, and local small business. In addition, the Institute received petitions that include hundreds of names of current FLACS parents and guardians and community members advocating on behalf of the proposed school.
To date the Institute has not received any direct comments in opposition to the proposed school.

APPENDIX B: EXISTING SCHOOL PERFORMANCE
0
50
100
Target: 75
TestYear
CompGrades
District%
School%
2016 3-8
2017 3-8
2018 3-5
3520
4422
5330
Compara�ve Measure:District Comparison. Eachyear, the percentage ofstudents at the school in atleast their second yearperforming at or aboveproficiency in ELA will begreater than that of studentsin the same tested grades inthe district.
0
1
2
3
4
Target: 0.3
TestYear
TestGrades Effect Size
2016 3-8
2017 3-8
2018 3-5
0.76
0.99
1.09
40
60
80
Target: 50
TestYear School Mean Growth
2016
2017
2018 52.2
53.8
56.1
ENGLISH LANGUAGE ARTS ACCOUNTABILITY PLAN GOAL
Compara�ve Measure:Effect Size. Each year, theschool will exceed itspredicted level ofperformance by an effectsize of 0.3 or above in ELAaccording to a regressionanalysis controlling foreconomically disadvantagedstudents among all publicschools in New York State.
Compara�ve GrowthMeasure: Mean GrowthPercen�le. Each year, theschool's unadjusted meangrowth percen�le for allstudents in grades 4-8 will beabove the state's unadjustedmedian growth percen�le inELA.
Family Life Academy Charter School Bronx CSD 9

APPENDIX B: EXISTING SCHOOL PERFORMANCE
Compara�ve Measure:District Comparison. Eachyear, the percentage ofstudents at the school in atleast their second yearperforming at or aboveproficiency in Mathema�cswill be greater than that ofstudents in the same testedgrades in the district.
0
50
100
Target: 75
TestYear
CompGrades
District%
School%
2016 3-8
2017 3-8
2018 3-5
3618
3919
5230
MATHEMATICS ACCOUNTABILITY PLAN GOAL
Compara�ve Measure: EffectSize. Each year, the schoolwill exceed its predicted levelof performance by an effectsize of 0.3 or above inMathema�cs according to aregression analysis controllingfor economicallydisadvantaged studentsamong all public schools inNew York State.
Compara�ve GrowthMeasure: Mean GrowthPercen�le. Each year, theschool's unadjusted meangrowth percen�le for allstudents in grades 4-8 will beabove the state's unadjustedmedian growth percen�le inMathema�cs.
Family Life Academy Charter School Bronx CSD 9
0
1
2
3
4
Target: 0.3
TestYear
TestGrades Effect Size
2016 3-8
2017 3-8
2018 3-5
0.74
0.82
0.82
40
60
80
Target: 50
TestYear School Mean Growth
2016
2017
2018 51.5
49.5
49.3
APPENDIX B: EXISTING SCHOOL PERFORMANCE
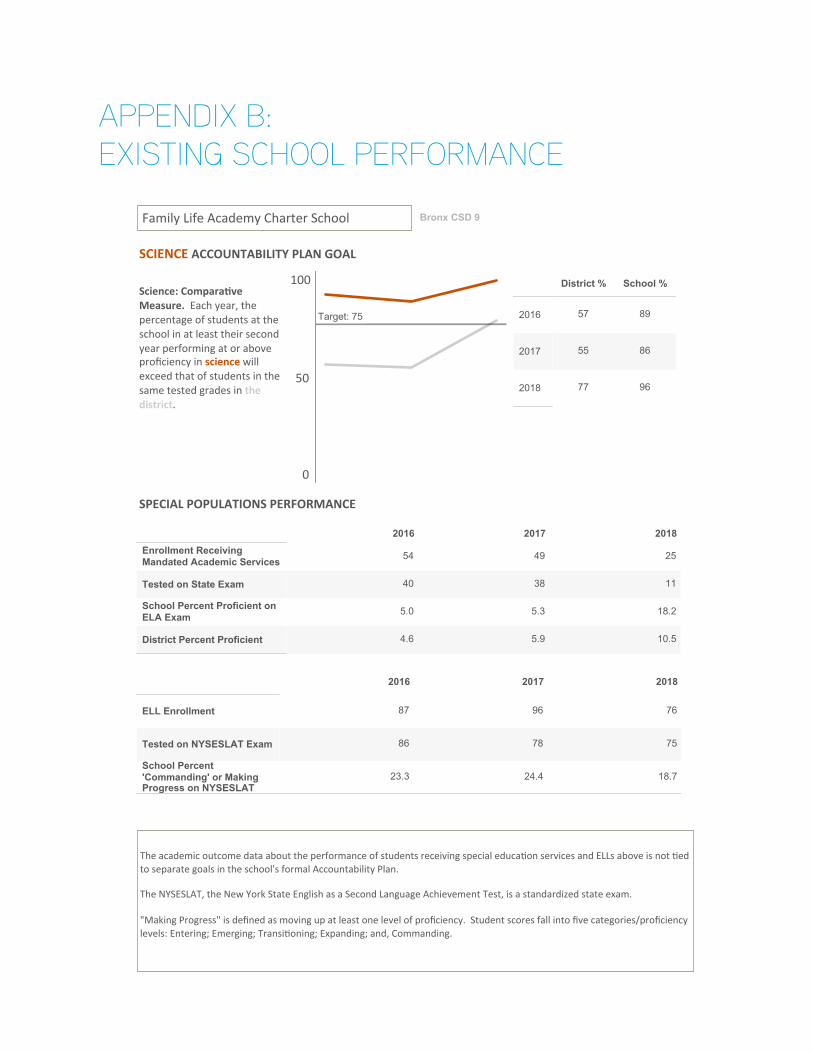
Science: Compara�veMeasure. Each year, thepercentage of students at theschool in at least their secondyear performing at or aboveproficiency in science willexceed that of students in thesame tested grades in thedistrict.
SCIENCE ACCOUNTABILITY PLAN GOAL
District % School %
2016
2017
2018 96
86
89
77
55
57
0
50
100
Target: 75
Family Life Academy Charter School
2016 2017 2018Enrollment ReceivingMandated Academic Services
Tested on State Exam
School Percent Proficient onELA Exam
District Percent Proficient 10.5
18.2
11
25
5.9
5.3
38
49
4.6
5.0
40
54
2016 2017 2018
ELL Enrollment
Tested on NYSESLAT Exam
School Percent'Commanding' or MakingProgress on NYSESLAT
18.7
75
76
24.4
78
96
23.3
86
87
The academic outcome data about the performance of students receiving special educa�on services and ELLs above is not �edto separate goals in the school's formal Accountability Plan.
The NYSESLAT, the New York State English as a Second Language Achievement Test, is a standardized state exam.
"Making Progress" is defined as moving up at least one level of proficiency. Student scores fall into five categories/proficiencylevels: Entering; Emerging; Transi�oning; Expanding; and, Commanding.
SPECIAL POPULATIONS PERFORMANCE
Bronx CSD 9

APPENDIX B: EXISTING SCHOOL PERFORMANCE
0
50
100
Target: 75
TestYear
CompGrades
District%
School%
2016 3-4
2017 3-5
2018 3-6
9323
8123
8930
Compara�ve Measure:District Comparison. Eachyear, the percentage ofstudents at the school in atleast their second yearperforming at or aboveproficiency in ELA will begreater than that of studentsin the same tested grades inthe district.
0
1
2
3
4
Target: 0.3
TestYear
TestGrades Effect Size
2016 3-4
2017 3-5
2018 3-8
3.86
3.35
2.64
40
60
80
Target: 50
TestYear School Mean Growth
2016
2017
2018 56.5
36.4
59.8
ENGLISH LANGUAGE ARTS ACCOUNTABILITY PLAN GOAL
Compara�ve Measure:Effect Size. Each year, theschool will exceed itspredicted level ofperformance by an effectsize of 0.3 or above in ELAaccording to a regressionanalysis controlling foreconomically disadvantagedstudents among all publicschools in New York State.
Compara�ve GrowthMeasure: Mean GrowthPercen�le. Each year, theschool's unadjusted meangrowth percen�le for allstudents in grades 4-8 will beabove the state's unadjustedmedian growth percen�le inELA.
Family Life Academy Charter School II Bronx CSD 9
APPENDIX B: EXISTING SCHOOL PERFORMANCE
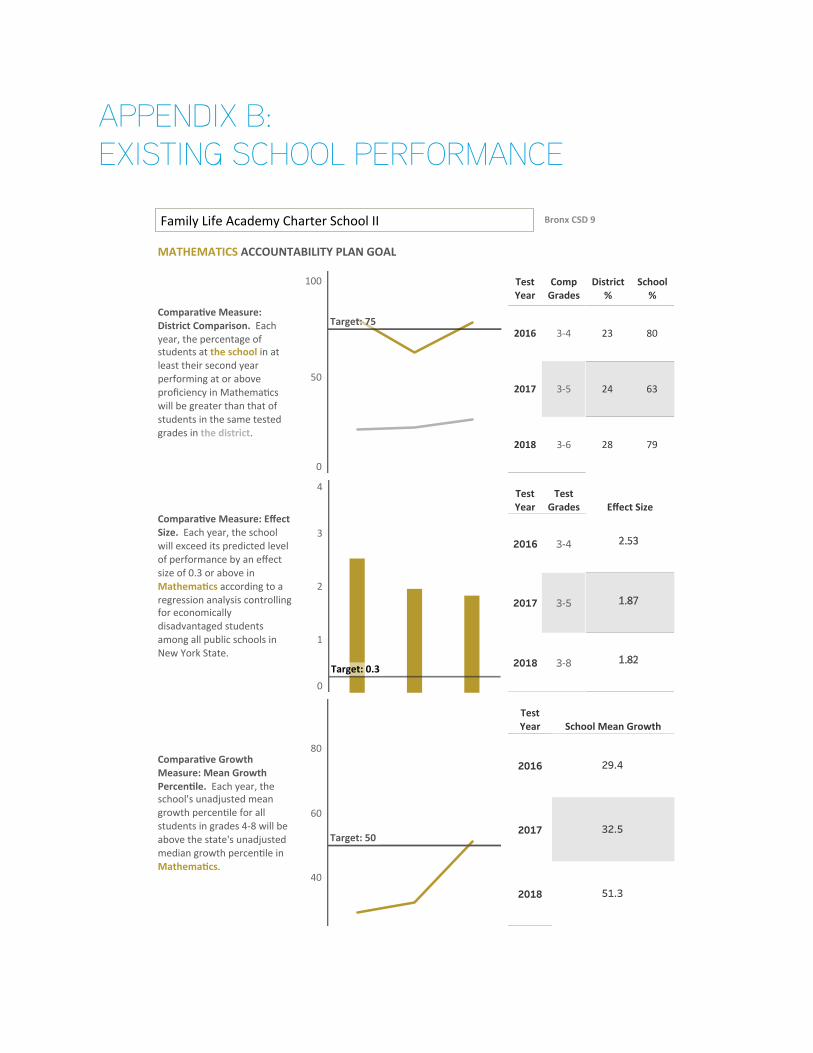
Compara�ve Measure:District Comparison. Eachyear, the percentage ofstudents at the school in atleast their second yearperforming at or aboveproficiency in Mathema�cswill be greater than that ofstudents in the same testedgrades in the district.
0
50
100
Target: 75
TestYear
CompGrades
District%
School%
2016 3-4
2017 3-5
2018 3-6
8023
6324
7928
MATHEMATICS ACCOUNTABILITY PLAN GOAL
Compara�ve Measure: EffectSize. Each year, the schoolwill exceed its predicted levelof performance by an effectsize of 0.3 or above inMathema�cs according to aregression analysis controllingfor economicallydisadvantaged studentsamong all public schools inNew York State.
Compara�ve GrowthMeasure: Mean GrowthPercen�le. Each year, theschool's unadjusted meangrowth percen�le for allstudents in grades 4-8 will beabove the state's unadjustedmedian growth percen�le inMathema�cs.
Family Life Academy Charter School II Bronx CSD 9
0
1
2
3
4
Target: 0.3
TestYear
TestGrades Effect Size
2016 3-4
2017 3-5
2018 3-8
2.53
1.87
1.82
40
60
80
Target: 50
TestYear School Mean Growth
2016
2017
2018 51.3
32.5
29.4

APPENDIX B: EXISTING SCHOOL PERFORMANCE
Science: Compara�veMeasure. Each year, thepercentage of students at theschool in at least their secondyear performing at or aboveproficiency in science willexceed that of students in thesame tested grades in thedistrict.
SCIENCE ACCOUNTABILITY PLAN GOAL
District % School %
2016
2017
2018 100
98
100
77
72
72
0
50
100
Target: 75
Family Life Academy Charter School II
2016 2017 2018Enrollment ReceivingMandated Academic Services
Tested on State Exam
School Percent Proficient onELA Exam
District Percent Proficient 9.6
43.4
53
72
7.4
70.6
17
38
7.5
77.8
9
31
2016 2017 2018
ELL Enrollment
Tested on NYSESLAT Exam
School Percent'Commanding' or MakingProgress on NYSESLAT
42.9
63
63
33.3
33
39
8.8
34
34
The academic outcome data about the performance of students receiving special educa�on services and ELLs above is not �edto separate goals in the school's formal Accountability Plan.
The NYSESLAT, the New York State English as a Second Language Achievement Test, is a standardized state exam.
"Making Progress" is defined as moving up at least one level of proficiency. Student scores fall into five categories/proficiencylevels: Entering; Emerging; Transi�oning; Expanding; and, Commanding.
SPECIAL POPULATIONS PERFORMANCE
Bronx CSD 9

APPENDIX B: EXISTING SCHOOL PERFORMANCE
0
50
100
Target: 75
TestYear
CompGrades
District%
School%
2017 3
2018 3-4
5625
6333
Compara�ve Measure:District Comparison. Eachyear, the percentage ofstudents at the school in atleast their second yearperforming at or aboveproficiency in ELA will begreater than that of studentsin the same tested grades inthe district.
0
1
2
3
4
Target: 0.3
TestYear
TestGrades Effect Size
2017 3
2018 3-4
1.50
1.51
40
60
80
Target: 50
TestYear School Mean Growth
2018 56.1
ENGLISH LANGUAGE ARTS ACCOUNTABILITY PLAN GOAL
Compara�ve Measure:Effect Size. Each year, theschool will exceed itspredicted level ofperformance by an effectsize of 0.3 or above in ELAaccording to a regressionanalysis controlling foreconomically disadvantagedstudents among all publicschools in New York State.
Compara�ve GrowthMeasure: Mean GrowthPercen�le. Each year, theschool's unadjusted meangrowth percen�le for allstudents in grades 4-8 will beabove the state's unadjustedmedian growth percen�le inELA.
Family Life Academy Charter School III Bronx CSD 9

APPENDIX B: EXISTING SCHOOL PERFORMANCE
Compara�ve Measure:District Comparison. Eachyear, the percentage ofstudents at the school in atleast their second yearperforming at or aboveproficiency in Mathema�cswill be greater than that ofstudents in the same testedgrades in the district.
0
50
100
Target: 75
TestYear
CompGrades
District%
School%
2017 3
2018 3-4
7928
7232
MATHEMATICS ACCOUNTABILITY PLAN GOAL
Compara�ve Measure: EffectSize. Each year, the schoolwill exceed its predicted levelof performance by an effectsize of 0.3 or above inMathema�cs according to aregression analysis controllingfor economicallydisadvantaged studentsamong all public schools inNew York State.
Compara�ve GrowthMeasure: Mean GrowthPercen�le. Each year, theschool's unadjusted meangrowth percen�le for allstudents in grades 4-8 will beabove the state's unadjustedmedian growth percen�le inMathema�cs.
Family Life Academy Charter School III Bronx CSD 9
0
1
2
3
4
Target: 0.3
TestYear
TestGrades Effect Size
2017 3
2018 3-4
2.28
1.69
40
60
80
Target: 50
TestYear School Mean Growth
2018 41.5

APPENDIX B: EXISTING SCHOOL PERFORMANCE
Science: Compara�veMeasure. Each year, thepercentage of students at theschool in at least their secondyear performing at or aboveproficiency in science willexceed that of students in thesame tested grades in thedistrict.
SCIENCE ACCOUNTABILITY PLAN GOAL
District % School %
2018 9777
0
50
100
Target: 75
Family Life Academy Charter School III
2016 2017 2018Enrollment ReceivingMandated Academic Services
Tested on State Exam
School Percent Proficient onELA Exam
District Percent Proficient 11.9
53.8
13
30
7.8
22.2
9
31
0
24
2016 2017 2018
ELL Enrollment
Tested on NYSESLAT Exam
School Percent'Commanding' or MakingProgress on NYSESLAT
45.8
48
49
27.0
37
41
13.3
30
32
The academic outcome data about the performance of students receiving special educa�on services and ELLs above is not �edto separate goals in the school's formal Accountability Plan.
The NYSESLAT, the New York State English as a Second Language Achievement Test, is a standardized state exam.
"Making Progress" is defined as moving up at least one level of proficiency. Student scores fall into five categories/proficiencylevels: Entering; Emerging; Transi�oning; Expanding; and, Commanding.
SPECIAL POPULATIONS PERFORMANCE
Bronx CSD 9

APPENDIX B: EXISTING SCHOOL PERFORMANCE
2016 2017 2018
0% o
f stu
dent
s sus
pend
ed
School ISS Rate School OSS Rate
2016
2017
2018 0.3
2.3
1.9
0.3
2.3
2.4
2015-16
2016-17
2017-18
94.5
94.2
91.2
Persistence in Enrollment: The percentage ofstudents eligible to return from previous year
who did return 2016 2017 2018
000
Expulsions: The number of students expelled fromthe school each year
Enrollment
economicallydisadvantagedEnglish languagelearnersstudents withdisabili�es
Reten�on
economicallydisadvantagedEnglish languagelearnersstudents withdisabili�es
Family Life Academy Charter School's Enrollment andReten�on Status: 2017-18 District Target School
7.6
36.3
89.8
18.0
27.1
96.1
100.0
93.9
90.2
92.5
93.4
92.2
CSD data suitable for comparison are not available. The percentage rate shown here is calculated using the method employed by theNew York City Department of Educa�on ("NYCDOE"): the total number of students receiving an in school or out of school suspensionat any �me during the school year is divided by the total enrollment, then mul�plied by 100.
Family Life Academy Charter School CSD 9

APPENDIX B: EXISTING SCHOOL PERFORMANCE
2016 2017 2018
0% o
f stu
dent
s sus
pend
ed
School ISS Rate School OSS Rate
2016
2017
2018 0.6
0.0
0.0
0.6
0.0
0.0
2015-16
2016-17
2017-18
92.2
89.5
92.9
Persistence in Enrollment: The percentage ofstudents eligible to return from previous year
who did return 2016 2017 2018
000
Expulsions: The number of students expelled fromthe school each year
Enrollment
economicallydisadvantagedEnglish languagelearnersstudents withdisabili�es
Reten�on
economicallydisadvantagedEnglish languagelearnersstudents withdisabili�es
Family Life Academy Charter School II's Enrollment andReten�on Status: 2017-18 District Target School
13.7
28.4
91.9
22.9
20.9
95.4
95.9
95.3
92.8
92.2
92.2
91.3
CSD data suitable for comparison are not available. The percentage rate shown here is calculated using the method employed by theNew York City Department of Educa�on ("NYCDOE"): the total number of students receiving an in school or out of school suspensionat any �me during the school year is divided by the total enrollment, then mul�plied by 100.
Family Life Academy Charter School II CSD 7

APPENDIX B: EXISTING SCHOOL PERFORMANCE
2016 2017 2018
0% o
f stu
dent
s sus
pend
ed
School ISS Rate School OSS Rate
2016
2017
2018 0.0
0.0
1.9
0.0
0.0
1.9
2015-16
2016-17
2017-18
82.9
83.8
92.9
Persistence in Enrollment: The percentage ofstudents eligible to return from previous year
who did return 2016 2017 2018
000
Expulsions: The number of students expelled fromthe school each year
Enrollment
economicallydisadvantagedEnglish languagelearnersstudents withdisabili�es
Reten�on
economicallydisadvantagedEnglish languagelearnersstudents withdisabili�es
Family Life Academy Charter School III's Enrollment andReten�on Status: 2017-18 District Target School
13.1
21.8
92.9
21.1
21.5
95.5
93.3
90.5
92.7
93.4
93.5
92.4
CSD data suitable for comparison are not available. The percentage rate shown here is calculated using the method employed by theNew York City Department of Educa�on ("NYCDOE"): the total number of students receiving an in school or out of school suspensionat any �me during the school year is divided by the total enrollment, then mul�plied by 100.
Family Life Academy Charter School III CSD 7
APPENDIX B: EXISTING SCHOOL PERFORMANCE
APPENDIX C: FISCAL DASHBOARD
SCHOOL INFORMATION
BALANCE SHEETAssets MERGED MERGED MERGED MERGEDCurrent Assets 2013‐14 2014‐15 2015‐16 2016‐17 2017‐18
Cash and Cash Equivalents ‐ GRAPH 1 ‐ 469,248 1,799,682 1,687,775 3,998,174 Grants and Contracts Receivable ‐ 257,483 464,979 969,168 822,371 Accounts Receivable ‐ ‐ ‐ ‐ ‐ Prepaid Expenses ‐ 53,092 124,867 258,840 301,692 Contributions and Other Receivables ‐ ‐ 81,232 ‐ ‐
Total Current Assets ‐ GRAPH 1 ‐ 779,823 2,470,760 2,915,783 5,122,237 Property, Building and Equipment, net ‐ 1,199,193 1,464,686 2,173,232 2,688,798 Other Assets ‐ 1,364,290 433,464 844,802 388,542
Total Assets ‐ GRAPH 1 ‐ 3,343,306 4,368,910 5,933,817 8,199,577
Liabilities and Net AssetsCurrent Liabilities
Accounts Payable and Accrued Expenses ‐ 432,582 258,557 310,776 202,589 Accrued Payroll and Benefits ‐ 994,714 990,820 1,066,540 1,305,639 Deferred Revenue ‐ 113,872 215,639 402,270 532,616 Current Maturities of Long‐Term Debt ‐ 34,171 ‐ ‐ ‐ Short Term Debt ‐ Bonds, Notes Payable ‐ ‐ ‐ ‐ ‐ Other ‐ ‐ ‐ ‐ 132,297
Total Current Liabilities ‐ GRAPH 1 ‐ 1,575,339 1,465,016 1,779,586 2,173,141 Deferred Rent/Lease Liability ‐ ‐ ‐ ‐ 2,424,339 All other L‐T debt and notes payable, net current maturities ‐ 691,670 588,770 1,775,668 132,297
Total Liabilities ‐ GRAPH 1 ‐ 2,267,009 2,053,786 3,555,254 4,729,777
Net AssetsUnrestricted ‐ 1,051,047 2,253,579 2,340,235 3,417,939 Temporarily restricted ‐ 25,250 61,545 38,328 51,861
Total Net Assets ‐ 1,076,297 2,315,124 2,378,563 3,469,800
Total Liabilities and Net Assets ‐ 3,343,306 4,368,910 5,933,817 8,199,577
ACTIVITIESOperating Revenue
Resident Student Enrollment ‐ 11,158,836 12,096,492 13,485,496 15,100,111 Students with Disabilities ‐ ‐ 765,315 815,494 919,785 Grants and Contracts State and local ‐ 638,595 1,395,107 493,718 523,740 Federal ‐ Title and IDEA ‐ 1,632,782 734,764 752,144 923,331 Federal ‐ Other ‐ ‐ 179,272 160,554 240,603 Other ‐ ‐ ‐ ‐ ‐ NYC DoE Rental Assistance ‐ ‐ ‐ 744,015 1,843,796 Food Service/Child Nutrition Program ‐ ‐ 621,953 611,283 724,601
Total Operating Revenue ‐ 13,430,213 15,792,903 17,062,704 20,275,967
ExpensesRegular Education ‐ 10,588,340 10,637,604 13,269,680 14,915,848 SPED ‐ 966,206 1,379,078 1,565,386 1,884,121 Other ‐ ‐ ‐ ‐ ‐
Total Program Services ‐ 11,554,546 12,016,682 14,835,066 16,799,969 Management and General ‐ 1,658,271 2,193,671 2,153,079 2,433,061 Fundraising ‐ 106,445 152,756 175,419 158,224
Total Expenses ‐ GRAPHS 2, 3 & 4 ‐ 13,319,262 14,363,109 17,163,564 19,391,254
Surplus / (Deficit) From School Operations ‐ 110,951 1,429,794 (100,860) 884,713
Support and Other RevenueContributions ‐ 109,671 88,128 126,703 147,480 Fundraising ‐ 6,880 10,278 3,315 3,265 Miscellaneous Income ‐ 289,625 (289,373) 34,281 55,778 Net assets released from restriction ‐ ‐ ‐ ‐ ‐
Total Support and Other Revenue ‐ 406,176 (190,967) 164,299 206,523
Total Unrestricted Revenue ‐ 13,836,389 15,601,936 17,227,003 20,482,490 Total Temporally Restricted Revenue ‐ ‐ ‐ ‐ ‐ Total Revenue ‐ GRAPHS 2 & 3 ‐ 13,836,389 15,601,936 17,227,003 20,482,490
Change in Net Assets ‐ 517,127 1,238,827 63,439 1,091,236 Net Assets ‐ Beginning of Year ‐ GRAPH 2 ‐ 559,170 1,076,297 2,315,124 2,378,563
Prior Year Adjustment(s) ‐ ‐ ‐ ‐ ‐ Net Assets ‐ End of Year ‐ GRAPH 2 ‐ 1,076,297 2,315,124 2,378,563 3,469,799
FAMILY LIFE ACADEMY CHARTER SCHOOLS (COMBINED)

APPENDIX C: FISCAL DASHBOARD FAMILY LIFE ACADEMY CHARTER SCHOOLS (COMBINED)
SCHOOL INFORMATION ‐ (Continued)Functional Expense Breakdown
Personnel Service 2013‐14 2014‐15 2015‐16 2016‐17 2017‐18 Administrative Staff Personnel ‐ 2,089,334 3,132,744 3,167,906 3,821,153 Instructional Personnel ‐ 4,191,663 4,351,636 5,043,632 5,435,058 Non‐Instructional Personnel ‐ 518,459 390,545 815,537 1,070,786 Personnel Services (Combined) ‐ ‐ ‐ ‐ ‐ Total Salaries and Staff ‐ 6,799,456 7,874,925 9,027,075 10,326,997 Fringe Benefits & Payroll Taxes ‐ 1,120,589 1,295,646 1,473,407 1,810,372 Retirement ‐ 65,407 76,810 169,192 158,956 Management Company Fees ‐ ‐ ‐ ‐ ‐ Building and Land Rent / Lease ‐ 1,973,275 1,727,979 3,054,519 3,260,569 Staff Development ‐ 165,488 204,289 273,325 173,298 Professional Fees, Consultant & Purchased Services ‐ 799,880 488,123 343,384 395,545 Marketing / Recruitment ‐ 15,250 14,572 22,591 34,609 Student Supplies, Materials & Services ‐ 552,737 460,102 608,209 679,531 Depreciation ‐ 388,591 428,860 501,564 568,946 Other ‐ 1,438,589 1,791,803 1,690,298 1,982,432
Total Expenses ‐ 13,319,262 14,363,109 17,163,563 19,391,255
SCHOOL ANALYSIS
ENROLLMENT 2013‐14 2014‐15 2015‐16 2016‐17 2017‐18Original Chartered Enrollment ‐ 764 866 967 1,108 Final Chartered Enrollment (includes any revisions) ‐ 764 866 967 1,092 Actual Enrollment ‐ GRAPH 4 ‐ 762 872 961 1,041 Chartered Grades ‐ ‐ ‐ ‐ ‐ Final Chartered Grades (includes any revisions) ‐ ‐ ‐ ‐ ‐
Primary School District: Per Pupil Funding (Weighted Avg of All Districts) ‐ ‐ ‐ ‐ ‐
Increase over prior year 0.0% 0.0% 0.0% 0.0% 0.0%
PER STUDENT BREAKDOWN
RevenueOperating ‐ 17,636 18,120 17,749 19,481 Other Revenue and Support ‐ 533 (219) 171 198 TOTAL ‐ GRAPH 3 ‐ 18,170 17,901 17,920 19,680
ExpensesProgram Services ‐ 15,173 13,788 15,432 16,141 Management and General, Fundraising ‐ 2,317 2,692 2,422 2,490 TOTAL ‐ GRAPH 3 ‐ 17,491 16,480 17,854 18,631 % of Program Services 0.0% 86.8% 83.7% 86.4% 86.6%% of Management and Other 0.0% 13.2% 16.3% 13.6% 13.4%
% of Revenue Exceeding Expenses ‐ GRAPH 5 0.0% 3.9% 8.6% 0.4% 5.6%
Student to Faculty Ratio ‐ 6.9 10.1 10.3 10.3
Faculty to Admin Ratio ‐ 3.7 1.5 2.2 1.8
Financial Responsibility Composite Scores ‐ GRAPH 6Score 0.0 1.7 2.4 1.8 2.3
Working Capital ‐ GRAPH 7Net Working Capital 0 (795,516) 1,005,744 1,136,197 2,949,096 As % of Unrestricted Revenue 0.0% ‐5.7% 6.4% 6.6% 14.4%Working Capital (Current) Ratio Score 0.0 0.5 1.7 1.6 2.4Risk (Low ≥ 3.0 / Medium 1.4 ‐ 2.9 / High < 1.4) N/A HIGH MEDIUM MEDIUM MEDIUMRating (Excellent ≥ 3.0 / Good 1.4 ‐ 2.9 / Poor < 1.4) N/A Poor Good Good Good
Quick (Acid Test) RatioScore 0.0 0.5 1.6 1.5 2.2Risk (Low ≥ 2.5 / Medium 1.0 ‐ 2.4 / High < 1.0) N/A HIGH MEDIUM MEDIUM MEDIUMRating (Excellent ≥ 2.5 / Good 1.0 ‐ 2.4 / Poor < 1.0) N/A Poor Good Good Good
Debt to Asset Ratio ‐ GRAPH 7Score 0.0 0.7 0.5 0.6 0.6Risk (Low < 0.50 / Medium 0.51 ‐ .95 / High > 1.0) N/A MEDIUM MEDIUM MEDIUM MEDIUMRating (Excellent < 0.50 / Good 0.51 ‐ .95 / Poor > 1.0) N/A Good Good Good Good
Months of Cash ‐ GRAPH 8Score 0.0 0.4 1.5 1.2 2.5Risk (Low > 3 mo. / Medium 1 ‐ 3 mo. / High < 1 mo.) N/A HIGH MEDIUM MEDIUM MEDIUMRating (Excellent > 3 mo. / Good 1 ‐ 3 mo. / Poor < 1 mo.) N/A Poor Good Good Good
Fiscally Strong 1.5 ‐ 3.0 / Fiscally Adequate 1.0 ‐ 1.4 /Fiscally Needs Monitoring < 1.0 N/A Fiscally Strong Fiscally Strong Fiscally Strong Fiscally Strong

APPENDIX C: FISCAL DASHBOARD
SCHOOL INFORMATION
BALANCE SHEETAssets MERGED MERGED MERGED MERGEDCurrent Assets 2013‐14 2014‐15 2015‐16 2016‐17 2017‐18
Cash and Cash Equivalents ‐ GRAPH 1 474,474 ‐ ‐ ‐ ‐ Grants and Contracts Receivable 118,593 ‐ ‐ ‐ ‐ Accounts Receivable ‐ ‐ ‐ ‐ ‐ Prepaid Expenses 79,092 ‐ ‐ ‐ ‐ Contributions and Other Receivables 1,343,592 ‐ ‐ ‐ ‐
Total Current Assets ‐ GRAPH 1 2,015,751 ‐ ‐ ‐ ‐ Property, Building and Equipment, net 571,661 ‐ ‐ ‐ ‐ Other Assets 72,175 ‐ ‐ ‐ ‐
Total Assets ‐ GRAPH 1 2,659,587 ‐ ‐ ‐ ‐
Liabilities and Net AssetsCurrent Liabilities
Accounts Payable and Accrued Expenses 330,222 ‐ ‐ ‐ ‐ Accrued Payroll and Benefits 569,027 ‐ ‐ ‐ ‐ Deferred Revenue ‐ ‐ ‐ ‐ ‐ Current Maturities of Long‐Term Debt 33,765 ‐ ‐ ‐ ‐ Short Term Debt ‐ Bonds, Notes Payable ‐ ‐ ‐ ‐ ‐ Other 514,024 ‐ ‐ ‐ ‐
Total Current Liabilities ‐ GRAPH 1 1,447,038 ‐ ‐ ‐ ‐ Deferred Rent/Lease Liability ‐ ‐ ‐ ‐ ‐ All other L‐T debt and notes payable, net current maturities 235,911 ‐ ‐ ‐ ‐
Total Liabilities ‐ GRAPH 1 1,682,949 ‐ ‐ ‐ ‐
Net AssetsUnrestricted 959,638 ‐ ‐ ‐ ‐ Temporarily restricted 17,000 ‐ ‐ ‐ ‐
Total Net Assets 976,638 ‐ ‐ ‐ ‐
Total Liabilities and Net Assets 2,659,587 ‐ ‐ ‐ ‐
ACTIVITIESOperating Revenue
Resident Student Enrollment 6,704,149 6,953,727 6,455,883 6,524,103 4,403,630 Students with Disabilities ‐ ‐ 492,837 486,391 162,344 Grants and Contracts State and local 927,089 367,778 215,417 246,440 205,998 Federal ‐ Title and IDEA ‐ 846,195 448,319 441,187 404,914 Federal ‐ Other ‐ ‐ 66,217 6,499 26,265 Other ‐ ‐ ‐ ‐ ‐ NYC DoE Rental Assistance ‐ ‐ ‐ ‐ ‐ Food Service/Child Nutrition Program ‐ ‐ 264,089 288,181 182,862
Total Operating Revenue 7,631,238 8,167,700 7,942,762 7,992,801 5,386,013
ExpensesRegular Education 6,072,392 6,380,811 5,702,273 6,094,935 4,390,438 SPED 623,135 493,021 735,343 663,768 425,732 Other ‐ ‐ ‐ ‐ ‐
Total Program Services 6,695,527 6,873,832 6,437,616 6,758,703 4,816,170 Management and General 1,283,481 811,501 1,108,049 983,582 600,589 Fundraising 93,000 106,445 81,629 85,833 46,116
Total Expenses ‐ GRAPHS 2, 3 & 4 8,072,008 7,791,778 7,627,294 7,828,118 5,462,875
Surplus / (Deficit) From School Operations (440,770) 375,922 315,468 164,683 (76,862)
Support and Other RevenueContributions 110,867 98,671 68,716 103,913 46,445 Fundraising 7,181 4,530 3,966 1,294 82 Miscellaneous Income 103,629 288,995 (292,784) 12,782 19,233 Net assets released from restriction ‐ ‐ ‐ ‐ ‐
Total Support and Other Revenue 221,677 392,196 (220,102) 117,989 65,760
Total Unrestricted Revenue 7,852,915 8,559,896 7,722,660 8,110,790 5,451,773 Total Temporally Restricted Revenue ‐ ‐ ‐ ‐ ‐ Total Revenue ‐ GRAPHS 2 & 3 7,852,915 8,559,896 7,722,660 8,110,790 5,451,773
Change in Net Assets (219,093) 768,118 95,366 282,672 (11,102) Net Assets ‐ Beginning of Year ‐ GRAPH 2 1,195,731 976,638 1,739,115 1,834,481 2,117,153
Prior Year Adjustment(s) ‐ ‐ ‐ ‐ ‐ Net Assets ‐ End of Year ‐ GRAPH 2 976,638 1,744,756 1,834,481 2,117,153 2,106,051
FAMILY LIFE ACADEMY CHARTER SCHOOL
Opened 2001‐02
NOTE: Effective 2014‐15 the school merged into the education corporation, "Family Life Academy Charter Schools." Accordingly, see the education corporation report containing the "Balance Sheet" for all schools merged into the education corporation.

APPENDIX C: FISCAL DASHBOARD FAMILY LIFE ACADEMY CHARTER SCHOOL NOTE: Effective 2014‐15 the school merged into the education corporation, "Family Life Academy Charter Schools." Accordingly, see the education corporation report containing the "Balance Sheet" for all schools merged into the education corporation.
SCHOOL INFORMATION ‐ (Continued)Functional Expense Breakdown
Personnel Service 2013‐14 2014‐15 2015‐16 2016‐17 2017‐18 Administrative Staff Personnel 1,116,630 1,471,508 1,512,557 1,514,583 1,052,666 Instructional Personnel 3,157,121 2,917,057 2,482,810 2,547,506 1,611,599 Non‐Instructional Personnel 378,300 518,459 390,545 417,129 396,354 Personnel Services (Combined) ‐ ‐ ‐ ‐ ‐ Total Salaries and Staff 4,652,051 4,907,024 4,385,912 4,479,218 3,060,619 Fringe Benefits & Payroll Taxes 777,235 824,164 739,048 771,601 581,314 Retirement 64,424 48,735 40,977 79,832 42,933 Management Company Fees ‐ ‐ ‐ ‐ ‐ Building and Land Rent / Lease 733,223 739,760 733,590 950,162 666,201 Staff Development 76,062 55,073 98,460 133,901 51,275 Professional Fees, Consultant & Purchased Services 460,875 (94,393) 310,902 168,568 110,342 Marketing / Recruitment 30,751 8,532 8,315 10,961 9,540 Student Supplies, Materials & Services 150,486 251,137 243,736 300,719 215,878 Depreciation 238,936 242,833 227,977 204,740 215,963 Other 887,964 808,913 838,377 728,417 508,810
Total Expenses 8,072,007 7,791,778 7,627,294 7,828,118 5,462,875
SCHOOL ANALYSIS
ENROLLMENT 2013‐14 2014‐15 2015‐16 2016‐17 2017‐18Original Chartered Enrollment 462 464 466 467 468 Final Chartered Enrollment (includes any revisions) 462 464 466 467 312 Actual Enrollment ‐ GRAPH 4 459 467 465 465 304 Chartered Grades K‐8 K‐8 K‐8 K‐8 K‐8Final Chartered Grades (includes any revisions) ‐ ‐ ‐ ‐ K‐5
Primary School District: NYC CHANCELLOR'S OFFICEPer Pupil Funding (Weighted Avg of All Districts) 13,878 13,878 13,878 14,027 14,529
Increase over prior year 2.5% 0.0% 0.0% 1.1% 3.5%
PER STUDENT BREAKDOWN
RevenueOperating 16,618 17,508 17,076 17,186 17,711 Other Revenue and Support 483 841 (473) 254 216 TOTAL ‐ GRAPH 3 17,100 18,349 16,603 17,440 17,928
ExpensesProgram Services 14,580 14,735 13,840 14,533 15,837 Management and General, Fundraising 2,997 1,968 2,558 2,299 2,127 TOTAL ‐ GRAPH 3 17,577 16,702 16,397 16,832 17,964 % of Program Services 82.9% 88.2% 84.4% 86.3% 88.2%% of Management and Other 17.1% 11.8% 15.6% 13.7% 11.8%
% of Revenue Exceeding Expenses ‐ GRAPH 5 ‐2.7% 9.9% 1.3% 3.6% ‐0.2%
Student to Faculty Ratio 8.7 5.8 10.1 10.8 9.5
Faculty to Admin Ratio 2.3 3.8 1.6 2.3 1.9
Financial Responsibility Composite Scores ‐ GRAPH 6Score 1.3 0.0 0.0 0.0 0.0
Working Capital ‐ GRAPH 7Net Working Capital 568,713 0 0 0 0 As % of Unrestricted Revenue 7.2% 0.0% 0.0% 0.0% 0.0%Working Capital (Current) Ratio Score 1.4 0.0 0.0 0.0 0.0Risk (Low ≥ 3.0 / Medium 1.4 ‐ 2.9 / High < 1.4) MEDIUM N/A N/A N/A N/ARating (Excellent ≥ 3.0 / Good 1.4 ‐ 2.9 / Poor < 1.4) Good N/A N/A N/A N/A
Quick (Acid Test) RatioScore 1.3 0.0 0.0 0.0 0.0Risk (Low ≥ 2.5 / Medium 1.0 ‐ 2.4 / High < 1.0) MEDIUM N/A N/A N/A N/ARating (Excellent ≥ 2.5 / Good 1.0 ‐ 2.4 / Poor < 1.0) Good N/A N/A N/A N/A
Debt to Asset Ratio ‐ GRAPH 7Score 0.6 0.0 0.0 0.0 0.0Risk (Low < 0.50 / Medium 0.51 ‐ .95 / High > 1.0) MEDIUM N/A N/A N/A N/ARating (Excellent < 0.50 / Good 0.51 ‐ .95 / Poor > 1.0) Good N/A N/A N/A N/A
Months of Cash ‐ GRAPH 8Score 0.7 0.0 0.0 0.0 0.0Risk (Low > 3 mo. / Medium 1 ‐ 3 mo. / High < 1 mo.) HIGH N/A N/A N/A N/ARating (Excellent > 3 mo. / Good 1 ‐ 3 mo. / Poor < 1 mo.) Poor N/A N/A N/A N/A
Fiscally Strong 1.5 ‐ 3.0 / Fiscally Adequate 1.0 ‐ 1.4 /Fiscally Needs Monitoring < 1.0
Fiscally Adequate N/A N/A N/A N/A

APPENDIX C: FISCAL DASHBOARD
SCHOOL INFORMATION
BALANCE SHEETAssets MERGED MERGED MERGED MERGEDCurrent Assets 2013‐14 2014‐15 2015‐16 2016‐17 2017‐18
Cash and Cash Equivalents ‐ GRAPH 1 81,397 ‐ ‐ ‐ ‐ Grants and Contracts Receivable 31,003 ‐ ‐ ‐ ‐ Accounts Receivable ‐ ‐ ‐ ‐ ‐ Prepaid Expenses 2,586 ‐ ‐ ‐ ‐ Contributions and Other Receivables 50,000 ‐ ‐ ‐ ‐
Total Current Assets ‐ GRAPH 1 164,986 ‐ ‐ ‐ ‐ Property, Building and Equipment, net 120,606 ‐ ‐ ‐ ‐ Other Assets ‐ ‐ ‐ ‐ ‐
Total Assets ‐ GRAPH 1 285,592 ‐ ‐ ‐ ‐
Liabilities and Net AssetsCurrent Liabilities
Accounts Payable and Accrued Expenses 98,251 ‐ ‐ ‐ ‐ Accrued Payroll and Benefits 142,519 ‐ ‐ ‐ ‐ Deferred Revenue 3,720 ‐ ‐ ‐ ‐ Current Maturities of Long‐Term Debt ‐ ‐ ‐ ‐ ‐ Short Term Debt ‐ Bonds, Notes Payable ‐ ‐ ‐ ‐ ‐ Other 209,652 ‐ ‐ ‐ ‐
Total Current Liabilities ‐ GRAPH 1 454,142 ‐ ‐ ‐ ‐ Deferred Rent/Lease Liability ‐ ‐ ‐ ‐ ‐ All other L‐T debt and notes payable, net current maturities ‐ ‐ ‐ ‐ ‐
Total Liabilities ‐ GRAPH 1 454,142 ‐ ‐ ‐ ‐
Net AssetsUnrestricted (168,550) ‐ ‐ ‐ ‐ Temporarily restricted ‐ ‐ ‐ ‐ ‐
Total Net Assets (168,550) ‐ ‐ ‐ ‐
Total Liabilities and Net Assets 285,592 ‐ ‐ ‐ ‐
ACTIVITIESOperating Revenue
Resident Student Enrollment 2,076,295 2,964,132 3,559,059 4,148,980 7,095,088 Students with Disabilities ‐ ‐ 158,188 188,838 595,616 Grants and Contracts State and local 40,538 225,437 441,487 147,499 209,131 Federal ‐ Title and IDEA 345,400 323,395 179,875 181,660 363,307 Federal ‐ Other ‐ ‐ ‐ 18,851 181,485 Other ‐ ‐ ‐ ‐ ‐ NYC DoE Rental Assistance ‐ ‐ ‐ 387,776 862,696 Food Service/Child Nutrition Program ‐ ‐ 223,042 222,688 323,962
Total Operating Revenue 2,462,233 3,512,964 4,561,651 5,296,292 9,631,285
ExpensesRegular Education 2,090,740 2,541,555 3,228,098 4,006,427 6,478,499 SPED 137,616 354,386 374,437 472,677 967,982 Other ‐ ‐ ‐ ‐ ‐
Total Program Services 2,228,356 2,895,941 3,602,535 4,479,104 7,446,481 Management and General 378,695 592,851 658,689 638,551 1,146,596 Fundraising ‐ ‐ 45,457 53,445 74,361
Total Expenses ‐ GRAPHS 2, 3 & 4 2,607,051 3,488,792 4,306,681 5,171,100 8,667,438
Surplus / (Deficit) From School Operations (144,818) 24,172 254,970 125,192 963,847
Support and Other RevenueContributions 2,134 11,000 5,882 3,372 83,983 Fundraising ‐ 2,350 5,338 2,021 2,182 Miscellaneous Income 330 505 1,584 16,866 21,013 Net assets released from restriction ‐ ‐ ‐ ‐ ‐
Total Support and Other Revenue 2,464 13,855 12,804 22,259 107,178
Total Unrestricted Revenue 2,464,697 3,526,819 4,574,455 5,318,551 9,738,463 Total Temporally Restricted Revenue ‐ ‐ ‐ ‐ ‐ Total Revenue ‐ GRAPHS 2 & 3 2,464,697 3,526,819 4,574,455 5,318,551 9,738,463
Change in Net Assets (142,354) 38,027 267,774 147,451 1,071,025 Net Assets ‐ Beginning of Year ‐ GRAPH 2 (26,196) (168,550) (126,769) 141,005 288,456
Prior Year Adjustment(s) ‐ ‐ ‐ ‐ ‐ Net Assets ‐ End of Year ‐ GRAPH 2 (168,550) (130,523) 141,005 288,456 1,359,481
FAMILY LIFE ACADEMY CHARTER SCHOOL II
Opened 2012‐13
NOTE: Effective 2014‐15 the school merged into the education corporation, "Family Life Academy Charter Schools." Accordingly, see the education corporation report containing the "Balance Sheet" for all schools merged into the education corporation.

APPENDIX C: FISCAL DASHBOARD FAMILY LIFE ACADEMY CHARTER SCHOOL II NOTE: Effective 2014‐15 the school merged into the education corporation, "Family Life Academy Charter Schools." Accordingly, see the education corporation report containing the "Balance Sheet" for all schools merged into the education corporation.
SCHOOL INFORMATION ‐ (Continued)Functional Expense Breakdown
Personnel Service 2013‐14 2014‐15 2015‐16 2016‐17 2017‐18 Administrative Staff Personnel 603,316 308,873 946,774 943,269 1,787,158 Instructional Personnel 674,163 838,452 1,161,442 1,509,507 2,511,183 Non‐Instructional Personnel 78,441 ‐ ‐ 252,165 495,671 Personnel Services (Combined) ‐ ‐ ‐ ‐ ‐ Total Salaries and Staff 1,355,920 1,147,325 2,108,216 2,704,941 4,794,011 Fringe Benefits & Payroll Taxes 203,532 200,634 341,234 405,103 814,062 Retirement 17,081 10,926 21,513 53,369 76,498 Management Company Fees ‐ ‐ ‐ ‐ ‐ Building and Land Rent / Lease 350,460 742,417 898,990 857,072 1,209,782 Staff Development 18,372 51,448 54,047 86,038 91,792 Professional Fees, Consultant & Purchased Services 97,414 582,030 98,289 75,785 169,104 Marketing / Recruitment 788 ‐ 3,798 6,939 17,302 Student Supplies, Materials & Services 123,080 185,994 117,638 204,714 311,900 Depreciation 124,280 109,726 136,566 180,912 225,476 Other 316,124 458,292 526,390 596,227 957,511
Total Expenses 2,607,051 3,488,792 4,306,681 5,171,100 8,667,439
SCHOOL ANALYSIS
ENROLLMENT 2013‐14 2014‐15 2015‐16 2016‐17 2017‐18Original Chartered Enrollment 150 200 250 300 390 Final Chartered Enrollment (includes any revisions) 150 200 250 300 520 Actual Enrollment ‐ GRAPH 4 149 205 256 296 489 Chartered Grades K‐2 K‐3 K‐4 K‐5 K‐6Final Chartered Grades (includes any revisions) ‐ ‐ ‐ ‐ K‐8
Primary School District: NYC CHANCELLOR'S OFFICEPer Pupil Funding (Weighted Avg of All Districts) 13,878 13,878 13,878 14,027 14,528
Increase over prior year 2.5% 0.0% 0.0% 1.1% 3.4%
PER STUDENT BREAKDOWN
RevenueOperating 16,550 17,136 17,791 17,908 19,716 Other Revenue and Support 17 68 50 75 219 TOTAL ‐ GRAPH 3 16,567 17,204 17,841 17,983 19,935
ExpensesProgram Services 14,978 14,127 14,050 15,145 15,244 Management and General, Fundraising 2,545 2,892 2,746 2,340 2,499 TOTAL ‐ GRAPH 3 17,523 17,018 16,797 17,485 17,743 % of Program Services 85.5% 83.0% 83.6% 86.6% 85.9%% of Management and Other 14.5% 17.0% 16.4% 13.4% 14.1%
% of Revenue Exceeding Expenses ‐ GRAPH 5 ‐5.5% 1.1% 6.2% 2.9% 12.4%
Student to Faculty Ratio 9.3 10.3 10.3 9.9 11.4
Faculty to Admin Ratio 1.6 5.0 1.6 2.2 1.9
Financial Responsibility Composite Scores ‐ GRAPH 6Score (0.9) 0.0 0.0 0.0 0.0
Working Capital ‐ GRAPH 7Net Working Capital (289,156) 0 0 0 0 As % of Unrestricted Revenue ‐11.7% 0.0% 0.0% 0.0% 0.0%Working Capital (Current) Ratio Score 0.4 0.0 0.0 0.0 0.0Risk (Low ≥ 3.0 / Medium 1.4 ‐ 2.9 / High < 1.4) HIGH N/A N/A N/A N/ARating (Excellent ≥ 3.0 / Good 1.4 ‐ 2.9 / Poor < 1.4) Poor N/A N/A N/A N/A
Quick (Acid Test) RatioScore 0.4 0.0 0.0 0.0 0.0Risk (Low ≥ 2.5 / Medium 1.0 ‐ 2.4 / High < 1.0) HIGH N/A N/A N/A N/ARating (Excellent ≥ 2.5 / Good 1.0 ‐ 2.4 / Poor < 1.0) Poor N/A N/A N/A N/A
Debt to Asset Ratio ‐ GRAPH 7Score 1.6 0.0 0.0 0.0 0.0Risk (Low < 0.50 / Medium 0.51 ‐ .95 / High > 1.0) HIGH N/A N/A N/A N/ARating (Excellent < 0.50 / Good 0.51 ‐ .95 / Poor > 1.0) Poor N/A N/A N/A N/A
Months of Cash ‐ GRAPH 8Score 0.4 0.0 0.0 0.0 0.0Risk (Low > 3 mo. / Medium 1 ‐ 3 mo. / High < 1 mo.) HIGH N/A N/A N/A N/ARating (Excellent > 3 mo. / Good 1 ‐ 3 mo. / Poor < 1 mo.) Poor N/A N/A N/A N/A
Fiscally Strong 1.5 ‐ 3.0 / Fiscally Adequate 1.0 ‐ 1.4 /Fiscally Needs Monitoring < 1.0
Fiscally Needs Monitoring N/A N/A N/A N/A

APPENDIX C: FISCAL DASHBOARD
SCHOOL INFORMATION
BALANCE SHEETAssets MERGED MERGED MERGED MERGEDCurrent Assets 2013‐14 2014‐15 2015‐16 2016‐17 2017‐18
Cash and Cash Equivalents ‐ GRAPH 1 ‐ ‐ ‐ ‐ ‐ Grants and Contracts Receivable ‐ ‐ ‐ ‐ ‐ Accounts Receivable ‐ ‐ ‐ ‐ ‐ Prepaid Expenses ‐ ‐ ‐ ‐ ‐ Contributions and Other Receivables ‐ ‐ ‐ ‐ ‐
Total Current Assets ‐ GRAPH 1 ‐ ‐ ‐ ‐ ‐ Property, Building and Equipment, net ‐ ‐ ‐ ‐ ‐ Other Assets ‐ ‐ ‐ ‐ ‐
Total Assets ‐ GRAPH 1 ‐ ‐ ‐ ‐ ‐
Liabilities and Net AssetsCurrent Liabilities
Accounts Payable and Accrued Expenses ‐ ‐ ‐ ‐ ‐ Accrued Payroll and Benefits ‐ ‐ ‐ ‐ ‐ Deferred Revenue ‐ ‐ ‐ ‐ ‐ Current Maturities of Long‐Term Debt ‐ ‐ ‐ ‐ ‐ Short Term Debt ‐ Bonds, Notes Payable ‐ ‐ ‐ ‐ ‐ Other ‐ ‐ ‐ ‐ ‐
Total Current Liabilities ‐ GRAPH 1 ‐ ‐ ‐ ‐ ‐ Deferred Rent/Lease Liability ‐ ‐ ‐ ‐ ‐ All other L‐T debt and notes payable, net current maturities ‐ ‐ ‐ ‐ ‐
Total Liabilities ‐ GRAPH 1 ‐ ‐ ‐ ‐ ‐
Net AssetsUnrestricted ‐ ‐ ‐ ‐ ‐ Temporarily restricted ‐ ‐ ‐ ‐ ‐
Total Net Assets ‐ ‐ ‐ ‐ ‐
Total Liabilities and Net Assets ‐ ‐ ‐ ‐ ‐
ACTIVITIESOperating Revenue
Resident Student Enrollment ‐ 1,240,977 2,081,550 2,812,413 3,601,393 Students with Disabilities ‐ ‐ 114,290 140,265 161,825 Grants and Contracts State and local ‐ 45,380 738,203 99,779 108,611 Federal ‐ Title and IDEA ‐ 463,192 106,570 129,297 155,110 Federal ‐ Other ‐ ‐ 113,055 135,204 32,853 Other ‐ ‐ ‐ ‐ ‐ NYC DoE Rental Assistance ‐ ‐ ‐ 356,239 981,100 Food Service/Child Nutrition Program ‐ ‐ 134,822 100,414 217,777
Total Operating Revenue ‐ 1,749,549 3,288,490 3,773,611 5,258,669
ExpensesRegular Education ‐ 1,665,974 1,707,233 3,168,318 4,046,911 SPED ‐ 118,799 269,298 428,941 490,407 Other ‐ ‐ ‐ ‐ ‐
Total Program Services ‐ 1,784,773 1,976,531 3,597,259 4,537,318 Management and General ‐ 253,919 426,933 530,946 685,876 Fundraising ‐ ‐ 25,670 36,141 37,747
Total Expenses ‐ GRAPHS 2, 3 & 4 ‐ 2,038,692 2,429,134 4,164,346 5,260,941
Surplus / (Deficit) From School Operations ‐ (289,143) 859,356 (390,735) (2,272)
Support and Other RevenueContributions ‐ ‐ 13,530 19,418 17,052 Fundraising ‐ ‐ 974 ‐ 1,001 Miscellaneous Income ‐ 125 1,827 4,633 15,532 Net assets released from restriction ‐ ‐ ‐ ‐ ‐
Total Support and Other Revenue ‐ 125 16,331 24,051 33,585
Total Unrestricted Revenue ‐ 1,749,674 3,304,821 3,797,662 5,292,254 Total Temporally Restricted Revenue ‐ ‐ ‐ ‐ ‐ Total Revenue ‐ GRAPHS 2 & 3 ‐ 1,749,674 3,304,821 3,797,662 5,292,254
Change in Net Assets ‐ (289,018) 875,687 (366,684) 31,313 Net Assets ‐ Beginning of Year ‐ GRAPH 2 ‐ (248,918) (536,049) 339,638 (27,046)
Prior Year Adjustment(s) ‐ ‐ ‐ ‐ ‐ Net Assets ‐ End of Year ‐ GRAPH 2 ‐ (537,936) 339,638 (27,046) 4,267
FAMILY LIFE ACADEMY CHARTER SCHOOL III
Opened 2014‐15
NOTE: Effective 2014‐15 the school merged into the education corporation, "Family Life Academy Charter Schools." Accordingly, see the education corporation report containing the "Balance Sheet" for all schools merged into the education corporation.

APPENDIX C: FISCAL DASHBOARD FAMILY LIFE ACADEMY CHARTER SCHOOL III NOTE: Effective 2014‐15 the school merged into the education corporation, "Family Life Academy Charter Schools." Accordingly, see the education corporation report containing the "Balance Sheet" for all schools merged into the education corporation.
SCHOOL INFORMATION ‐ (Continued)Functional Expense Breakdown
Personnel Service 2013‐14 2014‐15 2015‐16 2016‐17 2017‐18 Administrative Staff Personnel ‐ 308,953 673,413 710,053 981,329 Instructional Personnel ‐ 436,154 707,384 986,619 1,312,277 Non‐Instructional Personnel ‐ ‐ ‐ 146,243 178,761 Personnel Services (Combined) ‐ ‐ ‐ ‐ ‐ Total Salaries and Staff ‐ 745,107 1,380,797 1,842,915 2,472,366 Fringe Benefits & Payroll Taxes ‐ 95,791 215,364 296,703 414,997 Retirement ‐ 5,746 14,320 35,991 39,525 Management Company Fees ‐ ‐ ‐ ‐ ‐ Building and Land Rent / Lease ‐ 491,098 95,399 1,247,285 1,384,586 Staff Development ‐ 58,967 51,782 53,386 30,230 Professional Fees, Consultant & Purchased Services ‐ 312,243 78,932 99,031 116,099 Marketing / Recruitment ‐ 6,718 2,459 4,692 7,768 Student Supplies, Materials & Services ‐ 115,606 98,728 102,777 151,753 Depreciation ‐ 36,032 64,317 115,912 127,507 Other ‐ 171,384 427,036 365,654 516,111
Total Expenses ‐ 2,038,692 2,429,134 4,164,346 5,260,941
SCHOOL ANALYSIS
ENROLLMENT 2013‐14 2014‐15 2015‐16 2016‐17 2017‐18Original Chartered Enrollment ‐ 100 150 200 250 Final Chartered Enrollment (includes any revisions) ‐ 100 150 200 260 Actual Enrollment ‐ GRAPH 4 ‐ 90 150 201 248 Chartered Grades Planning Year K‐1 K‐2 K‐3 K‐4Final Chartered Grades (includes any revisions) ‐ ‐ ‐ ‐ ‐
Primary School District: NYC CHANCELLOR'S OFFICEPer Pupil Funding (Weighted Avg of All Districts) ‐ 13,877 13,877 14,027 14,527
Increase over prior year 0.0% 100.0% 0.0% 1.1% 3.4%
PER STUDENT BREAKDOWN
RevenueOperating ‐ 19,439 21,923 18,821 21,187 Other Revenue and Support ‐ 1 109 120 135 TOTAL ‐ GRAPH 3 ‐ 19,441 22,032 18,941 21,323
ExpensesProgram Services ‐ 19,831 13,177 17,941 18,281 Management and General, Fundraising ‐ 2,821 3,017 2,828 2,915 TOTAL ‐ GRAPH 3 ‐ 22,652 16,194 20,770 21,196 % of Program Services 0.0% 87.5% 81.4% 86.4% 86.2%% of Management and Other 0.0% 12.5% 18.6% 13.6% 13.8%
% of Revenue Exceeding Expenses ‐ GRAPH 5 0.0% ‐14.2% 36.0% ‐8.8% 0.6%
Student to Faculty Ratio ‐ 9.0 10.0 10.0 9.5
Faculty to Admin Ratio ‐ 2.0 1.3 1.9 1.6
Financial Responsibility Composite Scores ‐ GRAPH 6Score 0.0 0.0 0.0 0.0 0.0
Working Capital ‐ GRAPH 7Net Working Capital 0 0 0 0 0 As % of Unrestricted Revenue 0.0% 0.0% 0.0% 0.0% 0.0%Working Capital (Current) Ratio Score 0.0 0.0 0.0 0.0 0.0Risk (Low ≥ 3.0 / Medium 1.4 ‐ 2.9 / High < 1.4) N/A N/A N/A N/A N/ARating (Excellent ≥ 3.0 / Good 1.4 ‐ 2.9 / Poor < 1.4) N/A N/A N/A N/A N/A
Quick (Acid Test) RatioScore 0.0 0.0 0.0 0.0 0.0Risk (Low ≥ 2.5 / Medium 1.0 ‐ 2.4 / High < 1.0) N/A N/A N/A N/A N/ARating (Excellent ≥ 2.5 / Good 1.0 ‐ 2.4 / Poor < 1.0) N/A N/A N/A N/A N/A
Debt to Asset Ratio ‐ GRAPH 7Score 0.0 0.0 0.0 0.0 0.0Risk (Low < 0.50 / Medium 0.51 ‐ .95 / High > 1.0) N/A N/A N/A N/A N/ARating (Excellent < 0.50 / Good 0.51 ‐ .95 / Poor > 1.0) N/A N/A N/A N/A N/A
Months of Cash ‐ GRAPH 8Score 0.0 0.0 0.0 0.0 0.0Risk (Low > 3 mo. / Medium 1 ‐ 3 mo. / High < 1 mo.) N/A N/A N/A N/A N/ARating (Excellent > 3 mo. / Good 1 ‐ 3 mo. / Poor < 1 mo.) N/A N/A N/A N/A N/A
Fiscally Strong 1.5 ‐ 3.0 / Fiscally Adequate 1.0 ‐ 1.4 /Fiscally Needs Monitoring < 1.0 N/A N/A N/A N/A N/A

Charter Schools InstituteThe State University of New York
www.newyorkcharters.org
State University Plaza353 BroadwayAlbany, New York 12246
518-445-4250