the state of the unions 2014 - university of illinois at ... · the state of the unions 2014 i...
TRANSCRIPT

April 22, 2014
Frank Manzo IV, M.P.P.
Illinois Economic Policy Institute
Robert Bruno, Ph.D.
University of Illinois at Urbana-Champaign
Virginia Parks, Ph.D. The University of Chicago
A Profile of Unionization in Chicago, in Illinois, and in America
THE STATE OF THE UNIONS 2014
The State of the Unions 2014 i
Research Report April 22, 2014
THE STATE OF THE UNIONS 2014 A Profile of Unionization in Chicago, in Illinois, and in America
About the Authors
Frank Manzo IV, M.P.P. is the Policy Director of the Illinois Economic Policy Institute (ILEPI). His research focuses on labor market policies, community and economic development, infrastructure investment, and public finance. He received his Master of Public Policy from The University of Chicago Harris School of Public Policy and his Bachelor of Arts in Economics and Political Science from the University of Illinois at Urbana-Champaign. He can be contacted at [email protected].
Robert Bruno, Ph.D. is a Professor at the University of Illinois at Urbana-Champaign School of Labor and Employment Relations and is the Director of the School’s Labor Education Program. His research focuses broadly on working-class and union studies issues. He received his Doctor of Philosophy in Political Theory from New York University and his Master of Arts in Political Science from Bowling Green State University. He can be contacted at [email protected].
Virginia Parks, Ph.D. is a Professor at The University of Chicago School of Social Service Administration. Her research focuses on urban labor markets, urban geography, immigration, racial and gender inequality, and community organizing and development. She received her Doctor of Philosophy in Geography and her Master of Arts in Urban Planning from the University of California, Los Angeles. She can be contacted at [email protected].
ILINOIS ECONOMIC POLICY INSTITUTE
“A Higher Road for a Better
Tomorrow”
P.O. Box 298 La Grange, Illinois 60525
Phone: 708-375-1002 www.illinoisepi.org
UNIVERSITY OF ILLINOIS AT URBANA-CHAMPAIGN
Labor Education Program
School of Labor and Employment Relations
815 W. Van Buren Street, Suite 110 Chicago, Illinois 60607 Phone: 312-996-2624
www.illinoislabored.org
THE UNIVERSITY OF CHICAGO
School of Social Service Administration
969 E. 60th Street
Chicago, Illinois 60637 Phone: 773-702-1250
www.ssa.uchicago.edu
The State of the Unions 2014 ii
TABLE OF CONTENTS Executive Summary iii
Introduction
1
Data and Limitations 1
Unionization Rates and Trends
2
Unionization by Demographics
4
Unionization by Education
9
Unionization by Sector, Industry, and Occupation
10
Predicting Union Membership in Illinois 15
Union Wages 16
Conclusions
18
References
20
Cover Photo Credits
20
Appendix
21 Industry Profiles:
Public Administration 23
Education, Health, and Social Services 24
Construction 25
Manufacturing 26
Retail Trade 27

The State of the Unions 2014 iii
EXECUTIVE SUMMARY Since 2003, unionization has declined in Illinois, in the Chicago region, and in America. There are approximately 116,000 fewer union members in Illinois today than there were in 2003, contributing to the 1.26 million drop in union workers across the nation over that time. Declining union membership has primarily been the result of decreases in male unionization, white non-Latino unionization, and private sector unionization. Despite the long-term downward trends, however, both the unionization rate and total union membership increased in Illinois last year.
The unionization rate increased from 14.6 percent in 2012 to 15.7 percent in 2013;
Union members increased from 800,000 to about 850,000;
This uptick was driven by increases in unionization of Chicago area workers, female workers, African-American workers, public sector workers, and older workers.
Over half of all public sector workers are unionized in both Illinois and the Chicago metropolitan area (about two-thirds of public sector workers are unionized in the City of Chicago proper). Meanwhile, slightly more than a third of all public sector workers are unionized across the nation. In comparison, one-in-ten Illinois and Chicago area workers in the private sector are union members while less than seven percent of private sector American workers are unionized. Union membership is influenced by a number of factors. Employment in the utilities industry, construction industry, or public sector raises the chances that a given worker is a union member. African-American workers are also statistically more likely to be union members than their counterparts. On the other hand, high school dropouts, non-citizens, and residents who live in rural communities are less likely to be unionized. Lastly, labor unions increase individual incomes by lifting hourly wages and by raising the number of hours that employed persons work each week. In Illinois, the usual workweek of union workers is 4.8 hours longer on average than the usual workweek of nonunion employees. Additionally, unions raise worker wages by an average of 21.4 percent (and by a median of 20.3 percent) in Illinois. The state’s union wage effect exceeds the national average of 16.7 percent and is the 8
th-highest in the nation.
Ultimately, despite the long-term gradual decline in union membership, labor unions continue to play a vital role in the direction of the economy and in the creation of public policy in Illinois.

The State of the Unions 2014 1
INTRODUCTION Throughout modern American history, labor unions have played a significant role in the nation’s economy and political process. Unions have fought on behalf of workers for better pay and fringe benefits, worked to increase health and safety conditions in U.S. workplaces, and provided workers with a voice in the direction of the economy and in the creation of public policy. Organized labor has been the principal institution in fostering a middle-class society that protects the dignity of all work. Over the long run, the labor movement has contributed substantially to American families and communities. The labor movement, however, has endured a gradual decline in both membership and influence. Almost one-in-four American workers (23.0 percent) were members of labor unions in 1980. Just over three decades later, in 2013, only one-in-nine employed persons in America (11.2 percent) are unionized (Hirsch & Macpherson, 2014). Concurrently, as unionization rates have waned, income inequality has soared. The richest 10 percent of American households accrued 49.7 percent of total U.S. income in 2007, up from 34.6 percent in 1980 and even greater than the previous peak of 49.3 percent in 1928 (U.S. Congress Joint Economic Committee, 2010). Declining unionization and polarizing worker incomes are linked: wage dispersion is 25 percent lower in unionized firms than in nonunion workplaces, reducing wage inequality in the national economy by as much as 10 percent (Freeman, 1996). Additionally, declining unionization has been found to be the main cause of income inequality among men while the declining real value of the minimum wage is the primary culprit for women (Gordon & Dew-Becker, 2008; Card, 1998). Illinois has not been immune to these trends. In addition to declining union membership and rising income inequality, the state also continues to suffer from a weak economy in which wages have been largely stagnant and unemployment spells have been persistent (Manzo & Bruno, 2013). While the worst of the Great Recession appears to be over, much improvement is still needed in the Illinois labor market to restore maximum employment and raise consumer demand.
This Research Report—conducted by researchers at the Illinois Economic Policy Institute, the University of Illinois Labor Education Program, and The University of Chicago School of Social Service Administration– analyzes the course of unionization in Illinois, in the Chicago metropolitan statistical area (MSA), and in the United States from 2003 to 2013. The report is modeled off of The State of the Unions in 2013: A Profile of Union Membership in Los Angeles, California, and the Nation by the Institute for Research on Labor and Employment at the University of California, Los Angeles (Adler et al., 2013) and The State of the Unions 2013: A Profile of Organized Labor in New York City, New York State, and the United States by the Joseph S. Murphy Institute for Worker Education and Labor Studies at the City University of New York Graduate Center (Milkman & Luce, 2013). The report tracks unionization rates and trends, and investigates union membership across demographic, educational, sectoral, industry, and occupational classifications. The study subsequently evaluates the impact that labor union membership has on a worker’s hourly wage in Illinois, in the Chicago MSA, and in America. Finally, the report concludes by recapping key findings.
DATA AND LIMITATIONS This Research Report exclusively utilizes data from the Current Population Survey Outgoing Rotation Groups (CPS-ORG), which is collected, analyzed, and released by the U.S. Department of Labor Bureau of Labor Statistics (BLS). CPS-ORG data reports individual-level information on 25,000 respondents nationwide each month. The records include data on wages, unionization, hours worked, sector, industry, and occupation, as well as other demographic, geographic, education, and work variables. The data was extracted from the user-friendly Center for Economic and Policy Research Uniform Data Extracts (Center for Economic and Policy Research, 2013).

The State of the Unions 2014 2 The 11-year dataset from 2003 to 2013 captures information on 3,523,304 individuals aged 16 to 85 in the United States. These observations include 2,152,088 persons with a job, of whom 230,521 were union members. Survey responses include information from 67,523 employed individuals in Illinois since 2003 and 35,154 employed persons in the Chicago MSA since 2005, the earliest year for which data are available. In 2013, respondents totaled 5,675 in Illinois, 3,848 in the Chicago MSA, and 186,115 nationwide. “Chicago MSA” workers are defined as only those who live in the Illinois component of the Chicago-Naperville-Joliet Metropolitan Statistical Area (i.e., no Indiana or Wisconsin residents are included). Analytic weights are provided by the Department of Labor to match the sample to the actual U.S. population 16 years of age or greater. These weights adjust the influence of an individual respondent’s answers on a particular outcome to compensate for demographic groups that are either underrepresented or overrepresented compared to the total population. The weights are applied throughout the analysis. There are limitations to the CPS-ORG dataset. First, the data reports a worker’s state of residence rather than state of employment, so the results may be biased by workers who live in one state but work in another (e.g., living in Illinois but working in Missouri) and vice-versa. Additionally, CPS-ORG data is based on household survey responses, so the potential exists for respondents to be untruthful. Certain individuals such as undocumented workers may also be underreported if they are harder to reach by survey officials.
UNIONIZATION RATES AND TRENDS Since 2003, unionization has declined in Illinois, the Chicago metropolitan area, and the United States (Figure 1). The total union membership rate was 17.9 percent in Illinois and 12.9 percent nationwide in 2003. Eleven years later, both rates have fallen to 15.7 percent and 11.2 percent, respectively. The Chicago region’s unionization rate has also dipped from 16.9 percent in 2005, the earliest year for which data are available, to 15.6 percent in 2013. The gradual decline in the unionization rate has translated into a decrease in union membership of about 116,000 workers in Illinois since 2003, contributing to the 1,260,000 national decline in union members over that time. Additionally, from 2005 to 2013, the Chicago region experienced an estimated loss of 36,000 union workers (Figure 2). News for the Illinois labor movement has not been all bad, however. Despite the long-term downward trends, unionization rates and total membership increased in 2013 for both Illinois and the Chicago region (Figure 1). The unionization rate rose in Illinois to 15.7 percent in Illinois, up from 14.6 percent in 2012. This upward movement was the result of an estimated 50,000 year-over-year increase in union members throughout the state. Additionally, the statewide increase was driven predominately by improvement in the Chicago metropolitan area, which saw an 80,000-member growth and a 2.2 percentage-point increase in the unionization rate to 15.6 percent. Finally, despite fluctuations in unionization, Illinois’ union membership rate has consistently been above the national average. The 11-year combined Illinois unionization rate was 16.2 percent, 4.2 percentage points higher than the 12.1 percent national rate. On a year-by-year basis, Illinois’ elevation has ranged from 2.4 to 5.2 percentage points higher than the national average (Figure 2). An ongoing challenge to the Illinois labor movement remains the high rate of unemployment in the state. Unemployment is the result of a surplus of workers compared to available jobs. Since labor supply exceeds the demand for workers, downward pressure is placed on wages and the job security of the currently employed is threatened. The pressures of a weak labor market thus empower employers relative to workers, and as a result unions may be pushed into making concessions. In Illinois, unemployment has been above 9 percent for the past five years (Figure 3). Initially, the union membership rate actually increased during the Great Recession. Unionization was 16.6 percent in 2008

The State of the Unions 2014 3 and 17.5 percent in 2009, up from a 2007 rate of 14.5 percent. The rise, however, was likely because unions protected the jobs of their members while employers cut nonunion and temporary workers from their payrolls. Since the initial bump, the unionization rate has regressed back into decline as high unemployment has incentivized employers to proceed to shed the union workforce.
FIGURE 1: UNIONIZATION RATES AND TOTAL UNION MEMBERSHIP BY REGION, 2003-2013
FIGURE 2: TOTAL UNION MEMBERS AND OVERALL UNIONIZATION RATES BY REGION, 2003-2013
Illinois Chicago MSA* USA
Year Members Rate Members Rate Members Rate
2003 966,861 17.91% 15,775,968 12.89%
2004 908,286 16.79% 15,471,602 12.52%
2005 926,805 16.94% 606,501 16.92% 15,685,387 12.46%
2006 931,165 16.38% 601,518 16.22% 15,359,108 11.98%
2007 842,189 14.51% 525,343 13.77% 15,670,352 12.08%
2008 939,212 16.59% 581,955 15.70% 16,097,535 12.44%
2009 950,586 17.49% 609,460 17.06% 15,327,280 12.31%
2010 843,807 15.53% 549,528 15.57% 14,715,061 11.86%
2011 875,891 16.19% 537,637 15.18% 14,754,673 11.78%
2012 800,434 14.58% 490,023 13.36% 14,349,358 11.25%
2013 850,557 15.74% 570,390 15.55% 14,515,755 11.24%
Totals 9,835,792 16.23% 5,072,355 15.47% 167,722,080 12.07%
*Due to changes in the definition of metropolitan statistical areas (MSAs), 2005 is the earliest year for which Chicago MSA data are available.
FIGURE 3: ILLINOIS UNIONIZATION RATE VS. ILLINOIS UNEMPLOYMENT RATE, 2003-2013
0%
5%
10%
15%
20%
20
03
20
04
20
05
20
06
20
07
20
08
20
09
20
10
20
11
20
12
20
13
Unionization Rates by Region
USA Illinois Chicago MSA
400,000
500,000
600,000
700,000
800,000
900,000
1,000,000
20
03
20
04
20
05
20
06
20
07
20
08
20
09
20
10
20
11
20
12
20
13
Union Membership by Region
Illinois Chicago MSA Trends
17.9%
14.5%
17.5%
14.6%
15.7%
6.7%
5.1%
10.1%
9.1%
9.4%
0%
5%
10%
15%
20%
20
03
20
04
20
05
20
06
20
07
20
08
20
09
20
10
20
11
20
12
20
13
Unionization vs. Unemployment
UnionizationRate
UnemploymentRate
Trends

The State of the Unions 2014 4
UNIONIZATION BY DEMOGRAPHICS Falling rates of unionization have reflected steep declines in union membership among men (Figure 4). An estimated 22.2 percent of employed men were unionized in 2003, but the 2013 male unionization rate in Illinois fell to 16.5 percent. The male unionization rate has also decreased in both the Chicago region and the nation as a whole. Since 2005, male union density has dropped by 3.8 percentage points in the Chicago area and by 1.7 percentage points in the United States. In Illinois, a significant portion of the male drop in unionization has been offset by an increase in the female union membership rate (Figure 4). Indeed, female union density in both Illinois and Chicago was higher in 2013 than at any other point over the past decade. While 13.3 percent of women workers in Illinois were union members in 2003, by the end of 2013 the rate had increased to 14.9 percent. The union membership rate for women is even larger in the Chicago region, at 15.4 percent. Nationwide, however, female union membership has dipped slightly, from 11.4 percent in 2003 to 10.5 percent today.
FIGURE 4: GRAPHS OF UNIONIZATION RATES BY GENDER, 2003-2013
0%
5%
10%
15%
20%
25%
20
03
20
04
20
05
20
06
20
07
20
08
20
09
20
10
20
11
20
12
20
13
Male
Illinois Chicago USA
0%
5%
10%
15%
20%
25%
20
03
20
04
20
05
20
06
20
07
20
08
20
09
20
10
20
11
20
12
20
13
Female
Illinois Chicago USA
0%
5%
10%
15%
20%
25%
20
03
20
04
20
05
20
06
20
07
20
08
20
09
20
10
20
11
20
12
20
13
Illinois Unionization by Gender
Male Female Linear Trends
16.5% 14.9%
15.7% 15.4%
11.9% 10.5%
0%
5%
10%
15%
20%
Male Female
2013 Unionization Rates by Gender
Illinois Chicago MSA USA

The State of the Unions 2014 5 The gap between male and female union membership rates is shrinking (Figure 4). In 2013, male union membership exceeded its female equivalent by just 0.3 percentage points in the Chicago area and by 1.6 percentage points in Illinois. But as recently as 2003, the Illinois gap was a full 9.0 percentage points. If current (linearized) trends in unionization continue in the state, the distance between male and female unionization rates will be eliminated by 2017, converging at 14.6 percent. African-Americans are the most unionized racial or ethnic identity group (Figure 5). The unionization rate for African-American workers is 25.8 percent in Illinois, 27.6 percent in the Chicago MSA, and 13.4 percent in the United States. In comparison, white non-Latino union density is 15.4 percent in the state, 14.6 percent in Illinois’ largest metropolitan area, and 11.4 percent across the nation. Respective unionization rates for Latino and Latina workers are currently lower, at 12.6 percent, 12.8 percent, and 9.4 percent.
FIGURE 5: UNIONIZATION RATES BY RACIAL OR ETHNIC IDENTIFICATION BY REGION, 2013
Over time, union membership has fallen for every racial or ethnic identity group except for African-Americans (Figure 6). From 2003 to 2013, unionization in Illinois fell by 2.4 percentage points for white workers, 3.6 percentage points for Latino/a workers, and 0.7 percentage points for other non-black workers. The African-American union membership rate, however, increased by 1.7 percentage points. In the Chicago area, trends have mirrored the overall state labor market except that, over the 11-year period of analysis, African-American union membership rates have generally been higher in the Chicago area than in the rest of the state while white non-Latino rates have been lower in the Chicago MSA. Thus, while white worker unionization increased slightly from 2012 to 2013, the primary reason that union membership jumped in Illinois last year was the boost in African-American unionization, particularly in Chicago. It is worth noting, however, that national unionization rates have declined for all racial or ethnic groups, especially for African-Americans. For all groups, unionization has fallen by between 1.3 percentage points (Latino/a workers) and 2.9 percentage points (African-Americans) in the United States since 2003. Unionization rates are much higher for middle-aged workers than young workers (Figure 7). Regardless of region studied, unionization rates are highest for workers between the ages of 35 and 64 years old. Specifically, the most unionized age groups are those aged 55-64 for the Chicago MSA (20.5 percent) and America (14.4 percent) and workers between the ages of 45 and 54 for Illinois (19.4 percent). For young workers aged 16-24, unionization rates are less than 5 percent for each of Illinois, the Chicago MSA, and the nation.
15.4%
25.8%
12.6% 14.6%
27.6%
12.8% 11.4%
13.4%
9.4%
0%
10%
20%
30%
White non-Latino African-American Latino/a
2013 Unionization Rates by Race/Ethnicity
Illinois Chicago MSA USA
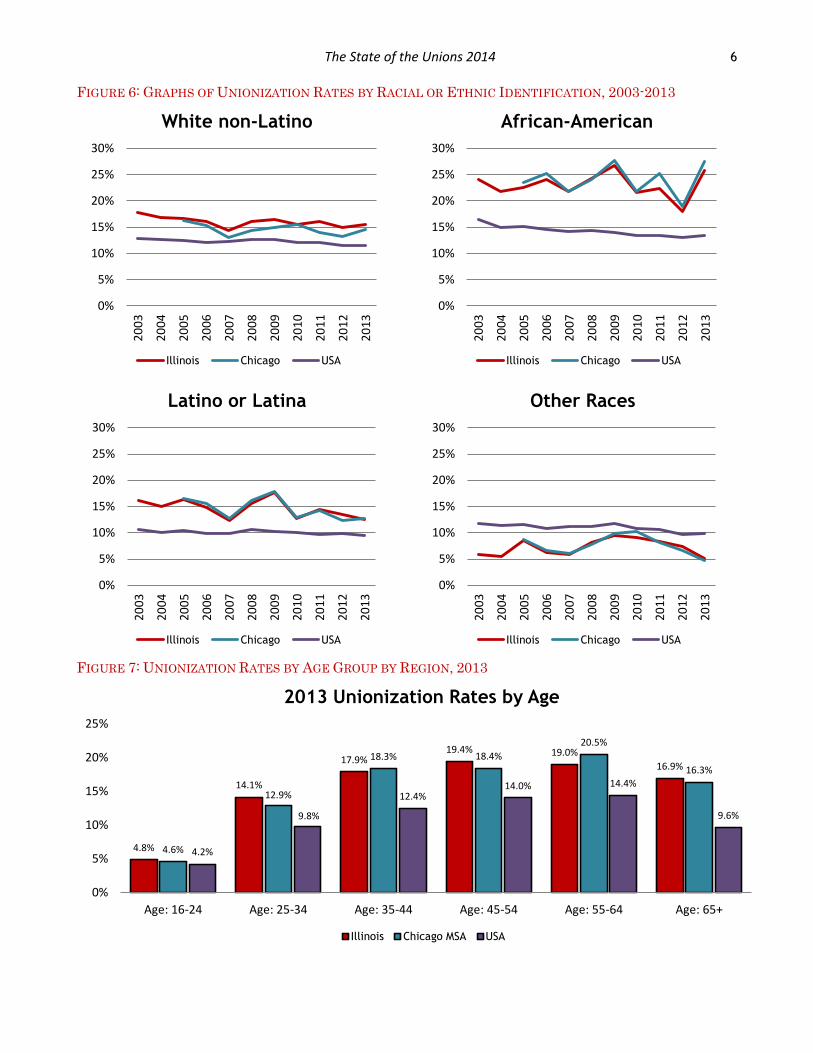
The State of the Unions 2014 6 FIGURE 6: GRAPHS OF UNIONIZATION RATES BY RACIAL OR ETHNIC IDENTIFICATION, 2003-2013
FIGURE 7: UNIONIZATION RATES BY AGE GROUP BY REGION, 2013
0%
5%
10%
15%
20%
25%
30%2
00
3
20
04
20
05
20
06
20
07
20
08
20
09
20
10
20
11
20
12
20
13
White non-Latino
Illinois Chicago USA
0%
5%
10%
15%
20%
25%
30%
20
03
20
04
20
05
20
06
20
07
20
08
20
09
20
10
20
11
20
12
20
13
Latino or Latina
Illinois Chicago USA
0%
5%
10%
15%
20%
25%
30%
20
03
20
04
20
05
20
06
20
07
20
08
20
09
20
10
20
11
20
12
20
13
African-American
Illinois Chicago USA
0%
5%
10%
15%
20%
25%
30%
20
03
20
04
20
05
20
06
20
07
20
08
20
09
20
10
20
11
20
12
20
13
Other Races
Illinois Chicago USA
4.8%
14.1%
17.9% 19.4% 19.0%
16.9%
4.6%
12.9%
18.3% 18.4%
20.5%
16.3%
4.2%
9.8%
12.4% 14.0% 14.4%
9.6%
0%
5%
10%
15%
20%
25%
Age: 16-24 Age: 25-34 Age: 35-44 Age: 45-54 Age: 55-64 Age: 65+
2013 Unionization Rates by Age
Illinois Chicago MSA USA
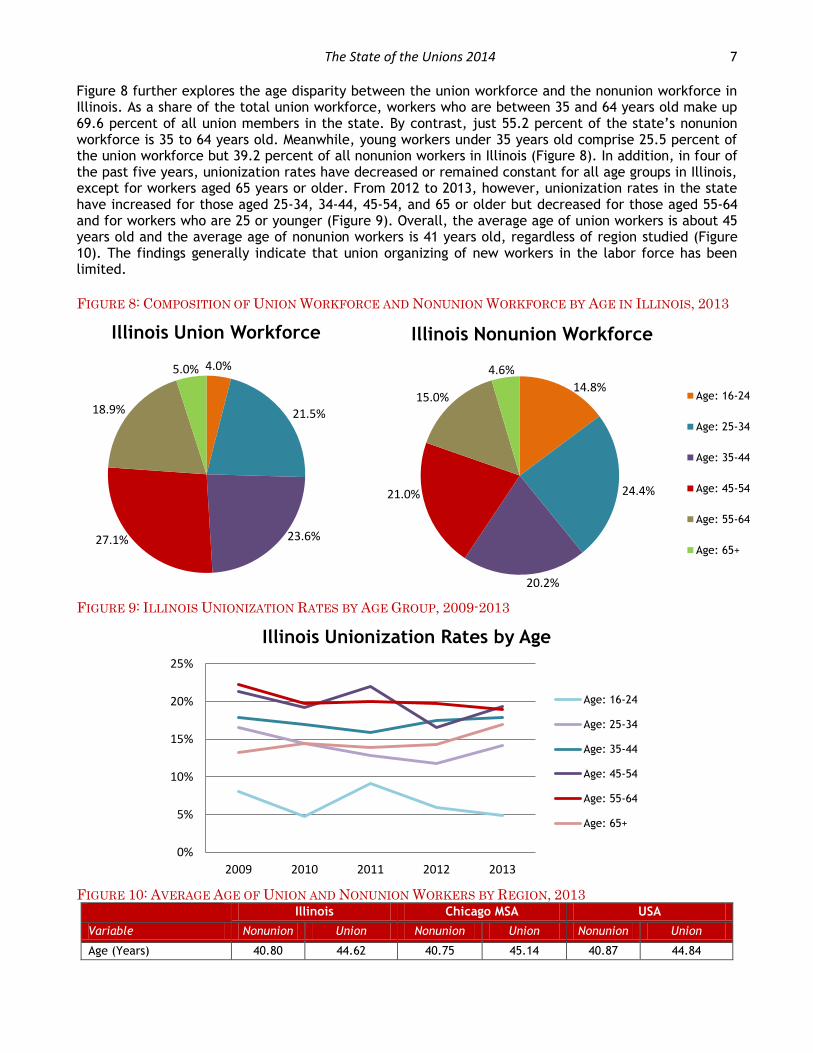
The State of the Unions 2014 7 Figure 8 further explores the age disparity between the union workforce and the nonunion workforce in Illinois. As a share of the total union workforce, workers who are between 35 and 64 years old make up 69.6 percent of all union members in the state. By contrast, just 55.2 percent of the state’s nonunion workforce is 35 to 64 years old. Meanwhile, young workers under 35 years old comprise 25.5 percent of the union workforce but 39.2 percent of all nonunion workers in Illinois (Figure 8). In addition, in four of the past five years, unionization rates have decreased or remained constant for all age groups in Illinois, except for workers aged 65 years or older. From 2012 to 2013, however, unionization rates in the state have increased for those aged 25-34, 34-44, 45-54, and 65 or older but decreased for those aged 55-64 and for workers who are 25 or younger (Figure 9). Overall, the average age of union workers is about 45 years old and the average age of nonunion workers is 41 years old, regardless of region studied (Figure 10). The findings generally indicate that union organizing of new workers in the labor force has been limited.
FIGURE 8: COMPOSITION OF UNION WORKFORCE AND NONUNION WORKFORCE BY AGE IN ILLINOIS, 2013
FIGURE 9: ILLINOIS UNIONIZATION RATES BY AGE GROUP, 2009-2013
FIGURE 10: AVERAGE AGE OF UNION AND NONUNION WORKERS BY REGION, 2013
Illinois Chicago MSA USA
Variable Nonunion Union Nonunion Union Nonunion Union
Age (Years) 40.80 44.62 40.75 45.14 40.87 44.84
4.0%
21.5%
23.6% 27.1%
18.9%
5.0%
Illinois Union Workforce
14.8%
24.4%
20.2%
21.0%
15.0%
4.6%
Illinois Nonunion Workforce
Age: 16-24
Age: 25-34
Age: 35-44
Age: 45-54
Age: 55-64
Age: 65+
0%
5%
10%
15%
20%
25%
2009 2010 2011 2012 2013
Illinois Unionization Rates by Age
Age: 16-24
Age: 25-34
Age: 35-44
Age: 45-54
Age: 55-64
Age: 65+

The State of the Unions 2014 8 Union membership varies across other demographic classifications as well (Figure 11). Among the most unionized social groups are war veterans. Almost one-quarter of all employed veterans are unionized in the Chicago area (23.4 percent) and Illinois (23.3 percent). For the United States, approximately 15.4 percent of employed veterans are members are unions. The unionization rate for married workers is also above the overall average for each of the Chicago MSA, Illinois, and the United States. In addition, foreign-born immigrant workers experience lower union membership rates than their respective regional averages, while native-born and naturalized citizens are more likely to be union members.
FIGURE 11: UNIONIZATION RATES OF SELECT DEMOGRAPHIC VARIABLES BY REGION, 2013
Figure 12 reveals that geographic distance from an urban core also plays a factor in union membership. Workers who reside in the central city of a metropolitan area are more likely to be unionized than those who live in suburbs, who in turn are more likely to be union members than people living in rural communities. In Illinois, 17.6 percent of urban workers are members of unions, 14.9 percent of suburban workers are unionized, and 11.9 percent of rural workers belong to a union. The comparable figures for the United States are respectively 11.7 percent, 9.5 percent, and just 3.9 percent.
FIGURE 12: UNIONIZATION RATES BY URBAN STATUS BY REGION, 2013
10.4%
16.5%
23.3%
16.7%
10.7%
16.5%
23.4%
16.4%
9.0%
11.8%
15.4%
12.8%
0%
5%
10%
15%
20%
25%
Immigrant Citizen Veteran Married
2013 Unionization Rates by Other Demographic
Illinois Chicago MSA USA
Foreign-Born Native-Born and Naturalized Citzens
17.6%
14.9%
11.9%
17.6%
14.4%
0.0%
11.7%
9.5%
3.9%
0%
5%
10%
15%
20%
Central City Suburb Rural
2013 Unionization Rates by Urban Status
Illinois Chicago MSA USA
N/A
The State of the Unions 2014 9
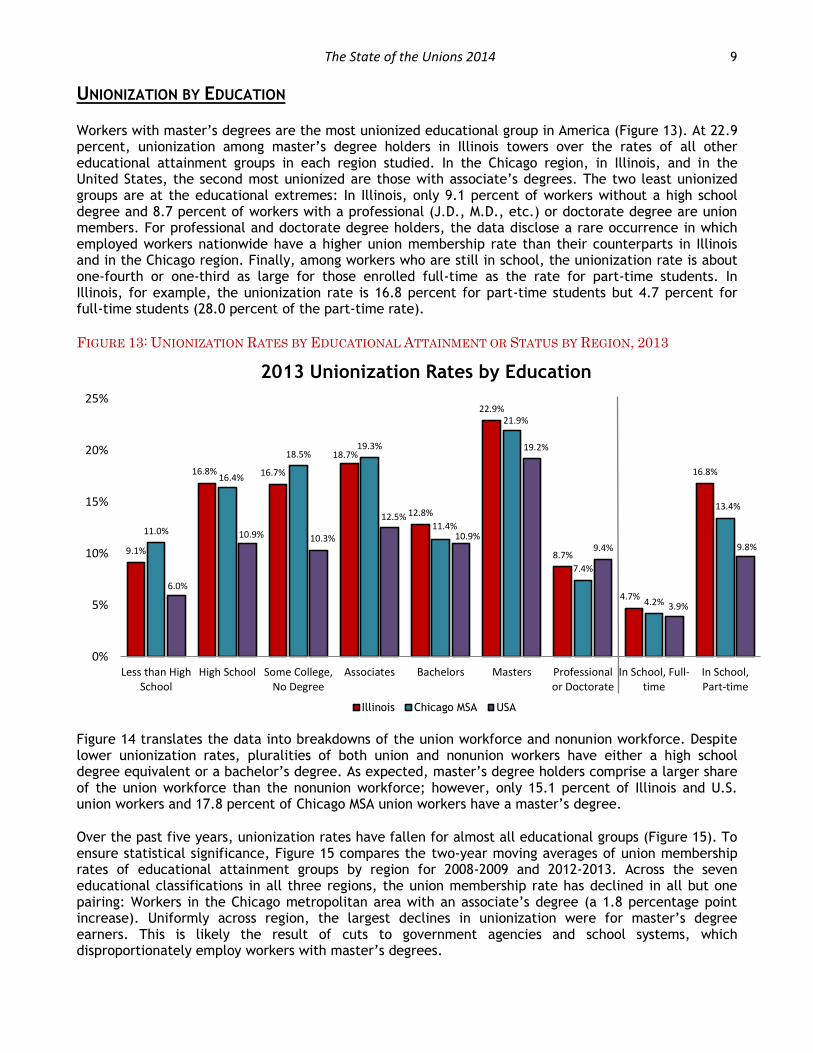
UNIONIZATION BY EDUCATION Workers with master’s degrees are the most unionized educational group in America (Figure 13). At 22.9 percent, unionization among master’s degree holders in Illinois towers over the rates of all other educational attainment groups in each region studied. In the Chicago region, in Illinois, and in the United States, the second most unionized are those with associate’s degrees. The two least unionized groups are at the educational extremes: In Illinois, only 9.1 percent of workers without a high school degree and 8.7 percent of workers with a professional (J.D., M.D., etc.) or doctorate degree are union members. For professional and doctorate degree holders, the data disclose a rare occurrence in which employed workers nationwide have a higher union membership rate than their counterparts in Illinois and in the Chicago region. Finally, among workers who are still in school, the unionization rate is about one-fourth or one-third as large for those enrolled full-time as the rate for part-time students. In Illinois, for example, the unionization rate is 16.8 percent for part-time students but 4.7 percent for full-time students (28.0 percent of the part-time rate).
FIGURE 13: UNIONIZATION RATES BY EDUCATIONAL ATTAINMENT OR STATUS BY REGION, 2013
Figure 14 translates the data into breakdowns of the union workforce and nonunion workforce. Despite lower unionization rates, pluralities of both union and nonunion workers have either a high school degree equivalent or a bachelor’s degree. As expected, master’s degree holders comprise a larger share of the union workforce than the nonunion workforce; however, only 15.1 percent of Illinois and U.S. union workers and 17.8 percent of Chicago MSA union workers have a master’s degree.
Over the past five years, unionization rates have fallen for almost all educational groups (Figure 15). To ensure statistical significance, Figure 15 compares the two-year moving averages of union membership rates of educational attainment groups by region for 2008-2009 and 2012-2013. Across the seven educational classifications in all three regions, the union membership rate has declined in all but one pairing: Workers in the Chicago metropolitan area with an associate’s degree (a 1.8 percentage point increase). Uniformly across region, the largest declines in unionization were for master’s degree earners. This is likely the result of cuts to government agencies and school systems, which disproportionately employ workers with master’s degrees.
9.1%
16.8% 16.7%
18.7%
12.8%
22.9%
8.7%
4.7%
16.8%
11.0%
16.4%
18.5% 19.3%
11.4%
21.9%
7.4%
4.2%
13.4%
6.0%
10.9% 10.3%
12.5%
10.9%
19.2%
9.4%
3.9%
9.8%
0%
5%
10%
15%
20%
25%
Less than HighSchool
High School Some College,No Degree
Associates Bachelors Masters Professionalor Doctorate
In School, Full-time
In School,Part-time
2013 Unionization Rates by Education
Illinois Chicago MSA USA

The State of the Unions 2014 10 FIGURE 14: COMPOSITION OF UNION AND NONUNION WORKFORCE BY EDUCATION BY REGION, 2013
Illinois Chicago MSA USA
Variable Nonunion Union Nonunion Union Nonunion Union
Less than High School 8.2% 4.4% 8.6% 5.7% 9.4% 4.7%
High School 24.2% 26.1% 21.7% 23.1% 27.1% 26.2%
Some College, No Degree 19.4% 20.8% 17.7% 21.8% 19.5% 17.7%
Associates 8.8% 10.9% 7.2% 9.5% 10.6% 12.0%
Bachelors 26.5% 20.9% 29.2% 20.4% 22.5% 21.8%
Masters 9.5% 15.1% 11.6% 17.8% 7.9% 15.1%
Professional or Doctorate 3.5% 1.8% 4.0% 1.8% 3.0% 2.5%
Sample Size 4,310 817 2,943 546 145,053 18,775
Employed Population 4,520,869 850,557 3,079,842 570,390 113,120,437 14,515,753
FIGURE 15: CHANGE IN UNIONIZATION RATES BY EDUCATION, TWO-YEAR MOVING AVERAGES, 2008-2013 Illinois Chicago MSA USA
Variable 2008-09 2012-13 Change 2008-09 2012-13 Change 2008-09 2012-13 Change
Less than High School 11.6% 8.1% -3.5% 12.9% 9.5% -3.4% 6.8% 5.8% -1.0%
High School 18.2% 17.2% -1.1% 17.6% 16.9% -0.6% 12.1% 11.0% -1.1%
Some College, No Degree 16.8% 15.3% -1.5% 18.0% 15.0% -3.0% 11.4% 10.3% -1.1%
Associates 19.5% 17.4% -2.1% 16.8% 18.6% 1.8% 14.1% 12.6% -1.5%
Bachelors 14.6% 12.5% -2.0% 13.0% 10.7% -2.3% 12.4% 10.9% -1.5%
Masters 26.8% 21.9% -4.9% 24.5% 20.9% -3.6% 21.5% 19.4% -2.1%
Professional/Doctorate 8.1% 7.8% -0.3% 8.5% 6.5% -2.0% 10.1% 9.3% -0.8%
UNIONIZATION BY SECTOR, INDUSTRY, AND OCCUPATION Unionization rates are significantly higher for public sector workers (Figure 16). Over half of all public sector workers are unionized in both Illinois (52.3 percent) and the Chicago region (55.1 percent) and slightly over one-third are union members nationwide (35.3 percent). In comparison, just one-in-ten private sector workers is now a union member in both Illinois (10.0 percent) and the Chicago MSA (9.9 percent) and less than seven percent of the private sector is unionized in America (6.7 percent). Furthermore, though not shown graphically, union membership rates for the City of Chicago proper are 10.8 percent for private sector workers and 64.1 percent for public sector workers, based on results from a weighted sample size of 1,237 Chicago workers. Across all regions studied, the most unionized public sector group is local government employees, with almost six-in-ten workers belonging to a union in Illinois (56.6 percent) and the Chicago MSA (59.0 percent). State government commands the second-highest unionization rate among workers in the three levels of American government. Among public sector workers, the unionization rate is lowest for federal government employees, but federal government union membership rates are still about four times as high as the private sector workforce, ranging from 26.5 percent (in America) to 41.3 percent (in the Chicago area). Overall, almost half of all union members now work in the public sector (Figure 17). Of the unionized workforce, public sector workers comprise 45.2 percent in Illinois, 49.6 percent in the Chicago area, and 44.2 percent in the United States. By contrast, public sector workers are just 7.5 percent of all nonunion workers in Illinois, 11.1 percent of all nonunion workers in the Chicago MSA, and 6.5 percent of the nonunion workforce across America. The largest component of the public sector workforce, unsurprisingly, is the local government bloc of employees.

The State of the Unions 2014 11 FIGURE 16: UNIONIZATION RATES BY SECTOR OR LEVEL OF GOVERNMENT BY REGION, 2013
FIGURE 17: PUBLIC SECTOR AS A SHARE OF UNION AND NONUNION WORKFORCES BY REGION, 2013
Illinois Chicago MSA USA
Variable Nonunion Union Nonunion Union Nonunion Union
Public Sector 7.5% 45.2% 11.1% 49.6% 6.5% 44.2%
Federal 1.2% 3.9% 1.2% 4.7% 2.1% 6.4%
Local 4.3% 30.3% 4.2% 33.4% 5.2% 29.7%
State 2.1% 11.0% 1.1% 6.1% 3.7% 13.5%
Public sector unionization in Illinois has actually increased over time (Figure 18). While private sector unionization has gradually decreased in Illinois, the Chicago metropolitan area, and the United States, public sector union membership has experienced gains in Illinois and in the Chicago area (nationwide, public sector unionization has marginally declined). In Illinois, 2003 union membership rates were 49.8 percent for public sector workers and 12.9 percent for private sector workers. The rates experienced a trough in 2007, at 44.2 percent and 9.7 percent, respectively, before rebounding in 2009. Today, the union membership rate for private sector workers is 2.9 percentage points lower than it was in 2003 but 2.5 percentage points higher for public sector workers.
FIGURE 18: UNIONIZATION RATES BY SECTOR BY REGION, 2003 TO 2013
10.0%
52.3%
37.6%
56.6%
49.0%
9.9%
55.1%
41.3%
59.0%
50.2%
6.7%
35.3%
26.5%
40.8%
30.9%
0%
10%
20%
30%
40%
50%
60%
Private Sector Public Sector Federal government Local government State government
2013 Unionization Rates by Sector
Illinois Chicago MSA USA
0%
10%
20%
30%
40%
50%
60%
20
03
20
04
20
05
20
06
20
07
20
08
20
09
20
10
20
11
20
12
20
13
Public vs. Private
Illinois Public
Illinois Private
Chicago Public
Chicago Private
USA Public
USA Private
12.9%
9.7%
10.9% 10.0%
49.8%
44.2%
53.6% 52.3%
0%
10%
20%
30%
40%
50%
60%
20
03
20
04
20
05
20
06
20
07
20
08
20
09
20
10
20
11
20
12
20
13
Illinois Unionization Rates by Sector
Private Sector Public Sector

The State of the Unions 2014 12 FIGURE 19: UNIONIZATION RATES BY INDUSTRY BY REGION, 2013
7.0%
16.6%
37.8%
12.8%
2.9%
6.1%
31.5%
42.7%
5.7%
4.4%
3.3%
25.9%
1.2%
6.6%
51.7%
8.6%
7.7%
0.0%
0.0%
36.6%
8.1%
2.7%
8.0%
32.2%
46.1%
4.5%
5.8%
3.5%
26.7%
1.8%
5.3%
52.2%
11.1%
10.9%
1.7%
5.5%
15.3%
10.2%
5.1%
4.6%
26.8%
26.7%
9.5%
2.7%
2.9%
18.2%
1.5%
3.1%
32.1%
7.0%
6.6%
0% 10% 20% 30% 40% 50% 60%
Agriculture & Fishing
Mining
Construction
Manufacturing
Wholesale Trade
Retail Trade
Transportation & Warehousing
Utilities
Info & Communications Technology
Finance
Professional, Science, & Management
Education, Health, & Social Service
Food Service
Other Services
Public Administration
Accommodation
Arts & Entertainment
2013 Unionization Rates by Industry
USA Chicago MSA Illinois

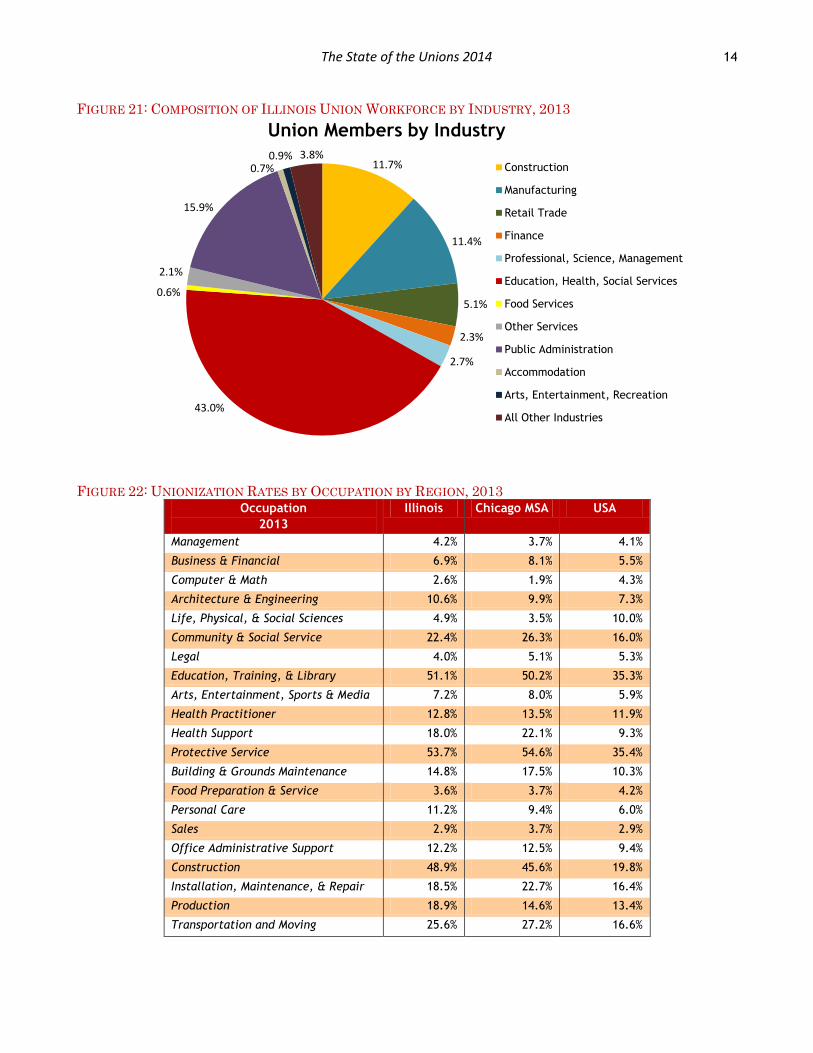
The State of the Unions 2014 13 Union membership varies significantly by industry of employment (Figure 19). The top five industries by unionization rates are public administration; utilities; construction; transportation and warehousing; and the combined education, health, and social services industry. The national manufacturing workforce, associated historically as a leader in industrial unionization, is now only 10.2 percent organized, compared to 8.1 percent in the Chicago region and 12.8 percent in Illinois. The least-unionized industries generally are food service; the combined professional, science, and management industry; wholesale trade; finance; and the aggregated agriculture, fishing, and hunting sector. Figures 20 and 21 present industry breakdowns of total union membership in Illinois compared to total employment in the state. In Figure 20, industries are organized in descending order by unionization rate and weighted estimates are rounded to the nearest thousand. The top five industries with the most union members in Illinois are education-health-social services (325,000 members), public administration (120,000 members), construction (89,000 members), manufacturing (86,000 members), and retail trade (39,000 members) (Figure 20). Together, union members from these five industries account for 87.1 percent of all union workers in Illinois (Figure 21). For more information, the Appendix includes profiles of unionization for these five largest Illinois industries by union membership. One cautionary note must be mentioned, however. While the total sample included 5,675 respondents of persons living in Illinois who were employed (4,872 of whom offered their industry of employment), cutting the data into industry-level investigations results in relatively small sample sizes. Other than the large education-health-social sciences industry, the statistics in Figure 20 are simply estimates. Nevertheless, they are informative in that they shed light on the state’s union membership and provide, at the very least, general parameters on the composition of the union workforce.
FIGURE 20: ILLINOIS INDUSTRY UNIONIZATION RATES, EMPLOYMENT, AND UNION MEMBERS, 2013 Illinois
2013
Unionization
Rate
Total
Employment
Total Union Members
Total
Sample
Public Administration 51.71% 232,000 120,000 224
Construction 37.81% 234,000 89,000 222
Education, Health, & Social Sciences 25.94% 1,252,000 325,000 1,211
Manufacturing 12.76% 672,000 86,000 647
Accommodation 8.57% 60,000 5,000 56
Arts & Entertainment 7.70% 85,000 7,000 82
Other Services 6.60% 241,000 16,000 229
Retail Trade 6.14% 627,000 39,000 589
Finance 4.40% 400,000 18,000 382
Professional, Science, & Management 3.32% 603,000 20,000 577
Food Service 1.17% 365,000 4,000 336
All Other Industries 8.70% 329,000 29,000 317
Lastly, Figure 22 depicts unionization rates by occupation. Across all regions, the five most unionized occupation groups are protective service jobs such as police officers and firefighters (53.7 percent in Illinois); education, training, and library occupations such as teachers (51.1 percent in Illinois); construction occupations such as carpenters and operating engineers (48.9 percent in Illinois); transportation and moving jobs such as public transit workers and truck drivers (25.6 percent in Illinois); and community and social service occupations such as community health workers and social workers (22.4 percent in Illinois). Nevertheless, compared to the nation, unionization rates in these five occupations are significantly higher in Illinois. Union membership in the construction and education-training-library occupations, as examples, are respectively 29.1 percentage points and 15.8 percentage points higher in Illinois than the United States average. The five least-unionized occupations, regardless of region, are sales; computer and math; management; legal; and business and financial jobs.
The State of the Unions 2014 14
FIGURE 21: COMPOSITION OF ILLINOIS UNION WORKFORCE BY INDUSTRY, 2013
FIGURE 22: UNIONIZATION RATES BY OCCUPATION BY REGION, 2013
Occupation
2013
Illinois Chicago MSA USA
Management 4.2% 3.7% 4.1%
Business & Financial 6.9% 8.1% 5.5%
Computer & Math 2.6% 1.9% 4.3%
Architecture & Engineering 10.6% 9.9% 7.3%
Life, Physical, & Social Sciences 4.9% 3.5% 10.0%
Community & Social Service 22.4% 26.3% 16.0%
Legal 4.0% 5.1% 5.3%
Education, Training, & Library 51.1% 50.2% 35.3%
Arts, Entertainment, Sports & Media 7.2% 8.0% 5.9%
Health Practitioner 12.8% 13.5% 11.9%
Health Support 18.0% 22.1% 9.3%
Protective Service 53.7% 54.6% 35.4%
Building & Grounds Maintenance 14.8% 17.5% 10.3%
Food Preparation & Service 3.6% 3.7% 4.2%
Personal Care 11.2% 9.4% 6.0%
Sales 2.9% 3.7% 2.9%
Office Administrative Support 12.2% 12.5% 9.4%
Construction 48.9% 45.6% 19.8%
Installation, Maintenance, & Repair 18.5% 22.7% 16.4%
Production 18.9% 14.6% 13.4%
Transportation and Moving 25.6% 27.2% 16.6%
11.7%
11.4%
5.1%
2.3%
2.7%
43.0%
0.6%
2.1%
15.9%
0.7% 0.9% 3.8%
Union Members by Industry
Construction
Manufacturing
Retail Trade
Finance
Professional, Science, Management
Education, Health, Social Services
Food Services
Other Services
Public Administration
Accommodation
Arts, Entertainment, Recreation
All Other Industries

The State of the Unions 2014 15
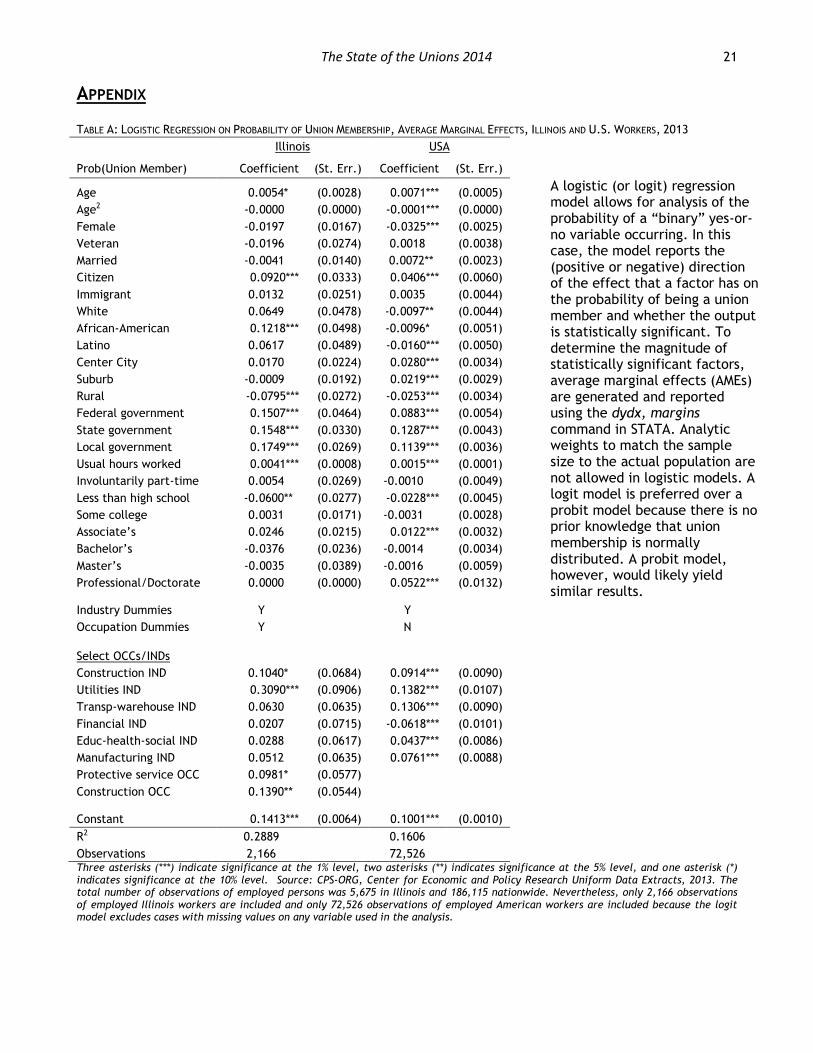
PREDICTING UNION MEMBERSHIP IN ILLINOIS An advanced analytic model is developed to predict the chances that any given worker is a union member in Illinois, using 2013 data. The model, which is detailed in the Table A of the Appendix, reports how statistically significant variables increase or decrease one’s probability of being a union member. The model does not allow the application of weights to match the sample to the actual Illinois population, but includes data on 2,166 Illinois workers. Given that Illinois had an estimated 5.40 million workers in 2013, the sample size would yield a normal 2.11 percent margin of error in a standard survey report. Many factors increase the likelihood that an employed person is a union member in Illinois. Employment in the utilities industry, the largest contributor to an individual’s chances of being a union member, raises the probability by 30.9 percentage points on average. Local, state, and federal government employment respectively increase the union probability by averages of 17.5, 15.5, and 15.1 percentage points. Employment as a construction occupation worker (e.g., as a carpenter, an operating engineer, a pipefitter, an electrician, a painter, etc.) lifts the likelihood that a worker is a union member by 13.9 percentage points. There is also suggestive evidence that working in the construction industry (which would include, for example, lawyers, architects, and administrative workers in contractor offices) adds 10.4 percentage points to the chances of being a union member and that protective service occupations increase the chances of union membership by 9.8 percentage points. Thus, employment growth in the public sector or in construction and utilities (through infrastructure investment) would likely increase unionization.
FIGURE 23: LOGISTIC REGRESSION ON PROBABILITY OF BEING A UNION MEMBER, 2013
Probability of Union Membership Illinois Mean
Predictor Coefficient Sig.
Industry: Utilities 30.90% **
Local government 17.49% **
State government 15.48% **
Federal government 15.07% **
Occupation: Construction 13.90% **
African-American 12.18% **
Industry: Construction 10.40% *
Occupation: Protective service 9.81% *
Citizen 9.20% **
Age 0.54% *
Usual hours worked 0.41% **
Less than high school -6.00% **
Rural -7.95% **
Constant 14.13% **
Observations 2,166
Two asterisks (**) indicate significance at the 5-percent level. One asterisk (*) indicates significance at the 10-percent level. Source: CPS-ORG, Center for Economic and Policy Research Uniform Data Extracts, 2013. Only statistically significant variables are displayed in the figure. For more, see the Appendix.
Beyond sector, industry, and occupation influencers, a few factors contribute positively toward the chances that a given worker in Illinois is unionized. First, African-American workers are 12.2 percentage points more likely, on average, to be union members than all other racial or ethnic groups. In addition, U.S. citizenship (or naturalization) increases the probability of being a union member by 9.2 percentage points. Every additional hour that a person usually works during a week adds 0.4 percentage points to the likelihood, meaning that a full-time worker who usually works 40 hours per week is 8.2 percentage
The State of the Unions 2014 16 points more likely to be a union member than a part-time employee who usually works 20 hours in the same job. The only educational attainment variable which statistically significantly impacts union membership is having less than a high school degree: high school dropouts are 6.0 percentage points less likely to be union members than the rest of the Illinois workforce. Decreasing the high school dropout rate may thus have a positive impact on union membership. Finally, residence in rural Illinois reduces an individual’s union membership probability by 8.0 percentage points on average compared to urban and suburban workers.
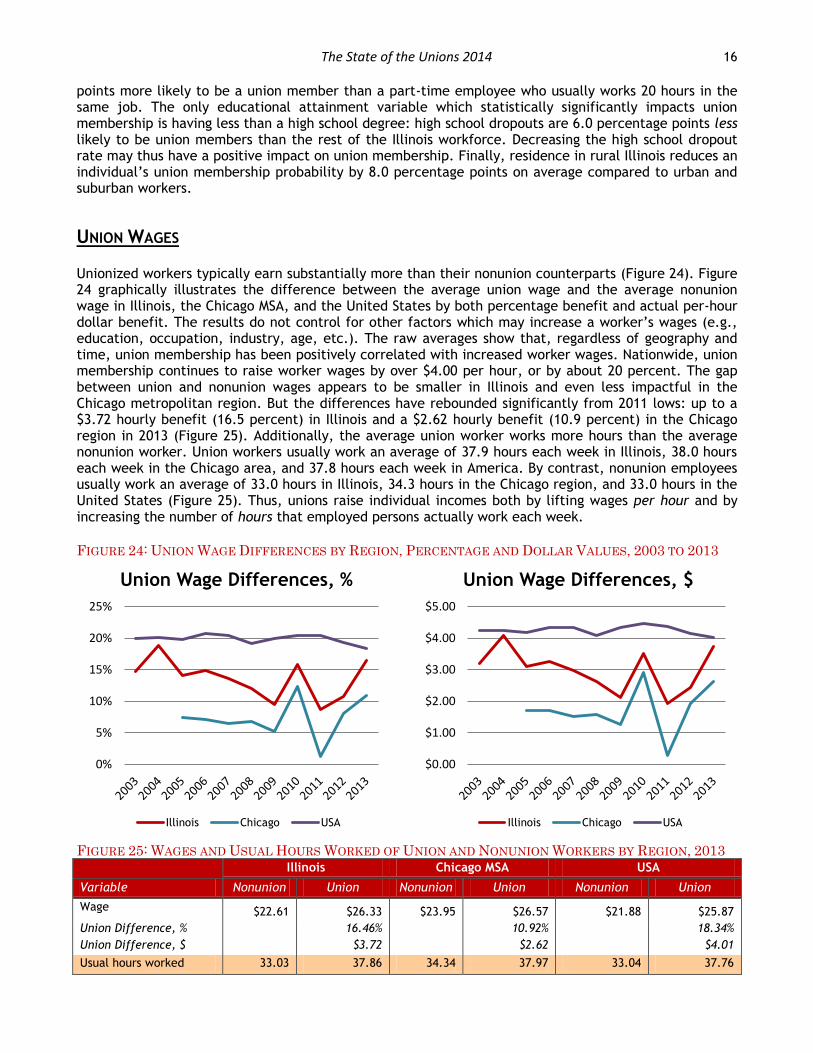
UNION WAGES Unionized workers typically earn substantially more than their nonunion counterparts (Figure 24). Figure 24 graphically illustrates the difference between the average union wage and the average nonunion wage in Illinois, the Chicago MSA, and the United States by both percentage benefit and actual per-hour dollar benefit. The results do not control for other factors which may increase a worker’s wages (e.g., education, occupation, industry, age, etc.). The raw averages show that, regardless of geography and time, union membership has been positively correlated with increased worker wages. Nationwide, union membership continues to raise worker wages by over $4.00 per hour, or by about 20 percent. The gap between union and nonunion wages appears to be smaller in Illinois and even less impactful in the Chicago metropolitan region. But the differences have rebounded significantly from 2011 lows: up to a $3.72 hourly benefit (16.5 percent) in Illinois and a $2.62 hourly benefit (10.9 percent) in the Chicago region in 2013 (Figure 25). Additionally, the average union worker works more hours than the average nonunion worker. Union workers usually work an average of 37.9 hours each week in Illinois, 38.0 hours each week in the Chicago area, and 37.8 hours each week in America. By contrast, nonunion employees usually work an average of 33.0 hours in Illinois, 34.3 hours in the Chicago region, and 33.0 hours in the United States (Figure 25). Thus, unions raise individual incomes both by lifting wages per hour and by increasing the number of hours that employed persons actually work each week.
FIGURE 24: UNION WAGE DIFFERENCES BY REGION, PERCENTAGE AND DOLLAR VALUES, 2003 TO 2013
FIGURE 25: WAGES AND USUAL HOURS WORKED OF UNION AND NONUNION WORKERS BY REGION, 2013
Illinois Chicago MSA USA
Variable Nonunion Union Nonunion Union Nonunion Union
Wage $22.61 $26.33 $23.95 $26.57 $21.88 $25.87
Union Difference, % 16.46% 10.92% 18.34%
Union Difference, $ $3.72 $2.62 $4.01
Usual hours worked 33.03 37.86 34.34 37.97 33.04 37.76
0%
5%
10%
15%
20%
25%
Union Wage Differences, %
Illinois Chicago USA
$0.00
$1.00
$2.00
$3.00
$4.00
$5.00
Union Wage Differences, $
Illinois Chicago USA
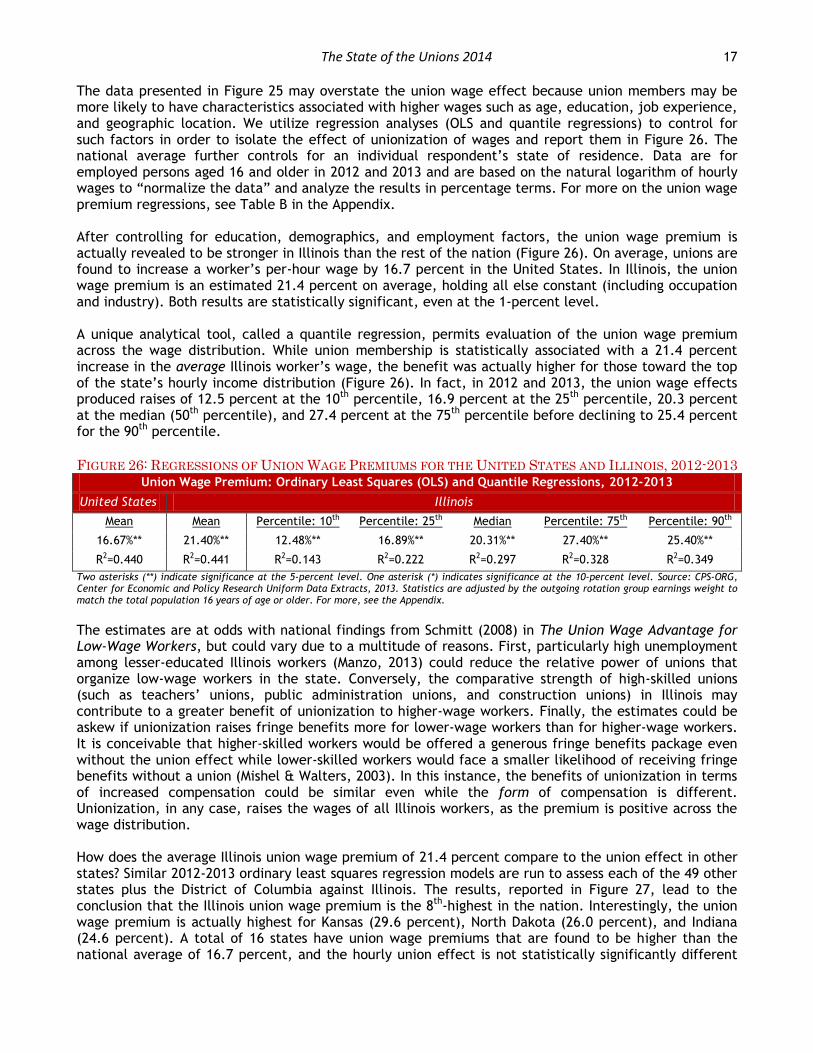
The State of the Unions 2014 17 The data presented in Figure 25 may overstate the union wage effect because union members may be more likely to have characteristics associated with higher wages such as age, education, job experience, and geographic location. We utilize regression analyses (OLS and quantile regressions) to control for such factors in order to isolate the effect of unionization of wages and report them in Figure 26. The national average further controls for an individual respondent’s state of residence. Data are for employed persons aged 16 and older in 2012 and 2013 and are based on the natural logarithm of hourly wages to “normalize the data” and analyze the results in percentage terms. For more on the union wage premium regressions, see Table B in the Appendix. After controlling for education, demographics, and employment factors, the union wage premium is actually revealed to be stronger in Illinois than the rest of the nation (Figure 26). On average, unions are found to increase a worker’s per-hour wage by 16.7 percent in the United States. In Illinois, the union wage premium is an estimated 21.4 percent on average, holding all else constant (including occupation and industry). Both results are statistically significant, even at the 1-percent level. A unique analytical tool, called a quantile regression, permits evaluation of the union wage premium across the wage distribution. While union membership is statistically associated with a 21.4 percent increase in the average Illinois worker’s wage, the benefit was actually higher for those toward the top of the state’s hourly income distribution (Figure 26). In fact, in 2012 and 2013, the union wage effects produced raises of 12.5 percent at the 10
th percentile, 16.9 percent at the 25
th percentile, 20.3 percent
at the median (50th
percentile), and 27.4 percent at the 75th
percentile before declining to 25.4 percent for the 90
th percentile.
FIGURE 26: REGRESSIONS OF UNION WAGE PREMIUMS FOR THE UNITED STATES AND ILLINOIS, 2012-2013 Union Wage Premium: Ordinary Least Squares (OLS) and Quantile Regressions, 2012-2013
United States Illinois
Mean Mean Percentile: 10th Percentile: 25th Median Percentile: 75th Percentile: 90th
16.67%** 21.40%** 12.48%** 16.89%** 20.31%** 27.40%** 25.40%**
R2=0.440 R2=0.441 R2=0.143 R2=0.222 R2=0.297 R2=0.328 R2=0.349
Two asterisks (**) indicate significance at the 5-percent level. One asterisk (*) indicates significance at the 10-percent level. Source: CPS-ORG, Center for Economic and Policy Research Uniform Data Extracts, 2013. Statistics are adjusted by the outgoing rotation group earnings weight to match the total population 16 years of age or older. For more, see the Appendix.
The estimates are at odds with national findings from Schmitt (2008) in The Union Wage Advantage for Low-Wage Workers, but could vary due to a multitude of reasons. First, particularly high unemployment among lesser-educated Illinois workers (Manzo, 2013) could reduce the relative power of unions that organize low-wage workers in the state. Conversely, the comparative strength of high-skilled unions (such as teachers’ unions, public administration unions, and construction unions) in Illinois may contribute to a greater benefit of unionization to higher-wage workers. Finally, the estimates could be askew if unionization raises fringe benefits more for lower-wage workers than for higher-wage workers. It is conceivable that higher-skilled workers would be offered a generous fringe benefits package even without the union effect while lower-skilled workers would face a smaller likelihood of receiving fringe benefits without a union (Mishel & Walters, 2003). In this instance, the benefits of unionization in terms of increased compensation could be similar even while the form of compensation is different. Unionization, in any case, raises the wages of all Illinois workers, as the premium is positive across the wage distribution. How does the average Illinois union wage premium of 21.4 percent compare to the union effect in other states? Similar 2012-2013 ordinary least squares regression models are run to assess each of the 49 other states plus the District of Columbia against Illinois. The results, reported in Figure 27, lead to the conclusion that the Illinois union wage premium is the 8
th-highest in the nation. Interestingly, the union
wage premium is actually highest for Kansas (29.6 percent), North Dakota (26.0 percent), and Indiana (24.6 percent). A total of 16 states have union wage premiums that are found to be higher than the national average of 16.7 percent, and the hourly union effect is not statistically significantly different
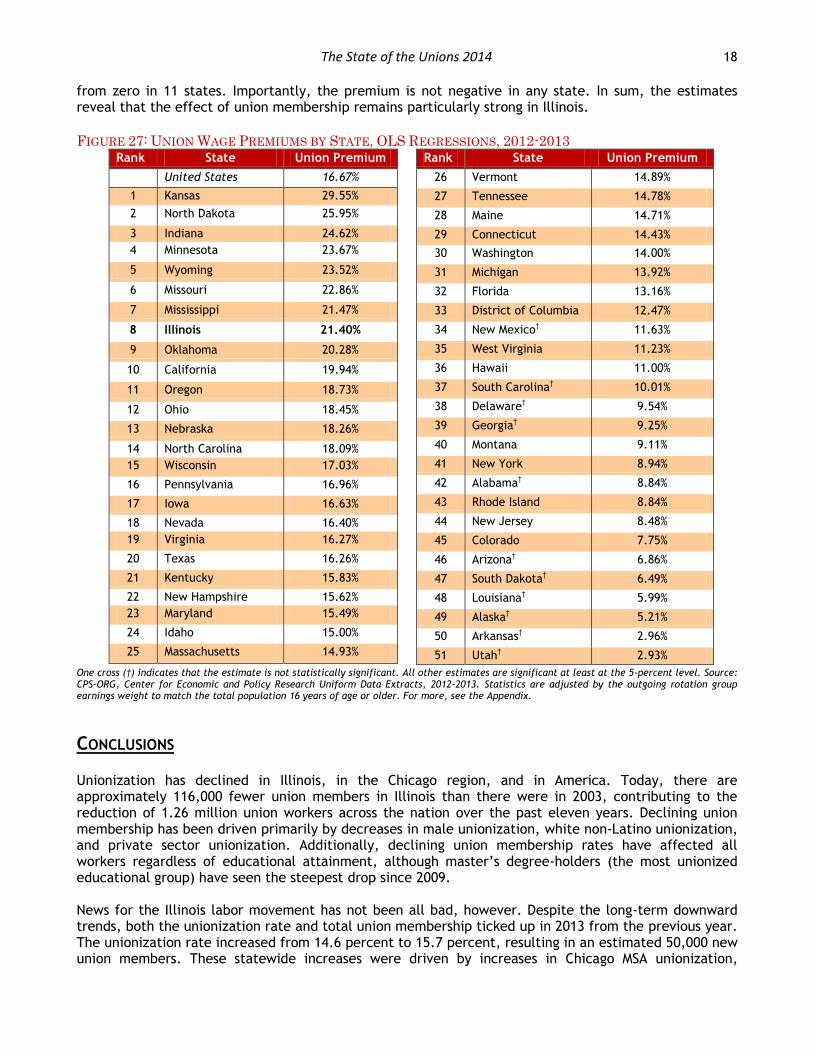
The State of the Unions 2014 18 from zero in 11 states. Importantly, the premium is not negative in any state. In sum, the estimates reveal that the effect of union membership remains particularly strong in Illinois.
FIGURE 27: UNION WAGE PREMIUMS BY STATE, OLS REGRESSIONS, 2012-2013
Rank State Union Premium
United States 16.67%
1 Kansas 29.55%
2 North Dakota 25.95%
3 Indiana 24.62%
4 Minnesota 23.67%
5 Wyoming 23.52%
6 Missouri 22.86%
7 Mississippi 21.47%
8 Illinois 21.40%
9 Oklahoma 20.28%
10 California 19.94%
11 Oregon 18.73%
12 Ohio 18.45%
13 Nebraska 18.26%
14 North Carolina 18.09%
15 Wisconsin 17.03%
16 Pennsylvania 16.96%
17 Iowa 16.63%
18 Nevada 16.40%
19 Virginia 16.27%
20 Texas 16.26%
21 Kentucky 15.83%
22 New Hampshire 15.62%
23 Maryland 15.49%
24 Idaho 15.00%
25 Massachusetts 14.93%
Rank State Union Premium
26 Vermont 14.89%
27 Tennessee 14.78%
28 Maine 14.71%
29 Connecticut 14.43%
30 Washington 14.00%
31 Michigan 13.92%
32 Florida 13.16%
33 District of Columbia 12.47%
34 New Mexico† 11.63%
35 West Virginia 11.23%
36 Hawaii 11.00%
37 South Carolina† 10.01%
38 Delaware† 9.54%
39 Georgia† 9.25%
40 Montana 9.11%
41 New York 8.94%
42 Alabama† 8.84%
43 Rhode Island 8.84%
44 New Jersey 8.48%
45 Colorado 7.75%
46 Arizona† 6.86%
47 South Dakota† 6.49%
48 Louisiana† 5.99%
49 Alaska† 5.21%
50 Arkansas† 2.96%
51 Utah† 2.93%
One cross (†) indicates that the estimate is not statistically significant. All other estimates are significant at least at the 5-percent level. Source: CPS-ORG, Center for Economic and Policy Research Uniform Data Extracts, 2012-2013. Statistics are adjusted by the outgoing rotation group earnings weight to match the total population 16 years of age or older. For more, see the Appendix.
CONCLUSIONS Unionization has declined in Illinois, in the Chicago region, and in America. Today, there are approximately 116,000 fewer union members in Illinois than there were in 2003, contributing to the reduction of 1.26 million union workers across the nation over the past eleven years. Declining union membership has been driven primarily by decreases in male unionization, white non-Latino unionization, and private sector unionization. Additionally, declining union membership rates have affected all workers regardless of educational attainment, although master’s degree-holders (the most unionized educational group) have seen the steepest drop since 2009. News for the Illinois labor movement has not been all bad, however. Despite the long-term downward trends, both the unionization rate and total union membership ticked up in 2013 from the previous year. The unionization rate increased from 14.6 percent to 15.7 percent, resulting in an estimated 50,000 new union members. These statewide increases were driven by increases in Chicago MSA unionization,

The State of the Unions 2014 19 female unionization, African-American unionization, public sector unionization, and unionization of older workers (specifically those aged 45 to 54 and those 65 or older). Sector, industry, and occupation of employment are important determinants of union membership. Unionization rates remain significantly higher for public sector workers than for private sector workers. Over half of all public sector workers are unionized in both Illinois and the Chicago metropolitan area and slightly more than one-third are unionized nationwide. In comparison, one-in-ten Illinois and Chicago MSA workers in the private sector are union members while less than seven percent of private sector American workers are unionized. Additionally, just five industries (education-health-social services, public administration, construction, manufacturing, and retail trade) account for almost nine-in-ten (87.1 percent) union workers in Illinois. Lastly, the five most unionized occupation groups are protective service jobs, education-training-library occupations, construction occupations, transportation and moving jobs, and community and social service occupations. Union membership is influenced by a number of factors. Employment in the utilities industry, construction industry, and public sector each raise the chances that a given worker is a union member by over 13 percentage points. African-American workers are also statistically more likely to be union members than their counterparts. On the other hand, high school dropouts, non-citizens, and residents who live in rural communities are less likely to be unionized. Finally, unions raise individual incomes by lifting per-hour wages and by increasing the number of hours worked each week. In Illinois, the average union worker earns $3.72 more per hour (16.5 percent) than the average nonunion worker. Once education, demographics, and employment factors are controlled for, Illinois’ union wage premium is even stronger, at 21.4 percent on average (and a median of 20.3 percent). Illinois’ union wage premium surpasses the national average of 16.7 percent and is the 8
th-
highest in the nation. Despite the long-term gradual decline in union membership, Illinois’ labor movement has seen recent growth in the Chicago region, among females, among African-American workers, and in the public sector. Organized labor in the Land of Lincoln continues to have a strong impact on both the wages and hours of its members, especially compared to other states. Ultimately, unions still play a vital role in Illinois’ economy, communities, and social life.

The State of the Unions 2014 20
REFERENCES Adler, Patrick, Chris Tilly, and Ben Zipperer. (2013). The State of the Unions in 2013: A Profile of Union
Membership in Los Angeles, California and the Nation. Institute for Research on Labor and Employment, University of California- Los Angeles, available at http://www.irle.ucla.edu/ publications/documents/StateoftheUnions2013Final.pdf.
Barry T. Hirsch and David A. Macpherson. (2014). "Union Membership, Coverage, Density, and Employment Among All Wage and Salary Workers, 1973-2013.” Unionstats.com. Georgia State University and Trinity University, Database from the Current Population Survey, available at www.unionstats.com.
Card, David. (April 1998). “Falling Union Membership and Rising Wage Inequality: What’s the Connection?” National Bureau of Economic Research. Working Paper 6520. Department of Economics, Princeton University, available at http://davidcard.berkeley.edu/papers/ wunion%20wage%20inequ.pdf.
Center for Economic and Policy Research. 2003-2013. CPS ORG Uniform Extracts, Version 1.7 . Washington, DC.
Eren, Ozkan and I. Serkan Ozbeklik. (2014). “Union Threat and Nonunion Wages: Evidence from the Case Study of Oklahoma.” Louisiana State University Working Paper, Submitted to Economic Inquiry, available at http://faculty.unlv.edu/oeren/eren_ozbeklik_paper3.pdf.
Freeman, Richard. (July 1996). “Unionism and the Dispersion of Wages.” Industrial and Labor Relations Review 34, early edition publicly available at http://core.kmi.open.ac.uk/download/pdf/ 6881792.pdf.
Gordon, Robert and Ian Dew-Becker. (April 2008). “Controversies about the Rise of American Inequality: A Survey.” National Bureau of Economic Research. Working Paper 13982. Department of Economics, Northwestern University; Department of Economics, Harvard University, available at http://www.dew-becker.org/documents/NBER_Final.pdf.
Manzo IV, Frank. (2013). A State of Lost Labor: Who Are the Unemployed in Illinois? Illinois Economic Policy Institute, Economic Commentary, available at http://illinoisepi.org/countrysidenonprofit/ wp-content/uploads/2013/10/ILEPI-Economic-Snapshot-A-State-of-Lost-Labor1.pdf.
Manzo IV, Frank and Robert Bruno. (2013). The State of Working Illinois 2013: Labor in the Land of Lincoln. Labor Education Program, University of Illinois at Urbana-Champaign, available at http://www.ler.illinois.edu/labor/images/State%20of%20Working%20Illinois_Final%20LEP%20Version.pdf.
Milkman, Ruth and Stephanie Luce. (2013). The State of the Unions 2013: A Profile of Organized Labor in New York City, New York State, and the United States. Joseph S. Murphy Institute for Worker Education and Labor Studies and the Center for Urban Research, City University of New York Graduate Center, available at http://sps.cuny.edu/filestore/8/6/3_bc4b97196c5659e/ 863_916e1989d05f0e6.pdf.
Mishel, Lawrence and Matthew Walters. (2003) How Unions Help All Workers. Economic Policy Institute, Briefing Paper, available at http://www.epi.org/publication/briefingpapers_bp143.
Schmitt, John. (2008). The Union Wage Advantage for Low-Wage Workers. Center for Economic and Policy Research, available at http://www.cepr.net/documents/publications/quantile_2008_ 05.pdf.
United States Joint Economic Committee. (2010). Income Inequality and the Great Recession. U.S. Congress, available at http://www.jec.senate.gov/public/?a=Files.Serve&File_id=91975589-257c-403b-8093-8f3b584a088c.
COVER PHOTO CREDITS Photo “CTU Rally on First Day of Strike” is © Creative Commons Flickr user firedoglakedotcom (top left), “19.MenWork.1919.14thStreet.NW.WDC.26April1013” is © Creative Commons Flickr user Elvert Barnes (top right), “Union Made Is Well Made” is © Creative Commons Flickr user Indra Hajar (bottom left) and “SEIU rally in the loop” is © Creative Commons Flickr user pbarcas (bottom right). All photos are unmodified except for bottom left, which was cropped to eliminate a white-gray border around the photo. All photos used in this report are under a Creative Commons Attribution– (ShareAlike) 2.0 Generic license, available here: http://creativecommons.org/licenses/by-sa/2.0/. The Illinois Economic Policy Institute (ILEPI), the University of Illinois Labor Education Program (LEP), and the University of Chicago School of Social Service Administration (SSA) do not own any photos included in this report.
The State of the Unions 2014 21
APPENDIX TABLE A: LOGISTIC REGRESSION ON PROBABILITY OF UNION MEMBERSHIP, AVERAGE MARGINAL EFFECTS, ILLINOIS AND U.S. WORKERS, 2013
Illinois USA
Prob(Union Member) Coefficient (St. Err.) Coefficient (St. Err.)
Age 0.0054* (0.0028) 0.0071*** (0.0005)
Age2 -0.0000 (0.0000) -0.0001*** (0.0000)
Female -0.0197 (0.0167) -0.0325*** (0.0025)
Veteran -0.0196 (0.0274) 0.0018 (0.0038)
Married -0.0041 (0.0140) 0.0072** (0.0023)
Citizen 0.0920*** (0.0333) 0.0406*** (0.0060)
Immigrant 0.0132 (0.0251) 0.0035 (0.0044)
White 0.0649 (0.0478) -0.0097** (0.0044)
African-American 0.1218*** (0.0498) -0.0096* (0.0051)
Latino 0.0617 (0.0489) -0.0160*** (0.0050)
Center City 0.0170 (0.0224) 0.0280*** (0.0034)
Suburb -0.0009 (0.0192) 0.0219*** (0.0029)
Rural -0.0795*** (0.0272) -0.0253*** (0.0034)
Federal government 0.1507*** (0.0464) 0.0883*** (0.0054)
State government 0.1548*** (0.0330) 0.1287*** (0.0043)
Local government 0.1749*** (0.0269) 0.1139*** (0.0036)
Usual hours worked 0.0041*** (0.0008) 0.0015*** (0.0001)
Involuntarily part-time 0.0054 (0.0269) -0.0010 (0.0049)
Less than high school -0.0600** (0.0277) -0.0228*** (0.0045)
Some college 0.0031 (0.0171) -0.0031 (0.0028)
Associate’s 0.0246 (0.0215) 0.0122*** (0.0032)
Bachelor’s -0.0376 (0.0236) -0.0014 (0.0034)
Master’s -0.0035 (0.0389) -0.0016 (0.0059)
Professional/Doctorate 0.0000 (0.0000) 0.0522*** (0.0132)
Industry Dummies Y Y
Occupation Dummies Y N
Select OCCs/INDs
Construction IND 0.1040* (0.0684) 0.0914*** (0.0090)
Utilities IND 0.3090*** (0.0906) 0.1382*** (0.0107)
Transp-warehouse IND 0.0630 (0.0635) 0.1306*** (0.0090)
Financial IND 0.0207 (0.0715) -0.0618*** (0.0101)
Educ-health-social IND 0.0288 (0.0617) 0.0437*** (0.0086)
Manufacturing IND 0.0512 (0.0635) 0.0761*** (0.0088)
Protective service OCC 0.0981* (0.0577)
Construction OCC 0.1390** (0.0544)
Constant 0.1413*** (0.0064) 0.1001*** (0.0010)
R2 0.2889 0.1606
Observations 2,166 72,526 Three asterisks (***) indicate significance at the 1% level, two asterisks (**) indicates significance at the 5% level, and one asterisk (*) indicates significance at the 10% level. Source: CPS-ORG, Center for Economic and Policy Research Uniform Data Extracts, 2013. The total number of observations of employed persons was 5,675 in Illinois and 186,115 nationwide. Nevertheless, only 2,166 observations of employed Illinois workers are included and only 72,526 observations of employed American workers are included because the logit model excludes cases with missing values on any variable used in the analysis.
A logistic (or logit) regression model allows for analysis of the probability of a “binary” yes-or-no variable occurring. In this case, the model reports the (positive or negative) direction of the effect that a factor has on the probability of being a union member and whether the output is statistically significant. To determine the magnitude of statistically significant factors, average marginal effects (AMEs) are generated and reported using the dydx, margins command in STATA. Analytic weights to match the sample size to the actual population are not allowed in logistic models. A logit model is preferred over a probit model because there is no prior knowledge that union membership is normally distributed. A probit model, however, would likely yield similar results.
The State of the Unions 2014 22 TABLE B: OLS AND QUANTILE REGRESSIONS OF THE IMPACT OF UNION MEMBERSHIP ON THE NATURAL LOG OF REAL HOURLY WAGES, 2012-2013
(1) (1) (2) (3)
USA Mean Illinois Mean Illinois Median, Q(.5) Indiana Mean
Ln(Real Wage) Coefficient (St. Err.) Coefficient (St. Err.) Coefficient (St. Err.) Coefficient (St. Err.)
Union member 0.1667*** (0.0048) 0.2140*** (0.0256) 0.2031*** (0.0011) 0.2462*** (0.0399)
Age 0.0261*** (0.0006) 0.0185*** (0.0032) 0.0165*** (0.0001) 0.0273*** (0.0043)
Age2 -0.0002*** (0.0000) -0.0002*** (0.0000) -0.0002*** (0.0000) -0.0003*** (0.0000)
Female -0.0793*** (0.0032) -0.0649*** (0.0184) -0.0287*** (0.0008) -0.1172*** (0.0258)
Veteran 0.0154** (0.0063) 0.0488 (0.0384) 0.0552*** (0.0017) -0.0107 (0.0443)
Married 0.0508*** (0.0031) 0.0383** (0.0178) 0.0332*** (0.0008) 0.0932** (0.0233)
Citizen 0.0658*** (0.0068) 0.0143 (0.0364) 0.0863*** (0.0016) 0.1592* (0.0917)
Immigrant -0.0390*** (0.0059) -0.0600* (0.0327) -0.0512*** (0.0014) 0.0133 (0.0832)
White 0.0306*** (0.0063) 0.0110 (0.0415) 0.0025 (0.0018) 0.2703*** (0.0775)
African-American -0.0538*** (0.0071) -0.0748 (0.0462) -0.0629*** (0.0020) 0.1716** (0.0839)
Latino -0.0330*** (0.0065) -0.0197 (0.0427) -0.0001 (0.0019) 0.2155*** (0.0797)
Center City 0.0209*** (0.0046) 0.0457* (0.0278) 0.0479*** (0.0012) 0.0309 (0.0358)
Suburb 0.0264*** (0.0041) 0.0342 (0.0245) 0.0615*** (0.0010) 0.0203 (0.0310)
Rural -0.0222*** (0.0049) -0.0180 (0.0306) 0.0420*** (0.0014) 0.0125 (0.0320)
Federal government 0.0760*** (0.0109) -0.0032 (0.0825) -0.0688*** (0.0036) 0.0656 (0.1088)
State government -0.0465*** (0.0086) 0.0422 (0.0556) 0.0338*** (0.0025) -0.0466 (0.0730)
Local government 0.0247*** (0.0070) -0.0278 (0.0439) -0.0149*** (0.0019) 0.0042 (0.0587)
Usual hours worked 0.0065*** (0.0002) 0.0068*** (0.0009) 0.0069*** (0.0000) 0.0053*** (0.0012)
Involuntarily part-time -0.0679*** (0.0050) -0.0751*** (0.0270) -0.0365*** (0.0012) -0.0628*** (0.0382)
Less than high school -0.1045*** (0.0047) -0.1007*** (0.0278) -0.0735*** (0.0013) -0.0458 (0.0368)
Some college 0.0273*** (0.0037) 0.0217 (0.0212) 0.0234*** (0.0009) -0.0497* (0.0268)
Associate’s 0.0656*** (0.0046) 0.0007 (0.0285) 0.0371*** (0.0013) 0.0602* (0.0353)
Bachelor’s 0.1850*** (0.0046) 0.1991*** (0.0264) 0.2116*** (0.0012) 0.1442*** (0.0403)
Master’s 0.3064*** (0.0088) 0.2417*** (0.0485) 0.2745*** (0.0021) 0.1455* (0.0836)
Professional/Doctorate 0.3699*** (0.0159) 0.4956*** (0.1131) 0.5982*** (0.0050) 0.1522 (0.1295)
Industry Dummies Y Y Y Y
Occupation Dummies Y Y Y Y
State Dummies Y N N N
Constant 1.8305*** (0.0335) 1.9696*** (0.1062) 1.8377*** (0.0047) 1.5615*** (0.1768)
R2 0.4396 0.4411 0.2968 0.4704
Observations 72,494 2,199 2,199 1,247
Weighted Y Y Y Y Three asterisks (***) indicate significance at the 1% level, two asterisks (**) indicates significance at the 5% level, and one asterisk (*) indicates significance at the 10% level. Source: CPS-ORG, Center for Economic and Policy Research Uniform Data Extracts, 2012-2013. The total number of observations of employed persons was 5,675 in Illinois and 186,115 nationwide. The data are adjusted by the outgoing rotation group earnings weight to match the total population 16 years of age or older.
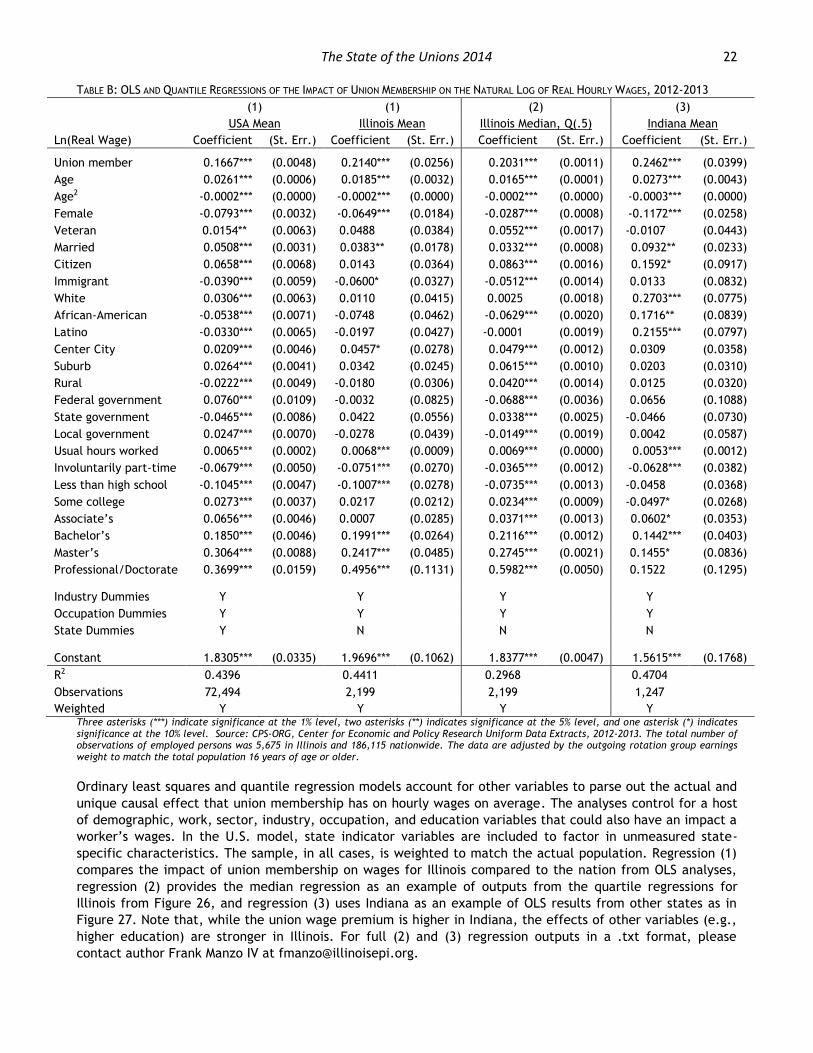
Ordinary least squares and quantile regression models account for other variables to parse out the actual and
unique causal effect that union membership has on hourly wages on average. The analyses control for a host
of demographic, work, sector, industry, occupation, and education variables that could also have an impact a
worker’s wages. In the U.S. model, state indicator variables are included to factor in unmeasured state-
specific characteristics. The sample, in all cases, is weighted to match the actual population. Regression (1)
compares the impact of union membership on wages for Illinois compared to the nation from OLS analyses,
regression (2) provides the median regression as an example of outputs from the quartile regressions for
Illinois from Figure 26, and regression (3) uses Indiana as an example of OLS results from other states as in
Figure 27. Note that, while the union wage premium is higher in Indiana, the effects of other variables (e.g.,
higher education) are stronger in Illinois. For full (2) and (3) regression outputs in a .txt format, please
contact author Frank Manzo IV at [email protected].

The State of the Unions 2014 23
The State of the Unions: Public Administration in Illinois
15.9%
Illinois Union Members by Industry
Construction
Manufacturing
Retail Trade
Finance
Professional, Science, Management
Education, Health, Social Services
Food Services
Other Services
Public Administration
Accommodation
Arts, Entertainment, Recreation
All Other Industries
1.8% 0.2%
24.2% 14.1%
29.6%
20.1%
9.8%
13.9%
22.4%
33.8%
10.5% 13.4%
1.6% 4.4%
0%
50%
100%
Union Nonunion
Workforce Education
Professional or Doctorate
Masters
Bachelors
Associates
Some College, No Degree
High School
Less than High School
65.4%
23.4%
9.5%
1.7%
Union Workforce
66.9%
22.9%
7.3% 2.9%
Nonunion Workforce
White
African-American
Latino/a
Other Races
59.2% 59.7%
40.8% 40.3%
0%
20%
40%
60%
80%
100%
Union Nonunion
Gender of Workforce
Male Female
Variable Public Administration
Employed 92.68%
In Labor Force 97.68%
Unemployment Rate 5.12%
Unionization Rate 51.71%
Variable Union Nonunion
Estimated Workers 120,000 111,000
Hourly Wage $25.23 $26.37
Union Wage Premium, $ -$1.14
Union Wage Premium, % -4.33%
Usual Hours Worked 35.9 34.5
Age 45.1 46.6
Lives in the Chicago MSA 70.2% 71.6%
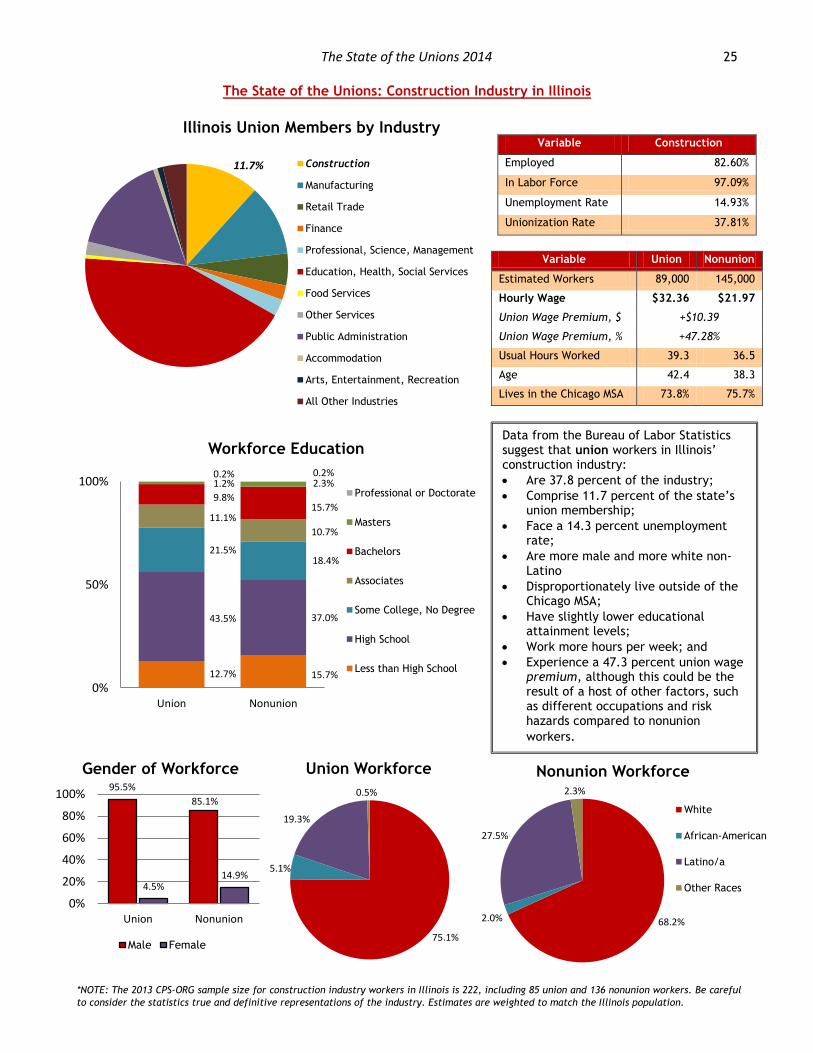
Data from the Bureau of Labor Statistics suggest that union workers in Illinois’ public administration industry:
Are 51.7 percent of the industry;
Comprise 15.9 percent of the state’s union membership;
Face a 5.1 percent unemployment rate;
Are slightly more female, more African-American, and more Latino or Latina;
Disproportionately tend to work outside of the Chicago MSA;
Generally have lower educational attainment levels;
Work more hours per week; and
Experience a 4.3 percent union wage penalty, although this finding could be the result of the lower average educational attainment or younger
average ages.
*NOTE: The 2013 CPS-ORG sample size for public administration industry workers in Illinois is 224, including 115 union and 108 nonunion workers.
Be careful to consider the statistics true and definitive representations of the industry. Estimates are weighted to match the Illinois population.
The State of the Unions 2014 24
The State of the Unions: Education, Health, & Social Services Industry in Illinois
Illinois Union Members by Industry
Construction
Manufacturing
Retail Trade
Finance
Professional, Science, Management
Education, Health, Social Services
Food Services
Other Services
Public Administration
Accommodation
Arts, Entertainment, Recreation
All Other Industries
1.6% 2.2% 14.4% 14.9%
9.9% 18.0%
9.5%
10.4% 28.5%
30.9%
32.7%
15.6%
3.5% 8.1%
0%
50%
100%
Union Nonunion
Workforce Education
Professional or Doctorate
Masters
Bachelors
Associates
Some College, No Degree
High School
Less than High School
67.4%
20.5%
9.7% 2.5%
Union Workforce
69.9%
14.9%
7.7%
7.5%
Nonunion Workforce
White
African-American
Latino/a
Other Races
22.6% 25.5%
77.4% 74.5%
0%
20%
40%
60%
80%
100%
Union Nonunion
Gender of Workforce
Male Female
Variable Educ-Health-Soc Serv
Employed 91.06%
In Labor Force 96.11%
Unemployment Rate 5.25%
Unionization Rate 25.94%
Variable Union Nonunion
Estimated Workers 325,000 907,000
Hourly Wage $26.86 $24.08
Union Wage Premium, $ +$2.78
Union Wage Premium, % +11.56%
Usual Hours Worked 37.2 31.3
Age 44.5 41.7
Lives in the Chicago MSA 74.2% 73.9%
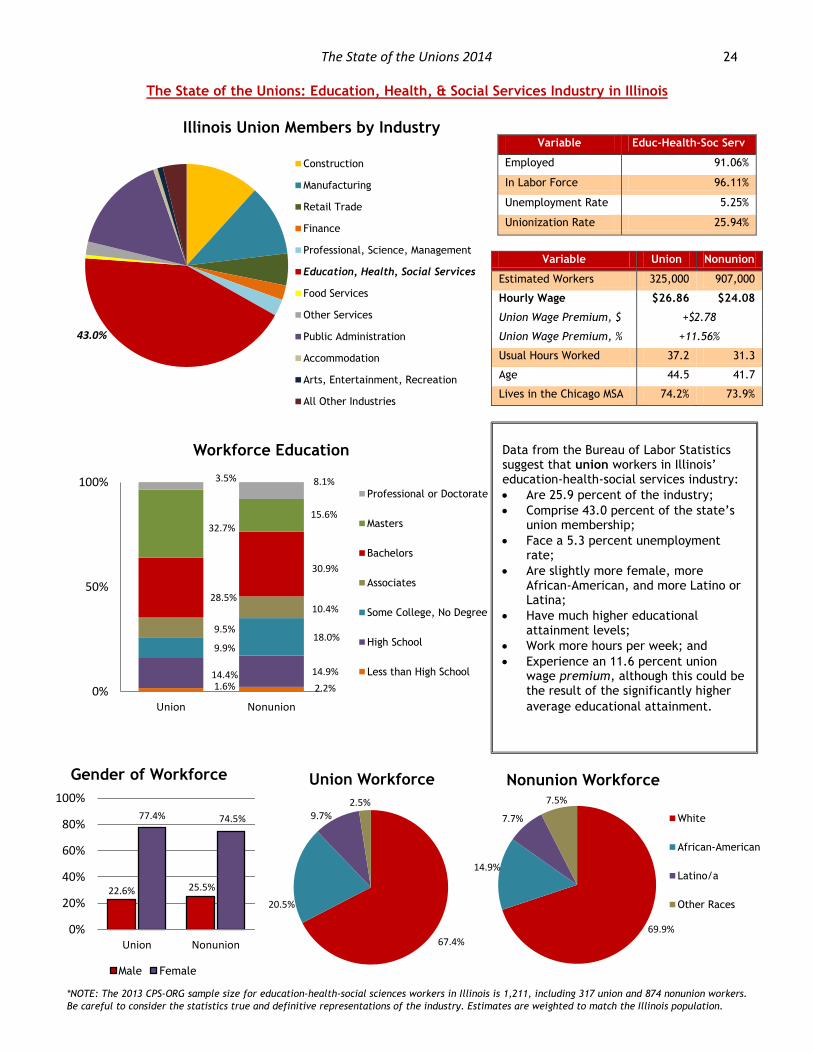
Data from the Bureau of Labor Statistics suggest that union workers in Illinois’ education-health-social services industry:
Are 25.9 percent of the industry;
Comprise 43.0 percent of the state’s union membership;
Face a 5.3 percent unemployment rate;
Are slightly more female, more African-American, and more Latino or Latina;
Have much higher educational attainment levels;
Work more hours per week; and
Experience an 11.6 percent union wage premium, although this could be the result of the significantly higher
average educational attainment.
*NOTE: The 2013 CPS-ORG sample size for education-health-social sciences workers in Illinois is 1,211, including 317 union and 874 nonunion workers.
Be careful to consider the statistics true and definitive representations of the industry. Estimates are weighted to match the Illinois population.
43.0%
The State of the Unions 2014 25
The State of the Unions: Construction Industry in Illinois
Illinois Union Members by Industry
Construction
Manufacturing
Retail Trade
Finance
Professional, Science, Management
Education, Health, Social Services
Food Services
Other Services
Public Administration
Accommodation
Arts, Entertainment, Recreation
All Other Industries
12.7% 15.7%
43.5% 37.0%
21.5% 18.4%
11.1%
10.7%
9.8% 15.7%
1.2% 2.3% 0.2% 0.2%
0%
50%
100%
Union Nonunion
Workforce Education
Professional or Doctorate
Masters
Bachelors
Associates
Some College, No Degree
High School
Less than High School
75.1%
5.1%
19.3%
0.5%
Union Workforce
68.2% 2.0%
27.5%
2.3%
Nonunion Workforce
White
African-American
Latino/a
Other Races
95.5%
85.1%
4.5% 14.9%
0%
20%
40%
60%
80%
100%
Union Nonunion
Gender of Workforce
Male Female
Variable Construction
Employed 82.60%
In Labor Force 97.09%
Unemployment Rate 14.93%
Unionization Rate 37.81%
Variable Union Nonunion
Estimated Workers 89,000 145,000
Hourly Wage $32.36 $21.97
Union Wage Premium, $ +$10.39
Union Wage Premium, % +47.28%
Usual Hours Worked 39.3 36.5
Age 42.4 38.3
Lives in the Chicago MSA 73.8% 75.7%
Data from the Bureau of Labor Statistics suggest that union workers in Illinois’ construction industry:
Are 37.8 percent of the industry;
Comprise 11.7 percent of the state’s union membership;
Face a 14.3 percent unemployment rate;
Are more male and more white non-Latino
Disproportionately live outside of the Chicago MSA;
Have slightly lower educational attainment levels;
Work more hours per week; and
Experience a 47.3 percent union wage premium, although this could be the result of a host of other factors, such as different occupations and risk hazards compared to nonunion
workers.
*NOTE: The 2013 CPS-ORG sample size for construction industry workers in Illinois is 222, including 85 union and 136 nonunion workers. Be careful
to consider the statistics true and definitive representations of the industry. Estimates are weighted to match the Illinois population.
11.7%
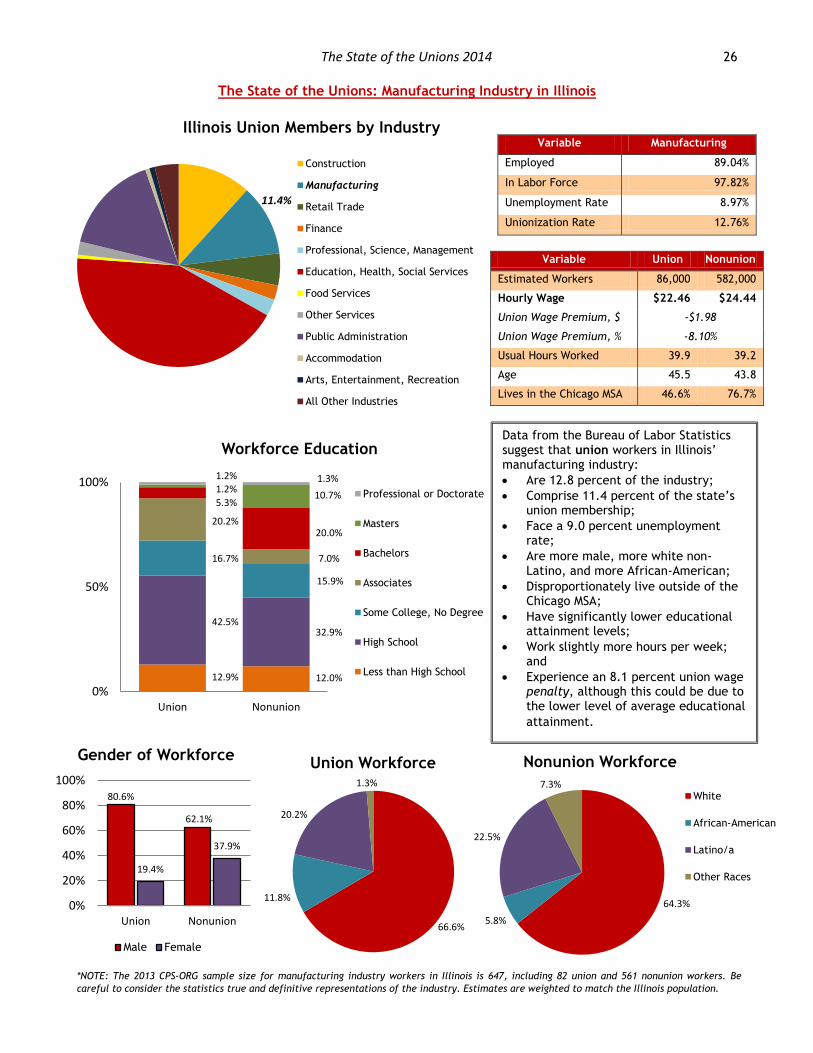
The State of the Unions 2014 26
The State of the Unions: Manufacturing Industry in Illinois
Illinois Union Members by Industry
Construction
Manufacturing
Retail Trade
Finance
Professional, Science, Management
Education, Health, Social Services
Food Services
Other Services
Public Administration
Accommodation
Arts, Entertainment, Recreation
All Other Industries
12.9% 12.0%
42.5% 32.9%
16.7%
15.9%
20.2%
7.0%
5.3%
20.0%
1.2% 10.7%
1.2% 1.3%
0%
50%
100%
Union Nonunion
Workforce Education
Professional or Doctorate
Masters
Bachelors
Associates
Some College, No Degree
High School
Less than High School
66.6%
11.8%
20.2%
1.3%
Union Workforce
64.3%
5.8%
22.5%
7.3%
Nonunion Workforce
White
African-American
Latino/a
Other Races
80.6%
62.1%
19.4%
37.9%
0%
20%
40%
60%
80%
100%
Union Nonunion
Gender of Workforce
Male Female
Variable Manufacturing
Employed 89.04%
In Labor Force 97.82%
Unemployment Rate 8.97%
Unionization Rate 12.76%
Variable Union Nonunion
Estimated Workers 86,000 582,000
Hourly Wage $22.46 $24.44
Union Wage Premium, $ -$1.98
Union Wage Premium, % -8.10%
Usual Hours Worked 39.9 39.2
Age 45.5 43.8
Lives in the Chicago MSA 46.6% 76.7%
Data from the Bureau of Labor Statistics suggest that union workers in Illinois’ manufacturing industry:
Are 12.8 percent of the industry;
Comprise 11.4 percent of the state’s union membership;
Face a 9.0 percent unemployment rate;
Are more male, more white non-Latino, and more African-American;
Disproportionately live outside of the Chicago MSA;
Have significantly lower educational attainment levels;
Work slightly more hours per week; and
Experience an 8.1 percent union wage penalty, although this could be due to the lower level of average educational
attainment.
*NOTE: The 2013 CPS-ORG sample size for manufacturing industry workers in Illinois is 647, including 82 union and 561 nonunion workers. Be
careful to consider the statistics true and definitive representations of the industry. Estimates are weighted to match the Illinois population.
11.4%
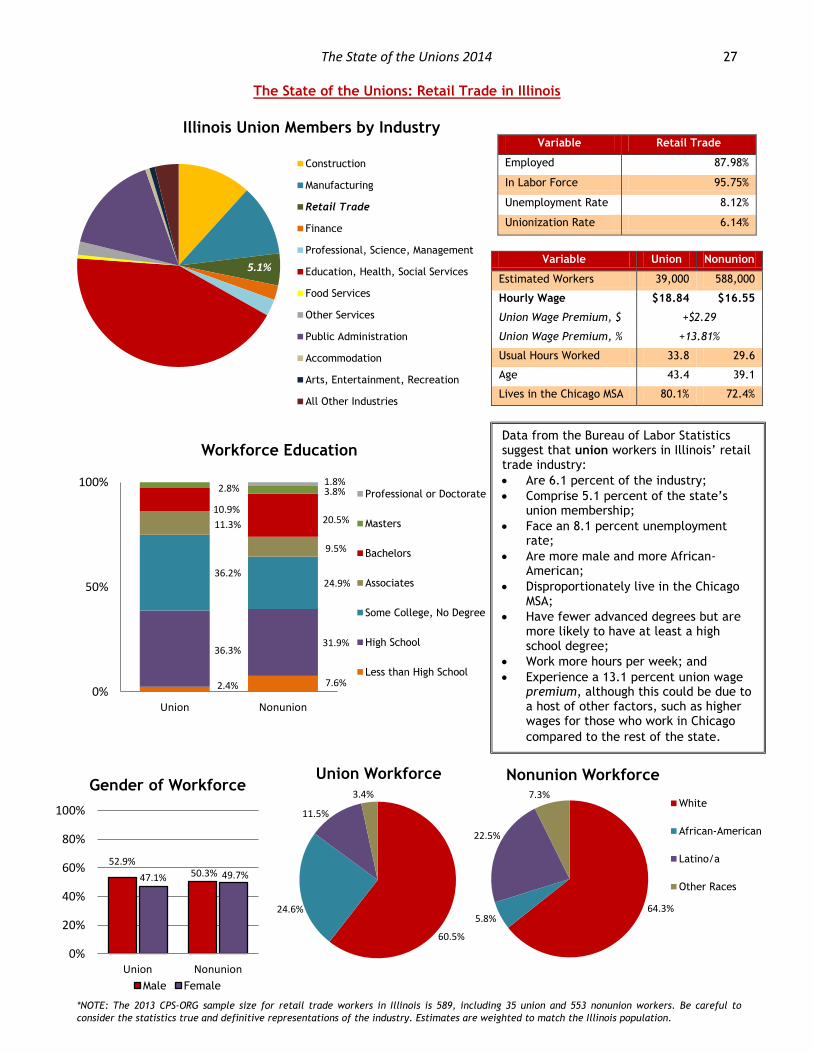
The State of the Unions 2014 27
The State of the Unions: Retail Trade in Illinois
Illinois Union Members by Industry
Construction
Manufacturing
Retail Trade
Finance
Professional, Science, Management
Education, Health, Social Services
Food Services
Other Services
Public Administration
Accommodation
Arts, Entertainment, Recreation
All Other Industries
2.4% 7.6%
36.3% 31.9%
36.2% 24.9%
11.3%
9.5%
10.9% 20.5%
2.8% 3.8% 1.8%
0%
50%
100%
Union Nonunion
Workforce Education
Professional or Doctorate
Masters
Bachelors
Associates
Some College, No Degree
High School
Less than High School
60.5%
24.6%
11.5%
3.4%
Union Workforce
64.3% 5.8%
22.5%
7.3%
Nonunion Workforce
White
African-American
Latino/a
Other Races
52.9% 50.3% 47.1% 49.7%
0%
20%
40%
60%
80%
100%
Union Nonunion
Gender of Workforce
Male Female
Variable Retail Trade
Employed 87.98%
In Labor Force 95.75%
Unemployment Rate 8.12%
Unionization Rate 6.14%
Variable Union Nonunion
Estimated Workers 39,000 588,000
Hourly Wage $18.84 $16.55
Union Wage Premium, $ +$2.29
Union Wage Premium, % +13.81%
Usual Hours Worked 33.8 29.6
Age 43.4 39.1
Lives in the Chicago MSA 80.1% 72.4%
Data from the Bureau of Labor Statistics suggest that union workers in Illinois’ retail trade industry:
Are 6.1 percent of the industry;
Comprise 5.1 percent of the state’s union membership;
Face an 8.1 percent unemployment rate;
Are more male and more African-American;
Disproportionately live in the Chicago MSA;
Have fewer advanced degrees but are more likely to have at least a high school degree;
Work more hours per week; and
Experience a 13.1 percent union wage premium, although this could be due to a host of other factors, such as higher wages for those who work in Chicago
compared to the rest of the state.
*NOTE: The 2013 CPS-ORG sample size for retail trade workers in Illinois is 589, including 35 union and 553 nonunion workers. Be careful to
consider the statistics true and definitive representations of the industry. Estimates are weighted to match the Illinois population.
5.1%

The State of the Unions 2014 28