the state of ohio’s ninth graders will they be in this picture? ninth grade make-it or break-it...
TRANSCRIPT

The State of Ohio’s Ninth GradersWill they be in this picture?
Ninth Grade Make-It or Break-It Year RetreatMarch 31, 2006
Presented by Kathy Shibley, Ph.D.Director, Office of Career-Technical and Adult Education
Ohio Department of Education

Charge: Help Ohio’s education policy leaders rethink the rules, roles and relationships that define high school by focusing on:
– Personalized education– Middle to high school transition– High School to college transition– Aligning Ohio’s P-16 system

Source: Ohio Department of Education, State Board of Education’s Task Force on Quality High Schools for a Lifetime of Opportunities (Estimated using 2003-2004 data)
Too many students leave school before they graduate.

“It’s not just about graduation. It’s about preparation.”
Governor Bob Taft, State of the State,
January 25, 2006
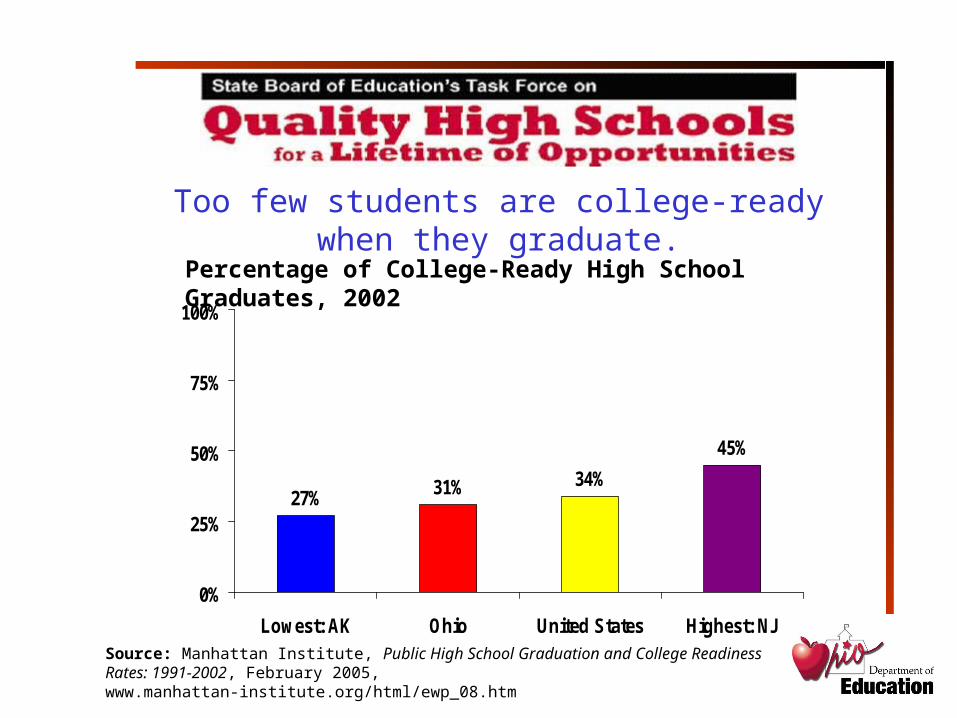
Source: Manhattan Institute, Public High School Graduation and College Readiness Rates: 1991-2002, February 2005, www.manhattan-institute.org/html/ewp_08.htm
27% 31% 34%
45%
0%
25%
50%
75%
100%
Lowest: AK Ohio United States Highest: NJ
Percentage of College-Ready High School Graduates, 2002
Too few students are college-ready when they graduate.

The Task Force’s Goal:
Improve and sustain the academic achievement of all Ohio high school students, ensuring that they acquire the knowledge and skills they will need to succeed in postsecondary education, careers and citizenship.

Education Continuum
Pre-KElementary
GradesMiddle Grades
High School
Higher Education
and Workforce

Pre-KElementary
GradesMiddle Grades
High School
Higher Education
and Workforce
Five Pressure Points
Middle School
Transitions
Grades 9-10Ohio Graduation TestsGrades 11-12
Post- secondary Transitions

Problem:
Not enough students leave middle school prepared for high school
Pressure Point #1:Middle school transitions

Students Unprepared for High School
7th Grade Math58.5%
8th Grade Reading
78.9% 8th Grade Math60.1%
0
75
All Students
Per
cent
Pro
ficie
nt
State Standard
Source: Ohio Department of Education, Local Report Card data, 2004-2005
Percentage of Students Proficient or Above on Middle School Tests, 2004-2005
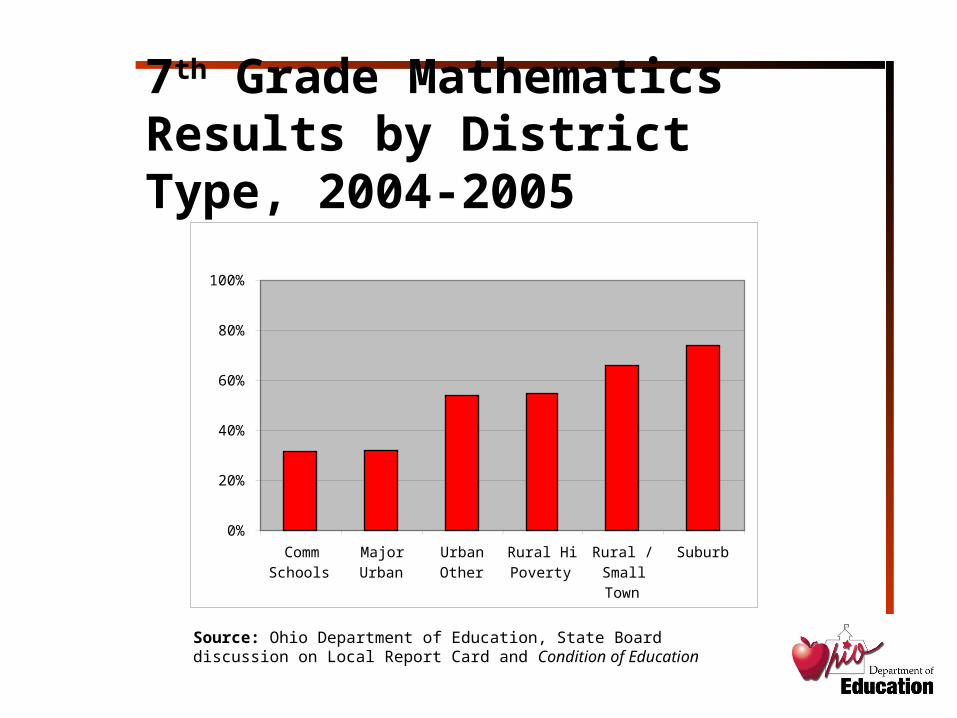
7th Grade Mathematics Results by District Type, 2004-2005
Source: Ohio Department of Education, State Board discussion on Local Report Card and Condition of Education
0%
20%
40%
60%
80%
100%
CommSchools
MajorUrban
UrbanOther
Rural HiPoverty
Rural /SmallTown
Suburb
0%
20%
40%
60%
80%
100%
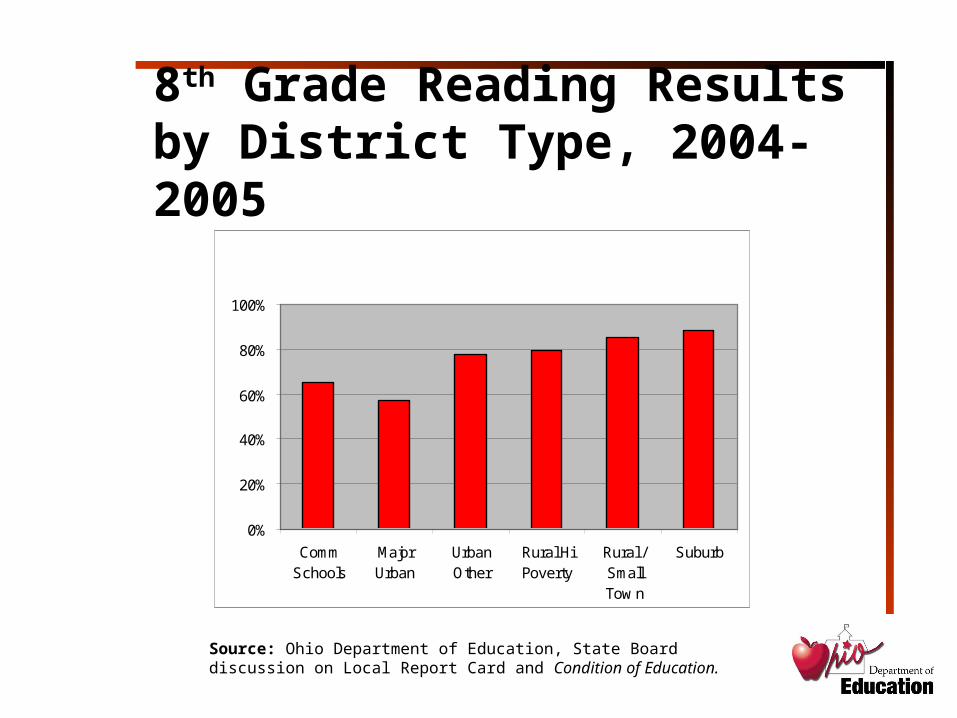
CommSchools
MajorUrban
UrbanOther
Rural HiPoverty
Rural /SmallTow n
Suburb
Source: Ohio Department of Education, State Board discussion on Local Report Card and Condition of Education.
8th Grade Reading Results by District Type, 2004-2005

Middle School Transitions
Goal:
Encourage more rigor, relevance and relationship building
Problem:Not enough students engaged and progressing through system
Pressure Point #2:Grades 9-10

9th Grade “Bubble”
0%
2%
4%
6%
8%
10%
12%
Grade
Pe
rce
nt
of
Sta
te E
nro
llm
en
t
State Enrollment (June head count) by Grade, 2004-2005
Source: Ohio Department of Education

0
2,000
4,000
6,000
8,000
10,000
12,000
KG 01 02 03 04 05 06 07 08 09 10 11 12
Grade
Nu
mb
er
of
Stu
den
ts
Source: Ohio Department of Education
Number of Students Retained by Grade Level, 2004-2005

Retention in Grades 9-12
2004-2005 School Year
Ohio high school students retained 20,446
Approximate cost per student $9,000
$184 million

Grades 9-10
Goal:
Facilitate Timely Student Success and Progress

Problem:
Not enough students meet OGT standards in a timely fashion
Pressure Point #3:Ohio Graduation Tests

Ohio Graduation Tests
Source: Ohio Department of Education, Local Report Card data, 2004-2005

Ohio Graduation TestsGoal:
Focus on Timely Successful Completion of the OGT

Problem:
Not enough students participate in rigorous curriculum
Pressure Point #4:Grades 11-12

ACT Composite Scores
Source: ACT: Crisis at the Core, 2005
16.3
21.520.1
18.3 18.717.8
23.6 22.721.3 21.2
0.0
6.0
12.0
18.0
24.0
30.0
36.0
AfricanAmerican
AsianAmerican
Caucasian HispanicAmerican
NativeAmerican
Average ACT
Composite Score
Non-Core Core
Ohio ACT Composite Scores for 2004 High School Graduates by Core Status and
Race/Ethnicity

Advanced Placement
Source: College Board
2000 - 2005 % GrowthStudents Taking AP Exams
43.80% 45.30%
0.00%
50.00%
100.00%
Ohio Nation
Ohio
Nation

Advanced Placement
Source: College Board
2005 Students Passing AP Exams
0.00%10.00%20.00%30.00%40.00%50.00%
Ohio Nation

High School Graduates Unprepared
Source: The Performance Report for Ohio’s Colleges and Universities, 2005, Ohio Board of Regents, www.regents.state.oh.us/perfrpt/2005HSindex.html
23%33%
41%
0%
20%
40%
60%
80%
100%
Remedial Math orEnglish
Remedial Math Remedial English
Too many college freshmen need remedial coursework

78%75%
75%74%
18%25%
10%10%
Extremely/very well prepared for typical job in my companyExtremely/very well prepared for advancement in my company
Few Employers Feel High School Graduates Are Prepared
Applicants with no high school degree
Recent public high school grads who have no further education/training
Recent grads of two-year college or training program
Recent graduates of four-year colleges
Source: Peter D. Hart Research Associates/Opinion Strategies, Rising to the Challenge: Are High School Graduates Prepared for College and Work? Prepared for Achieve, Inc., 2005
High School Graduates Unprepared

Grades 11-12
Goal:
Rigorous Preparation

Problem:
Not enough students graduate from high school prepared for postsecondary education and work
Pressure Point #5:Postsecondary Transitions

% of Adults with High School Diploma or More
0.0
10.0
20.0
30.0
40.0
50.0
60.0
70.0
80.0
90.0
100.0
Adults 25+ Adults 25 - 34
OH
US
Ohio Above National Average in High School Graduates
Source: U.S. Census data, 2004

Ohio Below National Average in College Graduates
% of Adults with Bachelor's Degree or More
0.0
5.0
10.0
15.0
20.0
25.0
30.0
35.0
Adults 25+ Adults 25 - 34
OH
US
Source: U.S. Census data, 2004

How Does Ohio Stack Up?
Source: National Center for Public Policy & Higher Education, Policy Alert, April 2004. Data are estimates of pipeline progress rather than actual cohort
68%
40%
27%18%
70%
40%
29%19%
0%
25%
50%
75%
100%
Graduate highschool
Start college Persist 2ndyear
Earn degree
Perc
enta
ge o
f 9t
h G
rade
Stu
dent
s
OhioU.S.

Median Earnings for Adults 25+
$0
$10,000
$20,000
$30,000
$40,000
$50,000
$60,000
Less thanhigh schoolgraduate
HS Grad Some collegeor
associate'sdegree
Bachelor'sdegree
Graduate orprofessional
degree
College Graduates Earn More than High School Graduates
Source: U.S. Census data, 2004

0%
5%
10%
15%
20%
25%
Less thanhigh school
graduate
HS Grad Somecollege or
associate'sdegree
Bachelor'sdegree
Graduate orprofessional
degree
Poverty Rate For Adults 25+
Source: U.S. Census data, 2004

Postsecondary Transitions
Goal:
Seamless Transition

Class of 2009
Where have all the ninth graders gone?