the south african wine industry - pwc · pdf file2 the south african wine industry insights...
TRANSCRIPT

The South African wine industryInsights survey 2013
Key trends, challenges and future prospects/10th editionLook out for: CEO insights and views p4/Financial overview of producer cellars p12/Human resource management p24/Wine supply chain p38
www.pwc.co.za/wine-insights-survey

Photo on cover: © Greatstock
PwC has exercised reasonable professional care and diligence in the collection, processing and reporting of this information. However, the data used is from third-party sources and PwC has not independently verified, validated or audited the data. PwC makes no representations or warranties with respect to the accuracy of the information, nor whether it is suitable for the purposes to which users put it.
PwC shall not be liable to any user of this report or to any other person or entity for any inaccuracy of this information or any errors or omissions in its content, regardless of the cause of such inaccuracy, error or omission. Furthermore, in no event shall PwC be liable for consequential, incidental or punitive damages to any person or entity for any matter relating to this information.
PwC will not disclose the name of any respondent without their prior approval and under no circumstances will PwC disclose individual entity data.

ForewordWelcome to PwC’s 2013 South African wine industry insights survey. The survey explores some of the issues facing local wine businesses, specifically those evident from the financial results of the 2012 harvest, human resource management practices in the industry and wine supply chain. It also includes the views of a number of chief executives on the opportunities in and challenges facing the industry.
This year’s publication is presented with a focus on the following four areas:
• Views from chief executives;• Financial overview of producer cellars – 2012 harvest;• Human resource management; and• Wine supply chain.
Views from chief executivesWe posed a variety of questions to chief executives of wine businesses. Their views are summarised under the following sections:
• General industry outlook;• Opportunities and challenges; and• Short- and medium-term forecast.
The questions were designed to gauge executives’ assessment of the short- to medium-term prospects for both the local and global wine industry.
Financial overview of producer cellars – 2012 harvestOur financial benchmarking survey has covered ten harvests since 2003. The results of the 2012 wine-grape harvest are presented with those of the four preceding harvesting years as comparative figures.
The findings are presented on a national average basis. The focus remains on the key performance indicators in the following areas:
• Production;• Profitability; and• Balance sheet structuring.
The high rate of annual participation of cellars in this section of the survey makes the results both highly representative and applicable.
Human resource managementThis survey again includes a high-level overview of human resource practices in the industry. The high participation level provided us with detailed information, assisting us to identify general and specific trends and to provide comprehensive feedback on the key human resources challenges facing the wine industry.
The results of this year’s human resource management section of our survey are presented under the following headings:
• The human resource department;• Staff turnover;• Human resource practices; and• General insights.

Wine supply chainResearch teams from Stellenbosch University and the CSIR worked together in gaining insight into the wine industry’s supply chain activities. In 2010 a first survey across some of the wine supply chain activities was conducted (inbound and outbound). With the aid of seven postgraduate students, a follow-up survey was conducted in 2012 in the form of an exploratory assessment. The aim was to gain a better understanding of the nature, context and complexity of wine supply chains in South Africa and of the current state of supply chain performance measurement.
GeneralWine businesses are indeed anxious when looking to the future. On both the local and global front, it is becoming increasingly difficult to gauge consumer trends, predict weather patterns and budget for rising costs. This makes it extremely difficult to get the balance right between supply and demand before the decision is made on the nature and levels of capital investment.
Never before has the local wine industry had to contemplate so many aspects in determining its direction and growth strategies. Volatile exchange rates, increasing input costs, as well the recent labour-related difficulties experienced in the Western Cape are only some of the daily challenges faced.
A number of regulatory changes will impact cellars over the next financial year, with the introduction of the Tax Administration Act and Government proposals to place a ban on advertising in the liquor industry. It also remains to be seen if the fast-approaching 2014 local and national elections will have an impact on Government policy and regulation in agriculture, and in particular, the wine industry.
A significant number of our clients are involved in the wine industry. Our own involvement in and appreciation of this segment of our economy has, over the years, resulted in the development of experienced and knowledgeable professionals who understand the specific challenges the industry faces. Our aim remains to make a meaningful contribution to the industry with projects like this insights survey, and to work alongside industry leaders to provide advice and seek solutions on business opportunities, risk, growth, compliance and general challenges facing the industry.
A word of thanks to the wine businesses that participated in the survey, as well as the representatives of the various organisations and institutions in the industry for their time, dedication and support, which made this report possible.
If you would like clarification on any matters covered in this publication, please contact one of our team members listed on page 48.
We trust you will find this report insightful and valuable and look forward to receiving any feedback you might have.
Frans WeilbachDirector and Specialist Partner: Wine IndustryPwCStellenboschSeptember 2013

Table of contents
1. Executive summary 1
2. Views from chief executives 4
2.1 Introduction 4
2.2 General industry outlook 4
2.3 Opportunities and challenges 6
2.4 Short and medium-term forecast 9
2.5 Summary 11
3. Financial overview of producer cellars – 2012 harvest 12
3.1 Introduction 12
3.2 Results/Findings 13
3.2.1 Production 13
3.2.2 Profitability 17
3.2.3 Structuring 22
3.3 Summary 23
4. Human resource management 24
4.1 Introduction 24
4.2 The human resource department 25
4.3 Staff turnover 27
4.4 Human resource practices 29
4.5 General insights 36
4.6 Summary 37
5. Wine supply chain 38
5.1 Introduction 38
5.2 Key findings from contextual survey 40
5.3 Key findings from supply chain performance survey 44
5.4 Summary 47
6. Contacts 48

6 The South African wine industry insights survey September 2013

PwC 1
1. Executive summary
Main findingsViews from chief executivesThe relative weakness of the rand certainly offers growth opportunities for wine exporters. However, the volatility of the value of the rand is proving to be a challenge for chief executives planning to expand their market share abroad. Most chief executives regard growth in existing markets as the main opportunity for overall growth over the next 12 months. New international markets, with North America and Asia at the forefront, also remain a key focus area.
Construction of the 4,800MW Medupi coal-fired power station in Lephalale, Limpopo, has been delayed for several months following labour unrest and wage negotiations. This will undoubtedly keep the national grid under pressure, and may result in further increases in electricity prices from the National Energy Regulator. Chief executives have indicated their concern in this regard.
A positive finding is that almost 90% of chief executives expected the price of wine to either increase or stabilise over the medium term. However, more wine businesses are concerned about rising labour costs compared to previous surveys.
Financial overview of producer cellars – 2012 harvestAn increase in national crop size and higher yield per ton harvested have kept cellar costs per ton under control and have resulted in higher net revenues per ton. Both red and white cultivars have once again recorded net revenues per ton higher than VinPro’s estimated average production cost per hectare.
During February 2013, Labour Minister Mildred Oliphant announced a new minimum wage of R105 per day that took effect on 1 March 2013. The results
BackgroundThis survey focuses on key performance indicators and issues affecting role players in the South African wine industry. The information was obtained from questionnaires completed by designated individuals within the organisations as well as financial information provided by them, usually in the form of annual financial statements.
The following summary is based on data received from the various wine businesses and is presented separately for each of the four sections. The data was processed and analysed by PwC with input from the Department of Logistics at Stellenbosch University on Section 5: Wine supply chain.
Photo: © Great Stock
Photo: © Greatstock

2 The South African wine industry insights survey September 2013
presented for the 2012 harvest, therefore do not necessarily include any potential effect of this increase.
The downward trend in the average product price of producer cellars in real terms continued. The change in the composition of products sold, with drinkwine losing ground in favour of rebate wine, distilling wine and juice at lower prices, could be a contributing factor to the pressure on the average price. The strong correlation between cellars obtaining higher prices for both red and white cultivars has again been evident in the current year.
Human resource managementEncouragingly, more cellars are exploring the implementation of a dedicated HR function, which could see the focus change from transactional activities, to a strategic HR focus and succession planning.
The transfer of skills and business continuity through succession planning will become more important for cellars. Cellars have identified the development of such a plan as a priority area.
Training and skills development remains key focus areas for cellars and 93% of participants have indicated that they have properly implemented a skills development programmes.
Staff retention in any business is critical. Fifty percent of respondents have indicated that the main reasons for leaving are for better remuneration and career opportunities. Proper benchmarking of remuneration and career discussions could help alleviate this problem.
Wine supply chainResearch has indicated that proper supply chain management poses a significant opportunity. It could be extremely beneficial for wine businesses to develop this area to a strategic advantage over competitors.
Currently, there are no industry best practices or performance indicators against which cellars can measure themselves. Cellars willing to invest in a proper supply chain framework and strategy, will be at the forefront of new and innovative methods of doing business in the wine industry.

PwC 3 PwC 3

4 The South African wine industry insights survey September 2013
Photo: © Greatstock
2. Views from chief executives
2.2 General industry outlook When do you expect to see significant improvement in the global economic environment? The majority of executives do not foresee any significant improvement in the global economic environment before 2017, with almost 80% expecting improvement from 2016 at the earliest.
2.1 IntroductionWe asked executives of various wine companies and industry bodies to share their opinions on the current state of the global and South African wine industry, the key opportunities and the biggest risks to the recovery of the global wine industry.
This is the second year we have included this section in our publication and the participants’ responses to and views on a variety of questions are provided.
27%
51%
11%
11%
Already happening
Within the next year
Within the next 2 years
Within the next 3 years or more
2013

PwC 5
Do you believe the global wine market will improve, stay the same, or decline over the next 12 months?Although more respondents expect the global wine market to improve over the next 12 months, the vast majority do not foresee any significant change. Twenty-three percent of executives indicated that there may be some improvements over the next 12 months, while 11% are expecting a further decline.
Do you believe the South African wine market will improve, stay the same, or decline over the next 12 months?It is encouraging to note that 43% of executives expect the local wine industry to improve over the next 12 months. However, 19% expect a decline.
23%
43%
38%
19%
66%
11%
Improve
Stay the same
Decline
Improve
Stay the same
Decline
2013
2013

6 The South African wine industry insights survey September 2013
How confident are you about your business’ prospects for revenue growth over the next 12 to 36 months?Respondents’ confidence in growing their organisations’ revenues has increased from 81% being very or at least somewhat confident, to almost all executives expecting revenue growth over the next 12 months.
2.3 Opportunities and challenges
Which expenditure are you most concerned about over the next 12 to 36 months?Given recent labour-related issues experienced in the agri-sector, as well as persistent increases in energy costs, it is not surprising to see labour and electricity as the expenses that executives are most concerned about over the next 12 to 36 months.
Labour
Marketing and sales
Bottling and packaging
Chemicals, cleaning and filtration
Electricity and water
Finance charges
Repairs and maintenance
Extremely Somewhat Not very Not at all
Very confident
Somewhat confident
Not confident at all
37%
61%
2%
2013
PwC 7
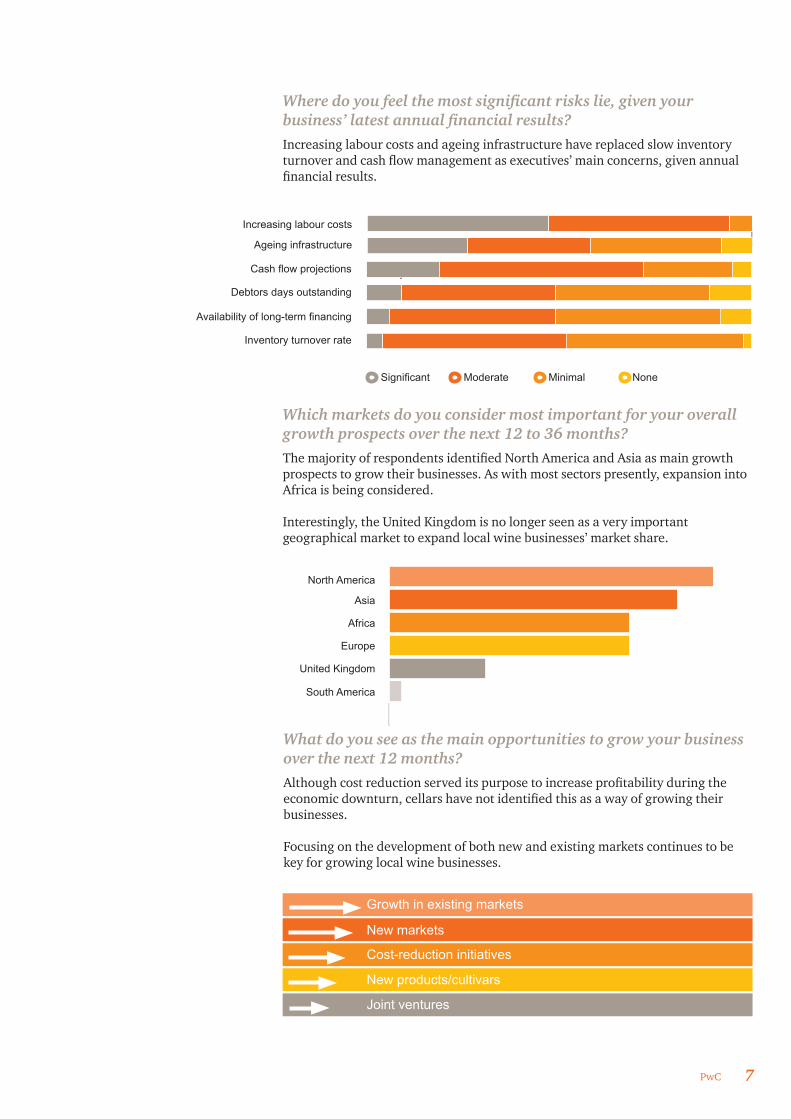
Where do you feel the most significant risks lie, given your business’ latest annual financial results?Increasing labour costs and ageing infrastructure have replaced slow inventory turnover and cash flow management as executives’ main concerns, given annual financial results.
What do you see as the main opportunities to grow your business over the next 12 months?Although cost reduction served its purpose to increase profitability during the economic downturn, cellars have not identified this as a way of growing their businesses.
Focusing on the development of both new and existing markets continues to be key for growing local wine businesses.
New markets
Growth in existing markets
New products/cultivars
Joint ventures
Cost-reduction initiatives
North America
Asia
Africa
South America
Europe
United Kingdom
Which markets do you consider most important for your overall growth prospects over the next 12 to 36 months?The majority of respondents identified North America and Asia as main growth prospects to grow their businesses. As with most sectors presently, expansion into Africa is being considered.
Interestingly, the United Kingdom is no longer seen as a very important geographical market to expand local wine businesses’ market share.
Increasing labour costs
Ageing infrastructure
Inventory turnover rate
Availability of long-term financing
Debtors days outstanding
Cash flow projections
Significant Moderate Minimal None

8 The South African wine industry insights survey September 2013
Which factors are most likely to influence your decisions regarding strategy?
For the most part respondents have indicated that the current economic environment and its impact on global supply and demand are having a significant influence on strategies. Executives are sensitive to the volatility in exchange rates when determining their organisations’ strategies for the successful development of foreign markets.
What are your main concerns?
Almost all respondents have indicated that they are concerned about mounting energy costs, which are set to continue, as well as current labour-related challenges. Increasing regulations and taxes remain important factors over which wine businesses have very limited control.
Changes in local regulations and taxes
Labour legislation
Stagnating global demand
Increased global supply
Shareholders’ expectations
Volatile exchange rates
Global climate change
Capital gearing ratios
Availability of grapes
Availability of capital
New market entrants (global supply)
Labour cost
Changes in consumer-patterns
Availability of key skills
Ageing infrastructure
Volatility in exchange rates
Increase in regulations and taxes
Ageing vineyards
Energy cost
Labour unrest
Extremely Somewhat Not very Not at all

PwC 9
To what extent are you satisfied with the government’s current role in the following areas?
Wine businesses are still looking to the government to play a more supportive role in the wine industry. Executives again indicated that they would like government to consider alternative methods to charge and collect excise duty, as well as easing the tax and regulatory burden on wine businesses.
2.4 Short- and medium-term forecastWhat is your expectation for red and white grape production over the next three to five years?Respondents are expecting white wine production to increase, with red wine production relatively unchanged.
Red cultivars
Increase
Stable
Decrease
White cultivars
30%
60%
9%
32%
55%
15%
Reducing the regulatory burden on wine businesses
Taking sufficient steps to improve infrastructure
Helping wine businesses to access natural resources
Effectively protects the ecosystem and biodiversity
Assistance with developing unskilled workers
Tax breaks
Alternative methods for the recovery of excise duty
Assisting wine businesses with BEE implementation
Extremely satisfied
Somewhat satisfied
Not very satisfied
Not at all satisfied
2013

10 The South African wine industry insights survey September 2013
What do you expect from yield in litres per ton over the next 12 to 36 months?Almost 50% of respondents are expecting increasing litres per ton for white cultivars.
For red cultivars, respondents are, for the most part, expecting yields in litres per ton to remain unchanged.
How do you expect the price of wine to change over the next 12 months?A positive finding is that almost all respondents expect wine prices to improve, or at least remain at current levels in the immediate future.
Increase
Stable
Decrease
Red cultivars White cultivars
30%
49%49%
68%
2% 2%
2013
Increase
Stable
Decrease
Red cultivars White cultivars
4%
38%
57%
4%
53%43%
2013

PwC 11
How do you expect the price of wine to change over the next 12 to 36 months?The expectation for wine prices in the next two to three years is encouraging, with a large portion of respondents foreseeing increases in average prices. Executives are, however, less optimistic about growth in red wine prices, with only 38% expecting increases.
What level of infrastructure investment do you anticipate over the next 12 to 36 months?In line with executives’ views 12 months ago, only moderate infrastructure investment is anticipated over the next 12 to 36 months.
2.5 SummaryThe general outlook from chief executives has not changed significantly during the last 12 months. Volatile exchange rates and increased global supply remain obstacles in developing profitable foreign markets, still being wine businesses’ main focus in terms of growing their businesses.
While respondents are marginally more optimistic about the recovery of the global economic environment and wine prices, they remain concerned about many local challenges that may impact their organisations’ profitability. Executives continue to look to Government to assist the industry on a number of issues, from the consideration of tax breaks and alternative methods for the recovery of excise duty, to strong leadership on sensitive matters such as wage negotiations and affordable natural resources.
Significant
Moderate
Minimal
Not at all
2%
24%
46%
28%
2013
Increase
Stable
Decrease
Red cultivars White cultivars
38%
11%
51%
13%
55%32%
2013

12 The South African wine industry insights survey September 2013
3. Financial overview of producer cellars – 2012 harvest
The global economy, and in particular the South African economy is showing signs of recovery from the global downturn in 2008. While the rand has lost significant ground to other major currencies in recent times, the JSE All Share Index has reached record heights.
A number of external factors, both good and bad, have played a significant role in the results of participating cellars.
On the positive side for exporters, the continuous weaker level of the rand has assisted in price negotiations and has assisted in the retention, and hopefully expansion, of market share.
Weather conditions have been favourable, and a continued focus on Africa and BRICS countries provides exciting opportunities for those willing to make the investment.
Labour unrest, wage negotiations and soaring input costs, amongst others, have put a dampener on otherwise positive results.
In light of these events, the following results add some perspective and aim to provide users with information to evaluate their performance relative to others.
3.1 IntroductionThe 2012 section of the financial overview of producer cellars saw a significant portion of South African producer cellars taking part, making the results both representative and applicable. The findings have once again made for interesting reading.

PwC 13
3.2 Results/Findings3.2.1 Production
Average tons pressed per cultivar
Cultivar2008 harvest 2009 harvest 2010 harvest 2011 harvest 2012 harvest
Tons % Tons % Tons % Tons % Tons %
Total red 5,562.41 34.0 4,931.15 33.1 4,272.25 32.8 5,034.17 32.5 5,463.73 30.5
Cabernet Sauvignon 1,271.23 7.8 1,056.49 7.1 931.54 7.2 1,073.10 6.9 1,157.59 6.5 Cinsaut 532.56 3.3 504.45 3.4 467.14 3.6 532.16 3.4 542.37 3.0 Merlot 711.35 4.3 678.86 4.6 563.74 4.3 687.28 4.4 727.89 4.1 Pinotage 941.98 5.8 788.38 5.3 656.60 5.0 821.26 5.3 915.59 5.1 Ruby Cabernet 616.51 3.8 484.71 3.3 467.42 3.6 569.29 3.7 586.61 3.3 Shiraz 1,114.56 6.8 1,059.85 7.1 951.22 7.3 1,030.75 6.7 1,145.27 6.4 Port varieties 16.16 0.1 20.38 0.1 21.29 0.2 21.85 0.1 15.10 0.1 Dry red 134.48 0.8 101.42 0.7 47.06 0.4 85.76 0.6 67.54 0.4 Other red 223.57 1.4 236.61 1.6 166.25 1.3 212.73 1.4 305.76 1.7
Total white 10,797.29 66.0 9,948.57 66.9 8,734.06 67.2 10,451.54 67.5 12,463.15 69.5
Chardonnay 1,108.86 6.8 1,112.40 7.5 1,015.27 7.8 1,131.77 7.3 1,252.84 7.0 Chenin Blanc 3,725.70 22.8 3,599.46 24.2 3,371.50 25.9 3,808.58 24.6 4,461.62 24.9 Colombar 2,975.36 18.2 2,574.96 17.3 2,237.84 17.2 2,899.55 18.7 3,605.18 20.1 Hanepoot 521.24 3.2 379.03 2.5 289.75 2.2 408.25 2.6 497.76 2.8 Riesling (Cape) 146.16 0.9 143.50 1.0 125.83 1.0 112.60 0.7 124.57 0.7 Sauvignon Blanc 816.95 5.0 814.72 5.5 891.54 6.9 1,062.64 6.9 1,224.60 6.8 Port varieties 4.50 - 7.46 0.1 29.35 0.2 9.97 0.1 8.89 0.0 Dry white 400.71 2.4 247.21 1.7 152.96 1.2 278.81 1.8 353.42 2.0 Other white 1,097.81 6.7 1,069.84 7.2 620.02 4.8 739.37 4.8 934.27 5.2
Total 16,359.70 100.0 14,879.72 100.0 13,006.31 100.0 15,485.71 100.0 17,926.88 100.0
20080%
20%
40%
60%
80%
100%
2009 2010 2011 2012
Red White
Red/White compositionThe national crop size has shown steady increases over the last number of years, and the 2012 harvest is no exception. This increase reflects in the results recorded by participating cellars.
Not surprisingly, white cultivars remain at the forefront of grape production, edging on 70% of the total wine crop, with especially Chenin Blanc and Colombar maintaining a significant share of the total harvest.

14 The South African wine industry insights survey September 2013
3.2 Results/Findings3.2.1 Production (continued)
Average producing hectares per cultivar
Cultivar2008 harvest 2009 harvest 2010 harvest 2011 harvest 2012 harvest
Ha % Ha % Ha % Ha % Ha %
Total red 473.55 40.0 443.68 41.5 421.34 40.5 442.93 39.7 473.21 40.9 Cabernet Sauvignon 137.90 11.7 124.85 11.7 115.45 11.1 118.93 10.6 122.84 10.6 Cinsaut 38.36 3.2 37.14 3.5 34.90 3.4 36.92 3.3 34.17 3.0 Merlot 60.09 5.1 55.10 5.2 56.88 5.5 58.72 5.3 58.74 5.1 Pinotage 75.83 6.4 68.45 6.4 63.73 6.1 71.31 6.4 78.45 6.8 Ruby Cabernet 35.73 3.0 33.17 3.1 35.28 3.4 35.39 3.2 34.13 3.0 Shiraz 93.64 7.9 93.30 8.7 89.56 8.6 92.43 8.3 102.07 8.8 Port varieties 1.96 0.2 2.23 0.2 3.15 0.3 3.01 0.3 1.76 0.2 Dry red 9.48 0.8 8.04 0.8 4.05 0.4 5.75 0.5 4.53 0.4 Other red 20.56 1.7 21.39 2.0 18.35 1.8 20.46 1.8 36.52 3.2
Total white 709.41 60.0 625.87 58.5 617.90 59.5 674.16 60.3 683.58 59.1 Chardonnay 104.00 8.8 94.54 8.8 98.61 9.5 100.79 9.0 98.85 8.5 Chenin Blanc 272.99 23.1 240.42 22.5 240.78 23.2 263.19 23.6 257.91 22.3 Colombar 143.26 12.1 112.61 10.5 122.04 11.7 136.17 12.2 140.51 12.1 Hanepoot 26.79 2.3 19.67 1.8 20.28 2.0 23.54 2.1 23.57 2.0 Riesling (Cape) 14.71 1.2 11.92 1.1 11.27 1.1 9.71 0.9 8.38 0.7 Sauvignon Blanc 73.33 6.2 71.87 6.7 73.37 7.1 80.43 7.2 82.34 7.1 Port varieties 0.36 - 0.56 0.1 2.44 0.2 0.85 0.1 0.62 0.1 Dry white 19.11 1.6 15.08 1.4 12.06 1.2 16.82 1.5 28.05 2.4 Other white 54.86 4.6 59.21 5.5 37.04 3.6 42.66 3.8 43.36 3.7
Total 1,182.96 100.0 1,069.55 100.0 1,039.25 100.0 1,117.09 100.0 1,156.79 100.0
20
0
40
60
80
100
120
140
160
2008 2009 2010 2011 2012
Red White Total
Average non-producing hectares per cellar
Average non-producing hectares have continued to decline in 2012, indicating the maximum utilisation of resources available to cellars. While Colombar accounts for only 12.1% of the total producing hectares, the average tons pressed for this cultivar account for 20.1% of the total tons pressed, indicating the high yield on this cultivar. In strong contrast to this, red cultivars utilise 40.9% of producing hectares, while only contributing 30.5% of tons pressed.
PwC 15
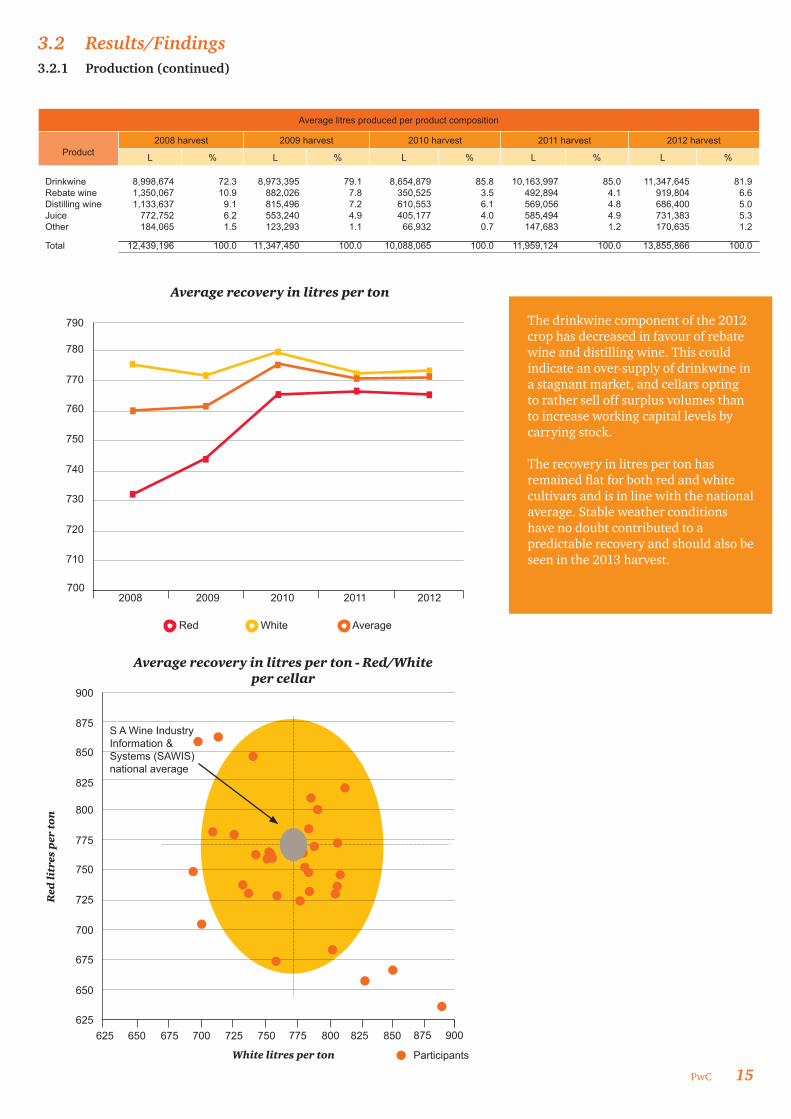
The drinkwine component of the 2012 crop has decreased in favour of rebate wine and distilling wine. This could indicate an over-supply of drinkwine in a stagnant market, and cellars opting to rather sell off surplus volumes than to increase working capital levels by carrying stock. The recovery in litres per ton has remained flat for both red and white cultivars and is in line with the national average. Stable weather conditions have no doubt contributed to a predictable recovery and should also be seen in the 2013 harvest.
3.2 Results/Findings3.2.1 Production (continued)
Average litres produced per product composition
Product
2008 harvest 2009 harvest 2010 harvest 2011 harvest 2012 harvest
L % L % L % L % L % Drinkwine 8,998,674 72.3 8,973,395 79.1 8,654,879 85.8 10,163,997 85.0 11,347,645 81.9Rebate wine 1,350,067 10.9 882,026 7.8 350,525 3.5 492,894 4.1 919,804 6.6Distilling wine 1,133,637 9.1 815,496 7.2 610,553 6.1 569,056 4.8 686,400 5.0Juice 772,752 6.2 553,240 4.9 405,177 4.0 585,494 4.9 731,383 5.3Other 184,065 1.5 123,293 1.1 66,932 0.7 147,683 1.2 170,635 1.2
Total 12,439,196 100.0 11,347,450 100.0 10,088,065 100.0 11,959,124 100.0 13,855,866 100.0
Average recovery in litres per ton
710
700
720
730
740
750
760
770
780
790
2008 2009 2010 2011 2012
Red White Average
S A Wine Industry Information & Systems (SAWIS) national average
Average recovery in litres per ton - Red/White per cellar
625
650
675
700
725
750
775
825
800
850
875
900
625 650 675 700 725 750 775 825800 850 875 900
Participants
Red
litr
es p
er t
on
White litres per ton

16 The South African wine industry insights survey September 2013
Ave
rage
yie
ld in
to
ns
per
hec
tare
6
4
8
10
12
14
18
16
20
2008 2009 2010 2011 2012
Red White Average
An increase of two tons per hectare for white varieties has contributed to the average yield in tons per hectare for the 2012 crop, to edge towards 16. This increase should assist producers to absorb ever increasing costs per hectare and remain competitive in the local and international market.
3.2 Results/Findings3.2.1 Production (continued)

PwC 17
3.2 Results/Findings3.2.2 Profitability
Income statement (Average per cellar)
Wine and related products2008 2009 2010 2011 2012
R R/ton R R/ton R R/ton R R/ton R R/ton
Sales 55,537,348 57,981,093 57,558,271 55,588,636 66,078,036
Opening inventories 20,743,837 19,841,361 22,080,838 23,602,430 27,669,242
Closing inventories 19,788,300 21,657,617 22,431,089 30,103,161 33,271,507 Net profit before tax 1,172,439 71.67 1,872,263 125.83 672,062 51.67 271,680 17.54 1,101,754 61.51 Tax 273,784 16.74 664,018 44.63 432,614 33.26 272,318 17.11 300,509 16.78 Net profit/(loss) for the year 898,655 54.93 1,327,267 89.20 477,490 36.71 (13,910) (0.90) 812,667 45.37
The 2011 prices per litre showed promise of recovery from the global economic downturn in 2008. However, average prices per litre for 2012 have been disappointing, with the drop in real prices continuing from the prior year. Few participating cellars were able to break through the R6 per litre barrier for red varieties and R6 was also the maximum price obtained for white varieties. With relatively low inflation levels, producers would have wanted to show an increase in real prices per litre.
R1.50R2.00
R0.50R1.00
R2.50R3.00R3.50R4.00R4.50R5.00R5.50R6.00R6.50R7.00R7.50
2008 2009 2010 2011 2012
Red White Average Real Average (excluding inflation)
Ave
rage
pri
ce p
er li
tre
Nu
mb
er o
f cel
lars
Ave
rage
pri
ce p
er li
tre
(Red
)
5
0
10
15
20
25
30
Less than R4.50
R4.50 to R6.00
R6.00 to R8.00
More than R8.00
Nu
mb
er o
f cel
lars
Ave
rage
pri
ce p
er li
tre
(Wh
ite)
5
0
10
15
20
2011
2011
2012
2012
Less than R3.50
R3.50 to R4.50
R4.50 to R6.00
More than R6.00

18 The South African wine industry insights survey September 2013
Analysis of expenses attributable to bulk and packaged wine
Expense
2008 2009 2010 2011 2012
Bulk wine Packaged Bulk wine Packaged Bulk wine Packaged Bulk wine Packaged Bulk wine Packaged
R/ton R/L R/ton R/L R/ton R/L R/ton R/L R/ton R/L
Labour Permanent 139.56 0.59 160.42 0.70 196.89 0.57 202.41 0.79 190.77 1.05 Temporary 18.03 0.09 17.79 0.15 24.97 0.14 22.83 0.02 25.86 0.02 Insurance 10.58 0.02 13.08 0.03 16.79 0.03 16.82 0.04 15.69 0.04 Marketing and sales expenses 31.86 1.18 27.49 1.48 34.14 1.15 27.56 1.90 36.71 3.05 Bottling and packaging 2.03 2.72 4.99 4.26 - 5.03 - 5.26 16.63 7.39 Chemicals, cleaning and filtration materials 128.18 0.15 154.35 0.16 164.12 0.14 176.50 0.16 199.21 0.09
Distribution 24.79 0.23 18.38 0.37 30.32 0.34 33.60 0.66 42.22 0.82 Sundry administrative expenses 53.46 0.15 64.89 0.63 84.38 0.71 69.90 0.54 71.30 0.89 Sundry cellar expenses 28.19 0.20 38.20 0.28 43.70 0.32 34.94 0.36 84.51 0.55 Electricity and water 29.86 0.06 36.48 0.08 54.25 0.07 63.33 0.08 71.90 0.07 Finance charges 114.35 0.26 101.53 0.22 107.22 0.20 96.62 0.25 88.58 0.21 Rent paid 6.97 0.04 9.11 0.03 6.37 0.03 6.38 0.04 14.29 0.05 Repairs, maintenance and cellar consumables 53.41 0.12 76.51 0.21 87.68 0.15 78.59 0.15 80.47 0.14
Telephone and postage 4.55 0.01 4.54 0.03 4.77 0.02 4.81 0.03 3.99 0.04 Depreciation 78.38 0.12 84.07 0.22 115.09 0.15 123.87 0.16 116.07 0.16
3.2 Results/Findings3.2.2 Profitability(continued)
The correlation between obtaining high or low prices for both red and white varieties, has remained strong during the year. This suggests that a well-organised and focused marketing programme could deliver positive results for all product ranges.
4
32 3.52.5 4 5 63 4.5 5.5 6.5
5
6
7
8
9
Average price per bulk litre – Red/White per cellar
Bu
lk r
ed w
ine
(Ra
nd
/lit
re)
Bulk white wine (Rand/litre) Participants

PwC 19
2008 2009 2010 2011 2012
R50
R100
R200
R150
R250
Labour Chemicals Finance charges Electricity and water
Major expenses per ton pressed
The larger harvest of 2012 has contributed to a better absorption of labour costs per ton. The institution of a new minimum wage of R105 per day, could see labour costs increase for the 2013 harvest. The monetary policy of the Reserve Bank has ensured that interest rates remain at an all-time low. The cost associated with financing has remained at an acceptable level.
Chemicals and electricity have shown increases and will continue doing so in future as the national grid remains under pressure.
Nu
mb
er o
f cel
lars
0Less than
R150R150 to R250
R250 to R350
More than R350
2
4
6
10
8
12
14
16
Cost of labour per ton pressed
Nu
mb
er o
f cel
lars
0Less than
R40R40 to R60
R60 to R90
More than R90
2
4
6
10
8
12
14
16
Cost of electricity and water per ton pressed
Nu
mb
er o
f cel
lars
0Less than
R125R125 to R175
R175 to R225
More than R225
2
4
6
10
8
12
14
16
Cost of chemicals per ton pressed
Nu
mb
er o
f cel
lars
0Less than
R50R50 to R100
R100 to R150
More than R150
2
4
6
10
8
12
14
18
16
20
Finance charges per ton pressed
3.2 Results/Findings3.2.2 Profitability(continued)
2011
2011
2011
2011
2012
2012
2012
2012
20 The South African wine industry insights survey September 2013
3.2 Results/Findings3.2.2 Profitability(continued)
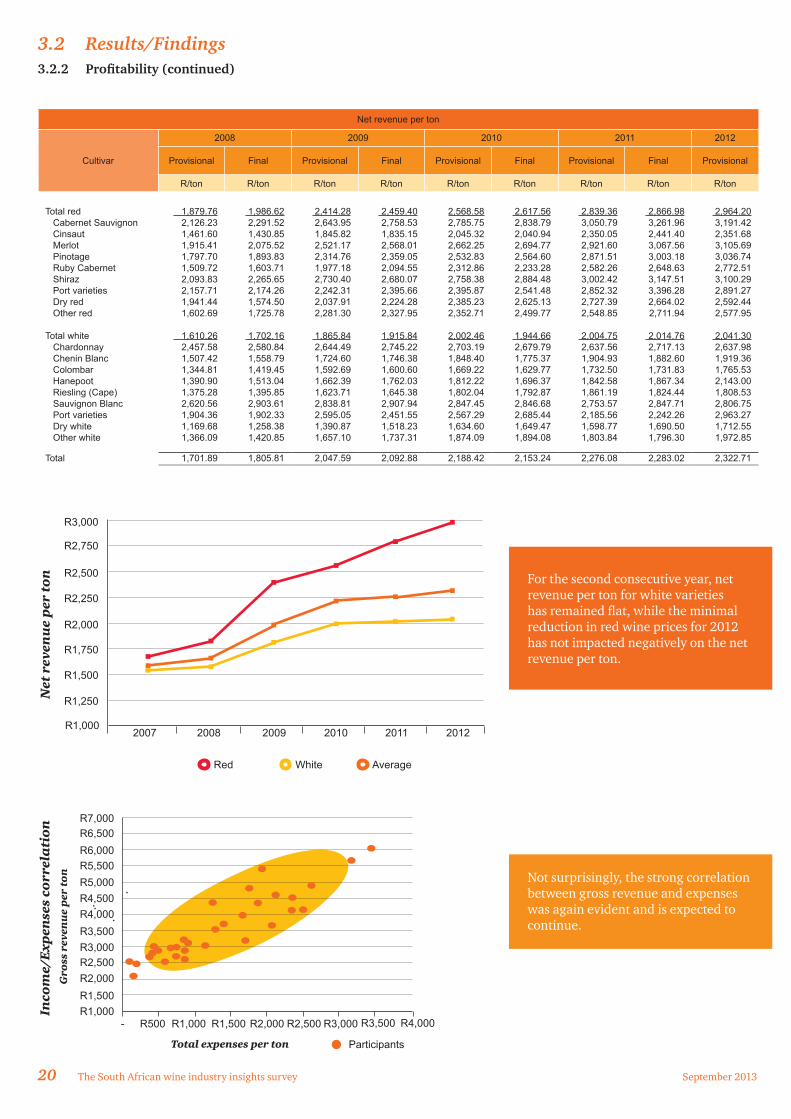
Net revenue per ton
Cultivar
2008 2009 2010 2011 2012
Provisional Final Provisional Final Provisional Final Provisional Final Provisional
R/ton R/ton R/ton R/ton R/ton R/ton R/ton R/ton R/ton
Total red 1,879.76 1,986.62 2,414.28 2,459.40 2,568.58 2,617.56 2,839.36 2,866.98 2,964.20 Cabernet Sauvignon 2,126.23 2,291.52 2,643.95 2,758.53 2,785.75 2,838.79 3,050.79 3,261.96 3,191.42 Cinsaut 1,461.60 1,430.85 1,845.82 1,835.15 2,045.32 2,040.94 2,350.05 2,441.40 2,351.68 Merlot 1,915.41 2,075.52 2,521.17 2,568.01 2,662.25 2,694.77 2,921.60 3,067.56 3,105.69 Pinotage 1,797.70 1,893.83 2,314.76 2,359.05 2,532.83 2,564.60 2,871.51 3,003.18 3,036.74 Ruby Cabernet 1,509.72 1,603.71 1,977.18 2,094.55 2,312.86 2,233.28 2,582.26 2,648.63 2,772.51 Shiraz 2,093.83 2,265.65 2,730.40 2,680.07 2,758.38 2,884.48 3,002.42 3,147.51 3,100.29 Port varieties 2,157.71 2,174.26 2,242.31 2,395.66 2,395.87 2,541.48 2,852.32 3,396.28 2,891.27 Dry red 1,941.44 1,574.50 2,037.91 2,224.28 2,385.23 2,625.13 2,727.39 2,664.02 2,592.44 Other red 1,602.69 1,725.78 2,281.30 2,327.95 2,352.71 2,499.77 2,548.85 2,711.94 2,577.95
Total white 1,610.26 1,702.16 1,865.84 1,915.84 2,002.46 1,944.66 2,004.75 2,014.76 2,041.30 Chardonnay 2,457.58 2,580.84 2,644.49 2,745.22 2,703.19 2,679.79 2,637.56 2,717.13 2,637.98 Chenin Blanc 1,507.42 1,558.79 1,724.60 1,746.38 1,848.40 1,775.37 1,904.93 1,882.60 1,919.36 Colombar 1,344.81 1,419.45 1,592.69 1,600.60 1,669.22 1,629.77 1,732.50 1,731.83 1,765.53 Hanepoot 1,390.90 1,513.04 1,662.39 1,762.03 1,812.22 1,696.37 1,842.58 1,867.34 2,143.00 Riesling (Cape) 1,375.28 1,395.85 1,623.71 1,645.38 1,802.04 1,792.87 1,861.19 1,824.44 1,808.53 Sauvignon Blanc 2,620.56 2,903.61 2,838.81 2,907.94 2,847.45 2,846.68 2,753.57 2,847.71 2,806.75 Port varieties 1,904.36 1,902.33 2,595.05 2,451.55 2,567.29 2,685.44 2,185.56 2,242.26 2,963.27 Dry white 1,169.68 1,258.38 1,390.87 1,518.23 1,634.60 1,649.47 1,598.77 1,690.50 1,712.55 Other white 1,366.09 1,420.85 1,657.10 1,737.31 1,874.09 1,894.08 1,803.84 1,796.30 1,972.85
Total 1,701.89 1,805.81 2,047.59 2,092.88 2,188.42 2,153.24 2,276.08 2,283.02 2,322.71
For the second consecutive year, net revenue per ton for white varieties has remained flat, while the minimal reduction in red wine prices for 2012 has not impacted negatively on the net revenue per ton.
20082007 2009 2010 2011 2012
R1,250
R1,000
R1,500
R1,750
R2,000
R2,250
R2,500
R2,750
R3,000
Red White Average
Net
rev
enu
e p
er t
on
Not surprisingly, the strong correlation between gross revenue and expenses was again evident and is expected to continue.
Participants
Inco
me/
Exp
ense
s co
rrel
ati
on
Gro
ss r
even
ue
per
to
n
R1,000- R1,500R500 R2,000 R3,000 R3,500 R4,000R1,000 R2,500
R1,500R2,000
R3,000R2,500
R3,500R4,000
R5,000R4,500
R5,500R6,000R6,500R7,000
Total expenses per ton

PwC 21
3.2 Results/Findings3.2.2 Profitability(continued)
Net revenue per producing hectare
Cultivar
2008 2009 2010 2011 2012
Provisional Final Provisional Final Provisional Final Provisional Final Provisional
R/ha R/ha R/ha R/ha R/ha R/ha R/ha R/ha R/ha
Total red 22,080.05 22,829.99 26,833.03 28,095.65 26,109.60 29,535.53 32,271.31 32,499.71 34,223.23 Cabernet Sauvignon 19,601.31 20,471.91 22,372.73 23,986.31 22,476.60 24,376.50 27,526.28 30,611.00 30,074.05 Cinsaut 20,292.29 19,308.87 25,073.56 25,647.64 28,138.57 29,717.67 33,874.54 35,441.38 37,326.75 Merlot 22,674.87 23,915.96 31,061.75 32,383.70 26,385.19 30,935.64 34,194.03 36,112.88 38,485.61 Pinotage 22,332.40 22,920.54 26,660.52 28,327.18 26,095.73 28,425.41 33,071.25 36,082.82 35,441.09 Ruby Cabernet 26,046.24 28,408.92 28,896.09 30,892.99 30,645.32 34,969.11 41,543.19 43,854.25 47,652.19 Shiraz 24,922.20 25,807.30 31,014.87 31,392.52 29,296.10 33,224.17 33,481.75 36,785.79 34,787.03 Port varieties 17,763.19 18,932.86 20,462.56 22,011.14 16,191.06 16,407.68 20,679.10 30,446.02 24,749.91 Dry red 27,549.62 22,342.93 25,694.75 31,730.56 28,515.30 27,925.45 40,664.87 38,553.96 38,683.37 Other red 17,424.89 19,974.41 25,234.17 25,872.10 21,320.78 34,149.68 26,498.75 29,710.35 21,584.82
Total white 24,508.19 25,037.42 29,658.47 31,116.57 28,322.75 29,934.24 31,099.76 31,724.32 37,232.57 Chardonnay 26,202.13 27,297.50 31,117.51 33,076.57 27,832.26 30,468.50 29,616.83 31,125.63 33,434.81 Chenin Blanc 20,572.66 20,092.25 25,819.77 27,253.06 25,881.68 26,185.50 27,565.47 28,019.05 33,203.19 Colombar 27,930.06 28,174.25 36,419.46 36,809.62 30,607.49 33,087.71 36,890.63 37,091.95 45,298.09 Hanepoot 27,065.08 30,069.48 32,029.37 32,877.69 25,886.56 29,074.91 31,956.15 33,657.83 45,256.13 Riesling (Cape) 13,665.42 14,384.73 19,545.96 19,788.61 20,114.32 30,355.78 21,591.73 20,948.43 26,899.28 Sauvignon Blanc 29,194.10 31,609.32 32,181.06 35,062.89 34,600.18 37,571.11 36,380.15 38,735.08 41,745.11 Port varieties 23,958.44 23,932.81 34,793.06 38,214.32 31,699.31 32,857.85 24,940.71 25,590.03 42,679.41 Dry white 24,525.57 25,399.65 22,801.30 25,959.96 21,306.26 28,669.78 27,243.82 28,806.99 21,580.51 Other white 27,337.61 31,189.18 29,942.08 31,035.85 31,373.28 29,616.96 31,260.66 31,492.87 42,506.55
Total 23,536.19 24,105.51 28,486.40 29,872.29 27,426.47 29,661.22 31,564.47 31,911.76 36,000.73
2008 2009 2010 2011 2012
R21,500
R20,000
R23,000
R24,500
R26,000
R27,500
R29,000
R30,500
R35,000
R32,000
R36,500
R33,500
R38,000
Red White Average Costs (VinPro)
Net
rev
enu
e p
er h
ecta
re
Net revenue per hectare continued to increase from 2011. White cultivars were at the forefront, with revenue per hectare for Sauvignon Blanc, Chenin Blanc and Colombar all increasing in excess of 15% from the prior year. Although at low volumes, Hanepoot managed to increase its revenue per hectare by 42% to R45,200 per producing hectare, while white port varieties increased revenue by more than 70%. The growth in net revenue per ton for red varieties was less aggressive and only Cinsaut, Merlot, Ruby Cabernet and Port were able to record growth above 10%. Revenue for dry red varieties decreased by an average of 12%.

22 The South African wine industry insights survey September 2013
3.2 Results/Findings3.2.3 Structuring
Balance sheet (Average per cellar)
2008 2009 2010 2011 2012
R R R R R
AssetsNon-current assets
28,913,668 30,346,382 31,101,990 35,602,571 36,301,087
Property, plant and equipment
26,139,623 27,745,501 28,310,193 32,467,191 33,494,786 Investments
2,754,155 2,517,185 2,704,879 3,062,876 2,728,139
Deferred tax assets
19,890 83,696 86,918 72,505 78,162 Current assets
39,379,503 41,870,475 40,416,354 48,498,264 54,137,181
Inventories
20,847,481 22,526,245 22,911,030 30,349,729 34,264, 687 Wine 19,788,300 21,657,617 22,464,393 29,671,137 33,380,411 Other
1,059,181 868,628 446,637 678,592 884,276
Trade and other debtors
16,382,114 16,812,555 15,402,824 16,112,956 18,086,400 Bank and cash
2,149,907 2,531,675 2,102,500 2,035,579 1,786,094
Total assets
68,293,171 72,216,857 71,518,344 84,100,835 90,438,267
Equity and liabilitiesCapital and reserves
19,741,704 20,764,483 19,747,353 22,731,844 24,290,860
Share capital
4,783,717 4,742,382 5,006,216 6,596,301 6,146,528 Reserves
14,176,458 15,274,328 14,029,844 15,314,916 17,486,514
Members’ funds
781,528 747,772 711,292 820,627 657,818 Non-current liabilities
13,269,637 14,223,281 14,104,520 13,218,810 13,323,521
Long-term borrowings
9,794,468 10,608,758 10,366,281 8,750,152 8,407,768 Deferred tax liabilities
3,172,946 3,361,393 3,549,021 4,308,664 4,859,531
Deferred income 302,223 253,129 189,218 159,994 56,222
Current liabilities
35,281,830 37,229,094 37,666,471 48,150,180 52,823,886 Trade and other creditors
16,015,280 14,323,157 13,728,355 18,435,285 17,098,486
Producers
18,808,073 21,844,931 22,314,933 27,657,522 32,403,920 Bank overdrafts
458,478 1,061,006 1,623,183 2,057,373 3,321,481
Total equity and liabilities
68,293,171 72,216,857 71,518,344 84,100,835 90,438,267
Ratios 2008 2009 2010 2011 2012
Own capital vs debt Own capital 29% 29% 28% 27% 27% Debt 71% 71% 72% 73% 73%
100% 100% 100% 100% 100%
Current ratio 1.12 :1 1.12 :1 1.07 :1 1.01:1 1.02:1
Acid test 0.53 :1 0.52 :1 0.46 :1 0.38:1 0.38:1
Non-current assets vs non-current liabilities 2.18 :1 2.13 :1 2.21 :1 2.7:1 2.7:1
Inventory turnover rate (times per year) (Note 1) 2.7 2.8 2.5 2.1 2.2
Debtors days outstanding (days) 100 104 102 105 93
Return on investment (%) (Note 2) 17% 17% 11% 8% 11%
(Note 1: Since most of the respondents value wine inventories at the expected realisation prices, the inventory turnover rate is based on turnover instead of cost of sales.)
(Note 2: Return on investment is calculated as earnings before interest and tax (EBIT) as a percentage of capital and reserves.)

PwC 23
3.3 Summary
Overall, the results recorded for the 2012 harvest were positive. Cash flows in the current year were more favourable than in prior years, with stock turnover remaining at levels seen in the past, combined with a quicker recovery of debtors. An increase in the return on investment to 11% is positive in light of low interest rates. Producers would have welcomed the higher net revenue per ton, especially for white cultivars.
Reference list: South African Wine Industry Information and Systems publications. Available from www.sawis.co.zaVinpro publications. Available from www.vinpro.co.za

24 The South African wine industry insights survey September 2013
4. Human resource management
4.1 IntroductionIndividually and collectively, the human resources of an organisation drive the organisation to reach its objectives and create value for all stakeholders involved. That is why human resource (HR) management is vital to the success of any organisation or business, including those operating in the wine industry.
This is the fourth year that human resource practices are included in this survey and the results have once again proved valuable.
In an ongoing effort to improve the survey and increase its value, additional questions have been added to the 2013 survey – providing further insight into the key human resource challenges faced by the wine industry.
The results and significant trends for the 2013 survey are provided below and, where applicable, comparisons have been made to the results of previous years.
The trends illustrated here will provide wine businesses with a significant benchmark against which to measure their own performance and promote an increased understanding of practical human resource management in this industry.

PwC 25
Thirty-seven percent of participating cellars indicate that they currently have an internal human resource function. This percentage increased gradually from 19% in 2010. It is thus evident that more and more cellars are exploring the opportunity to implement a dedicated team for this function internally. This is a positive indicator, as it positions human resources management as an important business driver.
4.2 The human resource departmentIn 2013, the typical trend for the staff complement of participating wine cellars is continued, with the majority (63%) of cellars having between 11 and 50 employees. In 2013, 15% of cellars employ fewer than 10 employees and 22% employ between 51 and 200 employees.
15%
63%
22%
2013 number of employees
< 10
11 - 50
51 - 200
Does your organisation have an internal HR function or department?
Yes
No
37%
63%
More cellars are exploring the implementation of a dedicated HR function.

26 The South African wine industry insights survey September 2013
Of the group of cellars that do have an internal HR function, 54% indicated in 2013 that their human resource function is performed by their financial manager and 38% by the CEO. Only 8% have an HR manager and team dedicated to the function. Due to the size of the staff complement of the majority of cellars participating (as indicated above), these cellars often feel that they cannot yet fully justify a dedicated HR manager or team.
The majority of participating cellars’ (73%) HR function focuses on transactional activities pertaining to the management of employees rather than a strategic focus. There is an increased need for cellars to incorporate more and more strategic functions into their HR activities. Although staff complements remain low, human practices and processes are nevertheless increasing in complexity and are constantly posing new challenges to wine cellars and their leadership. Strategic human resource practices can help cellars to address these challenges and align the capabilities and skills of their employees to the goals of the organisation and at the same time increase staff retention.
Who performs these internal HR activities?
38%
8%
54%
HR department
Financial Manager
CEO
What type of HR activities does your internal HR function perform?
27%
73%
Transactional activities e.g. administration, disciplinary procedures and recruitment
Strategic HR activities e.g. succession planning, performance management and organisational development

PwC 27
4.3 Staff turnover
Eighty-nine percent of cellars indicate that they do not have a high staff turnover rate. This figure is well in line with the trend for previous years.
High staff turnover
Yes
No
11%
89%
Fifty-five percent of participating cellars indicate the highest staff turnover in 2013 to be in the operational/technical category of staff. This percentage is remarkably lower than the 87% indicated for 2012. It is promising to see that the retention of operational and technical staff is improving. One of the contributing factors to this could be the increased investment in skills development in this staff category.
The other side of the same coin is that more participating cellars have indicated that their highest turnover of staff is in the categories of professional and management level employees. This may pose a concern, but only tangible figures for each cellar will indicate whether the concern is valid. The average staff turnover for the participating wine cellars is 10% per annum.
Employee bands with highest turnover level
Unskilled
Semi-skilled
Skilled, technical and academically qualified employees, supervisors and junior management
Professionally qualified and experienced specialists and middle management
Senior and top management
3%
29%
26%
29%
13%

28 The South African wine industry insights survey September 2013
The 2013 survey indicates that better career opportunities and remuneration seem to be the main reasons for staff turnover, together adding up to 50%. This is slightly lower than the 58% of 2012, but should still be taken cognisance of. Benchmarking the remuneration of employees, as well as ensuring career development and growth may well improve this trend in the future.
The percentage of staff turnover due to dismissals is still quite high at 28%, compared to 26% in 2012. This trend reiterates the question of possible shortcomings in certain human resource practices such as recruitment and selection, training, and/or performance management.
The 2013 survey also requested the participating cellars to indicate the average age of each of the staff categories. The results are provided below, indicating that four of the five staff bands have an average employee age of well below 40. The average age of senior/top managers is 45. It is promising to note that the wine industry seems to be able to attract a young workforce.
Main reasons for employees leaving
Better remuneration and benefits elsewhere
Better career opportunities elsewhere
Dismissal
Retirement
Retrenchment
Other
19%
31%28%
6%
13%3%
31
3134
3745
Workforce average age
Unskilled
Semi-skilled
Skilled, technical and academically qualified employees, supervisors and junior management
Professionally qualified and experienced specialists and middle management
Senior and top management

PwC 29
4.4 Human resource practicesSuccession planningThere is a downward trend for cellars who have a succession plan in place. In 2011 41% of participating cellars indicated that they have a succession plan in place, dropping to 28% in 2012 and 20% in 2013. Further to this, only 11% of the 80% of cellars that currently do not have succession plans in place are planning to implement these plans in the future. Succession plans are going to be pivotal to ensure that shortages of skills and experience do not have a bearing on cellars’ overall performance. One of the reasons for a lack of succession planning may be the young age of the workforce as indicated before. Succession planning may be seen as an unnecessary and time consuming exercise.
Does your organisation have a succession plan in place?
Yes
No
20%
80%
Looking at the staff levels at which succession planning is aimed, an interesting shift has occurred from 2012 to 2013. In 2012, most succession plans were still aimed at the senior management level. In 2013, however, an increase is noted in succession plans for the operational/technical levels and junior management.
Do you intend to implement a succession plan over the next 12 months?
Yes
No
11%
89%

30 The South African wine industry insights survey September 2013
This strategic intervention is in line with the staff turnover levels measured and therefore can be commended.
RecruitmentFourty-one percent of participating cellars indicate that they make use of newspaper advertising for recruitment, whilst 36% make use of recruitment agencies. These two methods seem to be the preferred form of recruitment.
Thirty-one percent of cellars indicated that there are critical skills that they find difficult to recruit. Critical skills refer to particular capabilities needed within an organisation, such as communication, teamwork and general management skills.
Levels of existing succession planning
Unskilled
Semi-skilled
Skilled, technical and academically qualified employees, supervisors and junior management
Professionally qualified and experienced specialists and middle management
Senior and top management
10%
30%
30%
10%
20%
Methods of recruitment
Referrals
Newspaper advertising
Recruitment agency
8%
44%
48%
Despite the digital age, the type of candidates applying for jobs at wine cellars still prefer printed media. Alternatively they make use of agencies to find employment.

PwC 31
TrainingThe participating cellars have a properly implemented skills development programme in place, aligned to their business strategy. This has increased gradually in recent years to reach 93% in 2013. The majority of training programmes are aimed at the operational/technical level (in line with 2012). This is often due to the need to comply with regulations such as health and safety, ethical trade, etc. There is also the necessity to comply with the BEE (Black Economic Empowerment) scorecard and spend on training of black employees. Cellars spending on training of this staff category receive the added benefit of BEE points.
In 2013 the biggest percentage of the training budget was also spent on training of employees in the operational/technical level as evident below:
Main beneficiaries of training
29
22
29
10
10
Unskilled
Semi-skilled
Skilled, technical and academically qualified employees, supervisors and junior management
Professionally qualified and experienced specialists and middle management
Senior and top management
Training spend per employee band
Unskilled
Semi-skilled
Skilled, technical and academically qualified employees, supervisors and junior management
Professionally qualified and experienced specialists and middle management
Senior and top management
16%
33%
29%
11%
11%
R50,830
R33,810
Average training budget of participating cellars: R50,830
Most wine cellars are members of the Agri Seta with an annual skills levy of R33,810

32 The South African wine industry insights survey September 2013
For the purposes of the BEE scorecard, cellars should spend 3% of their leviable amount (total salaries and wages) on training of black people. If we use the average skills levy at R33,810 (as indicated in the survey) to derive the leviable amount, then this amount is on average R3,381,000 per cellar. In order to obtain full points for skills development on the AgriBEE scorecard, participating cellars need to spend on average R101,430 on training of black employees. Currently cellars spend more or less half of this target amount on training. It is implied then that training spend would need to be doubled for wine cellars to gain the advantage of BEE points from this element in the future.
It is interesting to note the typical priority training needs at each level of employment:
Senior and top management BEE, marketing and financial management skills, life skills, time management, management practice, HR training
Professionallyqualifiedandexperienced specialists and middle management
Wine-making skills development, life skills, time management, management practice, budgeting, leadership
Skilled,technicalandacademicallyqualifiedemployees,supervisorsand junior management
Wine-making skills development, computer top-up courses, life skills
Semi-skilled ABET (Adult Basic Education and Training)/SKOP (operational training for cellar workers), first aid, health and safety, forklift, life skills, fire fighting
Unskilled ABET/SKOP, forklift, health and safety
Performance managementIn 2013, 52% of participating cellars indicated that they have a performance management system in place, an increase from 41% in 2012. Participating cellars indicated that their performance management systems are directed at all levels of the company, as indicated below:
Levels of performance management systems
17%
7%
17%
26%
24% Unskilled
Semi-skilled
Skilled, technical and academically qualified employees, supervisors and junior management
Professionally qualified and experienced specialists and middle management
Senior and top management

PwC 33
Of the 48% of cellars indicating that they do not have a performance management system in place, only 15% plan to implement such a system in the next year. The most significant challenges to employee performance are listed below:
Mostsignificantchallengestoemployeeperformance
Keeping technical/operational employees motivated
Rewards in rand value
Workload
Motivation
Providing valid recognition
Amalgamation
Effectiveness of reward system
Accountability
Consistency
KPI’s not set for individuals
The 2013 survey highlights the following interesting trends in performance management:
• 89% of respondents indicated that employees have clearly defined job descriptions;
• 81% of cellars indicated that their employees understand their own contribution in terms of the organisation’s overall performance;
• 52% of cellars indicated that they incentivise their employees for outstanding performance; and
• 96% of cellars feel that they award fair and competitive compensation according to industry standards.
It is evident from the results of the survey that employees do understand how their own performance (as per their job descriptions) ties in with organisational goals, but that there is not sufficient incentive for exceptional performance. Such a scheme may just be the differentiating factor between good and great organisational performance.
Motivation of staff can happen through more methods than merely increased remuneration. Cellars indicated that job satisfaction is a very valuable tool for motivation, as well as creating a sense of belonging and cohesion through team building and social events.

34 The South African wine industry insights survey September 2013
RemunerationA new section has been included in the survey for 2013, focusing on remuneration. Some interesting insights can be shared:
The graph below illustrates the months in which salary increases are awarded by the participating cellars. Twenty percent of cellars award increases in October, 17% in November and 15% in May:
The basis on which salary increases are determined differs substantially from one cellar to the next. Twenty-six percent of cellars indicated that they make use of market movements, 20% are guided by union negotiations and 17% are driven by the financial position of the organisation.
Month in which salary increase is awarded
January
May
September
March
July
November
February
June
October
April
August
December
6%
3%
0%0%
15%12%
6%
3%
9%20%
17%9%
Basis used for awarding salary increases
CPI
Budget limitations
Affordability
Market movement
CPIX
Union negotiations
Organisation’s financial position
12%
3%14%
17%
8%20%
26%

PwC 35
Salary increases in percentage (on average) are indicated for the participating cellars:
Increase for last 12 months %
Basic salary 6.99%
Total package structure 6.86%
Increase forecast for next 12 months %
Basic salary 6.75%
Total package structure 6.89%
Fifty-six percent of participating cellars indicated that they provide bonus/incentive schemes to employees. Of this group, 32% of cellars indicated that senior and top management are eligible for incentives and only 18% that operational/technical levels of staff are eligible. Only 46% of the group of cellars that indicated that they provide incentives from time to time, have done so in the last 12 months.
Most cellars (63%) indicate that they use recruitment agencies as a point of reference for remuneration.
Employee bands eligible for incentives
32%
23%
18%
18%
9%
Senior and top management
Unskilled
Skilled, technical and academically qualified employees, supervisors and junior management
Professionally qualified and experienced specialists and middle management
Semi-skilled
Reference used in determining remuneration
Recruitment agency information
Special consulting assignmentsSalary benchmarking studies
63%16%
21%

36 The South African wine industry insights survey September 2013
It is interesting to note that 12% of participating wine cellars follow practices that differ from those prescribed by the Department of Labour in terms of minimum rates of pay.
Cellars adhering to minimum rates of pay as per Department of Labour
88%
Cellars following practices that differ from those prescribed by the Department of Labour
12%
This figure is significant, as it would seem that more cellars are implementing alternative remuneration practices, which in some cases could exceed the minimum requirements of the Department.
Sixty-seven percent of cellars focus not only on market benchmarks, but also on experience and qualification, when determining remuneration.
4.5 General insightsIt is interesting to see (in the graphs below) which HR practices cellars currently feel they are doing well at and which practices they would like to improve. The more transactional/administrative functions such as remuneration, disciplinary procedures and HR administration are highest on the list of current best practices. The more strategic functions such as succession planning, organisational development and performance management, which are not currently perceived as the most successful HR practices, are also high on the list for improvement.
HR practices doing well
HR practices that can be improved
Remuneration and benefits
Performance management
Recruitment
Remuneration and benefits
HR administration
Training and skills development
Organisational development
Disciplinary procedures
Disciplinary procedures
Succession planning
Performance management
Recruitment
Training and skills development
Organisational development
Succession planning
HR administration
19%
18%
16%14%14%
9%7%
3%
31%
26%
17%
16%
3%3%
2%2%

PwC 37
4.6 SummaryThe 2013 HR component of this survey has provided a very good overview of practices in the industry. The key elements are highlighted below:
• More cellars are exploring the implementation of a dedicated HR function.• Only 3% of participating wine cellars have an appointed HR manager. • The majority of cellars housing an internal HR function still focus on
transactional activities (administration, discipline) rather than strategic ones (performance management, organisational development, succession planning).
• The highest staff turnover still occurs in the operational/technical category of staff, but this figure has decreased substantially since 2012.
• Four of the five staff bands have an average employee age of well below 40, indicating a young and vibrant workforce in this dynamic industry.
• There is an alarming downward trend for cellars to have a succession plan in place. This may be due to the young average age of the workforce and it may be deemed an unnecessary and time consuming exercise.
• An increase is noted in succession plans for the operational/technical levels and junior management levels.
• Despite the digital age, candidates seeking jobs at wine cellars still prefer printed media (newspapers). Alternatively, they make use of agencies to find employment.
• The number of participating cellars that have a properly implemented skills development programme in place that is aligned to their business, has increased in recent years.
• The majority of training programmes are aimed at the operational/technical level.
• More and more cellars are implementing and considering implementing performance management systems.
• Employees do understand how their own performance (as per their job descriptions) ties in with organisational goals, but maintain that there are not sufficient incentive schemes for exceptional performance.
• The two main considerations for cellars in determining remuneration/increases/incentives are market movements and union negotiations.
• Twelve percent of participating wine cellars are following alternative remuneration practices that differ from those prescribed by the Department of Labour.
• Transactional and administrative HR functions are currently the strong point of most cellars, while strategic functions are most cellars’ future growth ideal.
• The need for performance management and succession planning has again been identified as a priority by the participating cellars.
• A high emphasis is also placed on relevant training and skills development as well as organisational development initiatives to improve organisational efficiency.
• The need for proper remuneration benchmarking for the wine industry has also been identified as a priority by the participating cellars.

38 The South African wine industry insights survey September 2013
5. Wine supply chain
5.1 Introduction
Many wine cellars in South Africa are still under tremendous financial pressure. Reducing costs and increasing efficiency in their supply chains can help cellars survive and stay competitive in these tough economic times. News reports often discuss issues such as increased inventory levels, reduced profit margins and increased competition in international markets by Australia and Chile amongst other competing countries.
Literature reviews indicate a vast amount of research related to grape production and wine making. However, little literature was found on the business aspects of the wine industry, especially the supply chain activities that connect, for example, wine making to the intended consumers. In most Fortune 1000 companies, there is substantial evidence that shows a positive correlation between a well-performing supply chain and a business’ profitability (e.g. influencing key business performance indicators such as ROI).
The ultimate aim of this research is to have proper quantitative supply chain benchmark information available in the coming years. This information could assist the South African wine industry in improving its supply chain performance and making a positive contribution to the financial bottom line. Over time the intention is also to contribute to the increased supply chain knowledge, awareness and improved overall supply chain performance in the wine industry.
Contributors:
Professor Johan Louw (SU)
Mr Joubert van Eeden (SU)
Dr Leila Goedhals-Gerber (SU)
Dr Esbeth van Dyk (CSIR)
Ms Ulrike Kussing (PwC)

PwC 39
Approach and methodology followed A collaborative, team-based research approach was used by Stellenbosch University, CSIR and PwC. This research is part of the exploratory phase in working towards gathering proper quantitative supply chain benchmarking information. Both qualitative and quantitative data was used in the secondary and primary research conducted. The SCOR model formed the basis for the methodology of the study (Supply Chain Council, 2012).
This explorative study focused on wine cellars in three wine regions of South Africa, namely, the Breedekloof, Robertson and Worcester wine regions. These wine regions contributed 41.5% of the South African wine production in 2011 (SAWIS, 2012). The primary reason for choosing these three regions related to:
(a) Large volume of wine production,
(b) Presence of producer cellars, wholesalers (wine context) as well as private cellars, and
(c) Relative proximity to Stellenbosch for conducting the research with students.
During the 2012 study, seven students assisted in this study as part of the research component of their Honours Degree in Logistics Management. Each student had a study leader at the Stellenbosch University to guide him/her throughout the study.
The best method identified for gathering the required information for this research was by means of a questionnaire. This was largely due to the fact that little supply chain information is publically available for the wine industry in South Africa or even recorded at the various cellars. Two questionnaires were used:
Questionnaire 1: Focused on understanding the industry
Supply chain information gathered provided contextual information of each wine region. Descriptive statistics were used to compare the wine regions to each other and determine differences in their inbound- and outbound supply chains as well as the difference in products produced.
Questionnaire 2: Focused on performance of selected individual supply chains
In the second part of this study a number of specific cellars were selected and compared to the different cellars in their own wine district, as well as the cellars from the other two wine districts. This was done to identify possible improvements for their supply chain’s configuration and performance.

40 The South African wine industry insights survey September 2013
5.2 Key findings from contextual survey
The responses from participants in Questionnaire 1 provided the following sample across the three regions used for data analysis:
• Twenty-three cellars producing 18% of SA wine• Sixty-three percent of the wine produced in the three regions covered by the
participants
Although the number of responses was limited compared to the total population size, it did allow for some explorative analysis in this study. In the following sections key findings are highlighted, arising from the two questionnaires and explorative interviews held.
Average wine production per cellar per annum
Supply chain segmentation and definition Six wine supply chains were identified and confirmed by participants to be a true reflection of the type of supply chains operated by most in the wine industry. The following matrix provided the basis for the supply chain definition (based on aggregate wine produced and markets served). The wine industry segmentation into these supply chains was found to be appropriate.
Markets
Products
Local Export
Bulk wine (basic) Basic Bulk - Local Basic Bulk - Export
Packaged wine (basic) Basic Packaged - Local Basic Packaged - Export
Packaged wine (premium) Premium Packaged - Local Premium Packaged - Export
Note: The split used for this past study between basic and premium wine was R 35 per litre in finished product.
Each grouping gets a description, indication the type of supply chain (e.g. “Basic Bulk - Local”)
For the purpose of this study, a further grouping of cellars was made (based on the responses) into three main categories of “Bulk Local”, “Mixed Supply Chain (SC)”, and “Premium Export”.
0M 2M 4M 6M 8M 10M
13 972 656
8 081 811
7 725 578
12M 14M 16M 18M 20M 22M 24M 26M 28M 30M
Cellar groupingBulk Local
Mixed SCs
Premium Export
Wine Region
Breedekloof
Worcester
Robertson
Average wine production litres per annum

PwC 41
The Logistics Cost as a percentage of Total Cost varies quite widely across the regions and grouping of responses. Typically one would expect the “Bulk Local” cost to be lower, and the “Premium Export” Logistics Cost to be higher, but it is difficult to distinguish on this graph. Cellars in the Robertson area seem to have a higher logistics cost for local bulk compared to the other regions. This could be because they are further away from major distillers or distributors, resulting in higher transport cost.
Wineries that focus on bulk wines for the local markets segment should typically show a lower logistics cost as a percentage of total cost. This is expected, due to lower input effort required. On the other extreme, premium bottled wine for the export market should result in a significantly higher logistics cost percentage. The sample data from participants does not indicate as such; possibly also due to inconsistency in calculating or estimating the key performance indicators.
Logistics cost as a percentage of total cost
0
9
122 4 6 8 10 12 14 16 18 20 22 24 26
Cellar groupingBulk Local
Mixed SCs
Premium Export
Wine Region
Wine Region
Breedekloof
Breedekloof
Worcester
Worcester
Robertson
Robertson
Spend on logistics activities as % of total cost
Value
Value
Local focus
Value
Export focus% Sales
10
0 20 40 60 8080
85
95 5
1520
100 0 20 40 60 80 100

42 The South African wine industry insights survey September 2013
Bulk wine (local) opportunityCellars focusing on local bulk wine have the opportunity to optimise their supply chains upstream. Since this type of supply chain has less complexity downstream of a cellar, the opportunity lies in reducing the Total Cost of Ownership (TCO) compared to more distribution-intensive cellars that also bottle their wines. The following diagram indicates the various expenditure items in the form of a “Pareto chart” (the 80–20 rule).
Bulk wine vs Packaged wine – Expenses
BulkExpense
ExpensePackaged
% of Total amount
% of Total amount
Cum perc
Cum perc
0%
0%
5%
5%
10%
10%
15%
15%
20%
20%
0%
0%
20%
20%
40%
40%
60%
60%
80%
80%
100%
100%
Labour - Permanent
Bottling and packaging
Repairs, maintenance and cellar consumables
Sundry administrative expenses
Labour - Temporary
Electricity and water
Depreciation
Labour - Permanent
Distribution
Chemicals, cleaning and filtration materials
Electricity and water
Finance charges
Rent paid
Insurance
Chemicals, cleaning and filtration materials
Marketing and sales expenses
Sundry cellar expenses
Depreciation
Sundry administrative expenses
Sundry cellar expenses
Insurance
Rent paid
Finance charges
Distribution
Marketing and sales expenses
Repairs, maintenance and cellar consumables
PwC 43
Involvement in logistics activities
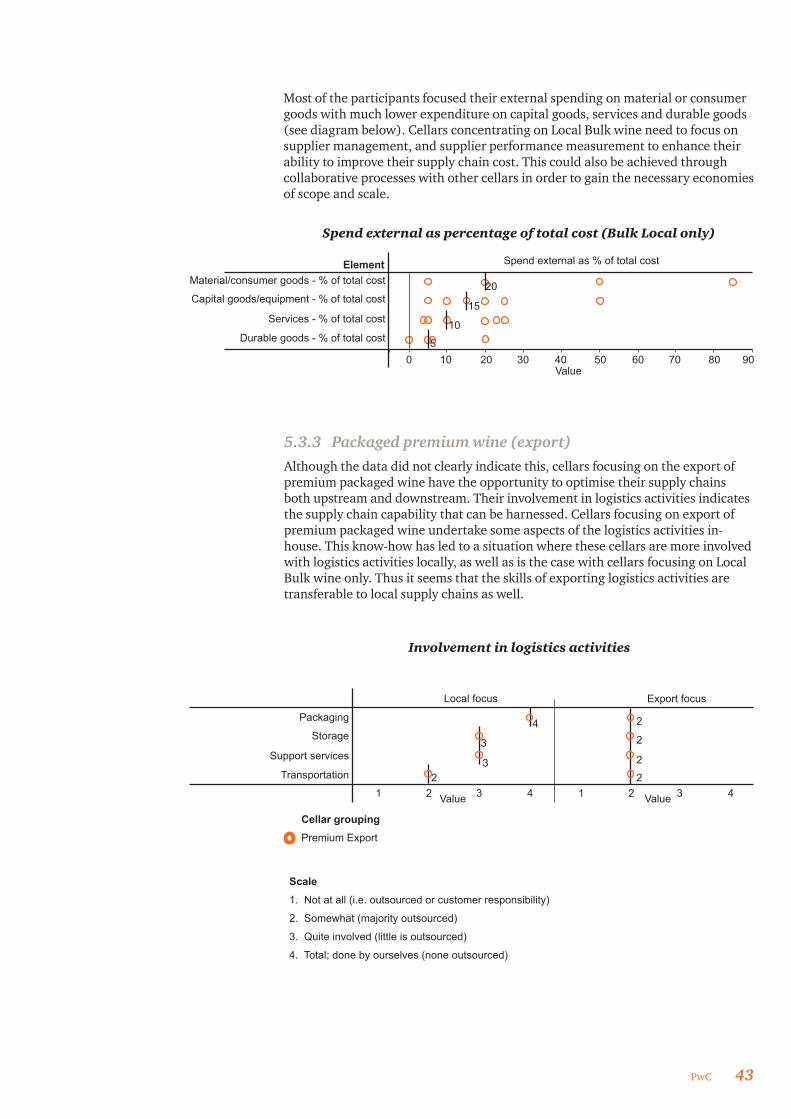
Spend external as percentage of total cost (Bulk Local only)
Most of the participants focused their external spending on material or consumer goods with much lower expenditure on capital goods, services and durable goods (see diagram below). Cellars concentrating on Local Bulk wine need to focus on supplier management, and supplier performance measurement to enhance their ability to improve their supply chain cost. This could also be achieved through collaborative processes with other cellars in order to gain the necessary economies of scope and scale.
5.3.3 Packaged premium wine (export) Although the data did not clearly indicate this, cellars focusing on the export of premium packaged wine have the opportunity to optimise their supply chains both upstream and downstream. Their involvement in logistics activities indicates the supply chain capability that can be harnessed. Cellars focusing on export of premium packaged wine undertake some aspects of the logistics activities in-house. This know-how has led to a situation where these cellars are more involved with logistics activities locally, as well as is the case with cellars focusing on Local Bulk wine only. Thus it seems that the skills of exporting logistics activities are transferable to local supply chains as well.
50
1 22
3
3
3
4
4
1 22
2
2
2
3 4
10 20 30 40 50 60 70 80 90
ElementMaterial/consumer goods - % of total cost
Packaging
Services - % of total cost
Support services
Durable goods - % of total cost
Transportation
Capital goods/equipment - % of total cost
Storage
Spend external as % of total cost
Local focus Export focus
Value
10
15
20
Scale1. Not at all (i.e. outsourced or customer responsibility)
2. Somewhat (majority outsourced)
3. Quite involved (little is outsourced)
4. Total; done by ourselves (none outsourced)
Cellar groupingPremium Export
Value Value

44 The South African wine industry insights survey September 2013
Responsibility for the logistics and supply chain Responses to the question on the specific management roles/positions used for logistics and supply chain management fell into the following two categories:
Combined with other positions Unique positions
Winemaker
Financial manager
General manager
Marketing
Sales
Logistics manager
Warehouse manager
Transport manager
Procurement manager
Coordinator
Administrator
Order fulfilment
Packaging manager
This table indicates that some key logistics and supply chain management roles have been established over time. This creates competence in dealing with logistics and supply chain issues. Although cellars were not rated on their level of supply chain maturity, one would expect to find more specific positions to exist for logistics and supply chain processes in wineries where the discipline has been recognised and established.
5.3 Key findings from supply chain performance survey
Performance attributes are characteristics of a supply chain that permit it to be analysed and evaluated against other supply chains (with competing strategies).
Performance attributes Typical metric What it entailsExternal (customer facing)
Reliability Perfect order fulfilment On time? Complete? Undamaged?
Responsiveness Order fulfilment cycle time From customer request to final acceptance
Agility (flexibility) Supply chain flexibility How long to scale up? How expensive to scale down?
Internal (internal facing)
Cost Cost of goods sold Cost of processes? Cost of goods sold?
Assets Return on working capital Working capital tied up? Return on investments?

PwC 45
For comparative ranking, a supply chain’s performance can be rated as “S” for Superior, “A” for Advantage, “P” for Parity or “D” for Disadvantage for each of the performance attributes. These indicators aim to show:
Performance InterpretationSuperior (S) Top performing cellars
Advantage (A) Cellars performing between Superior and Parity
Parity (P) Half of cellars perform better and half worse (cellar is an average performer)
Disadvantage Cellar performs worse than half of the cellars
Selected supply chains across the six supply chain types were analysed to compare the “Desired state” of performance to the “Current state” of performance for the various performance attributes indicated above (i.e. reliability, responsiveness, agility/flexibility, cost and assets). Below is an example of how the desired and current states of performance of a supply chain could be rated.
SC performance Desired state Current stateReliability S A
Responsiveness A P
Agility (Flexibility) P P
Cost P A
Assets P P
Note: “S” for Superior, “A” for Advantage, “P” for Parity or “D” for Disadvantage.
Based on the performance gaps above, the responsiveness and cost performance should thus be investigated further.

46 The South African wine industry insights survey September 2013
Wine cellars’ supply chain performance priorities In general, the current performance priorities aspired to by wine cellars are not always in line with good supply chain practice according to the types of supply chains identified. For example, it was found that some cellars with mainly local bulk type supply chains, would aspire for “Superior” performance in all performance attributes. Realistically, they should rather aspire to perform on “Advantage/Parity” in the customer-facing performance attributes, while aiming for more “Superior/Advantage” level performance on the internal-facing performance attributes (striving for cost efficiency).
The same principle would apply for a cellar that has mainly premium, packaged export type supply chains. They should aspire for “Superior/Advantage” level performance in the customer-facing performance attributes, while aiming for more “Advantage/Parity” level performance on the internal-facing performance attributes (superior service at a cost).
Early stage of supply chain maturity During the interviewing and clarification discussions, it became apparent that many of the cellars surveyed are at a very early stage of supply chain and logistics maturity. Reflecting back on the establishment of the logistics and supply chain discipline in organisations, it has typically evolved through the following four stages and perspective of how companies globally view it (Langley, 1992). This indicates that the focus of logistics and supply chain could/should evolve from a cost and customer focus to a more strategic focus:
1. Logistics is viewed as an area for cost control.
2. Logistics capabilities have a revenue-enhancing impact on sales.
3. Logistics is viewed as a key way in which a firm can differentiate itself from its competitors.
4. Its strategic/competitive advantage revolves around its logistics activity.
The application of supply chain principles poses a challenge to the wine industry. There is room for improvement in the overall management of supply chains, and cellars should strive to not only view supply chain management as an area for cost control, but use it as a competitive advantage in logistics activities.

PwC 47
Cellars did, however, commend themselves on the following areas: • Inbound: Communication with suppliers, services, just-in-time (JIT)
practices, outsourcing and procurement.• Outbound: Manage complex logistical networks, relationship with logistics
service providers, customer communication, transport and on-time delivery (right product at the right place at the right price), strive for superior customer service, export capability.
Cellars also indicated areas that need improvement and plans to achieve this:Recycling, shorter lead-times, technical service and administration, better suppliers and better quality raw materials, productivity in general, customer and sales support, communication issues abroad, timeous orders from consumers (to ensure product is produced on time), timeous notification of cargo at destination, electronic order management system, e-commerce (e.g. PODs), appointing logistics specialist, environmentally good practices, energy savings and biodiversity initiatives.
5.4 SummaryMany participating cellars still view supply chain management as a cost element. A proper investment in the principles applicable to supply chain management, continued measurement against these principles and knowledge sharing will assist cellars to understand supply chains better and improve focus on the right areas.
Through transparency and collaboration with other cellars, industry best practices could be developed and established over time. Individual cellars could then identify key performance indicators for themselves and measure the results against industry best practice. Over time the regular and proper evaluation of results could be used by cellars to use supply chains as a competitive advantage the wine industry.
This information could assist the South African wine industry in its supply chain performance and make a positive contribution towards improving the financial bottom line of individual participants and the industry as a whole. Through this process, supply chain knowledge and performance in the wine industry would increase and the level of maturity in adopting world-class supply chain practices could also significantly increase.
Reference list: Langley, C.J. 1992. The evolution of the logistics concept, 17-28. In: Christopher, M.(ed). Logistics; The Strategic Issues. London: Chapman & Hall.SAWIS. 2012. SA Wine Industry Statistics nr 36. [Online]. Available: http/ www.sawis.co.za [2012, March 2].Supply-Chain Council. 2012. SCOR®: The Supply Chain Reference Model (Ver 10). Boston: Supply-Chain Council.

48 The South African wine industry insights survey September 2013
6. Contacts
PwC Cape Town
Tom Blok [email protected]
Pieter Janse van Rensburg [email protected]
Crispin Swart [email protected]
Ulrike Kussing [email protected]
Tel: +27 (0) 21 529 2000
PwC Paarl
Tertius Bruwer [email protected]
Tel: +27 (0) 21 807 7100
PwC Robertson
Johan du Toit [email protected]
Lorka Hayman [email protected]
Tel: +27 (0) 23 626 3041
PwC Stellenbosch
Frans Weilbach [email protected]
Tel: +27 (0) 21 815 3000
PwC Worcester
Pieter Eksteen [email protected]
Marco van Tonder [email protected]
Tel: +27 (0) 23 346 5500
StellenboschUniversity
Department of Logistics Professor Johan Louw [email protected]
Tel: +27 (0) 21 808 3412
CSIR
Logistics & Quantitative Methods Dr Esbeth van Dyk [email protected]
Tel: +27 (0) 21 888 2614

www.pwc.co.za/wine-insights-survey
©2013 PricewaterhouseCoopers (“PwC”), the South African firm. All rights reserved. In this document, “PwC” refers to PricewaterhouseCoopers in South Africa, which is a member firm of PricewaterhouseCoopers International Limited (PwCIL), each member firm of which is a separate legal entity and does not act as an agent of PwCIL.
“PwC” is the brand under which member firms of PricewaterhouseCoopers International Limited (PwCIL) operate and provide services. Together, these firms form the PwC network. Each firm in the network is a separate legal entity and does not act as agent of PwCIL or any other member firm. PwCIL does not provide any services to clients. PwCIL is not responsible or liable for the acts or omissions of any of its member firms nor can it control the exercise of their professional judgment or bind them in any way.
Scan the QR code to download an electronic copy of this document.