the social environment, genetics, and obesity: …
TRANSCRIPT
THE SOCIAL ENVIRONMENT, GENETICS, AND OBESITY: EVALUATION
OF DIATHESIS-STRESS AND DIFFERENTIAL
SUSCEPTIBILITY FRAMEWORKS
by
Colin R. Pierson, B.S.
A thesis submitted to the Graduate Council of
Texas State University in partial fulfillment
of the requirements for the degree of
Master of Arts
with a Major in Sociology
December 2013
Committee Members:
Bob Price, Chair
Debarun Majumdar
Krista Howard

COPYRIGHT
by
Colin R. Pierson
2013

FAIR USE AND AUTHOR’S PERMISSION STATEMENT
Fair Use
This work is protected by the Copyright Laws of the United States (Public Law 94-553
section 107). Consistent with fair use as defined in the Copyright Laws, brief quotations
from this material are allowed with proper acknowledgment. Use of this material for
financial gain without the author’s express written permission is not allowed.
Duplication Permission
As the copyright holder of this work I, Colin R. Pierson, authorize duplication of this
work, in whole or in part, for educational or scholarly purposes only.

DEDICATION
“Don’t worry about the horse being blind,
Just load the wagon.
Sometimes the road to Easy Street
Goes through the sewer.”
v
ACKNOWLEDGEMENTS
While this document may currently exist as the culmination of my work as an
academic, my success up to this point would not be possible with the help and support of
the people that surround me. Thank you to my friends and family for their unconditional
support and understanding. A very special thank you to the faculty and staff in the
Department of Sociology at the University of Wisconsin-La Crosse, past and present,
whom plucked me from their classes and pushed me to dream bigger – your timing could
not have been any more impeccable.
The completion of this project and the successes I have had as a graduate student
could not have ever been possible if it weren’t for faculty and staff here at Texas State
University. There are too many important people to name individually, but know that
I’m truly grateful for your patience and the opportunities you have presented me with.

vi
TABLE OF CONTENTS
Page
ACKNOWLEDGEMENTS .................................................................................................v
LIST OF TABLES ........................................................................................................... viii
ABSTRACT ....................................................................................................................... ix
CHAPTER
I. INTRODUCTION ...............................................................................................1
Genetics in Sociology ..................................................................................3
II. LITERATURE REVIEW ....................................................................................7
Serotonin-Related Genes and Alleles ..........................................................8
Dopamine-Related Genes, Alleles, and Enzymes ......................................10
Metabolic Modifiers and Phenotypic Obesity ...........................................12
Social-Environmental Influences of Obesity .............................................15
III. THEORETICAL FRAMEWORK ...................................................................18
IV. RESEARCH QUESTIONS .............................................................................21
V. METHODOLOGY............................................................................................24
Data ............................................................................................................24
Variables – Dependent Measure ................................................................24
Variables – Key Independent Measures ....................................................25
Gene Alleles ...................................................................................25
Social-Environmental Variables ....................................................27
Metabolic Modifiers – Physical Activity and Eating Habits .........28
Controls ..........................................................................................29
Analysis and Procedure..............................................................................29

vii
VI. RESULTS ........................................................................................................31
VII. DISCUSSION ................................................................................................43
Weight Status and Gene Alleles ................................................................43 Gene Interaction .........................................................................................45
Sex..............................................................................................................46
Research Questions ....................................................................................48
Limitations and Future Research ...............................................................49
REFERENCES ..................................................................................................................52

viii
LIST OF TABLES
Table Page
1. Descriptive Statistics ....................................................................................................31
2. Obesity and Overweight+Obesity by MAOA Gene Alleles ........................................32
3. Obesity and Overweight+Obesity by 5-HTTLPR Gene Alleles .................................33
4. Obesity by Cumulative Risk/Plasticity Allele Measure...............................................33
5. Overweight+Obesity by Cumulative Risk/Plasticity Allele Measure .........................34
6. Logistic Regression Models Predicting Odds of Obesity and Overweight+Obesity ...35
7. 5-HTT Allele Interaction Models Predicting Odds of Obesity and
Overweight+Obesity ........................................................................................36
8. MAOA Allele Interaction Models Predicting Odds of Obesity and
Overweight+Obesity ........................................................................................36
9. Male Only Models Predicting Odds of Obesity and Overweight+Obesity .................37
10. Female Only Models Predicting Odds of Obesity and Overweight+Obesity ..............38
11. Differences in the Distribution of Only Obese Individuals with 5-HTT and MAOA
Risk/Plasticity Alleles by Education (Goodness-of-Fit Test) ..........................39
12. Differences in the Distribution of Only Obese Individuals with 5-HTT and MAOA
Risk/Plasticity Alleles by Income (Goodness-of-Fit Test) ..............................40
13. Males Only: Differences in the Distribution of Only Obese Individuals with 5-HTT
and MAOA Risk/Plasticity Alleles by Income (Goodness-of-Fit Test) ..........41
14. Females Only: Differences in the Distribution of Only Obese Individuals with 5-HTT
and MAOA Risk/Plasticity Alleles by Income (Goodness-of-Fit Test) ..........42

ix
ABSTRACT
The National Longitudinal Study of Adolescent Health (Add Health) dataset was
used to explore how newly-available genetic information can aid social scientists in
conducting studies concerned with social outcomes. A key goal of this study is to
evaluate two prominent theoretical frameworks in the area of gene-by-environment
(GxE) interaction: diathesis-stress and differential susceptibility. The diathesis-stress
model has informed nearly all behavioral gene-by-environment studies and is the
prevailing theoretical orientation among GxE scholars. Within the last decade, the
differential susceptibility framework has been advanced as a viable alternative. Using
genetic data collected during Wave IV of the Add Health study, the current study
explores how the MAOA and 5-HTTLPR gene alleles interact with known predictors of
obesity to compare and contrast the different frameworks. Results reveal that MAOA and
5-HTT do not have the same effect on obesity, especially when socioeconomic status and
gender are considered. Results also support both differential susceptibility and diathesis-
stress frameworks. Individuals with the low activity 5-HTT allele had higher rates of
obesity across all incomes. Individuals with the low activity MAOA allele had higher
rates of obesity at low incomes, but lower rates of obesity at higher incomes. These
relationships are additionally nuanced by gender. The 5-HTT finding is only significant
for females and MAOA is only significant for males. The implications for future gene-
environment studies that may wish to use MAOA and 5-HTT alleles in conjunction are
discussed.
1
CHAPTER I
Introduction
Widespread obesity is a new development in the United States, with the
emergence of the “obesity epidemic” only in the past 25 years (Burke and Heiland 2007).
The prevalence of obesity has slowly increased over time in the United States, but has
more dramatically increased since the 1980s, with current figures indicating that more
than 30 percent of Americans are now considered obese (Flegal 2005). At its most basic
level, obesity is simply excess weight individuals carry. The Centers for Disease Control
and the World Health Organization often classify obese individuals using a body mass
index (BMI) calculation, where the threshold for being overweight is 25 kg/m2 and the
threshold for obesity is 30 kg/m2
or higher.
Obesity is of particular sociological relevance because of its broad impact on
human life and interaction. Demographically, obesity and weight-related health issues
contribute to high levels of morbidity and mortality, including physical ailments such as
heart disease, hypertension, stroke, diabetes, and some forms of cancer (Black and
Macinko 2008; Flegal 2005). Culturally, obesity rates have challenged notions of
acceptable or desirable body image (Schwartz and Brownell 2004). In terms of individual
differences in social and environmental context, obesity has been linked to poverty and
food availability, access, and security (Black and Macinko 2008; Cummins and
MacIntyre 2006; Ulijaszek and Lofink 2006). Obesity rates also differ significantly
between genders and racial/ethnic groups (Belcher et al. 2010; Heitmann 2010). The
relationships between obesity and the environmental or contextual factors are of
particular interest for this study.
2
While many social factors and influences that contribute to obesity are studied by
social researchers, obesity itself is rooted in the human body and it is highly malleable. It
is vitally important amidst the obesity discussion to consider two factors that directly
contribute to differences in individual weight: physical activity and diet. Obesity itself is
simply the product of an imbalance between energy intake and energy output, so
naturally many researchers in the social and other sciences focus their studies on eating
and exercise behaviors, as well as the co-factors that affect both of these activities
(Cummins and Macintyre 2005). Food choice and eating behavior studies have found that
obesity can be the result of low-priced, energy-dense foods (Drewnowski 2004), the high
cost and/or low availability of fresh produce (Turrell et al. 2002), or the satiability
derived from eating sweets and fats (Drewnowski and Specter 2004). In terms of physical
activity, studies have linked obesity to increases in contemporary sedentary lifestyles
(Martin 2008) and limited access to recreational facilities or space to use for recreation
(Morland and Evenson 2009; Booth, Pinkston, and Poston 2005).
Traditionally academics have explored obesity using niche theories and
discipline-specific philosophy (e.g. geneticists study the impact of genes on obesity,
social researchers focus on social-environmental contributors). Obesity has been studied
extensively at the individual level, but also within families (Martin 2008), neighborhoods
(Black and Macinko 2007; Burdette and Whitaker 2003), and between countries
(Cummins and Macintyre 2005). Researcher’s choice in a particular unit of analysis is
often embedded in specific disciplines as well. While disciplinary boundaries still exist,
many of the most recent obesity related studies have found common interest in areas of

3
physiology and eating behavior, occasionally including genetics as well (Ulijaszek and
Lofink 2006).
Many of the most recent obesity studies in sociology converge at an
interdisciplinary crossroads linking obesity to the combined influence of genetic factors
(G) and environmental context (E) (Fuemmeler et al. 2009; Fuemmeler et al. 2008;
Hjelmborg et al. 2008; Martin 2008; Ulijaszek and Lofink 2006). Studies in this area
focus on the phenomenon known as gene-environment interactions (GxE). The
relationship between obesity and both its direct and indirect factors, especially when
genetic components are considered, varies greatly by the conceptualization of the
relationships between the variables.
Genetics in Sociology
After a long period of exclusion, the use of genetic factors in social research is
garnering support, and in some of the most acclaimed sociology journals. Using genetics
alongside social research is in no way a novel concept. Sociology has kept genetic
research at a distance for important reasons. Many of sociological concerns with genetics
are simply philosophical differences, but the discipline has also harbored a pervasive and
long-lasting contempt for genetics research based on a past history of gross misuse and
abuse of information, and the negligent, destructive, and faulty application of genetics as
the explanation for social differences.
Philosophically, social and biological arguments over the general understanding
of human life have been at odds for much of human history. The debate is commonly
referred to as the “nature versus nurture” argument: whether social forces or biology have
greater effect on an individual’s life course. While the debate is no longer as volatile as it

4
once was, rigid disciplinary boundaries still exist (Bearman 2008; Diez Roux 2006;
Freese 2008).
The most significant reason social scientists remain averse to biological and
genetic arguments concerning human nature. Early geneticists used newfound genetic
information as justification for additional research that resulted in heinous violations of
human rights, including the use of forced sterilizations and barbaric medical experiments.
Paired with interpretations and implications of early “social” research and theory, like
Social Darwinism, this specific school of scientific thought also birthed the eugenics
movement the Nazi’s would embrace. Despite the global reaction to eugenics, American
scientists continued egregious human experimentation for decades, notably the infamous
Tuskegee syphilis experiments. Revulsion at this and other similar studies, once again
justified in the name of scientific progress, spurred ethical reform among scientists
regarding human research methods and practice. The practical implications of this reform
resulted in much more rigorous standards and guidelines for conducting research with
human subjects, but the reform’s most significant impact was a change in the perception
of medical research.
The atrocities carried out by early medical researchers and biologists have left a
lasting impression among social scientists. Yet many of the ideas that fueled these
movements have been appropriately retired. Genetic determinism for instance, the notion
that genetic makeup is the sole contributing factor to individual differences and
outcomes, heavily influenced scientific research for beginning in the late 19th
and early
20th
centuries (Simons et al. 2011; Martin 2008). This framework has been entirely
discredited, and researchers are beginning to understand how important the

5
environmental context is to an individual and their genes. As Simons et al. (2011)
explain: “Evidence is overwhelming that human beings are never simply instructed by
their genes to show a particular trait or behavior…genes are turned on (i.e., expressed)
and messages they transcribe vary depending on environmental circumstances (883).”
Interest in genetics has increased over time among researchers and the public at
large. The completion of the Human Genome Project and the launch of a number of new
genome sequencing and decoding projects, like the 1000 Genomes Project, have brought
genetics to the forefront of sociological conversations (Via, Gignoux and Burchard 2010;
Freese 2008). Sociologists are once again confronted with genetics and their purpose and
place within social research.
In the last decade, many social researchers have proposed ways to assimilate this
new information. Social science research serves to benefit from the inclusion of genetic
information in research studies in a variety of ways. It’s important to understand that the
context of the gene-environment discussion has dramatically changed. Genetic
determinism has been abolished and the genetic discussion has instead turned into an
exploration and evaluation of genetic-environmental effects arguments (Freese and
Shostak 2009). Research that places genes into social context is a rapidly developing area
of multidisciplinary study, where different studies explore this interplay with regard to
outcomes such as aggression (Simons et al. 2011), depression (Fuemmeler et al. 2009),
sexuality (Guo, Tong and Cai 2008), and obesity (Fuemmeler et al. 2009; Fuemmeler et
al. 2008; Hjelmborg et al. 2008; Martin 2008; Ulijaszek and Lofink 2006).
Genetic data has been integrated into a variety of datasets that are popular among
social researchers, including the National Longitudinal Study of Adolescent Health (Add
6
Health) and the National Health and Nutrition Examination Survey (NHANES). Social
researchers no longer have the excuse that genotype information is not available. Use of
genetic variables has the potential to increase our accuracy in explaining relationships
and would allow sociologists to enter into the broad, interdisciplinary discussion of
genetics. We have been given another tool to aid in the process of developing a more
thorough understanding of social relationships and the opportunity to produce findings
that are acknowledged and reputable across disciplines.

7
CHAPTER II
Literature Review
Genes represent specific parts of the human genome that contribute to the
physiological creation of the human body and control bodily functions. Genes can be
polymorphic, or have structures that differ slightly between individuals. Each of the
possible variations of a gene is known as an “allele” and the alleles are caused by
differences in the genetic code sequence within genes (Simons et al. 2011). The genetic
code is comprised of nucleotide base pairs (bps), where the four possible bases are
adenine (A), cytosine (C), guanine (G), and thymine (T), although uracil (U) takes the
place of thymine in RNA sequences. In the typical double helix DNA structure, guanine
pairs with cytosine and adenine pairs with thymine.
These pairs appear in a variety of forms, or are organized in a variety of ways,
within genes. One particular genetic variation occurs when a set of base pairs is repeated,
known as a Variable Number Tandem Repeat (VNTR). The different gene variations
based on VNTRs are referred to in the literature as insertion/deletions, where a gene may
have additional base pairs (insertion) or may be missing pairs (deletion) when compared
between different people. VNTRs can alter various aspects of gene function depending
on where the VNTR is located in the code sequence, particularly if the VNTR is located
within the promoter region of the code (Simons et al. 2011). The promoter regions are
important because they control gene transcription, or the expression of the gene.
Variability in the promoter region of serotonin-related genes, for example, can affect the
magnitude and duration of the serotonin transportation synapse (Sookoian, Gemma and
Garcia 2007).

8
Genetic research has linked a wide variety of genes to obesity, including those
responsible for serotonin transportation. The 2005 Human Obesity Gene Map found
significant associations with 127 candidate genes, although consistent findings occurred
with only 22 of these (Fuemmeler et al. 2008). The vast majority of genetic obesity
studies focus on genes that affect the function of serotonin and dopamine systems in the
brain. There are specific genes associated with each system: serotonin (SLC6A4,
SLC6A14), dopamine (SLC6A3, DRD2, DRD4) and the enzymes that metabolize both
serotonin and dopamine (COMT, MAOA, MAOB) (Fuemmeler et al. 2009; Fuemmeler
et al. 2008; Need et al. 2006; Camarena et al. 2004). The related hormones regulate
metabolic and eating behaviors (as well as others), which in turn affect obesity
(Fuemmeler et al. 2008). More specifically, certain alleles allow the gene to transcribe
serotonin or dopamine more or less efficiently than others.
Serotonin-Related Genes and Alleles
Serotonin is a neurochemical associated with changes in an individual’s mood,
especially pleasure. Genes associated with serotonin include SLC6A14, which affects
serotonin synthesis, and SLC6A4, which affects the serotonin transporter. Researchers
found SLC6A14 to be significantly associated with obesity in two studies (Durand et al.
2003), but these findings have not been replicated. Many other studies instead focus on
SLC6A4 alleles (Simons et al. 2011; Fuemmeler et al. 2009; Guo et al. 2008; Sookoian et
al. 2008).
The serotonin SLC6A4 gene is of particular interest in this study, especially
alleles in the transporter region of the gene known as 5-HTT. The 5-HTT polymorphism
is an allele with a 43-base pair (formerly thought to be a 44-base pair) insertion/deletion
9
on the promoter region of the SLC6A4 gene, meaning that there are short and long
variations of the gene based on the number of sequence repeats (Harris et al. 2013). 5-
HTT is the key regulator of transmission of serotonin in the brain (Simons et al. 2011).
The group of alleles located in the transporter region of this gene are known as 5-
HTTLPR.
Individuals inherit two copies of this gene, one from each parent, and can have a
combination of two long alleles (L/L), two short alleles (S/S), or one of each (L/S). The
vast majority of individuals have either a 14-repeat (14R) or 16-repeat (16R) sequence,
where 14R is considered the short allele and 16R is the long allele. There are rare cases
where individuals have extra-long sequences, comprised of 18, 20, or 22 repeats, but this
information is relatively new and the effects of these gene variations has not been
thoroughly studied.
Research on 5-HTTLPR alleles focus on a variety of behaviors and disorders as a
result of serotonergic function, including mood disorders like depression and anxiety
(Fuemmeler et al. 2009; Caspi et al. 2003), antisocial behavior (Lyons-Ruth et al. 2007),
aggression (Simons et al. 2011), as well as physiological functions such as sleep and
memory (Lucki 1998). The serotonergic alleles, including 5HTTLPR, also affect satiety
to some extent, although the genes that regulate dopamine largely control those feelings.
Studies have shown that presence of the short allele in any variety (either in a S/S
homozygous or a L/S heterozygous pair) transcribes serotonin less efficiently than
homozygous L/L alleles, and the short variations of the gene are significantly associated
with risk of overweight or obesity (Fuemmeler et al. 2008; Sookoian et al. 2008;
Sookoian et al. 2007). Sookoian et al. (2008) and Sookoian et al. (2007) compared

10
individuals with any short alleles to individuals with homozygous long alleles and found
that the presence of a short allele significantly increased the odds of being obese between
from 36% to 85%. Fuemmeler et al. (2008) found that the effects of a short allele varied
by sex, where the odds of being obese for males was significantly higher than females.
The shorter variations of the serotonin transporter are linked to higher rates of obesity,
although nuances based on gender in particular exist. In general, the effects of the 5-
HTTLPR short allele on obesity were consistent across cultures, with study populations
derived from both the United States and Argentina. In addition, studies using different
obesity measurement (both BMI raw scores and BMI z-scores) produced similar results.
Dopamine-Related Genes, Alleles, and Enzymes
While serotonin affects mood and can, in turn, alter eating behaviors, dopamine
regulates the eating behavior itself. Researchers have analyzed various alleles associated
with dopamine regulation, including those that affect dopamine-related enzymes (COMT,
MAOA, MAOB), the dopamine transporter (SLC6A3), and the dopamine receptor D2
(DRD2, DRD4) (Fuemmeler et al. 2008; Need et al. 2005). Each gene has a substantial
impact on the amount of dopamine available in the brain, altering feelings of hunger and
satiety.
Dopamine-related studies of obesity and genetics have produced mixed results.
While studies including the transporter SLC64A, receptors DRD2 and DRD4, and the
enzyme COMT have not consistently substantiated a relationship with obesity, the MAO
alleles, specifically MAOA, continue to be significantly associated with overweight and
obesity (Fuemmeler et al. 2009; Fuemmeler et al. 2008; Need et al. 2005; Camarena et al.
2004). The differences between MAOA and MAOB are slight. Monoamine oxidase A
11
(MAOA) is a gene that produces an enzyme that metabolizes a variety of neurochemicals,
including dopamine, serotonin, and noradrenaline (Fuemmeler et al. 2008). MAOB only
metabolizes the dopamine neurotransmitter. Only MAOA alleles have been consistently
associated with obesity, potentially due to their role in metabolizing serotonin (Need et
al. 2005).
MAOA gene alleles are also described by insertion/deletions. The 30-base pair
sequence is commonly seen in 3, 3.5, or 4 repeat varieties, where the long alleles (3.5 and
4 repeat) transcribe up to 10 times more efficiently than the short (3 repeat) alleles (Need
et al. 2005; Sabol, Hu, and Hamer 1998). Less common are 2 or 5 repeat alleles, and
studies analyzing these variants have so far been inconclusive (Need et al. 2005). Similar
to 5-HTT short alleles, MAOA short alleles are also associated with higher rates of
obesity.
While genes that produce and regulate serotonin and dopamine are most widely
used in obesity studies, only those alleles related to serotonin have consistently predicted
risk for obesity in past research – not dopamine. This suggests that obesity is potentially
linked to the pleasure derived from eating as opposed to feelings of hunger satiety. The
SLC6A4 gene and its alleles control the transportation of serotonin. While both MAOA
and MAOB produce enzymes that metabolize a variety of neurochemicals, only MAOA
produces those which metabolize serotonin. In both cases, gene alleles with low
efficiency (slow transportation and slow metabolism of serotonin) are both linked to an
increased risk of obesity. Slow metabolism and transportation of serotonin would extend
or prolong the pleasurable feelings derived from eating
12
It is important to note that the vast majority of these studies frame gene alleles as
inherent individual components that affect susceptibility to, or risk of, obesity, not
necessarily causes that determine obesity itself. This highlights the role social and
environmental contexts play on the development of obesity within individuals. There is a
substantial body of literature outside of obesity studies that focuses on these particular
alleles and social-environmental relationships. Caspi et al. (2002) found that MAOA
moderates the relationship between children’s maltreatment and their tendency to develop
violent behaviors. In a similar study, Simons et al (2011) found that presence of the 5-
HTTPLR short allele (and its interaction with a long allele DRD4) moderates the
relationship between social environments, hostile life orientations, and aggressive
behavior. Gene-by-environment studies have shown that genes play an important,
although nuanced, role in many of the relationships social researchers study.
Metabolic Modifiers and Phenotypic Obesity
In obesity research, genetic predispositions may increase the odds that an
individual is obese, but there are a host of additional factors that have a much more direct
influence. Many studies seek to determine obesity risk factors that actually function
through differences in eating habits and levels of physical activity as opposed to having a
direct influence on obesity (Black and Macinko 2008; Stafford et al. 2007). These studies
address the observable, phenotypic expressions of obesity and propose solutions – eating
healthier and exercising more – as a way to promote health and change how people look.
Diet and physical activity have a relatively direct and immediate impact on individual
obesity, making these factors important in obesity research.

13
In terms of diet, researchers have studied types of food, the quantity of food eaten,
and the frequency of meals as indicators of obesity, with the assumption that fresh foods
and a balanced eating schedule help to reduce obesity (Stafford et al. 2007). From a
physiological standpoint, reducing the amount of calories consumed by substituting lower
calorie fresh foods for high carbohydrate, high fat foods is likely to reduce percentage
body fat, individual weight, and ultimately rates of obesity.
Researchers have explored how eating and dieting behavior is affected by various
individual level factors, including depression (Appelhans et al. 2012), mood/anxiety
disorders (Bodenlos et al. 2011), and existing health conditions, such as diabetes (Blazer
et al. 2002). While the physiological effects of each of these conditions affect eating
behaviors directly, medications prescribed to treat these conditions also alter feelings of
hunger and satiety (Bodenlos et al. 2011). The relationship between mental health
conditions, obesity, and diet are complicated by the use of medication. Results are mixed,
indicating that diet may (Appelhans et al. 2012) or may not (Beydoun and Wang 2009)
mediate the relationship between depression and obesity.
Physical activity directly affects obesity by increasing the amount of calories
burned. Many studies focus on obesity rates among adolescents because physical activity
is often regimented through school and relatively standard among age groups (Harris et
al. 2009). Physical activity for adolescents is a requirement for most students (physical
education classes) and a wide variety of sports or physically demanding extracurricular
activities are generally offered to students through their schools as afterschool programs.
Because physical activity is so structured for adolescents, policy changes and
implications are relatively straightforward.

14
Studies that explore the physical activity and obesity relationship among
adolescents often incorporate many of the same predictors that are used in diet studies
(Appelhans et al. 2012; Beydoun and Wang 2009; Dockray, Susman, and Dorn 2009;
Brosnahan et al. 2004). Many of the physical activity studies have been carried out by
researchers using large datasets, clinical trials, and experimental/control groups
comparisons. Not all studies, however, have found physical activity to be a significant
factor in the obesity/depression relationship however (Dockray et al. 2009).
Many of the studies that include diet also include physical activity. Both factors
alter caloric intake immediately and directly affect an individual’s weight and obesity
classification. Statistically, both diet and physical activity are often included as mediators
between key independent variables and the obesity outcome (Appelhans et al. 2012;
Davis and Cooper 2011; Beydoun and Wang 2009).
Because obesity is a condition that is physically apparent, body image and
individual self-concept become important issues and are often the topic of sociological
and psychological obesity research (Schwartz and Brownell 2004). Western culture has
idealized thinness and stigmatized individuals with excess weight. The effects of body
image dissatisfaction are emotional, biological, and physiological changes that can lead
to increased eating (Schwartz and Brownell 2004). Schwartz and Brownell (2004)
explain that meta-analyses indicate that the first generation of body image studies found a
large statistical effect size between obesity and body image, although new body image
studies have begun to specify risk factors more clearly.

15
Social-Environmental Influences of Obesity
Underlying the issues of diet and physical activity are the social-structural issues
that inform these specific behaviors. Much of the obesity literature focuses on the “built
environment” that an individual is placed within and how aspects of that environment
influence obesity rates between populations (Black and Macinko 2008; Booth et al.
2005). The social-structural factors that influence individual diet and eating habits
include parental eating habits (Martin 2008), peer group eating habits (Cohen-Cole and
Fletcher 2008), availability of food (Morland and Evenson 2009; Black and Macinko
2008), and a wide variety of additional environmental factors (Booth et al. 2005).
Socioeconomic status (SES) plays an important role in these studies because there is a
clear link between individual income, neighborhood poverty rates, and obesity (Beydoun
and Wang 2010; Chang and Lauderdale 2005). Even after controlling for individual SES,
studies have consistently found a relationship between living in poor neighborhoods and
higher rates of obesity (Morland and Evenson 2009).
Studies that seek to establish a relationship between environmental contexts and
obesity often use neighborhoods as the unit of analysis instead the individual, and
conduct analyses using Census data in conjunction with additional aggregated data
(Booth et al. 2005). Neighborhoods affect both eating and exercise habits in a variety of
ways. Availability of food, especially fresh food from grocery stores, has a significant
association with obesity rates. Studies show healthy foods in poor neighborhoods are less
readily available and more expensive than in wealthier communities (Cummins and
Macintyre 2006). Some researchers have found that poor neighborhoods in urban
settings, where large supermarkets are rare and instead replaced by small family-owned
16
groceries, generally have a limited selection of food that is also more expensive
(Morland, Diez-Roux, and Wing 2006). Places with limited access to healthy food are
known as “food deserts.” Food deserts are present in both extremely urban and
extremely rural settings, although the term is primarily associated with urban settings
(Morton and Blanchard 2007).
Type and quality of neighborhood can also directly impact physical activity rates.
Neighborhood factors associated with physical activity include perceived safety (Burdette
and Whitaker 2003), presence of sidewalks (Giles-Corti et al. 2003), perceived
walkability (Saelens et al. 2003), and population density (Ewing et al. 2003). The
physical structures that make up the built environment innately promote or inhibit
physical activity based on the city’s design, appearance, and layout (Black and Macinko
2008). Densely populated areas often require an efficient land use strategy, where
physical space for leisure activities is scarce. These areas often have limited amenities
and green space, which also serve as deterrents to physical activity (Black and Macinko
2008).
Socioeconomic status (SES) is particularly important because of its direct and
indirect effect on individual physical activity and diet. While some studies find
significant relationships between obesity and neighborhood structures independent of
individual SES (Morland and Evenson 2009), most researchers agree that there is a
significant link between neighborhood type and individual income level, occupation, and
educational attainment (Beydoun and Wang 2010; Black and Macinko 2009; Chang and
Lauderdale 2005). With healthier food sometimes available only at higher prices in urban
17
settings, SES directly affects obesity rates by limiting residents to inexpensive but high-
calorie, high-fat foods (Bowman and Vinyard 2003).
While eating habits and physical activity directly affect obesity through caloric
intake and expenditure, an individual’s tendency to be physically active or eat healthy are
often guided by much less apparent social forces. The physical environment and
neighborhood an individual lives in limits the scope of available activities and food
choice, all of which is also attributed to socioeconomic status. Among adolescents, the
role the parents serve in creating the immediate environment for their children is an
additional component to the built environment (Martin 2008). Adolescent obesity
researchers have found strong connections between parents’ and children’s food choices,
eating frequency, leisure time activities, and rates of physical activity (Martin 2008).
Socioeconomic status is a critically important predictor when studying obesity
because of the breadth of its influence on individual obesity rates. It can be used to
approximate a variety of differences between individuals that affect physical activity and
eating habits, two factors that have the most direct and immediate effect on obesity. This
study will explore obesity using socioeconomic status as a focal point, but it seeks also to
determine the extent to which genetic predispositions influence obesity.
18
CHAPTER III
Theoretical Framework
The vast majority of gene-by-environment studies seek to explain the extent to
which particular gene variants magnify the relationships between environmental factors
and various outcomes (Freese 2008). These gene variants have been predominantly
conceptualized as “risk alleles,” genetic variations that increase an individual’s
vulnerability to environmental influence (Simons et al. 2011). Recent research, however,
has sought to reshape the theoretical relationship between genes (as risk alleles) and
various outcomes by instead conceptualizing genes as “plasticity alleles,” gene variations
that increase an individual’s susceptibility to environmental influence (Belsky et al.
2009). The difference is subtle, but important.
Genetic vulnerability means that individuals with risk alleles are prone to
succumbing to negative outcomes given a negative social environment. This model has a
variety of names, including the diathesis-stress model (by psychiatrists) and the
transactional or dual-risk model (by developmentalists) (Belsky and Pluess 2009). The
diathesis-stress model has informed virtually all psychiatric research and been the
predominant orientation of genetic researchers working in gene-by-environment studies
(Belsky et al., 2009). To some extent the diathesis-stress model had not been thoroughly
explored simply due to the tendencies of researchers to focus on negative outcomes. In
other words, “vulnerability” adequately explained research findings and lent itself well to
policy discussions about individuals experiencing negative outcomes.
In 1997, Jay Belsky proposed the notion of differential susceptibility, an
expansion of the vulnerability framework. Differential susceptibility is the notion that

19
some individuals have inherent predispositions either to amplify or buffer the effects of
environmental influences on outcomes depending on the characteristics of an individual’s
environment (Belsky and Pluess 2009). Both vulnerability and susceptibility theories
agree that individuals with risk alleles in negative environments have negative social
outcomes, but differential susceptibility would also suggest that those in positive
environments also have more positive social outcomes as well. Applying differential
susceptibility in the case of the obesity, individuals with specific serotonin and dopamine
transporter gene alleles may be either at a greater risk of obesity if the social-
environmental conditions that promote obesity are present or at a further decreased risk if
the conditions are favorable for deterring obesity.
Belsky et al. (2009) have cited numerous studies that validate differential
susceptibility theory in opposition to the prevailing diathesis-stress model, one of which
is particularly relevant to this study. Simons et al. (2011) used the DRD4 and 5-HTT
gene alleles to explain how differential susceptibility informs individual differences in
feelings of aggression. Here the low-activity serotonin transporter allele (short allele 5-
HTT) is linked to changes in psychological function, including increased antisocial
behavior leading to a propensity to engage in aggressive behavior in an adverse
environment and decreased aggression in favorable social environments.
One goal of the current study is evaluate both differential susceptibility and
diathesis-stress models using obesity as an outcome variable and various gene alleles as
risk/plasticity factors. Socioeconomic status, measured using educational levels, is
anticipated to be an important predictor of obesity. Exploring the interaction between
socioeconomic status and serotonin-related gene alleles and their effects on obesity will

20
help to further distinguish the nature of genetic predispositions and contribute to the
growing theoretical discussion.
21
CHAPTER IV
Research Questions
The research questions to be addressed in this study are:
1. How can genetics be incorporated in social research and tested statistically?
2. Does the incorporation of MAOA and 5-HTT plasticity/risk alleles into models
significantly aid in the understanding of obesity and its predictors?
3. Do MAOA and 5-HTT gene alleles relate to obesity in the same way?
4. Does the relationship between obesity, socioeconomic status, and either gene
allele lend itself to differential susceptibility and/or diathesis-stress frameworks?
The overarching goal of this study is creating a more parsimonious model of
obesity for future social research. Sociological research predominantly focuses on the
effects of social and environmental stressors on outcome. The goal at present is to
develop a better model by including genetic variables that are already studied outside of
sociology. The relationship between obesity and both the genetic and social-environment
variables have been previously established in a broad field of interdisciplinary literature,
but they are not often combined and analyzed together.
The sociological focus on the built environment is vitally important to obesity
literature. Neighborhoods can promote or inhibit physical activities and control access to
food type and quality based on land use, city design, urban sprawl, degradation, wealth,
and safety. Wealth, denoted by individual socioeconomic status in this case, is often the
key characteristic that distinguishes neighborhoods from one another, because it serves as
a proxy for many of the additional factors.

22
Figure 1. Potential relationships between predictors and obesity outcome (adapted from
Freese 2008). “E” indicates environmental factors. “G” indicates genetic traits and
characteristics. “PA” and “D” stand for physical activity and diet respectively.
The first research question is an important starting point for gene-by-environment
studies. Figure 1 suggests four possible orientations to use for exploring the relationships
between factors associated with obesity. Each model has practical implications when it
comes to determining the specific type of analysis used to explore obesity. Models 1, 2,
and 3 can all be tested using various statistical procedures. Model 4 depicts an important
relationship that researchers must also consider after analyses have been performed.
Researchers too often focus on their specific predictors of interest and do not adequately
acknowledge the potential influence of unobserved variables (Freese 2008). Model 2,
depicting obesity as the outcome of a series of intervening factors through a single
(1) Independent additive causes
(2) Single cause through pathways
(3) Interaction and multiple causes
(4) Confounding causes

23
pathway, would require a path analysis technique (or more likely structural equation
modeling due to latent constructs). The current study will test and evaluate Model 1 and
Model 3, which can be done using regression techniques.
The second and third research questions regard the role MAOA and 5-HTT alleles
play in the more broad obesity context. It is anticipated that both the MAOA and 5-HTT
low-activity (short) alleles will be associated with higher rates (or odds) of obesity and
overweightness, but the exact relationship is yet to be determined. Previous research has
established significant links between both alleles and obesity, but recent research has
provided additional insight into the subtle nature of gene interaction. Harris and
colleagues (2013) explain that additive gene models (such as Model 1) are at odds with
much of what the most current genetic studies have uncovered. Such designs should
hypothetically fail to find a significant relationship between gene alleles and outcome
variables outright because the nature of gene-by-environment interactions should be
nuanced (Harris et al., 2013). Statistically significant associations between genes and
outcomes like obesity may actually be attributed to a spurious relationship driven by
unobserved variables, (Model 4) an important consideration that researchers must make
when working with genetic variables (Freese 2008).
The final research question is an evaluation of both prevailing theories in gene-
by-environment studies, diathesis-stress and differential susceptibility. The evaluation
will focus on socioeconomic status to see if individuals with low activity plasticity/risk
alleles have higher obesity rates among low SES (relative to those without the alleles),
lower obesity rates when SES is high (relative to those without the alleles), or both.

24
CHAPTER V
Methodology
Data
This study employs various statistical techniques to better understand the
relationship between social-environmental factors, genetics, and obesity among adults.
The research questions will be tested using data from the National Longitudinal Study of
Adolescent Health (Add Health). The Add Health study is a longitudinal cohort study
conducted by the University of North Carolina at Chapel Hill. The study population is a
nationally representative sample of over 20,000 individuals who were in grades 7 to 12
during 1994-95 in the United States.
The longitudinal cohort completed in-home interviews at four different time
points (Wave I: 1994-95, Wave II: 1995-96, Wave III: 2001-02, and Wave IV: 2007-08).
In addition to the in-home interview portion of the study, a variety of supplemental data
were collected at each wave. At Wave III, a saliva sample used for DNA analysis was
collected from a sub-sample of individuals identified as twins or full siblings at earlier
waves. At Wave IV, the majority of remaining Add Health participants submitted DNA
for genotyping. Analysis for this study is based on the Wave IV data (N=15,701).
Variables – Dependent Measure
The dependent variable is obesity, indicated using a BMI score calculation
(weight in kilograms divided by height in meters squared). The standard definition and
official classification of “obese” according to the Center for Disease Control and the
World Health Organization is a raw BMI score of 30 kg/m2 or above. This study will
employ the BMI raw score measurement. The final obesity measure is dichotomous,

25
coded (0) normal weight (<30 kg/m2) and (1) obese (≥30 kg/m
2). Analysis will also
explore how predictors function using a dichotomous “overweight + obesity” variable as
well using a BMI of 25 kg/m2 or above as a cutoff point.
Variables – Key Independent Measures
Gene Alleles
Genetic data were collected and analyzed using respondent’s saliva.
Polymorphisms within five candidate genes were identified using a buccal sampling and
DNA extraction procedure, where the salivary buccal cells containing DNA were isolated
and genotyped (Harris et al. 2006). Included in the five genes are two of the
polymorphisms described earlier that are particularly relevant to obesity: a 43-basepair
insertion/deletion polymorphism (5-HTTLPR) in the promoter of the serotonin
transporter (SLC6A4), and a 30-basepair VNTR polymorphism in the promoter of the
monoamine oxidase A (MAOA) gene. Both of these genes will be used in obesity
analysis independently, but also in conjunction as a single cumulative plasticity allele.
Both the MAOA and 5-HTT variables will be created using framework
established in previous research (Fuemmeler et al. 2008; Hu et al. 2005; Sabol et al.
1998). The MAOA alleles will be classified into two groups: low activity (3 repeats of
the 30-bp sequence) and high activity (3.5 or 4 repeats). MAOA is a sex-linked gene
allele located on the X-chromosome, meaning that males only have a single copy while
females have two. To be considered in the low activity MAOA group, individuals must
have any short allele (S for males, S/S or S/L for females). The final MAOA variable is
coded (0) high activity (having only long alleles) and (1) low activity (having any
combination of short alleles).

26
The 5-HTT polymorphism will consist of three classifications based on short or
long lengths of alleles: S/S, S/L, and L/L. The 5-HTT short alleles are the gene
variations with 14 repeats of the 43-bp sequence whereas the long alleles have 16 repeats.
As previously mentioned, extra-long alleles were also genotyped (anywhere from 17 to
22 repeats) but insufficient information exists as to the role and function of these gene
variations. An extremely small portion of the sample was found to possess any extra-long
5-HTT alleles (N=116), so these individuals were excluded from the analysis. Both males
and females inherit two copies of the gene. The categories will be regrouped in a process
similar to that in the process of creating the MAOA variable, where low activity 5-HTT is
defined as the presence of any short allele combination and high activity is the presence
of only long alleles. The final 5-HTT variable is coded (0) high activity (L/L only) and
(1) low activity (S/S or S/L).
Low activity MAOA and 5-HTT alleles have been associated with higher rates of
obesity in past research (Fuemmeler et al. 2009; Fuemmeler et al. 2008; Need et al. 2005;
Camarena et al. 2004). It is this particular variation of the gene that is referred to as the
risk/plasticity (R/P) allele. Using the traditional diathesis-stress model, these low activity
alleles are risk alleles. In the case of obesity, these alleles would be exacerbating only the
negative effects of an individual’s environment, and in turn, increasing risk of obesity. In
terms of differential susceptibility, the low activity allele is a plasticity allele and may be
responsible for both increased risk of obesity (given an obesity-prone environment) and a
decreased risk of obesity (given an obesity-deterring environment).
27
Social-Environmental Variables
The relationship between socioeconomic status and obesity is well established. It remains
one of the most important predictors of obesity in sociological obesity studies, and it is
the key predictor of obesity in this study as well. Socioeconomic status is generally
denoted by some combination of income, education, and/or occupational measures. A
variety of composite indices have been created to best measure this concept, such as
Duncan’s index (occupation by income/education), material deprivation, and the Living
Conditions Index (see Fotso and Kuate-defo 2005 for a full discussion of socioeconomic
measures). One difficulty of creating SES indices is the combination of multidimensional
variables. There is a general lack of consensus on how to weight and aggregate measures,
which in turn produces a wide range of personalized measures, each very different from
the next (Krishnan 2010).
Using income and education variables, a generic SES composite measure was
initially created. The first issue with this particular measure was the combination of
different levels of measurement. Education is not technically continuous, but is instead
grouped into 13 brackets ranging from less than 8th
grade education to post-bachelor’s
professional degree. The measure was simply the summation of both variables after each
had been standardized (using z-scores). Unfortunately the standardized education and
income measures did not converge well. While there was a significant correlation
between measures, it was very weak (r = .174) and the composite measure itself had very
weak reliability (Cronbach’s α = .297). Both income and education were included in
logistic regression models, but used separately and without standardization or
modification. In goodness-of-fit analysis, education and income were recoded into
28
grouped variables: education based on practical cut points (i.e. highschool, associate’s
degree, college graduate, etc) and income based on quintiles.
Metabolic Modifiers – Physical Activity and Eating Habits
Physical activity was based on a self-reported recollection of the activities
individuals engaged in over the course of the previous week. The 7-day recall
methodology is a standardized method of measuring physical activity that has been used
and validated in many large-scale studies (Nelson et al. 2006). Godin and Shepard (1985)
created a specific questionnaire to be used for the purpose of physical activity analysis
using 7-day recall and measuring energy output. Activities, such as running, yoga, or
playing particular sports, are filtered into groups based on the amount of energy expended
in each activity. In the end, all activities are reclassified as being strenuous, moderate, or
mild forms of exercise. Each category is assigned a specific metabolic equivalent (MET)
value used to approximate how many calories were spent through physical activity: 9
METs for strenuous, 5 METs for moderate, and 3 METS for mild (Godin and Shepard
1985) .
Add Health contains eight questions that ask respondents about physical activity
habits in a 7-day recall format. Each group was assigned a MET value and an index was
created through summation of all measures. The resulting leisure-time activity scale was
continuous, with values ranging from 0 to 301. Three categories were created from the
scale based on the individual’s level of activity (related to health benefits): low,
moderate, or high. Two dummy variables (low activity and moderate activity) were
created, using high activity as a reference category simply due to most individuals
indicating that they engage in high amounts of physical activity.

29
Very few questions inquired about respondent’s eating habits in Wave IV of the
Add Health study. Only one question was relevant to this study, and it asked individuals
to recall how on how many occasions they had eaten fast food in the past week. Other
eating measures included frequency of soda and/or diet soda consumption; however these
were not included for this analysis. Only the fast food measure will be used for this study.
Controls
Both sex and race/ethnicity were controlled for in this study, with females and
those who identified as white non-Hispanic as reference groups. In addition,
neighborhood type was also controlled for (rural, suburban, or urban). The physical
environment has proved important in past obesity studies and will be accounted for here
as well (Black and Macinko 2008; Burdette and Whitaker 2003).
Analysis and Procedure
The Add Health sample was the product of a stratified random sampling
technique that used 80 clusters based on region, urbanicity, school size, school type, and
racial/ethnic composition to obtain a representative sample (Chantala and Tabor 1999).
This cluster sampling survey method selected individuals with an unequal probability of
selection. To ensure that the sample and analysis results remain representative,
researchers working with Add Health data must use multiple sample weights (individual,
region, and cluster). Software packages like SPSS and SAS are unsuited for analyses runs
using multiple weights. Using these more common software packages would result in
biased estimates (Chantala and Tabor 1999). Stata (v.12) was used for this study as it
allows for the use of multiple weights (Chantala and Tabor 1999).

30
Analysis began with a univariate analysis of all study variables. Bivariate
analyses, focusing on relationships between obesity, socioeconomic status, and gene
alleles, will then help to establish preliminary relationships between our outcome
measure and predictors of interest. The core of the analysis will be conducted using a
binary logistic regression technique predicting the odds of obesity among study
participants. Use of interaction terms will also be employed in an effort to capture the
nuanced gene-by-environment relationship that is anticipated. Lastly, chi-square
goodness-of-fit tests will be used to see how the distribution of obese individuals into
socioeconomic status groups varies based on risk/plasticity alleles.

31
CHAPTER VI
Results
Table 1. Descriptive Statistics Percentage/Mean S.E. Variable n
Controls: Male 50.7% --- 14,800 White (reference) 67.1% --- 14,408 Black 15.4% --- 14,408 Hispanic 12.3% --- 14,408 Asian 3.0% --- 14,408 Multiracial 1.8% --- 14,408 Neighborhood: Suburban (reference) 45.1% --- 12,803 Urban 32.6% --- 12,803 Rural 22.4% --- 12,803 Socioeconomic Status: Income $34,593 911.87 14,066 Education 5.53
.086 14,796 Physical Activity and Diet: High activity (reference) 49.5% --- 14,780 Moderate activity 15.3% --- 14,780 Low activity 35.2% --- 14,780 Fast food frequency (week) 2.36 .062 14,720 MAOA Gene: Low activity (R/P) allele 49.5% --- 13,590 5-HTTLPR Gene: Low activity (R/P) allele 66.5% --- 13,978 Obesity (≥30kg/m
2):
Obese 31.9% --- 14,568 Overweight+Obesity (≥25kg/m
2):
Overweight+ 63.8% --- 14,573
Descriptive statistics in Table 1 indicate that demographically the sample is
evenly split male and female, and over two-thirds of the population identify as white non-
Hispanic. Most respondents live in suburban neighborhoods (45.07%), followed by urban

32
Table 2. Obesity and Overweight+Obesity by MAOA Gene Alleles
MAOA Alleles
Low Activity (R/P) High Activity (No R/P)
(0) Not Obese 67.21% 69.12%
(1) Obese 32.79% 30.88%
Differences between low activity and high activity for obese: 2 = 5.6572; F=3.117 (p < .10)
(0) Not Overweight 35.90% 35.30%
(1) Overweight 64.10% 64.70%
Differences between low activity and high activity for overweight: 2 = 0.6130 (not sig)
residential (32.58%) and then a rural setting (22.35%). In terms of socioeconomic status,
average income for respondents is about $35,500 annually and average education (5.53)
falls midway between the (4) and (5) groups: some college/completion of an Associate’s
degree and college graduate. Nearly half of all respondents reported engaging in vigorous
physical activity, although 35% of the remaining individuals reported little to no activity
at all. On average, respondents ate out at fast food restaurants about twice per week.
A large change in the proportion of people who are classified as obese versus
overweight is apparent here as well. A substantial majority of respondents are considered
overweight (63.84%) whereas only about 32% are considered obese, meaning that nearly
a third of all individuals fall between the 30 kg/m2 and 25 kg/m
2 BMI thresholds. The
sample is evenly split for low activity (risk/plasticity) and high activity MAOA alleles,
although two-thirds of the sample possess the 5-HTT risk/plasticity allele.

33
Table 3. Obesity and Overweight+Obesity by 5-HTTLPR Gene Alleles
5-HTT Alleles
Low Activity (R/P) High Activity (No R/P)
(0) Not Obese 67.79% 68.11%
(1) Obese 32.21% 31.89%
Differences between low activity and high activity for obese: 2 = 0.1370; F=0.087 (not sig)
(0) Not Overweight 36.12% 35.79%
(1) Overweight 63.88% 64.21%
Differences between low activity and high activity for overweight: 2 = 0.1447; F=0.054 (not sig)
Table 3 reveals that the association between the 5-HTT risk/plasticity allele and
both overweight and obesity weight classifications is not significant. Table 2 however
indicates that the relationship between MAOA risk/plasticity alleles and obesity is
marginally significant however (p<.10) and in the anticipated direction. Individuals with
the MAOA risk/plasticity allele were about 2% more likely to report being obese.
Table 4. Obesity by Cumulative Risk/Plasticity Allele Measure
Risk/Plasticity Allele Combinations
Both MAOA 5-HTT Neither Total
(0) Not Obese 67.54% 66.50% 68.57% 70.38% 68.17%
(1) Obese 32.46% 33.50% 31.43% 29.62% 31.83%
Differences between allele combinations for obesity: 2 = 8.8012; F=1.548 (not sig)

34
Both genes were used in tandem as a cumulative plasticity allele to explore
associations with overweight and obesity. Tables 4 and 5 indicate that no significant
difference exists between weight status based on the combination of MAOA and 5-HTT
risk/plasticity alleles an individual has. In other words, having additional low activity
alleles is not associated with an increase or decrease in either weight status.
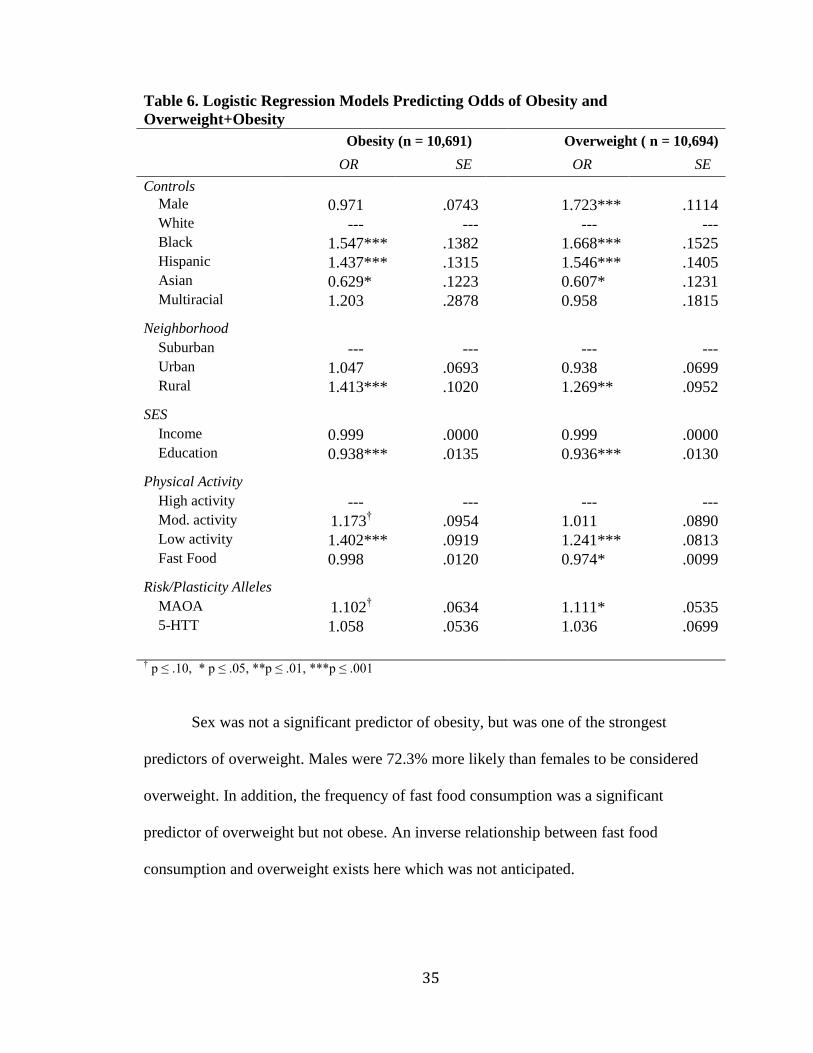
Table 6 reveals a number of important predictors of obesity and overweight. In
both cases, odds of obesity or overweight were significantly predicted by race/ethnicity ,
type of neighborhood, educational level, physical activity, and having the MAOA
plasticity allele. Individuals who identified as black or Hispanic were 54.7% and 43.7%
more likely to be obese respectively, while those who identified as Asian were 37.1% less
likely to be considered obese compared to white. Individuals living in rural settings were
41.3% more likely to have been classified as obese compared to those living in a
suburban environment. Respondents with the MAOA risk/plasticity allele were 10-11%
more likely to be obese or overweight. This finding was significant for
overweight+obese, but only marginally significant in the case of obesity.
Table 5. Overweight+Obesity by Cumulative Risk/Plasticity Allele Measure
Risk/Plasticity Allele Combinations
Both MAOA 5-HTT Neither Total
(0) Not Overweight 36.86% 35.31% 35.58% 37.03% 36.17%
(1) Overweight 63.14% 64.69% 64.42% 62.97% 63.83%
Differences between allele combinations for overweight: 2 = 2.990; F=0.517 (not sig)
35
Sex was not a significant predictor of obesity, but was one of the strongest
predictors of overweight. Males were 72.3% more likely than females to be considered
overweight. In addition, the frequency of fast food consumption was a significant
predictor of overweight but not obese. An inverse relationship between fast food
consumption and overweight exists here which was not anticipated.
Table 6. Logistic Regression Models Predicting Odds of Obesity and
Overweight+Obesity Obesity (n = 10,691)**** Overweight ( n = 10,694)
OR**** SE**** OR**** SE*
Controls Male 0.971*** .0743 1.723*** .1114 White ---*** --- ---*** --- Black 1.547*** .1382 1.668*** .1525 Hispanic 1.437*** .1315 1.546*** .1405 Asian 0.629*** .1223 0.607*** .1231 Multiracial 1.203*** .2878 0.958*** .1815 Neighborhood Suburban ---*** --- ---*** --- Urban 1.047*** .0693 0.938*** .0699 Rural 1.413*** .1020 1.269*** .0952 SES Income 0.999*** .0000 0.999*** .0000 Education 0.938*** .0135 0.936*** .0130 Physical Activity High activity ---*** --- ---*** --- Mod. activity 1.173
†††† .0954 1.011*** .0890
Low activity 1.402*** .0919 1.241*** .0813 Fast Food 0.998*** .0120 0.974*** .0099 Risk/Plasticity Alleles MAOA 1.102
†††† .0634 1.111*** .0535
5-HTT 1.058*** .0536 1.036*** .0699
† p ≤ .10, * p ≤ .05, **p ≤ .01, ***p ≤ .001

36
Interaction models were used to explore the potential nuanced relationship
between socioeconomic status, plasticity genes, and weight status. Table 7 indicates
marginally significant interaction between 5-HTT risk/plasticity alleles and education
when used to predict the odds of obesity. No significant interaction exists when
predicting overweight. Table 8, using the MAOA risk/plasticity allele, depicts a
relationship opposite to what is found with 5-HTT alleles. A significant interaction term
was found when using education and MAOA risk/plasticity interaction to predict
overweight, but not obesity. In both cases where the interaction terms were significant,
the interaction term itself provided a slight decrease to obesity or overweight, but the net
overall effect of the gene alleles was an increase in obesity rates.
Table 7. 5-HTT Allele Interaction Models Predicting Odds of Obesity and
Overweight+Obesity Obesity (n = 13,761)**** Overweight (n = 13,379)
β**** SE**** β **** SE*
Education -0.063*** .0205 -0.081*** .0232 5-HTT 0.256
†††† .1908 0.704*** .1760
Education x 5-HTT -0.045††††
.0846 -0.015*** .0282 Constant -0.413*** 1.034*** † p ≤ .10, * p ≤ .05, **p ≤ .01, ***p ≤ .001
Table 8. MAOA Allele Interaction Models Predicting Odds of Obesity and
Overweight+Obesity
Obesity (n = 13,379)**** Overweight (n = 13,386)
β**** SE**** β **** SE*
Education -0.972*** .0154 -0.063*** .0174 MAOA 0.029
†††† .1273 0.297*** .1729
Education x MAOA 0.013††††
.0706 -0.053*** .0214 Constant -0.285*** 0.924*** † p ≤ .10, * p ≤ .05, **p ≤ .01, ***p ≤ .001

37
Due to the significance of sex as a predictor of overweight+obese, but not solely
obesity, in the logistic regression models, separate sex models were additionally run.
Table 9 contains the results of the male-only model predicting obesity. Hispanic males
were 45% more likely the report being obese compared to white males, and Hispanic
race/ethnic identification was significant in predicting both obesity and overweight.
Additional predictors of odds of obesity were rural (versus suburban), education, low
physical activity (versus high) and possessing the MAOA
Table 9. Male Only Models Predicting Odds of Obesity and Overweight+Obesity
Obesity ( ≥ 30 kg/m2)**** Overweight ( ≥ 25 kg/m
2)
OR**** SE**** OR**** SE*
Controls White ---*** --- ---*** --- Black 1.002*** .1314 1.169*** .1532 Hispanic 1.450*** .1734 1.485*** .2111 Asian 0.882*** .2253 0.678*** .1779 Multiracial 1.431*** .3947 1.308*** .4181 Neighborhood Suburban ---*** --- ---*** --- Urban 0.949*** .1086 0.878*** .0972 Rural 1.322*** .1249 1.177*** .1234 SES Income 1.000*** .000 1.000*** .0000 Education 0.955*** .0191 0.978*** .0222 Physical Activity High activity ---*** --- ---*** --- Mod. activity 1.151*** .1458 0.802
†††† .1049
Low activity 1.538*** .1301 1.234*** .1247 Fast Food 0.994*** .0156 0.965*** .0127 Risk/Plasticity Alleles MAOA 1.189*** .0921 1.105*** .0890 5-HTT 0.961*** .0793 0.918*** .0890 † p ≤ .10, * p ≤ .05, **p ≤ .01, ***p ≤ .001
38
risk/plasticity allele. Besides Hispanic racial/ethnic status, only physical activity
differences and fast food consumption predicted odds of overweight among males.
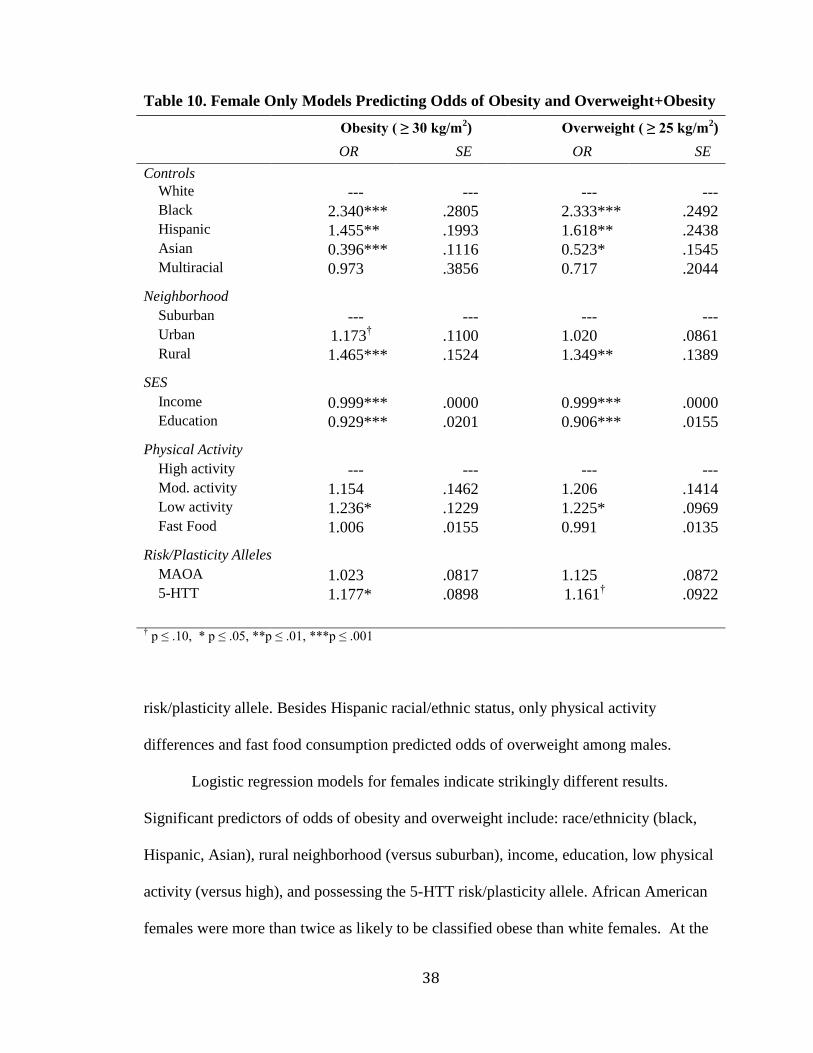
Logistic regression models for females indicate strikingly different results.
Significant predictors of odds of obesity and overweight include: race/ethnicity (black,
Hispanic, Asian), rural neighborhood (versus suburban), income, education, low physical
activity (versus high), and possessing the 5-HTT risk/plasticity allele. African American
females were more than twice as likely to be classified obese than white females. At the
Table 10. Female Only Models Predicting Odds of Obesity and Overweight+Obesity
Obesity ( ≥ 30 kg/m2)**** Overweight ( ≥ 25 kg/m
2)
OR**** SE**** OR**** SE*
Controls White ---*** --- ---*** --- Black 2.340*** .2805 2.333*** .2492 Hispanic 1.455*** .1993 1.618*** .2438 Asian 0.396*** .1116 0.523*** .1545 Multiracial 0.973*** .3856 0.717*** .2044 Neighborhood Suburban ---*** --- ---*** --- Urban 1.173
†††† .1100 1.020*** .0861
Rural 1.465*** .1524 1.349*** .1389 SES Income 0.999*** .0000 0.999*** .0000 Education 0.929*** .0201 0.906*** .0155 Physical Activity High activity ---*** --- ---*** --- Mod. activity 1.154*** .1462 1.206*** .1414 Low activity 1.236*** .1229 1.225*** .0969 Fast Food 1.006*** .0155 0.991*** .0135 Risk/Plasticity Alleles MAOA 1.023*** .0817 1.125*** .0872 5-HTT 1.177*** .0898 1.161
†††† .0922
† p ≤ .10, * p ≤ .05, **p ≤ .01, ***p ≤ .001
39
same time, Asian females were about 60% less likely to be classified obese than white
females. Women living in a rural environment were disproportionately more obese. For
obesity, living in an urban environment was also a marginally significant predictor.
Physical activity rates were the strongest predictors of obesity and overweight
odds for men, but were one of the weakest for females. Females who reported low levels
of physical activity were between 22 and 24% more likely to be classified overweight or
obese respectively. MAOA risk/plasticity alleles did not significantly predict odds of
either weight status for women, but 5-HTT alleles did. Women with the 5-HTT
risk/plasticity allele were 17.7% more likely to be classified obese and 16.1% more likely
to be classified overweight (although 5-HTT was marginally significant in the overweight
model).
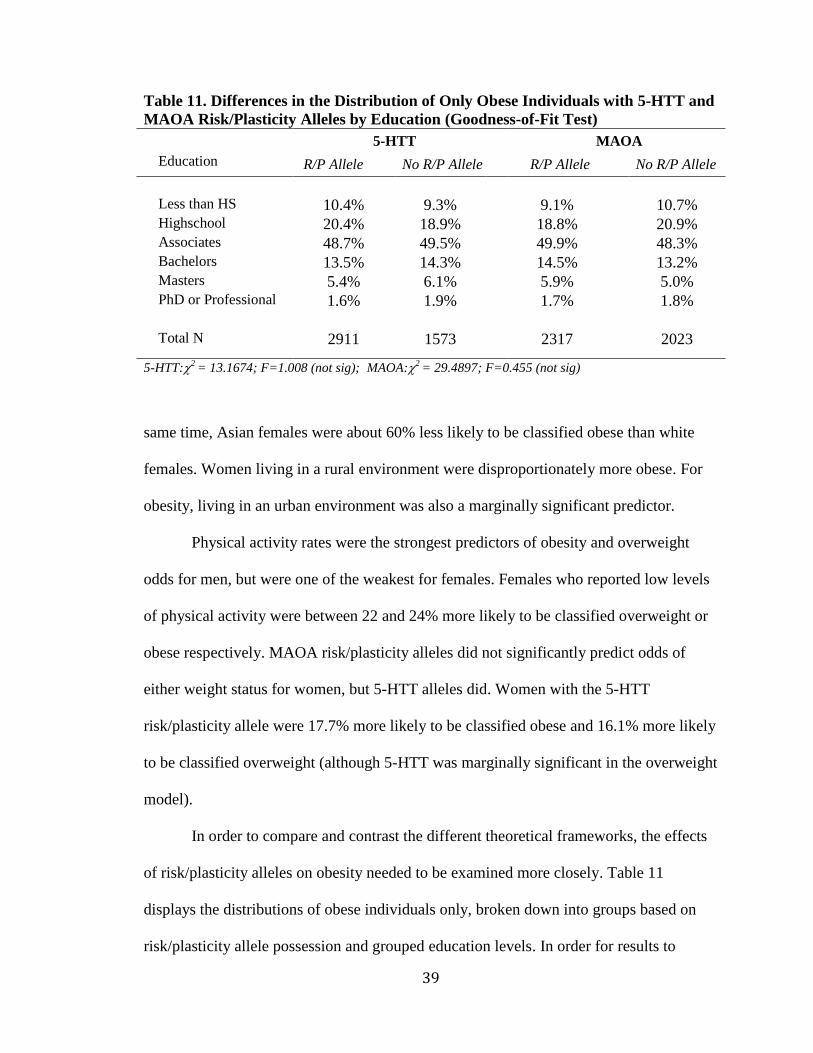
In order to compare and contrast the different theoretical frameworks, the effects
of risk/plasticity alleles on obesity needed to be examined more closely. Table 11
displays the distributions of obese individuals only, broken down into groups based on
risk/plasticity allele possession and grouped education levels. In order for results to
Table 11. Differences in the Distribution of Only Obese Individuals with 5-HTT and
MAOA Risk/Plasticity Alleles by Education (Goodness-of-Fit Test)
5-HTT**** MAOA
Education R/P Allele*** No R/P Allele R/P Allele**** No R/P Allele
Less than HS 10.4% 9.3% 9.1% 10.7% Highschool 20.4% 18.9% 18.8% 20.9% Associates 48.7% 49.5% 49.9% 48.3% Bachelors 13.5% 14.3% 14.5% 13.2% Masters 5.4% 6.1% 5.9% 5.0% PhD or Professional 1.6% 1.9% 1.7% 1.8% Total N 2911 1573 2317 2023 5-HTT:2
= 13.1674; F=1.008 (not sig); MAOA:2 = 29.4897; F=0.455 (not sig)
40
support a diathesis-stress model, individuals with the low activity risk alleles should have
significantly higher obesity rates than those without it in the lower education brackets. At
the same time, individuals with higher education levels in either allele group should have
nearly identical distributions. This would indicate that having a risk allele results in
vulnerability to obesity among the less educated, or that only the individuals with either
MAOA or 5-HTT alleles are more prone to becoming obese but are unaffected by factors
that would deter obesity.
The alternative interpretation posited by differential susceptibility advocates is
that plasticity alleles affect individuals on both ends of the spectrum. In other words,
having a MAOA or 5-HTT plasticity allele would make an individual more susceptible to
the negative forces that increase obesity, but also less susceptible when the positive
forces that discourage obesity are present. Unfortunately, Tables 11 indicates that no
significant differences were found in the distributions of obese individuals into
educational groups based on either MAOA or 5-HTT risk/plasticity alleles.
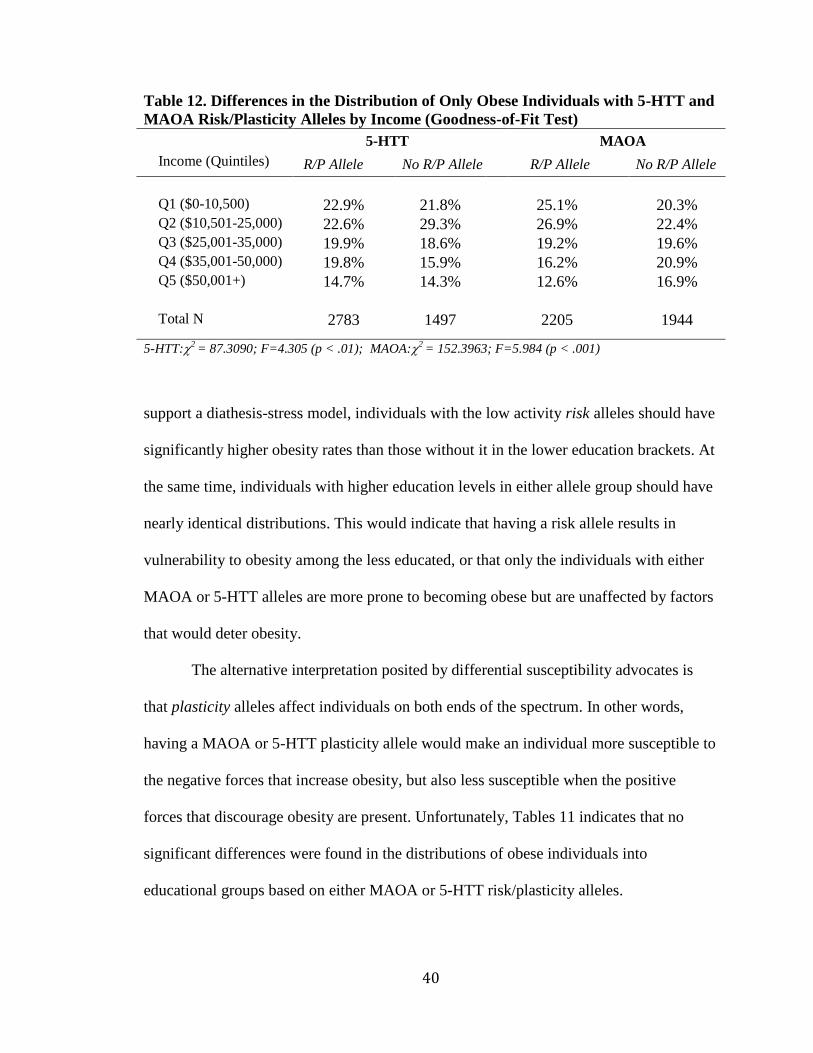
Table 12. Differences in the Distribution of Only Obese Individuals with 5-HTT and
MAOA Risk/Plasticity Alleles by Income (Goodness-of-Fit Test)
5-HTT**** MAOA
Income (Quintiles) R/P Allele*** No R/P Allele R/P Allele**** No R/P Allele
Q1 ($0-10,500) 22.9% 21.8% 25.1% 20.3% Q2 ($10,501-25,000) 22.6% 29.3% 26.9% 22.4% Q3 ($25,001-35,000) 19.9% 18.6% 19.2% 19.6% Q4 ($35,001-50,000) 19.8% 15.9% 16.2% 20.9% Q5 ($50,001+) 14.7% 14.3% 12.6% 16.9% Total N 2783 1497 2205 1944 5-HTT:2
= 87.3090; F=4.305 (p < .01); MAOA:2 = 152.3963; F=5.984 (p < .001)

41
Using income (in quintiles) as an indicator of socioeconomic status and repeating
the same procedure produced a very different result. Table 12 shows the differences in
the distribution of obese individuals based on income and risk/plasticity alleles. Those
with 5-HTT risk/plasticity alleles had significantly higher rates of obesity in all income
brackets with the exception of the $10,501 to $25,000 income bracket. That particular
income bracket also has the greatest difference in the distributions of individuals, 29.3%
obesity in the no risk/plasticity allele group compared to only 22.6% in the risk/plasticity
group. Results also indicate that individuals with the MAOA risk/plasticity allele were
significantly more obese in lower income brackets and less obese at higher incomes than
those without the allele.
While education was a significant predictor in nearly every model of obesity or
overweight, income was only significant in the female model. Due to the important role
gender may play, male-only and female-only distributions were also created. Table 13
displays the results of the male only distributions of obese individuals based on income
and risk/plasticity allele. Results are similar to those found in the male only logistic
Table 13. Males Only: Differences in the Distribution of Only Obese Individuals
with 5-HTT and MAOA Risk/Plasticity Alleles by Income (Goodness-of-Fit Test)
5-HTT**** MAOA
Income (Quintiles) R/P Allele*** No R/P Allele R/P Allele**** No R/P Allele
Q1 ($0-10,500) 13.3% 13.3% 17.1% 11.4% Q2 ($10,501-25,000) 18.6% 24.5% 24.1% 17.8% Q3 ($25,001-35,000) 20.2% 18.7% 17.4% 20.7% Q4 ($35,001-50,000) 24.7% 20.2% 18.5% 26.2% Q5 ($50,001+) 23.2% 23.4% 22.9% 23.9% Total N 1259 642 754 1105 5-HTT:2
= 86.7449; F=1.732 (not sig); MAOA:2 = 260.7320; F=3.935 (p < .01)

42
regression models, where MAOA, but not 5-HTT, plays a significant role. In this case,
obese males with the MAOA risk/plasticity allele were disproportionally overrepresented
in the low income quintiles and disproportionally underrepresented at the highest
incomes. The distributions of obese males based on 5-HTT in were not significantly
different.
Results of the female only models in Table 14 also mirror the relationships
established in the female only logistic regression models. Findings indicates that obese
females with the 5-HTT risk/plasticity allele had a marginally significant
overrepresentation in all income brackets relative to those without the allele except the
$10,501 to $25,000 income bracket, which was found in the non-gender specific model as
well. Obese females with the MAOA risk/plasticity allele were not significantly
difference that those without the allele in their distribution among income quintiles.
Table 14. Females Only: Differences in the Distribution of Only Obese Individuals
with 5-HTT and MAOA Risk/Plasticity Alleles by Income (Goodness-of-Fit Test)
5-HTT**** MAOA
Income (Quintiles) R/P Allele*** No R/P Allele R/P Allele**** No R/P Allele
Q1 ($0-10,500) 32.2% 29.5% 30.2% 33.7% Q2 ($10,501-25,000) 26.5% 33.7% 28.6% 29.4% Q3 ($25,001-35,000) 19.8% 18.5% 20.3% 17.8% Q4 ($35,001-50,000) 15.0% 12.2% 14.8% 12.9% Q5 ($50,001+) 6.5% 6.1% 6.2% 6.2% Total N 1524 855 1451 839 5-HTT:2
= 87.1677; F=2.192 (p < .10); MAOA:2 = 33.1693; F=0.734 (not sig)

43
CHAPTER VII
Discussion
Weight Status and Gene Alleles
Statistical analysis of obesity and overweight+obese established sociological
predictors, and their interaction effects, had mixed results. Preliminary analysis of the
association between obesity and overweight and the gene alleles of interest failed to
reveal significant association in any of the four models (p < .05), although marginal
significance was found between MAOA and obesity. Both MAOA and 5-HTT gene
alleles have been repeatedly associated with obesity in a variety of studies, including
many using previous iterations of Add Health data (Fuemmeler et al. 2009, Fuemmeler et
al. 2008).
The non-significant association between both gene alleles and obesity/overweight
is expected for a few important reasons. Harris et al. (2013) explain that the relationship
between variation in genetic makeup and any social outcome of interest is difficult to
pinpoint and capture. They emphasize the importance of utilizing the longitudinal data in
Add Health and delicately accounting for changes over time, which this study does not
do. If researchers understand genetics to be an intermediate influence between social
predictors and outcomes, it would make sense that the relationship between genetics and
outcomes outright may not always yield significant results. Other studies using Wave IV
Add Health data have also failed to find a substantial and significant direct effect of
genetic variation on BMI (Wickrama, Walker-O’Neal, and Lee 2013).
In order to corroborate the differential susceptibility framework, a significant
association between outcome and gene allele should not exist outright. Belsky and
44
colleagues (2007) proposed stepwise criteria for distinguishing true differential
susceptibility from other types of interaction. One of the preliminary steps in differential
susceptibility evaluation is a test of association between the susceptibility factor (MAOA
or 5-HTT in this case) and the outcome (obesity or overweight). Belsky and colleagues
explain that if a significant association exists there is no need for further analysis. In that
case, evidence would suggest that the relationship between outcome, predictor, and
susceptibility factor is that of a dual-risk model where both the predictor and
susceptibility factor are affecting obesity rates (Belsky et al., 2007). In the context of this
research, a significant relationship between gene alleles and obesity outright would
indicate both socioeconomic status and gene alleles are both independently predicting
obesity. In order for differential susceptibility to prove true, gene alleles must moderate
the relationship between socioeconomic status and obesity instead.
The distribution of obese individuals within educational groups did not
significantly differ based on plasticity and non-plasticity allele groups in either direction.
While it appears that individuals with the 5-HTT plasticity allele are more obese than
those without the allele at low levels of education and less obese than those without at
high levels of education, the difference is not statistically significant. The implication of
this is that neither diathesis-stress nor differential susceptibility frameworks are supported
when observing education, obesity, and MAOA/5-HTT despite education continually
reappearing as a significant predictor of obesity and overweight in regression models.
The distribution of obese individuals within income quintiles yielded much more
interesting results. In general, there were significantly more obese individuals in all
income groups (with one exception) for those who had the 5-HTT plasticity allele relative
45
to those who did not. A very different relationship existed for those with MAOA allele.
Significantly more obese respondents with the MAOA risk/plasticity allele were found in
the lower two income quintiles, while significantly less fewer were found in the upper
two income quintiles. Results of the 5-HTT models lend themselves to a diathesis-stress
framework, where genetic predisposition amplifies negative environmental influences
that increase obesity rates regardless of income. On the other hand, MAOA models
further validate differential susceptibility frameworks, where genetic predisposition
increases overall susceptibility to environmental influences, both increasing and
decreasing obesity rates.
Gene Interaction
Analysis of the interaction between plasticity alleles and socioeconomic status
when predicting odds of obesity and overweight did yield interesting results. Education
remained a significant predictor in all models regardless of the outcome (obesity or
overweight) or the gene allele and interaction action term included (MAOA or 5-HTT).
The MAOA plasticity allele and interaction was only significant in the overweight model,
while the 5-HTT plasticity allele and interaction was only marginally significant in
predicting obesity.
The disparity in the relationships between allele type and weight status provide
rather compelling evidence against the use of cumulative plasticity allele indices which
are currently and often used in gene-environment studies (Wickrama et al. 2013; Belksy
and Beaver 2011; Guo et al. 2008). Statistical significance of associations between 5-
HTT and MAOA alleles and weight status differ substantially for on sex. The sex-
moderated models revealed that MAOA was a significant predictor for males, but not for
46
females. For females, 5-HTT plasticity alleles were a significant predictor, but not for
males. It is not surprising that a cumulative plasticity allele using MAOA and 5-HTT
revealed no significant relationship to either weight status in this study.
Sex
Sex disparities in both weight status models are prominent. Sex was the strongest
predictor of overweight status in the preliminary regression models, but were not
significant in obesity models. Earlier blocks of the obesity model did reveal sex as a
significant predictor, but its significance was later accounted for when neighborhood type
and socioeconomic status variables were added. From the descriptive statistics we know
that nearly a third of the sample was classified overweight (BMI > 25kg/m2), but not
obese (BMI < 30 kg/m2). This portion of the sample clearly differs from those who are
considered obese, which could use additional exploration.
For males, physical activity was the strongest predictor of obesity, specifically the
difference between individuals who reported low levels of activity relative to those who
were vigorously active. This is a logical difference due simply to the direct effect
exercise has on an individual’s weight. The second strongest predictor of obesity was
Hispanic ethnic identification. All other race/ethnic categories did not significantly
predict odds of obesity or overweight for males. Fuemmeler et al. (2008) produced
findings that mirror these, where white and Hispanic men had significantly higher rates of
overweight and obesity. In that study no significant findings were produced among
females.
For females, all race/ethnicies with the exception of the multi-race category were
strong predictors of both obesity and overweight. African American females in particular
47
had the highest increased odds of obesity out of all models (135% more likely to be
classified obese). Physical activity, while significant, was not as strong of a predictor of
obesity or overweight for females as it is for males. One additional factor that became
marginally significant in the female model was urban environment (versus suburban).
The significance of both rural and urban environments in predicting weight status reflects
much of the literature that details limited food access and availability in both settings,
although many studies focus predominantly on urban food scarcity (Morland and
Evenson 2009; Black and Macinko 2008). With regard to both variables in this study,
living in rural and urban environments disproportionately increased odds of obese and
overweight classification.
The differences in the gender-specific distributions of obese individuals by
income and gene alleles support both diathesis-stress and differential susceptibility
frameworks, but also signal the important role gender plays as well. The 5-HTT allele
was marginally significant for females, but not significant for males. The opposite
relationship exists between genders when using the MAOA allele. Studies have shown
that changes in estrogen levels in women, typically among aging women, can decrease
the expression of the MAOA gene (Gundlah, Lu, and Bethea 2002; Smith et al. 2004).
The net effect of this change is an increase in the serotonin levels among these women,
which in turn would increase the amount of pleasure derived from things such as eating.
At the time this data was collected female cohort participants were in their late 30s, and it
is possible that some of them are already experiencing hormonal changes which could
affect eating behaviors and mask the effect of the MAOA allele among women in this
study.
48
In general, however, findings regarding the role gender plays in gene-by-
environment obesity studies are mixed. Sookoian et al. (2008) found that the 5-HTT
allele was associated with increased obesity rates among men, but did not have a female
sample to compare to. Wickrama and colleagues (2013) find that woman report greater
increases in obesity over time than men even when accounting for cumulative
risk/plasticity alleles, including 5-HTT and MAOA among others. Fuemmeler et al.
(2008) find that both 5-HTT and MAOA are associated with obesity and
overweight+obesity only among men, while other studies suggest that only MAOA is
significantly related to obesity for men (Marmorstein and Hart 2011). While the current
findings with regard to gender are supported in some past research, it is clear that the role
gender plays needs additional attention.
Research Questions
Genetics-informed social research clearly has a place, although additional work is
necessary for distinguishing how and to what degree genetic variability influences social
outcomes. The relationship genes have with various outcomes is not often direct or
explicit, but is instead enmeshed in the relationships between the outcome and its known
predictors, as is the case here. Understanding the predictors of obesity is a necessary
component to exploring gene-environment interactions so that this complex relationship
can be properly unfolded.
While the inclusion of the allele data into statistical models did not aid in the
understanding of weight status outright in most cases, the variation in significance for
each of the genes individually and the disparities between significant predictors within
models inform future gene-environment study in a variety of ways. Past studies have

49
utilized cumulative risk/plasticity measures by creating indices with multiple genetic
alleles under the assumption that all alleles function together as a vulnerability (in
diathesis-stress models) or susceptibility factor (using differential susceptibility). It is
evident here that MAOA and 5-HTT gene alleles have different effects on obesity and/or
overweight and function in different ways. While both alleles may be associated with
obesity, the use of both alleles combined in a single measure seems unwarranted.
Successful preliminary testing revealed that genetic alleles were often marginally
or non-significant in additive models or in association with obesity and
overweight+obesity, which is an important step in providing evidence for the moderating
nature of genes in both diathesis-stress and differential susceptibility theoretic
frameworks. A closer analysis of the plasticity allele groups by education levels,
however, revealed that there was little to no difference in the distribution of obesity on
either end of the educational spectrum between groups. Evaluation of differential
susceptibility and diathesis-stress theories using education predictor of obesity did not
produce any significant results. Both frameworks were supported, however, using income
as a predictor and were additionally nuanced when sex was included. There is no clear
consensus as to why this difference exists or to the specific role gender plays in gene-by-
environment obesity studies in the current literature.
Limitations and Future Research
Although this study has important implications and contributes to the growing
gene-environment literature, there are limitations that future researchers should consider.
Data used for this study was used cross-sectionally, a disadvantage for many studies but
one that is particularly detertrimental for genetic-informed social research as Harris et al.
50
(2013) have described. The relationship between genes and social outcomes is complexly
layered and due diligence is required of those in pursuit of further exploring this
relationship. Harris et al. (2013) discuss the benefits of using Add Health data
longitudinally, and in models that adequately considered changes over time, at length.
Each factor influencing an outcome works at multiple levels, at times in conjunction with
other factors, and no single factor solely determines the outcome. Sufficient knowledge
of genetics, the predictors related to the outcome of interest, and advanced statistical
methodology is required to accurately depict any given gene-environment relationship.
In the current study different measures of weight status produced disparate results,
highlighting the role and importance of measurement choice when working with weight.
Running separate obesity and overweight models indicated that a variety of predictors
existed in only one of the two models. These differences were further accentuated when
analyses were subdivided into models based on sex. Additional weight status measures
are also available and are used in other obesity and overweight studies. BMI is often used
in analysis in raw score form, kg/m2 (Wickrama et al. 2013; Fuemmeler et al. 2009), but
can also be used after z-score standardization (Richardson et al. 2013; Marmorstein and
Hart 2011) and in a percentile rank variable (Guo et al. 2012).
The gender findings presented here may serve as an important starting point for
researchers. Many of the most recent Add Health genetic studies exploring obesity have
produced results that are often significant for only one gender. No studies have currently
focused solely on interaction between gender, gene alleles, and/or predictors when
studying obesity or overweight, although many have recommended it as an area where

51
future research is necessary (Marmorstein and Hart 2011; Fuemmeler et al. 2009;
Fuemmeler et al. 2008).

52
REFERENCES
Appelhans, Bradley M., Matthew C. Whited, Kristin L. Schneider, Yunsheng Ma, Jessica
L. Oleski, Philip A. Merriam, Molly E. Waring, Barbara C. Olendzki, Devin M.
Mann, Ira S. Ockene, and Sherry L. Pagoto. 2012. "Depression Severity, Diet
Quality, and Physical Activity in Women with Obesity and Depression." Journal
of the Academy of Nutrition and Dietetics 112(5):693-698.
Bearman, Peter. 2008. “Exploring Genetics and Social Structure.” Journal of Sociology
114(S1):v-x.
Belcher, Britni R., David Berrigan, Kevin W. Dodd, B. Adar Emken, Chih-Ping Chou,
and Donna Spuijt-Metz. 2010. “Physical Activity in US Youth: Impact of
Race/Ethnicity, Age, Gender, & Weight Status.” Medicine and Science in Sports
and Exercise 42(12):2211-2221.
Belsky, Jay, and Kevin M. Beaver. 2011. “Cumulative-Genetic Plasticity, Parenting, and
Adolescent Self-Regulation.” Journal of Child Psychology and Psychiatry
52(2):619-626.
Belsky, Jay, C. Jonassaint, Michael Pluess, M. Stanton, B. Brummett, and R. Williams.
2009. “Vulnerability Genes or Plasticity Genes?” Molecular Psychiatry 14:746-
754.

53
Belsky, Jay and Michael Pluess. 2009. “Beyond Diathesis Stress: Differential
Susceptibility to Environmental Influences.” Psychological Bulletin 135(6):885-
908.
Belsky, Jay, Marian J. Bakermans-Kranenburg, and Marinus H. van IJzendoorn. 2007.
“For Better and For Worse: Differential Susceptibility to Environmental
Influences.” Current Directions in Psychological Science 16(6):300-304.
Belsky, Jay. 1997. “Variation in Susceptibility to Rearing Influence: An Evolutionary
Argument.” Psychological Inquiry 8:182-186.
Beydoun, May A., and Youfa Wang. 2010. “Pathways Linking Socioeconomic Status to
Obesity Through Depression and Lifestyle Factors Among Young US Adults.”
Journal of Affective Disorders 123:52-63.
Black, Jennifer L. and James Macinko. 2008. “Neighborhoods and Obesity.” Nutrition
Reviews 66(1):2-20.
Blazer, Dan G., Sandra Moody-Ayers, Jennifer Craft-Morgan, and Bruce Burchett. 2002.
“Depression in Diabetes and Obesity: Racial/Ethnic/Gender Issues in Older
Adults.” Journal of Psychosomatic Research 53(4):913-916.
Bodenlos, Jamie S., Stephenie C. Lemon, Kristin L. Schneider, Madeline A. August, and
Sherry L. Pagoto. 2011. “Associations of Mood and Anxiety Disorders with
Obesity: Comparisons by Ethnicity.” Journal of Psychosomatic Research 71:319-
324.
54
Booth, Katie M., Megan M. Pinkston, and Walker S. Carlos Poston. 2005. “Obesity and
the Built Environment.” Journal of the American Dietetic Association
105(5):S110-S117.
Bowman, Shanthy A. and Bryan T. Vinyard. 2003. “Fast Food Consumption of U.S.
Adults: Impact on Energy and Nutrient Intakes and Overweight Status.” Journal
of the American College of Nutrition 23(2):163-168.
Brosnahan, Jennifer, Lyn M. Steffen, Leslie Lytyle, Joan Patterson, and Ardys Boostrom.
2004. “The Relation Between Physical Activity and Mental Health Among
Hispanic and Non-Hispanic White Adolescents.” Archives of Pediatrics &
Adolescent Medicine 158(8):818-823.
Burdette, Hillary L. and Robert C. Whitaker. 2003. “Neighborhood Playgrounds, Fast
Food Restaurants, and Crime: Relationships to Overweight in Low-Income
Preschool Children.” Preventative Medicine 38:57-63.
Burke, Mary A. and Frank Heiland. 2007. “Social Dynamics of Obesity.” Economic
Inquiry 45(3):571-591.
Camarena, Beatriz, Haydee Santiago, Alejandro Aguilar, Elsa Ruvinskis, Jorge
Gonzalez-Barranco, and Humberto Nicolini. 2004. “Family-Based Association
Study Between the Monoamine Oxidase A Gene and Obesity: Implications for
Psychopharmacogenic Studies.” Neuropsychobiology 49:126-129.
55
Caspi, Avshalom, Karen Sugden, Terrie E. Moffitt, Alan Taylor, Ian W. Craig, HonaLee
Harrington, Joseph McClay, Jonathan Mill, Judy Martin, Antony Braithwaite, and
Richie Poulton. 2003. “Influences of Life Stress on Depression: Moderation by a
Polymorphism in the 5-HTT Gene.” Science 301(5631):386-389.
Chang, Virginia W. and Diane S. Lauderdale. 2005. “Income Disparities in Body Mass
Index and Obesity in the United States, 1971-2002.” Archives of Internal
Medicine 165(18):2122-2128.
Chantala, Kim and Joyce Tabor. 1999. Strategies to Perform a Design-Based Analysis
Using the Add Health Data. Unpublished manuscript, Carolina Population Center,
University of North Carolina at Chapel Hill, Chapel Hill, NC.
Cohen-Cole, Ethan and Jason M. Fletcher. 2008. “Is Obesity Contagious? Social
Networks vs. Environmental Factors in the Obesity Epidemic.” Journal of Health
Economics 27:1382-1387.
Cummins, Steven and Sally Macintyre. 2005. “Food Environments and Obesity –
Neighborhood or Nation?” International Journal of Epidemiology 35:100-104.
Davis, Catherine L. and Stephanie Cooper. 2011. “Fitness, Fatness, Cognition, Behavior,
and Academic Achievement Among Overweight Children: Do Cross-Sectional
Associations Correspond to Exercise Trial Outcomes?” Preventative Medicine
52(S1):S65-S69.

56
Diez-Roux, Ana V. 2006. “Integrating Social and Biological Factors in Health Research:
A Systems View.” Annals of Epidemiology 17(7):569-574.
Dockray, Samantha, Elizabeth J. Susman, and Lorah D. Dorn. 2009. “Depression,
Cortisol Reactivity, and Obesity in Childhood and Adolescence.” Journal of
Adolescent Health 45:344-350.
Durand, Emmanuelle, Philippe Boutin, David Meyre, M. Aline Charles, Karine Clement,
Christian Dina, and Philippe Froguel. 2004. “Polymorphisms in the Amino Acid
Transporter Solute Carrier Family 6 (Neurotransmitter Transporter) Member 14
Gene Contribute to Polygenic Obesity in French Caucasians.” Diabetes
53(9):2483-2486.
Ewing, Reid, Tom Schmid, Richard Killingsworth, Amy Zlot, and Stephen Raudenbush.
2003. “Relationship Between Urban Sprawl and Physical Activity, Obesity, and
Morbidity.” American Journal of Health Promotion 18(1):47-57.
Fotso, Jean-Christophe and Barthelemy Kuate-Defo. 2005. “Measuring Socioeconomic
Status in Health Research in Developing Countries: Should We Be Focusing on
Households, Communities, or Both?” Social Indicators Research 72:189-237.
Freese, Jeremy. 2008. “Genetics and the Social Science Explanation of Individual
Outcomes.” American Journal of Sociology 114(S1):S1-S35.
Freese, Jeremy and Sara Shostak. 2009. “Genetics and Social Inquiry.” Annual Review of
Sociology 35:107-128.

57
Fuemmeler, Bernard F., Tanya Agurs-Collins, F. Joseph McClernon, Scott H. Kollins,
Melanie E. Garrett, Allison E. Ashley-Koch. 2009. “Interactions Between
Genotype and Depressive Symptoms on Obesity.” Behavioral Genetics 39:296-
305.
Fuemmeler, Bernard F., Tanya D. Agurs-Collins, F. Joseph Mcclernon, Scott H. Kollins,
Melanie E. Kali, Andrew W. Bergen, and Allison E. Ashley-Koch. 2008. “Genes
Implicated in Serotonergic and Dopaminergic Functioning Predict BMI
Categories.” Obesity 16(2):348-356.
Giles-Corti, Billie, Sally Macintyre, Johanna P. Clarkson, Terro Pikora, and Robert J.
Donovan. 2003. “Environmental and Lifestyle Factors Associated with
Overweight and Obesity in Perth, Austrailia.” American Journal of Health
Promotion 18(1):93-102.
Godin, Gaston and Roy J. Shepard. 1985. “A Simple Method to Assess Exercise
Behavior in the Community.” Canadian Journal of Applied Sport Sciences
10(3):141-146.
Gundlah, Chrisana, Nick Z. Lu, and Cynthia L. Bethea. 2002. “Ovarian Steriod
Regulation of Monoamine Oxidase-A and B mRNAs in the Macaque Dorsal
Raphe and Hypothalmic Nuclei.” Psychopharmacology 160:271-282.
58
Guo, Guang, Kari E. North, Penny Gorden-Larson, Cynthia M. Bulik, and Seulki Choi.
2012. “Body Mass, DRD4, Physical Activity, Sedentary Behavior, and Family
Socioeconomic Status: The Add Health Study.” Obesity 15(5):1199-1206.
Guo, Guang, Yuying Tong, and Tianji Cai. 2008. “Gene by Social-Context Interactions
for Number of Sexual Partners Among White Male Youths: Genetics-Informed
Sociology.” American Journal of Sociology 114:S36-S66.
Heitmann, B. L. 2010. “Obesity and Gender.” Pp 58-64 in Clinical Obesity in Adults and
Children. Wiley-Blackwell.
Harris, Kathleen Mullan, Carolyn Tucker Halpem, Jon Hussey, Eric A. Whitsel, Ley
Killeya-Jones, Joyce Tabor, Glen Elder, John Hewitt, Michael Shanahan, Redford
Williams, Ilene Siegler, and Andrew Smolen. 2013. “Social, Behavioral, and
Genetic Linkages from Adolescence to Adulthood.” American Journal of Public
Health 103(S1):S25-S32.
Harris, Kathleen Mullan, Carolyn Tucker Halpern, Andrew Smolen, and Brett C.
Haberstick. 2006. “The National Longitudinal Study of Adolescent Health (Add
Health) Twin Data.” Twin Research and Human Genetics 9(6):988-997.
Harris, Kevin C., Lisa K. Kuramoto, Michael Schulzer, and Jennifer E. Retallack. 2009.
“Effect of School-Based Physical Activity Interventions on Body Mass Index in
Children: A Meta-Analysis.” Canadian Medical Association Journal 180(7):719-
726.

59
Hjelmborg, Jacob v.B., Corrado Fagnani, Karri Silventoinen, Matt McGue, Maarit
Korkeila, Kaare Christensen, Aila Rissanen, and Jaakko Kaprio. 2008. “Genetic
Influences on Growth Traits of BMI: A Longitudinal Study of Adult Twins.”
Obesity 16(4):847-852.
Hu, Xianzhang, Gabor Oroszi, Jeffrey Chun, Tom L. Smith, David Goldman, and Marc
A. Schuckit. 2006. “An Expanded Evaluation of the Relationship of Four Alleles
to the Level of Response to Alcohol and the Alcoholism Risk.” Alcoholism:
Clinical and Experimental Research 29(1):8-16.
Krishnan, Vijaya. 2010. Construction an Area-Based Socioeconomic Index: A Principal
Components Analysis Approach. Unpublished manuscript. Early Child
Development Mapping Project, University of Alberta, Edmonton, Alberta.
Lucki, Irwin. 1998. “The Spectrum of Behaviors Influenced by Serotonin.” Biological
Psychiatry 44(3):151-162.
Lyons-Ruth, Karlen, Bjarne M. Holmes, Maria Sasvari-Szekely, Zsolt Ronai, Zsofia
Nemoda, and David Pauls. 2007. “Serotonin Transporter Polymorphism and
Borderline/Antisocial Traits among Low-Income Adults.” Psychiatric Genetics
17:339-343.
Marmorstein, Naomi R. and Daniel Hart. 2011. “Interactions Between MAOA Genotype
and Receipt of Public Assistance: Predicting Change in Depressive Symptoms
and Body Mass Index.” Journal of Research on Adolescence 21(3):619-630.

60
Martin, Molly A. 2008. “The Intergenerational Correlation in Weight: How Genetic
Resemblance Reveals the Social Role of Families.” American Journal of
Sociology 114(S1):S67-S105.
Morland, Kimberly B. and Kelly R. Evenson. 2009. “Obesity Prevalence and the Local
Food Environment.” Health & Place 15:491-495.
Morland, Kimberly, Ana V. Diez Roux, and Steve Wing. 2006. “Supermarkets, Other
Food Stores, and Obesity: The Atherosclerosis Risk in Communities Study.”
American Journal of Preventative Medicine 30(4):333-339.
Morton, Lois Wright and Troy C. Blanchard. 2007. “Starved for Access: Life in Rural
American’s Food Deserts.” Rural Realities 1(4):1-10.
Need, A.C., K.R. Ahmadi, T.D. Spector, and D.B. Goldstein. 2006. “Obesity is
Associated with Genetic Variants that Alter Dopamine Availability.” Annals of
Human Genetics 70:293-303.
Nelson, Melissa C., Penny Gordon-Larsen, Yan Song, and Barry M. Popkin. 2006. “Built
and Social Environments: Associations with Adolescent Overweight and
Activity.” American Journal of Preventative Medicine 31(2):109-117.
Richardson, A. S., K. E. North, M. Graff, K. M. Young, K. L. Mohlke, L. A. Lange, E.
M. Lange, K. M. Harris, and P. Gorden-Larsen. 2013. “Moderate to Vigorous
Physical Activity Interactions with Genetic Variants and Body Mass Index in a
Large U.S. Ethnically Diverse Cohort.” Pediatric Obesity [Epub ahead of print]
61
Sabol, Sue Z., Stella Hu, and Dean Hamer. 1998. “A Functional Polymorphism in the
Monoamine Oxidase A Gene Promoter.” Human Genetics 103(3):273-279.
Saelens, Brian E., James F. Sallis, Jennifer B. Black, and Diana Chen. 2003.
“Neighborhood-Based Differences in Physical Activity: An Environmental Scale
Evaluation.” American Journal of Public Health 93(9):1552-1558.
Schwartz, Marlene B. and Kelly D. Brownell. 2004. “Obesity and Body Image.” Body
Image 1:43-56.
Simons, Ronald L., Man Kit Lei, Steven R. H. Beach, Gene H. Brody, Robert A.
Philibert, and Frederick X. Gibbons. 2011. “Social Environment, Genes, and
Aggression: Evidence Supporting Differential Susceptibility Perspective.”
American Sociological Review 76(6):883-911.
Smith, Lisa J., Jessica A. Henderson, Creed W. Abell, and Cynthia L. Bethea. 2004.
“Effects of Ovarian Steroids and Raloxifene on Proteins That Synthesize,
Transport, and Degrade Serotonin in the Raphe Region of Macaques.”
Neuropsychopharmacology 29(16):2035-2045.
Sookoian, Silvia, Tomas F. Gianotti, Carolina Gemma, Adriana Burgueno, and Carlos J.
Pirola. 2008. “Contribution of the Functional 5-HTTLPR Variant of the SLC6A4
Gene to Obesity Risk in Male Adults.” Obesity 16(2):488-491.

62
Sookoian, Silvia, Carolina Gemma, Silvia I. Garcia, Tomas Fernandez Gianotti,
Guillermo Dieuzeide, Adriana Roussos, Miriam Tonietti, Liliana Trifone, Diego
Kanevsky, Claudio D. Gonzalez, and Carlos J. Pirola. 2007. “Short Allele of
Serotonin Transporter Gene is a Risk Factor for Obesity in Adolescents.” Obesity
15(2):271-276.
Stafford, Mai, Steven Cummins, Anne Ellaway, Amanda Sacker, Richard D. Wiggins,
and Sally Macintyre. 2007. “Pathways to Obesity: Identifying Local, Modifiable
Determinants of Physical Activity and Diet.” Social Science & Medicine
65:1882-1897.
Suviolahti, Elina, Laura J. Oksanen, Miina Ohman, Rita M. Cantor, Martin Ridderstrale,
Tiinamaija Tuomi, Jaakko Kaprio, Aila Rissanen, Pertti Mustajoki, Pekka
Jousilahti, Erikki Vartiainen, Kaisa Silander, Riika Kilpikari, Veikko Salomaa,
Leif Groop, Kiimo Kontula, Leena Peltonen, and Paivi Pajukanta. 2003. “The
SLC6A4 Gene Shows Evidence of Association with Obesity.” Journal of
Clinical Investigation 112(11):1762-1772.
Ulijaszek, Stanley J. and Hayley Lofink. 2006. “Obesity in Biocultural Perspective.”
Annual Review of Anthropology 35:337-360.
Via, Marc, Christopher Gignoux, and Esteban Gonzalez-Burchard. 2010. “The 1000
Genomes Project: New Opportunities for Research and Social Challenges.”
Genome Medicine 2:3-5.

63
Wickrama, Kandauda, Catherine Walker O’Neal, and Tae Kyoung Lee. 2013. “Early
Community Context, Genes, and Youth Body Mass Index Trajectories: An
Investigation of Gene-Community Interplay Over Early Life Course.” Journal of
Adolescent Health 53:328-334.