the smart grid return on investment
TRANSCRIPT
The Smart Grid Return on Investment (ROI)
A Catalog of Consumer and Utility
Company Benefits

NEMA - 1 - February 1, 2012
The Smart Grid Return on Investment (ROI) A Catalog of Consumer and Utility Company Benefits
Executive Summary “A smart grid uses digital technology to improve reliability, security, and efficiency (both economic and energy) of the electric system from large generation, through the delivery systems to electricity consumers…”
U.S. Department of Energy, Smart Grid Systems Report1 December of 2012 marks the fifth anniversary of the Energy Independence and Security Act of 2007 (better known as EISA), the landmark piece of legislation that launched the U.S. government’s effort to modernize the nation’s electrical system and produce a “Smart Grid.”2 Aided by a grant program as part of the American Investment and Recovery Act of 2009 (ARRA or the Stimulus Act)3, federal and state agencies have come together with the electrical industry to design and install a variety of solutions aimed at achieving the objectives outlined in EISA. As the results from these investments start to become apparent, it is important to take a critical look at the value they are providing to utility companies and consumers alike. As the examples in this whitepaper will show, financial, environmental, and societal benefits are all achievable from Smart Grid implementations:
The Smart Grid plan adopted by Commonwealth Edison will generate immediate savings on customer’s electric bills;
Investments by Austin Energy promote a smarter, more efficient grid that also involves the consumer in energy consumption decisions;
Virginia Dominion Power uses Smart Grid technologies to save thousands of megawatts in future generating capacity;
Minnesota Power uses long-haul transmission and energy storage to incorporate the massive wind energy potential in the Midwest; and
The Bonneville Power Administration implements an effective Conservation Voltage Reduction program saving generation costs that are shared by its members.
The key to achieving additional benefits from the Smart Grid is to continue to fortify and adapt the business model for utility companies based on the prospect of achieving a favorable return on investment. Whether a utility is municipal, cooperative, or investor-owned, the revolutionary technologies that make these benefits possible require structural changes in the utility operating environment that are equally as bold. Regulators and legislators will have a major hand in the success of this endeavor as they wrestle with a range of challenges necessary to the success of the Smart Grid. These may include financing mechanisms such as low-interest government-backed loans, technology considerations based on variations for the service life of Smart Grid products when compared to legacy predecessors, changes to the accounting rules to avoid stranded assets in utility operations, and rate schemes that take advantage of emerging technologies.
1 http://www.smartgrid.gov/sites/default/files/pdfs/sgsr_main.pdf
2 U.S Congress, Public Law 110-140, Energy Independence and Security Act of 2007, Title XIII.
3 U.S. Congress, Public Law 111-5
NEMA - 2 - February 1, 2012
Background
“A penny saved is a penny earned” Variation on a phrase in George Herbert’s
Outlandish Proverbs circa 16334 In some cases, the Return on Investment (ROI) argument is extremely obvious—money spent on Smart Grid technologies promote efficiencies that enable the consumer to directly and immediately save money on their electric bill. In other cases, the ROI is much more nuanced. A utility company may incur a Smart Grid expense today in exchange for some form of operational efficiency down the road. Regulatory filings will often express these benefits in terms of their “net present value” or NPV, making it very easy to show ROI as a percentage of the expense. However, when the utility states the benefits over a period of time, it’s much more difficult to calculate an exact ROI.5 Regardless of the interval, the savings expressed by the utility company still represent a real operational expense that would otherwise become part of the rate base, which is ultimately another financial benefit to the consumer. And finally, it’s possible that in some cases a Smart Grid investment may yield a societal or environmental benefit that can’t be measured in dollars and cents.
Historically, Benjamin Franklin has been credited as the source of the quote listed above, when actually he was born 73 years after it was published in its original form, “A penny spar’d is twice got.”6 In the context of the Smart Grid, the economic equivalent of the penny-saved saying is contained in the energy sector cliché, which states that
the cheapest power plant is the one we don’t have to build. A typical example illustrating this concept is Virginia Dominion Power, which announced that it intended to install $600 million of equipment to create a “smart” electric grid that “will produce environmental benefits while providing customers with substantial cost savings.”7 As a starting point, Dominion installed 30,000 smart meters with an additional $1.5 million in synchrophasor technologies which together provide dynamic, real-time information about the conditions on the grid.8, 9 The operational efficiencies derived by the combination of a smart distribution and transmission system, in conjunction with Dominion’s EDGE℠ Energy Efficiency program for consumers, provide the primary drivers for the utility’s savings.10 As a result, Dominion’s Smart Grid implementation will produce customer savings of over $1 billion against the $600 million investment—an ROI of just under 67 percent. Environmental and societal benefits associated with the program include the ability to forgo the construction of two power plants, and delay the implementation of two more despite the fact that customer demand for electricity is expected to grow by more than 4,000 MW over the same period.11
4 http://www.phrases.org.uk/meanings/a-penny-saved-is-a-penny-earned.html
5 NPV calculations include a factor for the time-based value of the investment.
6 http://www.phrases.org.uk/meanings/a-penny-saved-is-a-penny-earned.html
7 http://www.sustainablebusiness.com/index.cfm/go/news.display/id/16269
8 http://www.dom.com/dimensions/customers/smart-grid-applications.jsp
9 http://dom.mediaroom.com/index.php?s=43&item=812
10 http://www.dom.com/business/dominion-voltage/edge-overview.jsp
11 Ibid.

NEMA - 3 - February 1, 2012
The Case for Sustained Utility Company Investment “1. Electrification”
National Academy of Engineering, Top Engineering Achievements of the 20th Century12
Collectively, we are faced with an aging, over-stressed electric grid—parts of which are dangerously antiquated. As many have noted relative to the quote from the National Academy of Engineering above, even as we complete the first decade of the 21st century, if Thomas Edison or George Westinghouse were alive today, they would recognize much of the technology as the same they had used to build electric grids in the late 1800s. The blackout in August of 2003 that affected the northeastern United States and central Canada was an eye-opening event that resulted in a number of studies about the performance of the grid. The aftermath of the event included having an impact on two major pieces of federal legislation: the Energy Policy Act of 2005 and the Energy Independence and Security Act of 2007. Portions of each law dealt with electricity reliability and the Smart Grid. In July of 2004, the North American Electricity Reliability Council issued a report to the NERC Board of Trustees on the causes of the blackout.13 Viewing the event from several perspectives, the report details the conditions (including weather and load) in the moments leading up to the event that triggered the outage, and then follows the behavior of multiple grid elements (including the operators) as the events of the day unfolded. In a moment of absolute clarity describing the cause of the blackout, the report states, “Simply put—blaming a tree for contacting a line serves no useful purpose.” 14 The report then goes on to list a variety of deficiencies that include everything from a lack of situational awareness and poorly trained operators, to failed alarms and poor vegetation management practices.
In December of 2011, Commonwealth Edison filed a “first-of-its-kind utility performance metrics program with financial penalties” with the Illinois Commerce Commission.15 As part of a series of filings in its grid modernization program, the initial filing “triggered a process that should lead to a $44 million reduction in ComEd’s current rates.”16 The metrics
outlined in the filing focus on “improving system reliability, reducing estimated bills, reducing customer costs associated with unaccounted for energy consumption and theft, and increasing support for minority- and women-owned businesses. Among the performance standards are:17
Reducing the frequency of outages by 20 percent over 10 years resulting in 700,000 fewer outages per year. This will save consumers a projected $100 million in outage-related costs.
Reducing annual average outage duration by 15 percent over 10 years.
Reducing ComEd’s Southern Region frequency of outages by 20 percent over 10 years. This area includes the southern suburbs, which have traditionally lagged other regions in service reliability.
12
http://www.nationalacademies.org/greatachievements/Feb22Release.PDF, February 22, 2000. 13
Technical Analysis of the August 14, 2003 Blackout: What Happened, Why, and What Did We Learn? North American Electric Reliability Corporation, Princeton, NJ, July 13, 2004. 14
Ibid, pp. 94. 15
http://www.smartenergyil.com/update/comed-files-historic-utility-accountability-standards-benefit-consumers 16
Ibid 17
Ibid

NEMA - 4 - February 1, 2012
Reducing ComEd’s Northeastern Region frequency of outages by 20 percent. This area includes the north and northwest suburbs, which were devastated by storms this past summer. This metric assumes that HB 3036 (trailer bill) is signed by the Governor.
Improvement in the total number of customers who exceed the service reliability targets by 75 percent over the 10 year period.
Reducing the number of annual estimated electric bills by 90 percent over 10 years.
Reducing consumption on inactive meters, a cost borne by all customers, by 90 percent over 10 years.
Reducing electricity theft, a cost borne by all customers, by 50 percent over 10 years.
Reducing bad debt expenses, a cost borne by all customers, by $30 million over 10 years. Here again, in addition to the financial benefits enumerated above the ComEd announcement projects a societal benefit by “increasing opportunities for minority- and women-owned businesses by 15 percent over a 10 year period, representing millions in additional spending every year for these businesses.”18 ComEd is one of many utilities taking an aggressive approach to its Smart Grid implementation plans. A number of other examples are available on the Smart Grid Information Clearinghouse website: http://www.sgiclearinghouse.org/businesscases.
The Case for Involving the Electricity Customer “Improving consumers' understanding of and access to the electric energy usage information of the consumers will help consumers more effectively manage usage.”
S.1029, The Electric Consumer Right to Know Act or e-KNOW Act19 Electricity customers come in a variety of sizes and types, but they are generally broken down into three categories: residential, commercial, and industrial. Some customers can occupy multiple categories as companies like Google and Boeing operate significantly large office buildings in addition to large data centers and manufacturing facilities. In the Department of Defense, base-level metering is not uncommon which means that a single military facility could operate residential (barracks and housing), commercial (exchanges, commissaries, and hospitals), and industrial (operational units and motor pools) facilities concurrently on an installation’s electric bill.
Number of Customers (Pct. of Total)
Thousand MWh (Pct. of Use)
Avg. Retail Price in cents per kWh
Residential 125.7 million (87.22%)
1,445,708 (38.51%)
11.54
Commercial 17.7 million (12.26%)
1,330,199 (35.43%)
10.19
Industrial 0.748 million (0.52%)
970,873 (25.86%)
6.77
All Sectors 144.140 million 3,754,493 9.83
Table 1. U.S. Retail Electricity Sales Data, 2010
18
Ibid 19
http://www.gpo.gov/fdsys/pkg/BILLS-112s1029is/pdf/BILLS-112s1029is.pdf

NEMA - 5 - February 1, 2012
According to the U.S. Energy Information Administration’s Electric Power Annual (EPA) 2010 report, Table 1 represents the amount of electricity used by each of the three customer categories. It’s amazing how close the breakdown in usage is across the three categories despite the vast differences in numbers of customers.20 In terms of getting the customer involved with his or her energy usage, the White House Policy Framework for the 21st Century Grid notes that, “Commercial and industrial (C&I) consumers enjoy powerful opportunities for energy efficiency and demand response, but generally experience fewer of the information and access barriers that affect residential consumers and small businesses.”21 In June 2010, the American Council for an Energy-Efficient Economy (ACEEE) released a report that examined the results of 57 feedback studies “which had sufficient data on the energy savings from various feedback approaches.”22 In its analysis, the ACEEE cited a variety of customer feedback mechanisms that were categorized as either “indirect,” meaning enhanced billing, websites, and daily or weekly reporting, or “direct” which included real-time and premise-level information down to the individual appliance. As the report states, “if broadly implemented in the United States using well-designed programs, residential sector feedback programs could provide the equivalent of 100 billion kilowatt-hours of electricity savings annually by 2030.”23
The most successful implementation in terms of integrating the consumer into the Smart Grid is the Pecan Street demonstration project hosted by Austin Energy and the University of Texas in the historic Mueller neighborhood of Austin, Texas. The Pecan Street project is the very model of interoperability as a smart distribution system is fully integrated with renewable generation through solar
panels, a local communication system, and consumer controls to implement an advanced electricity and water conservation environment. The benefits of the fully-integrated environment in the Pecan Street project were summed up in a 2010 report which included a set of recommendations for Austin Energy. Some of the cost-saving benefits the report cites include “fuel savings, decreased line losses, and less need for transmission and distribution lines.”24 The report goes on to lay the groundwork for the changing relationship between the consumer and the utility company. In the future, the consumer cannot be simply considered a load to the utility company, but has to be seen as an integrated partner hosting renewable generation devices and participating in demand response programs. It goes on to detail rate structures and business models that will help to complete this transformation.
The Case for System Efficiency In the mid-1970s, researchers at Lawrence Livermore National Laboratory in California began tracking and publishing an annual “Energy Flow Chart” based on the total energy inputs and points of
20
http://www.eia.gov/electricity/annual/pdf/tablees1.pdf 21
Executive Office of the President, National Science and Technology Council, Washington, DC, 20502; June 13, 2011, pp37. 22
Ehrhardt-Martinez, K., et. al., Advanced Metering Initiatives and Residential Feedback Approaches: A Meta-Review for Household Electricity-Saving Opportunities, © June 2010, ACEEE, Washington, DC 20045 23
Ibid, pp.iii 24
http://www.pecanstreet.org/wordpress/wp-content/uploads/2011/08/Pecan_Final_Report_March_2010.pdf

NEMA - 6 - February 1, 2012
consumption in the U.S. economy.25 Based on “vast quantities of data from the Department of Energy’s Energy Information Administration (EIA),” perhaps the most telling detail in the chart is the area dedicated to electricity generation. As seen in Figure 1, for the estimated data in 2010 of the 39.49 quads (short for quadrillion BTU) that were committed to the process of electricity generation, some 26.78 quads or just over 67.8 percent of the total input ended up as “Rejected Energy.”
Figure 1. 2010 Energy Flow Chart
From the perspective of the energy flow chart, there is room for improvement in the operation of the electric grid. But the question is, “How?” What’s lacking in the Livermore diagrams is any level of granularity in the data that the observer can turn into actionable intelligence; that is where the Smart Grid provides value. Voltage optimization is the holy grail of electric power for the distribution system. Utility companies strive to keep voltages within regulator-specified limits in order to provide a sustainable electrical current for devices connected to the grid. Meanwhile, manufacturers strive to produce devices that will tolerate the voltage fluctuations that are inherent within those limits. Too much voltage fed into a home, office, or factory (a condition called “overvoltage”) is a waste of energy that might cause certain devices to produce excessive amounts of heat in their internal wiring. Too little voltage can result in a condition called a “brownout,” where individual devices might trip on and off as the voltage continues to fluctuate below acceptable levels. Either way, too much or too little voltage could result in reducing the service life of the device.
25
https://str.llnl.gov/Sep09/simon.html
NEMA - 7 - February 1, 2012
In a three-year study called the Distribution Efficiency Initiative (DEI), the Northwest Energy Efficiency Alliance (NEEA) “studied and evaluated cost-effective methods of implementing DSE [distribution system efficiency] and voltage optimization (VO) on distribution systems.”26 Utilizing both a load research study and concurrent demonstration project, the outcomes were described in a February 2010 Transmission & Distribution World article as follows:27
“The overall results of the study conclusively show that operating a utility distribution system in the lower half of the American National Standards Institute (ANSI) C84.1 standards' acceptable voltage range of 120 V to 114 V saves energy, lowers demand and reduces reactive power requirements without negatively impacting customer service. By implementing both DSE and VO in concert, utilities can cost effectively achieve a 1% to 3% energy kilowatt-hour reduction, a 2% to 4% reduction in kilowatt demand, and a 4% to 10% reduction in reactive power demand. Computer models demonstrate that 10% to 20% of the energy savings can occur on the utility side of the meter.”
Seizing on the DEI results, the Bonneville Power Administration (BPA) has implemented an Energy Smart Utility Efficiency (ESUE) program focused on distribution efficiency and conservation voltage reduction (CVR). Established in 1937, the BPA markets wholesale electrical power from 31 hydroelectric sites located on the Columbia River and a transmission network that covers Washington, Oregon, and Idaho and extends into parts of Montana, California, Nevada, Utah, and Wyoming.28 While they don’t have a specific stake in the
distribution grid, as a public service organization formed under the federal government, the BPA is committed to advancing a vision that includes responsible environmental stewardship and accountability to the region. 29 Effective voltage optimization is a concept that relies on all of the capabilities of the Smart Grid. Simply lowering voltage at the substation may cause unacceptably low voltages at the tail-end of a distribution line. In a similar vein, raising the voltages at the substation could cause persistent overvoltage conditions at the head-end. In order to successfully implement voltage optimization, CVR systems require the assistance of the Smart Grid’s most visible component—the advanced metering infrastructure (AMI) or so-called “smart meter.” The first generations of electric meters simply had the capability of measuring (electromechanical) and/or reporting (automatic meter reading or AMR) the amount of electricity that passed through them. Modern AMI-based smart meters cannot only measure electricity usage, but they can also report system voltages at the customer end that would be necessary for a utility company to implement voltage optimization. For two implementations in the BPA service region (the Clark and Cowlitz Public Utility Divisions), the ESUE’s incentive program offered to pay the utility either twenty-five cents per kWh, or 70 percent of the project installed cost, whichever is less.30 Either way it’s a win-win situation for the consumers and utility companies alike. Utility companies win because they can leverage the existing investment in smart meters, see greater efficiency in the overall distribution system, and can recover their costs by
26
http://tdworld.com/overhead_distribution/distribution-system-efficiency-20100201 27
Ibid, February 1, 2010 28
http://www.bpa.gov/corporate/About_BPA 29
Ibid 30
http://tdworld.com/overhead_distribution/voltage-optimization-20101101, November 1, 2010
NEMA - 8 - February 1, 2012
lowering their generation levels and/or power-purchasing burden. At the same time, consumers win because of the savings in future generation costs by the utility and the environmental benefits. According to one article, if we achieve an increase of only three percent across the board, it would be equivalent to “over twice the energy provided by solar power installations in the U.S. And, since we’re talking demand reduction, benefits don’t rely on weather or time of day, and you don’t have to figure out how to store it.”31
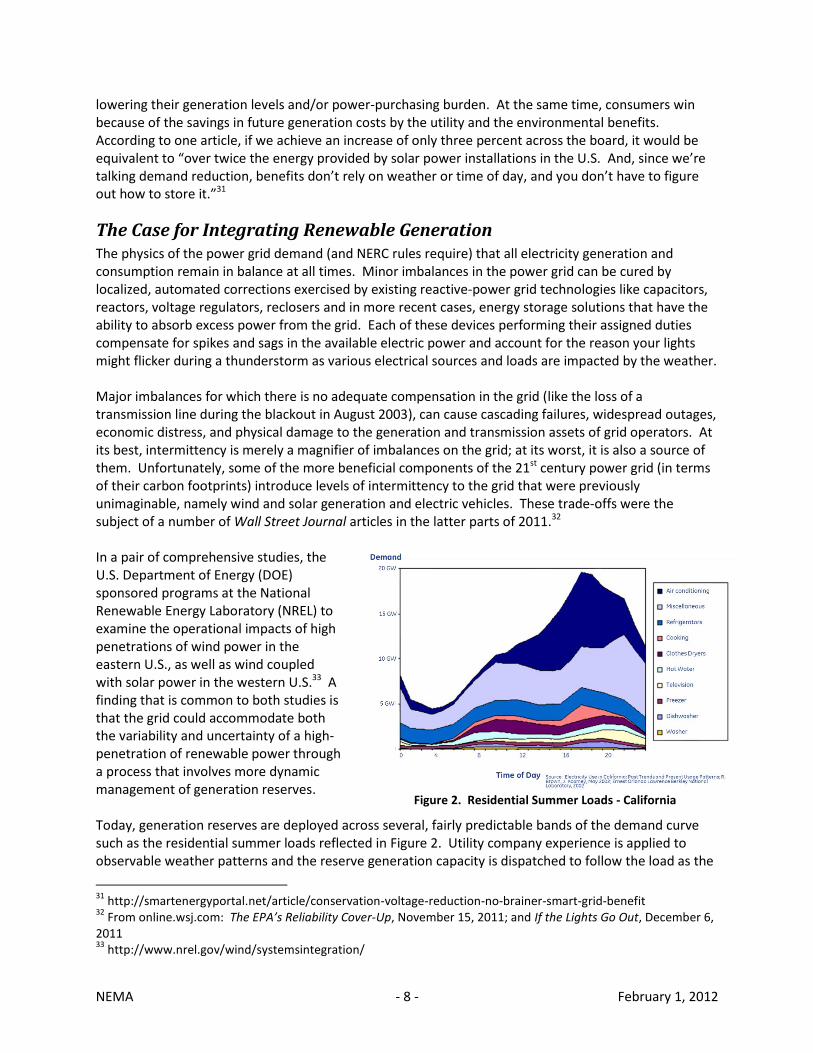
The Case for Integrating Renewable Generation The physics of the power grid demand (and NERC rules require) that all electricity generation and consumption remain in balance at all times. Minor imbalances in the power grid can be cured by localized, automated corrections exercised by existing reactive-power grid technologies like capacitors, reactors, voltage regulators, reclosers and in more recent cases, energy storage solutions that have the ability to absorb excess power from the grid. Each of these devices performing their assigned duties compensate for spikes and sags in the available electric power and account for the reason your lights might flicker during a thunderstorm as various electrical sources and loads are impacted by the weather. Major imbalances for which there is no adequate compensation in the grid (like the loss of a transmission line during the blackout in August 2003), can cause cascading failures, widespread outages, economic distress, and physical damage to the generation and transmission assets of grid operators. At its best, intermittency is merely a magnifier of imbalances on the grid; at its worst, it is also a source of them. Unfortunately, some of the more beneficial components of the 21st century power grid (in terms of their carbon footprints) introduce levels of intermittency to the grid that were previously unimaginable, namely wind and solar generation and electric vehicles. These trade-offs were the subject of a number of Wall Street Journal articles in the latter parts of 2011.32 In a pair of comprehensive studies, the U.S. Department of Energy (DOE) sponsored programs at the National Renewable Energy Laboratory (NREL) to examine the operational impacts of high penetrations of wind power in the eastern U.S., as well as wind coupled with solar power in the western U.S.33 A finding that is common to both studies is that the grid could accommodate both the variability and uncertainty of a high-penetration of renewable power through a process that involves more dynamic management of generation reserves. Today, generation reserves are deployed across several, fairly predictable bands of the demand curve such as the residential summer loads reflected in Figure 2. Utility company experience is applied to observable weather patterns and the reserve generation capacity is dispatched to follow the load as the
31
http://smartenergyportal.net/article/conservation-voltage-reduction-no-brainer-smart-grid-benefit 32
From online.wsj.com: The EPA’s Reliability Cover-Up, November 15, 2011; and If the Lights Go Out, December 6, 2011 33
http://www.nrel.gov/wind/systemsintegration/
Figure 2. Residential Summer Loads - California

NEMA - 9 - February 1, 2012
curve moves from the nominal base load demand to the expected peak over the course of a day.34 The key concepts in this description are the terms ”predictable” and ”dispatchable” as neither of them can be applied to wind and solar generation capabilities in the same operational sense that utility companies use them today. In a study released in December 2011 by Alstom Grid, Inc. for the U.S. Department of Energy,35 a variety of techniques for accommodating high penetrations of wind power were described based on the lessons learned from utility companies across the globe. Based on survey information, a key theme in the best practices presented in the report is flexibility: procuring flexible resources, managing congestion, economical dispatch, dispatchable loads, flexible generation, etc.36 The report goes on to say “efficient integration of wind energy requires that the grid operator has access to the proper mix of flexible resources ranging from supply-side, delivery-side and the demand-side…several of the changes in operational processes, which respondents rank as having high value for wind integration, are related to measures that are known to provide flexibility to power systems.”37
An interesting paradigm related to this concept is an arrangement that has been struck between Minnesota Power, a utility in the U.S., and Manitoba Hydro, a utility in Canada. In May 2011, Minnesota Power announced a deal that “includes a wind storage provision that allows Minnesota Power to transmit energy northward from its wind farms in
North Dakota when wind production is high or electric loads are low. Manitoba Hydro will then absorb the wind power into its system—in essence storing the wind power, using the Manitoba system as a rechargeable battery.”38 The “storage” referred to in this article is actually the backbone of Manitoba Hydro’s system, a series of 14 hydroelectric systems scattered throughout the province. The electricity from Minnesota Power’s wind farms is aggregated and incorporated into Manitoba Hydro’s base load, and in order to keep its grid in balance, Manitoba Hydro will simply curtail their hydroelectric dams.
The Case for Supporting Electric Vehicles In addition to the variability of renewable generation, electric vehicles (EVs) present a new and interesting challenge to grid operators: the idea of a mobile load. While a certain percentage of the electrical load has always been mobile, it has never approached the levels that could be possible with EVs. In the White House’s policy statement for the 21st century grid, the Obama administration reiterated its goal of having one million electric vehicles on the road by 2015.39 In an online search of Library of Congress documents, 57 pieces of legislation containing the phrase “electric vehicle,” (many
34
Blume, Steven W., Electric Power System Basics for the Nonelectrical Professional, pp. 188-195, © 2007 by the Institute of Electrical and Electronics Engineers, Inc. Published by John Wiley & Sons Inc., Hoboken, NJ. 35
Jones, Lawrence E., Strategies and Decision Support Systems for Integrating Variable Energy Resources in Control Centers for Reliable Grid Operations, U.S. Government Contract No. DE-EE0001375. 36
Ibid, Section 5.4 and 5.5 37
Ibid, pp. 30 38
http://www.cbc.ca/news/canada/manitoba/story/2011/05/24/mb-hydro-sale-power-minnesota.html 39
Executive Office of the President, National Science and Technology Council, A Policy Framework for the 21st
Century Grid: Enabling Our Secure Energy Future, pp. 1.

NEMA - 10 - February 1, 2012
targeted at incentivizing the EV or charging station purchases) had been introduced during the first session of the 112th U.S. Congress.40 In essence, a vast proliferation of EVs not only means additional overall electrical demand, but because the vast majority of EVs are targeted to the consumer market, the EVs that are charging in a residential area overnight will possibly appear in various retail, commercial, and industrial locations during the day. While a certain amount of the electricity load has always been mobile (following the commuter from home to work and back again), the amount of electricity involved with electric vehicle charging takes this challenge to a whole new level. The National Electrical Code outlines specifications for electric vehicle charging requirements,41 for which there are three charging levels being developed in the U.S. by the Society of Automotive Engineers (SAE):42
Level 1 uses the common 110-volt electrical supply in order to facilitate virtually ubiquitous access for EV charging—any functioning electrical outlet can be used to charge a vehicle;
Level 2 charging uses a 240-volt electrical supply and will require that a dedicated charging station be hard-wired to a fixed location. According to the Tennessee Valley Authority, Level 2 will likely be the charging level of choice for commercial EVs and public outlets;43 and
Level 3 has not yet been defined, but could entail even higher voltage than Level 2 charging, as well as some form of direct current (dc) fast charging. (According to DOE sources44, lower-voltage dc charging has been proposed for Level 1 (up to 20kW dc) and Level 2 (up to 80kW dc) charging standards).
Depending on how they are supported by the various utility companies and regulatory commissions, high penetrations of EVs could require substantial changes to the grid. In terms of the utility business model, it may be necessary to support special rates for EV charging, changes in metering and/or submetering technologies, and back office systems that support some form of roaming charge for EV owners that could potentially cross control area boundaries. It could also be necessary to create third-party classifications for parking providers, convenience stores, retailers, or employers who want to offer EV charging for their customers and employees. Once all of these issues are resolved, the utility company still needs to figure out how to incorporate the operational implications of these factors in their grid management system. The conceptual design of a Smart Grid forms the ideal platform for accommodating both the variability and mobility of the load associated with electric vehicles. Two documents, the Federal Energy Regulatory Commission’s (FERC) Smart Grid Policy; Final Rule45 and the National Institute of Standards and Technology’s NIST Framework and Roadmap for Smart Grid Interoperability Standards,46 form the primary sources from which a vast majority of industry draw their direction. Together these publications list eight priority application areas for Smart Grid standardization:
40
Search conducted on www.thomas.loc.gov, December 30, 2011; the 112th
Congress began on January 5, 2011. 41
National Fire Protection Association, NFPA 70®: National Electrical Code, Article 625, 2011. 42
https://www.tva.gov/environment/technology/car_infrastructure.htm 43
Ibid. 44
http://www1.eere.energy.gov/cleancities/toolbox/pdfs/ev_charging_requirements.pdf 45
FERC 18 CFR, Chapter 1; July 27, 2009 46
NIST Special Publication 1108; Release 1.0, January 2010
NEMA - 11 - February 1, 2012
Demand Response and Consumer Energy Efficiency
Wide-Area Situational Awareness
Energy Storage
Electric Transportation
Advanced Metering Infrastructure
Distribution Grid Management
Cyber Security
Network Communications Any grid operator who must address a high penetration of renewable generation and/or widespread adoption of electric vehicles would have to rely on the tools that deliver wide-area situational awareness, network communications, and distribution management in order to achieve the necessary levels of operational flexibility. Also, one of the greatest weapons for dealing with intermittency is the application of energy storage technologies, which also happens to be another of the eight priority application areas.
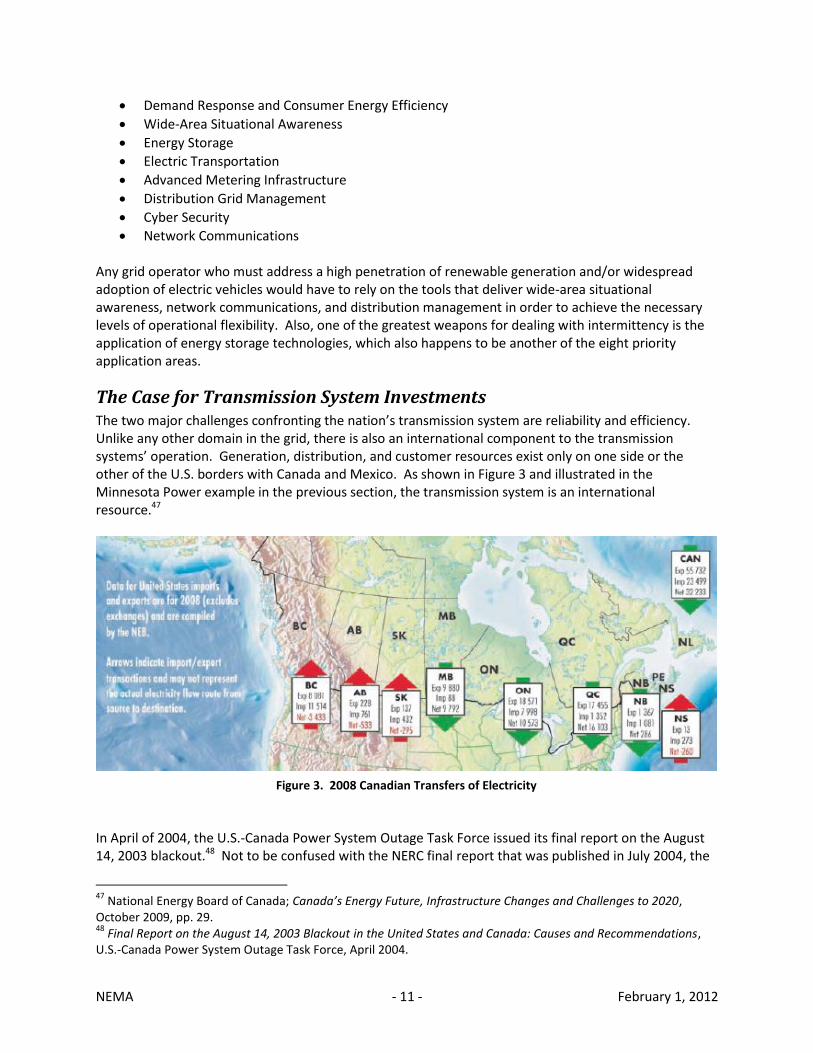
The Case for Transmission System Investments The two major challenges confronting the nation’s transmission system are reliability and efficiency. Unlike any other domain in the grid, there is also an international component to the transmission systems’ operation. Generation, distribution, and customer resources exist only on one side or the other of the U.S. borders with Canada and Mexico. As shown in Figure 3 and illustrated in the Minnesota Power example in the previous section, the transmission system is an international resource.47
In April of 2004, the U.S.-Canada Power System Outage Task Force issued its final report on the August 14, 2003 blackout.48 Not to be confused with the NERC final report that was published in July 2004, the
47
National Energy Board of Canada; Canada’s Energy Future, Infrastructure Changes and Challenges to 2020, October 2009, pp. 29. 48
Final Report on the August 14, 2003 Blackout in the United States and Canada: Causes and Recommendations, U.S.-Canada Power System Outage Task Force, April 2004.
Figure 3. 2008 Canadian Transfers of Electricity
NEMA - 12 - February 1, 2012
U.S.-Canada Task Force was formed as a collaborative effort sponsored by the U.S. Department of Energy and the Canadian Ministry of Natural Resources. Because the failures of the August blackout were felt on both sides of the U.S.-Canadian border, the introductory remarks to the Recommendations section state that, “The interconnected nature of the transmission grid requires that reliability standards be identical or compatible on both sides of the Canadian/U.S. border.”49 The report then includes a collection of 46 recommendations, fourteen of which deal specifically with reliability. To this end, Recommendation 4 states, “Clarify that prudent expenditures and investments for bulk system reliability (including investments in new technologies) will be recoverable through transmission rates.”50 As previously mentioned, the impacts of the August 2003 outage influenced the development of the Energy Policy Act of 2005. Pursuant to this, in July of 2006 the Federal Energy Regulatory Commission (FERC) issued Final Rule 679 “for the purpose of benefiting consumers by ensuring reliability and reducing the cost of delivered power by reducing transmission congestion.”51 Attempting to quantify the hard costs of transmission congestion, one section of the ruling notes that:
“Many commenters agree that there is a significant need for new investment in transmission facilities. EEI states that, although increases in transmission investment are predicted over the 2004 to 2008 period, the industry still has not reached the optimal level of investment. International Transmission notes that growth in transmission capacity has lagged behind the growth in peak demand over the last three decades and this trend is projected to continue through at least 2012. International Transmission cites to studies estimating the cost of power interruptions and fluctuations to range from between $29 billion and $135 billion annually, the cost of the August 2003 Northeast-Midwest blackout to be between $4 billion and $10 billion, congestion costs of $4.8 billion in the ISO/RTO markets of California, New York, New England, the Midwest and PJM for 1999 to 2002, and increases in PJM congestion costs, from $499 million in 2003 to $808 million in 2004.”52
The benefits of the transmission investments spurred by FERC Order 679 are evident the U.S. Department of Energy’s Smart Grid System Report issued in July 2009. In the three years following the FERC Final Rule, the System Report observed that “gross annual measures of grid operating efficiency have been steady or improving slightly as the amount of energy lost in generation…and transmission and distribution losses improved very slightly” as a percentage of net generation. While this is an encouraging trend, not every indicator is positive. Indices for Service Average Interruption Duration (SAIDI), Customer Average Interruption Duration (CAIDI), and System Average Interruption Frequency (SAIFI) have not improved. The report attributes that “the worsening trend in these indices suggests that a lack of investment in the delivery infrastructure is having an impact.”53 A continuing challenge, especially with respect to large-scale renewable energy, is the ability to get electricity from the generation source to the point of consumption. This problem is especially
49
Ibid, pp. 143. 50
Ibid, pp. 146. 51
18 CFR Part 35, Federal Energy Regulatory Commission, Promoting Transmission Investment through Pricing Reform, (Docket No. RM06-4-000; Order No. 679), Final Rule, Issued July 20, 2006. 52
Ibid, pp. 8-9 53
U.S. Department of Energy, Smart Grid System Report, July 2009, pp. 45.

NEMA - 13 - February 1, 2012
noticeable when you compare a U.S. map showing the population density to those showing wind and solar potential.
Figure 4. U.S. Population Density by County
Figure 5. U.S. Wind Power Potential Figure 6. U.S. Photovoltaic Solar Potential
In September of 2009, the National Energy Technology Laboratory of the U.S. Department of Energy published a document called The Transmission Smart Grid Imperative.54 Because of advancements driven by the Smart Grid, the report states that, “new and emerging requirements find transmission in roles it was not designed to perform.”55 The stresses on the transmission system will not only increase because of wind and solar penetration, but will also be driven by more active wholesale markets as a result of TOU rates. Section 1304 of the Energy Independence and Security Act states that the Secretary of Energy “shall seek to leverage existing Smart Grid deployments…to facilitate the commercial transition from the current power transmission and distribution system technologies to advanced technologies.”56 To this end, the American Reinvestment and Recovery Act of 2009 included specific allocations for the incorporation of phasor measurement units (PMUs), better known as synchrophasors and other transmission system optimization technologies. As of December 2010, the Smart Grid Information Clearing House listed ten projects that will implement a total of 625 PMUs as part of the stimulus program.
54
http://www.netl.doe.gov/smartgrid/referenceshelf/whitepapers/The%20Transmission%20Smart%20Grid%20Imperative_2009_09_29.pdf 55
Ibid, pp. 4 56
PL 110-140, Energy Independence and Security Act of 2007, Title XIII, Section 1304(2)(B).
NEMA - 14 - February 1, 2012
An example of what can be gained on the transmission system relative to the EISA objectives via Smart
Grid is the Dynamic Line Ratings Demonstration Project being implemented by Oncor Electric Delivery Company, LLC in Texas. According to the Smart Grid Information Clearinghouse, the objective of this project is to “reduce transmission-line congestion and increase the carrying capacity of the transmission lines…so that transmission systems can be utilized to their full capacity, decreasing congestion and deferring upgrades and additional construction.”57 The demonstration project runs through 2013 with the results indicating that the smarter transmission system will deliver reduced electric costs, increased power reliability, and decreased greenhouse gas
emissions.
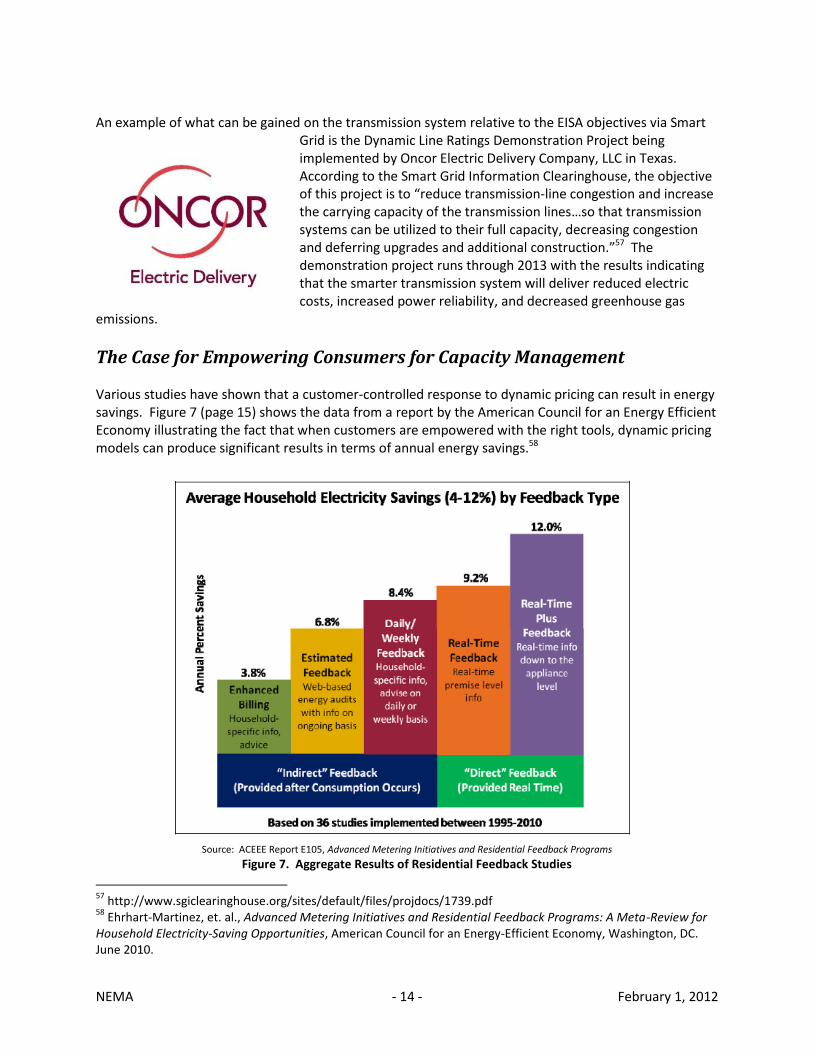
The Case for Empowering Consumers for Capacity Management Various studies have shown that a customer-controlled response to dynamic pricing can result in energy savings. Figure 7 (page 15) shows the data from a report by the American Council for an Energy Efficient Economy illustrating the fact that when customers are empowered with the right tools, dynamic pricing models can produce significant results in terms of annual energy savings.58
Source: ACEEE Report E105, Advanced Metering Initiatives and Residential Feedback Programs
Figure 7. Aggregate Results of Residential Feedback Studies
57
http://www.sgiclearinghouse.org/sites/default/files/projdocs/1739.pdf 58
Ehrhart-Martinez, et. al., Advanced Metering Initiatives and Residential Feedback Programs: A Meta-Review for Household Electricity-Saving Opportunities, American Council for an Energy-Efficient Economy, Washington, DC. June 2010.

NEMA - 15 - February 1, 2012
Additional research for commercial/industrial customers using “automated” demand response built into devices (ADR, as opposed to manual customer response) provides both substantial savings and improved response times particularly in terms of peak load reduction. Pilot studies with residential customers have also indicated that increased information regarding their current energy usage and dynamic pricing results in a large number of customers responding either manually or via automatic responses from pre-programmed devices (e.g., programmable communicating thermostats, energy management controllers/systems). Figure 8 (page 16)shows the effectiveness of various rate schemes such as time of use (TOU), peak-time rebate (PTR), critical peak pricing (CPP), and real-time pricing (RTP) as standalone measures and in combination with ADR and customer feedback technologies.59
Source: The Brattle Group, http://www.brattle.com
Figure 8. Household Response to Dynamic Pricing of Electricity
Based on AMI communication networks, utilities are establishing pilots and in some cases larger rollouts of energy information, monitoring, and control devices within individual buildings. Many utilities with severe summer weather offer peak- or direct-load control programs (DLC) for their customers, allowing them to interrupt air conditioning and other non-essential devices on the days with the greatest demand. In conjunction with smart meters and AMI systems, utilities are now working to identify the energy management systems and home/commercial networked devices that provide the greatest benefits in these programs.
59
Faruqui, Amad and Sergicil, Sanem, Survey of Experimental Evidence, The Brattle Group, http://www.brattle.com/Experts/ExpertDetail.asp?ExpertID=164, January 10, 2009.

NEMA - 16 - February 1, 2012
Ideal dynamic pricing solutions empower customers to make their own decisions and to install systems themselves. Home area network (HAN) and home energy management systems (HEMS) can empower residents to automatically control HVAC, lighting, and plug-loads based on the price of electricity. Technology enhancements are making it practical to implement customer control based on pricing signals and not just demand response signals. Although the customer energy cost-saving benefits may not be large enough to be a strong motivator, the same new technology also enhances home security, automation, fire safety, and power quality. The combinational benefits can motivate voluntary adoption and relieve utilities of risk and liability by not “owning” the solution. New technology for plug-based load control uniquely identifies each plug-load and thus solves the 40-year-old problem of trying to control plug-based loads safely. For example, a window air conditioner is a typical plug-based ADR target. However, until recently the control system had no way to know if the unit had been unplugged during the middle of a DR event, or worse if it had been unplugged and replaced by a piece of medical equipment. Now, with unique appliance identification using plug RFID tags, the local receptacle controller only executes a DR signal or responds to a dynamic price signal if the correct target device is plugged in. Plug-load identification is key to demand and dynamic pricing response. Devices that monitor and report status (energy usage, utilization voltage) are commercially available for use in home/building automation. In some cases, the current cost(s) to the customer, when compared to the short-term savings have not been adequate to motivate individual customers to install these items. However, based on the results cited earlier, any utility seeking to control peak loads, match load dynamics to renewable generation outputs, and/or optimize system resources, relatively small customer energy savings (e.g., 5 percent) could justify the utility subsidizing cost of direct load control, energy management systems, and home area networks for their customers. Motivating customers to proceed with these efforts may require customer education, retail distribution of suitable devices (perhaps certified by the utility and/or national standards organizations), and customer incentives with support/approval from local or regional regulatory agencies. These regulatory agencies may also need information/support regarding the benefits of including voltage, as well as energy usage so that both customers and electric utilities can benefit from better information and control of those parameters at the individual building and device location.
Conclusions and Call to Action A popular book on many business professionals’ reading lists in the 1990’s was Crossing the Chasm by Geoffrey A. Moore. The gist of the book is that there are multiple stages to the product adoption curve and that the most difficult transition (i.e., the chasm) was moving from the early adopters into the first stages of mass deployment. In terms of the Smart Grid, many feel that we are at exactly that point. The question then becomes, what would be necessary to maintain enough momentum for the industry to breach the chasm? In order to sustain the business case for utility companies and manufacturers in a way that is palatable for regulators and consumers, there are several options:
Legislative Actions
Low interest rate loans. Capital investment is the life blood of the Smart Grid business case. In order for utility companies to reach the investment levels necessary for full deployment, they will have to borrow at favorable interest rates. Though a significant amount of stimulus was directed to the grid, the amount of spending to date has yielded only modest results as

NEMA - 17 - February 1, 2012
evidenced by the Department of Energy Smart Grid Systems Report. While the ARRA certainly helped get things started, a lot more is necessary. When you consider that $3.4 billion was allocated to the Smart Grid Investment Grant program, it averages out to only about $1 million per electric utility in the U.S. With estimates ranging from $200 billion worldwide (Pike Research60) to $2 trillion just for the U.S. (Electric Light & Power Online61), it’s obvious that a great deal of funding is going to be necessary for a long, long time. State and federal legislators need to promote government-backed loans as a low-interest option for utility companies.
Synchronization between service life and depreciation schedules. If the service life of a device is shortened, the accounting rules for how a utility carries that device on their books must undergo a similar change. The very definition of a “stranded asset” is when the service life is less than the depreciated life of a device. Rip-and-replace strategies for under-depreciated electrical gear will be very expensive if the accounting rules don’t keep up, and will provide mountains of frustration for regulators, customers, and utility companies. Legislators and regulators must work together to synchronize service life with utility company depreciation schedules.
Regulatory Actions
Adjustments in the effective service life and maintenance increments for power equipment systems. In order to achieve the full benefit of a smart grid, a great deal of technology penetration is necessary. In developing areas of the country, this is more easily accomplished as the grid can be “built smart” from the ground up. Because utility companies exist under a regulatory model, in many cases the service life of a given piece of electrical gear is very tightly controlled. The underlying digital technologies simply don’t have the same durability as their so-called “dumb grid” predecessors, and possible rapid advances in efficiency and security characteristics mandate a more forward-looking vision for devices on the grid. In order to facilitate the evolution of the grid, regulators are going to have to break from the decades-long service life models they’ve come to know and permit shorter service-life models for power equipment systems associated with Smart Grid. This must include additional allowances for maintenance of the smarter gear and provisions for routine replacements of those assets on a periodic basis.
Look for opportunities to implement well-structured pilot programs. A favorite quote from Vint Cerf, one of the men considered to be the father of the internet, is that nothing sells like a working demo. Utility companies should be looking for opportunities to implement projects that will prove the value of Smart Grid implementations. At the same time they should work with their regulators to structure those projects and identify a business case that can also be embraced by legislators who want to incentivize them. A remarkable example is the Smart Grid City initiative that was implemented by Xcel Energy in Boulder, Colorado. The industry should observe the lessons learned from the Xcel experience and use those lessons to define the characteristics of a well-structured pilot. Utility companies need to work with regulators to define these pilots and consumer education must be permitted as a legitimate expense.
Embrace creative rate schemes. Numerous studies have shown that the combination of Smart Grid technologies and creative rate schemes can create energy savings for consumers and
60
http://www.pikeresearch.com/newsroom/smart-grid-investment-to-total-200-billion-worldwide-by-2015 61
http://www.elp.com/index/allan-mchale-blog/blogs/elp-blogs/alan-mchale/post987_6042380411334018898.html

NEMA - 18 - February 1, 2012
reduce peak demand for utility companies.62 Regulators and legislators alike should consider creative pricing plans for Smart Grid programs that include time of use (TOU), real-time (RTP), and critical peak (CPP) pricing, as well as performance-based ratemaking and cost recovery. In doing so, models which include separate charges for infrastructure and service delivery need to be part of the rate structure. Also, rate mechanisms must be identified for third-party providers capable of delivering Smart Grid services, and a workable set of feed-in tariffs need to be fielded for consumer generated renewable energy. These rates must be designed to remove the disincentives for conservation and balance the risk and reward between the traditional ratepayer, the ratepayer as generator, and the regulated utility that would serve both of them. Encourage support for dynamic pricing information delivery to consumers in conjunction with in-building devices that provide measurement and control of load devices. Dynamic price ranges may need to become more aggressive to create a stronger incentive for adoption of Home Area Network solutions by customers.
Optimize the Transmission Network. Current transmission planning practices focus entirely on static line ratings. As seen in the Oncor example discussed earlier, there is a variety of benefits to be gained by allowing optimization of the transmission system through dynamic line ratings. Recommendation 27 of the US-Canada task force report in April 2004 encourages the use of dynamic line ratings, citing that variations in ambient temperature, wind, and other environmental factors create “unnecessary and unacceptable uncertainties about the safe carrying capacity of individual lines on the transmission networks.”63 Making regulatory allowances for utilities to optimize their transmission system through the use of synchrophasors and dynamic line ratings will allow them to absorb additional capacity from renewable and distributed generation sources at a fraction of what it costs to either upgrade existing transmission corridors or build new lines.
62
A catalog of such studies is available on the website of Dr. Amad Faruqui, a pillar of the Smart Grid community and employee of the Brattle Group: http://www.brattle.com/Experts/ExpertDetail.asp?ExpertID=164. Other examples are available via the U.S. Department of Energy website for the Smart Grid Information Clearinghouse: http://www.sgiclearinghouse.org/Project 63
U.S.-Canada Power System Outage Task Force, Final Report on the August 14, 2003 Blackout in the United States and Canada: Causes and Recommendations, April 2004, pp. 162.

NEMA - 19 - February 1, 2012
Disclaimer This paper was assembled and edited by the staff and member companies of NEMA, The Association of Electrical Equipment and Medical Imaging Manufacturers. Supporters of and contributors to this effort include: 2D2C, Inc.; ABB Inc.; Cooper Power Systems; Eaton Corporation; Emerson Electric Co.; G&W Electric Company; General Electric; Hubbell Power System; Itron, Inc.; Legrand North America; Lutron Electronics Company, Inc.; Mitsubishi Electric Power Products, Inc.; S&C Electric Company; Schneider Electric; Siemens Energy, Inc.; Technology Research Corporation; The Valley Group, a Nexans company; Thomas & Betts Corporation; and the Zigbee Alliance. Neither NEMA, its members, nor any person acting on behalf of any of the above:
MAKES ANY WARRANTY OR REPRESENTATION, EXPRESS OR IMPLIED, with respect to the accuracy, completeness, or usefulness of the information contained in this report, or that the use of any information, apparatus, process, or composition disclosed in this report may not infringe privately owned rights; or
Assumes any liabilities with respect to the use of, or for damages resulting from the use of, any information, apparatus, process, or composition disclosed in this report; or
Reference herein to any specific commercial product, process, or service by trade name, trademark, manufacturer, or otherwise, does not necessarily constitute or imply its endorsement, recommendation, or favoring by NEMA or its members.
© 2012 by NEMA, 1300 North 17th Street, Suite 1752, Rosslyn, VA 22209

National Electrical Manufacturers Association 1300 North 17th Street, Suite 1752, Rosslyn, VA 22209