measuring fundraising return on investment and the …€¦ · measuring fundraising return on...
TRANSCRIPT

Principles of Fundraising Strategy for
Nonprofit Organizations
2013
White Paper
Measuring Fundraising Return on Investment and the Impact of Wealth Intelligence

About This PaperEvaluating Return on Investment (ROI) provides great advantage for moving a nonprofit organization’s fundraising office, management and the board forward in aligning the business of fundraising with their overall philanthropic mission. WealthEngine has written its second edition of Measuring Fundraising Return on Investment, to explore the various factors to consider when measuring the ROI of fundraising, including the ROI when systematically deploying wealth intelligence.
Since our first edition in 2010, there has been a shift in attitudes towards measuring and evaluating ROI, as donations by Americans to nonprofit groups mirror the slow recovery of the larger economy and organizations realize that investing in fundraising is likely to improve returns. In this paper, we include the findings from a WealthEngine survey on measuring ROI and business analytics, along with case studies, perspectives from industry leaders, and in-depth content on the non-financial measurements of return.
WealthEngine Publications Team: Special Thanks to:
©2013 WealthEngineTM, Inc. All Rights Reserved.
Reproduction and distribution of this publication in any form without prior written permission is forbidden. The information
contained herein has been obtained from sources believed to be reliable. This document is informational in nature and we do not
guarantee any of the information either expressed or implied. Readers are encouraged to consult with their appropriate legal,
accounting and professional counsel before implementing any suggested actions. WealthEngine has no liability for errors, omissions
or inadequacies in the information contained herein or for interpretations thereof and shall not be held liable for any claims or
losses that may rise from the implementation of the best practices in this report. This document includes ideas for enhancing
WealthEngine’s products. These ideas are subject to change at any time.
Tony Glowacki, President and Chief Executive Officer
Shane Bair, Creative Director
Sally Boucher, Director of Research, WealthEngine Institute
Lili Mehta, Senior Consultant, Marketing & Special Projects
Kimberly O’Donnell, Chief Marketing Officer
Wendy Tanner, Marketing Communications Specialist
Norman Olshansky, Fundraising Consultant and President of NFP Consulting Resources
Rick Dunham, President & CEO of Dunham+Company
Carrie Collins, Vice President of Institutional Advancement at University of the Sciences, Philadelphia PA
Mark Koenig, Senior Director for Advancement Services at Oregon State University Foundation
David Ferguson, Executive Director at Maryland Republican Party (Maryland GOP)

Measuring Fundraising Return on Investment 1Measuring Fundraising Return on Investment 1
ContentsOverview 2The Fundraising Landscape 6Measuring Return on Investment 14
Calculating Net Revenues 17Other Important Measurements of Success 18Measuring Success 20The Cost-Benefit Analysis 22
Assessing Development Expenses: The Development Office 26Organization Structure and Costs 27Development Staff Expenses 28Other Direct Expenses 29Wearing Multiple Hats 30
Investing in Fundraising 32Controlling Costs and Maximizing Contributions: Striking a Balance 36
The Challenges of Accounting for Overhead Expenses 38The Impact of Donor Cultivation 39Special Considerations for Planned Giving 41
The Tie to the Marketing Office 42The Impact of Social Media 45Measuring ROI of Social Efforts 47
The Impact of Wealth Intelligence on Fundraising Return on Investment 48Uses of Wealth Intelligence for Successful Fundraising and Beyond 51Investing in Wealth Intelligence 52The Role of Predictive Analytics 53Measuring the Return of Your Wealth Intelligence Investment 55
Other Factors Affecting Return on Investment Metrics 58Factors to Consider when Evaluating Your ROI and CRD 61
Conclusion and Next Steps 62Case Studies 66Appendix 1: Worksheets 80Appendix 2: WealthEngine Custom Analytics 88Appendix 3: ROI Measurements: Results from the WealthEngine 2013 Surveys 90

White Paper For Nonprofit Organizations
2
Overview

Measuring Fundraising Return on Investment 3
Understanding Return on Investment (ROI) is critical to a nonprofit organization’s long term strategic planning – regardless of their size, age, mission or the constituents they serve. With today’s tight economy, nonprofits face increased pressure to improve every facet of their fundraising operation in terms of productivity, efficiency and value, and organizations must be cognizant of the relationship between their investment in fundraising and the return on that investment.
Having a command of ROI-related metrics helps to inform decision-making and foster a strategic approach to development planning, budgeting, staffing and other key operational areas. For example, tracking, measuring and reporting the results of various fundraising programs and activities is critical for internal staff, organizational leadership and external stakeholders, such as donors and community members. This includes cost-related metrics such as ROI and Cost to Raise a Dollar (CRD), as well as key performance metrics across prospecting, new donors, renewals and repeat donors. In addition to measuring the results of individual fundraising activi-ties, and then comparing the effectiveness and ROI of each activity against other activities, it is important to analyze the success of each fundraising activity against its initial goals by doing a cost-benefit analysis. Looking at this data over a number of years allows the nonprofit organization to establish its own benchmarks, uncover trends, and determine if they are progressing in the right direction.
Wealth intelligence is an important component within the fundraising operations for organizations of all sizes and types. By combining the use of wealth, lifestyle and biographical research data with advanced analytics, wealth intelligence provides the foundation for targeted and successful identification, cultivation, solicitation, and stewardship strategies. When performed effectively and supported by a develop-ment and marketing office that implements targeted fundraising programs, wealth intelligence can have a significant impact on fundraising ROI. It enables organiza-tions to save time and money by identifying and focusing on their best prospects, and to raise more money in the long run.

4
Measuring ROI can help nonprofits justify their investments in staffing, research and wealth intelligence. And perhaps even more importantly, it can help maximize the efficiency of these efforts by providing the benchmark for understanding the overall cost of raising money for their organization.
As development offices, board members, donors and volunteers all look to have greater transparency into the costs and outcomes of fundraising, ROI metrics provide an important indication of the overall effectiveness of the organization’s fundraising efforts. ROI, CRD and other performance measures allow them to determine what mix of fundraising investments, done at this stage in their fund-raising strategy, gives the organization the best return over time. This information is especially important to board members, CFOs and others who have a say in how the fundraising budget is set. It also allows the nonprofit to potentially increase their wealth intelligence and analytics budget by providing the proof positive that wealth intelligence is an investment that yields positive results.
At the end of the day, it’s about striking a balance between efficiency and effect-iveness. ROI metrics may vary depending on the organization’s efforts towards achieving maximum net revenues, or effectiveness, versus maximum efficiency, or keeping fundraising expenses as low as possible.
This white paper will explore various factors to consider when measuring the ROI of fundraising for the nonprofit organization, including the ROI when systematically deploying wealth intelligence. As part of the discussion of ROI, and the benefits and costs of wealth intelligence in increasing returns while lowering the cost of a dollar raised, we present several WealthEngine client case studies. These real-world examples demonstrate the use of wealth intelligence and custom analytics and its ROI in the context of various fundraising campaigns.
“In today’s tough economy, there is a trend towards building fundraising strategies in a highly disciplined and cost-conscious manner, and as a result, fundraising is becoming more of a science. While there is still an art to it, the science is playing a bigger role.”
- Norman Olshansky Fundraising Consultant and President of NFP Consulting Resources

Measuring Fundraising Return on Investment 5

White Paper For Nonprofit Organizations
6
The Fundraising Landscape

Measuring Fundraising Return on Investment 7
The Fundraising LandscapeThe nonprofit sector represents a significant part of the overall U.S. economy, growing steadily over the past decade and increasing in size by 25%, from 1,259,764 million nonprofits in 2001 to 1,574,674 million nonprofits in 2011, according to the Urban Institute. Indeed, the growth rate of the nonprofit sector has surpassed the rate of both the business and government sectors. Nonprofit organizations represent a significant portion of the U.S. workforce (5.4% of the gross domestic product (GDP) and 9% of all wages/salaries paid1). The nonprofit sector contributed $779 billion to the U.S. economy in 2010, and public charities, the largest component of the nonprofit sector, reported more than $1.51 trillion in revenue, $1.45 trillion in expenses, and $2.71 trillion in assets.
Charitable organizations have four primary sources of revenue:
T Private payments, such as education tuition, fees for medical care or fees for other goods and services
T Private charitable contributions – including those from individuals (outright and deferred, such as planned gifts), corporations, foundations and bequests
T Government grants and payments
T Income from investments
The percentage of revenue from each source varies widely across various sectors, with education, healthcare (including hospitals) and human services related charities relying more heavily on private payments. Healthcare and human services related charities generally receive higher percentages of their revenue from government grants, while educational institutions have greater investment income – driven largely by the higher education endowments.
2012 Contributions by Source
Individuals
Corporations
Foundations
Bequests72%
15%
6%
7%
Figure 1: 2012 Contributions by Source (by percentage of the total). Total 2012 conributions: $316.23 billion.
1 The Nonprofit Sector in Brief: Public Charities, Giving and Volunteering, The Urban Institute, 2012

8
In 2012, private charitable contributions in the U.S., which include giving to public charities and religious congregations, totaled $316.23 billion. The single largest influence on this increase was from an $8.67 billion increase in gifts made by individuals, over 20112.
In terms of charitable contributions, individual giving far exceeds foundation giving. According to Giving USA 2013, and illustrated in Figure 1, individual giving represents nearly three quarters of charitable giving in the United States3. Individuals donated $228.9 billion in 2012, a 3.9% increase from $220.3 billion in 2011. If you include bequests, which are also contributions from individuals, that total rises to 79%. While some organizations depend largely on government grants, and others get much of their funding from corporate sponsorships or foundation grants, the vast majority of nonprofit organizations depend on individual giving to fulfill their missions. As discussed in this paper, many industry experts have voiced the opinion that if individual giving could be increased by only a few percentage points, the impact would be tremendous.
The report shows that donations by Americans to nonprofit groups are mirroring the slow recovery of the larger economy. However, their findings indicated that if charitable giving continues to grow at its recent rates, it will take about another six or seven years to return to pre-recession levels. Overall donations are still down about 8% from their 2007 peak of $344.5 billion.
In a study published in April 2013 by the Nonprofit Research Collaborative (NRC)4, 58% of organizations saw fundraising receipts increase in 2012. This is up from 53% in 2011 and 43% in 2010. And, 63%, met their fundraising goal in 2012. This is up from 59% in 2011 and 52% in 2010.
This survey was completed by over 1,200 respondents from large and small organizations (by budget size) and organizations from every sub-sector, from Arts, Culture & Humanities to Religion, and included organizations in the U.S. and Canada. The survey questions ranged from changes in charitable receipt amounts in 2012 compared with 2011 to expectations for 2013.
2 2013 Giving USA Highlights: An Overview of Giving in 2012. The Giving Institute. 3 2013 Giving USA Highlights: An Overview of Giving in 2012. The Giving Institute. 4 Nonprofit Fundraising Study: Covering Charitable Receipts at U.S. and Canadian Nonprofit Organizations in 2012, Nonprofit Research Collaborative, April 2013. (http://www.urban.org/UploadedPDF/412836-nonprofit-research- collaborative.pdf )

Measuring Fundraising Return on Investment 9
Change in Charitable Receipts
42%
Decreased over the prior year
About the same
Increased over the prior year 58%
16%
26%
Figure 2: Percentage of responding organizations reporting change in charitable receipts, 2012 compared with 2011
Many of today’s donors are concerned about the sluggish economy, federal furloughs and sequesters and the fiscal cliff. With potential cuts to federal spending, and looming changes to the tax code, donors are more careful of their spending. Meanwhile, changing technology and fundraising practices provide new challenges and opportunities to reaching supporters and cultivating donors. A 2012 Dunham+Company State of Philanthropy Study showed that while Americans feel the economy is improving, donors anticipate that their giving in 2013 will revert to recession-like levels, with 27% of adults—the same percentage as 2009 and 2010 and more than double the percentage in 2012—saying they will give less in the coming year. In essence, when the economy appears unstable or uncertain, charitable giving is at risk5.
Industry leaders have long held the stance that those organizations that invest in fundraising are likely to see the benefit. In fact, some fundraising veterans claim that we’d see far greater impact by investing in individual giving than by directly supporting programs. Individual giving far exceeds foundation giving, as demonstrated above. While presenting at a Council on Foundations conference, Dan Pallota, activist and fundraiser, asserted that stronger fundraising would generate more than enough new dollars from individual donors to off-set whatever foundation dollars weren’t spent directly on programs6. The sentiment
5 Dunham and Company Annual State of Philanthropy Study, January 2013. (http://dunhamandcompany.com/down loads/DC_StateOfPhilanthropyStudy_PresentationDeck20130123.pdf ) 6 Doughty, Roger. The Multiplier Effect: Invest in Fundraising, Philanthropy411 blog, April 11, 2011. (http://philanthro py411.wordpress.com/2011/04/11/multiplier/)

10
is that philanthropy’s more important job is to figure out how to have the greatest impact with those resources available, and how to use those resources to fuel further growth of the organization. The greater the growth, the greater the funds raised, and thus the greater impact that can be made in serving the mission.
Those who continue to invest in fundraising and growing individual gifts are better positioned than those who maintain status quo. And important to investing in fundraising programs – including major gifts, planned giving and annual giving – is understanding the overall revenue and expense associated with the program or activity. This allows you to calculate your fundraising return on investment (ROI) and cost to raise a dollar (CRD). When you can demonstrate the impact that contributions have on your organization – and the fact that every dollar is making a difference – donors are more likely to donate again and again. ROI becomes a valuable tool for nonprofits to demonstrate the value of their organization.
As Norman Olshansky, Fundraising Consultant and President of NFP Consulting Resources explained in an exclusive interview with WealthEngine, “We need to move away from measuring outputs and begin to look at measuring outcomes. Outcomes are inherently harder to measure. You have to look at evidence-based practices.” This is critical to building a philanthropy-focused organization.
“When talking to your stakeholders, if you need to have a story to tell, tell about your accomplishments. Talk about both your points of pride and your challenges. Major donors give not just to solve your problems, but to be part of your success.”
- Norman Olshansky Fundraising Consultant and President of NFP Consulting Resources

Measuring Fundraising Return on Investment 11
A Fresh Perspective: Changing the Way We Think About Changing the World7
Dan Pallota, author, speaker and founder and Chief Humanity Officer of Advertising for Humanity as well as founder and President of the Charity Defense Council, has led the movement dedicated to transforming the way the donating public thinks about charity and change. In his acclaimed 2013 TED talk, he talks about the need to change the way we think about changing the world. The precept is that social problems are massive, yet social organizations are tiny in scale, and we have a belief system that keeps them tiny. He argues that the rules for the nonprofit sector and the rules for the rest of the world should not be different.
By following some of the same rules that the commercial world goes by, nonprofits – and their causes – will be better off. But the main thing getting in the way of nonprofits doing this is the discrimination nonprofits face:
T Donors are obsessed with low overhead, so it makes organizations obsessed with overhead as well. What is needed is an understanding that development work costs money; you need to have proper support structures (administrative, financial, logistical, security, procurement, etc.) in order to function properly and effectively. This obsession with low overhead makes NGOs cut down on the essentials, which ultimately results in staff burnout, ineffective implementation, and other negative consequences.
T There is a misconception that doing good cannot be synonymous with doing well financially. Nonprofit CEO’s are paid dramatically lower than their counter-parts in commercial organizations, when in reality the impact they can have on society (and the economy) may be just as great or even greater.
T Commercial organizations are rarely, if ever, scrutinized for spending on adver-tising and marketing. Nonprofits, on the other hand, are often criticized if they overspend in this area. Donors don’t like the idea of an organization spending on advertising because it is thought of as overhead, even if it is effective.
T Charitable giving is stuck at 2% of GDP since the 1970’s, and in 40 years has not been able to wrestle market share away from the for-profit sector. Unless there is some change to shake things up, this is likely not going to change soon. But today, it’s nearly impossible for charitable giving to take on more market share because it is not allowed to market.
7 Pallotta, Dan. The way we think about charity is dead wrong, TED, March 2013. (http://www.ted.com/talks/dan_pal lotta_the_way_we_think_about_charity_is_dead_wrong.html)

12
T There is reluctance to taking risks on new revenue ideas. Why? Because if it doesn’t produce results, your character falls into question. There is a fear of failure among nonprofits, and a fear of ruining their reputations. This fear is killing their ability to innovate. And without innovation, the nonprofit cannot grow and cannot solve the problems that their mission seeks to address.
T There is also a different set of expectations for nonprofits. One example Pallotta cites is Amazon. It took Amazon 6 years to become profitable, because they had to invest in scaling their business. If a nonprofit took six years to start supporting their constituents because they were focusing on scaling their business, it wouldn’t be considered acceptable.
T Nonprofits cannot use their profit to attract risk capital. The for-profit sector has a lock on the capital markets, and as a result nonprofits are starved for growth, risk and idea capital. They cannot use money to lure talent, task risks, advertise, or fund their growth.
Percentage Allocated Towards Fundraising vs Cause
Cause
Fundraising
Figure 3: Percentage that is allocated towards fundraising is minor compared to what goes towards the cause
There is a misconception that overhead is not part of the cause, when in fact it is. This thinking forces charities to forgo what they need in order to grow, because they feel pressured to keep overhead low. As a result, the percentage that is allocated towards fundraising is minor compared to what goes towards the cause.

Measuring Fundraising Return on Investment 13
In the end, it’s about making the pie bigger. In his ‘Bake Sale’ example, Pallotta sites how a bake sale fundraiser with 5% overhead is considered “morally superior” to the professional fundraiser with 40% overhead. But if you increase the investment in the organization – in staffing, fundraising, customer service, operations, etc., the overall revenue is much higher despite the fact that the percentage of overhead is greater.
Investment in Organization vs Overall Revenue
5%
$71.00
40%
$71,000,000.00
Bake Sale Enterprise
Figure 4: Investment in the organization vs overall revenue
Therefore, you need to invest more in fundraising because fundraising has or does the one thing you need in order to invest in the mission.
According to Pallota is that if we could move charitable giving from 2% to 3% of GPD by investing in that growth, that would give us an extra $150 billion a year in contributions just for health and human services organizations alone – three times the dollar amount they raise today.
In the end, donors, constituents and other stakeholders shouldn’t care about the rate of overhead, they should care about the scale of the organization’s dreams, because this is how the underlying human and social problems will get solved!

White Paper For Nonprofit Organizations
14
Measuring Return on Investment

Measuring Fundraising Return on Investment 15
Measuring Return on InvestmentIn a 2013 survey by WealthEngine to assess the state of fundraising effectiveness and business analytics, 79.3% of respondents said that measuring ROI is either somewhat or very important for their organization.
Importance of Measuring Fundraising Return on Investment by Organization
4% 8%
31%
48%
9%
Not at all important
Somewhat unimportant
Somewhat important
Very important
Don’t Know/Not Sure
Figure 5: How important is measuring fundraising Return on Investment (ROI) for your organization?
WealthEngine’s survey included over 1,126 respondents over a range of organization types and sizes, with the primary types being Education (31%), Social & Human Services (18%), Healthcare/Hospitals (14%) and Art / Culture / Museum (11%). Of all respondents, 40% have a budget of $600,000 to $5,000,000.
Survey Participants by Organization Type
2.8% 8.3%
2.1% 3.9%
31.1% 3.5%
0.6% 9.4%
4.1% 1.5%
4.2% 15.6%
1.4% 0.5% 0.6% 0.5%
9.9%
Advocacy Arts - Culture
Arts - Museums Community Organization
Education Environment
Fraternal Organization Healthcare
Hospital International and Foreign A airs
Religious Organization Social/Human Services
Grant-making Organization Consulting and/or Business Services
Political Organization Professional Services
Other
0.0% 5.0% 10.0% 15.0% 20.0% 25.0% 30.0% 35.0%
Figure 6: Survey Participants by Organization Type
What’s New in FindWealth 8
T Advanced Search Functionality
T Enhanced Ratings & Scores
T Valuable Alert Features
T Intuitive & Easy to Use
T Fast, Accurate Results

16
Survey Participants by Contribution Size
19% 4%
40%
20%
17%
Under $600k
$600K to under $5MM
$5MM to under $25MM
$25MM and over
Don't know/Not sure
Figure 7: What is your organization’s level of annual contributions from all sources?
So how does the fundraising office begin to determine which information is relevant when tracking and reporting on their ROI? It begins with understanding the ROI of your staff and frontline fundraisers, and includes the ROI of programmatic activities. There are two key cost-related metrics to assess return on investment (ROI). The most common, ROI, is the net revenues generated from fundraising, divided by the total investment in fundraising, or fundraising expense. Another metric is Cost to Raise a Dollar (CRD), which is the inverse of ROI and a figure that many nonprofits believe is equally important. In looking at these figures, organizations can better understand the value of their fundraising activities and determine how the costs to carry out one activity compare to the costs to carry out another activity.
Return on Investment (ROI) =
Cost to Raise a Dollar (CRD) = $+-Expense of Investment
Net Revenue
Net Revenue
Expense of Investment
Who Wants to Know About ROI?
WealthEngine research shows that calculating and under-standing ROI is important not only for the develop-ment office, but is a topic of increasing interest among organization executives (CEO, CFO), the board and/or trust-ees, donors and volunteers. Transparency is critical to the cost side of the equation while return serves as a per-formance measuring stick.
Measuring ROI is important, and it is a long term process. It is the foundation for maximizing the efficiency and effectiveness of your fundraising operations.

Measuring Fundraising Return on Investment 17
Groups/Individuals Interested in Measuring Return on Investment%
Res
pons
e
68.0%
59.6%
68.3%
54.0%
25.9%
10.3% 4.9% 5.2%
0.0%
10.0%
20.0%
30.0%
40.0%
50.0%
60.0%
70.0%
80.0%
Board and/o
r Tru
stees
Development
execu
tives
Organiza
tion Execs
execu
tives (
CEO, CFO,
etc.)
Development Sta�
Donors
Volunteers
None
Other
Figure 8: Which groups/individuals are interested in measuring Return on Investment?
Calculating Net RevenuesNet Revenue is simply the sum of cash gifts and commitments, minus the amount spent on fundraising. For gift commitments and the various types of deferred gifts, organizations may use different methodologies to account for gift expectancies. One useful example is the Guidelines for Counting Charitable Gifts developed by the Partnership for Philanthropic Planning (formerly NCPG). These guidelines recommend that organizations set three separate and complementary goals, and report on their fundraising results separately, for (1) gifts received during the campaign period, (2) irrevocable deferred gifts and (3) revocable gifts. It offers a paradigm for structuring and measuring results of both annual and multi-year campaigns, and for counting and reporting gifts within those campaigns.
Utilizing these guidelines and measuring ROI separately for the three different types of gifts enables organizations to differentiate between new commitments and commitments from previous campaigns that have changed in character. This puts organizations in a position to show how different development activities can affect the financial state (both present and future) of the institution without appearing to count the same gift twice. This is especially important in the case of deferred gifts, where it may be years before a gift commitment is fully realized.

18
Other Important Measurements of SuccessTracking, measuring and reporting the results of various fundraising programs and activities is critical for internal staff, organizational leadership and external stakeholders, such as donors and community members. It allows internal teams to determine what is working, what needs adjusting, and to determine how changes in strategy or direction can impact the efforts of other internal and external stakeholders. This makes it easier to make course corrections in a timely manner so that the organization can maximize its fundraising success.
WealthEngine outlines this step in detail in our 2012 publication, Growing Individual Gifts, which provides important insight on data understanding, analysis, forecasting and strategy development for fundraisers. As explained in the workbook, having these metrics is important not only for fundraising leadership, but for staff as well. Staff should have easy access to all data that pertains to their areas of responsibility.
In WealthEngine’s 2013 survey, we asked participants which metrics they use to determine fundraising return. The responses varied, with the top four metrics, other than CRD and ROI, being:
T Measure the increase/decrease in number of gifts (51%)
T Measure the number of new and recaptured donors (47.7%)
T Measure the increase/decrease in average size of gifts (45.4%)
T Measure the number of gifts renewed or maintained (44.7%)
33.8%
48.4%
20.3%
16.3%
23.0%
8.2%
51.0%
45.4%
47.7%
44.7%
32.4%
18.8%
8.4%
0.0% 10.0% 20.0% 30.0% 40.0% 50.0% 60.0%
Calculate the Return on Investment
Calculate the Cost to Raise a Dollar
Measure the number of prospects per major gift secured
Measure the number of contacts per prospect to secure a gift
Measure the increase/decrease in size of prospect pool
Measure the increase/decrease in average cultivation time
Measure the increase/decrease in number of gifts
Measure the increase/decrease in average size of gifts
Measure the number of new and recaptured donors
Measure the number of gifts renewed or maintained
Measure the number of gifts upgraded or downgraded
None
Other
% Response
ROI M
easu
rem
ents
How Do You Measure Success and Return on Investment?
Figure 9: How do you measure success and return on investment?

Measuring Fundraising Return on Investment 19
Major DonorAny donor who gives a gift at your major gift level or above, typically the top 1% to 5% of gift levels to your organization
New Donor*
A donor who gives in the current year but has never given previously
Lapsed DonorA donor who has given in a prior year, but not in the current year
Recaptured DonorA previously lapsed donor who gives again in the current year
New Donor RenewalAny new or recaptured donor who gave in the last year, but not the previous year, who gives again in the current year
Repeat Donor RenewalAny donor who gives in the current year and has also given at least in the two previous years
Upgrade DonorAny donor who gives more in the current year than in the previous year
Regrade DonorAny donor who gives the same amount in the current year as in the previous year
Downgrade DonorAny donor who gives less in the current year than in the previous year
MetricA measurement used to gauge some quantifiable component of an organization’s performance
BenchmarkA point of reference for assessing perfor-mance that could be based on industry standards, the performance of peer organizations or your organization’s historical performance
Useful Definitions:
* These definitions are consistent with definitions used in the AFP/Urban Institute research study: 2011 Fundraising Effectiveness Survey Report (FEP).

20
Measuring SuccessThe key performance metrics that the fundraising office should track, measure and report on are provided in Table 1. It is important to track these metrics for each key fundraising activity or program, and assess by:
T Comparing the effectiveness and ROI of each activity against the initial goals
T Comparing the effectiveness and ROI of each activity against other activities
T Comparing the effectiveness and ROI of each activity over a three or even five-year timeframe to determine year over year changes and trends.
These measurements allow fundraising management and leadership to identify areas of maximum impact, inform the fundraising strategy, forecast revenue and expenses, and better focus their fundraising efforts on those that yield maximum return.
All of these metrics, taken individually and combined, can help the organization better understand what is working, and what needs adjusting, and to determine how changes in strategy or direction can impact overall results. This makes it easier to make course corrections in a timely manner so that the organization can maximize its fundraising success.
As Olshansky states, “There is a cost to start and a cost to sustain. An initial invest-ment may not pay off for a few years. It’s important to look at trends over a number of years (3-5) and determine if you are progressing in the right direction.”
Measuring ROI and CRD enable the nonprofit to determine what mix of fundraising investments, done at this stage in their fund-raising strategy, gives the organization the best return over time.

Measuring Fundraising Return on Investment 21
Fundraising Key Performance Metrics
Prospecting Year 1 Year 2 Year 3
Number of Prospects Under Management*
Increase/decrease in Size of Prospect Pool
Average Time (months)
Discovery to Cultivation (Months)
Cultivation to Solicitation (Months)
Solicitation to Stewardship (Months)
New and Recaptured Donors Year 1 Year 2 Year 3
Number of New and Recaptured Donors
Number of Prospects Solicited
Dollars Raised from New and Recaptured Donors
Average Gift Size from New and Recaptured Donors
New Donor Renewals (renewing after first gift) Year 1 Year 2 Year 3
Number of New Donor Renewals
Percent of New Donor Renewals
Number of First Time Donors Solicited
Dollars Raised from First Time Donors
Average Gift Size from First Time Donors
Repeat Donors Year 1 Year 2 Year 3
Number of Repeat Donors
Percent of Repeat Donors
Number of Repeat Donors Solicited
Dollars Raised from Repeat Donors
Average Gift Size from Repeat Donors
Upgraded/Regraded/Downgraded Donors Year 1 Year 2 Year 3
Number of Donors Upgrading Gifts
Percent of Donors Upgrading Gifts
Dollars Raised from Upgraded Donors
Average Gift Size from Upgraded Donors
Number of Donors Maintaining Gifts (Regraded)
Percent of Donors Maintaining Gifts (Regraded)
Number of Donors Downgrading Gifts
Percent of Donors Downgrading Gifts
Table 1: Fundraising Key Performance Metrics
* Additional tracking and analysis of prospects under management within each stage of the fundraising lifecycle should be done, as further explained in the Growing Individual Gifts workbook.

22
The Cost-Benefit AnalysisIn addition to measuring the results of individual fundraising activities and then comparing the effectiveness and ROI of each activity against other activities, it is important to analyze the success of each fundraising activity against its initial goals by doing a Cost-Benefit Analysis. For each activity, a quantifiable goal should be established during the planning stage, when the organization is forecasting its fundraising potential and creating a development plan to achieve that potential. For each goal, it is important to measure the costs of implementing the strategies used to achieve the goal, the benefit or payoff from implementation, and the return on investment for each. An example of such a Cost-Benefit analysis, using data provided in the examples used in the Growing Individual Gifts workbook is provided in Table 2.
Sample Cost-Benefit Analysis
Goals Strategies Cost Benefit Return on Investment ROI
Goal: Maximize Individual Giving
Increase number of major gifts closed by 18% from 51 to 60 and Increase major gift average gift size by 20%
•Purchase data and analytics to determine best prospects to cultivate ($25K)
• Invest in training for major gift staff and volunteers ($20K)
•Begin implementing prospect management and major gift metrics ($10K add’l salary)
$55,000 $182,584 232%
Grow event participation by 15%
• Invite high potential prospects •Leverage board relationships disclosed in
data purchase•Promote event via social media
$1,000 $3,577 257%
Prepare report for board with recom-mendations for Planned Giving Program for September meeting
•Research, interview and prepare report of findings and recommendations for board
N/A N/A N/A
Increase renewal rate among first-time donors by 5% to 15%
• Invest in welcome communications with first-time donors
•Segment donors for most cost-effective approach
$4,000 $12,830 221%

Measuring Fundraising Return on Investment 23
Sample Cost-Benefit Analysis (Continued)
Goals Strategies Cost Benefit Return on Investment ROI
Goal: Increase Donor Loyalty
Increase annual fund upgrades by 5%
•Segment population for customized approaches
•Apply consistent, customized formulas to drive upgraded donations
$500 $10,389 1977%
Increase volunteer participation in fundraising by 10%
•Develop individualized communications plan for volunteers
• Institute volunteer recognition event
$1,000 $2,492 149%
Grow social media communities by 30%
• Institute email campaigns to add community members
•Create and post interesting content and conversations
N/A N/A N/A
Goal: Improve Fundraising Efficiency
Reduce costs by 20% •Purchase email overlay for donors and prospects for whom we don’t already have email addresses
• Institute regular email communications for all viable donors and prospects
•Segment constituents to exclude mailings to least likely to respond
$1,250 Est. Savings: $ -6,200
$4,605 268%
Table 2: Fundraising Operations and Program Expenses
Appendix 1 provides additional sample worksheets for measuring fundraising return on investment, as well as worksheets for measuring the return from wealth intelligence. These include:
T Appendix 1.1: Fundraising ROI: Development Audit Worksheet
T Appendix 1.2: Tracking and ROI of Gift Activity, and the Impact of Wealth Intelligence
T Appendix 1.3: Tracking and ROI of Fundraising, and the Impact of Wealth Intelligence
T Appendix 1.4: ROI for Fundraising Operations
T Appendix 1.5: ROI of Frontline Fundraisers

24
The sample worksheets for tracking fundraising results, including tracking of cultivation efforts, are useful to evaluate the success of an organization’s research and screening efforts and determine how the investment in wealth intelligence and prospect research has impacted the organization’s fundraising programs. The example provided in Appendix 1.3 for Major Gifts can be used as a template for evaluating the results of any type of giving campaign. Depending on the components of your fundraising program, you may want to measure your results in planned giving, annual fund leadership solicitations and other fundraising activities.
The template for calculating ROI for Fundraising Operations includes the expenses and revenues for the overall fundraising effort as well as specifically for major gifts, annual giving, planned giving and corporate and foundation gifts.
The sample worksheets in Appendix 1.5 for tracking the ROI for the frontline fundraising team have been provided by Carrie Collins, Vice President of Institutional Advancement at University of Sciences in Philadelphia. These worksheets can help you capture key performance-related metrics for gift officers as well as the associated costs of staffing and employment. By determining the ROI of the frontline fundraising team – through examining the ratio of dollars raised against the cost of employment – senior management can demonstrate to their executives and board members that frontline fundraisers are closing gifts in amounts larger than it costs to employ them, lending credence to the adage that you have to spend money to make money.

Measuring Fundraising Return on Investment 25

White Paper For Nonprofit Organizations
26
Assessing Development Expenses: The Development Office

Measuring Fundraising Return on Investment 27
Organization Structure and CostsTo accurately assess the expenses or costs associated with fundraising, it is important to measure these aspects of fundraising: staff and human resource costs, overhead costs and direct expenses.
In the first edition of WealthEngine’s ROI white paper, we noted that the size of a nonprofit’s development organization – and the cost required to operate it – depends on a number of factors, including the size of the overall organization, the scope of its fundraising initiatives and its overall budget. “We think of non-profits as education, healthcare, large charities and advocacy organizations, but it’s a lot more than that. We cannot forget about the associations, the government organizations. And size is important too – the metrics that a large organization can expect, who has the benefit of economies of scale, are dramatically different than what a small organization may experience,” explains Olshansky.
Nonprofit organizations should take into account several realities of fundraising when setting fundraising targets and staffing to meet them. North Carolina State University has developed Relationship Management Best Practices that offer a more formalized, structured system for major gift prospect portfolio management to ensure their fundraising activity is aligned with fundraising goals. These guidelines include:
T Major gift officers (MGO’s) identify, qualify, cultivate, and solicit major gifts of $25,000 and higher by matching donors’ philanthropic interests with needs of the university
T MGO’s average 18-24 asks of $25,000 and up per year
T MGO’s carry a major gift prospect portfolio of 120-150 major gift prospects in active solicitation cycle (those not in perpetual stewardship)
T MGO’s maintain 20-30 top prospects who will move through the solicitation cycle in 12-18 months
T MGO’s maintain 20-30 emerging prospects whose proposal is not yet in negotiation and cultivate them to become top prospects within12-18 months.8
Industry benchmarks show that organizations typically receive 75-85% of their “ask” and, contrary to the standard 80/20 rule, roughly 90% of campaign gifts come from 10% of donors.
8 NC State University, Relationship Management Best Practice, February 2009. (http://www.ncsu.edu/advancement- services/prospectmgmt/2-4-09%20NC%20States%20Relationship%20Management%20Best%20Practi.pdf )

28
When planning staffing for fundraising campaigns, most nonprofit organizations take into account the number of prospects a development officer can reasonably manage. Most consultants and industry veterans recommend a prospect portfolio of between 75 and 150 prospects per major gift officer – depending on the ask amount, geography, other job responsibilities and the major gift officer’s (MGO) skill and experience level.
As prospects make gifts or choose not to, the MGO’s portfolio must be resup-plied from a pool of new prospects, a responsibility typically managed through the prospect research function. Prospect researchers evaluate the overall pool of prospective donors and pass those that meet appropriate criteria to the MGOs for cultivation. A ratio of 4-5 MGO’s per prospect researcher is considered by many to be appropriate. However, depending on the organization’s fundraising goals, the research tools available to the research staff and level of screening efficiency, higher or lower ratios may be workable.
Development Staff ExpensesHuman resource costs such as salaries, benefits and travel expenses, are generally the largest portion of the fundraising or development budget. The Association of Fundraising Professionals (AFP) publishes an annual comprehensive salary survey, which is intended to capture overall salary and benefits data, including health/medical, retirement and general perquisites or “perks” for U.S. and Canadian non-profits. Their 2012 findings show that the mean (average) salary for all respondents is $75,595. The median (middle value) salary is $66,000. The top 25 percent of respondent fundraisers earn more than $90,000, and the bottom 25 percent earns $50,000 or less9. These figures demonstrate a 6% increase in the mean and a 4% increase in the median salary since 2009, which is consistent with the 5.8% increase in U.S. cost of living between 2009 and 201210.
Factors that influence salary levels include, but are not limited to, years of experience, education, CFRE-certification and location. Fundraisers working in national and international organizations reported average salaries higher than those affiliated with local or state/regional entities. There were also strong positive correlations between average compensation and the size of an organization’s staff, its budget, and the amount of funds raised11.
When calculating the cost of employment, it is important to include the gross salary, plus fringe benefits. Carrie Collins of University of the Sciences suggests a
Determining the appropriate staffing level ultimately depends on a number of factors, including:
T The nonprofit organiza-tion’s overall fundraising goal
T The amount desired from each type of fundraising effort or program
T The desired number of donors at each giving level
T The timeline to achieve the goal
9 2012 AFP Compensation and Benefits Report, Association of Fundraising Professionals, 2012.10 Social Security Administration, History of Cost of Living Adjustments. (http://www.ssa.gov/cola/automatic-cola.htm)11 2012 AFP Compensation and Benefits Report, Association of Fundraising Professionals, 2012.

Measuring Fundraising Return on Investment 29
guideline of 33% for fringe benefits, plus an additional $15,000 per person in travel and hospitality expenses. As Collins points out “Not including these figures in your calculations, you are underestimating how much money your institution is spending to ensure that your frontline fundraisers are, in fact, on the front lines.”
Other Direct ExpensesIn addition to the staffing component, organizations also incur a variety of direct expenses to support their development efforts. These can include accounting and budgeting software, donor management systems and other fundraising software, including research and analytical tools and prospect screening. It is important to account for and accurately attribute these expenses, as well as other direct expenses incurred for proposal generation, special events, direct mail and other campaign-related costs. In many cases, reasonable approximations and/or percentage allocations will suffice. Table 3 provides a summary of some of the typical categories of expenses incurred by development departments. This information can be generated to calculate return on investment, as well as cost per dollar raised, for individual fundraising programs as well as for the overall fundraising function.
Fundraising Operations and Program Expenses
Expenses Overall Major Gifts Annual Fund
Corp & Foundation
Planned Giving
Salary & Benefits
Fundraiser Salary & Benefits
Prospect Researcher Salary & Benefits
Administrative Overhead
Subtotal Salary & Benefits
Direct Expenses
Travel
Meals
Events
Telephone
Printing & Mailing
Office Supplies
Technology – Hardware, Software
Equipment
Maintenance
Dues & Membership
Donor Recognition
Professional Development
30
Fundraising Operations and Program Expenses (Continued)
Expenses Overall Major Gifts Annual Fund
Corp & Foundation
Planned Giving
Research Subscriptions
Wealth Intelligence & Data Analytics
Subtotal Direct Expenses
Total Expenses
Table 3: Fundraising Operations and Program Expenses
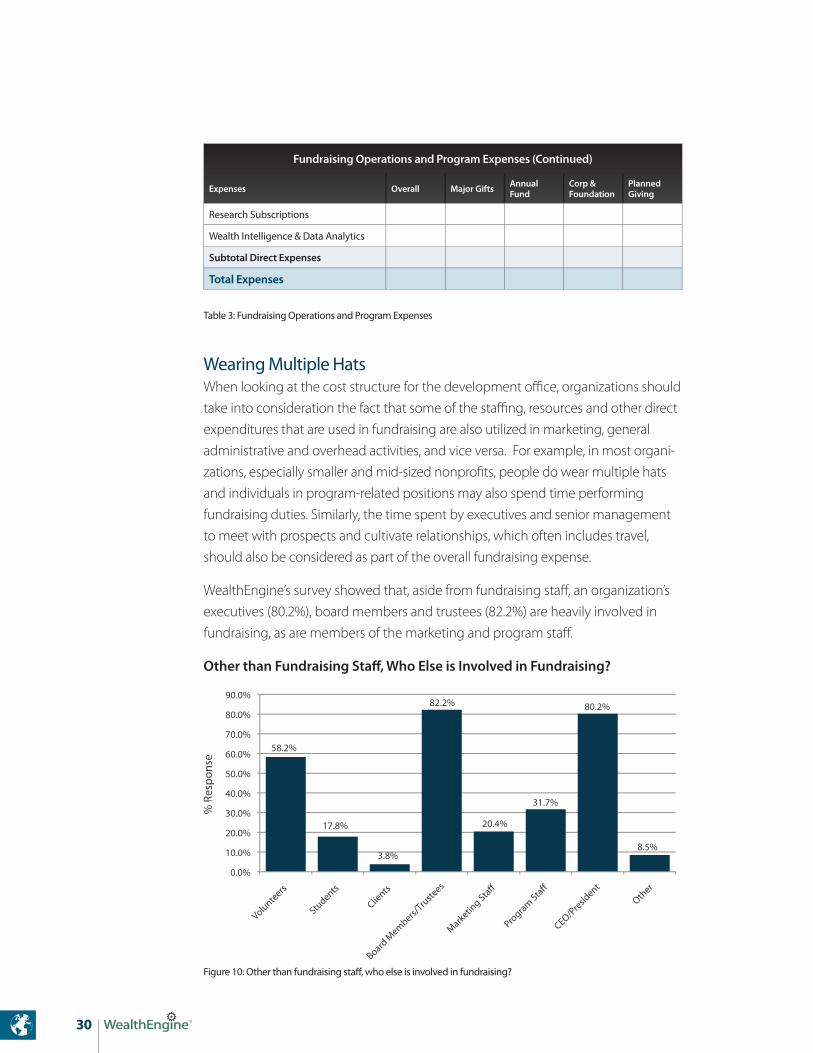
Wearing Multiple HatsWhen looking at the cost structure for the development office, organizations should take into consideration the fact that some of the staffing, resources and other direct expenditures that are used in fundraising are also utilized in marketing, general administrative and overhead activities, and vice versa. For example, in most organi-zations, especially smaller and mid-sized nonprofits, people do wear multiple hats and individuals in program-related positions may also spend time performing fundraising duties. Similarly, the time spent by executives and senior management to meet with prospects and cultivate relationships, which often includes travel, should also be considered as part of the overall fundraising expense.
WealthEngine’s survey showed that, aside from fundraising staff, an organization’s executives (80.2%), board members and trustees (82.2%) are heavily involved in fundraising, as are members of the marketing and program staff.
Other than Fundraising Staff, Who Else is Involved in Fundraising?
% R
espo
nse
% R
espo
nse
0.0%
10.0%
20.0%
30.0%
40.0%
50.0%
60.0%
70.0%
80.0%
90.0%
Volunteers
Students
Clients
Board M
embers/Tru
stees
Marketin
g Sta
Program Sta
CEO/Presid
ent
Other
17.8%
58.2%
3.8%
82.2%
20.4%
31.7%
80.2%
8.5%
Figure 10: Other than fundraising staff, who else is involved in fundraising?

Measuring Fundraising Return on Investment 31
Carrie Collins, JDVice President of Institutional Advancement, University of the Sciences, Philadelphia PA
As development professionals, it is important to demonstrate – to the board, to the executive team, to the finance office - that frontline fundraisers are taking advantage of the data they have available to them (the science) to perfect the art of cultivating and soliciting donors. By showing how frontline fundraisers are closing gifts in amounts larger than it costs to employ them, we lend credence to the adage that you have to spend money to make money.
In her experience, she has found the following metrics to be the most relevant in determining a gift officer’s success, and the key benchmarks that she has found applicable to major gift officers at an institution of higher education:
T Number of personal visits: 120 to 150 visits with major prospects
T Percentage of unique visits: calculated as the number of prospects visited/number of visits made, with a goal of 50-75% unique visit prospecting
T Proposals submitted: apply a tiered approach based upon the level of prospects to which the gift officer is assigned, such as:• $25,000 to $100,000: 10 to 15• $100,000 or greater: 4 to 7
T Number of gifts closed: using the following as a general guideline• $25,000 to $100,000: 7 to 20• $100,000 or greater: 2 to 3
T Amount of gifts closed: includes all monies that were donated as a direct result of the gift officer’s efforts, including those that are less than the proposal threshold for which he or she receives credit
T Assists/shared credit: recognize teamwork among gift officers, which makes them far less likely to hoard or poach prospects
T Multiple of total compensation: dollars raised divided by the cost of employment
While most organizations have a formal, annual performance review process, it is important to conduct these assessments more frequently – ideally on a quarterly basis. This allows you to assess performance, make adjustments in staffing or strategy, and document lackluster performance to create a record for future employment decisions.
Collins recommends that organizations prepare a document of expectations for each fundraiser, with the metrics clearly stated, and have the individual agree and sign off on them. When performance evaluations are conducted, you can include these expectations in the evaluation.

White Paper For Nonprofit Organizations
32
Investing in Fundraising

Measuring Fundraising Return on Investment 33
Investing in FundraisingAs organizations can vary in the structure and size of their fundraising infrastructure and fundraising strategy, separate investment decisions and separate ROI tracking should be made for the various types of activities related to fundraising. For exam-ple, activities and campaigns related to acquiring new donors can differ from those related to donor retention and renewal. The key activities related to fundraising typically fall into one of these five areas:
T Capacity-building, which includes operating expenses related to assessing an organization’s capacity to raise money, strategic planning, board recruitment and development, marketing, setting up donor management systems and fundraising systems.
T New donor acquisition efforts, such as direct mail, where nonprofits identify and target donors that make small-to-medium size gifts.
T Individual donor renewal, or fund raising activity that produces net contribu-tions from the second, third, etc. gifts from prior individual donors. Donor renewal focuses on retention and upgrading of prior donors. It includes major gifts, annual gifts, special gifts, capital gifts and gifts for endowment.
T Individual planned giving, in which donors are asked to make deferred, non-cash or life-income gifts.
T Grantseeking from institutional sources such as corporations and foundations.
Furthermore, different fundraising techniques have different costs per dollar raised associated. For example, if you are raising a large percentage of major gifts, then your average cost per dollar raised may be lower than an organization that is focused on raising money through its annual fund. The cost of fundraising can also vary depending on variables such as: the age of the organization, the size of the budget, the popularity of the cause, the skills of the development staff, the strength of the organization’s leadership – and many more.
Historical research done by James Greenfield, a well-respected leader in fundraising and the retired Senior Vice President of Resource Development at Hoag Memorial Hospital Presbyterian in Newport Beach, California, showed average costs to raise a dollar at anywhere from $.05 to $1.00 per dollar raised, depending on the fund-raising activity or method, with a national average of $.20 per dollar raised12. Each method of fundraising should be measured against the results it achieved, and most importantly it should be measured against prior years’ performance using the same
12 Taken from Supporting Advancement.com FAQ, What is the average cost per dollar raised? (http://www.supporting advancement.com/faq/cost_per_dollar_raised.htm)

34
method. This assessment should be done for at least three cumulative years in order to get a complete and accurate picture13.
Reasonable Cost Guidelines for Solicitation Activities
Solicitation Activity Reasonable Cost Guidelines
Direct Mail (acquisition) $1.25 to $1.50 per $1.00 raised
Direct Mail (renewal) $0.20 to $0.25 per $1.00 raised
Membership Associations $0.20 to $0.30 per $1.00 raised
Activities, Benefits and Special Events $0.50 per $1.00 raised (gross revenue and direct costs)*
Donor Clubs and Support Group Organizations $0.20 to $0.30 per $1.00 raised
Volunteer-led Personal Solicitation $0.10 to $0.20 per $1.00 raised
Corporations $0.20 per $1.00 raised
Foundations $0.20 per $1.00 raised
Special Projects $0.10 to $0.20 per $1.00 raised
Capital Campaigns $0.10 to $0.20 per $1.00 raised
Planned Giving $0.20 to $0.30 per $1.00 raised
Table 4: Reasonable Cost Guidelines for Solicitation Activities14
*To calculate bottom-line total costs and net proceeds from a benefit event, calculate and add the indirect and overhead support expenses to direct costs incurred and subtract from gross revenue.
Source: Greenfield, James. “Accountability and Budgeting, Assessing Costs, Results and Outcomes.” In Hank Rosso, Achieving Excellence in Fundraising, New York: Wiley, 2003. Originally published by James M. Greenfield, ed. Fund-Raising Cost Effectiveness: A Self Assessment Workbook, 1996, p.281.
National Averages for Fundraising Costs and Return on Investment
Method Cost Return on Investment
Direct Mail to General Lists (non donors) 115% -15%
Special Events 50% 50%
Planned Giving 25% 75%
Direct Mail to Prior Donors 20% 80%
Foundations/Corporations 20% 80%
Major Gifts 5-10% 90-95%
National Average, all methods 20% 80%
Table 5: National Averages for Fundraising Costs and Return on Investment
Source: Greenfield, James. Fund-Raising: Evaluating and Managing the Fund Development Process.
13 Greenfield, James. “Accountability and Budgeting, Assessing Costs, Results and Outcomes.” In Hank Rosso, Achieving Excellence in Fundraising, New York: Wiley, 2003. 14 Greenfield, James. “Accountability and Budgeting, Assessing Costs, Results and Outcomes.” In Hank Rosso, Achieving Excellence in Fundraising, New York: Wiley, 2003. Originally published by James M. Greenfield, ed. Fund-Raising Cost Effectiveness: A Self Assessment Workbook, 1996, p.281.

Measuring Fundraising Return on Investment 35
Table 5 indicates that you would need to spend $1.15 in order to raise $1.00 through direct mailings to general lists. To solicit major gifts, you would spend 5 to 10 cents to raise $1.00. In practice, however, there is such wide range in costs and many variables to be considered, that it is hard to place a target or benchmark on how much it should cost to raise a dollar. Depending on the circumstance, the campaign, timing and goal, an organization can (and should) spend anywhere from $0.10 to over $2.00 to raise a dollar. In addition, different organization types have different channels available to them and some are more effective than others.
The more important considerations are to assess the returns of each activity against the initial fundraising goal, and against other activities, and do this over a three or five-year timeframe to determine trends. Mal Warwick highlighted this in his Ask Mal blog entry, “How Much to Spend”:
“Some organizations are blessed with highly efficient fundraising programs that allow them either to acquire new donors at a breakeven or to derive so much revenue so quickly from new donors that the effect is much the same.
Other nonprofits are forced to wait for two or three years, or even more, to recoup their investment.
With all that said, however, it’s becoming increasingly common for nonprofit organizations to pay a net initial cost of between $5 and $50 to acquire an aver-age new donor. In such circumstances, I advise clients that – if it’s worth paying, say, $30 to enroll a new donor – it’s worth paying at least that much to reacti-vate a donor who has lapsed.”15
As Rick Dunham, President & CEO of Dunham+Company, a national fundraising consultancy with specialization working with ministries, pointed out in an interview with WealthEngine, “The press has unfairly characterized the topic of ROI and donor acquisition. Some organizations will spend $100 to get a donor, but will get $1000, which is great – a 10:1 return. Others will spend $20-25 and get $50, so a 2:1 return. But over time they can grow that value. So you have to look at it as a cumulative measure, and not on a single basis. Looking at net revenue is extremely important as well. It serves as the ballast for comparing other metrics. For example, you could spend $20,000 to raise $100,000, or you could spend $30,000 and raise $125,000. In the second scenario, the ROI is lower but the net revenue is higher.”
15 Mal Warwick Associates, How much to spend? (http://www.malwarwick.com/mals-corner/askmal/how-much-to- spend.html)

White Paper For Nonprofit Organizations
36
Controlling Costs and Maximizing Contributions: Striking a Balance
Measuring Fundraising Return on Investment 37
Controlling Costs and Maximizing Contributions: Striking a BalanceIt is important for organizations to look at their ROI as a benchmark that is specific to their unique organization and that is tied to their overall strategic plan and fundraising strategy. Development professionals, CFOs and board members can use ROI, CRD and other performance measures to determine what mix of fundraising investments, done at this stage in their fundraising strategy, gives the organization the best return over time.
Historically, there has been much pressure on organizations to minimize fundraising costs. Published in 2004, The National Overhead Cost Project16 reported that nonprofits should spend no more than 25 to 50 percent of contributions on fundraising, where the average across all industry sectors is to spend less than 35 percent of contribu-tions on fundraising17. This means that a charity was expected to spend no more than $0.35 to raise each dollar. However, the majority of charities were actually spending far less than this amount – between $0.15 and $0.24 per dollar raised. Many organiza-tions that went above the 35% benchmark were criticized by donors and the media, which incited a high degree of pressure to keep their costs in check.
More contemporary attitudes dispel the notion that lower fundraising costs are associated with a better-managed nonprofit. Current research into the economics of charitable fund raising indicates that investing in the development and fundraising function not only improves the annual rate of growth of giving, but can also help the nonprofit to improve the overall effectiveness and efficiency of their organization.
Nevertheless, the pressure is on. Nonprofits have historically had tight budgets and the economic environment has exacerbated this. As Rick Dunham points out, “There is a high sensitivity to measuring ROI and controlling expenses, in the U.S. and even more so in the U.K. There is a sensitivity to ensuring that the investment is making a return. But when organizations get into expense management and become too focused on lowering expenses, it does more harm than good. In many cases, campaigns get derailed by an over-focus on the expenses, when in fact if the organization had continued the course, they would have raised more.”
At the end of the day, it’s about striking a balance between efficiency and effectiveness. ROI will vary depending on the organization’s efforts towards achieving maximum net revenues, or effectiveness, versus maximum efficiency, or keeping fundraising expenses as low as possible.
16 The Nonprofit Fundraising and Administrative Cost Project, published in 2004, is a collaboration between the Center on Philanthropy at Indiana University and the Center on Nonprofits and Philanthropy at the Urban Institute. 17 The Pros and Cons of Financial Efficiency Standards, Nonprofit Overhead Cost Project, Brief No. 5, Center on Nonprofits and Philanthropy, Urban Institute and Center on Philanthropy, Indiana University, August 2004.

38
The Challenges of Accounting for Overhead Expenses Fundraising costs, including the cost of wealth intelligence solutions, are a key component to the organization’s operating expenses. While these overhead expenses must be reported in the nonprofit’s IRS Form 990, there are a number of issues that affect the reliability of these figures. Issues abound, from the lack of a uni-versal accounting standard for nonprofits, to the variations and changing definitions of the ways in which fundraising and administrative expenses should be accounted for, to conflicting ideas about where fundraising expenses should be charged.
In fact, a survey done by the Nonprofit Fundraising & Administrative Cost project in 2004 found that 37% of organizations with more than $50,000 in private contributions reported zero fundraising and special event costs. Of those reporting costs, more than a quarter received more than $15 for each dollar spent on fundraising. These remarkable figures show that the pressure to keep costs low is leading to questionable accuracy in how costs are tracked and reported.
Nonprofits face pressure from their funding sources (government agencies, individuals, and foundations) as well as external watchdog organizations to keep a tight rein on overhead expenses. Part of the pressure to keep costs low and efficiency percentages high also comes from grant organizations and donors, who want to know that their dollars are making a difference. The Better Business Bureau’s Wise Giving Alliance provides standards for charity accountability and produces reports on nationally soliciting charitable organizations. Included in their recommendation is a guideline that organizations spend no more than 35% of related contributions on fundraising. Related contributions include donations, legacies, and other gifts received as a result of fundraising efforts. However, while most organizations keep well within this guideline, their research found that over half of adult Americans felt that nonprofit organizations should have overhead rates of 20 percent or less; nearly four in five felt that overhead should be less than 30 percent18.
While regulators, watchdogs, and donors may have altruistic concerns when evaluating charities and encouraging them to limit their costs, this creates excessive pressure that can actually hamper the charities ability to deliver upon their mission. Professionals within the nonprofit community have the power to change donor thinking about fundraising costs, and we are beginning to see this play out.
18 Bedsworth, Gregory and Howard, Nonprofit Overhead Costs: Breaking the Vicious Cycle of Misleading Reporting, Unrealistic Expectations, and Pressure to Conform, 2008, which cites a 2001 research study by the Better Business Bureau Wise Giving Alliance (BBB Wise Giving Alliance Donor Expectations Survey, Princeton Research Associates, 2001.)

Measuring Fundraising Return on Investment 39
In traditional thinking, donors would consider issues such as:
T How much goes to the mission or cause? How high are the nonprofit’s expenses?
T Do they need my money? Will my money just be lying around in their reserve?
It is the nonprofits responsibility to facilitate the reshaping of donor thinking, by be-ing able to provide answers to the more relevant questions of:
T How efficient and effective is their fundraising? What is their cost-per-fundraised-dollar ratio?
T Is the charity run properly? How efficient and effective is their human capital? Management team?
It is these questions that allow us to focus on the key measures of efficiency and effectiveness and to truly evaluate nonprofits on their ability to deliver change and serve their cause. At the end of the day, that is the return that is most important.
The Impact of Donor CultivationROI and CRD metrics are more meaningful when looked at in conjunction with factors such as average donor cycles and cultivation time. For example, first year expenses may be higher, but as the fundraising program matures, the cost to raise a dollar tends to taper. Likewise, returns are typically higher in the early stages of a major giving campaign, and in fact most fundraising professionals have found that the greatest contributions are made during the silent phase before the campaign even reaches the public domain. It is typical for 60% or more to be raised before the campaign goes public. This underscores the need to evaluate ROI and CRD over a three, five and ten year timeframe for each individual fundraising activity and for all combined. By looking at ROI in this way, the organization can balance the issues of efficiency and effectiveness.
As Olshansky points out, “There is an old saying: you want advice, ask for money. You want money, ask for advice. The trick is to really engage your donors. Transactional fundraising is not the way to gain success or improve your ROI.”
The Association of Advancement Services Professionals (AASP) and the Association for Professional Researchers for Advancement (APRA) teamed together to create a consistent, usable set of policies and procedures for the industry so that metrics and evaluation, as well as actions and prospect management, can be consistent across staff members19. Their best practices in prospect management include the following portfolio optimization guidelines:
19 Association of Advancement Services Professionals (AASP) http://www.advserv.org/Resources/Documents/AASPA PRA_Best%20Practices_ProspectManagement_Polies%20and%20Procedures.pdf

40
T Assign a priority to each prospect: top (ask within 12-18 months), emerging (move to Top within 12-18 months), discovery, stewardship, perpetual steward-ship (probably not going to give much more, but continue contacting them)
T Based on having approximately 120-150 major gift prospects (20-30 in Top, 20-30 in emerging)• 25% in Qualification• 25% in Cultivation • 30% in Pre-solicitation or Solicitation• 20% in Identification (before a gift) or Stewardship (after a gift)
T 80-150 major gift prospects to be cultivated over the next 2-5 years , leading to 30-45 asks per year, which should yield 10-15 gifts each year
Cultivation is the longest stage in the continuum, and can last up to a year. Traditionally, it’s also the most resource-intensive from a human capital perspective, as the gift officer’s responsibilities include in-person meetings, handwritten notes, personal phone calls, tours, etc. But in the long run it is a strategy that pays off. Industry metrics show that the costs of acquiring a new donor can be 6 to 7 times more than retaining an existing donor.
Studies have shown that donors who give over multiple years give much more than those who don’t. For every year you retain a donor, they become more valuable. And because your cost to cultivate doesn’t rise as quickly as does their support, you are generating greater net revenue to fuel your organization. For example, a study presented in 2010 by The Center on Philanthropy at Indiana University20 showed that persistent (3-yr) donors give more on average than repeat (2-yr), or occasional donors (1-yr). This study is based on a sample of 5,728 households who answered giving questions in 2001, 2003, and 2005.
Persistent (3-yr) Repeat (2-yr) Occasional (1-yr)
Mean Median Mean Median Mean Median
Total $2,659 $1,260 $1,022 $400 $406 $150
Religion $1,627 $500 $592 $50 $216 $0
Secular $1,033 $380 $430 $127 $190 $51
Table 6: Persistent, Repeat & Occasional Donors. Based on COPPS data.
Source: Based on COPPS data.
20 The Center on Philanthropy at Indiana University, http://www.cic.edu/News-and-Publications/Multimedia-Library/CIC ConferencePresentations/2011%20Presidents%20Institute/philanthropic-giving.pdf.

Measuring Fundraising Return on Investment 41
Special Considerations for Planned GivingROI metrics for planned giving should be considered separately from other gift types. The related costs for planned gifts can occur many years before the income is received. In fact, the average time from inception to maturity for a planned gift is 7-10 years. Therefore, looking at its ROI in the context of the year in which the gift is initially committed gives an incomplete measurement.
Furthermore, charitable organizations have different guidelines in accounting for planned gifts, determining the charitable tax deduction for planned gifts, and counting planned gifts for capital campaign reporting. For example, IRS charitable deduction calculations were not created for the purpose of counting planned gifts and, while valid for tax purposes, do not offer a way of counting planned gifts that recognizes the total campaign and development effort21. In many cases, these various yet accepted methods for accounting, counting, and determining the charitable deduction do not effectively capture the value of planned gifts.
The Partnership for Philanthropic Planning (formerly NCPG) offers Guidelines for Counting Charitable Gifts as well as Valuation Standards for Charitable Planned Gifts to help nonprofits understand the value of a planned gift in terms of its present purchasing power. Utilizing these standards to measure the value of a planned gift – and calculating ROI accordingly – enables the organization to better understand the costs and benefits of planned gift fundraising and determine the overall effective-ness of their investment in planned giving.
The good news is that donors can be more generous with non-cash gifts because of additional tax benefits. The typical capital gift target is 20 times a donor’s largest annual fund gift, while the typical planned giving target is 200 times a donor’s largest annual fund gift22. So while understanding the costs and returns of planned gift fundraising may prove challenging, the benefits are proven.
“Donor cultivation, and ultimately donor retention, is a careful dance between the short-term funding needs of the organization and the long-term impact of keeping a donor year after year.”23
- Rick Dunham President & CEO, Dunham+Company
21 Partnership for Philanthropic Planning, National Committee on Planned Giving, Guidelines for Counting Charitable Gifts, 2nd Edition, 2008. ( http://www.pppnet.org/pdf/NCPG-counting-guidelines-(rev-2008).pdf) 22 http://www.plannedgiving.com/answers/marketing 23 Dunham+Company, http://dunhamandcompany.com/rickblog/fundamental-3-donor-cultivation-and-retention/

White Paper For Nonprofit Organizations
42
The Tie to the Marketing Office

Measuring Fundraising Return on Investment 43
The Tie to the Marketing OfficeWhile there are massive differences between fundraising, marketing and commu-nications, fundraising and marketing professionals need to work closely together to achieve fundraising goals. The fundraising and development process is designed to convince prospective donors to contribute to the nonprofit organization, while the marketing process serves to promote the delivery of services that benefit their constituents. In practice, fundraising provides the opportunity for donors to support their community and/or the nonprofit’s constituency. Marketing advances the efforts to carry out the organization’s mission through advertising, promotion, publicizing its programs and services to its users and the general community, and recruiting volunteers and sponsors.
In essence, development focuses on the donor, and marketing focuses on the constituent. That said, there are great opportunities for the two groups to generate synergies. Their priorities need not be in conflict with each other, and the marketing director and the development director should regularly coordinate, interact, encourage and support their mutual goals, efforts and achievements.
For example, the marketing communications that are used to support fundraising activities also serve to build awareness for the organization as a whole and its cause. This in turn helps to build a pipeline for potential donors and facilitates the “ask.” Second, it is the brand identity and messaging that marketing creates that helps the organization speak with a single voice and deliver a clear message that resonates with current and prospective donors.
WealthEngine’s research in the marketplace shows that one of the closest points of interaction between the two groups is in the area of communications and social media, and data and analytics. Marketing helps fundraising with commu-nications, while fundraising aids marketing with acquiring and maintaining data, and preparing or recommending list segmentations. The majority of fundraising professionals who participated in our survey feel that the relationship between the two departments is somewhat or very collaborative.
One of the most promising aspects of social media is its impact on ROI. Nonprofits of every kind are finding that social media is making word of mouth marketing and advertising exponentially more effective.

44
How Marketing Department Assists with Fundraising
Figure 11: Please specify how your marketing department assists with fundraising
How Development Team Assists with Marketing
Figure 12: Please specify how your development team assists with marketing
% Response % Response
52.1%
49.0%
62.4%
43.6%
39.0%
34.7%
15.2%
6.4%
0.0% 10.0% 20.0% 30.0% 40.0% 50.0% 60.0% 70.0%
Preparing or recommending list segmentations
Acquiring data
Maintaining database
Conducting prospect and market level research
Monitoring and contributing to social media communities
Data analytics
Does not assist
Other
% Response % Response
11.2%
26.6%
57.4%
28.7%
22.8%
16.8%
45.9%
7.6%
8.6%
7.4%
6.8%
0.0% 10.0% 20.0% 30.0% 40.0% 50.0% 60.0% 70.0%
Does not assist
We do not have a separate marketing department
Issuing communications and press releases
Planning and executing direct mail or email campaigns
Planning and executing special events and activities
Preparing solicitations
Organizing communications via social media channels
Acquiring lists
Data analytics
Recruiting volunteers
Other

Measuring Fundraising Return on Investment 45
Collaboration Between Fundraising and Marketing within Organization
19%
8%
30%
30%
13%
Not collaborative at all
Slightly collaborative
Somewhat collaborative
Very collaborative
Extremely collaborative
Figure 13: Select option that best describes collaboration between fundraising and marketing within your organization
When looking at the cost structure for the development office, organizations should take into consideration the fact that some of the staffing, resources (like wealth intelligence, campaign and program costs) and other expenditures that are used in fundraising are also utilized in marketing. When looking at returns, marketing and fundraising are inextricably tied.
The Impact of Social MediaMarketing, and specifically marketing for fundraising, mixes especially well with social media outlets. Getting the word out is imperative, and the web is where people are spending most of their time. In the broadest sense, the widespread use of social media is breaking down communication barriers and opening organizations, companies, governments and individuals to new kinds of interactions and new levels of transparency.
WealthEngine explores this topic in detail in the 2012 publication, Fundraising’s Social Revolution: How Social Media is Changing Nonprofit Culture and Practice. Our research shows that overall, nonprofits have been relatively quick to adopt social practices including the use of social media and social technologies. According to a study by The University of Massachusetts Dartmouth Center for Marketing Research24, the 200 largest U.S. charities (as compiled by Forbes Magazine25) are outpacing the business world and academia in their adoption and use of social media. Previous res-earch by the same Center found that academia (Colleges and Universities) were using social media to a greater extent than businesses, represented by the Fortune 50026 list
24 Partnership for US Charities’ Adoption of Social Media Outpaces All OtherSectors for the Third Year in a Row Conducted by:Nora Ganim Barnes, Ph.D. ([email protected]) and Eric Mattson ([email protected]) 25 The 100 Largest Charities, Forbes Magazine, November 2012. http://www.forbes.com/top-charities/ 26 http://money.cnn.com/magazines/fortune/

46
of America’s largest corporations (by revenue). Small- and medium-sized nonprofits, however, that are adopting social media tools and practices, are doing so at a much slower rate than their larger counterparts, as evidenced in research conducted by Georgette Dumont of the University of North Florida27.
Social tools are most often used by nonprofit organizations in the areas of:
T Education and advocacy
T Prospect development including prospect identification and prospect research
T Fundraising including events, engagement and cultivation, email and online campaigns
T Marketing and public relations including constituent engagement, brand awareness, media relations, service recovery, and crisis communication
T Human resources including staff and volunteer recruitment, internal communications, and training
One of the most promising aspects of social media is its impact on ROI. Nonprofits of every kind are finding that social media is making word of mouth marketing and advertising exponentially more effective.
Social media is all about listening, engaging and integrating relationships:
1. Listen to assess what people are saying, monitor and observe behaviors and relationships and learn from peers and constituents
2. Engage by posting content, answering questions and effecting actions
3. Integrate relationships into existing organizational activities by recruiting advocates, drawing donors and prospects closer and identifying and leveraging influencers
Fundraisers have found social media especially helpful in enhancing traditional campaigns with multi-channel techniques and within major giving to engage and cultivate donors. Many nonprofits have discovered that multi-channel fundraising, just like multi-channel marketing, is the most effective approach. A multi-channel approach simply integrates social media and online fundraising channels with traditional direct mail, event, email and/or telephone strategies. A recent study by NTEN and M-R Strategic Services found that in 2011, by adding social media to the mix of fundraising appeals making up a campaign, the quantity of donations increased 20% on average, leading to an overall increase in funds raised of 19%28.
We are seeing social media platforms substantially change the way organizations, communities and people communicate. And, it’s notably different from traditional
27 Dumont, Georgette E. Nonprofit Engagement of Social Networks, University of North Florida 28 2012 eNonprofit Benchmarks Study. http://www.e-benchmarksstudy.com/

Measuring Fundraising Return on Investment 47
media in its accessibility, lack of hierarchical structure and rapid interactivity – all of which helps to bring about highly effective and highly efficient contact, communication and cultivation of donors.
Measuring ROI of Social EffortsThe following are a few of the ways nonprofit organizations are measuring the success of their social media investments:
T Number of followers or fans in the nonprofits community
T Growth rate of the fan community
T Number of “opens,” (for email) or clicks (for embedded links)
T Number of actions completed (for calls to action)
T Participation rate (for appeals)
T Average gift size (for appeals)
Many organizations are beginning to dive deeper to find the value in social media by measuring things such as:
T Percent share of the “conversation,” for instance Digital Marketing Manager Dan Michel monitors what percent of conversations about “hunger” Feeding America is mentioned in.
T Percent of online giving coming from web and unsolicited sources (including social media “fans”) vs. email solicitations29
T Number of Facebook fans per email subscriber (average for all nonprofits: 103 per 1,000)30
T Facebook “action rate”, or the number of likes and comments/members of the community (average for all nonprofits: 2.5 per 1,000)31
T The cost and value of a Facebook Fan (cost: $3.50 and value over one year: $214.81)32
Many organizations view social media content as a fertile field from which to pluck relevant, timely and useful information to identify and cultivate major gift prospects. By connecting via social networks, prospects are identifying an affinity for the organization, and as they reveal their interests and passions – as people do in any relationship whether on- or off-line – it allows the organization to cultivate them towards a truly meaningful giving experience. There is value, as well as fundraising potential, in using social media to develop such relationships with donors, prospects and constituents, today and for the future.
29 2012 eNonprofit Benchmarks Study 30 Ibid 31 Ibid 32 4th annual Nonprofit Social Network Report: http://nonprofitsocialnetworksurvey.com/

White Paper For Nonprofit Organizations
48
The Impact of Wealth Intelligence on Fundraising Return on Investment

Measuring Fundraising Return on Investment 49
The Impact of Wealth Intelligence on Fundraising Return on InvestmentThe discipline of wealth intelligence combines the use of wealth, lifestyle and biographical research data with advanced analytics. Traditional prospect research is useful for determining whom to target and engage, deciding when and how to target them, and assessing how much to ask them for. Wealth intelligence takes this a step further by providing an analytical approach to using data, and is useful not only for researching prospects but for setting organizational priorities, determining a fundraising or marketing strategy, segmenting and prioritizing prospects, and improving interactions with constituents, donors and prospects in order to build long term relationships and drive long-term value.
Wealth intelligence includes these primary activities:
T Wealth or asset screening
T Analytics to assess wealth, assets, liquidity
T Analytics to assess giving capacity and giving propensity
T Peer screening
T Demographic appends
T Predictive modeling
Wealth or asset screening is the most commonly used form of wealth intelligence used by WealthEngine’s survey respondents (47.1%). Analytics and peer screenings are also commonly used, as indicated in the chart below. Of those who conduct screenings, 42% do them on a periodic basis, in small batches, several times a year.
Most Common Forms of Wealth Intelligence
% Response % Response
46.7%
62.3%
47.1%
24.2%
28.9%
30.5%
16.5%
13.0%
14.7%
8.1%
15.9%
3.1%
0.0% 10.0% 20.0% 30.0% 40.0% 50.0% 60.0% 70.0%
Subscription based sources
Free Internet sources
Wealth or asset screening
Analytics to assess wealth, assets, liquidity
Analytics to assess giving capacity and giving propensity
Peer screening
Demographic appends
Predictive modeling
Surveys
Focus groups
None
Other
Figure 14: What methods of prospect research, data collection and analytics do you utilize?

50
Screening Frequency
11%
20%
42%
10%
11%
Never
Periodically, in small batches
Annually
Every 3 years
Every 5 years
Other
6%
Figure 15: How often do you screen your data?
By leveraging systematic wealth intelligence to better build, segment and target qualified pools of donors, nonprofit organizations can maximize efficiencies in their fundraising. Nevertheless, some nonprofits don’t recognize the value that wealth intelligence brings to the table; they may look at the cost of research and staffing resources as simply a capacity-building expense, and not as an investment that can generate value and drive a higher rate of return. “When making a decision to employ wealth intelligence and prospect research, you need to look at it from the ROI perspective. You have to ask yourself, does the cost warrant a big enough return to warrant the expense?” suggests Olshansky.
Oftentimes, the answer is yes. Leveraging wealth intelligence specifically can boost fundraising results and have a positive impact on fundraising ROI. A research study by the School of Philanthropy at Indiana University in 201033 showed that donors who give over multiple years give much more than those who don’t. This study also showed that the mean income and wealth of persistent givers was consider-ably higher than that of repeat and occasional givers. As a result, it is important for fundraisers to leverage wealth intelligence – including hard asset, income, and cash on hand scores as well as charitable giving history, estimated giving capacity and RFM, in order to better focus their fundraising efforts on those with the capacity and propensity to give.
33 http://www.cic.edu/News-and-Publications/Multimedia-Library/CICConferencePresentations/2011%20Presidents%20 Institute/philanthropic-giving.pdf and http://www.philanthropy.iupui.edu/research-by-category/center-on-philanthro py-panel-study

Measuring Fundraising Return on Investment 51
Donor (mean) Persistent (3-yr) Repeat (2-yr) Occasional (1-yr) Non-Donors
Income $89,441 $71,155 $43,205 $29,229
Wealth (excluding home equity) $344,188 $217,031 $116,625 $43,111
Table 7: Income and Wealth of Persistent and Repeat Donors
Source: Based on COPPS data.
Uses of Wealth Intelligence for Successful Fundraising and BeyondThe effective and systematic application of wealth intelligence can help nonprofits save time and money and maximize fundraising ROI. Wealth intelligence is important to:
T Identify new prospects with wealth, disposable income and an inclination to give
T Segment and prioritize existing donors and prospects for major gift, planned giving, direct mail and special events
T Determine ask amounts to maximize overall gift potential
T Validate gift pyramids and establish data-driven cultivation strategies
T Predict giving and determine the right ask
T Equip development officers with valuable “conversation starters” and critical information on hard assets, philanthropic and personal interests, company information, political giving, as well as corporate and social networks
T Provide opportunities to meaningfully engage board members, trustees, volunteers and other stakeholders in the fundraising process
Wealth intelligence is an essential part of the fundraising infrastructure. By providing the insight to determine how to effectively reach out to the right donors at the right time with the right ask amount, wealth intelligence is an investment that yields positive results.

52
Investing in Wealth IntelligenceIn addition to the staffing component, the development expenses related to wealth intelligence and prospect research can include a range of data and analytics, such as individual and batch screening, online data mining, peer screening and modeling and analytical tools, as described below.
Wealth Intelligence Solution
Description Average Cost
Batch and On-demand screening
Wealth screenings provide wealth identification, philanthropic and demographic information on lists of donor and/or prospect records. These screen-ings can encompass hundreds, thousands or even hundreds-of-thousands of records that are screened across multiple public data sources. Screenings can be done in large batches or in small samplings, often done at frequent intervals. The screened results can also have predictive modeling and analytic tools built into them, which are posted online, via a database that functions as a stand-alone resource, or inte-grated into a donor management system.
Typical batch screening costs are between $2,500 to $25,000, although costs can range from $500 to hundreds of thousands of dollars, depending on the number of records, which data sources are used, level of detail, extent of analysis and overall sophistication of the screening tool.
Online data mining Online wealth intelligence tools provide data, ratings and scores on individual donors, corpora-tions and foundations, gathered from one specific public data source or a wide range of data sources. Information is available through a searchable online platform and/or compiled into easy to read profiles. Data typically includes hard asset information like real estate, income and pension, stock ownership as well as philanthropic and biographical data. It can (and should) include ratings and scores to evaluate an individual’s ability to make a donation and the likelihood of them doing so.
Annual subscription costs range from $500 - $10,000, depending on the type of service. Stand alone data sources cost less, while data providers with multiple sources and features cost more.
Peer screening Individual or group-based review of prospect lists for assessment of wealth, inclination and capacity to give. These individuals or groups might include board members, key volunteers, staff or major gift donors. Verbal review of the list uncovers relation-ships, biographical details, as well as speculation on a prospect’s gift capacity.
There are minimal to no costs for peer screening, other than wealth screening and/or staff time applied to compiling the list.
Modeling and analytic tools
Includes custom modeling to address an organiza-tion’s specific fundraising objectives. The organiza-tions’ prospect lists are analyzed against the model and scores are assigned to determine how closely a prospect’s attributes match those of the model in order to identify the best prospects and their propensity to give.
Like screening costs, outsourced data modeling can range from thousands to tens of thousands of dollars. Costs will depend on the number of records reviewed and scored, the number of models developed, the cleanliness of the data set, and the sophistica-tion of the analytic method. There may be additional costs for wealth or demographic data appends if needed or desired.
Newspaper/magazines, hard copy and online data manuals
Includes a variety of free and fee-based data sources, most of which are subscription based.
Fees range from free to hundreds or thousands of dollars for a subscription.

Measuring Fundraising Return on Investment 53
When asked how the results of their most recent screening were used, the most common uses cited by WealthEngine’s survey participants included major giving programs (44.6%), annual giving programs (29.4%) and direct mail or email (27.9%). Approximately 26.3% use the results for the purposes of program strategy/planning.
Uses for Screening Results
% Response % Response
26.3%
27.9%
18.3%
17.1%
5.3%
44.6%
22.9%
29.4%
9.7%
28.8%
5.2%
0.0% 5.0% 10.0% 15.0% 20.0% 25.0% 30.0% 35.0% 40.0% 45.0% 50.0%
Program strategy and planning
Direct mail or email
Event strategy and planning
Event list development
Social media planning
Major giving program
Planned giving program
Annual giving program
Corporate and foundation giving
We have not done a recent screening
Other
Figure 16: In your most recent screening, how were the results used?
The Role of Predictive AnalyticsNonprofit organizations both large and small are finding that data analytics, when performed using both data found within their own organizations as well as through external data sources, is critical to achieving high performance. An analytical approach to wealth intelligence allows you to factor in a variety of data points, or attributes, and examine them together to create a complete picture or profile of an individual’s wealth. These attributes can include the individual’s net worth, income, giving history, relationships, education, businesses owned or employment, affilia-tions, interests and more. WealthEngine uses hundreds of data points to effectively analyze wealth and develop custom models and analytic solutions for clients.
Fundraising programs that include major gifts, annual giving, campaign components and events should include wealth intel-ligence in order to efficiently focus resources on those donors or prospects that are most likely to have the greatest impact − with a single gift or with increasingly higher gifts over time.
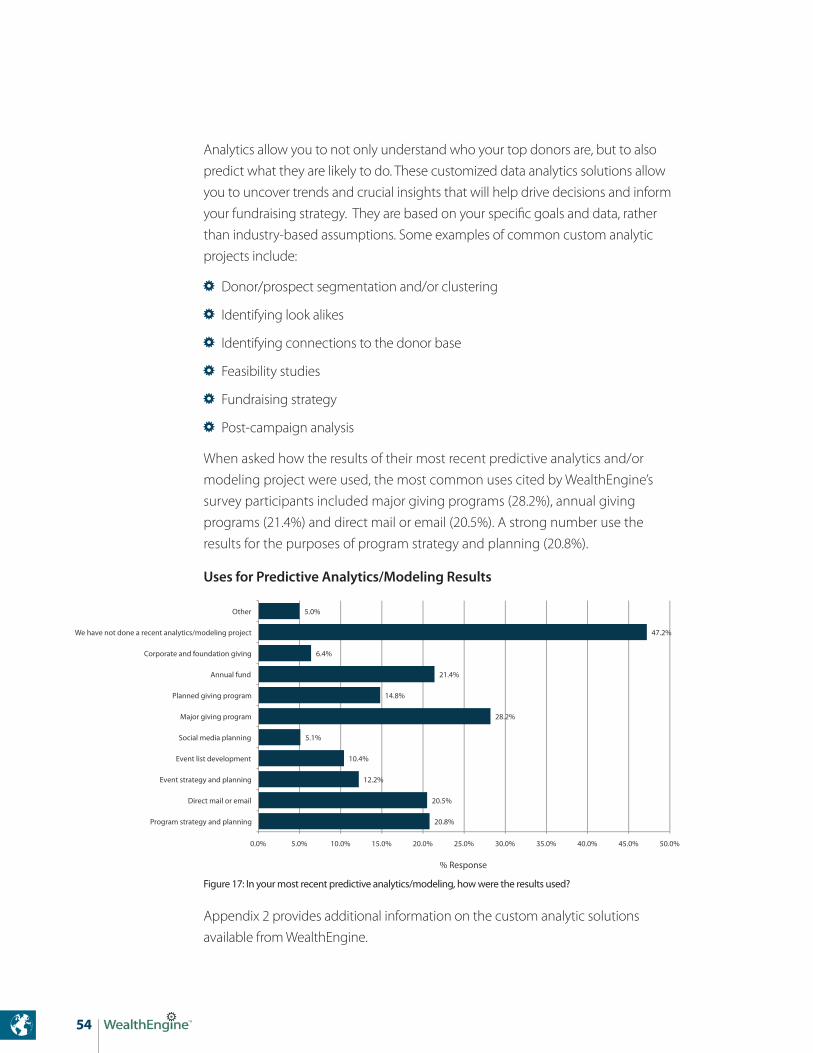
54
Analytics allow you to not only understand who your top donors are, but to also predict what they are likely to do. These customized data analytics solutions allow you to uncover trends and crucial insights that will help drive decisions and inform your fundraising strategy. They are based on your specific goals and data, rather than industry-based assumptions. Some examples of common custom analytic projects include:
T Donor/prospect segmentation and/or clustering
T Identifying look alikes
T Identifying connections to the donor base
T Feasibility studies
T Fundraising strategy
T Post-campaign analysis
When asked how the results of their most recent predictive analytics and/or modeling project were used, the most common uses cited by WealthEngine’s survey participants included major giving programs (28.2%), annual giving programs (21.4%) and direct mail or email (20.5%). A strong number use the results for the purposes of program strategy and planning (20.8%).
Uses for Predictive Analytics/Modeling Results
Figure 17: In your most recent predictive analytics/modeling, how were the results used?
Appendix 2 provides additional information on the custom analytic solutions available from WealthEngine.
% Response % Response
20.8%
20.5%
12.2%
10.4%
5.1%
28.2%
14.8%
21.4%
6.4%
47.2%
5.0%
0.0% 5.0% 10.0% 15.0% 20.0% 25.0% 30.0% 35.0% 40.0% 45.0% 50.0%
Program strategy and planning
Direct mail or email
Event strategy and planning
Event list development
Social media planning
Major giving program
Planned giving program
Annual fund
Corporate and foundation giving
We have not done a recent analytics/modeling project
Other

Measuring Fundraising Return on Investment 55
Measuring the Return of Your Wealth Intelligence InvestmentUsing an analytic approach and leveraging the data available through an online wealth intelligence platform allows development professionals to save time and money by identifying and focusing on their best prospects. It is in itself, a means to maximizing fundraising ROI. Imagine if you had to subscribe to dozens of research services, or spend hours and hours combing through hundreds of wealth, lifestyle and biographical research data on an individual! A wealth intelligence platform puts this data at your fingertips. It distills the data into valuable insight that can help you reach your preferred audience, faster and with greater precision and success.
In addition to helping nonprofits improve efficiency, analytics can help you improve effectiveness. By comparing predictive analytics against actual results you can see which aspects of your fundraising campaigns are working, and which may need to be refocused. This enables you to identify if there are issues with your current fundraising strategy and determine how making certain changes to the campaign strategy can impact campaign performance.
Investing in wealth intelligence and predictive analytics significantly increases both the size and quality of the prospect pipeline. The benefits to having a more comprehensive and accurate target prospect list, and the ability to apply analytics to further segment and classify the prospect pipeline, allows institutions to more effectively and efficiently target their strongest prospects and donors. This results in a higher response rate and a higher percentage of closed gifts, and can even bring about higher average gift amounts. Through better segmentation and qualification of the target donor audience, organizations can also reduce programmatic costs, including direct mail material and mailing expenses.
“An analytical tool cannot tell you what is in a donor’s heart, but it does allow you to focus on and build relationships with those who are most likely to give.”
- Rick DunhamPresident & CEO, Dunham+Company

56
When determining the impact wealth intelligence has on ROI and CRD, it is important to consider the way in which wealth intelligence is utilized across various fundraising programs. For example, when conducting batch screenings, data can be segmented and used for multiple fundraising activities, such as annual fund and major gift campaigns. Consequently, the use of wealth intelligence and predictive models will impact the ROI of each fundraising activity you are engaged in.
The following table provides typical scenarios in which wealth intelligence is used, and how it can impact ROI:
Activity Prospect Research Use Potential Impact on ROI
Soliciting Smaller Gifts Identify, prioritize and segment large masses of donors and prospects for various campaigns, at specific gift levels such as with an annual fund
Reduce overall campaign costs by better targeting solicitations
Cultivating Major Gifts or Planned Gifts
Identify prospects with the greatest gift capacity and propensity to give, resulting in targeting fewer donors, but at higher gift levels
Increase returns by setting more appropriate, and potentially higher, ask amounts
Constituent Review Routine evaluation of service recipients, such as patients, student parents/alumni, member-ship subscribers or ticket holders, etc. Regular screenings identify new prospects that are already connected to the organization, which are analyzed and distributed to the various fundraising pro-grams (annual fund, major gifts, planned giving, etc.) according to their propensity to give and giving capacity
Increase participation rates and yield higher returns by having a consistent prospect pipeline, segmented for action
Building the Prospect Pipeline
Establish models to verify that currently identified major gift prospects actually have major gift potential, and to increase the major gift prospect pool through the addition of names previously unidentified.
Increase returns by expanding the organization’s universe of prospects and identifying the best matches for cultivation

Measuring Fundraising Return on Investment 57

White Paper For Nonprofit Organizations
58
Other Factors Affecting Return on Investment Metrics

Measuring Fundraising Return on Investment 59
Other Factors Affecting Return on Investment MetricsThe fact that there are so many variables in a nonprofits’ fundraising cost structure, coupled with the notion that some nonprofits have made concerted and some-times excessive efforts to control costs, makes the case for measuring ROI and CRD for fundraising all the more compelling.
That said, determining a reasonable range for the rate of return per dollar invested on the overall fundraising effort can depend on a multitude of factors. First, it is important to distinguish between those activities and expenses related to individual giving and those that involve overall fundraising, such as grants and public funding. When it comes to individual giving, an acceptable ROI, CRD and other performance measures can depend on factors such as the nonprofit organization’s history, age, size, constituent profile, programs, funding structure, local demographics, local economics, staffing and fundraising history.
Additionally, organizations are not the same in how they conduct fundraising nor does fundraising perform the same for all organizations. As a result, comparative performance data from other organizations must be used with caution. While they can be used as benchmarks or guidelines, organizations will be best served to set their own benchmarks and performance criteria, and compare their results against initial goals.
Moreover, when assessing your ROI and cost-benefit figures to determine how effective your organization may be, it’s important to look at these metrics against your organization’s overall goals, not just your fundraising goals. As Olshansky explains, “It’s important to look at the non-cost aspects of ROI, such as the impact on other mission related activities and the opportunity cost. It’s important not to take a simplistic view of crunching numbers.”
For years, Olshansky has counseled his clients on the topic of events, and why it is so important for organizations to not take the poor ROI of events so seriously. “While they may be at a high cost, events serve other important purposes aside from fundraising. They are used to engage and celebrate the work of volunteers, bring constituents and the community together, and more. So you have to look at what is your purpose, what is your desired outcome, and what is the opportunity cost. It may be appropriate to spend for the event.”

60
Finally, most organizations should and do conduct an annual performance analysis, but to really understand what these metrics mean, it is important for them to look at their annual data as a benchmark and compare results against at least three previous years. This approach allows you to consider cultivation time and the average donor lifecycle when evaluating your organizations ROI and CRD figures.
For example, it’s easy to consider how one should measure ROI and CRD when conducting a fundraising event or direct mail solicitation. In these cases, the time period from generating and verifying a target list to executing the campaign is relatively short, ranging from a few weeks to a few months, making the ROI equation quite linear. However, when assessing ROI for major giving, nonprofits need to consider both the limitations and effects of relationship-building. Many larger donations come from years of cultivation, so they may not be clearly evident in an annual ROI model. When assessing ROI, the costs for research and wealth intelligence are calculated in the year they are incurred, while the benefits or return are not accounted for until they actually come in the door. As a result, development offices should consider their average donor cycles and measure ROI first on a yearly basis, and also look to establish three, five and even ten year averages.
Identi�cation Quali�cation Cultivation Solicitatio
n
S
tew
ards
hip
The Donor Lifecycle

Measuring Fundraising Return on Investment 61
Factors to Consider when Evaluating Your ROI and CRDThe Association of Fundraising Professionals (AFP) cites the following factors to consider when evaluating an organization’s fundraising costs and returns.
T Age of the organization. A well-established organization will likely have a greater return on investment than a newly established nonprofit.
T Age of the fundraising department. A mature, professionally run development program will be expected to produce a higher return on investment than a newly formed department.
T Source of funds. Nonprofits that rely heavily on small gifts from individual donors will have higher fundraising costs. In contrast, organizations that receive support from the federal government, corporations, foundations, or large gifts from wealthy donors, tend to have lower costs.
T Different methods used in the fundraising process will produce different returns. For example: • A donor acquisition mailing will have a much lower return on investment than a donor
renewal mailing.• A capital campaign will produce a much higher return on investment than an annual
fundraising program.• A new planned giving program may have zero return on investment for the first few years.• The return on investment for a special event will be lower than that for a major gifts program.
T Size of an organization. The return on investment may be affected by organization size.
T Profile of the constituency. The economic and geographic profile of the constituency being solicited will affect fundraising costs and return on investment.
T Location of the organization. An organization located in an affluent region should expect a higher return on investment than one located in a less affluent area.
T Popularity of the cause. The cause and its level of community acceptance will affect the return on investment.
T Competition for funds. Within the community or constituency that the organization is appeal-ing to for support, competition by other organizations may lower the return on investment.
T Sometimes, a fundraising campaign may lose money in the short term, but generate significant returns in the long run. The cost of direct mail acquisition (mail solicitations sent to potential new donors) may range from $1.00 to $1.25 per dollar raised. However, once new donors have been identified, a second mailing to that group may cost only $0.20 per dollar raised. Thus, while the first mailing may not bring in much money, the second mailing should bring in a substantial number of contributions. These newly identified donors may ultimately donate even larger gifts to the nonprofit (e.g., land, stocks, charitable bequests.).
Source: Factors affecting fundraising costs, AFP Resource Center. http://www.afpnet.org/ResourceCenter/ArticleDetail.cfm?ItemNumber=3299

White Paper For Nonprofit Organizations
62
Conclusion and Next Steps
Measuring Fundraising Return on Investment 63
Conclusion and Next StepsEvaluating Return on Investment provides great advantage for moving a nonprofit organization’s development office, its management and the board forward in aligning the business of fundraising with their overall philanthropic mission. Separate ROI benchmarks can and should be established for the various fund-raising activities that are designed to produce contributions – including donor acquisition, donor renewal, special events, major gifts, planned giving, capital campaigns and grantseeking – and all activities should be considered when measuring overall performance of the organization.
While monetary returns provide one true measurement of ROI, when evaluating fundraising effectiveness and the impact of wealth intelligence, there are a number of other metrics to consider. Looking at the number and the dollar amount of each gift, the number of new/ recaptured /repeat donors, the percentage of donor renew-als and number of donors upgraded/downgraded, as well as metrics related to the fundraising lifecycle, provides valuable indicators of performance. Also important to consider is the impact that the organization’s efforts in direct marketing and social media have on fundraising ROI. As many nonprofits have realized, a solid social media strategy can drive forward the number and value of individual donations by breaking down communication barriers and allowing organizations to quickly and more easily engage with donors, prospects and constituents.
Finally, when assessing your ROI and cost-benefit figures to determine how effective your organization may be, it’s important to consider the non-cost aspects of fundraising ROI, such as the impact on other mission related activities and the opportunity cost, and to look at these metrics against your organization’s overall goals, not just your fundraising goals. As Rick Dunham points out, “At the end of the day, a nonprofit’s success is about more than just keeping costs low and looking at ROI, it’s about measuring outcomes against the mission.”
The ROI of each fundraising activity should be managed sepa-rately because of their distinctly different purposes, varied sources of funds, and/or individual performance characteristics. This allows the nonprofit to assess the economic benefits achieved by their various fundraising efforts and recognize how investing in one activity versus another may yield better results.

64
When measuring the ROI for each fundraising activity, the investment in wealth intelligence should be considered. This provides a meaningful assessment of the impact that wealth intelligence and predictive analytics can have on the overall effectiveness of the organization’s fundraising efforts, especially when looking at the figures and ratios over three, five and ten year periods. This information is especially important to board members, CFOs and others who have a voice in how the fundraising budget is established and managed. It allows the nonprofit organization to potentially increase their fundraising, research and analytics budget by providing the proof positive that wealth intelligence is an investment that yields positive results.
Measuring ROI is important for development offices of all sizes; it requires a systematic process, a long term commitment and the tools to track and measure results consistently.

Measuring Fundraising Return on Investment 65

White Paper For Nonprofit Organizations
66
Case Studies

Measuring Fundraising Return on Investment 67
CASE
STU
DY
Maryland Republican Party Achieves Fundraising Success with Targeted Messaging and Appropriate Donation Requests
The ClientThe Maryland Republican Party (Maryland GOP) is the Annapolis-headquartered branch of the United States Republican Party (GOP). David Ferguson was named Executive Director of the organization in December 2011, with the mandate of leading the day-to-day operations, including management, public relations, marketing, and fundraising. “Our job is to get Republicans elected, identify and recruit good candidates, train and support candidates, register republican voters, provide opportunities for volunteers and to raise money to support all of these activities,” says Ferguson. In addition, for the first time in a generation, the Maryland GOP initiated petition drives during 2012’s election cycle, gaining 280,000 signatures on petitions to support key Republican platforms.
The ChallengeThe Republican Party is typically an underdog in the historically democratic- controlled state of Maryland. Despite the challenges, however, they are committed to communicating a conservative vision of lower taxes, fiscal responsibility, and creating a hospitable environment in which to live, work and raise families. Funding the activities to make this vision a reality is a continuing demand in the face of a competitive political landscape and fundraising environment. One of the priorities Ferguson brought to the job was to put in place smarter fundraising strategies.
“We use direct solicitation, direct mail, telemarketing, events, social media, online and email solicitations to prospect for new donors and to renew and upgrade our current donors,” shares Ferguson. The Maryland GOP needed to identify their best prospects for different solicitation channels, so they could gain a better under-standing of who their best donors were, and how to best approach each segment for the greatest possible gifts.

White Paper For Nonprofit Organizations
68
CASE STUD
Y
The SolutionThe Maryland GOP contacted WealthEngine in early 2012, and developed a strategy for their election year fundraising push. They obtained a list of registered republicans from the Maryland State Board of Elections, including which elections they had voted in. Ferguson selected the best 80,000 voters which formed the basis for prospecting activities. Through list trades with other republican organizations, including the National Republican Senatorial Committee (NRSC), the National Republican Congressional Committee (NRCC) and the Republican National Committee (RNC), the Maryland GOP was able to overlay their list with known donors to other republican causes.
Next, they submitted the list to WealthEngine for screening against public databases. WealthEngine was able to screen and append wealth data to all records, along with WealthEngine’s unique ratings and scores to allow the Maryland GOP to quickly segment these prospects into different groups. Based on their attention to publicly available data and focus on cost-effective constituent targeting, they were able to develop a multi-pronged fundraising and prospecting strategy that paid dividends.
T Those who were rated very highly for estimated giving capacity and propensity to give (P2G) by the WealthEngine screening were further reviewed for political donations (also a data point in the screening), assets, net worth and cash on hand. Those who showed promise as potential major donors of $10K or more were siphoned off for personal solicitation by leadership. High potential prospects rated with capacity of $1MM or more were also invited to exclusive events and otherwise cultivated according to their potential impact.
T The next tier of prospects selected were those with mid- to high capacity of $100K up to $1MM, and who had known donations to other causes. These were solicited by direct mail.
T A final segment included those with capacity of $25K - $100K, again with known donations, and these were solicited by telemarketing.
Direct MailProspecting
Direct, Face-to-FaceCultivation andSolicitation
TelemarketingProspecting
KnownContributions
HistoricallyRepublican Voters
WealthEngine Capacity Ratingof 6 and 7
WealthEngine Capacity Rating of 1 and 2
WealthEngine Capacity Rating of 3, 4 and 5
Client
KEY
WealthEngine

Measuring Fundraising Return on Investment 69
CASE
STU
DY
All three segments focused primarily on prospects aged 50 and above, which was another data point accessed in the screening.
The ResultsThis data-driven strategy paid off for the Maryland GOP. In their major gift efforts, they have identified unknown prospects for their Chairman’s Club, and have begun to work them up the giving ladder, from $50 and $100 gifts, to $1,000 and $1,500 gifts. Ferguson describes one such prospect, who he had planned to ask for $500 before the screening. When he discovered the capacity of the individual, he adj-usted his ask accordingly, and that donor has now given $15K this year. “Without WealthEngine, I had no idea how wealthy he was,” says Ferguson. “Once I found out, I adjusted my strategy and it paid off.”
Using as a baseline their 2011 fundraising results, the organization had budgeted to spend $88K for direct mail, with a goal to raise $135K. Their results as of the end of October show they have spent $80K and raised $218K so far in 2012. That’s a 61% increase over their anticipated goal, and an enviable $0.37 per dollar raised for direct mail, including a significant amount of acquisition. “I attribute our success to making smarter decisions about who to mail to, and what to ask for,” says Ferguson. “WealthEngine has been an integral part of our smarter decision making over the past year, allowing us to reduce our fundraising expenses and targeting our efforts towards those most likely to support our cause.”
Prospecting efforts for telemarketing have also been outstanding raising $25K in small contributions, many $5 or $10 donations. All of these new donors were then funneled to the direct mail house file. As most organizations who invest in prospect acquisition know, break even or better for this type of outreach is an outstanding result, and with appropriate stewardship, upgrading and engagement, these donors will be contributing, perhaps multiple times per year, for years to come.
“I attribute our success to making smarter decisions about who to mail to, and what to ask for. WealthEngine has been an integral part of our smarter decision making over the past year.”
- David FegusonExecutive Director, Maryland Republican Party

White Paper For Nonprofit Organizations
70
CASE STUD
Y
Ferguson explains, “We changed a number of things this year. We tightened our messaging, making it less generic, and more Maryland-specific. We targeted our messaging better. And we played to our strength of attracting a loyal following from the grass roots of the Republican Party.” The Maryland GOP is focused on finding the small- to mid-sized donors, who may give smaller gifts, but give month after month. “We won’t turn away the ultra-wealthy,” he adds, “but the small- to mid-sized donors are our bread and butter, and these are the ones we want to engage, involve and provide opportunities for them to volunteer. WealthEngine helped us find those prospective donors and target the right people. That strategy worked and will keep working.”
Next StepsFerguson believes the Maryland GOP has only scratched the surface in their emergence as a leader in data-driven political fundraising. He anticipates screening additional lists of registered voters, starting with those who are registered republican, and who have voted in the past three elections. Eventually, he may even turn his sights to democrats who have voted republican. “I’m looking forward to seeing what our results look like in a non-election year. We typically see fewer donations, but I’m banking that our strategy will keep working and will position us well in the next election cycle.”
“We won’t turn away the ultra-wealthy, but the small- to mid-sized donors are our bread and butter, and these are the ones we want to engage, involve and provide opportunities for them to volunteer. WealthEngine helped us find those prospective donors and we were then able to target the right people with the most appropriate ask amount. That strategy worked and will keep working.”
- David FegusonExecutive Director, Maryland Republican Party

Measuring Fundraising Return on Investment 71
CASE
STU
DY
Oregon State University FoundationUses WealthEngine to Realize 24,750% ROI for Potential Donor Discovery Project
The ClientOregon State University is Oregon’s Land Grant University and one of only two land grant universities in the country (the second is Cornell University in New York) to also hold sea, space and sun grant designations. The university was founded in 1868 and is approaching its Sesquicentennial or 150 year anniversary. Oregon State boasts strong agricultural, forestry, and engineering programs, as well as a superb ocean sciences program. At 26,000 students, the Oregon State community is home to students from all 50 states, and over 100 countries. The Oregon State University Foundation, the fundraising arm of the university, launched the public phase of OSU’s first ever comprehensive campaign in 2007 with a goal of $625 million. Raising more support from more sources at a faster pace than imagined, they have since adjusted their goal upward twice, and now stand to raise over $1 billion by the campaign close in 2014.
The ChallengeOne of the campaign priorities directly impacting the university’s ability to raise the needed funds for this campaign and to lay the groundwork for future improvements in fundraising capacity and effectiveness was the Discovery Project. The establishment of the Discovery Project was deemed a campaign goal and sought to qualify 6,000 individuals (potential donors) identified capable of giving $25K and above for the major gift pipeline. This goal was shared by the Advancement Services, Prospect Research, and Fundraising teams. Advancement services would source the necessary data, prospect research would identify and verify the capacity of prime candidates, and major gift officers would qualify potential donors through direct contact.
Mark Koenig, Senior Director for Advancement Services at the OSU Foundation, joined the team in 2008, shortly after the public launch of the campaign, and became an integral part of the team responsible for building the Discovery Program. “Prior to 2008, we, like many institutions, screened our data the traditional way,” shares Koenig. “Prior to your campaign, you would do a full data base screening and

White Paper For Nonprofit Organizations
72
CASE STUD
Y
never look back until the next.” When Koenig came on board, bringing experience from Rice University, Georgetown University and George Washington University, things changed. “OSU had done a full database screening with another company and had imported the returned data directly into our Advance database. It was problematic – no verification of the results had been done. Unfortunately, the data was just dumped in and not used strategically,” says Koenig. His first order of business was to back track and complete verification on the data that was in the data base.
This earlier screening had suggested to leadership that there were 6,000 individuals in the database capable of making major gifts to the campaign, and it was from this data that leadership included a discovery goal of 6,000 qualified prospects in their campaign strategic plan.
The SolutionLooking to do screenings in a more precise, structured and actionable way, Koenig brought in WealthEngine. “I had worked with WealthEngine in the past, and I trusted the data, so I added it to the slate of tools we use here at OSU. We started doing what I call ‘surgical screenings,’” says Koenig. “These are actually changing the way we do our work. We screen about 30,000 records per year, divided into mini-screenings, and they are tied to specific university goals.” Koenig attends management meetings, and as goals are identified for a project in agricultural sciences or a new building or other project, he and his team mine the university data to determine which records are appropriate to send for a mini-screening. They use WealthEngine’s on-demand screening service, which allows them to upload up to 6,000 records at a time and have them screened and returned the same day.
þ Used WealthEngine to conduct mini screenings of specified groups of constituents mined from the data base
þ Used WealthEngine’s FindWealth Online platform to help with research verifications
þ Total cost of data and online platform over 5 years 2008-2012= $45,875
þ Prospect Research has to date verified 7,815 new prospects from the WealthEngine Screenings
þ Major Gifts Officers have qualified (or dis-qualified) 3,462 of these
þ 1,506 (44%) have been assigned to major gift portfolios for cultivation
þ 184 have made gifts to the campaign resulting in $11.4M in new gifts from new donors
þ With a total cost for the Discovery Project of $45,875, and total revenue to date of $11.4M, the total ROI for the project stands at 24,750%
Prospect Management and ROI
Prospect Veri�cation & Quali�cation Data Sourcing

Measuring Fundraising Return on Investment 73
CASE
STU
DY
“Prior to sending the data, we look for those records in our sweet spot for capacity, age and other factors, and once we get the data back, research verifies the findings from the top down. Verification may take 15-30 minutes per record, depending on the complexity of the data matched,” explains Koenig. He points to one recent example, in which they screened a segment of prospects for OSU’s College of Engineering. “We got the results back, and there were 8 prospects in the $5 million+ capacity range. When we had reviewed them all, we ended up with two we didn’t know. One turned out to be a previously unidentified potential donor with huge capacity. Trust me, that was an invaluable find.”
The ResultsUsing the surgical screening method with WealthEngine, the OSU Foundation has already identified 7,815 constituents with capacity to make a gift of $25K or more who have had little to no contact from the University prior to identification. These were added to prospects already rated to make a total pool of 11,277 new prospects for the Discovery Project. Overall, the University has a pool of 22,366 rated prospects.
Research analysts spend approximately 25% to 30% of their time on screening verifications (or identifications), and major gift officers are tasked with qualifying the identified prospects forwarded to them by the Research Department, with goals for qualification varying by individual based on portfolio composition, longevity in field work, and other goals. “The important thing,” says Koenig “is that they actually have goals. That’s a key to making the Discovery Project work. If major gift officers didn’t have qualification as part of their goals, it simply wouldn’t work.”
“I had worked with WealthEngine in the past, and I trusted the data, so I added it to the slate of tools we use here at OSU. We started doing what I call ‘surgical screenings’. These are actually changing the way we do our work.”
- Mark KoenigSenior Director for Advancement Services, Oregon State University Foundation

White Paper For Nonprofit Organizations
74
CASE STUD
Y
Of the pool of prospects verified by research from the WealthEngine screenings, 3,462 have been qualified either by phone or through face-to-face contact. A qualification, according to OSU metrics, can be either positive or negative. “It is as important to learn that someone is not interested in the university as it is that they are,” Koenig explains. “We’re just a lot happier when we find out they are.”
Of the 3,462 qualifications, 1,506 or 44% have been positive and therefore have moved into major gift officer portfolios for cultivation. 569 of those, or 16% of those who were qualified, have been solicited for a major gift, and 184, or 5%, have made gifts to the campaign. These gifts have resulted in $11.4M in contributions to the campaign.
“The amazing thing is that this $11.4M in revenue is directly attributable to the work we’ve been doing. We didn’t hire any additional staff, we didn’t add to travel or hospitality budgets, the only direct expense attributable to the Discovery Project is the surgical screenings we’ve been utilizing since 2008,” according to Koenig. The screenings and the FindWealth Online subscription together have averaged about $9,175 per year, for a total over the past five years of $45,875. Because no other direct expenses were incurred in the project, ROI can be calculated as:
“While it’s true that staff time has been devoted both to the verification of prospects and the qualification of prospects,” he explains “the truth is that these staff members would have been doing prospect identification and qualification anyway, and likely it would have been much less efficient. Realizing a 24,750% ROI is simply phenomenal, and makes you wonder why everyone isn’t doing it.”
“When I started, I was leery of the 6,000 goal,” shares Koenig. “I wasn’t confident of the historical data we had on file. But now that we’ve been screening our prospects on a routine basis, and put the time into qualifying them, we have 11,000 prospects in our discovery pool, waiting to be qualified. Now it’s just a matter of time before we exceed the original 6,000-prospect goal.”
= 24,750% 11,400,000 - 45,875
45,875

Measuring Fundraising Return on Investment 75
CASE
STU
DY
With responsibility and accountability built into the discovery process at OSU for both the research office and the major gifts team, the Discovery Project has been a huge success. Koenig stresses the importance of having leadership committed to a data-based approach to fundraising, and being disciplined about tracking activities and results. “We have to be aligned with the overall goals of the university,” he adds. “If we had to do a lot of full profiles of prospects, we wouldn’t have time to do this. Because the goal is to fill the campaign pipeline and seed the pipeline for the next campaign, we’ve been able to focus a lot of our time on discovery, and it has paid dividends.”
Next StepsThe OSU Foundation has taken its data-based approach beyond reporting and metrics and is building a formidable modeling arsenal, including ratings for enthusiasm, engagement and a just-released planned giving score. Having multiple dimensions on which to evaluate and cross-tabulate prospects allows Koenig’s Advancement Services group to serve many functional units. In addition to the major and annual giving teams, they provide data and analysis to the Alumni Association, who have used the enthusiasm score to identify volunteers and committee members, and the planned giving group, who have used data to limit their mailings from mass appeals to more targeted and actionable subgroups.
Koenig looks forward to the coming year, when he is planning to enrich the data files with demographic, behavioral and consumer data. With this addition of data in combination with his modeling scores, he hopes to create more powerful tools to guide and inform University strategies.

White Paper For Nonprofit Organizations
76
CASE STUD
Y
University of the Sciences Data and Analytics Drive Results and Demonstrate ROI
The ClientHow does a two century old educational institution that has undergone tremen-dous change keep its alumni connected and engaged? University of the Sciences in Philadelphia, PA (USciences) is doing just that. Founded in 1821, the University was the first college of pharmacy in North America. Today, it has grown to serve more than 2,800 students across five colleges, offering undergraduate and graduate programs across a range of sciences and health sciences. From treating, researching, and studying diseases and cures on a molecular level to the medicines that improve the lives of people worldwide, USciences is about moving life forward.
The ChallengeAs Vice President of Institutional Advancement, Carrie Collins is faced with the challenge of building effective fundraising and marketing programs across all aspects of the University, including Development, Alumni, Marketing and Communications, and Government and Community Affairs. With a staff of 25, of which only five focus on fundraising - including one focusing on major gifts, two professionals focused on annual giving, and one focused on corporate and foundation gifts, Collins is an avid believer in taking a data-driven approach to engaging donors and maximizing the ROI of fundraising.
USciences has three major fundraising programs: Major and Planned Gifts, Annual Giving and Corporate and Foundation Relations. Further emphasis is also being place on alumni engagement. “With all of the changes our institution has undergone since we achieved university status in 1997 – new buildings, new programs, a new brand and image – making our alumni feel connected to who we are today is important,” explains Collins.
The Solution To maximize the effectiveness of these programs, Collins has utilized wealth screenings and appends to identify and segment donors, and to prioritize her team’s prospecting and cultivation efforts. She employs a number of analytic approaches to maximize and quantify her success, including:

Measuring Fundraising Return on Investment 77
CASE
STU
DY
T Leveraging data to segment donors, create prospect portfolios and prioritize cultivation efforts
T Developing a scoring system to categorize alumni volunteerism in each stage of the donor lifecycle
T Tracking of ROI of individual fundraising activities, including solicitations and closures
T Determining optimal resource allocations and workload assignments
T Measuring the ROI of frontline fundraisers
Upon arrival to USciences in 2012, Collins immediately began to utilize the WealthEngine data to create meaningful portfolios of prospects that would provide the fundraisers on her team with multiple opportunities for success. For example, utilizing the expectation/rating metric, Collins would assign prospects to the appropriate fundraiser: prospects rated at $500,000 and above were assigned to her; prospects rated between $50,000 and $500,000 were assigned to the major gifts officer; and those rated lower were divided among the two annual giving fundraisers, with an eye to moving annual donors from one level of the leadership society up to the next and to engage and secure gifts from “future donors,” i.e., alumni who had never donated to the institution. As fiscal year 2013 comes to a close, Collins and her team are further refining the prospect assignments, using additional data points, including the number of years an individual has been a consistent donor, to make adjustments to the portfolios.
These data and analytic-driven strategies have enabled Collins to better allocate her team’s time and make more informed decisions around the cultivation strategies that are used. “We’ve done screenings and have used analytics to assess wealth, assets, giving capacity and propensity, but now more than ever before we are using this data to drive our moves management strategy.”
For example, one of their key initiatives this year is alumni engagement, which is centered on showing alumni how important their service to the University is, and celebrating their collective efforts as volunteers and donors. To do this, they have developed a series of key strategic indicators to measure success.
The close of fiscal year 2013 marks the second year that Collins and her Alumni Relations team have been tracking alumni volunteerism, and the first report of such activity--a comparison of FY12 and FY13--is slated for distribution in September 2013. By creating a series of categories of alumni volunteerism, including service on the alumni board, the board of trustees or one of the colleges’ boards of visitors, event hosting and serving as volunteer solicitors, Collins plans to

White Paper For Nonprofit Organizations
78
CASE STUD
Y
show that USciences’ alumni population is engaged. Highlighting the number of volunteers, the level of their engagement, the number of hours contributed, and linking that information to the number of donors and aggregate dollars donated, Collins hopes to use data to quantify the elusive “alumni engagement” metric.
The ResultsLooking at the aggregate data over a period of quarters provides a strong indication of an individual’s performance. While data from a single quarter can also let you know whether someone is on the right track toward success, overall performance cannot be isolated by reviewing a single quarter—after all, since when do gifts close on a consistent basis across quarters?
A frontline fundraiser was added at USciences in September 2012, with the following fourth quarter performance. Compared to her performance expecta-tions, she is conducting an outstanding number of visits, which indicates that she is doing her utmost to meet as many prospects as possible. While the number of proposals she has submitted is low, her yield percentage is perfect. Thus, she does not appear to be engaging in ambush asks and has taken her time to settle into her role and ask at a time and for an amount that’s appropriate. Furthermore, she closed an amount that’s just below her expectation; again, as a newer fundraiser, this is evidence of outstanding fundraising performance.
Frontline Fundraiser: Major Gift Officer Quarterly Measures
Metrics MGO: Quarterly Measures MGO1: Actual
Visits 30 44
Proposals Submitted 4 2
Proposals Closed 2 2
Yield Percentage 50% 100%
Dollars Raised $125,000 $100,000
Cost of Employment (assuming 100% of time spent engaged in frontline fundraising)
$42,082 $42,082
Net Dollars Raised $82,918 $57,918
Return on Investment Percentage 297% 238%
Table 8: Frontline Fundraiser: Major Gift Officer Quarterly Measures
Collins herself is subject to performance expectations, and her fourth quarter performance is set forth below. Given that she spends approximately 25% of her time on fundraising, and a lesser dollar amount on travel and hospitality, her cost

Measuring Fundraising Return on Investment 79
CASE
STU
DY
of employment figure is much lower. However, she is expected to raise a substan-tially higher amount of money, which represents an ROI of over 3,000%. Collins had an outstanding quarter, closing a $2,000,000 commitment, as well as a few others, resulting in an ROI of over 12,000%!
VP Advancement: Quarterly Measures
Metrics VP: Quarterly Measures VP: Actual
Visits 10 4
Proposals Submitted 3 6
Proposals Closed 1 4
Yield Percentage 33% 67%
Dollars Raised $500,000 $2,025,000
Cost of Employment (assuming 25% of time spent engaged in frontline fundraising)
$15,625 $15,625
Net Dollars Raised $484,375 $2,009,375
Return on Investment Percentage 3,200% 12,960%
Table 9: VP Advancement: Quarterly Measuress
Alumni Engagement Results
Initial results of the data comparing alumni engagement in FY12 to FY13 are encouraging. The total number of alumni who volunteered rose 9%, assisted in part by the fact that four additional categories of volunteerism were offered-- an increase of 21%. These alumni participated in 306 separate instances of volunteerism, which was a 5% increase over FY12.
Collins will continue to provide new and interesting opportunities for alumni to become engaged in a meaningful way with the University. By tracking this infor-mation and presenting it to alumni in a fun and interesting fashion, Collins believes that even more alumni will be inspired to reconnect with their alma mater.
Next StepsGreat fundraisers understand the art of the ask—how to cultivate, when to solicit, and for what purpose. We are all driven to use data in our profession, whether it’s to determine who our best prospects are or whether a particular messaging point was effective in a direct mail solicitation. An ROI report is a helpful tool to measure whether our fundraisers are taking best advantage of the data—the science—that is available to them to perfect their art.

White Paper For Nonprofit Organizations
80
Appendix 1: Worksheets

Measuring Fundraising Return on Investment 81
Appendix 1.1: Tracking Fundraising Key Performance MetricsThe following outlines the key performance metrics that the fundraising office should track, measure and report on. It is important to track these metrics for each key fundraising activity or program, and assess by:
T Comparing the effectiveness and ROI of each activity against the initial goals
T Comparing the effectiveness and ROI of each activity against other activities
T Comparing the effectiveness and ROI of each activity over a three or even five-year timeframe to determine year over year changes and trends.
Fundraising Key Performance Metrics
Prospecting Year 1 Year 2 Year 3
Number of Prospects Under Management
Increase/decrease in Size of Prospect Pool
Average Time (months)
Discovery to Cultivation (Months)
Cultivation to Solicitation (Months)
Solicitation to Stewardship (Months)
New and Recaptured Donors Year 1 Year 2 Year 3
Number of New and Recaptured Donors
Number of Prospects Solicited
Dollars Raised from New and Recaptured Donors
Average Gift Size from New and Recaptured Donors
New Donor Renewals (renewing after first gift) Year 1 Year 2 Year 3
Number of New Donor Renewals
Percent of New Donor Renewals
Number of First Time Donors Solicited
Dollars Raised from First Time Donors
Average Gift Size from First Time Donors
Repeat Donors Year 1 Year 2 Year 3
Number of Repeat Donors
Percent of Repeat Donors
Number of Repeat Donors Solicited
Dollars Raised from Repeat Donors
Average Gift Size from Repeat Donors

82
Fundraising Key Performance Metrics (Continued)
Upgraded/Regraded/Downgraded Donors Year 1 Year 2 Year 3
Number of Donors Upgrading Gifts
Percent of Donors Upgrading Gifts
Dollars Raised from Upgraded Donors
Average Gift Size from Upgraded Donors
Number of Donors Maintaining Gifts (Regraded)
Percent of Donors Maintaining Gifts (Regraded)
Number of Donors Downgrading Gifts
Percent of Donors Downgrading Gifts
Table 10: Fundraising Key Performance Metrics
Appendix 1.2: Tracking and ROI of Gift Activity, and the Impact of Wealth IntelligenceThese examples demonstrate major gift activity over a specified period. The reports not only track major gift activity by gift officer, but measures the efficacy of research by analyzing the source of the prospect identification, any variance in the gift received from the research rating, and the length of time and number of contacts required to secure the gift.
Individual Major Gifts for Q4 2013
Research Source
Major Gift Assign-ment
Research Rating (low end)
Amount Received
Overage or (Underage) from Rating
Date Prospect Identified
Date Gift Received
Length of Cultivation (in months)
Number of Contacts
Table 11: Quarterly Major Gift Report

Measuring Fundraising Return on Investment 83
Appendix 1.3: Tracking and ROI of Fundraising, and the Impact of Wealth IntelligenceUse this chart to measure the return on investment from conducting a wealth screening.
Gift Received Amount Date Received
Estimated Giving Capacity
P2G Rating Internal Rating
Stage at Screening
Length of Cultivation (in months)
Research Time Invested (in months)
1
2
3
4
5
6
7
8
9
10
11
12
13
14
15
16
17
18
19
20
21
22
23
24
25
26
27
28
29
30
Table 12: Measure the benefit from research for each gift received

84
Appendix 1.4: ROI for Fundraising OperationsThis table is an example of a report that can be generated to calculate return on investment, as well as cost per dollar raised, for individual fundraising programs as well as for the overall fundraising function.
Expenses Overall Major Gifts Annual Fund Corp & Foundations
Planned Giving
Salary & Benefits
Fundraiser Salary & Benefits
Prospect Research Salary & Benefits
Administrative Overhead
Subtotal Salary & Benefits
Direct Expenses
Travel
Meals
Events
Telephone
Printing & Mailing
Office Supplies
Equipment
Maintenance
Dues & Memberships
Donor Recognition
Professional Development
Research Subscriptions
Screening
Total Expenses
Revenues
Major Gifts
Corp & Foundation
Annual Fund (Direct Mail, Telethon, Events)
Planned Giving
Total Gift Revenue
Net Revenue (Total Gift Revenue - Total Expenses)
Cost per Dollar Raised (Total Expenses / Net Revenue)
Return on Investment (Net Revenue / Total Expenses)
Table 13: ROI for Fundraising Operations

Measuring Fundraising Return on Investment 85
Appendix 1.5: ROI of Frontline FundraisersThe following tables were provided by Carrie Collins, Vice President of Institutional Advancement, University of the Sciences, Philadelphia PA. They offer an illustrative example of how the ROI for various frontline fundraisers might be calculated. All metrics should be reported on a quarterly basis, and these spreadsheets represent one quarter of performance.
ROI Summary
Metrics Annual Giving Major Gift Officers Corporate & Foundation Relations
Average Number of Visits 11.00 22.67 15.00
Average Number of Proposals Submitted 5.00 4.00 5.00
Average Number of Proposals Closed 3.00 1.00 1.00
Average Yield Percentage 62% 46% 20%
Average Dollars Raised $9,300 $188,333 $100,000
Average Cost of Employment (by quarter) $10,625 $42,082 $27,249
Average Net Dollars Raised ($1,325) $146,251 $72,751
Average Return on Investment Percentage 80% 448% 367%
Table 14: ROI Summary
Annual Giving
Metrics Director: Quar-terly Measures
Director: Actual
Ass’t Dir: Quar-terly Measures
Ass’t Director: Actual
Average
Visits 15 11 15 11 11
Proposals Submitted 18 7 18 3 5
Proposals Closed 6 4 6 2 3
Yield Percentage 33.33% 57.14% 33.33% 66.67% 61.90%
Dollars Raised $25,000 $4,100 $12,500 $14,500 $9,300
Cost of Employment (assuming 50% of time spent engaged in frontline fundraising)
$13,625 $13,625 $7,625 $7,625 $10,624.75
Net Dollars Raised $11,375 ($9,525) $4,875 $6,875 ($1,324.75)
Return on Investment Percentage 183.49% -30.09% 163.94% 190.17% 80.04%
Table 15: Annual Giving ROI

86
Major Giving
Metrics MGO: Quar-terly Measures
MGO1: Actual MGO2: Actual MGO3: Actual Average
Visits 38 24 16 40 26.67
Proposals Submitted 6 4 3 5 4.00
Proposals Closed 3 1 1 4 2.00
Yield Percentage 50.00% 25.00% 33.33% 80.00% 46.11%
Dollars Raised $125,000 $100,000 $340,000 $125,000 $188,333.33
Cost of Employment (assuming 100% of time spent engaged in frontline fundraising)
$42,082 $42,082 $42,082 $42,082 $42,082.38
Net Dollars Raised $82,918 $57,918 $297,918 $82,918 $146,250.96
Return on Investment Percentage 297.04% 237.63% 807.94% 297.04% 447.53%
Table 16: Major Giving ROI
Corporations and Foundations
Metrics Director: Quarterly Measures Director: Actual
Visits 15 15
Proposals Submitted 6 5
Proposals Closed 3 1
Yield Percentage 50.00% 20.00%
Dollars Raised $125,000 $100,000
Cost of Employment (assuming 100% of time spent engaged in frontline fundraising)
$27,249 $27,249
Net Dollars Raised $97,751 $72,751
Return on Investment Percentage 458.73% 366.98%
Table 17: Corporations and Foundations ROI

Measuring Fundraising Return on Investment 87

White Paper For Nonprofit Organizations
88
Appendix 2: WealthEngine Custom Analytics

Measuring Fundraising Return on Investment 89
Appendix 2: WealthEngine Custom Analytics for Nonprofit OrganizationsThe following table provides a summary of the custom models that WealthEngine offers.
Model Definition Practical Application
Major Gift Model
Predicts the likelihood of a constituent to give at or above your major gift threshold
Capital or Comprehensive Campaign Major Gift Program or Campaign
Planned Giving Model Predicts the likelihood of a constituent making a planned gift or commitment do-nating an annuity, bequest, or trust to your organization
Legacy or Planned Gift Program
Annual Fund Model Predicts the likelihood that a constituent will respond to an annual fund campaign
Annual Fund Program
Likelihood to Give Model Predicts the likelihood that a prospect will give to an organization
Annual Fund Program Grateful Patient Program
Estimated Next Gift Amount Estimates the next gift amount based on prior giving and/or wealth attributes
Annual Fund Program Major Gift Program
Gift Pyramid Determine or assess the feasibility of a capital campaign goal through the development of a gift pyramid that identifies and qualifies prospects by analyzing historical giving, affinity, and ability
Capital Campaign
Donor 360⁰ Analyze giving data to segment donors, uncover donor characteristics and predictors for a more complete picture of who is giving, why they are giving and whom to target for similar outcomes
Annual Fund Program Major Gift Program Planned Giving Program Grateful Patient Program
Prospecting Look-alikes Applies the characteristics of donors to the prospecting universe to identify the best matches for cultivation
Annual Fund Program Major Gift Program Planned Giving Program

White Paper For Nonprofit Organizations
90
Appendix 3: ROI Measurements: Results from the WealthEngine 2013 Survey

Measuring Fundraising Return on Investment 91
Appendix 3: ROI Measurements: Results from the WealthEngine 2013 Survey The following provides a summary of the responses gathered through WealthEngine’s 2013 survey, when asked what specific returns have you experienced for the various fundraising programs they take part in.
Major Giving
Metrics Average Range
Average Return on Investment 1844% 4% to 10,000%
Average Cost to Raise a Dollar $1.62 $.03 to $20
Number of Prospects per Major Gift Secured 17 2 to 157
Number of Contacts per Prospect to Secure a Gift 11 2 to 50
Percent Increase/decrease in Size of Prospect Pool 17% -25% to 150%
Percent Increase/decrease in Average Cultivation Time 16% -15% to 50%
Percent Increase/decrease in Number of Gifts 26% -50% to 200%
Percent Increase/decrease in Average Size of Gifts 28% -25% to 500%
Table 18: Major Giving Returns
Planned Giving
Metrics Average Range
Average Return on Investment 31% 3% to 75%
Average Cost to Raise a Dollar $0.25 $0.05 to $0.80
Number of Prospects per Planned Gift Commitment Secured 65 4 to 250
Number of Contacts per Prospect to Secure a Gift 14 1 to 75
Percent Increase/decrease in Size of Prospect Pool 11% -25% to 40%
Percent Increase/decrease in Average Cultivation Time 6% -25% to 33%
Percent Increase/decrease in Number of Gifts 59% -40 to 400%
Percent Increase/decrease in Average Size of Gifts 2% -56% to 50%
Table 19: Planned Giving Returns
Annual Giving
Metrics Average Range
Average Return on Investment 1061% 2 to 13,000%
Average Cost to Raise a Dollar $0.35 $0.02 to $2.83
Percent Increase/decrease in Size of Prospect Pool 23% -5% to 50%
Percent Increase/decrease in Number of Gifts 25% -20% to 400%
Percent Increase/decrease in Average Size of Gifts 9% -33% to 37%
Table 20: Annual Giving Returns

92
References4th annual Nonprofit Social Network Report, http://nonprofitsocialnetworksurvey.com/.
2012 AFP Compensation and Benefits Report, Association of Fundraising Professionals, 2012. (http://www.afpnet.org/Audiences/Re-portsResearchDetail.cfm?ItemNumber=11222)
2012 eNonprofit Benchmarks Study, http://www.e-benchmarksstudy.com/.
2013 Giving USA Highlights: An Overview of Giving in 2012. The Giving Institute.
Nonprofit Fundraising Study: Covering Charitable Receipts at U.S. and Canadian Nonprofit Organizations in 2012, Nonprofit Research Col-laborative, April 2013. (http://www.urban.org/UploadedPDF/412836-nonprofit-research-collaborative.pdf )
Association of Advancement Services Professionals (AASP) http://www.advserv.org/Resources/Documents/AASPAPRA_Best%20Practices_ProspectManagement_Polies%20and%20Procedures.pdf
Baruch College’s Nonprofit Management Group, ROI* ANALYSIS By Category of Fund Raising Activity And Average Gift Size Range, as published at http://nccsdataweb.urban.org/PubApps/levis/roi.html and originally published in the Philanthropy Monthly, March, 1993, pp. 23-37.
Bedsworth, Gregory and Howard, Nonprofit Overhead Costs: Breaking the Vicious Cycle of Misleading Reporting, Unrealistic Expectations, and Pressure to Conform, 2008.
Braun Poderis, Joyce.Wearing Those Development and Marketing “Hats” at the Same Time:
A Bad Fit and a Headache, Raise-funds.com. (http://www.raise-funds.com/2007/wearing-those-development-and-marketing-hats-at-the-same-time-a-bad-fit-and-a-headache/)
Center on Nonprofits and Philanthropy, Urban Institute and Center on Philanthropy, Indiana University, What We Know About Over-head Costs in the Nonprofit Sector, Nonprofit Overhead Cost Project, Brief No. 1, February 2004. (http://nccsdataweb.urban.org/kbfiles/313/Brief%201.pdf )
Doughty, Roger. The Multiplier Effect: Invest in Fundraising, Philanthropy411 blog, April 11, 2011. (http://philanthropy411.wordpress.com/2011/04/11/multiplier/)
Dumont, Georgette E. Nonprofit Engagement of Social Networks, University of North Florida
Dunham+Company, http://dunhamandcompany.com/rickblog/fundamental-3-donor-cultivation-and-retention/
Dunham and Company Annual State of Philanthropy Study, January 2013. (http://dunhamandcompany.com/downloads/DC_StateOf-PhilanthropyStudy_PresentationDeck20130123.pdf )
Greenfield, James. “Accountability and Budgeting, Assessing Costs, Results and Outcomes.” In Hank Rosso, Achieving Excellence in Fundrais-ing, New York: Wiley, 2003.
Factors affecting fundraising costs, AFP Resource Center (http://www.afpnet.org/ResourceCenter/ArticleDetail.cfm?ItemNumber=3299)
Greenfield, James. “Results Analysis and Performance Measurements.” In Hart, Ted [ed] et al, Major Donors: Finding Big Gifts in Your Database and Online, New York: Wiley, 2006.

Measuring Fundraising Return on Investment 93
Guidelines for Counting Charitable Gifts, 2nd Edition, Partnership for Philanthropic Planning, National Committee on Planned Giving, 2008. ( http://www.pppnet.org/pdf/NCPG-counting-guidelines-(rev-2008).pdf )
Mal Warwick Associates, How much to spend? (http://www.malwarwick.com/mals-corner/askmal/how-much-to-spend.html)
NC State University, Relationship Management Best Practice, February 2009. (http://www.ncsu.edu/advancement-services/prospectmg-mt/2-4-09%20NC%20States%20Relationship%20Management%20Best%20Practi.pdf )
Olshansky, Norman. Return on Investment: Getting the Most From Your Fundraising Efforts, NFP Consulting Resources. (http://nfpconsult-ing.com/pages/ROI.html)
Pallotta, Dan. The way we think about charity is dead wrong, TED, March 2013. (http://www.ted.com/talks/dan_pallotta_the_way_we_think_about_charity_is_dead_wrong.html)
Partnership for Philanthropic Planning, National Committee on Planned Giving, Guidelines for Counting Charitable Gifts, 2nd Edition, 2008. (http://www.pppnet.org/pdf/NCPG-counting-guidelines-(rev-2008).pdf ) http://www.plannedgiving.com/answers/marketing
Social Security Administration, History of Cost of Living Adjustments. (http://www.ssa.gov/cola/automatic-cola.htm)
SupportingAdvancement.com, What is the average cost per dollar raised. (http://www.supportingadvancement.com/faq/cost_per_dol-lar_raised.htm).
The 100 Largest Charities, Forbes Magazine, November 2012. http://www.forbes.com/top-charities/
The Center on Nonprofits and Philanthropy, Urban Institute and Center on Philanthropy, Indiana University, Getting What We Pay For: Lower Overhead Limits NonProfit Effectiveness, Nonprofit Overhead Cost Project, Brief No. 3, August 2004. (http://nccsdataweb.urban.org/kbfiles/311/brief%203.pdf )
The Center on Nonprofits and Philanthropy, Urban Institute and Center on Philanthropy, Indiana University, The Quality of Financial Report-ing by Nonprofits: Findings and Implications, Nonprofit Overhead Cost Project, Brief No. 4, August 2004. (http://nccsdataweb.urban.org/kbfiles/520/brief%204.pdf )
The Center on Nonprofits and Philanthropy, Urban Institute and Center on Philanthropy, Indiana University, The Pros and Cons of Finan-cial Efficiency Standards, Nonprofit Overhead Cost Project, Brief No. 5, August 2004. (http://nccsdataweb.urban.org/kbfiles/521/brief%205.pdf )
The Center on Philanthropy at Indiana University, http://www.cic.edu/News-and-Publications/Multimedia-Library/CICConferencePresenta-tions/2011%20Presidents%20Institute/philanthropic-giving.pdf
The Nonprofit Sector in Brief: Public Charities, Giving and Volunteering, The Urban Institute, 2012
The Nonprofit Almanac, Urban Institute, 2012. http://www.urban.org/nonprofits/index.cfm
The Pros and Cons of Financial Efficiency Standards, Nonprofit Overhead Cost Project, Brief No. 5, Center on Nonprofits and Philanthropy, Urban Institute and Center on Philanthropy, Indiana University, August 2004.
US Charities’ Adoption of Social Media Outpaces All Other Sectors for the Third Year in a Row, Survey by
Nora Ganim Barnes, Ph.D. ([email protected]) and Eric Mattson ([email protected]), Center for Marketing Research at the University of Massachusetts – Dartmouth and Society for New Communications Research (SNCR), July 2010.


About WealthEngine™, Inc.WealthEngineTM, Inc. is a leading provider of sophisticated wealth identification and prospect research services to charities, hospitals, institutions of higher education, political campaigns, advocacy groups, and other nonprofit organizations, as well as to firms that offer luxury goods and financial services. Four thousand clients use WealthEngine’s products for comprehensive research on individuals, companies and foundations. Headquartered in Bethesda, MD, WealthEngine serves both the United States and the United Kingdom. For more information, visit www.wealthengine.com.

wealthengine.com [email protected] 800.933.4446