the size and scope of the gb market - w3.siemens.co.uk · © siemens ag 2014. all rights reserved...
TRANSCRIPT

© Siemens AG 2014. All rights reserved
Smart Meter Roll-Out Industry Data Analysis
Multi-Dwelling Units The size and scope of the GB market

© Siemens AG 2014 Multi-Dwelling Units: The size and scope of the GB market Page | 2
Report Author Fiona Worrall Siemens plc Tel: 0115 906 6535 Email: [email protected] Acknowledgements With thanks to EDF Energy and Scottish Power for the contribution of their data and assistance during the analysis process. Siemens plc 100 Woodyard Lane Wollaton NG8 1GB United Kingdom Tel +44 (0)115 906 6000

© Siemens AG 2014 Multi-Dwelling Units: The size and scope of the GB market Page | 3
5
1 Executive Summary …………………………………………………. 5 4 2 MDU Households in GB ……………………………………………. 7
2.1 Definitions of Types of Multi-Dwelling Units 7
2.2 English Households Data 7
2.3 Scottish Households Data 7
2.4 Welsh Households Data 8
2.5 Great Britain Households Total Data 9 3 MDU Buildings in GB ……………………………………………….. 10
3.1 High-Rise Buildings 10
3.2 Low-Rise Buildings 11
3.3 Converted Buildings 12
3.4 Great Britain Total Buildings Data 12
3.5 Unoccupied Buildings 12
5 4 Survey Methods …………………………………………………..... 14
4.1 Introduction to Survey Data 14
4.2 Locations Covered 14
4.3 Data Sample Sizes and Methods 15
4.3.1 Siemens Survey 15
4.3.2 EDF Energy Survey 15
4.3.3 Scottish Power Survey 16
4.3.4 Total Survey Data 16
6 5 Data Analysis ……………………………………………………….. 17
5.1 Introduction to Data Analysis Methods 17
5.1.1 Four Case Model 17
5.2 High-Rise MDUs 19
5.2.1 Dual Fuel Propensity 21
5.2.2 Electricity Meters 22
5.2.3 Gas Meters 24
5.2.4 Space in Meter Rooms 25
5.2.5 Meter Location Matrix 25
5.2.6 Four Case Model for High-Rise 25
5.2.7 Summary of High-Rise Data 26
5.3 Low-Rise MDUs 26
5.3.1 Dual Fuel Propensity 28
5.3.2 Electricity Meters 28
5.3.3 Gas Meters 30
5.3.4 Space in Meter Rooms 30
Contents

© Siemens AG 2014 Multi-Dwelling Units: The size and scope of the GB market Page | 4
5.3.5 Meter Location Matrix 31
5.3.6 Four Case Model for Low-Rise 32
5.3.7 Summary of Low-Rise Data 33
5.4 Converted MDUs 33
5.4.1 Dual Fuel Propensity 35
5.4.2 Electricity Meters 35
5.4.3 Gas Meters 37
5.4.4 Space in Meter Rooms 38
5.4.5 Meter Location Matrix 38
5.4.6 Four Case Model for Converted 38
5.4.7 Summary of Converted Data 39
5.5 Exceptions in Meter Positions 39
5.6 Multiple Meter Rooms 40
5.6 Age Profiling 41
8 6 Conclusion …………………………………………………………. 45
13 7 Appendix …………………………………………………………… 46
Appendix 1: Postcode Regions in London & Bristol Surveyed by EDF Energy and Siemens
Appendix 2: Siemens MDU Survey Form
Appendix 3: Age Profiling
Appendix 4: Siemens’ Mock Comms Hub
Appendix 5: EDF Energy MDU Survey Form
Appendix 6: Scottish Power MDU Survey Summary
Appendix 7: Matrix Case Alignment Guide
Appendix 8: Building Regulations – Disproportionate Collapse
Appendix 9: IGEM G/5 Section 5 Gas Meter Location Restrictions
Appendix 10: High-Rise Meter Location Matrix by Type
13 8 Bibliography ………………………………………………………. 58

© Siemens AG 2014 Multi-Dwelling Units: The size and scope of the GB market Page | 5
Over 5 million households in Great Britain currently live in Multi-Dwelling Units (MDUs) including high-rise, low-rise and converted properties. Of these, it is estimated that over 2.3 million are in buildings which present an increased challenge in relation to the installation of smart metering equipment when compared to single dwelling units eg. houses. In blocks of flats the utility meters (gas and electricity) are often located outside of the individual flats in meter rooms, communal spaces or basement areas. In some cases they are external to the building. This increases the difficulty of connecting the smart metering components to the IHD (In-Home Display). The physical distance between the meters and flats is not the only problem. In several cases the utility meters themselves are located at a distance from each other which further complicates the situation. The fabric of certain buildings can also compromise the effectiveness of the connections between smart devices. The purpose of this research paper is to identify how many households and buildings are likely to have problems with smart metering such as those described above. Consequently, these properties are at risk of not experiencing the benefits of smart metering due to the inability of a standard solution to satisfy the buildings’ requirements. This analysis has been undertaken as a direct action from the Home Area Network (HAN) Advisory Group (a former working group which was a part of DECC’s smart metering implementation programme) to establish an industry agreed position on the size of the challenge to provide effective HAN services to support the roll out of smart meters to consumers living in MDUs. The data analysed in this paper is a combination of the respective research undertaken by EDF Energy, Scottish Power and Siemens. It forms the most detailed field research to date into MDU HAN connectivity issues in Great Britain, representing a common industry baseline. Over 3,000 MDU buildings have been physically surveyed across a number of major cities in Great Britain including London, Glasgow, Manchester and Birmingham.
1. Executive Summary
Figure 1 Connecting smart metering devices in Multi-Dwelling Units can be much more difficult compared to in single dwelling units, partly because of meter locations.
Communications Hub
Electricity Meter
Gas Meter
In-Home Display

© Siemens AG 2014 Multi-Dwelling Units: The size and scope of the GB market Page | 6
This report does not, however, assess the technical options available to resolve this issue or indeed the associated costs of providing effective HAN services to affected households. Instead, this report is intended to act as a catalyst for further investigation into the solution options available and associated cost benefit analysis supported by field trial evidence. As a result it is hoped that effective smart metering services can be deployed to the MDU sub-segment which requires a different HAN solution to that offered by the SMETS2 standard. The results of the combined research (as illustrated by the following tables) show that 2.37m households have a requirement for a different HAN solution other than the SMETS2 standard approach. This equates to 280k buildings.
GB BUILDINGS – TOTAL CASE MODEL CASE* 1a 1b 2 3a 3b 4a 4b HIGH-RISE 5,954 1,589 1,177 109 630 432 0 LOW-RISE 175,542 7,566 22,369 2,056 58,462 3,267 9,801 CONVERTED 10,754 633 92,040 0 12,652 2,530 74,328
TOTAL 202,038 279,853
41.9% 58.1%
GB HOUSEHOLDS – TOTAL CASE MODEL CASE* 1a 1b 2 3a 3b 4a 4b HIGH-RISE 338,111 93,901 51,606 5,077 32,437 19,568 0 LOW-RISE 2,638,468 151,317 398,468 39,391 473,623 65,341 196,024 CONVERTED 64,524 3,795 552,241 0 75,909 15,182 445,968
TOTAL 3,290,116 2,370,835
58.1% 41.9% * Case 1a & 1b will be satisfied by a standard solution whereas cases 2, 3a, 3b, 4a and 4b will require an MDU specific solution. More detailed versions
of thes tables can be found in the Conclusion.

© Siemens AG 2014 Multi-Dwelling Units: The size and scope of the GB market Page | 7
2.1 Definitions of Types of Multi-Dwelling Units The GB multi-dwelling unit market is divided into three major categories as defined below.1 High-Rise A flat in a purpose built block of at least six storeys high. Low-Rise A flat in a purpose built block less than six storeys high. Includes cases where there is only one flat with independent access in a building which is also used for non-domestic purposes. Converted A flat resulting from the conversion of a house or former non-residential building. Includes buildings converted into a flat plus commercial premises (such as corner shops). Regional Variations Tenement (Scottish) A dwelling within a common block of two or more floors (commonly up to five storeys but may be higher in certain circumstances) where some or all of the flats have a shared or common vertical access. The selected dwelling need not share the access, but may be situated within the block with shared/common access (own door flat).2 4-in-a-block (Scottish) Each flat in a block has its own independent access. Flats on the upper level have an internal or external stair.3 2.2 English Households Data The following data for English households is taken from the English Housing Survey.4
MDU TYPE HOUSEHOLDS High-Rise 432,000 Low-Rise 3,247,000 Converted 949,000 TOTAL 4,628,000
2.3 Scottish Households Data The data available for Scotland does not specifically define the number of households in each type of MDU. For this reason, an estimation has been made based on the data available. The total number of
1 Department for Communities & Local Government, ‘English Housing Survey, HOMES 2011‘, (Office for National Statistics) pp.135-6 2 The Scottish Government, ‘Scottish Housing Condition Survey, Key Findings 2010‘, (Office for Na-tional Statistics) p.55 3 The Scottish Government, ‘Scottish Housing Conditiong Survey, Key Findings 2010’, (Office for National Statistics) p.55 4 Department for Communities & Local Government, ‘English Housing Survey, Headline Report 2011-12’, (Office for National Statistics) p.30
2. MDU Households in GB

© Siemens AG 2014 Multi-Dwelling Units: The size and scope of the GB market Page | 8
households in Scotland was listed as 2,386,207 in mid-2012.5 The rate of growth in the number of households per year is listed as 0.5% for 2011-2012. If this same growth rate is applied for the 2012-2013 period then an estimate of the total current households in Scotland is 2,398,138 (+11,931 households). According to the National Records of Scotland 38%6 of these are flats which is 911,292 households. The classification types for MDUs used in Scottish housing data differ to those used elsewhere. In order to assimilate the data the separate Scottish types have been reclassified as follows: Tenement – As these are purpose built blocks usually of around 3 to 5 floors, for the purpose of this analysis they have been categorized as low-rise. There may be some which are more than 5 floors but these are few in number and are thus exceptions and not typical examples. 4-in-a-Block – Like tenements, as these are purpose built blocks which will consist of less than 6 floors they have been reclassified as low-rise for the purpose of this data comparison. To establish the number of households in each type of MDU in Scotland, an estimate has been made using categorisation data from the Scottish public authority housing stock which lists the split as: high-rise 10.69%, tenement & 4-in-a-block/low-rise 69.16%, converted 20.16%.7 Although these figures are taken only from the social sector8 they are similar in nature to the split for the English data and are assumed to be a reasonable representation.
MDU TYPE HOUSEHOLDS High-Rise 97,386 Low-Rise 630,227 Converted 183,679 TOTAL 911,292
2.4 Welsh Households Data Like Scotland, the data for Wales does not specifically define the number of households residing in each type of MDU therefore estimations have been made. The total number of households in Wales is listed as 1,389,118 for 2012.9 The number of new households created in the private sector in Wales from 2011-12 was 5,200 and the number of new households for the same time period in the social sector was 850.10 This same growth rate has been applied to the 2012-13 period to generate an estimate of the total current households in Wales as 1,395,168 (+6,050 households). The Welsh House Condition Survey of 1998 states that there are 1,157,300 dwellings in Wales and that 100,900 of these are flats which is 8.72%.11 This percentage has been applied to the latest total
5 National Records of Scotland, ‘Estimates of Households and Dwellings in Scotland, 2012’, (Office for National Statistics) p.6 6 National Records of Scotland, ‘Estimates of Households and Dwellings in Scotland, 2012‘, (Office for National Statistics) p.50 7 The Scottish Government,‘Public Authority Housing Stock – web table‘, (Housing Statistics for Scot-land) tab:tsStockbyType - AllFlats 8 A portion of the social sector housing stock covered in the data tables will have since been trans-fered to private housing stock under the Right to Buy. This was introduced into Scotland as part of the Tenants’ Rights, Etc. (Scotland) Act 1980 and gave people the right to buy their home from their local authority. The Scottish Government intends to end right to buy entitlements in the Housing Bill and if passed then the right will end three years after the date the Bill becomes law http://www.scotland.gov.uk/Topics/Built-Environment/Housing/16342/rtb. 9 Statistics for Wales, ‘First Release: Dwelling Stock Etimates for Wales 2011-2012’, (Ystadegau Gwladol | National Statistics) p.4 10 Statistics for Wales, ´First Release: Dwelling Stock Estimares for Wales 2011-2012’, (Ystadegau Gwladol | National Statistics) p.3 11 Welsh Government, ‚Welsh House Condition Survey 1998‘ , p.71

© Siemens AG 2014 Multi-Dwelling Units: The size and scope of the GB market Page | 9
dwelling figures, giving the current number of households in MDUs as 121,659. The distribution across the three categories has been taken from the percentages found in the English data to complete the following table (high-rise 9.3%, low-rise 70.2%, converted 20.5%).
MDU TYPE HOUSEHOLDS High-Rise 11,314 Low-Rise 85,405 Converted 24,940 TOTAL 121,659
2.5 Great Britain Total Households Data The following data is a combination of the above figures for England, Scotland and Wales.
MDU TYPE HOUSEHOLDS High-Rise 540,700 Low-Rise 3,962,632 Converted 1,157,619 TOTAL 5,660,951

© Siemens AG 2014 Multi-Dwelling Units: The size and scope of the GB market Page | 10
In the absence of building specific data, extensive desk and field research has been conducted to ascertain the average number of households per building. These figures have then been used to calculate an estimate for the total number of buildings in a certain catergory as follows: Total number of households per MDU type Average number of flats per MDU type 3.1 High-Rise Buildings To allow for increased accuracy when calculating the number of high-rise buildings this category has been split into the following two sub-categories: Non-super high-rise: Below 30m, typically 6-8 floors Super high-rise: Above 30m, typically 9 floors and over With regards to super high-rise buildings, an extensive online database is held by www.skyscrapernews.com, containing details of all buildings over 30m (demolished, cancelled, vision, proposed, pre-planning, under construction, complete).12 According to their records, there are 2,622 currently completed super high-rise buildings in England, Scotland and Wales. The above equation can therefore be reversed to remove the number of households in super high-rise buildings from the total number of households in high-rise, leaving only those in non-super high-rise buildings. The average number of flats was calculated using a desk top analysis of data from 900 buildings held by skyscraper news. This sample accounts for 34.32% of all super-high buildings in GB. The average number of flats was calculated as 87. 87 x 2,622 = 228,114 households in super high-rise buildings To calculate the same figures for the non-super high-rise buildings the following steps were carried out. 540, 700 – 228,114 = 312,586 households in non-super high-rise buildings To calculate the average number of flats per non-super high-rise building a field sample of 194 was investigated.13 This sample accounts for 2.7% of all non-super high-rise buildings in GB and gave the average number of flats as 43. The number of buildings can now be calculated using the following equation. Total number of households in non-super high-rise buildings Average number of flats per non-super high-rise 312,586 . 43 12 www.skyscrapernews.com 13 Siemens and EDF ENERGY data
= Number of buildings for MDU type
Number of super high-rise buildings
Total number of households in super high-rise buildings
x Average number of flats in super high-rise buildings
=
Total number of households in high-rise buildings
Households in super high-rise buildings
=
Households in non-super high-rise buildings
Number of non-super high-rise buildings
=
= 7,269 non-super high-rise buildings
3. MDU Buildings in GB

© Siemens AG 2014 Multi-Dwelling Units: The size and scope of the GB market Page | 11
MDU TYPE HOUSEHOLDS BUILDINGS Super High-Rise 228,114 2,622 Non-super High-Rise 312,586 7,269 TOTAL 540,700 9,891
3.2 Low-Rise Buildings To calculate the number of low-rise buildings as accurately as possible, the data for Scotland in relation to 4-in-a-block and tenements has been dealt with separately. For the remaining GB low-rise stock (referred to as Standard Low-Rise to distinguish from ‘low-rise’ as a category containing standard, 4-in-a-block and tenement), the average number of flats per building was calculated from a field sample of 1,066, which is 0.6% of the total number in GB.14 The average number of flats from this sample was 20. The number of buildings was then calculated using the following equation: Total number of households in standard low-rise buildings Average number of flats per low-rise
(3,332,405) 20 For Scotland, the number of 4-in-a-block buildings can be calculated by dividing the total number of households for that category by 4. 317,911 4 To find the average number of tenement buildings in Scotland further research was required. To better understand the construction of the tenement market in Scotland, the National Trust for Scotland was contacted for guidance.15 Subsequently, three categories of typical tenement were defined. These do not cover absolutely every combination of number of floors and flats but serve as a good general overview for the different tenement types.
TYPE FLATS Small 6 Medium 12 Large 15
According to Scottish household data there are 312,316 households in tenements.16 The classifications of small, medium and large have been divided across this number of households equally, leaving 104,105 households in each type. To calculate the number of buildings, each of these household totals was divided by the number of flats for its specific classification. These were then added together to give a total number of tenement buildings as shown below. Small: 104,105 6 Medium: 104,105 12
14 Siemens and EDF ENERGY data 15The National Trust for Scotland has a specific tenement museum which was able to offer advice on the size of the properties: http://www.nts.org.uk/Property/Tenement-House/ 16 See 2.3 Scottish Households Data
=
Number of standard low-rise buildings
= 166,620 standard low-rise buildings
= 79,478 4-in-a-block buildings
= 17,350 tenement buildings
= 8,675 tenement buildings

© Siemens AG 2014 Multi-Dwelling Units: The size and scope of the GB market Page | 12
Large: 104,105 15 Total tenement buildings = 17,350 + 8,675 + 6,940 = 32,965 The following table shows the totals for all low-rise properties.
MDU TYPE HOUSEHOLDS BUILDINGS Standard Low-Rise 3,332,405 166,620 4-in-a-Block 317,911 79,478 Tenement 312,316 32,965 TOTAL 3,962,632 279,063
3.3 Converted Buildings To ascertain the total number of converted buildings the following equation was used. Total number of households in converted buildings Average number of flats in converted buildings The average number of flats for converted buildings was taken from a field sample of 627 buildings which is 0.3% of the total number of converted properties.17 The average number of flats from this sample was 6. 1,157,619 6
MDU TYPE HOUSEHOLDS BUILDINGS Converted 1,157,619 192,937 TOTAL 1,157,619 192,937
3.4 Great Britain Total Buildings Data The following data is a combination of the above figures for high-rise, low-rise and converted.
MDU TYPE HOUSEHOLDS BUILDINGS High-Rise 540,700 9,891 Low-Rise 3,962,632 279,063 Converted 1,157,619 192,937 TOTAL 5,660,951 481,891
3.5 Unoccupied Buildings Not all dwellings are currently occupied by households due to the existence of holiday homes and second homes therefore there are some properties which fall outside the realms of this survey which may still require a solution. However, due to the limited amount of data on these properties it is not possible to ascertain if they are single dwelling or multi-dwelling units. Although these properties will only account for a small fraction of the overall housing stock it is still worth acknowledging their existence. To illustrate, in Wales there were more dwellings than households recorded during 2011-12.
17 Siemens and EDF ENERGY data
= Total number of converted buildings
= 192,937 converted buildings
= 6,940 tenement buildings

© Siemens AG 2014 Multi-Dwelling Units: The size and scope of the GB market Page | 13
At a local authority level, the difference between the estimated number of dwellings and the number of households in 2011 varied from around 3 per cent more dwellings than households in Flintshire and Wrexham to 16 per cent (8,536 dwellings) more in Gwynedd. The other authorities showing substanstially high numbers of dwellings than households included Pembrokeshire (14 per cent), the Isle of Anglesey (12 per cent) and Conwy and Ceredigion which both had 10 per cent more dwellings than households. These are all rural authorities which generally have a relatively high level of second or holiday homes. In particular the 2011 Census showed that Gwynedd had the highest rate of people with second addresses used for holidays, with 64 people from outside of Gwynedd having such an address for every 1,000 usual residents. 18
18 Statistics for Wales, ´First Release: Dwelling Stock Estimares for Wales 2011-2012’, (Ystadegau Gwladol | National Statistics) p.2

© Siemens AG 2014 Multi-Dwelling Units: The size and scope of the GB market Page | 14
4.1 Introduction to Survey Data To help gain a better understanding of the size and scope of the MDU market in GB, field research was carried out by Siemens, EDF Energy19 and Scottish Power between 2012-13. Inconsistent or incomplete surveys were discounted to ensure as far as possible the quality of the remaining data. As the data was gathered from different sources using different methods, there are certain limitations in the depth of comparison which can be conducted across the board but all reasonable attempts have been made to fully utilize the figures available. 4.2 Locations Covered With the exception of London and Bristol, each of the three different surveys covers a separate area. A cross-check was conducted on the London and Bristol data to ensure that there was no repetition of buildings in the survey.20 The Siemens’ survey focused on the 8 major GB cities of London, Cardiff, Birmingham, Manchester, Nottingham, Plymouth, Bristol and Liverpool. The EDF Energy research was conducted in the South Western Electricity Board (SWEB) and the South Wales Electricity Board (SWALEC) regions. The Scottish Power research took small samples from various locations across the whole of England, Scotland and Wales although the data used is primarily from the Scottish portion of the survey.
Figure 2 EDF Energy and Siemens Survey Regions
19 Whilst EDF Energy has endeavoured to gather accurate information regarding the characteristics of MDU/High-Rise apartment communities in respect to metering arrangements, it cannot be held accountable for any errors or omissions in the data presented. 20 Appendix 1: Postcode Regions in London & Bristol Surveyed by EDF ENERGY and Siemens
EDF ENERGY
Siemens
4. Survey Methods

© Siemens AG 2014 Multi-Dwelling Units: The size and scope of the GB market Page | 15
4.3 Data Sample Sizes and Methods 4.3.1 Siemens Survey The Siemens survey consists of a sample of 1,000 MDU buildings and was conducted by a dedicated research team who visited each of the properties in person. The researcher was accompanied by a data collector who had been working the specific area where the survey was conducted for at least 10 years.21 This survey covered the following areas:
Building Details: Address, MDU Type, Number of Floors, Number of Flats, Flats per Building (if more than one building), Age.22
Metering Details: Dual Fuel, Elec Meter Location, Gas Meter Location, Space at Meter Loca-tion23, Distance Between Meters.
Additional: Interesting Building Features. Comments were also recorded relating to any potential issues or difficulties smart meter roll-
out could potentially face at the location. When possible, photos of the buildings and their meters were taken.
SIEMENS SAMPLE MDU TYPE BUILDINGS Total High-Rise 87 Non-Super High-Rise 50 Super High-Rise 37 Low-Rise 348 Converted 565 TOTAL 1,000
4.3.2 EDF Energy Survey The EDF Energy survey consists of a sample of 989 MDU buildings and was conducted by a range of meter readers. Each was given a survey sheet and asked to complete it when encountering an MDU during their daily duties.24 This survey covered the following areas:
Building Details: Address, MDU Type, Number of Floors, Number of Flats, Maximum Flats per Floor, Number of Lifts, Age (Either pre-1945 or Post-1945).
21 Appendix 2: Siemens MDU Survey Form 22 Age was recorded using the categories of Pre-1919, 1919-1944, 1945-1964, 1965-1980, 1981-1990, Post-1990 as defined in Department for Communities & Local Government, ‘English Housing Survey, Housing Stock Report 2008’, (Office for National Statistics) p.9. These age categories are the standard defined measurements used by the Office for National Statistics in relation to build-ing/household surveys. For information on how age profiling was completed please refer to Appen-dix 3: Age Profiling. 23When conducting the MDU research, Siemens took a sample comms hub which was based on the size specifications given in the ‘CSP ISDS Extract - Communications Hub: Supplementary Require-ments’ document. Under section 4 ‘Physical Requirements’ the document states that ‘[t]he contractor shall supply a Communications Hub with a footprint that does not exceed any of the maximum di-mensions of (a) Height [12]cm; (b) Width [10]cm; and (c) Depth [5]cm.’ These size requirements are no longer used as supplier are now encouraged to make their equipment as small as possible. An image of the mock comms hub can be found in Appendix 4: Siemens’ Mock Comms Hub. Whenever possible a photo of the mock comms hub was taken in situ in a meter room to provide a scale guide illustrating the amount of space available. This helped to inform as to whether space would be an issue in a particular meter location. 24 Appendix 5: EDF ENERGY MDU Survey Form

© Siemens AG 2014 Multi-Dwelling Units: The size and scope of the GB market Page | 16
Metering Details: Dual Fuel, Elec Meter Locations, Gas Meter Locations, Distance Between Meters.25
EDF ENERGY SAMPLE MDU TYPE BUILDINGS Total High-Rise 209 Non-Super High-Rise 144 Super High-Rise 65 Low-Rise 718 Converted 62 TOTAL 989
4.3.3 Scottish Power Survey The Scottish Power MDU data was collected as part of a wider piece of research to identify smart metering roll-out issues. Forms were not used and the data was instead captured electronically by meter readers during their daily duties.26 The details of this survey which have been made available for MDU related analysis cover the follow-ing areas:
Building Details: Address (Country), MDU Type. Metering Details: Dual Fuel, Elec Meter Locations, Gas Meter Locations.27
SCOTTISH POWER SAMPLE MDU TYPE BUILDINGS High-Rise 52 Total Low-Rise 1,285 Standard Low-Rise 373 Tenement 203 4-in-a-Block 709 TOTAL 1,337
4.3.4 Total Survey Data
TOTAL SAMPLE MDU TYPE BUILDINGS High-Rise 348 Low-Rise 2,351 Converted 627 TOTAL 3,326
25 For the meter locations and distance between the meters, pre-defined options were given which could be selected from. These can be seen on a copy of the survey form in Appendix 5: EDF ENERGY MDU Survey Form. 26 Appendix 6: Scottish Power MDU Survey Summary 27 For the meter locations pre-defined options were given which could be selected from. These can be seen on a copy of the survey summary in Appendix 6: Scottish Power MDU Survey Summary.
© Siemens AG 2014 Multi-Dwelling Units: The size and scope of the GB market Page | 17
5.1 Introduction to Data Analysis Methods The MDU survey data was collated and then underwent specific analysis, divided by the separate building categories of high-rise, low-rise and converted. In some cases further subcategories have been analysed individually to enhance the accuracy of the conclusions eg. high-rise has been split into non-super high-rise and super high-rise. For each category of buildings, the following areas have been analysed in depth:
Dual fuel propensity: This compares the number of dual fuel properties to those that are electricity only.
Electricity meter locations: This is split into three location categories (in flat, landings and ground/basement level - typically meter rooms). Whenever possible, further detail of the exact location of the meters labelled as ground/basement level has been given eg. the level of location.
Gas meter locations: This is predominantely split into either inside or outside the flat. When a meter is located outside of the flat there is a further division to identify the exact location of the meter eg. in a meter room or outside of the building. This can be seen in the location matrix.
Space in meter rooms: This data refers only to electricity meter locations and covers the likelihood that there is sufficient space to fit a comms hub at the meter site.
Distance between meters: Distance was considered a potential problem if the electricity and gas meters are in meter rooms at opposite ends of a building, if one meter is in the flat and another located externally a substantial distance away and also if there are multiple floors separating meter locations.
Meter location matrix: This shows the location of meters in relation to each other and is then aligned to the case model which is dicussed later. For a guide to the correlation between the matrix and the case alignment please refer to the appendix.28
Four case model alignment: This is dicussed in section 5.1.1. Four Case Model. There are three sets of sub cases which have been defined and these are discussed in the following section.
Summary of data: This contains the total number of buildings and households of each MDU type which are estimated to need a solution based only on those within cases 2-4, excluding cases 1a and 1b where no issues are expected.
The data for Scotland has, in most cases, been considered separately under each category due to the regional variations found to be apparent in both the types of MDU and also the meter positioning.
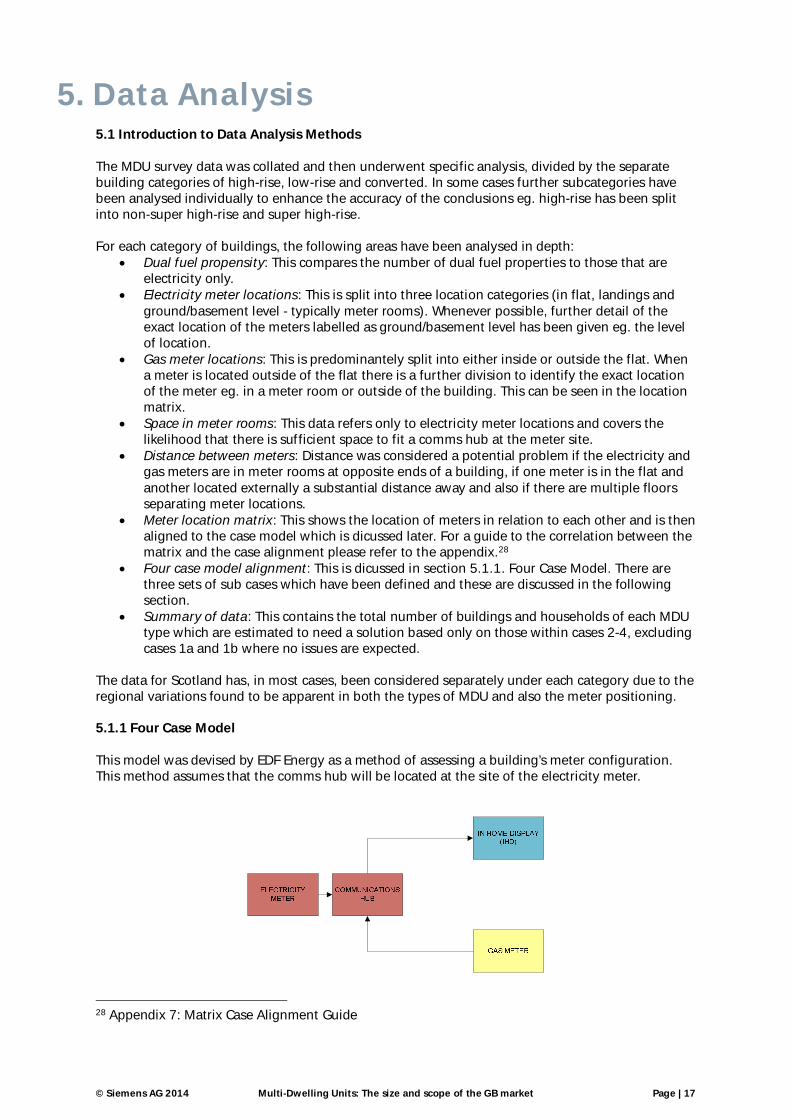
5.1.1 Four Case Model This model was devised by EDF Energy as a method of assessing a building’s meter configuration. This method assumes that the comms hub will be located at the site of the electricity meter.
28 Appendix 7: Matrix Case Alignment Guide
5. Data Analysis

© Siemens AG 2014 Multi-Dwelling Units: The size and scope of the GB market Page | 18
The following diagrams illustrate each of the four combinations. Case 1 should be satisfied by a standard solution whereas cases 2, 3 and 4 are candidates for an MDU specific solution. Dual fuel buildings may be classified as any of the following cases. Electricity only buildings must be either case 1 or case 2.
Case 1a
No expected issues as both the IHD and meters are close to or in the flat
Case 1b
No expected issue, however, meters are on landings which may mean there are exceptions in a few buildings
Case 2
Expected wireless connectivity issues between the IHD and the electrcitiy meter location
Case 3a
Expected wireless connectivity issues between the gas meters and electricity meter location due to hard to reach internal gas meter
Case 3b
Expected wireless connectivity issues between the gas meters and electricity meter location due to hard to reach external gas meter
Case 4a
Expected wireless connectivity issues between the gas meter, electricity meter and IHD due to hard to reach gas meter located close to the IHD
Case 4b
Expected wireless connectivity issues between the gas meter, electricity meter and IHD due to hard to reach gas meter located away from the IHD
CASE 1
CASE 4 CASE 3
CASE 2
IHD IHD
IHD IHD
EM
EM
EM
EM
GM
GM
GM
GM

© Siemens AG 2014 Multi-Dwelling Units: The size and scope of the GB market Page | 19
5.2 High-Rise MDUs Due to the differences between non-super high-rise and super high-rise buildings, this category will be split into two for a majority of the analysis. This will allow the unique features of each to be specifically addressed. High-rise buildings began to emerge in Great Britain after the end of the Second World War. They were seen as a swift resolution to the problems of crumbling 19th century housing and numerous dwellings which had been destroyed during the bombing. Between the 1950s and late 1970s the rate of building increased dramatically, fuelled by the ease of construction that these concrete buildings offered. However, the Brutalist style high-rises began to fall out of favour when they frequently suffered from structural decay and became a breeding ground for social disorder and increased crime rates. In response, many authorities instead began to build large housing estates. Towards the end of the 20th century there has been a resurgent interest in high-rise construction as building methods and standards of living improve significantly. It is important to understand these two phases of build in relation to high-rise as there is a correlation between the period of construction (phase 1: 50s – 70s, phase 2: post-1990) and the meter placements which will be covered later in the age profiling section of this paper. The high-rise buildings recorded in the surveys include both the stereotypical concrete designs commonly associated with the 60s and 70s and also the newer post-1990s builds, ensuring a sample which encompasses the two main construction phases.
The following graph shows the distribution of high-rise buildings in relation to the number of flats per building and is based upon the properties visited in the survey and those analysed as part of the desk research.
Trinity Point Super High-Rise
St. David’s Square Non-Super High-Rise
Amesbury Tower Super High-Rise
1950s
Present
Households 540,700 Buildings 9,891

© Siemens AG 2014 Multi-Dwelling Units: The size and scope of the GB market Page | 20
Figure 3 High-Rise MDUs Number of Flats
The following graphs show the distribution of the two types of high-rise in relation to the number of floors for each category.
Figure 4 Non-Super High-Rise MDUs Number of Floors
0.0%
5.0%
10.0%
15.0%
20.0%
25.0%
30.0%
35.0%
40.0%
2 -2
021
-40
41 -
6061
-80
81 -
100
101
-120
121
-140
141
-160
161
-180
181
-200
201
-220
22
1 -2
4024
1 -2
6026
1 -2
8028
1 -3
0030
1 -3
2032
1 -3
40
341
-360
361
-380
381
-400
401
-420
42
1 -4
4044
0+
Perc
enta
ge
Number of FlatsNon-Super High-Rise
Super High-Rise
0.0%
10.0%
20.0%
30.0%
40.0%
50.0%
60.0%
6 7 8
Perc
enta
ge
Number of FloorsNon-Super High-Rise

© Siemens AG 2014 Multi-Dwelling Units: The size and scope of the GB market Page | 21
5.2.1 Dual Fuel Propensity Before discussing the results of the analysis into the dual fuel propensity of high-rise buildings it is important to consider their history in relation to gas supply. During field research it became apparent that the dual fuel propensity in these buildings was much lower than in other types of MDU. This is largely due to an incident at Ronan Point on the 16th May 1968. A gas explosion in the kitchen of an 18th storey flat caused the entire south-east corner of the 22 storey east London tower block to collapse. This resulted in four deaths and 17 injuries.29 Following the incident there was an increased interest in disproportionate collapse which prompted the ‘Fifth Amendment’ to UK Building Regulations, introduced in 1970. This has remained relatively unchanged for the past 40 years30 and affects multi-dwelling units which are several storeys high and have a gas supply. Immediately after a report into the incident the Government brought out interim measures in relation to the safety and integrity of buildings should an explosion occur.
All new buildings constructed after November 1968 and over 5 storeys were required to be able to resist an explosive force of 3.4x10⁴Pa. Existing buildings were allowed to resist an explosive force of 1.7x10⁴Pa, provided that the gas supply was removed and flats were refitted for electric cooking and heating.31
These changes are now encompassed in the UK Building Regulations Part A – A3 Disproportionate Collapse.32 33 In addition to these requirements, the Institute of Gas Engineers and Managers also introduced the IGEM G/5 standard in response to queries relating to gas installations in high-rise buildings.34 Section 5 of this standard discusses the issues of meter location in these buildings. In order to comply with regulations several restrictions are placed on where meters can and cannot be placed.35 29 http://www.bre.co.uk/page.jsp?id=2855 30V. Janssens and D.W. O’Dwyer, ‘Disproportionate Collapse in Building Structures‘, (Dept. Of Civil, Structural and Environmental Eng, Trinity College Dublin) p1 31 http://en.wikipedia.org/wiki/Ronan_Point 32 HM Government, ‘The Building Regulations 2010, Approved Document A‘, pp 39-43 33 Appendix 8: Building Regulations – Disproportionate Collapse 34 http://www.installeronline.co.uk/wp-content/uploads/2013/01/High-rise-advice.pdf 35 Appendix 9: IGEM G/5 Section 5 Gas meter location restrictions
0.0%
2.0%
4.0%
6.0%
8.0%
10.0%
12.0%
14.0%
16.0%
18.0%
9 10 11 12 13 14 15 16 17 18 19 20 21 22 23 24 25 26 27 28 29 30 31 32 33 34 35 36 37 38 39 40 40+
Perc
enta
ge
Number of Floors
Super High-Rise
Figure 5 Super High-Rise MDUs Number of Floors

© Siemens AG 2014 Multi-Dwelling Units: The size and scope of the GB market Page | 22
Given the large amount of restrictions in place, it is unsurprising that gas is far less common in high-rise than other types of MDU. When present it is much more prevalent in the non-super high-rise than super high-rise buildings, as shown in the analysis below. The heavily regulated industry also means that when gas is present, there is much less variation found in the combinations of meter placements compared to other types of MDUs. The tables below illustrate the number of buildings in the sample which were dual fuel as opposed to electricity only.
DUAL FUEL PROPENSITY (EDF ENERGY & SIEMENS)
MDU TYPE DUAL FUEL ELEC ONLY
BUILDINGS % OF SAMPLE BUILDINGS % OF SAMPLE Non-Super High-Rise
95 60.1% 63 39.9%
TOTAL 158
DUAL FUEL PROPENSITY (EDF ENERGY & SIEMENS)
MDU TYPE DUAL FUEL ELEC ONLY
BUILDINGS % OF SAMPLE BUILDINGS % OF SAMPLE Super High-Rise 48 49.5% 49 50.5% TOTAL 97 The data from Scottish Power has been used to provide a separate account of those high-rise buildings in Scotland. The results from their survey are shown below.
DUAL FUEL PROPENSITY (SCOTTISH POWER)
MDU TYPE DUAL FUEL ELEC ONLY
BUILDINGS % OF SAMPLE BUILDINGS % OF SAMPLE High-Rise 2 3.8% 50 96.2% These figures have been extrapolated to cover the entire high-rise portfolio in GB and provide an estimate of the number of buildings and the number of households in each category.36
DUAL FUEL PROPENSITY
BUILDINGS DUAL FUEL ELEC ONLY
High-Rise 4,310 5,581 % 43.6% 56.4%
DUAL FUEL PROPENSITY
HOUSEHOLDS DUAL FUEL ELEC ONLY
High-Rise 242,965 297,735 % 44.9% 55.1%
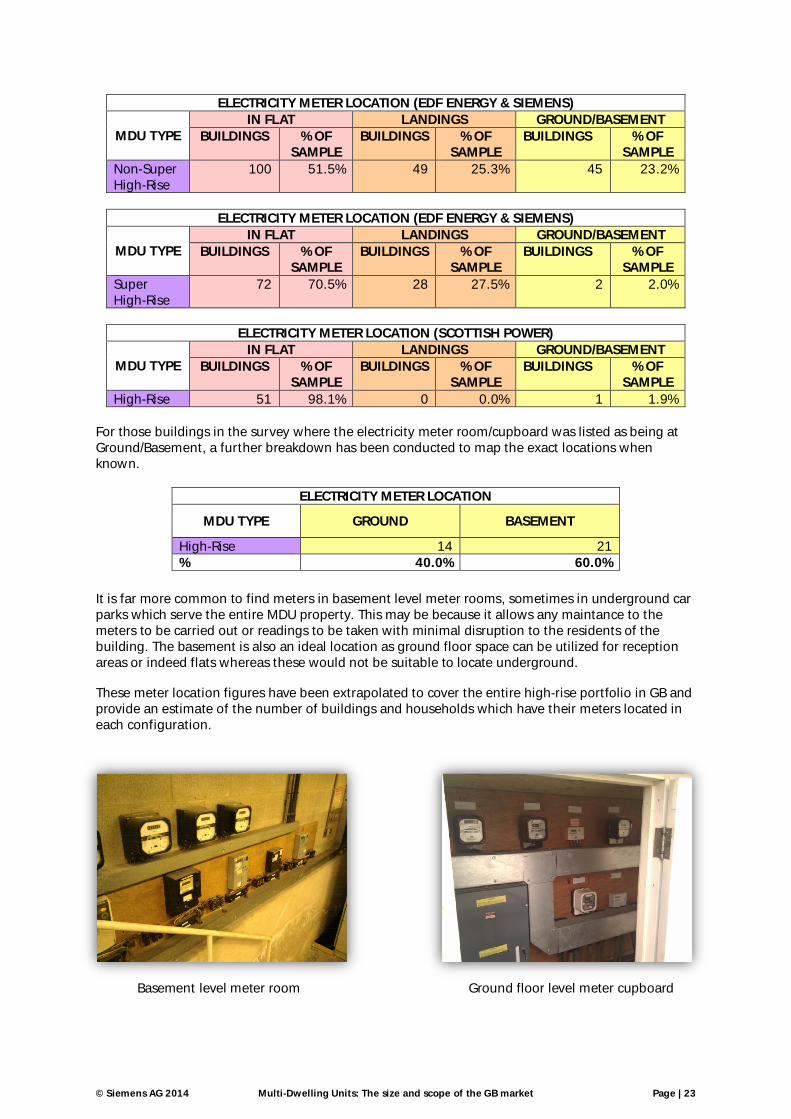
5.2.2 Electricity Meters The following tables show the locations of the electricity meters in the high-rise buildings sampled in the survey.
36 The figures from Scottish Power have been applied to the high-rise portfolio of Scotland only
© Siemens AG 2014 Multi-Dwelling Units: The size and scope of the GB market Page | 23
ELECTRICITY METER LOCATION (EDF ENERGY & SIEMENS)
MDU TYPE IN FLAT LANDINGS GROUND/BASEMENT
BUILDINGS % OF SAMPLE
BUILDINGS % OF SAMPLE
BUILDINGS % OF SAMPLE
Non-Super High-Rise
100 51.5% 49 25.3% 45 23.2%
ELECTRICITY METER LOCATION (EDF ENERGY & SIEMENS)
MDU TYPE IN FLAT LANDINGS GROUND/BASEMENT
BUILDINGS % OF SAMPLE
BUILDINGS % OF SAMPLE
BUILDINGS % OF SAMPLE
Super High-Rise
72 70.5% 28 27.5% 2 2.0%
ELECTRICITY METER LOCATION (SCOTTISH POWER)
MDU TYPE IN FLAT LANDINGS GROUND/BASEMENT
BUILDINGS % OF SAMPLE
BUILDINGS % OF SAMPLE
BUILDINGS % OF SAMPLE
High-Rise 51 98.1% 0 0.0% 1 1.9% For those buildings in the survey where the electricity meter room/cupboard was listed as being at Ground/Basement, a further breakdown has been conducted to map the exact locations when known.
ELECTRICITY METER LOCATION
MDU TYPE GROUND BASEMENT
High-Rise 14 21 % 40.0% 60.0%
It is far more common to find meters in basement level meter rooms, sometimes in underground car parks which serve the entire MDU property. This may be because it allows any maintance to the meters to be carried out or readings to be taken with minimal disruption to the residents of the building. The basement is also an ideal location as ground floor space can be utilized for reception areas or indeed flats whereas these would not be suitable to locate underground. These meter location figures have been extrapolated to cover the entire high-rise portfolio in GB and provide an estimate of the number of buildings and households which have their meters located in each configuration.
Ground floor level meter cupboard
Basement level meter room

© Siemens AG 2014 Multi-Dwelling Units: The size and scope of the GB market Page | 24
ELECTRICITY METER LOCATION
BUILDINGS IN FLAT LANDINGS GROUND/BASEMENT
High-Rise 7,056 2,183 652 % 71.3% 22.1% 6.6%
ELECTRICITY METER LOCATION
HOUSEHOLDS IN FLAT LANDINGS GROUND/BASEMENT
High-Rise 372,539 117,797 50,364 % 68.9% 21.8% 9.3%
5.2.3. Gas Meters As previously highlighted, there is significantly less gas supply in high-rise buildings than other types of multi-dwelling units. In addition to this, the strict regulations around the installation of a gas supply into a high-rise property mean the number of potential meter location configurations is limited.37 The following tables illustrate the locations of the gas meters in the high-rise buildings which were sampled and found to be dual fuel in nature.
GAS METER LOCATION (EDF ENERGY & SIEMENS)
MDU TYPE IN FLAT INSIDE BUILDING OUTSIDE BUILDING
BUILDINGS % OF SAMPLE
BUILDINGS % OF SAMPLE
BUILDINGS % OF SAMPLE
Non-Super High-Rise
70 73.7% 12 12.6% 13 13.7%
GAS METER LOCATION (EDF ENERGY & SIEMENS)
MDU TYPE IN FLAT INSIDE BUILDING OUTSIDE BUILDING
BUILDINGS % OF SAMPLE
BUILDINGS % OF SAMPLE
BUILDINGS % OF SAMPLE
Super High-Rise
41 87.2% 1 2.1% 5 10.7%
GAS METER LOCATION (SCOTTISH POWER)
MDU TYPE IN FLAT INSIDE BUILDING OUTSIDE BUILDING
BUILDINGS % OF SAMPLE
BUILDINGS % OF SAMPLE
BUILDINGS % OF SAMPLE
High-Rise 0 0.0% 1 50.0% 1 50.0% These meter location figures have been extrapolated to cover the entire high-rise portfolio in GB which is estimated to be dual-fuel in nature. This provides an estimate of the number of buildings and households which have their meters located in each place.
GAS METER LOCATION
BUILDINGS IN FLAT INSIDE
BUILDING OUTSIDE BUILDING
High-Rise 3,525 259 527 % 81.8% 6.0% 12.2%
37 Appendix 9: IGEM G/5 Section 5 Gas Meter Location Restrictions

© Siemens AG 2014 Multi-Dwelling Units: The size and scope of the GB market Page | 25
GAS METER LOCATION
HOUSEHOLDS IN FLAT INSIDE
BUILDING OUTSIDE BUILDING
High-Rise 193,465 18,677 30,824 % 79.6% 7.7% 12.7%
5.2.4 Space in Meter Rooms This table shows the results of an assement to establish if there was sufficient space in existing meter rooms/cupboards in high-rise buildings to install additional equipment. This refers only to the location of the electricity meters as this is where the comms hub will most likely be situated. These figures have not been extrapolated due to the small sample size and serve for illustrative purposes only.
SPACE IN METER ROOM (SIEMENS) MDU TYPE YES NO
High-Rise 40.7% 59.3% 5.2.5 Meter Location Matrix For those buildings visited as part of the survey where complete details are known on both the location of the gas and electricity meter, the following matrix has been populated. This does not include properties where the status of the gas meter was declared as ‘unknown’ as they cannot be marked as dual fuel or electricity only.38
HIGH-RISE
GAS METER LOCATION IN
FLAT INSIDE OUTSIDE
ELEC ONLY
In fl
at o
r by
its fr
ont
door
Inta
ke ro
om e
very
la
ndin
g
Met
erin
g ro
om o
r cu
pboa
rd
Met
erin
g ro
om o
r cu
pboa
rd o
utsi
de
build
ing
Out
side
bui
ldin
g eg
. se
mi c
once
aled
m
eter
box
ELEC
TRIC
ITY
MET
ER
LOC
ATIO
N
IN FLAT In flat or by its front door
29.5% 0.6% 0.3% 5.8% 31.8% 68.2%
LANDINGS
Intake room every landing
3.2% 0.6% 0.6% 0.3% 12.7% 17.5% Intake room few landings
0.3% 0.3%
GROUND FLOOR OR BASEMENT
LEVEL
Metering room or cupboard
2.9% 0.6% 1.6% 8.4% 13.6%
Metering room or cupboard outside building
0.0%
Outside building 0.3% 0.3% 36.0% 1.9% 2.6% 0.0% 6.2% 53.2% 100.0%
5.2.6 Four Case Model for High-Rise This sample of high-rise data has been aligned to the four case model devised by EDF Energy. The following table shows the number of buildings from the sample which fall into each of these cases. 38 For a breakdown of non-super high-rise, super high-rise and Scottish data please refer to Appendix 10: High-Rise Meter Location Matrix by Type

© Siemens AG 2014 Multi-Dwelling Units: The size and scope of the GB market Page | 26
SAMPLE – HIGH-RISE CASE MODEL CASE 1a 1b 2 3a 3b 4a 4b BUILDINGS 189 53 32 3 19 12 0 % 61.4% 17.2% 10.4% 0.9% 6.2% 3.9% 0.0% TOTAL 242 32 22 12 % 78.6% 10.4% 7.1% 3.9% The figures for each of the cases have been extrapolated to give an estimation of the number of high-rise buildings and households in the GB multi-dwelling unit market which fit into each case.
GB BUILDINGS – HIGH-RISE CASE MODEL CASE 1a 1b 2 3a 3b 4a 4b BUILDINGS 5,954 1,589 1,177 109 630 432 0 % 60.2% 16.1% 11.9% 1.0% 6.4% 4.4% 0.0% TOTAL 7,543 1,177 739 432 % 76.3% 11.9% 7.4% 4.4%
GB HOUSEHOLDS – HIGH-RISE CASE MODEL CASE 1a 1b 2 3a 3b 4a 4b HOUSEHOLDS 338,111 93,901 51,606 5,077 32,437 19,568 0 % 62.5% 17.4% 9.5% 1.0% 6.0% 3.6% 0.0% TOTAL 432,012 51,606 37,514 19,568 % 79.9% 9.5% 7.0% 3.6% 5.2.7 Summary of High-Rise Data 5.3 Low-Rise MDUs Due to the differences between tenements, 4-in-a-Block and standard low-rise, this category will be split into three to take into account the individual features of each. The buildings in this category vary greatly in size from the smaller properties which are similar in size to a converted house to the larger, multiple storey buildings which are reminiscent of a high-rise block turned on its side. Low-rise buildings are not subject to the same level of regulation as high-rise in terms of gas supply and as a result have a much higher rate of dual fuel propensity. There is also an increased variation in meter locations compared to both converted and high-rise MDUs.
Clyde Road 4 Flats
Loughborough Estate 68 Flats
Buildings requiring a solution 2,348
Households requiring a solution 108,688
Households 3,962,632 Buildings 279,063

© Siemens AG 2014 Multi-Dwelling Units: The size and scope of the GB market Page | 27
The following graph shows the distribution of standard low-rise buildings (excluding tenements and 4-in-a-Block) across a range of number of flats and is based upon the buildings visited in the survey.
Figure 6 Standard Low-Rise MDUs Number of Flats
The graph below shows the distribution of standard low-rise buildings (excluding tenements and 4-in-a-Block) in relation to the number of floors and is based on those buildings visited in the survey.
Figure 7 Standard Low-Rise MDUs Number of Floors
0.0%
5.0%
10.0%
15.0%
20.0%
25.0%
30.0%
35.0%
40.0%
2 -1
0
11 -
20
21 -
30
31 -
40
41 -
50
51 -
60
61 -
70
71 -
80
81 -
90
91 -
100
101
-110
111
-120
121
-130
131
-140
141
-150
Perc
enta
ge
Number of FlatsLow Rise
0.0%5.0%
10.0%15.0%20.0%25.0%30.0%35.0%40.0%45.0%
2 3 4 5
Perc
enta
ge
Number of Floors

© Siemens AG 2014 Multi-Dwelling Units: The size and scope of the GB market Page | 28
5.3.1 Dual Fuel Propensity The tables below show the number of buildings in the sample which were dual fuel as opposed to electricity only. The dual fuel propensity is exceptionally high for tenements and 4-in-a-Block when compared to other types of MDU.
DUAL FUEL PROPENSITY (EDF ENERGY, SIEMENS & SCOTTISH POWER)
MDU TYPE DUAL FUEL ELEC ONLY
BUILDINGS % OF SAMPLE BUILDINGS % OF SAMPLE Standard Low-Rise 932 68.7% 424 31.3%
DUAL FUEL PROPENSITY (SCOTTISH POWER)
MDU TYPE DUAL FUEL ELEC ONLY
BUILDINGS % OF SAMPLE BUILDINGS % OF SAMPLE Tenement 178 87.7% 25 12.3%
DUAL FUEL PROPENSITY (SCOTTISH POWER)
MDU TYPE DUAL FUEL ELEC ONLY
BUILDINGS % OF SAMPLE BUILDINGS % OF SAMPLE 4-in-a-Block 657 92.7% 52 7.3% These figures have been extrapolated to cover the entire low-rise portfolio in GB and provide an estimate of the number of buildings and households which are dual fuel and electricity only.
DUAL FUEL PROPENSITY
MDU TYPE DUAL FUEL ELEC ONLY
BUILDINGS HOUSEHOLDS BUILDINGS HOUSEHOLDS Standard Low-Rise 114,468 2,289,362 52,152 1,043,043 Tenement 28,910 273,901 4,055 38,415 4-in-a-Block 73,676 294,703 5,802 23,208 When combined, the totals for the entire GB low-rise segement are as follows:
DUAL FUEL PROPENSITY
BUILDINGS DUAL FUEL ELEC ONLY
Low-Rise 217,054 62,009 % 77.8% 22.2%
DUAL FUEL PROPENSITY
HOUSEHOLDS DUAL FUEL ELEC ONLY
Low-Rise 2,857,967 1,104,665 % 72.1% 27.9%
5.3.2 Electricity meters The tables below show the locations of the electricity meters in the low-rise buildings sampled in the survey. The most common location found was in or near to the flats.
ELECTRICITY METER LOCATION (EDF ENERGY, SIEMENS & SCOTTISH POWER)
MDU TYPE IN FLAT LANDINGS GROUND/BASEMENT
BUILDINGS % OF SAMPLE
BUILDINGS % OF SAMPLE
BUILDINGS % OF SAMPLE
Standard Low-Rise
758 71.3% 96 9.0% 210 19.7%

© Siemens AG 2014 Multi-Dwelling Units: The size and scope of the GB market Page | 29
ELECTRICITY METER LOCATION (SCOTTISH POWER)
MDU TYPE IN FLAT LANDINGS GROUND/BASEMENT
BUILDINGS % OF SAMPLE
BUILDINGS % OF SAMPLE
BUILDINGS % OF SAMPLE
Tenement 199 98.0% 1 0.5% 3 1.5%
ELECTRICITY METER LOCATION (SCOTTISH POWER)
MDU TYPE IN FLAT LANDINGS GROUND/BASEMENT
BUILDINGS % OF SAMPLE
BUILDINGS % OF SAMPLE
BUILDINGS % OF SAMPLE
4-in-a-Block 674 95.1% 0 0.0% 35 4.9% For those buildings where the electricity meter was located in meter rooms/cupboards at the ground floor or basement level the following table shows the split between these locations, when specified.
ELECTRICITY METER LOCATION
MDU TYPE GROUND FLOOR BASEMENT
BUILDINGS % OF SAMPLE
BUILDINGS % OF SAMPLE
Standard Low-Rise 56 57.7% 41 42.3%
ELECTRICITY METER LOCATION
MDU TYPE GROUND FLOOR BASEMENT
BUILDINGS % OF SAMPLE
BUILDINGS % OF SAMPLE
Tenement 3 100% 0 0% The initial meter location figures have been extrapolated to cover the entire low-rise portfolio in GB and provide an estimate of the number of buildings and households which have their meters located in each place.
ELECTRICITY METER LOCATION
MDU TYPE IN FLAT LANDINGS GROUND/BASEMENT
BUILDINGS HOUSEHOLDS BUILDINGS HOUSEHOLDS BUILDINGS HOUSEHOLDS Standard Low-Rise 118,800 2,376,005 14,996 299,916 32,824 656,484 Tenement 32,306 306,070 165 1,562 494 4,685 4-in-a-Block 75,584 302,333 0 0 3,894 15,578
When combined, the totals for the entire GB low-rise segement are as follows:
ELECTRICITY METER LOCATION
BUILDINGS IN FLAT LANDINGS GROUND/BASEMENT
Low-Rise 226,689 15,161 37,213 % 81.2% 5.4% 13.3%
ELECTRICITY METER LOCATION
HOUSEHOLDS IN FLAT LANDINGS GROUND/BASEMENT
Low-Rise 2,984,408 301,478 676,746 % 75.3% 7.6% 17.1%
© Siemens AG 2014 Multi-Dwelling Units: The size and scope of the GB market Page | 30
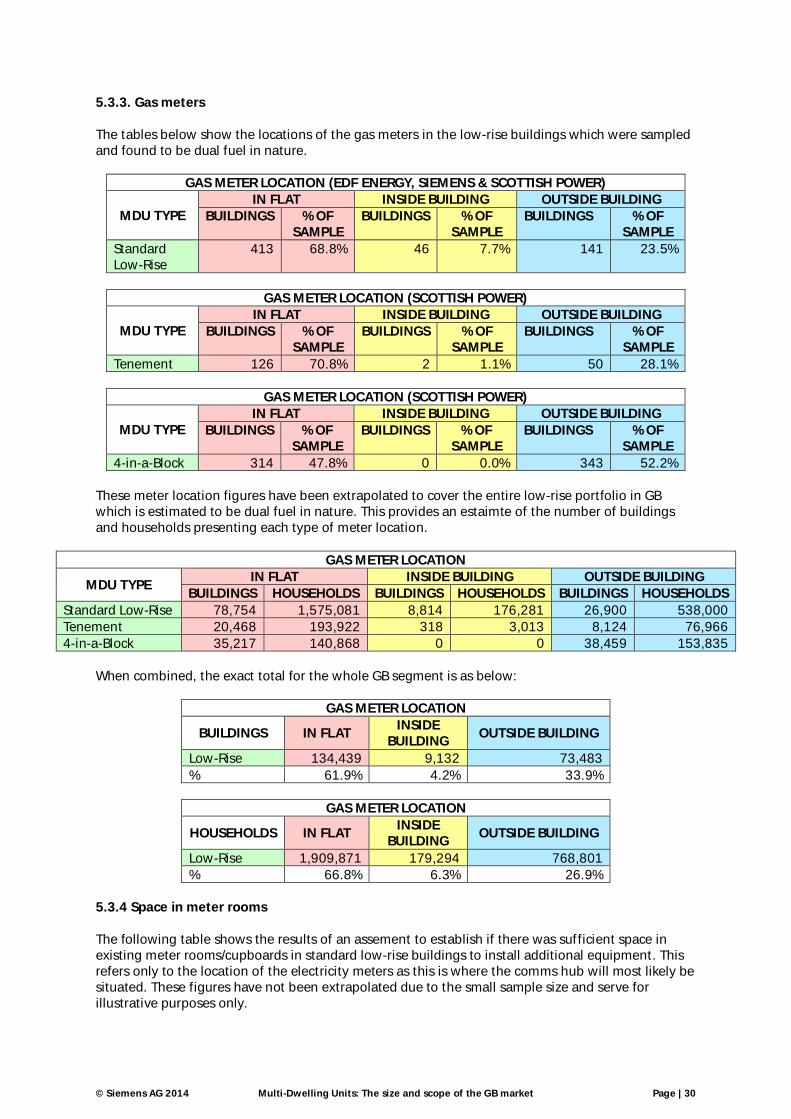
5.3.3. Gas meters The tables below show the locations of the gas meters in the low-rise buildings which were sampled and found to be dual fuel in nature.
GAS METER LOCATION (EDF ENERGY, SIEMENS & SCOTTISH POWER)
MDU TYPE IN FLAT INSIDE BUILDING OUTSIDE BUILDING
BUILDINGS % OF SAMPLE
BUILDINGS % OF SAMPLE
BUILDINGS % OF SAMPLE
Standard Low-Rise
413 68.8% 46 7.7% 141 23.5%
GAS METER LOCATION (SCOTTISH POWER)
MDU TYPE IN FLAT INSIDE BUILDING OUTSIDE BUILDING
BUILDINGS % OF SAMPLE
BUILDINGS % OF SAMPLE
BUILDINGS % OF SAMPLE
Tenement 126 70.8% 2 1.1% 50 28.1%
GAS METER LOCATION (SCOTTISH POWER)
MDU TYPE IN FLAT INSIDE BUILDING OUTSIDE BUILDING
BUILDINGS % OF SAMPLE
BUILDINGS % OF SAMPLE
BUILDINGS % OF SAMPLE
4-in-a-Block 314 47.8% 0 0.0% 343 52.2% These meter location figures have been extrapolated to cover the entire low-rise portfolio in GB which is estimated to be dual fuel in nature. This provides an estaimte of the number of buildings and households presenting each type of meter location.
GAS METER LOCATION
MDU TYPE IN FLAT INSIDE BUILDING OUTSIDE BUILDING
BUILDINGS HOUSEHOLDS BUILDINGS HOUSEHOLDS BUILDINGS HOUSEHOLDS Standard Low-Rise 78,754 1,575,081 8,814 176,281 26,900 538,000 Tenement 20,468 193,922 318 3,013 8,124 76,966 4-in-a-Block 35,217 140,868 0 0 38,459 153,835
When combined, the exact total for the whole GB segment is as below:
GAS METER LOCATION
BUILDINGS IN FLAT INSIDE
BUILDING OUTSIDE BUILDING
Low-Rise 134,439 9,132 73,483 % 61.9% 4.2% 33.9%
GAS METER LOCATION
HOUSEHOLDS IN FLAT INSIDE
BUILDING OUTSIDE BUILDING
Low-Rise 1,909,871 179,294 768,801 % 66.8% 6.3% 26.9%
5.3.4 Space in meter rooms The following table shows the results of an assement to establish if there was sufficient space in existing meter rooms/cupboards in standard low-rise buildings to install additional equipment. This refers only to the location of the electricity meters as this is where the comms hub will most likely be situated. These figures have not been extrapolated due to the small sample size and serve for illustrative purposes only.

© Siemens AG 2014 Multi-Dwelling Units: The size and scope of the GB market Page | 31
SPACE IN METER ROOM (SIEMENS) MDU TYPE YES NO
Standard Low-Rise 66.7% 33.3%
5.3.5 Meter Location Matrix The matrix below represents only the findings from standard low-rise buildings and not tenements or 4-in-a-Block. It has been populated using data from buildings visited in the survey when both the gas and electricity meter positions had been identified. This does not include properties where the status of the gas meter was declared as ‘unknown’ as they cannot be marked as dual fuel or electricity only.
STANDARD LOW-RISE
GAS METER LOCATION IN
FLAT INSIDE OUTSIDE
ELEC ONLY
In fl
at o
r by
its fr
ont
door
Inta
ke ro
om e
very
la
ndin
g
Met
erin
g ro
om o
r cu
pboa
rd
Met
erin
g ro
om o
r cu
pboa
rd o
utsi
de
build
ing
Out
side
bui
ldin
g eg
. se
mi c
once
aled
m
eter
box
ELEC
TRIC
ITY
MET
ER
LOC
ATIO
N
IN FLAT In flat or by its front door
39.1% 0.3% 0.3% 4.6% 28.5% 72.9%
LANDINGS
Intake room every landing
1.5% 0.3% 0.7% 0.2% 2.3% 2.4% 7.4% Intake room few landings
0.1% 0.3% 0.1% 0.5%
GROUND FLOOR OR BASEMENT
LEVEL
Metering room or cupboard
1.9% 0.1% 2.7% 5.5% 7.4% 17.5%
Metering room or cupboard outside building
0.3% 0.4% 0.1% 0.8%
Outside building 0.7% 0.1% 0.8%
42.5% 0.7% 3.8% 0.5% 13.8% 38.6% 100.0%
External meter cupboard with limited space
External meter room with ample space

© Siemens AG 2014 Multi-Dwelling Units: The size and scope of the GB market Page | 32
5.2.6 Four Case Model for Low-Rise The total sample of all low-rise data has been aligned to the four case model devised by EDF Energy. The tables below show the number of buildings in each case by type of property.39
SAMPLE – STANDARD LOW-RISE CASE MODEL CASE 1a 1b 2 3a 3b 4a 4b BUILDINGS 655 44 111 11 72 19 57 % 67.6% 4.5% 11.5% 1.1% 7.4% 2.0% 5.9% TOTAL 699 111 83 76 % 72.1% 11.5% 8.5% 7.9%
SAMPLE – TENEMENT LOW-RISE CASE MODEL CASE 1a 1b 2 3a 3b 4a 4b BUILDINGS 151 0 4 1 47 0 0 % 74.4% 0.0% 2.0% 0.5% 23.1% 0.0% 0.0% TOTAL 151 4 48 0 % 74.4% 2.0% 23.6% 0.0%
SAMPLE – 4-IN-A-BLOCK LOW-RISE CASE MODEL CASE 1a 1b 2 3a 3b 4a 4b BUILDINGS 342 0 24 0 343 0 0 % 48.3% 0.0% 3.3% 0.0% 48.4% 0.0% 0.0% TOTAL 342 24 343 0 % 48.3% 3.3% 48.4% 0.0% The figures for each of the cases have been extrapolated to give an estimation of the number of buildings and households which fit into each case in the GB multi-dwelling unit market.
GB BUILDINGS – STANDARD LOW-RISE CASE MODEL CASE 1a 1b 2 3a 3b 4a 4b BUILDINGS 112,628 7,566 19,087 1,891 12,380 3,267 9,801 % 67.6% 4.5% 11.5% 1.1% 7.4% 2.0% 5.9% TOTAL 120,193 19,087 14,272 13,068 % 72.1% 11.5% 8.5% 7.9%
GB HOUSEHOLDS – STANDARD LOW-RISE CASE MODEL CASE 1a 1b 2 3a 3b 4a 4b HOUSEHOLDS 2,252,554 151,317 381,731 37,829 247,609 65,341 196,024 % 67.6% 4.5% 11.5% 1.1% 7.4% 2.0% 5.9% TOTAL 2,403,871 381,731 285,438 261,365 % 72.1% 11.5% 8.5% 7.9%
GB BUILDINGS – TENEMENT LOW-RISE CASE MODEL CASE 1a 1b 2 3a 3b 4a 4b BUILDINGS 24,526 0 659 165 7,615 0 0 % 74.4% 0.0% 2.0% 0.5% 23.1% 0.0% 0.0% TOTAL 24,526 659 7,780 0 % 74.4% 2.0% 23.6% 0.0%
39 As the data for Scottish Power did not show the meter placements in relation to one another, conservative estimates have been made from the data available, assuming that as many meter con-figurations as possible will be satisfied by a standard solution.
© Siemens AG 2014 Multi-Dwelling Units: The size and scope of the GB market Page | 33
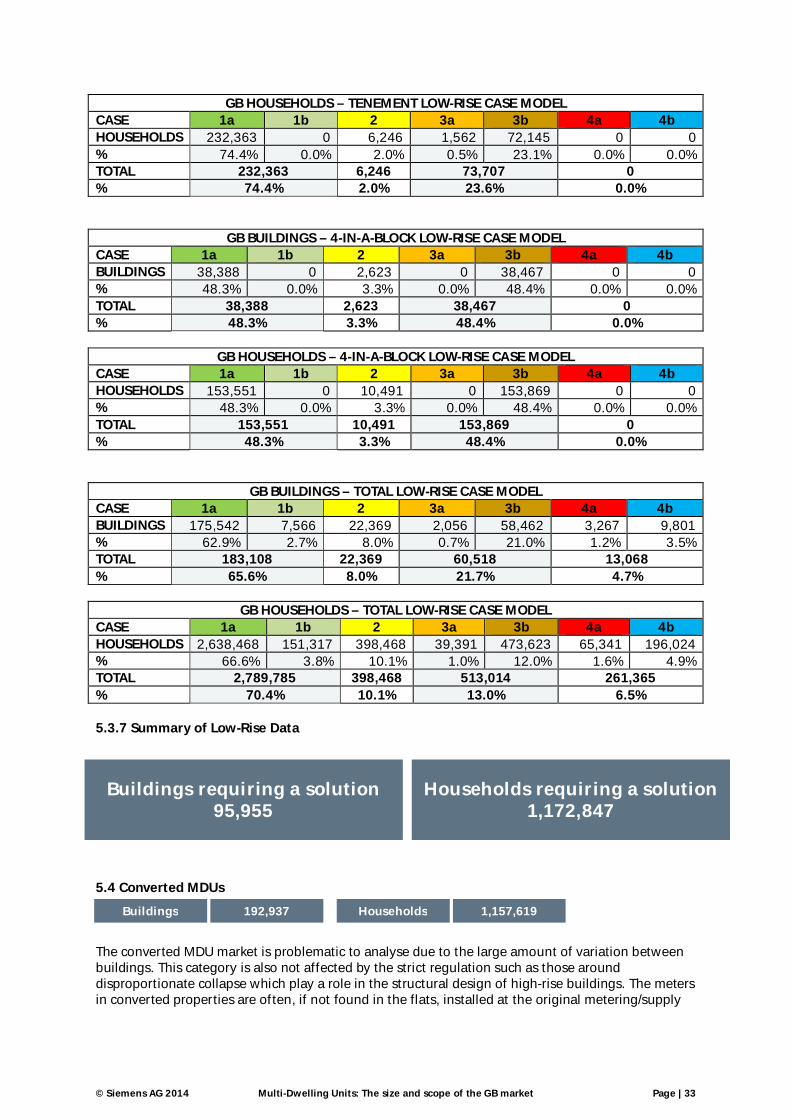
GB HOUSEHOLDS – TENEMENT LOW-RISE CASE MODEL CASE 1a 1b 2 3a 3b 4a 4b HOUSEHOLDS 232,363 0 6,246 1,562 72,145 0 0 % 74.4% 0.0% 2.0% 0.5% 23.1% 0.0% 0.0% TOTAL 232,363 6,246 73,707 0 % 74.4% 2.0% 23.6% 0.0%
GB BUILDINGS – 4-IN-A-BLOCK LOW-RISE CASE MODEL CASE 1a 1b 2 3a 3b 4a 4b BUILDINGS 38,388 0 2,623 0 38,467 0 0 % 48.3% 0.0% 3.3% 0.0% 48.4% 0.0% 0.0% TOTAL 38,388 2,623 38,467 0 % 48.3% 3.3% 48.4% 0.0%
GB HOUSEHOLDS – 4-IN-A-BLOCK LOW-RISE CASE MODEL CASE 1a 1b 2 3a 3b 4a 4b HOUSEHOLDS 153,551 0 10,491 0 153,869 0 0 % 48.3% 0.0% 3.3% 0.0% 48.4% 0.0% 0.0% TOTAL 153,551 10,491 153,869 0 % 48.3% 3.3% 48.4% 0.0%
GB BUILDINGS – TOTAL LOW-RISE CASE MODEL CASE 1a 1b 2 3a 3b 4a 4b BUILDINGS 175,542 7,566 22,369 2,056 58,462 3,267 9,801 % 62.9% 2.7% 8.0% 0.7% 21.0% 1.2% 3.5% TOTAL 183,108 22,369 60,518 13,068 % 65.6% 8.0% 21.7% 4.7%
GB HOUSEHOLDS – TOTAL LOW-RISE CASE MODEL CASE 1a 1b 2 3a 3b 4a 4b HOUSEHOLDS 2,638,468 151,317 398,468 39,391 473,623 65,341 196,024 % 66.6% 3.8% 10.1% 1.0% 12.0% 1.6% 4.9% TOTAL 2,789,785 398,468 513,014 261,365 % 70.4% 10.1% 13.0% 6.5% 5.3.7 Summary of Low-Rise Data 5.4 Converted MDUs The converted MDU market is problematic to analyse due to the large amount of variation between buildings. This category is also not affected by the strict regulation such as those around disproportionate collapse which play a role in the structural design of high-rise buildings. The meters in converted properties are often, if not found in the flats, installed at the original metering/supply
Buildings requiring a solution 95,955
Households requiring a solution 1,172,847
Households 1,157,619 Buildings 192,937
© Siemens AG 2014 Multi-Dwelling Units: The size and scope of the GB market Page | 34
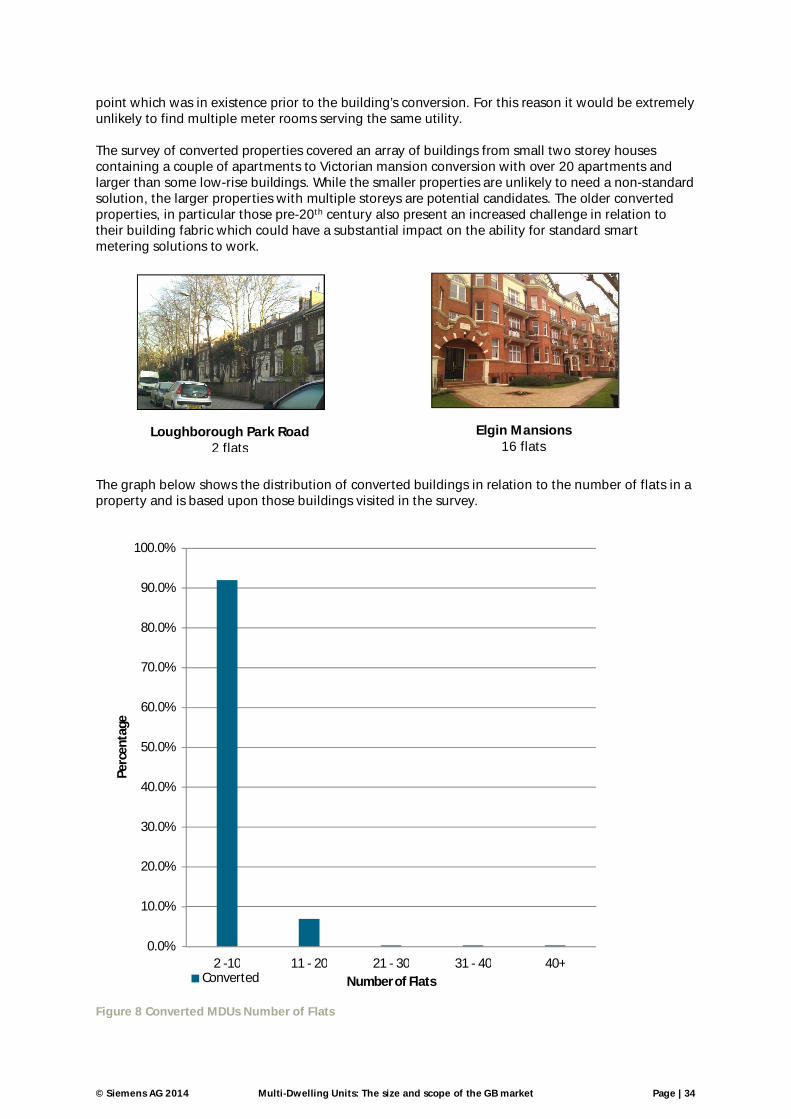
point which was in existence prior to the building’s conversion. For this reason it would be extremely unlikely to find multiple meter rooms serving the same utility. The survey of converted properties covered an array of buildings from small two storey houses containing a couple of apartments to Victorian mansion conversion with over 20 apartments and larger than some low-rise buildings. While the smaller properties are unlikely to need a non-standard solution, the larger properties with multiple storeys are potential candidates. The older converted properties, in particular those pre-20th century also present an increased challenge in relation to their building fabric which could have a substantial impact on the ability for standard smart metering solutions to work. The graph below shows the distribution of converted buildings in relation to the number of flats in a property and is based upon those buildings visited in the survey.
Figure 8 Converted MDUs Number of Flats
0.0%
10.0%
20.0%
30.0%
40.0%
50.0%
60.0%
70.0%
80.0%
90.0%
100.0%
2 -10 11 - 20 21 - 30 31 - 40 40+
Perc
enta
ge
Number of FlatsConverted
Elgin Mansions 16 flats
Loughborough Park Road 2 flats

© Siemens AG 2014 Multi-Dwelling Units: The size and scope of the GB market Page | 35
The following graph shows the distribution of converted buildings in relation to the number of floors per property and is based upon the building visited as part of the survey.
Figure 9 Converted MDUs Number of Floors
5.4.1 Dual Fuel Propensity The table below shows the number of converted buildings in the sample which were dual fuel as opposed to electricity only. The dual fuel propensity is higher for this category of MDU than any other, possibly a product of the initial construction age of the buildings.
DUAL FUEL PROPENSITY (EDF ENERGY & SIEMENS)
MDU TYPE DUAL FUEL ELEC ONLY
BUILDINGS % OF SAMPLE BUILDINGS % OF SAMPLE Converted 533 86.7% 82 13.3% The figures from the survey above have been extrapolated to give an estimate of the number of buildings and households across the entire GB converted portfolio in each category.
DUAL FUEL PROPENSITY
MDU TYPE DUAL FUEL ELEC ONLY
BUILDINGS HOUSEHOLDS BUILDINGS HOUSEHOLDS Converted 167,276 1,003,656 25,661 153,963 5.4.2 Electricity Meters A majority of the meter locations in converted buildings are outside of the flat, at a single point either at ground floor level or basement level. This is usually in a utility cupboard/room at the original metering point which existed prior to the building’s conversion into multiple dwellings.
0.00%
5.00%
10.00%
15.00%
20.00%
25.00%
30.00%
35.00%
40.00%
45.00%
50.00%
1 2 3 4 5 6
Perc
enta
ge
Number of Floors

© Siemens AG 2014 Multi-Dwelling Units: The size and scope of the GB market Page | 36
The table below shows the locations of the electricity meters in the converted properties which were visited during the survey.
ELECTRICITY METER LOCATION (EDF ENERGY & SIEMENS)
MDU TYPE IN FLAT LANDINGS GROUND/BASEMENT
BUILDINGS % OF SAMPLE
BUILDINGS % OF SAMPLE
BUILDINGS % OF SAMPLE
Converted 76 12.2% 4 0.6% 545 87.2% For those buildings where the electricity meters were neither in the flat nor on various landings the following table shows the differentiation between the ground floor level and basement level placements.
METER ROOM LOCATION (EDF ENERGY & SIEMENS)
MDU TYPE GROUND BASEMENT
BUILDINGS % OF SAMPLE
BUILDINGS % OF SAMPLE
Converted 319 63.4% 184 36.6% The initial meter location figures have been extrapolated to cover the entire converted portfolio in GB and provide an estimate of the number of buildings and households which have their meters located in each place.
ELECTRICITY METER LOCATION
BUILDINGS IN FLAT LANDINGS GROUND/BASEMENT
Converted 23,538 1,158 168,241 % 12.2% 0.6% 87.2%
ELECTRICITY METER LOCATION
HOUSEHOLDS IN FLAT LANDINGS GROUND/BASEMENT
Converted 141,230 6,946 1,016,389 % 12.2% 0.6% 87.2%
Ground floor level meter cupboard
Basement level utility room (elec inside, gas outside)

© Siemens AG 2014 Multi-Dwelling Units: The size and scope of the GB market Page | 37
5.4.3. Gas Meters The table below shows the locations of the gas meters in the converted buildings which were sampled and found to be dual fuel in nature.
GAS METER LOCATION (EDF ENERGY & SIEMENS)
MDU TYPE IN FLAT INSIDE BUILDING OUTSIDE BUILDING
BUILDINGS % OF SAMPLE
BUILDINGS % OF SAMPLE
BUILDINGS % OF SAMPLE
Converted 26 4.9% 105 20.0% 395 75.1% The previous figures have been extrapolated to cover the entire GB converted MDU martker which is dual fuel in nature to generate an estimate of the number of households and buildings which present each type of meter location.
GAS METER LOCATION
BUILDINGS IN FLAT INSIDE BUILDING OUTSIDE BUILDING
Converted 8,197 33,455 125,624 % 4.9% 20.0% 75.1%
GAS METER LOCATION
HOUSEHOLDS IN FLAT INSIDE BUILDING OUTSIDE BUILDING
Converted 49,179 200,731 753,746 % 4.9% 20.0% 75.1%
Ground floor level external wall-mounted gas meters
Gas meters mounted in the communal corridor above the doorway
Collection of meters in wall-mounted cupboard in the basement
Basement level underground gas meters common in large mansions

© Siemens AG 2014 Multi-Dwelling Units: The size and scope of the GB market Page | 38
5.4.4 Space in Meter Rooms The table below shows the results of an assement to establish if there was sufficient space in existing meter rooms/cupboards in converted buildings to install additional equipment. This refers only to the location of the electricity meters as this is where the comms hub will most likely be situated. These figures have not been extrapolated due to the small sample size and serve for illustrative purposes only.
SPACE IN METER ROOM (SIEMENS) MDU TYPE YES NO
Converted 61.5% 38.5% 5.4.5 Meter Location Matrix The following matrix has been populated using the findings from the survey of converted buildings where both the location of the gas and electricity meters was known. This does not include properties where the status of the gas meter was declared as ‘unknown’ as they cannot be marked as dual fuel or electricity only.
CONVERTED
GAS METER LOCATION IN
FLAT INSIDE OUTSIDE
ELEC ONLY
In fl
at o
r by
its
front
doo
r
Inta
ke ro
om
ever
y la
ndin
g
Met
erin
g ro
om
or c
upbo
ard
Met
erin
g ro
om
or c
upbo
ard
outs
ide
build
ing
Out
side
bui
ldin
g eg
. sem
i co
ncea
led
m
eter
box
ELEC
TRIC
ITY
MET
ER
LOC
ATIO
N
IN FLAT In flat or by its front door
3.0% 0.2% 3.3% 3.0% 2.6% 12.0%
LANDINGS
Intake room every landing
0.2% 0.3% 0.5%
Intake room few landings
0.0%
GROUND FLOOR OR BASEMENT
LEVEL
Metering room or cupboard
1.3% 21.1% 5.2% 33.0% 10.0% 70.7%
Metering room or cupboard outside building
3.4% 0.3% 0.8% 4.6%
Outside building 12.3% 12.3%
4.3% 0.3% 21.1% 12.0% 48.9% 13.4% 100.0% 5.4.6 Four Case Model for Converted The total sample of all converted data has been applied to the four case model devised by EDF Energy. The following table shows the number of properties which have been classified as belonging to each case. Both the size of the buildings and the number of floors between the meters and the flat have been factored in when aligning the buildings to cases eg. a building may have the meters in a communal area on the ground floor but if it is only 2 storeys high it will probably be satisfied by a standard solution and hence falls under Case 1.

© Siemens AG 2014 Multi-Dwelling Units: The size and scope of the GB market Page | 39
SAMPLE – CONVERTED CASE MODEL CASE 1a 1b 2 3a 3b 4a 4b BUILDINGS 34 2 291 0 40 8 235 % 5.6% 0.3% 47.7% 0.0% 6.6% 1.3% 38.5% TOTAL 36 291 40 243 % 5.9% 47.7% 6.6% 39.8% The figures for each of the cases have been extrapolated to give an estimation of the number of buildings and households in the GB multi-dwelling unit market which fall into each case.
GB BUILDINGS – CONVERTED CASE MODEL CASE 1a 1b 2 3a 3b 4a 4b BUILDINGS 10,754 633 92,040 0 12,652 2,530 74,328 % 5.6% 0.3% 47.7% 0.0% 6.6% 1.3% 38.5% TOTAL 11,386 92,040 12,652 76,858 % 5.9% 47.7% 6.6% 39.8%
GB HOUSEHOLDS – CONVERTED CASE MODEL CASE 1a 1b 2 3a 3b 4a 4b HOUSEHOLDS 64,524 3,795 552,241 0 75,909 15,182 445,968 % 5.6% 0.3% 47.7% 0.0% 6.6% 1.3% 38.5% TOTAL 68,319 552,241 75,909 461,150 % 5.9% 47.7% 6.6% 39.8% 5.4.7 Summary of Converted Data 5.5 Exceptions in Meter Positions The previous analysis into meter locations had been conducted using the meter position of the majority of meters in a building. However, in some buildings it may be that a few meters are located separate to the rest. For example, properties have been found where all but one meter is located in a ground floor meter room with the exception of one which has been moved to in-flat, possibily as a result of switching to a pre-payment meter. This is likely to be more common in older properties due to the increased likelyhood of multiple changes of tenancies and switches between pre-payment meters.
Buildings requiring a solution 181,550
Households requiring a solution 1,089,300
In this meter room, a majority of the meters are in situ but those for flats 8 and 10 have been removed and replaced with pre-payment ones located at the flats.

© Siemens AG 2014 Multi-Dwelling Units: The size and scope of the GB market Page | 40
As part of their research, EDF Energy looked into both high-rise and low-rise buildings with meter location exceptions. The results of this analysis are shown below, covering both electricity and gas meter locations seperately. BUILDINGS % MDUs with Elec Exceptions 22 4.3% Total MDU Sample 516 100% ELEC MAIN LOCATION ELEC EXCEPTION
LOCATION BUILDINGS %
In flat or by its front door Metering room 3 13.6% In flat or by its front door Outside of building 2 9.1% Metering room or intake room on landings
In flat or by its front door 17 77.3%
TOTAL 22 100.0% BUILDINGS % MDUs with Gas Exceptions 8 2.2% Total MDU Sample 358 100.0% GAS MAIN LOCATION GAS EXCEPTION
LOCATION BUILDINGS %
In flat or by its front door Metering room 3 37.5% In flat or by its front door Outside of bulding 1 12.5% Meter room In flat or by its front door 1 12.5% Meter room Outside of building 1 12.5% Outside of building In flat or by its front door 2 25.0% TOTAL 8 100.0 5.6 Multiple Meter Rooms In most buildings only one metering room per utilty was found yet there are exceptions to this. As part of their research EDF Energy investigated buildings with multiple meter rooms, the results of which are shown below.
ELEC METER ROOMS Number of Metering Rooms
Number of Buildings
%
1 80 89.9% 2 6 6.8% 3 2 2.2% 4 1 1.1% TOTAL 89 100.0%
GAS METER ROOMS Number of Metering Rooms
Number of Buildings
%
1 28 90.3% 2 2 6.5% 12 1 3.2% TOTAL 31 100.0%

© Siemens AG 2014 Multi-Dwelling Units: The size and scope of the GB market Page | 41
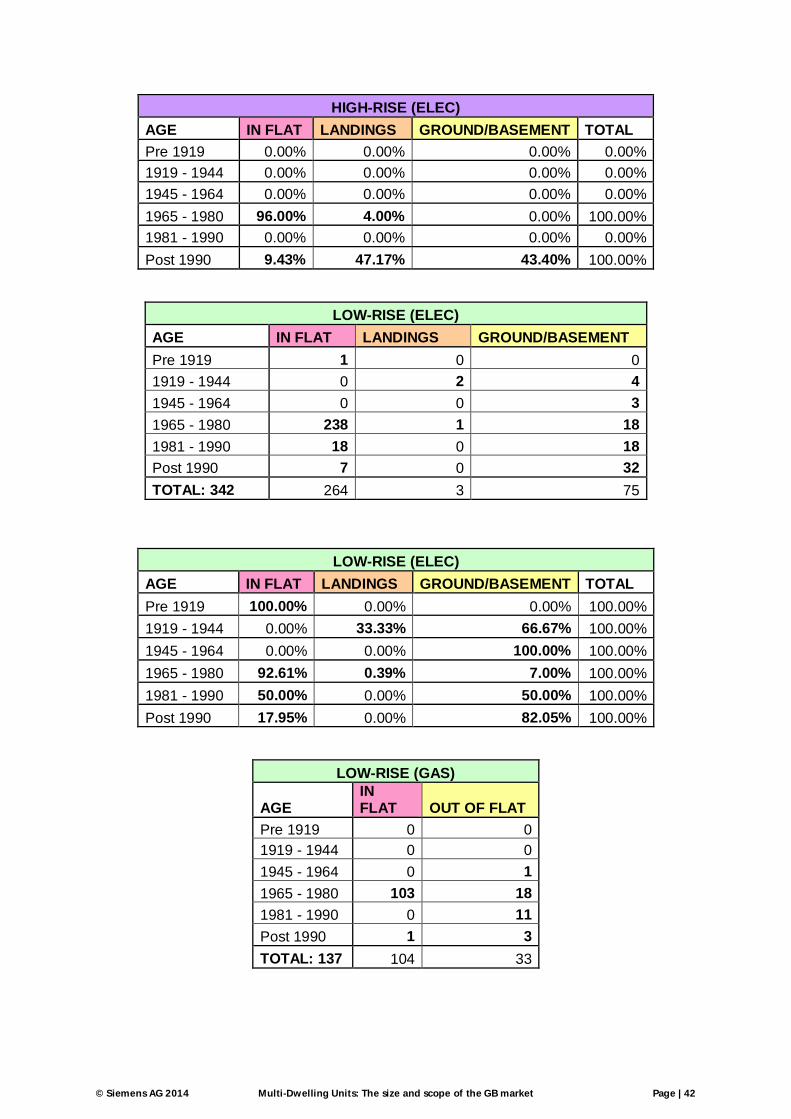
5.7 Age Profiling Age was considered a potential factor influencing the location of the meter in a building and was investigated as part of the Siemens’ research. The results showed that in certain cases a correlation can be identified between a building’s construction period and the likelihood that its meter will be in a certain location. The results of this analysis are shown below with tables illustrating both the size of the sample and then the percentage of buildings in each age/meter location category. For high-rise, only the data on electricity meters has been included as only a very limited number of buildings in the Siemens’ sample were found to have gas. For more details on how the age profile of the buildings has been determined, please refer to Appendix 3: Age Profiling.
AGE PROFILE OF SAMPLE AGE HIGH-RISE LOW-RISE CONVERTED TOTAL Pre 1919 0 1 19 20 1919 - 1944 0 6 12 18 1945 - 1964 0 3 262 265 1965 - 1980 25 257 158 440 1981 - 1990 0 36 2 38 Post 1990 53 39 1 93 TOTAL 78 342 454 874
AGE PROFILE OF SAMPLE AGE HIGH-RISE LOW-RISE CONVERTED Pre 1919 0.00% 0.29% 4.19% 1919 - 1944 0.00% 1.75% 2.64% 1945 - 1964 0.00% 0.88% 57.71% 1965 - 1980 32.05% 75.15% 34.80% 1981 - 1990 0.00% 10.53% 0.44% Post 1990 67.95% 11.41% 0.22% TOTAL 100.00% 100.00% 100.00%
HIGH-RISE (ELEC) AGE IN FLAT LANDINGS GROUND/BASEMENT Pre 1919 0 0 0 1919 - 1944 0 0 0 1945 - 1964 0 0 0 1965 - 1980 24 1 0 1981 - 1990 0 0 0 Post 1990 5 25 23 TOTAL: 78 29 26 23
© Siemens AG 2014 Multi-Dwelling Units: The size and scope of the GB market Page | 42
HIGH-RISE (ELEC) AGE IN FLAT LANDINGS GROUND/BASEMENT TOTAL Pre 1919 0.00% 0.00% 0.00% 0.00% 1919 - 1944 0.00% 0.00% 0.00% 0.00% 1945 - 1964 0.00% 0.00% 0.00% 0.00% 1965 - 1980 96.00% 4.00% 0.00% 100.00% 1981 - 1990 0.00% 0.00% 0.00% 0.00% Post 1990 9.43% 47.17% 43.40% 100.00%
LOW-RISE (ELEC) AGE IN FLAT LANDINGS GROUND/BASEMENT Pre 1919 1 0 0 1919 - 1944 0 2 4 1945 - 1964 0 0 3 1965 - 1980 238 1 18 1981 - 1990 18 0 18 Post 1990 7 0 32 TOTAL: 342 264 3 75
LOW-RISE (ELEC) AGE IN FLAT LANDINGS GROUND/BASEMENT TOTAL Pre 1919 100.00% 0.00% 0.00% 100.00% 1919 - 1944 0.00% 33.33% 66.67% 100.00% 1945 - 1964 0.00% 0.00% 100.00% 100.00% 1965 - 1980 92.61% 0.39% 7.00% 100.00% 1981 - 1990 50.00% 0.00% 50.00% 100.00% Post 1990 17.95% 0.00% 82.05% 100.00%
LOW-RISE (GAS)
AGE IN FLAT OUT OF FLAT
Pre 1919 0 0 1919 - 1944 0 0 1945 - 1964 0 1 1965 - 1980 103 18 1981 - 1990 0 11 Post 1990 1 3 TOTAL: 137 104 33

© Siemens AG 2014 Multi-Dwelling Units: The size and scope of the GB market Page | 43
LOW-RISE (GAS)
AGE IN FLAT OUT OF FLAT TOTAL
Pre 1919 0.00% 0.00% 0.00% 1919 - 1944 0.00% 0.00% 0.00% 1945 - 1964 0.00% 100.00% 100.00% 1965 - 1980 85.12% 14.88% 100.00% 1981 - 1990 0.00% 100.00% 100.00% Post 1990 25.00% 75.00% 100.00%
CONVERTED (ELEC) AGE IN FLAT LANDINGS GROUND/BASEMENT Pre 1919 15 0 4 1919 - 1944 0 0 12 1945 - 1964 17 0 245 1965 - 1980 0 0 158 1981 - 1990 0 0 2 Post 1990 0 0 1 TOTAL: 454 32 0 422
CONVERTED (ELEC) AGE IN FLAT LANDINGS GROUND/BASEMENT TOTAL Pre 1919 78.95% 0.00% 21.05% 100.00% 1919 - 1944 0.00% 0.00% 100.00% 100.00% 1945 - 1964 6.49% 0.00% 93.51% 100.00% 1965 - 1980 0.00% 0.00% 100.00% 100.00% 1981 - 1990 0.00% 0.00% 100.00% 100.00% Post 1990 0.00% 0.00% 100.00% 100.00%
CONVERTED (GAS)
AGE IN FLAT OUT OF FLAT
Pre 1919 15 4 1919 – 1944 0 4 1945 – 1964 0 241 1965 – 1980 0 121 1981 – 1990 0 0 Post 1990 0 0 TOTAL: 385 15 370

© Siemens AG 2014 Multi-Dwelling Units: The size and scope of the GB market Page | 44
CONVERTED (GAS)
AGE IN FLAT OUT OF FLAT TOTAL
Pre 1919 78.95% 21.05% 100.00% 1919 - 1944 0.00% 100.00% 100.00% 1945 - 1964 0.00% 100.00% 100.00% 1965 - 1980 0.00% 100.00% 100.00% 1981 - 1990 0.00% 0.00% 0.00% Post 1990 0.00% 0.00% 0.00%

The summary tables below show both the number of buildings and households for each MDU type which fall into the EDF Energy 4 cases. Those in 2, 3 and 4 will not be satisfied by a standard solution.
GB BUILDINGS – TOTAL CASE MODEL
CASE 1a 1b 2 3a 3b 4a 4b DIFFICULT BUILDINGS
CASE: 2, 3 & 4
HIGH-RISE
5,954 1,589 1,177 109 630 432 0 2,348
60.2% 16.1% 11.9% 1.0% 6.4% 4.4% 0.0% 7,543 1,177 739 432
23.7% 76.3% 11.9% 7.4% 4.4%
LOW-RISE
175,542 7,566 22,369 2,056 58,462 3,267 9,801 95,955
62.9% 2.7% 8.0% 0.7% 21.0% 1.2% 3.5% 183,108 22,369 60,518 13,068
34.4% 65.6% 8.0% 21.7% 4.7%
CONVERTED
10,754 633 92,040 0 12,652 2,530 74,328 181,550
5.6% 0.3% 47.7% 0.0% 6.6% 1.3% 38.5% 11,386 92,040 12,652 76,858
94.10% 5.9% 47.7% 6.6% 39.8%
TOTAL
192,250 9,788 115,586 2,165 71,744 6,229 84,129 279,853
39.9% 2.0% 24.0% 0.4% 14.9% 1.3% 17.5% 202,038 115,586 73,909 90,358
58.1% 41.9% 24.0% 15.3% 18.8%
GB HOUSEHOLDS – TOTAL CASE MODEL
CASE 1a 1b 2 3a 3b 4a 4b DIFFICULT
HOUSEHOLDS CASE: 2, 3 & 4
HIGH-RISE
338,111 93,901 51,606 5,077 32,437 19,568 0 108,688
62.5% 17.4% 9.5% 1.0% 6.0% 3.6% 0.0% 432,012 51,606 37,514 19,568
20.10% 79.9% 9.5% 7.0% 3.6%
LOW-RISE
2,638,468 151,317 398,468 39,391 473,623 65,341 196,024 1,172,847
66.6% 3.8% 10.1% 1.0% 12.0% 1.6% 4.9% 2,789,785 398,468 513,014 261,365
29.60% 70.4% 10.1% 13.0% 6.5%
CONVERTED
64,524 3,795 552,241 0 75,909 15,182 445,968 1,089,300
5.6% 0.3% 47.7% 0.0% 6.6% 1.3% 38.5% 68,319 552,241 75,909 461,150
94.10% 5.9% 47.7% 6.6% 39.8%
TOTAL
3,041,103 249,013 1,002,315 44,468 581,969 100,091 641,992 2,370,835
53.7% 4.4% 17.7% 0.8% 10.3% 1.8% 11.3% 3,290,116 1,002,315 626,437 742,083
41.9% 58.1% 17.7% 11.1% 13.1%
Buildings requiring a solution 279,853
Households requiring a solution 2,370,835
Conclusion

APPENDIX 1: Postcode Regions in London & Bristol Surveyed by EDF Energy and Siemens BRISTOL EDF ENERGY SIEMENS BS1 6TE BS13 7TJ BS1 6TA BS1 6TQ BS2 8LF BS4 2QN BS5 0JD BS16 5DL BS16 5EX BS16 5HS BS16 5JF BS16 5UP BS16 5UR LONDON EDF ENERGY SIEMENS E1 – Eastern (head district) E1 – Eastern (head district) E12 – Manor Park E14 – Poplar E13 – Plaistow E15 – Stratford E15 – Stratford NW2 – Cricklewood E2 – Bethnal Green NW6 – Kilburn E3 – Bow SE11 – Kennington E5 – Clapton SW11 – Battersea (head district) E6 – East Ham SW12 – Balham E7 – Forest Gate SW2 – Brixton E8 – Hackney SW4 – Clapham E9 – Homerton SW8 – South Lambeth IG11 – Barking SW9 – Stockwell N1 – Nothern (head district) W9 – Maida Hill N19 – Upper Holloway N22 – Wood Green N5 – Highbury N7 – Holloway NW1 – North Western (head district) NW10 – Willesden NW3 – Hampstead NW8 – St. Johns Wood SW10 – West Brompton SW1V – Westminster SW1W – Westminster/Kensington & Chelsea SW3 – Chelsea SW5 – Earls Court SW6 – Fulham SW7 – South Kensington W10 – North Kensington W11 – Notting Hill W12 – Shepherd’s Bush
Appendix

W14 – West Kensington W1B – Portland W1H – Marylebone W1U – Marylebone W2 – Paddington (head district) W5 – Ealing W6 – Hammersmith W8 – Kensington W9 – Maida Hill WC1H – St. Pancras WC1X – King’s Cross The areas found to be featured in both surveys are E1 Eastern (head district), E15 Stratford and W9 Maida Hill. In these cases the individual street names were checked and if any appeared in both surveys then the individual building addresses were checked. This ensured there was no duplication of building data in the survey. The list below shows the post code check for the W9 Maida Hill area:
EDF ENERGY SIEMENS Ashmore Road Chippenham Road (51-55 & 61-65) Chippenham Road (48) Delaware Road Fermoy Road Elgin Avenue Fleming Close Grittleton Road (18-25) Goldney Road Morshead Road Grand Union Close Warlock Road Grittleton Road (13-15) Wymering Road Harrowdene Court Rivertone Close

APPENDIX 2: Siemens MDU Survey Form40
Address
High/Low/Conv # Floors # Flats # Buildings (if more than one) # Flats per Building
Elec Meter Location Gas Meter Location Can you fit comms hub? Distance between gas and elec? Meter Type (pre-pay vs ordinary) Age A – Pre 1919 B – 1919 – 1944 C – 1945 – 1964 D – 1965 – 1980 E – 1980 – 1990 F – Post 1990
Photo ID/Description Interesting Building Features Additional Comments
40 The buildings visited as part of the Siemens’ survey were selected at random from areas in major GB cities with a high proportion of MDUs. In a majority of cases these were within areas with a strong United Utilties or British Gas customer base as data collectors from those companies assisted the survey team. The survey was carried out as a separate acitivity from the day to day meter reading.
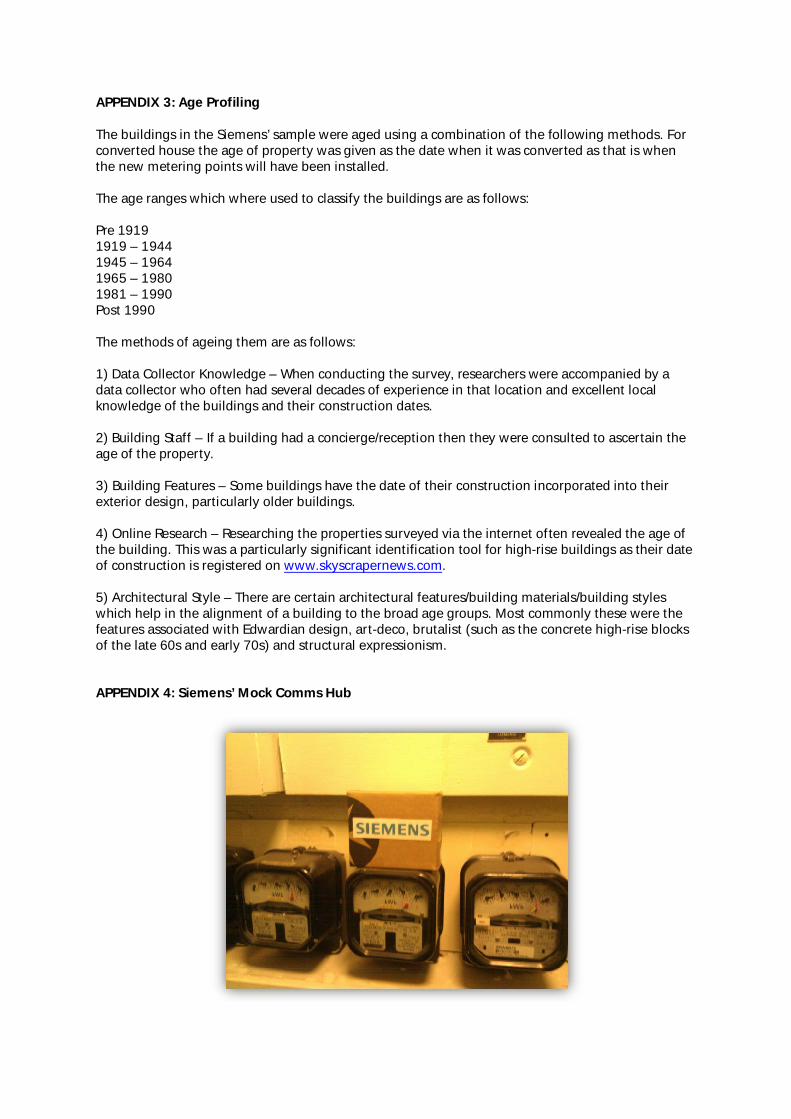
APPENDIX 3: Age Profiling The buildings in the Siemens’ sample were aged using a combination of the following methods. For converted house the age of property was given as the date when it was converted as that is when the new metering points will have been installed. The age ranges which where used to classify the buildings are as follows: Pre 1919 1919 – 1944 1945 – 1964 1965 – 1980 1981 – 1990 Post 1990 The methods of ageing them are as follows: 1) Data Collector Knowledge – When conducting the survey, researchers were accompanied by a data collector who often had several decades of experience in that location and excellent local knowledge of the buildings and their construction dates. 2) Building Staff – If a building had a concierge/reception then they were consulted to ascertain the age of the property. 3) Building Features – Some buildings have the date of their construction incorporated into their exterior design, particularly older buildings. 4) Online Research – Researching the properties surveyed via the internet often revealed the age of the building. This was a particularly significant identification tool for high-rise buildings as their date of construction is registered on www.skyscrapernews.com. 5) Architectural Style – There are certain architectural features/building materials/building styles which help in the alignment of a building to the broad age groups. Most commonly these were the features associated with Edwardian design, art-deco, brutalist (such as the concrete high-rise blocks of the late 60s and early 70s) and structural expressionism. APPENDIX 4: Siemens’ Mock Comms Hub

APPENDIX 5: EDF Energy MDU Survey Form41
41 The EDF ENERGY survey was carried out in conjunction with day to day meter reading activities. When a meter reader came across an MDU in the course of their normal duties, the above survey form was completed.

APPENDIX 6: Scottish Power MDU Survey Summary
Scottish Power conducted a large scale survey to identify smart metering rollout issues and the MDU data is taken from that wider piece of work. The information was captured electronically by meter readers throughout the course of their normal daily duties.

APPENDIX 7: Matrix Case Alignment Guide

APPENDIX 8: Building Regulations – Disproportionate Collapse
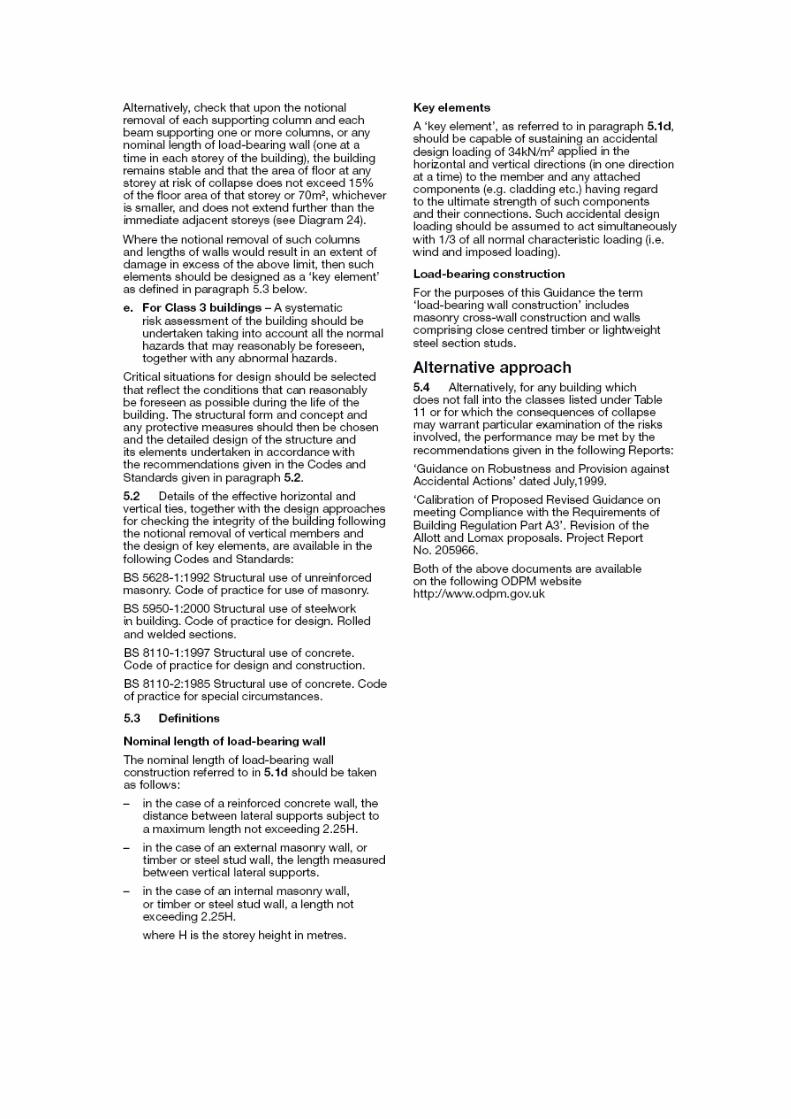

APPENDIX9: IGEM G/5 Section 5 Gas Meter Location Restrictions
Meters cannot be sited on or under the stairway, or in any other parts of the premises where the stairway or that other part of the premises forms the common means of escape in case of fire, unless other measures are taken.
Meters cannot be installed where the consequences of a gas escape, fire or explosion at the meter would compromise the integrity of the structure of the building.
Meters must not be installed in any common sole means of escape nor in any rooms, box, cupboard or other compartment or enclosure that opens onto a common sole means of escape.
Meters shall not be installed in a meter room where twin fire doors create a false or intermediate lobby between the meter room and the common sole means of escape.
Meters shall not be installed in any common alternative means of escape unless a risk assessment indicates it is safe to do so. It is suggested that a fire or explosion in one means of escape, or that the means of escape is largely in the outside open air where any escape of gas would quickly and safely disperse. Another optuion if the use of an Excess Flow Valve and a Thermal Cut-off Valve in conjuction with other safety measures.

APPENDIX 10: High-Rise Meter Location Matrix by Type
SUPER HIGH-RISE ENGLAND & WALES
GAS METER LOCATION IN
FLAT INSIDE OUTSIDE
ELEC ONLY
In fl
at o
r by
its fr
ont
door
Inta
ke ro
om e
very
la
ndin
g
Met
erin
g ro
om o
r cu
pboa
rd
Met
erin
g ro
om o
r cu
pboa
rd o
utsi
de
build
ing
Out
side
bui
ldin
g eg
. se
mi c
once
aled
me-
ter b
ox
ELEC
TRIC
ITY
MET
ER L
OC
ATI
ON
IN FLAT In flat or by its front door
37.5% 5.2% 28.1% 70.8%
LANDINGS
Intake room every landing
4.2% 1.0% 21.9% 27.1% Intake room few landings
0.0%
GROUND FLOOR OR BASEMENT
LEVEL
Metering room or cupboard
1.0% 1.0% 2.1%
Metering room or cupboard outside building
0.0%
Outside build-ing 0.0%
42.7% 1.0% 0.0% 0.0% 5.2% 51.0% 100.0%
NON-SUPER HIGH-RISE ENGLAND & WALES
GAS METER LOCATION IN
FLAT INSIDE OUTSIDE
ELEC ONLY
In fl
at o
r by
its fr
ont
door
Inta
ke ro
om e
very
la
ndin
g
Met
erin
g ro
om o
r cu
pboa
rd
Met
erin
g ro
om o
r cu
pboa
rd o
utsi
de
build
ing
Out
side
bui
ldin
g eg
. se
mi c
once
aled
met
er
box
ELEC
TRIC
ITY
MET
ER L
OC
ATI
ON
IN FLAT In flat or by its front door
34.4% 1.3% 7.5% 13.1% 56.3%
LANDINGS
Intake room every landing
3.8% 0.6% 1.3% 0.6% 11.3% 17.5% Intake room few landings
0.6% 0.6%
GROUND FLOOR OR BASEMENT
LEVEL
Metering room or cupboard
5.0% 1.3% 3.1% 15.6% 25.0% Metering room or cupboard outside building
0.0%
Outside build-ing 0.6% 0.6%
43.8% 3.1% 4.4% 0.0% 8.1% 40.6% 100.0%

HIGH RISE SCOTLAND
GAS METER LOCATION IN
FLAT INSIDE OUTSIDE
ELEC ONLY
In fl
at o
r by
its fr
ont
door
Inta
ke ro
om e
very
la
ndin
g
Met
erin
g ro
om o
r cu
pboa
rd
Met
erin
g ro
om o
r cu
pboa
rd o
utsi
de
build
ing
Out
side
bui
ldin
g eg
. se
mi c
once
aled
me-
ter b
ox
ELEC
TRIC
ITY
MET
ER L
OC
ATI
ON
IN FLAT In flat or by its front door
1.9% 1.9% 96.2% 100.0%
LANDINGS
Intake room every landing
0.0% Intake room few landings
0.0%
GROUND FLOOR OR BASEMENT
LEVEL
Metering room or cupboard
0.0%
Metering room or cupboard outside building
0.0%
Outside build-ing 0.0%
0.0% 0.0% 1.9% 0.0% 1.9% 96.2% 100.0%

Building & Household Statistics English Data Department for Communities & Local Government, ‘English Housing Survey, HOMES 2011‘, (Office for National Statistics) https://www.gov.uk/government/uploads/system/uploads/attachment_data/file/211324/EHS_HOMES_REPORT_2011.pdf Department for Communities & Local Government, ‘English Housing Survey, Headline Report 2011-12’, (Office for National Statistics) https://www.gov.uk/government/uploads/system/uploads/attachment_data/file/212496/EHS_HOUSEHOLDS_REPORT_2011-12.pdf Department for Communities & Local Government, ‘English Housing Survey, Housing Stock Report 2008’, (Office for National Statistics) https://www.gov.uk/government/uploads/system/uploads/attachment_data/file/6703/1750754.pdf Scottish Data The Scottish Government, ‘Scottish Housing Condition Survey, Key Findings 2010‘, (Office for Na-tional Statistics) http://www.scotland.gov.uk/Resource/Doc/363471/0123368.pdf National Records of Scotland, ‘Estimates of Households and Dwellings in Scotland, 2012‘, (Office for National Statistics) http://www.gro-scotland.gov.uk/files2/stats/household-estimates/he-12/2012-estimates-households-dwellings-scotland.pdf The Scottish Government,‘Public Authority Housing Stock – web table‘, (Housing Statistics for Scot-land) tab:tsStockbyType - AllFlats http://www.scotland.gov.uk/Topics/Statistics/Browse/Housing-Regeneration/HSfS/StockPublicSector Right to Buy http://www.scotland.gov.uk/Topics/Built-Environment/Housing/16342/rtb. National Trust for Scotland – Tenement Museum http://www.nts.org.uk/Property/Tenement-House/ Welsh Data Statistics for Wales, ‘First Release: Dwelling Stock Etimates for Wales 2011-2012’, (Ystadegau Gwla-dol | National Statistics) http://wales.gov.uk/docs/statistics/2013/130425-dwelling-stock-estimates-2011-12-en.pdf Welsh Government, ‘Welsh House Condition Survey 1998‘ http://wales.gov.uk/docs/statistics/2009/090924housesurvey1998en.pdf Buildings Skyscraper News www.skyscrapernews.com
Bibliography & Resources

Survey Resources CSP ISDS Extract - Communications Hub: Supplementary Requirements (Available upon request as no online source located). Building Research Establishment (BRE) http://www.bre.co.uk/page.jsp?id=2855 V. Janssens and D.W. O’Dwyer, ‘Disproportionate Collapse in Building Structures‘, (Dept. Of Civil, Structural and Environmental Eng, Trinity College Dublin http://www.tara.tcd.ie/bitstream/2262/49396/1/Disproportionate%20Collapse%20in%20Building%20Structures.pdf Ronan-Point Online Wiki Article http://en.wikipedia.org/wiki/Ronan_Point HM Government, ‘The Building Regulations 2010, Approved Document A‘, http://www.planningportal.gov.uk/uploads/br/BR_PDF_AD_A_2013.pdf Installer Online (also reference for IGEM G/5 Section 5 Gas Meter Location Restrictions) http://www.installeronline.co.uk/wp-content/uploads/2013/01/High-rise-advice.pdf

Nulput la consed duisit iustin et loborese modolob orperostrud et ex esequam est quam dolorper sed exer sed tat acietsopit utpatinis alit ipsustrud dolore dolobor sit eraessequis aut veniat ip et, quissim ip et iniscincinis alisl dunt vel utat lorer sequi bla consequam, summod tetu dignismod tincil ing ex ea acipsustrud molore feum zzriurer summy nim dolor quissim ip et iniscincinis alisl dunt vel utat lorer sequi bla consequamaut lobore.
Magnis del utpat. Duisis aliquam etumoll estrud dolorpe ratuerci blamet, su duis it cipis nit lum veniamet ad delis nonsequi diam iriure del illum inibh enit ullaore est irillaorper il utem inim et ipsuscilisi blatag met veniatum adit irit utpat ero etue et ip doloreet wis esto er sisl irit alit dino enim duisi essecte con henis do con vel exe ros si et ing elendre magnisi.
Siemens plc 100 Woodyard Lane Wollaton Nottingham NG8 1GB www.siemens.co.uk/metering Global Siemens Headquarters Siemens AG Wittelsbacherplatz 2 80333 Muenchen Germany
www.siemens.com © 01.2014, Siemens AG