size and scope of the live performance industry live performance australia
TRANSCRIPT

Size and scope of the Live Performance IndustryLive Performance Australia
24 February 2014

Live Performance AustraliaSize and Scope of the Live Performance Industry in 2012 EY ÷ i
Contents
Executive summary ................................................................................................................ 1
1. Introduction ................................................................................................................... 61.1 Overview ........................................................................................................................................................... 61.2 Definition of the industry .................................................................................................................................... 61.3 Limitations ......................................................................................................................................................... 71.4 Disclaimer .......................................................................................................................................................... 8
2. Key concepts .................................................................................................................. 92.1 Economic indicators ........................................................................................................................................... 92.2 Estimation approach......................................................................................................................................... 102.3 Data sources .................................................................................................................................................... 12
3. National economic contribution ..................................................................................... 133.1 Industry revenues and expenses ....................................................................................................................... 133.2 Industry output ................................................................................................................................................ 143.3 Industry value add ............................................................................................................................................ 143.4 Direct industry employment.............................................................................................................................. 153.5 Comparison with other industries...................................................................................................................... 16
4. Large scale venues and events ...................................................................................... 17
5. AMPAG companies ........................................................................................................ 19
6. Regional and metropolitan venues ................................................................................. 20
7. Key Organisations......................................................................................................... 22
8. Economic contribution by State and Territory ................................................................ 238.1 Overall results .................................................................................................................................................. 238.2 Per capita results ............................................................................................................................................. 24
9. Economic contribution by event category ...................................................................... 26
10. Comparison to 2008 data .......................................................................................... 2710.1 National economic contribution .............................................................................................................. 2710.2 Economic contribution by State and Territory ......................................................................................... 2810.3 Economic contribution by event category................................................................................................ 29
11. Disclaimer ................................................................................................................ 31
Appendix A : Survey participants ..................................................................................... 33
Appendix B : Category size definitions.............................................................................. 35
Appendix C : Number of performances by industry component and event category ............ 36
Appendix D : Revenue and cost descriptions ..................................................................... 37
Appendix E : Event profiles .............................................................................................. 38
Glossary............................................................................................................................... 41
© 2014 Ernst & Young Australia.
Liability limited by a scheme approved under Professional Standards Legislation.
Live Performance AustraliaSize and Scope of the Live Performance Industry in 2012 EY ÷ 1
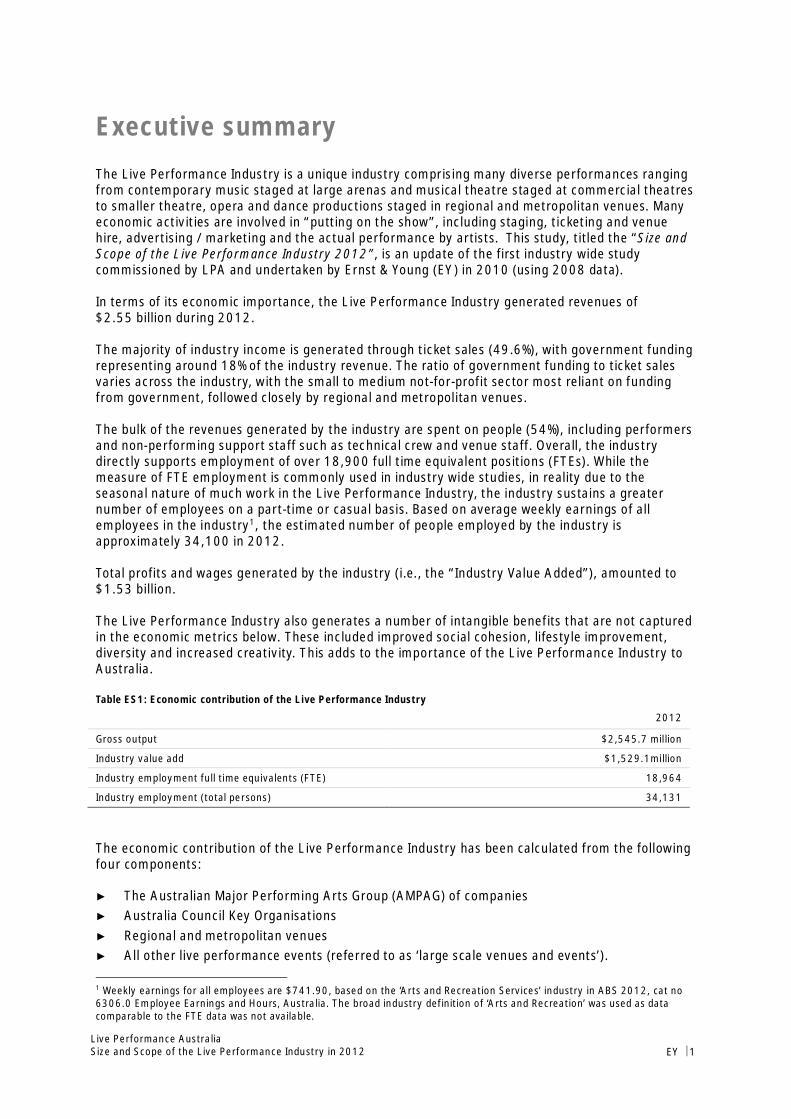
Executive summaryThe Live Performance Industry is a unique industry comprising many diverse performances rangingfrom contemporary music staged at large arenas and musical theatre staged at commercial theatresto smaller theatre, opera and dance productions staged in regional and metropolitan venues. Manyeconomic activities are involved in “putting on the show”, including staging, ticketing and venuehire, advertising / marketing and the actual performance by artists. This study, titled the “Size andScope of the Live Performance Industry 2012”, is an update of the first industry wide studycommissioned by LPA and undertaken by Ernst & Young (EY) in 2010 (using 2008 data).
In terms of its economic importance, the Live Performance Industry generated revenues of$2.55 billion during 2012.
The majority of industry income is generated through ticket sales (49.6%), with government fundingrepresenting around 18% of the industry revenue. The ratio of government funding to ticket salesvaries across the industry, with the small to medium not-for-profit sector most reliant on fundingfrom government, followed closely by regional and metropolitan venues.
The bulk of the revenues generated by the industry are spent on people (54%), including performersand non-performing support staff such as technical crew and venue staff. Overall, the industrydirectly supports employment of over 18,900 full time equivalent positions (FTEs). While themeasure of FTE employment is commonly used in industry wide studies, in reality due to theseasonal nature of much work in the Live Performance Industry, the industry sustains a greaternumber of employees on a part-time or casual basis. Based on average weekly earnings of allemployees in the industry1, the estimated number of people employed by the industry isapproximately 34,100 in 2012.
Total profits and wages generated by the industry (i.e., the “Industry Value Added”), amounted to$1.53 billion.
The Live Performance Industry also generates a number of intangible benefits that are not capturedin the economic metrics below. These included improved social cohesion, lifestyle improvement,diversity and increased creativity. This adds to the importance of the Live Performance Industry toAustralia.
Table ES1: Economic contribution of the Live Performance Industry
2012
Gross output $2,545.7 million
Industry value add $1,529.1million
Industry employment full time equivalents (FTE) 18,964
Industry employment (total persons) 34,131
The economic contribution of the Live Performance Industry has been calculated from the followingfour components:
► The Australian Major Performing Arts Group (AMPAG) of companies► Australia Council Key Organisations► Regional and metropolitan venues► All other live performance events (referred to as ‘large scale venues and events’).
1 Weekly earnings for all employees are $741.90, based on the ‘Arts and Recreation Services’ industry in ABS 2012, cat no6306.0 Employee Earnings and Hours, Australia. The broad industry definition of ‘Arts and Recreation’ was used as datacomparable to the FTE data was not available.

Live Performance AustraliaSize and Scope of the Live Performance Industry in 2012 EY ÷ 2
Table ES2 provides a breakdown of the economic contribution of the four components of theindustry. Large scale venues and events are the largest contributor to the industry, generating 66%of the industry’s revenue.
Table ES2: Live Performance Industry revenues, expenses and surpluses by industry component
Large scalevenues and
events($ millions)
AMPAG($ millions)
Regional andmetropolitan
($ millions)
KeyOrganisations
($ millions)
Total($ millions)
As % oftotal
revenue
Revenue
Box office income $1,027.0 $177.9 $51.0 $6.2 $1,262.1 49.6%
Government funding $105.2 $164.4 $166.7 $11.0 $447.3 17.6%
Corporate sponsorship and support $26.2 $64.8 $5.9 $3.0 $99.9 3.9%
Other* $521.1 $63.2 $148.3 $4.0 $736.6 28.9%
Total revenue $1,679.5 $470.2 $371.8 $24.2 $2,545.7 100.0%
Expenses
Wages (including direct wages toperformers) $424.2 $255.6 $135.9 $11.5 $827.2 32.5%
Contract payments to performers $457.4 $35.3 - $1.5 $494.2 19.4%
Rent, leasing and hiring $167.9 - - $0.7 $168.5 6.6%
Venue hire $130.6 $25.4 - $1.2 $157.2 6.2%
Travel, accommodation and vehicles $77.1 $23.3 - $2.8 $103.3 4.1%
Advertising, marketing and promotions $97.4 $46.5 $16.6 $1.4 $162.0 6.4%
Purchases $30.8 $10.8 - $0.2 $41.8 1.6%
Royalty payments $39.1 $10.2 - $0.3 $49.7 2.0%
Staging, equipment & repairs $48.4 $8.5 $13.4 $1.8 $72.0 2.8%
Other* $73.4 $41.4 $140.3 $2.5 $257.6 10.1%
Total expenses $1,546.2 $457.0 $306.2 $23.9 $2,333.3 91.7%
Operating surplus $133.3 $13.2 65.6 $0.3 212.4 8.3%
*Description of revenue and expense items can be found in Appendix D** Total may not add due to rounding
This study also analysed the industry by event category (refer section 2.2 for a description of theevent categories). The Contemporary Music and Musical Theatre categories made the largesteconomic contributions to the industry (32.6% and 14.6% respectively in terms of industryrevenue). This is consistent with Live Performance Australia’s (LPA) Ticket Attendance and RevenueSurvey 2012 where Contemporary Music and Musical Theatre are ranked one and two respectivelyin terms of both attendances and ticket revenue.

Live Performance AustraliaSize and Scope of the Live Performance Industry in 2012 EY ÷ 3
Figure ES1: Industry contribution by category
Change in the size of the industry
Since 2008, the Live Performance Industry has experienced modest real growth in total output(3% when excluding new data sources2). One of the key factors for achieving only modest growthwas the significant reduction in the contribution of Musical Theatre and Classical Music (both interms of percentage change and dollar value). The changes to the contribution of the industry byevent category are highlighted in Figures ES2 and ES3.
The size of the industry in terms of value-add and employment has grown more strongly since 2008.Excluding new data sources, value add has experienced real growth of 17%. This growth has beendriven by increased overall industry wages, and an estimated 21% increase in the number of fulltime equivalent employees.
The increase in the number of FTE employees is a result of higher industry wages as a percentage ofrevenue and modest growth in the average FTE wage.3 The expense item ‘wages (including directwages to performers)’ increased from 28% in 2008 to 32% in 2012.This increased wage pressurewas reflected in stakeholder consultations. In addition, the wage component of contract paymentsto performers increased (in the previous study a larger amount was treated as an expense).
Table ES3: Industry output, value add and employment, 2008 and 2012
2012 (full dataset) 2012 (excluding new datasources*) 2008**
Industry output $2,545.7 million $2,149.7 million $2,084.3 millionIndustry value add $1,529.1 million $1,309.1 million $1,115.5 millionIndustry employment (FTE) 18,964 16,745 13,819
*Excludes Key Organisations and regional and metropolitan venues**2008 numbers are inflated to 2012 dollars
Figures ES2 and ES3 below illustrate the changes in industry contribution by event category (ES2shows the percentage change and ES3 shows the dollar value change in contribution). SingleCategory Festivals, Ballet and Dance and Opera experienced the largest percentage growth in outputsince 2008. In terms of the dollar value change, Contemporary Music also experienced a largeincrease.
2 The 2012 study now includes data from the Australian Performing Arts Centres Association’s (APACA) Economic ActivityReport and the Australia Council Key Organisations.3 The number of FTE employees is calculated by applying an average labour cost per FTE staff to the industry wage amountsestimated.
8.0%3.5%
4.6%
6.7%
4.1%
32.6%
1.7%
8.9%
14.6%
5.2%
1.3%8.7%
Ballet and Dance
Childrens/FamilyCircus & Physical TheatreClassical MusicComedyContemporary MusicFestival (Multi Category)
Festival (Single Category)Musical TheatreOperaSpecial EventsTheatre

Live Performance AustraliaSize and Scope of the Live Performance Industry in 2012 EY ÷ 4
Figure ES2: 2008* to 2012 percentage change in industry contribution by category
*2008 numbers are inflated to 2012 dollars
Figure ES3: 2008* to 2012 dollar value change in industry contribution by category ($ millions)
*2008 numbers are inflated to 2012 dollars
Comparison to other industries
This study estimates the total size of the Live Performance Industry at $2.55 billion in output,supporting a total of around 18,964 full-time equivalent positions. The industry generated valueadd of $1.53 billion, which is greater than the film, television and digital games, heritage activitiesand library services sectors in Australia.
-61.9%
-55.4%
-33.2%
-25.5%
2.0%
2.2%
4.3%
16.1%
17.7%
30.6%
Special Events
Classical Music
Festival (Multi Category)
Musical Theatre
Theatre
Childrens/Family
Contemporary Music
Opera
Ballet and Dance
Festival (Single Category)
-80.0% -60.0% -40.0% -20.0% 0.0% 20.0% 40.0%
-$135.0-$108.2
-$18.4-$10.6
$1.3$3.5
$17.6$20.4
$31.0$50.4
Classical MusicMusical Theatre
Festival (Multi Category)Special Events
Childrens/FamilyTheatre
OperaBallet and Dance
Contemporary MusicFestival (Single Category)
-$175.0 -$125.0 -$75.0 -$25.0 $25.0 $75.0

Live Performance AustraliaSize and Scope of the Live Performance Industry in 2012 EY ÷ 5
Table ES4: Comparison with other industries
Industry Industry output($ millions)
Industry value add($ millions)
Source
Mining $237,416 $132,955 ABS (2013) 8415.0Manufacturing $397,705 $102,146 ABS (2013) 8155.0Publishing (except Internet and musicpublishing)
$13,181 $7,091 ABS (2011) 4172.0
Sports and recreation activities $12,773 $4,653 ABS (2013) 8155.0Creative and performing artsactivities*
$3,818 $1,602 ABS (2013) 8155.0
Live Performance Industry $2,546 $1,529 Ernst & YoungFilm, television and digital games $2,194 $930 ABS (2013) 8679.0Venue-based live music industry $1,211 $652 Ernst & YoungHeritage activities $$758 $353 ABS (2013) 8155.0Library and other information services $208 $199 ABS (2013) 8155.0
*The businesses that contribute to Creative and performing arts activities are classified in accordance with the ANZSICindustry definition and include performing arts operation (e.g. circus operation, dance and ballet company operation, musicalproductions and opera company operation), creative artists, musicians, writers and performers (e.g. artists, choreographyservices, costume designing, playwriting or screenwriting, set designing service and theatre lighting design service) andperforming arts venues operation. The Live Performance Industry measure includes some elements of this measure but notall.

Live Performance AustraliaSize and Scope of the Live Performance Industry in 2012 EY ÷ 6
1. Introduction
1.1 OverviewThe social and economic benefits generated by the creative and cultural industries have been welldocumented. Academics such as Richard Florida and David Throsby have highlighted the importanceof these industries to economic development4. Further, the social and economic benefits have beenrecognised in Creative Australia, the Australian Government’s National Cultural Policy. CreativeAustralia “describes the essential role arts and culture play in the life of every Australian and howcreativity is central to Australia’s economic and social success: a creative nation is a productivenation.”
An important element of creative industries is the Live Performance Industry, which encompassesthe music and performing arts sectors.
Live Performance Australia has engaged Ernst & Young (EY) to examine the size and scope of thisindustry in Australia. This study provides a snapshot of the Live Performance Industry’s economiccontribution in terms of gross output, value add and employment during 2012.
This study updates the 2010 Size and Scope study published by LPA in partnership with EY, whichmeasured the economic contribution of the Live Performance Industry during 2008 (referred to asthe previous study or 2008 data).
1.2 Definition of the industryFor the purposes of this study, the Live Performance Industry is defined as businesses and workersthat organise and perform work for or in connection with performances, productions, workshops,rehearsals or concerts (including the operation of venues or other facilities, whether permanent ortemporary) that are performed in front of a live audience.
This study is based on the same range of live performance events captured in the 2012 TicketAttendance and Revenue Survey and the 2012 Supplementary Ticket Attendance and RevenueSurvey published by Live Performance Australia.5 The events included represent professionalperformances, and in general exclude amateur and community events6. Table 1 presents adescription of the live performance events that were surveyed and incorporated in this study.
4 Richard L. Florida (2002) ‘The Rise of the Creative Class’5 Live Performance Australia (2013) Live Performance Industry in Australia: Ticket Attendance and Revenue Survey 2012Report and Live Performance Australia (2013) Regional and Metropolitan Venues and Australia Council Key Organisations:Supplementary Ticket Attendance and Revenue Survey 2012.6 All efforts were made to remove amateur and community events from the dataset, however, in some cases this was done bydata providers and EY did not have control over this data.

Live Performance AustraliaSize and Scope of the Live Performance Industry in 2012 EY ÷ 7
Table 1: Category descriptor guide (2012)
Category Description
Ballet and Dance Traditional forms, Ethnic dance, Folk dance, Ballet, Ballroom, Latin dance,Liturgical dance, Modern dance, Ballet, Tap, and Breakdancing
Children’s/Family Live entertainment for children, Interactive performances for children andWorkshops for children
Circus and Physical Theatre* Physical TheatreCircus
Classical Music Any of the following in classical/contemporary art (i.e. current, but not‘pop’) style: Orchestral music, Chamber music, Choirs and choral music,Recitals, and Singing/playing. All styles of the following: Sacred music andTraditional music/ethnic music/world music
Comedy* Stand upComedy performances (but not Comedy plays)
Contemporary Music^ All forms of the following, performed by any type of ensemble or soloist(including any ensemble/chorus/solo musicians advertising a programwhich is exclusively one of the following categories, e.g. ‘pop’ or ‘jazz,’ as inThe Australian Jazz Orchestra): Pop, Jazz, Blues, Country, Rock, Folk,Soul, R&B, Techno, Hip hop, Rap, Heavy Metal, and Dance parties
Festivals (Multi-Category) Festivals/events which contain a number of different types of events whichfall into two or more categories
Festivals (Single-Category) Festivals/events which contain a number of events but which fall into onecategory only
Musical Theatre Staged productions which include music/drama/movement in popular form,primarily (but not limited to): MusicalsCabarets in cabaret mode/style
Opera Theatrical presentations in which a dramatic performance is set to music inclassical or contemporary art style: Opera and Operetta (includes Gilbertand Sullivan)
Special Events Unique presentations which do not fall into any other category
Theatre Script based theatre, Drama, Comedy theatre, Mime and Plays
*These categories were introduced in 2009^This category was renamed in 2011, having been named “Non-Classical Music” in prior years
1.3 LimitationsThis study is largely based on ticket revenue and events data sourced from Live PerformanceAustralia’s 2012 Ticket Attendance and Revenue Survey and Supplementary Survey which wereprepared by EY. As noted in those Surveys, its coverage was limited to the companies andorganisations that participated in the survey (a table of survey participants is outlined in AppendixA).
Moreover, it was noted that revenues at festivals were under-reported. For instance, some festivalsmaintain their own ticketing systems and are not part of the survey. In addition, the contemporarymusic category is subject to similar limitations; as pub and club venues that self-ticket, or use

Live Performance AustraliaSize and Scope of the Live Performance Industry in 2012 EY ÷ 8
ticketing companies who are not part of that survey, are not included in the results. As such, thiseconomic size and scope study provides a conservative estimate of the economic contribution of theLive Performance Industry in Australia.7
This study also considers feedback from a range of industry stakeholders on the revenue and costprofiles of Live Performance events. EY have not independently verified, and do not accept anyresponsibility or liability for independently verifying the accuracy of information received from thefeedback process. Nor do we make any representation as to the accuracy or completeness of theinformation.
As part of the analysis, the 2012 data was compared to the results from Live PerformanceAustralia’s 2008 Size and Scope Study. When comparing 2012 data with that from 2008, thefollowing should be noted:
► The Non-Classical Music category was renamed to ‘Contemporary Music’ in 2011. However, thescope of performances in this category remains the same as prior years
► The regional and metropolitan venues and Key Organisations were new data providers in 2012.
► In 2009, the ‘Comedy’ and ‘Circus and Physical Theatre’ categories were introduced. As definedin Section 1.2, the Comedy category includes all comedy events such as stand up but does notinclude comedy plays, while the Circus and Physical Theatre includes Circus and PhysicalTheatre events. The introduction of these categories do not represent an extension of thescope of the Ticketing Survey, rather events which fall within these new categories would havebeen included in other categories in prior years
There are also likely to be other components to the Live Performance Industry that lie outside ofevent performances. Government funding to performing arts academies and grants to individualperformers for instance. These other elements are not captured in the analysis.
1.4 DisclaimerThis report, dated 24 February 2014, has been prepared by EY for Live Performance Australia inaccordance with our engagement agreement dated 21 June 2013. Any use of this report by thirdparties is subject to our disclaimer contained in Section 11 of this report.
7 For the value of the Live Music Industry see EY 2011, ‘Economic contribution of the venue-based live music industry inAustralia’, Report for Australasian Performing Right Association (APRA).

Live Performance AustraliaSize and Scope of the Live Performance Industry in 2012 EY ÷ 9
2. Key concepts
2.1 Economic indicatorsThree common indicators of an industry’s economic size are:
► Industry output – the market value of goods and services produced by an industry, oftenmeasured by industry turnover.
► Industry value add – the market value of goods and services produced by an industry, afterdeducting the cost of goods and services used.
► Industry employment – the number of workers directly employed by the industry, expressed interms of full time equivalent employees.
All three measures are valuable in their own right. Industry output is a measure of production, valueadd is a measure of wealth generation, and arguably, employment is a measure of the distribution ofincome.
In comparing an industry’s size against others, it is generally accepted to discuss this in terms of itsindustry value add. Industry value add measures net off the costs of production (that is, inputssourced from other sectors) from the industry’s outputs. This avoids the inclusion of revenues toother industries and any associated double counting. In practice, industry value add largelycomprises wages, salaries and the operating surplus of an industry – that is, the industry’s income.This study looks at all three measures, but attention will be placed on industry value add measureswhen making industry comparisons. The value add measure is commonly put forward as the mostappropriate measure of an industry’s contribution to the national economy.
In examining the size of an industry, it is necessary to place boundaries around what the industry is,and what it isn’t. For the purposes of this study, the Live Performance Industry is defined ascomprising:8
► Performers► Event organisers► Venue operators► Staging, equipment and repairs► Ticket service providers► Local artists that receive licence/royalty fees from productions.
Patrons, businesses, sponsors and government are effectively customers to this industry as theyprovide it with a source of funding. The other industries that provide goods and services to the LivePerformance Industry, such as advertising, merchandising and food etc. are treated as beingoutside of this industry. Revenues to these suppliers are not counted again as this would constitutedouble counting. As such this study only measures the direct contribution of the Live PerformanceIndustry and does not estimate the flow on or multiplier effects of the direct contribution. Figure 1summarises these linkages between the customers and suppliers to the Live Performance Industry.
8 To the extent that these individuals or businesses contribute to the Live Performance Industry.

Live Performance AustraliaSize and Scope of the Live Performance Industry in 2012 EY ÷ 10
Figure 1: Live Performance Industry lifecycle
2.2 Estimation approachThe economic contribution is estimated for the following four components:
► The Australian Major Performing Arts Group (AMPAG) of companies► Australia Council Key Organisations► Regional and metropolitan venues► All other live performance events (referred to as ‘large scale venues and events’).
The economic contribution of the Live Performance Industry is the sum of all four components.
This approach is adopted due to data constraints and enables different event profiles to be appliedto different components. The event profiles are in part based on assumptions regarding the costprofile of performances, ABS data and consultation with a sample of industry stakeholders, andticket revenue data from the ticketing surveys.
Industry size and scope analysis typically involves an understanding of the population of businessesin the industry, and their revenues and surpluses. However, for the Live Performance Industry, theapplication of this approach is problematic:
► The industry is rather fragmented, comprising many sole operators and small businesses. Assuch, it is difficult to obtain, with a relative degree of certainty, the true population of thesebusinesses (and their associated revenues and expenditures).
► There are many overlaps with other industries. For instance, some venue operators obtainincome from hosting Live Performance events, but also from other events such as sports.Likewise, some individuals (such as performers) do not work full-time in this industry and derivetheir livelihood from other income sources that are outside of the Live Performance Industry.9
As such, it is difficult to separate the Live Performance components from other components forthese businesses and individuals.
Given these limitations, and the data available for this study, an estimation process for the size andscope of each component of the industry has been developed and is presented over the page.
9 Throsby and Zednik 2010, ‘Do You Really Expect to Get Paid - An economic study of professional artists in Australia’ Reportfor the Australia Council for the Arts.
Government
Patrons
Businesses/Sponsors
Staging
Ticket serviceproviders
Venue Operators
Event organisers/back of house
The Live Entertainment Industry
Food andCatering
Advertisers/marketers
Electricity& Gas
Transport &Accommodation
Merchandisingsuppliers
Security
Gross Production –Measured by revenues
Costs –Measured by expenses
Industry Value Add - Measured by profit and wages
Customers of the Industry Suppliers to the Industry
Live performance artists, musicians& performers

Live Performance AustraliaSize and Scope of the Live Performance Industry in 2012 EY ÷ 11
AMPAG companies events
The size and scope of AMPAG companies is based on understanding the revenues and costsgenerated by the individual performances. Figure 2 illustrates the estimation approach for AMPAGevents.
Figure 2: Summary of estimation approach: AMPAG Events
Key Organisation events
As for AMPAG events, the economic contribution of Key Organisations is estimated based on therevenues and costs generated by the individual performances. The estimation methodology is basedon the development of a performance profile; to which the population of total Key Organisationevent performances was applied.
Regional and metropolitan venues
Individual performance data was not available for regional and metropolitan venues. Therefore, theeconomic contribution is based on the economic contribution of each regional/metropolitan venueto the live performance industry. Figure 3 summarises the estimation methodology for regional andmetropolitan venues.
Figure 3: Summary of estimation approach: Regional and metropolitan venues
Large scale venues and events
The size and scope of remaining events in the Live Performance Industry is based on the revenuesand costs generated by the individual performances. For this component of the industry, eventprofiles were estimated by event category and size given this is the largest component of theindustry with a diverse range of events including commercial theatre and contemporary music.Figure 4 summarises schematically the estimation approach for large scale venues and events.
Figure 4: Summary of estimation approach: Large scale venues and events
Details of the category size definitions and the number of performances for large scale venues andevents (by size and event category), are contained in Appendix B and Appendix C.

Live Performance AustraliaSize and Scope of the Live Performance Industry in 2012 EY ÷ 12
2.3 Data sourcesThe primary sources of data used in this study for each component of the industry were as follows:
► AMPAG – The Australia Council provided ticket and revenue data and audited financial results.
► Key Organisations –The Australia Council provided ticket and revenue data. The performanceprofile was based on stakeholder consultations and publicly available accounts data for KeyOrganisations.
► Regional and metropolitan venues – The Australian Performing Arts Centres Association(APACA) provided ticket and revenue data from their 2013 Economic Activity Report.
► Large scale venues and events – Venues and ticketing agencies provided ticket and revenuedata.
Appendix A lists the survey participants that provided ticketing and revenue data.
Other relevant data was sourced from the ABS, industry reports and stakeholder consultations.These are listed throughout the report where relevant.

Live Performance AustraliaSize and Scope of the Live Performance Industry in 2012 EY ÷ 13
3. National economic contribution
3.1 Industry revenues and expensesTable 2 below summarise the combined total revenues and expenses of the Live PerformanceIndustry. This data can be used to derive the key industry output, value add and employmentindicators of economic contribution. Further analysis of each component of the industry is providedin Chapters 4 to 7.
In aggregate, the Live Performance Industry generated a total turnover of $2.55 billion in 2012.The main revenue drivers for the industry were box office income (49.6%) and other income(28.9%); with government funding contributing 17.6% to total industry turnover.
The primary drivers of costs include wages (32.5%), contract payments to performers (19.4%) andother expenses (10.1%). Overall, the industry generated an estimated net operating surplus of$212.4 million or 8.3% of total revenues for 2012.
Large scale venues and events generated the largest total revenues ($1.68 billion or 66% of the LivePerformance Industry’s total turnover). This component also had the lowest percentage of itsincome from government (6.3%). This is in contrast with the AMPAG, Key Organisation and regionaland metropolitan components of the industry which drew between 35.0% and 45.5% of their totalrevenues from government funding.
Table 2: Live Performance Industry revenues, expenses and surpluses
Large scalevenues and
events($ millions)
AMPAG($ millions)
Regional andmetropolitan
($ millions)
KeyOrganisations
($ millions)
Total($ millions)
As % oftotal
revenue
Revenue
Box office income $1,027.0 $177.9 $51.0 $6.2 $1,262.1 49.6%
Government funding $105.2 $164.4 $166.7 $11.0 $447.3 17.6%
Corporate sponsorship and support $26.2 $64.8 $5.9 $3.0 $99.9 3.9%
Other* $521.1 $63.2 $148.3 $4.0 $736.6 28.9%
Total revenue $1,679.5 $470.2 $371.8 $24.2 $2,545.7 100.0%
Expenses
Wages (including direct wages toperformers) $424.2 $255.6 $135.9 $11.5 $827.2 32.5%
Contract payments to performers $457.4 $35.3 - $1.5 $494.2 19.4%
Rent, leasing and hiring $167.9 - - $0.7 $168.5 6.6%
Venue hire $130.6 $25.4 - $1.2 $157.2 6.2%
Travel, accommodation and vehicles $77.1 $23.3 - $2.8 $103.3 4.1%
Advertising, marketing and promotions $97.4 $46.5 $16.6 $1.4 $162.0 6.4%
Purchases $30.8 $10.8 - $0.2 $41.8 1.6%
Royalty payments $39.1 $10.2 - $0.3 $49.7 2.0%
Staging, equipment & repairs $48.4 $8.5 $13.4 $1.8 $72.0 2.8%
Other* $73.4 $41.4 $140.3 $2.5 $257.6 10.1%
Total expenses $1,546.2 $457.0 $306.2 $23.9 $2,333.3 91.7%
Operating surplus $133.3 $13.2 65.6 $0.3 212.4 8.3%
*Description of revenue and expense items can be found in Appendix D. Further detail is provided on other income andexpenses for various components of the industry in the following chapters where possible.** Total may not add due to rounding
Live Performance AustraliaSize and Scope of the Live Performance Industry in 2012 EY ÷ 14
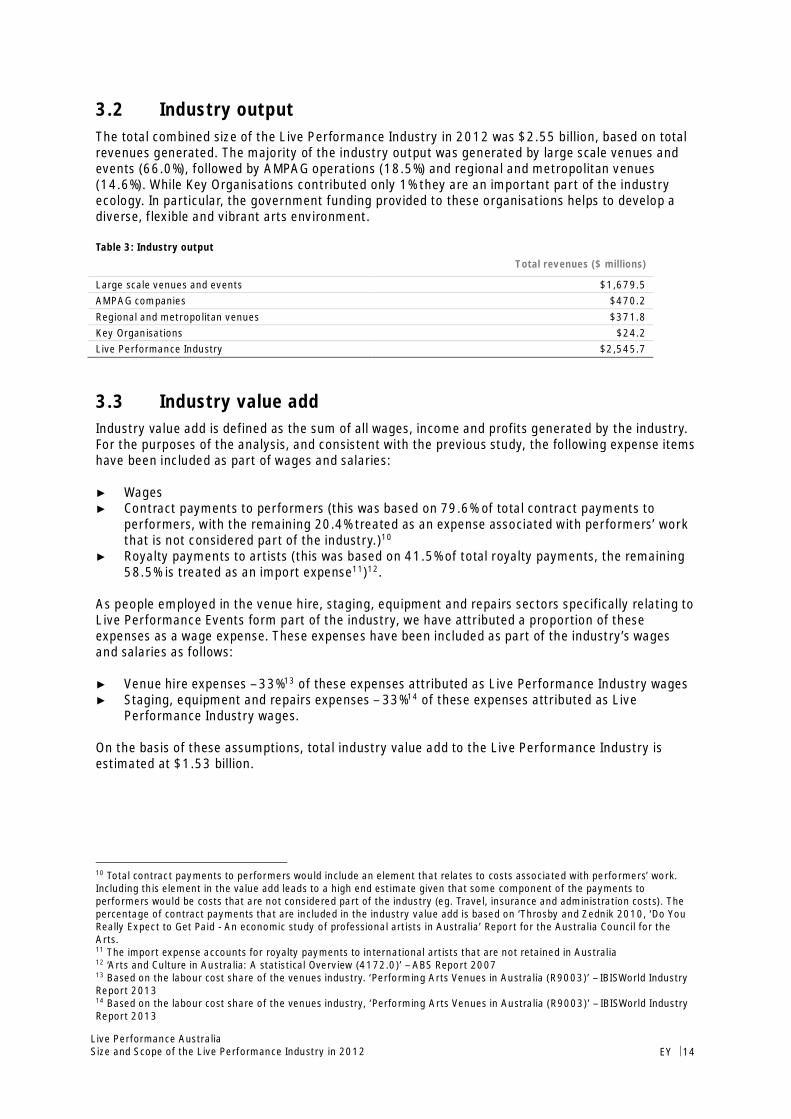
3.2 Industry outputThe total combined size of the Live Performance Industry in 2012 was $2.55 billion, based on totalrevenues generated. The majority of the industry output was generated by large scale venues andevents (66.0%), followed by AMPAG operations (18.5%) and regional and metropolitan venues(14.6%). While Key Organisations contributed only 1% they are an important part of the industryecology. In particular, the government funding provided to these organisations helps to develop adiverse, flexible and vibrant arts environment.
Table 3: Industry outputTotal revenues ($ millions)
Large scale venues and events $1,679.5AMPAG companies $470.2Regional and metropolitan venues $371.8Key Organisations $24.2Live Performance Industry $2,545.7
3.3 Industry value addIndustry value add is defined as the sum of all wages, income and profits generated by the industry.For the purposes of the analysis, and consistent with the previous study, the following expense itemshave been included as part of wages and salaries:
► Wages► Contract payments to performers (this was based on 79.6% of total contract payments to
performers, with the remaining 20.4% treated as an expense associated with performers’ workthat is not considered part of the industry.)10
► Royalty payments to artists (this was based on 41.5% of total royalty payments, the remaining58.5% is treated as an import expense11)12.
As people employed in the venue hire, staging, equipment and repairs sectors specifically relating toLive Performance Events form part of the industry, we have attributed a proportion of theseexpenses as a wage expense. These expenses have been included as part of the industry’s wagesand salaries as follows:
► Venue hire expenses – 33%13 of these expenses attributed as Live Performance Industry wages► Staging, equipment and repairs expenses – 33%14 of these expenses attributed as Live
Performance Industry wages.
On the basis of these assumptions, total industry value add to the Live Performance Industry isestimated at $1.53 billion.
10 Total contract payments to performers would include an element that relates to costs associated with performers’ work.Including this element in the value add leads to a high end estimate given that some component of the payments toperformers would be costs that are not considered part of the industry (eg. Travel, insurance and administration costs). Thepercentage of contract payments that are included in the industry value add is based on ‘Throsby and Zednik 2010, ‘Do YouReally Expect to Get Paid - An economic study of professional artists in Australia’ Report for the Australia Council for theArts.11 The import expense accounts for royalty payments to international artists that are not retained in Australia12 ‘Arts and Culture in Australia: A statistical Overview (4172.0)’ – ABS Report 200713 Based on the labour cost share of the venues industry. ‘Performing Arts Venues in Australia (R9003)’ – IBISWorld IndustryReport 201314 Based on the labour cost share of the venues industry, ‘Performing Arts Venues in Australia (R9003)’ – IBISWorld IndustryReport 2013

Live Performance AustraliaSize and Scope of the Live Performance Industry in 2012 EY ÷ 15
Table 4: Industry value add
Total ($ millions)
Wages, contract payments and royalty payments $1,241.1
Wages to venue hire, staging and equipment operations $75.6Live Performance Industry operating surplus $212.4Industry value add $1,529.1
3.4 Direct industry employmentEmployment in this industry is difficult to measure given the high degree of casualisation and part-time nature of the workforce, and the large number of businesses that make up the industry.
Industry employment is approximated by converting the industry wage amounts estimated in theprevious section into full-time equivalent (FTE) workers by applying an average labour cost per FTEstaff. The average salary needs to take into account the broad range on employees in the LivePerformance Industry and their varying wages, from the CEO of a major performing artsorganisation to part time performers. The average weekly earnings of staff in the ‘Creative andPerforming Arts Activities’ industry (as used in the previous study to estimate FTE workers) was notincluded in the ABS’s most recent data release. Other industry classifications were considered toobroad, therefore the average wage used in the previous study was inflated to 2012 dollars (based onthe wage growth for the Arts and Recreation industry). This resulted in a full time equivalent salaryof $69,432.15
Applying this estimate, total employment in this industry amounts to around 18,964 full-timeequivalent workers.
It is important to note that while the measure of FTE employment is commonly used in industry widestudies, in reality due to the part-time nature of Live Performance Industry, it sustains a greaternumber of employees on a part-time or casual basis. To estimate the total number of people directlyemployed by the industry (i.e. full-time and part-time employees) we have applied the averageweekly earnings of all employees in the industry16. This resulted in an annual wage for all employeesof $38,579. Applying this estimate, total employment in the industry is estimated at 34,131workers.
It should also be noted that the analysis presented in this section is limited by the available data.The ABS does not currently collect a detailed employment survey for the Live Performance Industry.In order to provide a more robust estimate of the true average FTE wage in the industry, additionalresearch is required, such as a detailed and comprehensive employment survey.
Table 5 provides a summary of the direct industry employment.
Table 5: Industry employment
Total
Industry wages $1,316.7 million
Average wages per FTE $69,432Industry employment (FTE) 18,964Average wages (all employees) $38,579Industry employment (persons) 34,131
15 ABS 2008, cat no 6306.0 Employee Earnings and Hours, Australia, ‘Creative and Performing Arts Activities’ (R 900) andABS 2012, cat no 6306.0 Employee Earnings and Hours, Australia ‘Arts and Recreation services’16 Weekly earnings for all employees are $741.90, based on the ‘Arts and Recreation Services’ industry in ABS 2012, cat no6306.0 Employee Earnings and Hours, Australia. The broad industry definition of ‘Arts and Recreation’ was used as datacomparable to the FTE data was not available.

Live Performance AustraliaSize and Scope of the Live Performance Industry in 2012 EY ÷ 16
3.5 Comparison with other industriesThis study estimates the total size of the Live Performance Industry at $2.55 billion in output. Theindustry generated value add of $1.53 billion, which is greater than the film, television and digitalgames, heritage activities and library services sectors in Australia (Table 6).
Table 6 Comparison with other industries
Industry Industry output($ millions)
Industry value add($ millions)
Source
Mining $237,416 $132,955 ABS (2013) 8415.0Manufacturing $397,705 $102,146 ABS (2013) 8155.0Publishing (except Internet and musicpublishing)
$13,181 $7,091 ABS (2011) 4172.0
Sports and recreation activities $12,773 $4,653 ABS (2013) 8155.0Creative and performing artsactivities*
$3,818 $1,602 ABS (2013) 8155.0
Live Performance Industry $2,546 $1,529 Ernst & YoungFilm, television and digital games $2,194 $930 ABS (2013) 8679.0Venue-based live music industry $1,211 $652 Ernst & YoungHeritage activities $$758 $353 ABS (2013) 8155.0Library and other information services $208 $199 ABS (2013) 8155.0
*The businesses that contribute to Creative and performing arts activities are classified in accordance with the ANZSICindustry definition and include performing arts operation (e.g. circus operation, dance and ballet company operation, musicalproductions and opera company operation), creative artists, musicians, writers and performers (e.g. artists, choreographyservices, costume designing, playwriting or screenwriting, set designing service and theatre lighting design service) andperforming arts venues operation. The Live Performance Industry measure includes some elements of this measure but notall.
The Live Performance Industry supports a total of around 18,964 full-time equivalent positions, or34,131 workers including full-time and part-time employees. This is greater than the 20,439 peopleemployed in film and video as their main job17.
17 Includes persons employed in motion picture and video distribution, motion picture and video production, motion pictureexhibition and post-production services and other picture and video activities (ABS 2012, cat no 6273.0 Employment inCulture, 2011)

Live Performance AustraliaSize and Scope of the Live Performance Industry in 2012 EY ÷ 17
4. Large scale venues and eventsAssumptions were developed to estimate the profit and loss position for this component of theindustry. As described in Section 2.2, the estimation methodology is based on the development of aseries of performance profiles; to which the population of total event performances were applied.Assumptions underlying the estimation approach are detailed in Appendix E.
Table 7 below shows the estimated profit and loss breakdown of the large scale venues and eventscomponent of the Live Performance Industry. The analysis indicates that these companiesgenerated $1.03 billion of ticketing income and contributed total revenues of $1.68 billion. Of this$1.68 billion, the Contemporary Music category of events generated the largest share (44%),followed by Musical Theatre (16%) and Single Category Festivals (13%).
The key revenue sources are ‘box office income’ (which includes ticketing and membershiprevenues), and ‘other’ income (which includes personal donations, orchestra hires and royaltypayments). Together these represent 61.1% and 31.0% of total revenues respectively. Governmentfunding to large scale venues and events amounted to 6.3% of total revenues.
Detailed data is not available to break down other incomes beyond what is shown in Table 7. Inaddition, other income sources may vary significantly by performance category and size. However,feedback from consultations indicated that personal donations, philanthropy, interest incomeearned, equipment hire income, workshop fees, orchestra hires, royalty payments andreimbursements and recoveries were included in other revenues. Food & beverage andmerchandising were also included but contributed only a small portion of other expenses.
With respect to expenses, contract payments to performers (27.2%), direct wages (25.3%), and rent,leasing and hiring (10.0%), were the main costs. Overall, the large scale venues and eventscomponent of the industry was more profitable compared to the AMPAG and Key Organisationcomponents, generating an operating surplus of 7.9%. This is due to the fact that this component ofthe industry comprises mainly for profit operators and capital city performing arts centres.

Live Performance AustraliaSize and Scope of the Live Performance Industry in 2012 EY ÷ 18
Table 7: Estimated profit and loss breakdown of all large scale venues and events in 2012 (excluding AMPAG, KeyOrganisations and regional and metropolitan venues)
Value($ millions) As % of totalrevenue
Revenue
Box office income $1,027.0 61.1%
Government funding $105.2 6.3%
Corporate sponsorship and support $26.2 1.6%
Other income*
Food & beverage $4.1 0.2%
Merchandising $1.0 0.1%
Other $516.0 30.7%
Sub-total other income $521.1 31.0%
Total revenue $1,679.5 100.0%
Expenses
Wages (including direct wages to performers) $424.2 25.3%
Contract payments (including to performers, artist agents, designers, etc.) $457.4 27.2%
Rent, leasing and hiring $167.9 10.0%
Venue hire $130.6 7.8%
Travel, accommodation and vehicles $77.1 4.6%
Advertising, marketing and promotions $97.4 5.8%
Purchases $30.8 1.8%
Royalty payments $39.1 2.3%
Staging, equipment & repairs $48.4 2.9%
Other $73.4 4.4%
Total expenses $1,546.2 92.1%
Operating surplus $133.3 7.9%
* Included within ‘other’ revenues is income relating to orchestra hires, royalty receipts, personal donations andmerchandising and food & beverage income.** Description of revenue and expense items are contained in Appendix D*** Total may not add due to rounding

Live Performance AustraliaSize and Scope of the Live Performance Industry in 2012 EY ÷ 19
5. AMPAG companies
Assumptions were developed to estimate the profit and loss position for the AMPAG component ofthe industry. As described in Section 2.2, the estimation methodology is based on the developmentof a performance profile18; to which the population of total event performances was applied.
The AMPAG companies generated $177.9 million of ticketing and membership income andcontributed total revenues of $470.2 million. Opera, Classical Music and Theatre events were thelargest categories for the AMPAG companies, and combined accounted for 70% of the total output.
The main sources of income for AMPAG companies were ticketing and membership revenues (or boxoffice income), and government funding, which represent 37.8% and 35.0% of total revenuerespectively.
On the expenses side, direct wages (54.4%) were the main cost, followed by advertising andmarketing (9.9%). Overall, the AMPAG companies generated a net operating surplus of 2.8% or$13.2 million.
Table 8: Estimated profit and loss breakdown for Australia Council AMPAG companies
Value($ millions)
As % of totalrevenue
Revenue
Box office income $177.9 37.8%
Government funding $164.4 35.0%
Corporate sponsorship and support $64.8 13.8%
Other* $63.2 13.4%
Total revenue $470.2 100.0%
Expenses
Wages (including direct wages to performers and venue staff) $255.6 54.4%
Contract payments (including to performers, artist agents, designers, etc.) $35.3 7.5%
Venue hire $25.4 5.4%
Travel, accommodation and vehicles $23.3 5.0%
Advertising, marketing and promotions $46.5 9.9%
Purchases $10.8 2.3%
Royalty payments $10.2 2.2%
Staging, equipment & repairs $8.5 1.8%
Other $41.4 8.8%
Total expenses $457.0 97.2%
Net profit/loss before tax $13.2 2.8%
* Included within ‘Other’ revenues is income relating to orchestra hires, royalty receipts and merchandising income.** Total may not add due to rounding*** Description of revenue and expense items are contained in Appendix D
18 The performance profile for the AMPAG component was based on the audited financial accounts provided by the AustraliaCouncil

Live Performance AustraliaSize and Scope of the Live Performance Industry in 2012 EY ÷ 20
6. Regional and metropolitan venuesData on regional and metropolitan venues was obtained from the Australian Performing ArtsCentres Association’s (APACA) Economic Activity Survey. Assumptions were developed to estimatethe profit and loss position for regional and metropolitan venues component of the industry. Asdescribed in Section 2.2, the estimation methodology is based on the development of a single venueprofile19; to which the population of total venues was applied.
Table 9 shows the estimated profit and loss breakdown for regional and metropolitan venues. Theanalysis indicates that regional and metropolitan venues contributed total revenues of $371.8million.
The key revenue sources for regional and metropolitan venues were government funding (44.8%)and ‘other’ income (which includes personal donations, venue hire, food & beverage and ticketingservices) (39.9%). Box office income was a smaller component of income for regional andmetropolitan venues, accounting for 13.7% of total revenues.
With respect to expenses, direct wages (36.6%) and ‘other’ expenses (37.7%) were the main costs.
Overall, the regional and metropolitan venues generated an operating surplus of 17.7%. However, asnoted by APACA, there are difficulties collating financial data for regional and metropolitan venues,as local government venues and venues managed by separate legal entities will often treatoperating deficits and surpluses in varying ways20. In addition, the net operating surplus for regionaland metropolitan venues has fluctuated considerably over the last few years. Although the revenuedata in the 2013 Economic Activity Report is consistent with the 2011 Economic Activity Survey,the net operating surplus is considerably higher than previous surveys (17.7% surplus in the 2013report compared to 1.4% surplus in the 2011 report) due to lower expenses.
19 The venue profile was based the financial overview for performing arts centres in APACA 2013, Economic Activity Report20 APACA 2013, Economic Activity Report

Live Performance AustraliaSize and Scope of the Live Performance Industry in 2012 EY ÷ 21
Table 9: Estimated profit and loss breakdown for regional and metropolitan venues in 2012
Value ($ millions) As % of total revenue
Revenue
Box office income $51.0 13.7%Government funding $166.7 44.8%Corporate sponsorship and support $5.9 1.6%Other income
Food & beverage $22.7 6.1%Ticketing services $22.8 6.1%Venue hire $36.4 9.8%Philanthropic trusts, donations and fundraising $4.6 1.2%Other* $61.7 16.6%
Sub-total other income** $148.3 39.9%
Total revenue** $371.8 100.0%
Expenses
Wages (including direct wages to performers) $135.9 36.6%Advertising, marketing and promotions $16.6 4.5%Staging, equipment & repairs $13.4 3.6%Other expenses
Administration $32.2 8.7%Food & beverage $13.1 3.5%Program expenditure $22.1 5.9%Show purchases $30.4 8.2%Other $42.5 11.4%
Sub-total other expenses $140.3 37.7%
Total expenses** $306.2 82.4%
Operating surplus 65.6 17.65%
* Included within ‘other’ revenues is income relating to contract performance fees, recoverables, merchandise and interestincome.**Total may not add due to rounding***Description of revenue and expense items are contained in Appendix D

Live Performance AustraliaSize and Scope of the Live Performance Industry in 2012 EY ÷ 22
7. Key OrganisationsAssumptions were developed to estimate the profit and loss position for the Key Organisationscomponent of the industry. As described in Section 2.2, the estimation methodology is based on thedevelopment of a single performance profile21; to which the population of total event performanceswas applied.
Table 10 below shows the estimated profit and loss breakdown of the Key Organisations componentof the Live Performance Industry. The analysis indicates that the Key Organisations contributedtotal revenues of $24.2 million. The Theatre category was the largest component for KeyOrganisations, accounting for 45% of total output.
The key revenue source for Key Organisations is government funding (45.5%), followed by box officeincome (25.7%). Corporate sponsorship and support was the smallest component of income for KeyOrganisations, amounting to 12.2% of total revenues. With respect to expenses, direct wages(47.3%) were the main cost. This was followed by travel, accommodation and vehicles (11.6%) and‘other’ costs (10.4%).
Overall, the Key Organisations component of the industry was the least profitable, generating anestimated operating surplus of 1.3%. This is consistent with the not-for-profit status of KeyOrganisations and their focus on the economically intensive development of new work. The KeyOrganisations are integral to the overall ecology of the industry, as they provide opportunities foremerging artists, create work for national and international touring and sometimes act as a steppingstone to larger scale work with the AMPAG companies.
Table 10: Estimated profit and loss breakdown for Australia Council Key Organisations in 2012 Value($ millions)
As % oftotal
revenue
Revenue
Box office income $6.2 25.7%Government funding $11.0 45.5%Corporate sponsorship and support $3.0 12.2%Other* $4.0 16.5%
Total revenue $24.2 100.0%
Expenses
Wages (including direct wages to performers) $11.5 47.3%Contract payments to performers (including to performers, artist agents, designers, etc.) $1.5 6.3%Rent, leasing and hiring $0.7 2.8%Venue hire $1.2 5.0%Travel, accommodation and vehicles $2.8 11.6%Advertising, marketing and promotions $1.4 5.9%Purchases $0.2 0.8%Royalty payments $0.3 1.4%Staging, equipment & repairs $1.8 7.2%Other $2.5 10.4%
Total expenses $23.9 98.7%
Operating surplus $0.3 1.3%
* Included within ‘other’ revenues is income relating to orchestra hires, royalty receipts and merchandising and food &beverage income.**Total may not add due to rounding***Description of revenue and expense items are contained in Appendix D
21 The performance profile for Key Organisations was based on stakeholder consultations and publicly available accounts datafor Key Organisations.

Live Performance AustraliaSize and Scope of the Live Performance Industry in 2012 EY ÷ 23
8. Economic contribution by State andTerritory
8.1 Overall resultsThe analysis below examines the economic contribution of the Live Performance Industry to thestates and territories around Australia.
Table 11 shows the industry output and industry value add of the Live Performance Industry on astate and territory basis.
The states which generated the largest share of industry output were New South Wales and Victoria,which represent 38.0% and 27.3% respectively of the national total. These states generated asimilar share of value add. In NSW, it is estimated that the Live Performance Industry contributed$586.5 million to the state economy or 38.4% of the national total. In Victoria, the industrycontributed $422.4 million to the state or 27.6% of the national total.
Of the other states, the industry contributed $236.5 million, $161.7 million and $87.9 million tothe economies of Queensland, Western Australia and South Australia respectively.
Table 11: Live Performance Industry economic contribution by State/Territory
Industry output($ millions)
% Share of industryoutput
Industry value add($ millions) % Share of value add
NSW 967.4 38.0% 586.5 38.4%VIC 693.8 27.3% 422.4 27.6%QLD 400.1 15.7% 236.5 15.5%WA 275.6 10.8% 161.7 10.6%SA 151.3 5.9% 87.9 5.7%ACT 32.1 1.3% 19.4 1.3%TAS 22.7 0.9% 13.2 0.9%NT 2.7 0.1% 1.5 0.1%Total 2,545.7 100.0% 1,529.1 100.0%
*Total may not add due to rounding

Live Performance AustraliaSize and Scope of the Live Performance Industry in 2012 EY ÷ 24
Figure 5: Share of industry value add by State and Territory
* Value Add for the purposes of this report has been attributed to the state in which the event is held. Typically, however ValueAdd is calculated based on the location of the business. For example, the methodology used in this report has assumed that aVictorian artist performing in Western Australia will be treated as Western Australian value add, as no data was availablerelating to where businesses and artists are based.
8.2 Per capita resultsA comparison of each State and Territory’s share of the Live Performance Industry against theirpopulations provides insight into the concentration of the Industry relative to where people live.Table 12 shows that New South Wales and Victoria generate a larger share of industry value addcompared to their share of Australia’s population. Western Australia’s share of industry value addwas similar to its share of the population. All other states and territories comprise a smaller share ofnational value add compared to their population.
Table 12: Population and per capita results
State/ Territory Population (2012)(millions) Share of population Share of industry value
addIndustry value add per
capita
NSW 7.35 32.1% 38.4% $79.79
VIC 5.68 24.8% 27.6% $74.36
QLD 4.61 20.1% 15.5% $51.31
WA 2.47 10.8% 10.6% $65.45
SA 1.66 7.3% 5.7% $52.95
ACT 0.38 1.7% 1.3% $51.00
TAS 0.51 2.2% 0.9% $25.97
NT 0.23 1.0% 0.1% $6.62
Total 22.89 100.0% 100.0% $66.80
*Total may not add due to rounding
38.4%
27.6%
15.5%
10.6%
5.7%
1.3%0.9% 0.1%
NSW
VIC
QLD
WA
SA
ACT
TAS
NT

Live Performance AustraliaSize and Scope of the Live Performance Industry in 2012 EY ÷ 25
There are several possible explanations for these disproportional results, including:
► Many performances take place exclusively in major cities along the more densely populatedeastern seaboard. For example, Coldplay only brought its large stadium tour to Sydney,Melbourne and Brisbane. At a high level, this reflects the economic and logistical advantagesthat big cities hold in their capability to stage major events
► Some of Australia’s largest performing arts companies are based in New South Wales andVictoria, including Opera Australia (Sydney), Melbourne Symphony Orchestra, SydneySymphony and The Australian Ballet (Melbourne), and as such the bulk of their performancesare in Sydney and Melbourne.
► Destination NSW and The Victorian Major Events Company are particularly active in the majorevents market and as such have been successful in attracting major events to these states
► Cities such as Brisbane and Perth are constrained in their ability to host performances due to asmaller number of venues and hence capacity, compared to Melbourne for example.
It should be noted that these state and territory breakdowns do not take into account people whotravel from interstate or overseas to watch a live performance. Industry share only accounts for thestate or territory in which the performance took place and hence where the revenue and attendanceare recognised.

Live Performance AustraliaSize and Scope of the Live Performance Industry in 2012 EY ÷ 26
9. Economic contribution by event categoryThis chapter looks at the economic contribution of the Live Performance Industry by eventcategories.
Table 13 below shows that the two largest event categories of the industry were ContemporaryMusic and Musical Theatre. The Contemporary Music category, by far the largest performancecategory, generated output of $830.9 million. In terms of value add, the category contributed$564.0 million to the Australian economy, representing 36.9% of the total value add by the industry.This was followed by the Musical Theatre which created output of $371.8 million and value add of$186.3, representing 12.2% of the total value add of the Live Performance Industry.
Table 13: Live Performance Economic Contribution by Category
Category Industry output($ millions)
% Share ofindustry output
Value add($ millions)
% Share ofvalue add
Direct industryemployment
(no FTEs)
Contemporary Music $830.9 32.6% $564.0 36.9% 6,962
Musical Theatre $371.8 14.6% $186.4 12.2% 2,282
Theatre $221.3 8.7% $128.3 8.4% 1,673
Ballet and Dance $204.4 8.0% $123.0 8.0% 1,537
Festival (Single Category) $227.6 8.9% $112.6 7.4% 1,344
Classical Music $170.0 6.7% $110.9 7.3% 1,501
Opera $132.0 5.2% $86.6 5.7% 1,185
Circus & Physical Theatre $117.7 4.6% $74.7 4.9% 1,025
Comedy $105.2 4.1% $56.1 3.7% 503
Children’s/Family $88.5 3.5% $45.3 3.0% 479
Festival (Multi Category) $43.0 1.7% $22.9 1.5% 294
Special Events $33.5 1.3% $18.4 1.2% 178
Total $2,545.7 100.0% $1,529.1 100.0% 18,964
* Employment estimates by event category are high level only and do not take into account differences in average wages bycategory.** Total may not add due to rounding
Figure 6: Share of value add by event category
8.0% 3.0%
4.9%
7.3%
3.7%
36.9%1.5%
7.4%
12.2%
5.7%
1.2%8.4%
Ballet and Dance
Childrens/Family
Circus & Physical Theatre
Classical Music
Comedy
Contemporary Music
Festival (Multi Category)
Festival (Single Category)
Musical Theatre
Opera
Special Events
Theatre

Live Performance AustraliaSize and Scope of the Live Performance Industry in 2012 EY ÷ 27
10. Comparison to 2008 dataThis section compares the size and scope of the industry with the results in the previous study. Asmentioned in Section 1.3, when comparing 2012 data with that from 2008, the following should benoted:
► The regional and metropolitan venues and Key Organisations were new data providers in 2012.In order to compare the 2012 and 2008 results, these have been removed from the 2012 dataset.
► In 2009, the ‘Comedy’ and ‘Circus and Physical Theatre’ categories were introduced. Theintroduction of these categories does not represent an extension of the scope of the currentstudy, rather events which fall within these new categories would have been included in othercategories in the previous Size and Scope Study.
► The Non-Classical Music category was renamed to ‘Contemporary Music’ in 2011. However, thescope of performances in this category remains the same as prior years
10.1 National economic contributionRegional and metropolitan venues and Key Organisations made significant contributions to the LivePerformance Industry in the current analysis ($371.8 million and $24.2 million in total revenuerespectively). However, their contribution should not be considered as growth in the industry, giventhey were new data providers in 2012. Removing the impact of this new data, the output of the LivePerformance Industry has experienced real growth of 3% since 2008, or $65.5 million (Table 14).
The size of the industry in terms of value add and employment has grown more strongly since 2008.Excluding Key Organisations and regional and metropolitan venues, value add has experienced realgrowth of 17%. This growth has been driven by increased overall industry wages, and an estimated21% increase in the number of full time equivalent employees (or 2,926 FTE positions).
The following factors have contributed to the increase in the estimated number of full timeequivalent employees in the Live Performance Industry since 2008:
► Industry wages as a percentage of revenue have increased since 2008. The expense item‘wages (including direct wages to performers)’ increased from 28% in 2008 to 32% in 2012.This increased wage pressure was reflected in stakeholder consultations. In addition, the wagecomponent of contract payments to performers increased (in the previous study a largeramount was treated as an expense).
► The average FTE wage has grown more modestly over the period.
The positive growth in the industry is consistent with changes in box office income and attendanceat events since 2008. Although box office income and attendance declined in 2012 compared to2011, both were still above the lows of 200822. In the context of these fluctuations in the industryover the past five years, primarily driven by weaker economic conditions in Australia and overseas,achieving real growth above consumer price inflation is a good result23. As noted in the TicketAttendance and Revenue Survey, participation in the Arts, including the Live Performance Industry,is particularly sensitive to changes in the growth of real household disposable income24.
22 Live Performance Australia (2013) Ticketing Attendance and Revenue Survey 201223 The consumer price index rose by 10.4% between December 2008 and December 201224 ‘Music and Theatre Productions in Australia’ IBISWorld Industry Report (August 2010), p4.
Live Performance AustraliaSize and Scope of the Live Performance Industry in 2012 EY ÷ 28
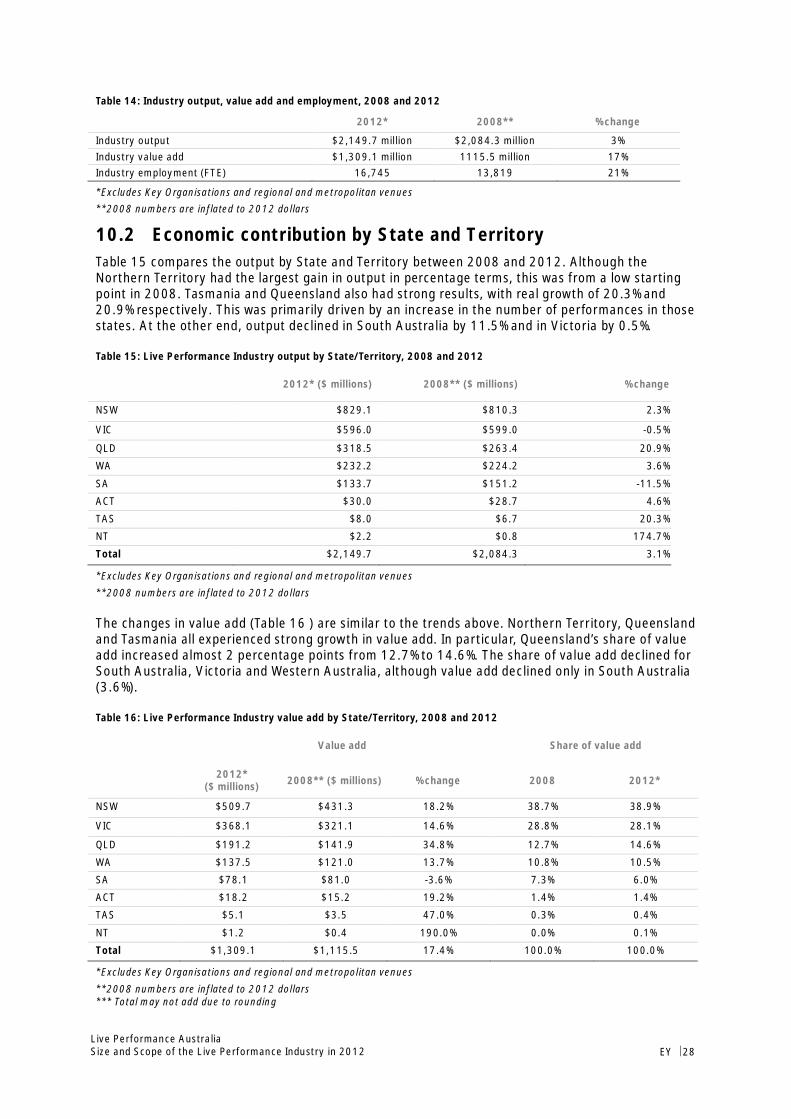
Table 14: Industry output, value add and employment, 2008 and 2012
2012* 2008** % change
Industry output $2,149.7 million $2,084.3 million 3%Industry value add $1,309.1 million 1115.5 million 17%Industry employment (FTE) 16,745 13,819 21%
*Excludes Key Organisations and regional and metropolitan venues**2008 numbers are inflated to 2012 dollars
10.2 Economic contribution by State and TerritoryTable 15 compares the output by State and Territory between 2008 and 2012. Although theNorthern Territory had the largest gain in output in percentage terms, this was from a low startingpoint in 2008. Tasmania and Queensland also had strong results, with real growth of 20.3% and20.9% respectively. This was primarily driven by an increase in the number of performances in thosestates. At the other end, output declined in South Australia by 11.5% and in Victoria by 0.5%.
Table 15: Live Performance Industry output by State/Territory, 2008 and 2012
2012* ($ millions) 2008** ($ millions) % change
NSW $829.1 $810.3 2.3%
VIC $596.0 $599.0 -0.5%
QLD $318.5 $263.4 20.9%
WA $232.2 $224.2 3.6%
SA $133.7 $151.2 -11.5%
ACT $30.0 $28.7 4.6%
TAS $8.0 $6.7 20.3%
NT $2.2 $0.8 174.7%
Total $2,149.7 $2,084.3 3.1%
*Excludes Key Organisations and regional and metropolitan venues**2008 numbers are inflated to 2012 dollars
The changes in value add (Table 16 ) are similar to the trends above. Northern Territory, Queenslandand Tasmania all experienced strong growth in value add. In particular, Queensland’s share of valueadd increased almost 2 percentage points from 12.7% to 14.6%. The share of value add declined forSouth Australia, Victoria and Western Australia, although value add declined only in South Australia(3.6%).
Table 16: Live Performance Industry value add by State/Territory, 2008 and 2012
Value add Share of value add
2012*($ millions) 2008** ($ millions) % change 2008 2012*
NSW $509.7 $431.3 18.2% 38.7% 38.9%
VIC $368.1 $321.1 14.6% 28.8% 28.1%
QLD $191.2 $141.9 34.8% 12.7% 14.6%
WA $137.5 $121.0 13.7% 10.8% 10.5%
SA $78.1 $81.0 -3.6% 7.3% 6.0%
ACT $18.2 $15.2 19.2% 1.4% 1.4%
TAS $5.1 $3.5 47.0% 0.3% 0.4%
NT $1.2 $0.4 190.0% 0.0% 0.1%
Total $1,309.1 $1,115.5 17.4% 100.0% 100.0%
*Excludes Key Organisations and regional and metropolitan venues**2008 numbers are inflated to 2012 dollars*** Total may not add due to rounding

Live Performance AustraliaSize and Scope of the Live Performance Industry in 2012 EY ÷ 29
10.3 Economic contribution by event categoryTable 17 compares the output by event category between 2008 and 2012. The changes to thecontribution are also highlighted in Figure 7and Figure 8.
Single Category Festivals, Ballet and Dance and Opera experienced the largest percentage growth inoutput since 2008. In terms of the dollar value change, Contemporary Music also experienced alarge increase.
Special Events, Classical Music, Multi Category Festival and Musical Theatre events experienced realdeclines in output between 2008 and 2012. The Special Events category experienced the largestdecline in percentage terms. However this category is particularly variable from year to year, and ishighly dependent on whether performances take place that cannot be classified elsewhere. ClassicalMusic also experienced a particularly large decline (55.4%), which can be attributed to the bumperyear for Classical Music in 2008. This category experienced a spike in revenues and attendances in2008 largely due to two international artists (Andre Rieu and Andrea Bocelli) performing a largenumber of events in Australia.
Table 17: Live Performance Industry output by event category, 2008 and 2012
2012* ($ millions) 2008** ($ millions) % change
Contemporary Music $753.0 $722.0 4.3%
Musical Theatre $315.9 $424.1 -25.5%
Festival (Single Category) $215.0 $164.6 30.6%
Theatre $173.3 $169.9 2.0%
Circus & Physical Theatre^ $147.4
Ballet and Dance $135.9 $115.4 17.7%
Opera $127.4 $109.7 16.1%
Classical Music $108.7 $243.7 -55.4%
Comedy^ $66.1
Children’s/Family $63.5 $62.2 2.2%
Festival (Multi Category) $37.0 $55.4 -33.2%
Special Events $6.5 $17.2 -61.9%
Total $2,149.7 $2,084.3 3.1%
*Excludes Key Organisations and regional and metropolitan venues**2008 numbers are inflated to 2012 dollars***Total may not add due to rounding^ These event categories were added in 2009

Live Performance AustraliaSize and Scope of the Live Performance Industry in 2012 EY ÷ 30
Figure 7: 2008* to 2012 percentage change in industry contribution by category
*2008 numbers are inflated to 2012 dollars
Figure 8: 2008* to 2012 dollar value change in industry contribution by category ($ millions)
*2008 numbers are inflated to 2012 dollars
-61.9%
-55.4%
-33.2%
-25.5%
2.0%
2.2%
4.3%
16.1%
17.7%
30.6%
Special Events
Classical Music
Festival (Multi Category)
Musical Theatre
Theatre
Childrens/Family
Contemporary Music
Opera
Ballet and Dance
Festival (Single Category)
-80.0% -60.0% -40.0% -20.0% 0.0% 20.0% 40.0%
-$135.0-$108.2
-$18.4-$10.6
$1.3$3.5
$17.6$20.4
$31.0$50.4
Classical MusicMusical Theatre
Festival (Multi Category)Special Events
Childrens/FamilyTheatre
OperaBallet and Dance
Contemporary MusicFestival (Single Category)
-$175.0 -$125.0 -$75.0 -$25.0 $25.0 $75.0

Live Performance AustraliaSize and Scope of the Live Performance Industry in 2012 EY ÷ 31
11. DisclaimerErnst & Young ("Consultant" or EY) was engaged on the instructions of Live Performance Australia("Client") to undertake an economic size and scope study of the live performance industry inAustralia ("Project"), in accordance with the engagement agreement dated 21 June 2013 includingthe General Terms and Conditions (“the Engagement Agreement”).
The results of the Consultant’s work, including the assumptions and qualifications made in preparingthe report, are set out in the Consultant's report dated 24 February 2014 ("Report"). You shouldread the Report in its entirety including any disclaimers and attachments. A reference to the Reportincludes any part of the Report. No further work has been undertaken by the Consultant since thedate of the Report to update it.
Unless otherwise agreed in writing with the Consultant, access to the Report is made only on thefollowing basis and in either accessing the Report or obtaining a copy of the Report the recipientagrees to the following terms.
1. Subject to the provisions of this notice, the Report has been prepared for the Client and maynot be disclosed to any other party or used by any other party or relied upon by any otherparty without the prior written consent of the Consultant.
2. The Consultant disclaims all liability in relation to any other party who seeks to rely upon theReport or any of its contents.
3. The Consultant has acted in accordance with the instructions of the Client in conducting itswork and preparing the Report, and, in doing so, has prepared the Report for the benefit ofthe Client, and has considered only the interests of the Client. The Consultant has not beenengaged to act, and has not acted, as advisor to any other party. Accordingly, the Consultantmakes no representations as to the appropriateness, accuracy or completeness of the Reportfor any other party's purposes.
4. No reliance may be placed upon the Report or any of its contents by any recipient of theReport for any purpose and any party receiving a copy of the Report must make and rely ontheir own enquiries in relation to the issues to which the Report relates, the contents of theReport and all matters arising from or relating to or in any way connected with the Report orits contents.
5. The Report is confidential and must be maintained in the strictest confidence and must not bedisclosed to any party for any purpose without the prior written consent of the Consultant.
6. No duty of care is owed by the Consultant to any recipient of the Report in respect of any usethat the recipient may make of the Report.
7. The Consultant disclaims all liability, and takes no responsibility, for any document issued byany other party in connection with the Project.
8. No claim or demand or any actions or proceedings may be brought against the Consultantarising from or connected with the contents of the Report or the provision of the Report toany recipient. The Consultant will be released and forever discharged from any such claims,demands, actions or proceedings.
9. To the fullest extent permitted by law, the recipient of the Report shall be liable for all claims,demands, actions, proceedings, costs, expenses, loss, damage and liability made against orbrought against or incurred by the Consultant arising from or connected with the Report, thecontents of the Report or the provision of the Report to the recipient.

Live Performance AustraliaSize and Scope of the Live Performance Industry in 2012 EY ÷ 32
10. In the event that a recipient wishes to rely upon the Report that party must inform theConsultant and, if the Consultant so agrees, sign and return to the Consultant a standard formof the Consultant’s reliance letter. A copy of the reliance letter can be obtained from theConsultant. The recipient’s reliance upon the Report will be governed by the terms of thatreliance letter.
Live Performance AustraliaSize and Scope of the Live Performance Industry in 2012 EY ÷ 33
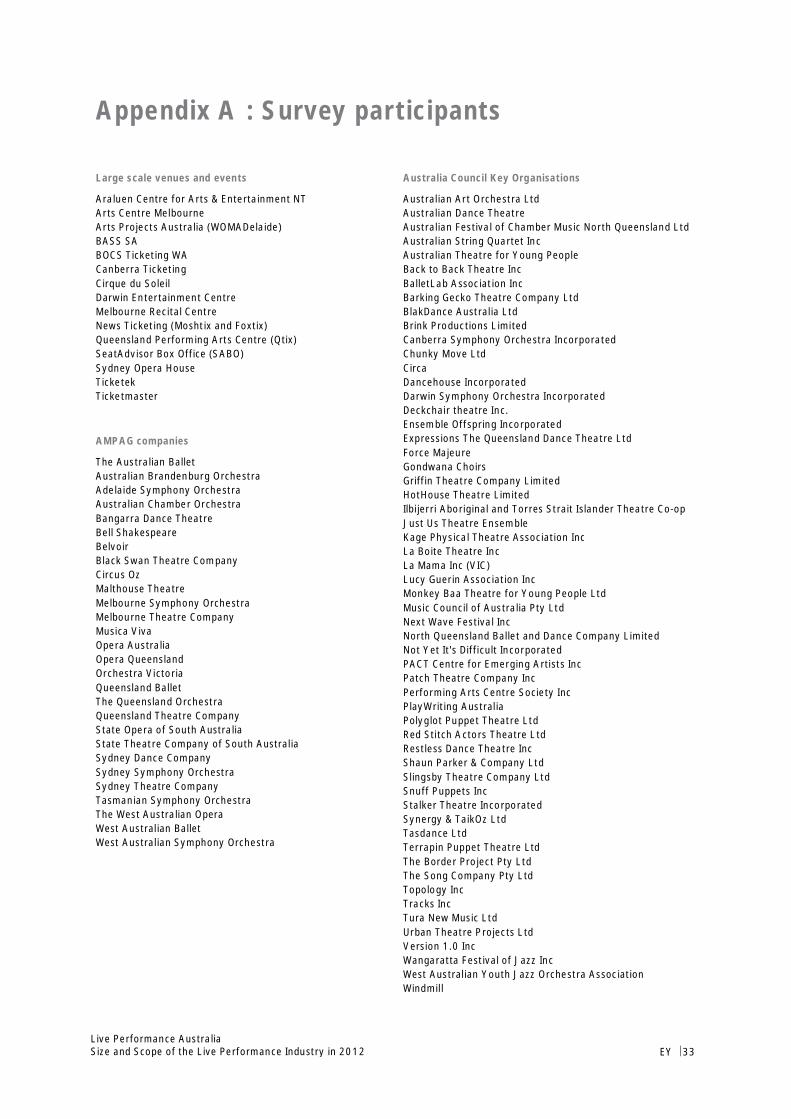
Appendix A : Survey participants
Large scale venues and events
Araluen Centre for Arts & Entertainment NTArts Centre MelbourneArts Projects Australia (WOMADelaide)BASS SABOCS Ticketing WACanberra TicketingCirque du SoleilDarwin Entertainment CentreMelbourne Recital CentreNews Ticketing (Moshtix and Foxtix)Queensland Performing Arts Centre (Qtix)SeatAdvisor Box Office (SABO)Sydney Opera HouseTicketekTicketmaster
AMPAG companies
The Australian BalletAustralian Brandenburg OrchestraAdelaide Symphony OrchestraAustralian Chamber OrchestraBangarra Dance TheatreBell ShakespeareBelvoirBlack Swan Theatre CompanyCircus OzMalthouse TheatreMelbourne Symphony OrchestraMelbourne Theatre CompanyMusica VivaOpera AustraliaOpera QueenslandOrchestra VictoriaQueensland BalletThe Queensland OrchestraQueensland Theatre CompanyState Opera of South AustraliaState Theatre Company of South AustraliaSydney Dance CompanySydney Symphony OrchestraSydney Theatre CompanyTasmanian Symphony OrchestraThe West Australian OperaWest Australian BalletWest Australian Symphony Orchestra
Australia Council Key Organisations
Australian Art Orchestra LtdAustralian Dance TheatreAustralian Festival of Chamber Music North Queensland LtdAustralian String Quartet IncAustralian Theatre for Young PeopleBack to Back Theatre IncBalletLab Association IncBarking Gecko Theatre Company LtdBlakDance Australia LtdBrink Productions LimitedCanberra Symphony Orchestra IncorporatedChunky Move LtdCircaDancehouse IncorporatedDarwin Symphony Orchestra IncorporatedDeckchair theatre Inc.Ensemble Offspring IncorporatedExpressions The Queensland Dance Theatre LtdForce MajeureGondwana ChoirsGriffin Theatre Company LimitedHotHouse Theatre LimitedIlbijerri Aboriginal and Torres Strait Islander Theatre Co-opJust Us Theatre EnsembleKage Physical Theatre Association IncLa Boite Theatre IncLa Mama Inc (VIC)Lucy Guerin Association IncMonkey Baa Theatre for Young People LtdMusic Council of Australia Pty LtdNext Wave Festival IncNorth Queensland Ballet and Dance Company LimitedNot Yet It's Difficult IncorporatedPACT Centre for Emerging Artists IncPatch Theatre Company IncPerforming Arts Centre Society IncPlayWriting AustraliaPolyglot Puppet Theatre LtdRed Stitch Actors Theatre LtdRestless Dance Theatre IncShaun Parker & Company LtdSlingsby Theatre Company LtdSnuff Puppets IncStalker Theatre IncorporatedSynergy & TaikOz LtdTasdance LtdTerrapin Puppet Theatre LtdThe Border Project Pty LtdThe Song Company Pty LtdTopology IncTracks IncTura New Music LtdUrban Theatre Projects LtdVersion 1.0 IncWangaratta Festival of Jazz IncWest Australian Youth Jazz Orchestra AssociationWindmill

Live Performance AustraliaSize and Scope of the Live Performance Industry in 2012 EY ÷ 34
APACA regional and metropolitan venues
New South WalesBathurst Memorial Entertainment CentreCapitol Theatre TamworthCasula PowerhouseCity Recital Hall Angel PlaceCivic Precinct TheatreDubbo Regional Theatre and Convention CentreGlen Street TheatreGriffith Regional TheatreIllawarra Performing Arts CentreJoan Sutherland Performing Arts CentreNORPA, Northern Rivers Performing ArtsOrange Civic TheatreRiverside Theatres ParramattaShoalhaven Entertainment CentreSutherland Entertainment CentreThe Glasshouse Arts Conference and Entertainment CentreZenith Theatre & Convention Centre
VictoriaColac Otway Performing Arts and Cultural CentreDarebin Arts and Entertainment CentreDrum TheatreEastbank Centre - Riverlinks VenuesESSO BHP Billiton Wellington Entertainment CentreFrankston Arts CentreGeelong Performing Arts CentreHamilton Performing Arts CentreKarralyka CentreKingston Arts CentreKyneton Arts CentreLighthouse TheatreMildura Arts CentreSwan Hill Town Hall Performing Arts and Convention CentreThe Capital - Bendigo's Performing Arts CentreThe Cube WodongaWhitehorse Performing Arts CentreWyndham Cultural Centre
QueenslandBrolga TheatreCairns Civic TheatreCentre of Contemporary Arts CairnsEmpire TheatreGladstone Entertainment CentreJudith Wright Centre of Contemporary ArtsMackay Entertainment & Convention CentreMount Isa Civic TheatrePilbeam TheatreQUT Gardens Theatre
Redland Performing Arts CentreRoundhouse TheatreThe Arts Centre Gold CoastThe Events CentreTownsville Civic Theatre
Western AustraliaArts Margaret River Margaret River Cultural CentreBroome Civic CentreBunbury Regional Entertainment CentreCarnarvon Civic CentreDon Russell Performing Arts CentreEsperance Civic CentreKalamunda Performing Arts CentreKoorliny Arts CentreMandurah Performing Arts CentreMatt Dann Cultural CentreQueens Park TheatreUniversity Theatres - University of Western Australia
South AustraliaBarossa Arts & Convention CentreCountry Arts South AustraliaMarion Cultural CentreMiddleback TheatreMurray Bridge Town HallNorthern Festival TheatreSir Robert Helpmann TheatreThe Hopgood Theatre
Australian Capital TerritoryStreet TheatreTuggeranong Arts Centre
TasmaniaDevonport Entertainment and Convention CentreTheatre Royal

Live Performance AustraliaSize and Scope of the Live Performance Industry in 2012 EY ÷ 35
Appendix B: Category size definitionsFor the purposes of this study, large scale venues and event performances were categorised by size(revenue) to understand whether different cost structure exist for events of difference sizes. Thereis no formal industry definition of event size categories. As such EY grouped events according toLarge, Medium and Small categories based on box office revenues per performance.
The thresholds for each of these were based on our assessment of the entire population ofperformances in each category and ranking them by their revenues, and making judgements onnoticeable size categories in the data. The size thresholds presented below have been determinedbased on a combination of feedback from stakeholder consultations and Ernst & Young’s ownanalysis of the data.
Table 18: Category size thresholds – box office income per performance
Small Medium LargeBallet and Dance $0-13,000 $13,000–43,000 $43,000 and aboveChildren/Family $0–7,000 $7,000–31,000 $31,000 and aboveClassical Music $0–3,000 $3,000–11,000 $11,000 and aboveFestivals Multi Category $0–4,000 $4,000–$14,000 $14,000 and aboveFestivals Single Category $0–150,000 $150,000–$349,000 $349,000 and aboveMusical Theatre $0–70,000 $70,000–165,000 $165,000 and aboveNon Classical Music $0–5,000 $5,000–94,000 $94,000 and aboveOpera $0–9,000 $9,000–29,000 $29,000 and aboveTheatre $0–15,000 $15,000–43,000 $43,000 and aboveSpecial Events/Other $0–5,000 $5,000–68,0000 $68,000 and aboveCircus & Physical Theatre $0–30,000 $30,000–217,000 $217,000 and aboveComedy $0–5,000 $5,000–54,000 $54,000 and above

Live Performance AustraliaSize and Scope of the Live Performance Industry in 2012 EY ÷ 36
Appendix C: Number of performances byindustry component and eventcategory
The table below presents the number of events by industry component and event category. For largescale venues and events, the number of performances is also shown by size. This is based on theevent sizes defined in Appendix B and the data provided by ticketing companies.
Table 19: No. of Performances in Event Profiles
AMPAG KeyOrganisations
Large scale venues and events
Small Medium Large
Ballet and Dance 462 231 609 311 253
Children’s/Family 62 299 1,731 489 353
Classical Music 882 100 741 282 264
Festivals (Multi Category) 193 1,038 315 346
Festivals (Single Category) 2 194 855 47 41
Musical Theatre 156 28 1,888 770 283
Contemporary Music 42 52 2,944* 3,123 790
Opera 327 4 137 57 44
Theatre 2,918 2,250 1,668 352 366
Special Events/Other 156 436 49 23
Circus & Physical Theatre 67 36 927 80 159
Comedy 10 4,283 868 186
Total 4,918 3,553 17,257 6,743 3,108
*Due to data limitations, the exact number of small contemporary music events is unknown. The number shown represents alow end estimate of the number of performances in this category. The actual number of performances is likely to be higher.

Live Performance AustraliaSize and Scope of the Live Performance Industry in 2012 EY ÷ 37
Appendix D: Revenue and cost descriptionsTable 20: Description of revenue and cost items
Revenue
Box office income Ticketing salesMembership income
Government funding State government contributionsCommonwealth Government contributionsOther government funding
Corporate sponsorship and support Business sponsorships and support
Other Personal donationsOrchestra hiresRoyalty incomeMerchandisingFood and catering income
Expenses
Wages Direct wages to employees, including performers
Contract payments to performers Payments to performers
Rent, leasing and hiring Leasing of premises not directly related to performances(ie offices of event organizers)
Venue hire Venue costs to venue operators (does not include income foregonewhere event organisers own venues)Ticketing fees/booking fees
Travel, accommodation and vehicles AccommodationTravelVehicle hire
Advertising, marketing and promotions Advertising and marketing expenses to external organisations
Purchases Production related purchases
Royalty payments Royalty payments to artists
Staging, equipment & repairs Staging constructionSet costs (eg. Props)Depreciation and maintenance of stage related assets*ManuscriptsCostume purchases
Other InsuranceSecurityFinancing costsConsulting services
* Lump sum capital costs are incorporated in the annual depreciation allowances, which amortises the capital amount over thelife of the asset.

Live Performance AustraliaSize and Scope of the Live Performance Industry in 2012 EY ÷ 38
Appendix E: Event profilesThis Appendix details revenue and expense profiles that were considered in developing eventprofiles for this study. In developing the profiles, industry data from the Australian Bureau ofStatistics (ABS)25 and IBISWorld26 were considered. The ABS and IBISWorld data alone was howeversubject to a number of limitations for this purpose. Primarily, the ABS data was only available at anevent category level and did not contain adequate detail to account for event size impacts. Inaddition, the ABS and IBISWorld data was not available for all event categories.
Table 21 below presents the high level cost/revenue items for the ABS’s ‘Performing Arts’ industry.
Table 21: ABS data on profit and loss of the ‘Performing Arts’ industry
Income As % of total revenue
Box office income 48.5%
Government funding 23.7%
Other 27.7%
Total 100.0%
Expenses
Labour costs 34.8%
Contract payments to performers and non-performers/artists and artistic support 7.8%
Rent, leasing and hiring 9.9%
Other 40.5%
Total 93.1%
Operating profit/surplus before tax 6.9%
Source: Australian Bureau of Statistics (2008) 8697.0 - Performing Arts, Australia, 2006-07 (most recent data available)*Total may not add due to rounding
This data was further disaggregated based on IBISWorld data. For instance, the ABS ‘Other’expenses were separated into venue hire, travel accommodation and vehicles, advertising,marketing and promotions, purchases, royalty payments, and staging equipment and repairs (seeFigure 9).
25 Australian Bureau of Statistics (2008) 8697.0 - Performing Arts, Australia, 2006-0726 ‘Music and Theatre Productions in Australia’ (P9241) – IBISWorld Industry Report, p27

Live Performance AustraliaSize and Scope of the Live Performance Industry in 2012 EY ÷ 39
Figure 9: IBISWorld data on cost structure of Music and Theatre productions
Source: ‘Music and Theatre Productions in Australia’ (P9241) – IBISWorld Industry Report, p27
Given that the ABS data includes AMPAG events, a process of ‘backing out’ the AMPAG data fromthe ABS results was also conducted. The aggregate profile for Non-AMPAG event organisers can beseen in Table 22.
Table 22: Aggregate profile for non-AMPAG event organisers (before stakeholder adjustments)
Income As % of total revenue
Box office income 49.1%
Government funding 6.3%
Other 44.6%
Total Revenue 100.0%
Expenses
Wages 29.1%
Contract payments to performers 7.7%
Rent, leasing and hiring 13.4%
Venue hire 6.5%
Travel, accommodation and vehicles 6.0%
Advertising, marketing and promotions 8.0%
Purchases 2.7%
Royalty payments 2.6%
Staging, equipment & repairs 2.2%
Other 9.1%
Total expenses 87.2%
Net profit/loss before tax 12.8%
*Total may not add due to rounding
Wages - 36.5%
Rent, leasing & hiring expenses - 9.3%
Venue Hire - 6.6%
Contract payments to Australian residents - 6.3%
Travel, accommodation, etc - 5.6%
Advertising - 4.9%
Marketing/Promotional - 3.3%
Superannuation Contributions - 3.2%
Contract payments to overseas residents - 3.0%
Purchases - 2.8%
Royalty Payments - 2.7%
Depreciation - 1.7%
Telecommunications - 0.8%
Workers Compensation - 0.6%
Insurance - 0.5%
Repairs and Maintenance - 0.5%
Motor Vehicle Expenses - 0.5%
Interest Expenses - 0.4%
Other - 5.3%
Profit - 5.5%
As % of Total Revenue

Live Performance AustraliaSize and Scope of the Live Performance Industry in 2012 EY ÷ 40
To refine this data further by event type, a stakeholder consultation process was undertaken with across-section of small, medium and large event organisers for each of the categories. The outputfrom this process was then used to make adjustments which formed the revenue and cost structuresfor individual performance profiles. We note that the revenue and cost structures represent anaverage of the performances within an event profile and do not represent specific performances.

Live Performance AustraliaSize and Scope of the Live Performance Industry in 2012 EY ÷ 41
Glossary
AMPAG The Australian Major Performing Arts Group of companies funded through the Australia Council
APACA The Australian Performing Arts Centres Association is the national peak body representing andsupporting performing arts centres.
Import expense A payment to international artists that is not retained in Australia.
Industryemployment
The number of workers directly employed by the industry, expressed in terms of full time equivalentemployees.
Industry output The market value of goods and services produced by an industry, often measured by industryturnover
Industry value add The market value of goods and services produced by an industry, after deducting the cost of goodsand services used
Key Organisations Small to medium arts organisations funded through the Australia Council
Large scale venuesand events
All other live performance events not captured in the AMPAG companies, Key Organisations andregional and metropolitan venues
Live PerformanceIndustry
Businesses and workers that organise and perform work for or in connection with performances,productions, workshops, rehearsals or concerts (including the operation of venues or other facilities,whether permanent or temporary) that are performed in front of a live audience.
Regional andmetropolitanvenues
Regional and metropolitan performing arts centres that are members of the Australian PerformingArts Centres Association

EY | Assurance | Tax | Transactions | Advisory
About EYEY is a global leader in assurance, tax, transaction and advisory services. The insights and qualityservices we deliver help build trust and confidence in the capital markets and in economies theworld over. We develop outstanding leaders who team to deliver on our promises to all of ourstakeholders. In so doing, we play a critical role in building a better working world for our people,for our clients and for our communities.
EY refers to the global organisation and may refer to one or more of the member firms of Ernst &Young Global Limited, each of which is a separate legal entity. Ernst & Young Global Limited, aUK company limited by guarantee, does not provide services to clients. For more informationabout our organisation, please visit ey.com.
© 2014 Ernst & Young, Australia.All Rights Reserved.
ey.com