the science of guessing: analyzing an anonymized … science of guessing: ... so far, large-scale...
TRANSCRIPT
The science of guessing: analyzing an anonymized corpus of 70 million passwords
Joseph BonneauComputer Laboratory
University of [email protected]
Abstract—We report on the largest corpus of user-chosenpasswords ever studied, consisting of anonymized passwordhistograms representing almost 70 million Yahoo! users, mit-igating privacy concerns while enabling analysis of dozens ofsubpopulations based on demographic factors and site usagecharacteristics. This large data set motivates a thorough sta-tistical treatment of estimating guessing difficulty by samplingfrom a secret distribution. In place of previously used metricssuch as Shannon entropy and guessing entropy, which cannotbe estimated with any realistically sized sample, we developpartial guessing metrics including a new variant of guessworkparameterized by an attacker’s desired success rate. Our newmetric is comparatively easy to approximate and directlyrelevant for security engineering. By comparing passworddistributions with a uniform distribution which would provideequivalent security against different forms of guessing attack,we estimate that passwords provide fewer than 10 bits ofsecurity against an online, trawling attack, and only about 20bits of security against an optimal offline dictionary attack.We find surprisingly little variation in guessing difficulty;every identifiable group of users generated a comparablyweak password distribution. Security motivations such as theregistration of a payment card have no greater impact thandemographic factors such as age and nationality. Even pro-active efforts to nudge users towards better password choiceswith graphical feedback make little difference. More surpris-ingly, even seemingly distant language communities choose thesame weak passwords and an attacker never gains more thana factor of 2 efficiency gain by switching from the globallyoptimal dictionary to a population-specific lists.
Keywords-computer security; authentication; statistics; infor-mation theory; data mining;
I. INTRODUCTION
Text passwords have dominated human-computer authen-tication since the 1960s [1] and been derided by securityresearchers ever since, with Multics evaluators singling pass-words out as a weak point in the 1970s [2]. Though manypassword cracking studies have supported this claim [3]–[7], there is still no consensus on the actual level of securityprovided by passwords or even on the appropriate metricfor measuring security. The security literature lacks soundmethodology to answer elementary questions such as “doolder users or younger users choose better passwords?” Ofmore concern for security engineers, it remains an openquestion the extent to which passwords are weak due toa lack of motivation or inherent user limitations.
The mass deployment of passwords on the Internet may
provide sufficient data to address these questions. So far,large-scale password data has arisen only from securitybreaches such as the leak of 32 M passwords from thegaming website RockYou in 2009 [7], [8]. Password corporahave typically been analyzed by simulating adversarial pass-word cracking, leading to sophisticated cracking libraries butlimited understanding of the underlying distribution of pass-words (see Section II). Our goal is to bring the evaluationof large password data sets onto sound scientific footingby collecting a massive password data set legitimately andanalyzing it in a mathematically rigorous manner.
This requires retiring traditional, inappropriate metricssuch as Shannon entropy and guessing entropy which don’tmodel realistic attackers and aren’t approximable using sam-pled data. Our first contribution (Section III) is to formalizeimproved metrics for evaluating the guessing difficulty of askewed distribution of secrets, such as passwords, introduc-ing α-guesswork as a tunable metric which can effectivelymodel different types of practical attack.
Our second contribution is a novel privacy-preservingapproach to collecting a password distribution for statisticalanalysis (Section IV). By hashing each password at the timeof collection with a secret key that is destroyed prior to ouranalysis, we preserve the password histogram exactly withno risk to user privacy.
Even with millions of passwords, sample size has sur-prisingly large effects on our calculations due to the largenumber of very infrequent passwords. Our third contribution(Section V) is to adapt techniques from computationallinguistics to approximate guessing metrics using a randomsample. Fortunately, the most important metrics are alsothe best-approximated by sampled data. We parametricallyextend our approximation range by fitting a generalizedinverse Gaussian-Poisson (Sichel) distribution to our data.
Our final contribution is to apply our research to a massivecorpus representing nearly 70 M users, the largest evercollected, with the cooperation of Yahoo! (Section VI).We analyze the effects of many demographic factors, butthe password distribution is remarkably stable and securityestimates in the 10–20 bit range emerge across every sub-population we considered. We conclude from our research(Section VII) that we are yet to see compelling evidence thatmotivated users can choose passwords which resist guessingby a capable attacker.

0.0 0.1 0.2 0.3 0.4 0.5 0.6 0.7 0.8 0.9α = proportion of passwords guessed
0
5
10
15
20
25
30
35µ
=lg
(dic
tion
ary
size
)
Morris and Thompson [1979]
Klein [1990]
Spafford [1992]
Wu [1999]
Kuo [2006]
Schneier [2006]
Dell’Amico (it) [2010]
Dell’Amico (fi) [2010]
Dell’Amico (en) [2010]
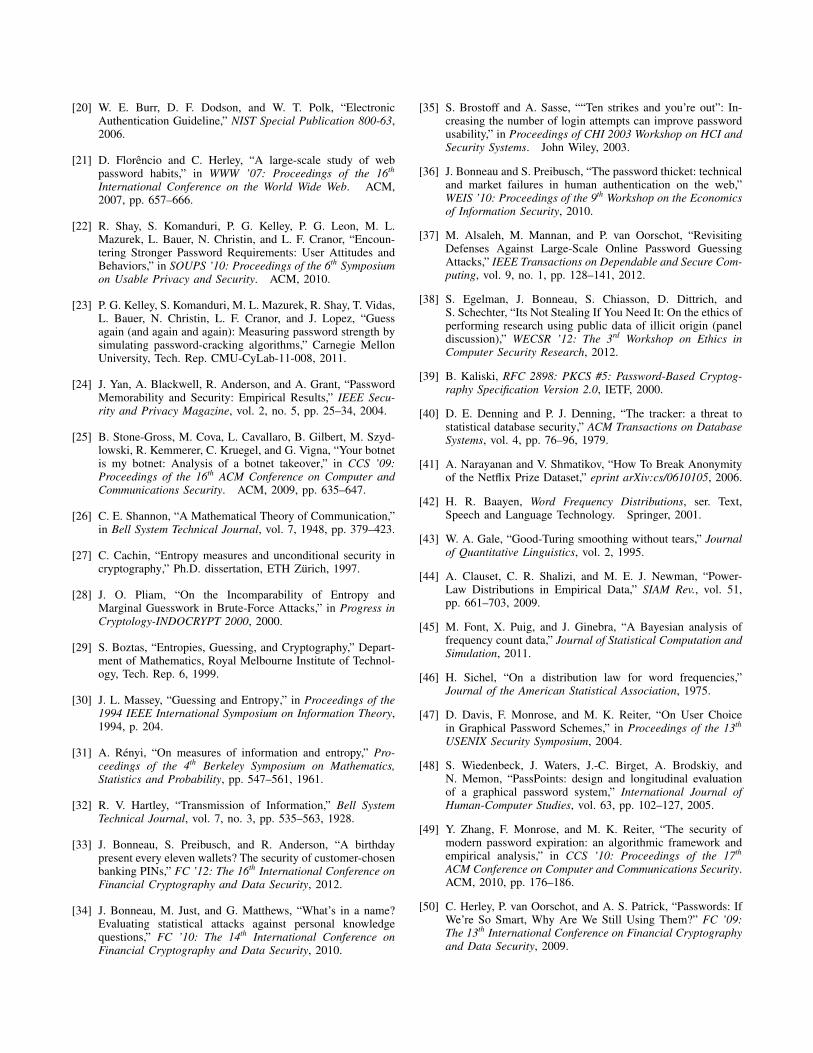
(a) Historical cracking efficiency, raw dictionary size
0.0 0.1 0.2 0.3 0.4 0.5 0.6 0.7 0.8 0.9α = proportion of passwords guessed
0
5
10
15
20
25
30
35
µ=
lg(d
icti
onar
ysi
ze/α
)
Morris and Thompson [1979]
Klein [1990]
Spafford [1992]
Wu [1999]
Kuo [2006]
Schneier [2006]
Dell’Amico (it) [2010]
Dell’Amico (fi) [2010]
Dell’Amico (en) [2010]
(b) Historical cracking efficiency, equivalent dictionary size
Figure 1. The size of cracking dictionaries is plotted logarithmically against the success rate achieved in Figure 1a. In Figure 1b, the dictionary sizes areadjusted to incorporate the inherent need for more guesses to crack more passwords. Circles and solid lines represent operating system user passwords,squares and dashed lines represent web passwords.
II. HISTORICAL EVALUATIONS OF PASSWORD SECURITY
It has long been of interest to analyze how secure pass-words are against guessing attacks, dating at least to Mor-ris and Thompson’s seminal 1979 analysis of 3,000 pass-words [3]. They performed a rudimentary dictionary attackusing the system dictionary and all 6-character strings andrecovered 84% of available passwords. They also reportedsome basic statistics such as password lengths (71% were6 characters or fewer) and frequency of non-alphanumericcharacters (14% of passwords). These two approaches, pass-word cracking and semantic evaluation, have been the basisfor dozens of studies in the thirty years since.
A. Cracking evaluation
The famous 1988 Morris worm propagated in part byguessing passwords using a 350-word password dictionaryand several rules to modify passwords [9]. The publicitysurrounding the worm motivated independent studies byKlein and Spafford which re-visited password guessing [4],[5]. Both studies broke 22–24% of passwords using more so-phisticated dictionaries such as lists of names, sports teams,movies and so forth. Password cracking evolved rapidly inthe years after these studies, with dedicated software toolslike John the Ripper emerging in the 1990s which utilizemangling rules to turn a single password like “john” intovariants like “John”, “J0HN”, and “nhoj.” [10]. Research onmangling rules has continued to evolve; the current state ofthe art by Weir et al. [11] automatically generates manglingrules from a large training set of known passwords.
Later studies have often utilized these tools to performdictionary attacks as a secondary goal, such as Wu’s studyof password cracking against Kerberos tickets in 1999 [12]and Kuo et al.’s study of mnemonic passwords in 2006 [13],which recovered 8% and 11% of passwords, respectively.
Recently, large-scale password leaks from compromisedwebsites have provided a new source of data for crackingevaluations. For example, Schneier analyzed about 50,000passwords obtained via phishing from MySpace in 2006 [6].A more in-depth study was conducted by Dell’Amico etal., who studied the MySpace passwords as well as thoseof two other websites using a large variety of differentdictionaries [7]. A very large data set of 32M passwordsleaked from RockYou in 2009, which Weir et al. studiedto examine the effects of password-composition rules oncracking efficiency [8].
Reported numbers on password cracking efficiency varysubstantially between different studies, as shown in Fig-ure 1. Most studies have broken 20–50% of accounts withdictionary sizes in the range of 220–230. All studies seediminishing returns for larger dictionaries. This is clear inFigure 1b, which adjusts dictionary sizes based on the per-centage of passwords cracked so that the degree of upwardslope reflects only decreasing efficiency. This concept willmotivate our statistical guessing metrics in Section III-E.
There is little data on the efficiency of small dictionariesas most studies employ the largest dictionary they canprocess. Klein’s study, which attempted to identify highlyefficient sub-dictionaries, is a notable exception [4]. Thereis also little data on the size of dictionary required to breaka large majority of passwords—only Morris and Thompsonbroke more than 50% of available passwords1 and theirresults may be too dated to apply to modern passwords.
B. Semantic evaluations
In addition to cracking research, there have been manystudies on the semantics of passwords with psychologists
1A 2007 study by Cazier and Medlin claimed to break 99% of passwordsat an e-commerce website, but details of the dictionary weren’t given [14].

year study length % digits % special1989 Riddle et al. [15] 4.4 3.5 —1992 Spafford [5] 6.8 31.7 14.81999 Wu [12] 7.5 25.7 4.11999 Zviran and Haga [18] 5.7 19.2 0.72006 Cazier and Medlin [14] 7.4 35.0 1.32009 RockYou leak [19] 7.9 54.0 3.7
Table ICOMMONLY ESTIMATED ATTRIBUTES OF PASSWORDS
and linguists being interested as well as computer securityresearchers. This approach can be difficult as it either re-quires user surveys, which may produce unrealistic passwordchoices, or direct access to unhashed passwords, whichcarries privacy concerns. Riddle et al. performed linguisticanalysis of 6,226 passwords in 1989, classifying them intocategories such as names, dictionary words, or seeminglyrandom strings [15]. Cazier et al. repeated this process in2006 and found that hard-to-classify passwords were alsothe hardest to crack [14].
Password structure was formally modeled by Weir etal. [11] using a context-free grammar to model the prob-ability of different constructions being chosen. Passwordcreation has also been modeled as a character-by-characterMarkov process, first by Narayanan and Shmatikov [16] forpassword cracking and later by Castelluccia et al. [17] totrain a pro-active password checker.
Thus methodology for analyzing password structure hasvaried greatly, but a few basic data points like averagelength and types of characters used are typically reported, assummarized in Table I. The estimates vary so widely that itis difficult to infer much which is useful in systems design.The main trends are a tendency towards 6-8 characters oflength and a strong dislike of non-alphanumeric characters inpasswords.2 Many studies have also attempted to determinethe number of users which appear to be choosing randompasswords, or at least passwords without any obvious mean-ing to a human examiner. Methodologies for estimating thisvary as well, but most studies put it in the 10–40% range.
Elements of password structure, such length or the pres-ence of digits, upper-case, or non-alphanumeric characterscan be used to estimate the “strength” of a password,often measured in bits and often referred to impreciselyas “entropy”.3 This usage was cemented by the 2006 FIPSElectronic Authentication Guideline [20], which provided a“rough rule of thumb” for estimating entropy from password
2It is often suggested that users avoid characters which require multiplekeys to type, but this doesn’t seem to have been formally established.
3This terminology is mathematically incorrect because entropy (seeSections III-A and III-B) measures a complete probability distribution,not a single event (password). The correct metric for a single event isself-information (or surprisal). This is perhaps disfavored because it iscounter-intuitive: passwords should avoid including information like namesor addresses, so high-information passwords sound weak.
characteristics such as length and type of characters used.This standard has been used in several password studieswith too few samples to compute statistics on the entiredistribution [21]–[23]. More systematic formulas have beenproposed, such as one by Shay et al. [22] which adds entropyfrom different elements of a password’s structure.
C. Problems with previous approaches
Three decades of work on password guessing has pro-duced sophisticated cracking tools and many disparate datapoints, but a number of methodological problems continueto limit scientific understanding of password security:
1) Comparability: Authors rarely report cracking resultsin a format which is straightforward to compare with pre-vious benchmarks. To our knowledge, Figure 1 is the firstcomparison of different data points of dictionary size andsuccess rate, though direct comparison is difficult sinceauthors all report efficiency rates for different dictionarysizes. Password cracking tools only loosely attempt to guesspasswords in decreasing order of likeliness, introducing im-precision into reported dictionary sizes. Worse, some studiesreport the running time of cracking software instead ofdictionary size [14], [24], [25], making comparison difficult.
2) Repeatability: Precisely reproducing password crack-ing results is difficult. John the Ripper [10], used in mostpublications of the past decade, has been released in 21 dif-ferent versions since 2001 and makes available 20 separateword lists for use (along with many proprietary ones), inaddition to many configuration options. Other studies haveused proprietary password-cracking software which isn’tavailable to the research community [6], [14]. Thus nearlyall studies use dictionaries varying in content and ordering,making it difficult to exactly re-create a published attack tocompare its effectiveness against a new data set.
3) Evaluator dependency: Password-cracking results areinherently dependent on the appropriateness of the dictionaryand mangling rules to the data set under study. Dell’Amicoet al. [7] demonstrated this problem by applying language-specific dictionaries to data sets of passwords in differentlanguages and seeing efficiency vary by 2–3 orders ofmagnitude. They also evaluated the same data set as Schneierthree years earlier [6] and achieved two orders of magnitudebetter efficiency simply by choosing a better word list. Thusit is difficult to separate the effects of more-carefully chosenpasswords from the use of a less appropriate dictionary. Thisis particularly challenging in data-slicing experiments [8],[23] which require simulating an equally good dictionaryattack against each subpopulation.
4) Unsoundness: Estimating the entropy of a passworddistribution from structural characteristics is mathematicallydubious, as we will demonstrate in Section III-D, and in-herently requires making many assumptions about passwordselection. In practice, entropy estimates have performedpoorly as predictors of empirical cracking difficulty [8], [23].
III. MATHEMATICAL METRICS OF GUESSING DIFFICULTY
Due to the problems inherent to password cracking simu-lations or semantic evaluation, we advocate security metricsthat rely only on the statistical distribution of passwords.While this approach requires large data sets, it eliminatesbias from password-cracking software by always modelinga best-case attacker, allowing us to assess and compare theinherent security of a given distribution.
Mathematical notation: We denote a probability distribu-tion with a calligraphic letter, such as X . We use lower-casex to refer to a specific event in the distribution (an individualpassword). The probability of x is denoted px. Formally, adistribution is a set of events x ∈ X , each with an associatedprobability 0 < px ≤ 1, such that
∑px = 1. We use N to
denote the total number of possible events in X .We often refer to events by their index i, that is, their
rank by probability in the distribution with the most probablehaving index 1 and the least probable having index N . Werefer to the ith most common event as xi and call its prob-ability pi. Thus, the probabilities of the events in X form amonotonically decreasing sequence p1 ≥ p2 ≥ . . . ≥ pN .
We denote an unknown variable as X , denoting X R← Xif it is drawn at random from X .
Guessing model: We model password selection as a ran-dom draw X
R← X from an underlying password distributionX . Though X will vary depending on the population ofusers, we assume that X is completely known to the attacker.Given a (possibly singleton) set of unknown passwords{X1, X2, . . . Xk}, we wish to evaluate the efficiency of anattacker trying to identify the unknown passwords Xi givenaccess to an oracle for queries of the form “is Xi = x?”
A. Shannon entropy
Intuitively, we may first think of the Shannon entropy:
H1(X ) =N∑i=1
−pi lg pi (1)
as a measure of the “uncertainty” of X to an attacker.Introduced by Shannon in 1948 [26], entropy appears tohave been ported from cryptographic literature into studiesof passwords before being used in FIPS guidelines [20].
It has been demonstrated that H1 is mathematically inap-propriate as a measure guessing difficulty [27]–[30]. It in factquantifies the average number of subset membership queriesof the form “Is X ∈ S?” for arbitrary subsets S ⊆ X neededto identify X .4 For an attacker who must guess individualpasswords, Shannon entropy has no direct correlation toguessing difficulty.5
4The proof of this is a straightforward consequence of Shannon’s sourcecoding theorem [26]. Symbols X R← X can be encoded using a Huffmancode with average bit length ≤ H1(X ) + 1, of which the adversary canlearn one bit at a time with subset membership queries.
5H1 has further been claimed to correlate poorly with password crackingdifficulty [8], [23], though the estimates of H1 used cannot be relied upon.
B. Renyi entropy and its variants
Renyi entropy Hn is a generalization of Shannon en-tropy [31] parametrized by a real number n ≥ 0:6
Hn(X ) =1
1− n lg
(N∑i=1
pni
)(2)
In the limit as n→ 1, Renyi entropy converges to Shannonentropy, which explains why Shannon entropy is denotedH1. Note that Hn is a monotonically decreasing function ofn. We are most interested in two special cases:
1) Hartley entropy H0: For n = 0, Renyi entropy is:
H0 = lgN (3)
Introduced prior to Shannon entropy [32], H0 measuresonly the size of a distribution and ignores the probabilities.
2) Min-entropy H∞: As n→∞, Renyi entropy is:
H∞ = − lg p1 (4)
This metric is only influenced by the probability of themost likely symbol in the distribution, hence the name.This is a useful worst-case security metric for human-chosendistributions, demonstrating security against an attacker whoonly guesses the most likely password before giving up. H∞is a lower bound for all other Renyi entropies and indeedall of the metrics we will define.
C. Guesswork
A more applicable metric is the expected number ofguesses required to find X if the attacker proceeds in optimalorder, known as guesswork or guessing entropy [27], [30]:
G(X ) = E[#guesses(X
R← X )]=
N∑i=1
pi · i (5)
Because G includes all probabilities in X , it models anattacker who will exhaustively guess even exceedingly un-likely events which can produce absurd results. For example,in the RockYou data set over twenty users (more than 1in 221) appear to use 128-bit pseudorandom hexadecimalstrings as passwords. These passwords alone ensure thatG(RockYou) ≥ 2106. Thus G provides little insight intopractical attacks and furthermore is difficult to estimate fromsampled data (see Section V).
D. Partial guessing metrics
Guesswork and entropy metrics fail to model the tendencyof real-world attackers to cease guessing against the mostdifficult accounts. As discussed in Section II, crackingevaluations typically report the fraction of accounts brokenby a given attack and explicitly look for weak subspaces ofpasswords to attack. Having many accounts to attack is an
6Renyi entropy is traditionally denoted Hα; we use Hn to avoidconfusion with our primary use of α as a desired success rate.

important resource for a real attacker, as it enables a partialguessing attack which trades a lower proportion of accountsbroken for increased guessing efficiency.
Formally, if Eve must sequentially guess each of k pass-words drawn from X , she will need ∼ k ·G(X ) guesses onaverage. However, a second guesser Mallory willing to breakonly ` < k of the passwords can do much better with theoptimal strategy of first guessing the most likely passwordfor all k accounts, then the second-most likely value andso on. As ` decreases, Mallory’s efficiency increases furtheras the attack can omit progressively more low-probabilitypasswords. For large values of k and `, Mallory will onlyneed to guess the most popular β passwords such that∑βi=1 pi ≥ α, where α = `
k . There are several possiblemetrics for measuring guessing in this model:
1) β-success-rate: A very simple metric, first formallydefined by Boztas [29], measures the expected success foran attacker limited to β guesses per account:
λβ(X ) =β∑i=1
pi (6)
2) α-work-factor: A related metric, first formalized byPliam [28], evaluates the fixed number of guesses peraccount needed to break a desired proportion α of accounts.
µα(X ) = min
{j
∣∣∣∣∣j∑i=1
pi ≥ α}
(7)
If µα(X ) = n, this tells us that an attacker must use anoptimal dictionary of n entries to have a probability α ofbreaking an individual account, or equivalently to break anexpected fraction α of many accounts.
3) α-guesswork: While λβ and µα are closer to mea-suring real guessing attacks, both ignore the fact that areal attacker can stop early after successful guesses. Whilemaking up to µα guesses per account will enable breakinga fraction α of accounts, some will require fewer than µαguesses. We introduce a new metric to reflect the expectednumber of guesses per account to achieve a success rate α:
Gα(X ) = (1− λµα) · µα +
µα∑i=1
pi · i (8)
We use λµα in place of α to round up to the proportionof passwords actually covered by µα guesses. Note that thetraditional guesswork metric G is a special case G1 of thismetric with α = 1. We could equivalently define Gβ for anattacker limited to β guesses, but this is less useful as forsmall β the effect of stopping early is negligible.
E. Effective key-length metrics
While λβ , µα and Gα are not measures of entropy, it isconvenient to convert them into units of bits. This enablesdirect comparison of all metrics as a logarithmically scaledattacker workload which is intuitive to programmers and
cryptographers. This can be thought of as an “effectivekey-length” as it represents the size of a randomly chosencryptographic key which would give equivalent security.7
We convert each metric by calculating the logarithmic sizeof a discrete uniform distribution UN with pi =
1N for all
1 ≤ i ≤ N which has the same value of the guessing metric.For β-success-rate, since we have λβ (UN ) = β
N we saythat another distribution X is equivalent with respect to λβto a uniform distribution of size N = β
λβ(X ) . We take thelogarithm of this size to produce our effective key-lengthmetric λβ , using a tilde to denote the conversion to bits:
λβ(X ) = lg
(β
λβ(X )
)(9)
The conversion formula for α-work-factor is related:
µα(X ) = lg
(µα(X )λµα
)(10)
Again, we use λµα in place of α in the denominatorbecause µα increases as a step function as α increases.Without this correction, µα would decrease over each rangeof α where µα is constant, giving a misleading over-estimateof security. Using λµα effectively rounds up to the nextvalue of α which would require additional guesses to cover,ensuring that µα is monotonically increasing.
To convert Gα, we consider that an attacker desiring tobreak a proportion α of accounts will average Gα guessesper account, or one successful guess per Gαα guesses. Againstthe uniform distribution UN , an attacker will break anaccount every N+1
2 guesses, giving us the formula:
Gα(X ) = lg[2 ·Gα(X )λµα
− 1] + lg1
2− λµα(11)
using the same correction for α as we did for µα to achievemonotonicity, and the correction factor lg 1
2−λµαto make
the metric constant for a uniform distribution.
F. Relationship between metrics
We enumerate a few useful relationships between differ-ent metrics in Table II. Note that for a discrete uniformdistribution UN , all of the metrics Hn, Gα, λβ and µα areequivalent. This validates the definitions and demonstrateswhy more complicated guessing metrics have rarely comeup in cryptographic literature, as they provide no additionalinformation for uniform distributions.
Massey proved that G1 ≥ H1−1 [30], which is sometimesused to justify H1 as a guessing metric. However, severalnegative results show that neither H1 nor G1 can provideany lower bound on partial guessing. Theorems proved byPliam [28], Boztas [29], and Bonneau [34] demonstrate anunbounded gap: for any desired success rate α < 1, it ispossible to construct a distribution X such that µα(X ) +
7Boztas introduced the term effective key-length specifically to refer toµ0.5 [29]. We extend the notion here to all of our metrics.

0.0 0.2 0.4 0.6 0.8 1.0success rate α
0
2000
4000
6000
8000
10000
nu
mb
erof
gues
ses
µα(U104)/Gα(U104)
µα(U103)/Gα(U103)
µα(PIN)
Gα(PIN)
(a) µα, Gα (number of guesses)
0.0 0.2 0.4 0.6 0.8 1.0success rate α
0
2
4
6
8
10
12
14
bit
s
↖ H∞
G↘
H0 ↘
H1 →
H2 →
µα(U104)/Gα(U104)
µα(U103)/Gα(U103)
µα(PIN)
Gα(PIN)
0.0
0.5
1.0
1.5
2.0
2.5
3.0
3.5
4.0
dit
s
(b) µα, Gα (effective key-length)
Figure 2. Two ways of comparing the guessing difficulty of user-chosen 4-digit PINs [33] against uniform distributions of size 10,000 and 1,000 (U104and U103 , respectively). Fig. 2a plots the dictionary size µα needed to have a chance of success α as well as the expected number of guesses per accountGα. Fig. 2b converts both metrics into an effective key-length, enabling visual comparison across the entire range of α. Traditional single-point metricsH0, H1, H2, H∞ and G are also marked for comparison. Note that µα and Gα are horizontal lines for uniform distributions; an attacker gains noefficiency advantage from lowering his desired success rate α.
m ≤ H1(X ) and µα(X ) +m ≤ G1(X ) for any separationparameter m. Furthermore, for any α1 < α2 a distributionX can be found with µα1
(X ) + m ≤ µα2(X ) for any m.
These results easily extend to Gα using the bounds listed inTable II and related results can be proved for λβ(X ).
equivalences∀n Hn(UN ) = lgN all metrics equal for U∀β λβ(UN ) = lgN all metrics equal for U∀α µα(UN ) = lgN all metrics equal for U∀α Gα(UN ) = lgN all metrics equal for UH0 = µ1 = λN = lgN metrics depending only on N
H∞ = µα≤p1 = λ1 = − lg p1 metrics depending only on p1bounds
H∞ ≤ Gα, µα, λβ H∞ is abs. lower boundGα, µα, λβ ≤ H0 H0 is abs. upper bound
Gα ≤ µα straightforward proofGα − µα ≤ lg(1− α) straightforward proof
monotonicityH∞ ≤ . . . ≤ H1 ≤ H0 Hn decreasing with n
λβ ≤ λβ+ε λβ increasing with βµα ≤ µα+ε µα increasing with αGα ≤ Gα+ε Gα increasing with α
Table IIRELATIONS BETWEEN GUESSING METRICS
G. Application in practical security evaluation
For an online attacker we can use λβ with β equal to theguessing limits imposed by the system. There is no standardfor β, with 10 guesses recommended by usability stud-ies [35], 3 by FIPS guidelines [20], and a variety of values(often ∞) seen in practice [36]. Sophisticated rate-limitingschemes may allow a probabilistic number of guesses [37].
We consider λ10 a reasonable benchmark for resistance toonline guessing, though λ1 = H∞ is a conservative choiceas a lower bound for all metrics proposed.
The separation results of Section III-F mean that for brute-force attacks we can’t rely on any single value of α; eachvalue provides information about a fundamentally differentattack scenario. For a complete picture, we can consider µαor Gα across all values of α. We can plot this as the guessingcurve for a distribution, as seen in Figure 2.
For offline attacks, where an adversary is limited only bytime and computing power, we might consider µα or Gα fora standard value such as 0.5 as a benchmark (µ0.5 was orig-inally suggested by [29]). While Gα more directly measuresthe efficiency of a guessing attack, µα can be advantageousin practice because it is simpler to compute. In particular, itcan be computed using previously published cracking resultsreported as “a dictionary of size µ compromised a fraction αof available accounts,” as plotted in Figure 1b. Furthermore,the difference between the metrics is only significant forhigher values of α; for α ≤ 0.5 the two will never differ bymore than 1 bit (from the bound in Table II).
IV. PRIVACY-PRESERVING EXPERIMENTAL SETUP
By using statistical guessing metrics to evaluate pass-words, we are freed from the need to access passwordsin their original form. Users may be willing to providepasswords to researchers with ethics oversight [4], [23]but this approach does not scale and the validity of thecollected passwords is questionable. In contrast, leaked datasets provide unquestionably valid data but there are ethicalquestions with using stolen password data and its availabilityshouldn’t be relied on [38]. There is also no control over
the size or composition of leaked data sets. Thus far, forexample, no leaked sources have included demographic data.
We addressed both problems with a novel experimentalsetup and explicit cooperation from Yahoo!, which maintainsa single password system to authenticate users for its diversesuite of online services. Our experimental data collectionwas performed by a proxy server situated in front of livelogin servers. This is required as long-term password storageshould include account-specific salting and iterated hashingwhich prevent constructing a histogram of common choices,just as they mitigate pre-computed dictionary attacks [39].
Our proxy server sees a stream of pairs (u, passwordu)for each user u logging in to any Yahoo! service. Ourgoal is to approximate distinct password distributions Xfifor a series of demographic predicates fi. Each predicate,such as “does this user have a webmail account?”, willtypically require a database query based on u. A simplisticsolution would be for the proxy to emit a stream of tuples(H(passwordu), f1(u), f2(u), . . . ), removing user identifiersu to prevent trivial access to real accounts and using a cryp-tographic hash function H to mask the values of individualpasswords.8 There are two major problems to address:
A. Preventing password cracking
If a user u can be re-identified by the uniqueness ofhis or her demographic predicates [40], then the valueH(passwordu) could be used as an oracle to perform anoffline dictionary attack. Such a re-identification attack wasdemonstrated on a data set of movie reviews superficiallyanonymized for research purposes [41] and would almostcertainly be possible for most users given the number anddetail of predicates we would like to study.
This risk can be effectively mitigated by prepending thesame cryptographically random nonce r to each passwordprior to hashing. The proxy server must generate r at thebeginning of the study and destroy it prior to making dataavailable to researchers. By choosing r sufficiently longto prevent brute-force (128 bits is a conservative choice)and ensuring it is destroyed, H(r||passwordu) is uselessfor an attacker attempting to recover passwordu but thedistribution of hash values will remain exactly isomorphicto the underlying distribution of passwords seen.
B. Preventing cross-account compromise
While including a nonce prevents offline search, an at-tacker performing large-scale re-identification can still iden-tify sets of users which have a password in common. Thisdecreases security for all users in a group which share apassword, as an attacker may then gain access to all accountsin the group by recovering just one user’s password byauxiliary means such as phishing, malware, or compromiseof an external website for which the password was re-used.
8Note that H cannot incorporate any user-specific salt—doing so wouldocclude the frequency of repeated passwords.
10 12 14 16 18 20 22 24 26lgM
5
10
15
20
25
met
ric
valu
e(b
its)
H0
ˆG
H1
ˆµ0.25
ˆλ10
H∞
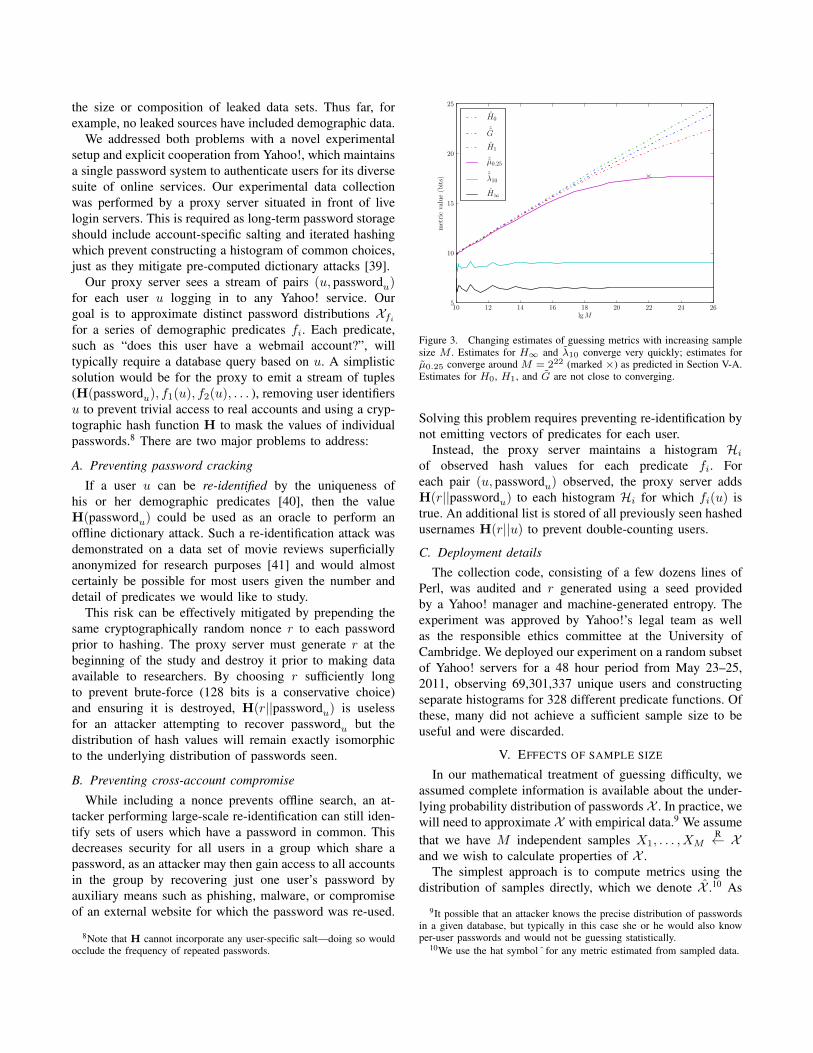
Figure 3. Changing estimates of guessing metrics with increasing samplesize M . Estimates for H∞ and λ10 converge very quickly; estimates forµ0.25 converge around M = 222 (marked ×) as predicted in Section V-A.Estimates for H0, H1, and G are not close to converging.
Solving this problem requires preventing re-identification bynot emitting vectors of predicates for each user.
Instead, the proxy server maintains a histogram Hiof observed hash values for each predicate fi. Foreach pair (u, passwordu) observed, the proxy server addsH(r||passwordu) to each histogram Hi for which fi(u) istrue. An additional list is stored of all previously seen hashedusernames H(r||u) to prevent double-counting users.
C. Deployment details
The collection code, consisting of a few dozens lines ofPerl, was audited and r generated using a seed providedby a Yahoo! manager and machine-generated entropy. Theexperiment was approved by Yahoo!’s legal team as wellas the responsible ethics committee at the University ofCambridge. We deployed our experiment on a random subsetof Yahoo! servers for a 48 hour period from May 23–25,2011, observing 69,301,337 unique users and constructingseparate histograms for 328 different predicate functions. Ofthese, many did not achieve a sufficient sample size to beuseful and were discarded.
V. EFFECTS OF SAMPLE SIZE
In our mathematical treatment of guessing difficulty, weassumed complete information is available about the under-lying probability distribution of passwords X . In practice, wewill need to approximate X with empirical data.9 We assumethat we have M independent samples X1, . . . , XM
R← Xand we wish to calculate properties of X .
The simplest approach is to compute metrics using thedistribution of samples directly, which we denote X .10 As
9It possible that an attacker knows the precise distribution of passwordsin a given database, but typically in this case she or he would also knowper-user passwords and would not be guessing statistically.
10We use the hat symbolˆfor any metric estimated from sampled data.
shown in Figure 3, this approach produces substantial andsystematic under-estimates of most metrics, most promi-nently H0 = lg N which increases nearly continuously withincreasing sample size M indicating that new passwordsare still being seen often even at our massive sample size.The maximum-likelihood estimation of the growth rate dN
dM
has been shown to be exactly V (1,M)M , the proportion of
passwords in the sample observed only once [42].11 Thiscan be seen because in in exactly V (1,M)
M of all possibleorderings that the sample may have been collected willthe last observation have been a new item. For our fullsample, V (1,M)
M = 42.5%, indicating that a larger samplewould continue to find many new passwords and hencelarger estimates for H0, H1, G1 etc. Similarly, for a randomsubsample of our data, many passwords will be missed andestimates of these metrics will decrease.
Interpreting hapax legomena is a fundamental problem instatistics and there are there are no known non-parametrictechniques for estimating the true distribution size N [42].This is a not merely a theoretical restriction; in the case ofpasswords determining that apparently pseudorandom pass-words really are 128-bit random strings would require an ut-terly intractable sample size many times greater 2128. Good-Turing techniques [43] aren’t helpful for the distribution-wide statistics we are interested in; they can only estimatethe cumulative probability of all unobserved events (the“missing mass”) and provide damped maximum-likelihoodestimates of the probability of individual events.
Fortunately, in practice we can usefully approximate ourguessing metrics from reasonably-sized samples; thoughthese estimations implicitly rely on assumptions about theunderlying nature of the password distribution. As seen inFigure 3, partial guessing metrics which rely only on themore-frequent items in the distribution are the easiest toapproximate, while those which rely on a summation overthe entire distribution such as H0, H1 and µα, Gα for largevalues of α will be the most difficult.
A. The region of stability
We can reliably estimate pi for events with observedfrequency fi � 1 due to the law of large numbers.Estimating H∞ requires estimating only p1, the probabilityof the most common password, which was 1.08% in our dataset. Gaussian statistics can be used to estimate the standarderror of the maximum-likelihood estimate pi:
error(pi) =
√pi(1− pi)
M· 1pi≈√
fiM2· Mfi
=1√fi
For our data set, this gives a standard error of under 0.1 bitin H∞ for M ≥ 214. This argument extends to ˆ
λβ for small
11Events observed only once in a sample are called hapax legomena inlinguistics, Greek for “said only once.”
0.0 0.2 0.4 0.6 0.8 1.0success rate α
0
5
10
15
20
25
α-w
ork-f
acto
rµα
(bit
s)
M = 69, 301, 337 (full)
M = 10, 000, 000 (sampled)
M = 1, 000, 000 (sampled)
M = 500, 000 (sampled)
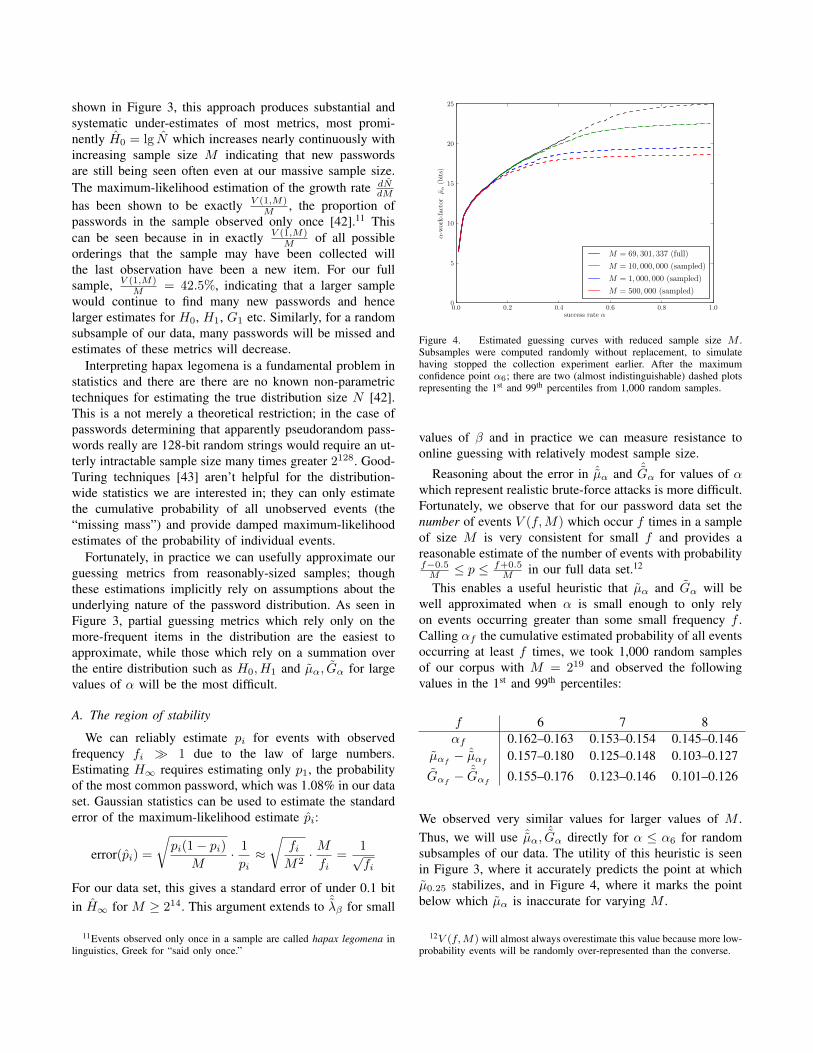
Figure 4. Estimated guessing curves with reduced sample size M .Subsamples were computed randomly without replacement, to simulatehaving stopped the collection experiment earlier. After the maximumconfidence point α6; there are two (almost indistinguishable) dashed plotsrepresenting the 1st and 99th percentiles from 1,000 random samples.
values of β and in practice we can measure resistance toonline guessing with relatively modest sample size.
Reasoning about the error in ˆµα and ˆGα for values of αwhich represent realistic brute-force attacks is more difficult.Fortunately, we observe that for our password data set thenumber of events V (f,M) which occur f times in a sampleof size M is very consistent for small f and provides areasonable estimate of the number of events with probabilityf−0.5M ≤ p ≤ f+0.5
M in our full data set.12
This enables a useful heuristic that µα and Gα will bewell approximated when α is small enough to only relyon events occurring greater than some small frequency f .Calling αf the cumulative estimated probability of all eventsoccurring at least f times, we took 1,000 random samplesof our corpus with M = 219 and observed the followingvalues in the 1st and 99th percentiles:
f 6 7 8αf 0.162–0.163 0.153–0.154 0.145–0.146
µαf − ˆµαf 0.157–0.180 0.125–0.148 0.103–0.127
Gαf − ˆGαf 0.155–0.176 0.123–0.146 0.101–0.126
We observed very similar values for larger values of M .Thus, we will use ˆµα,
ˆGα directly for α ≤ α6 for randomsubsamples of our data. The utility of this heuristic is seenin Figure 3, where it accurately predicts the point at whichµ0.25 stabilizes, and in Figure 4, where it marks the pointbelow which µα is inaccurate for varying M .
12V (f,M) will almost always overestimate this value because more low-probability events will be randomly over-represented than the converse.
B. Parametric extension of our approximations
Estimating µα and Gα for higher α requires directlyassuming a model for the underlying password distribution.Passwords have been conjectured to follow a power-lawdistribution13 where:
Pr [p(x) > y] ∝ y1−a (12)
Unfortunately, using a power-law distribution is problematicfor two reasons. First, estimates for the scale parameter aare known to decrease significantly with sample size [42].Using maximum-likelihood fitting techniques [44] for ourobserved count data we get the following estimates:
M 69M 10M 1M 100ka 2.99 3.23 3.70 4.21
A second problem is this model fits our observed, integercounts. To correctly estimate µα from samples, we need tomodel the presence of passwords for which pi · M < 1.Power law distributions require assuming a non-zero mini-mum password probability a-priori [44], which we have nomeaningful way of doing.
Instead we need a model ψ(p) for the distribution ofpassword probabilities, an approach taken by linguists formodeling word frequencies [45]. We model the probabilityof observing a password k times using a mixture-model:first we draw a password probability p randomly accordingto the probability density function ψ(p), then we draw froma Poisson distribution with expectation p ·M to model thenumber of times we observe this password:
Pr[k obs.] =
∫ 1
0(p·M)k·e−p·M
k! ψ(p)dp
1−∫ 1
0e−p·Mψ(p)dp
(13)
The numerator integrates the possibility of seeing a pass-word with probability p exactly k times, weighted by theprobability ψ(p) of a password having probability p. Thedenominator corrects for the probability of not observing apassword at all. This formulation allows us to take a set ofcounts from a sample {f1, f2, . . .} and find the parametersfor ψ(p) which maximize the likelihood of our observations:
Likelihood =
N∏i=1
Pr [fi obs.] (14)
This model has been effectively applied to word frequen-cies using the generalized inverse-Gaussian distribution:14
ψ(p|b, c, g) = 2g−1pg−1epc−
b2c4p
(bc)g ·Kg(b)(15)
where Kg is the modified Bessel function of the second kind.
13Power-law distributions are also called Pareto or Zipfian distributions,which can all be shown to be equivalent formulations [42].
14The combined generalized inverse-Gaussian-Poisson model which weadopt is also called the Sichel distribution after its initial use by Sichel in1975 to model word frequencies [46].
0.0 0.2 0.4 0.6 0.8 1.0success rate α
0
5
10
15
20
25
30
35
α-w
ork-f
acto
rµα
(bit
s)
M = 69, 301, 337 (full)
M = 10, 000, 000 (sampled)
M = 1, 000, 000 (sampled)
M = 500, 000 (sampled)
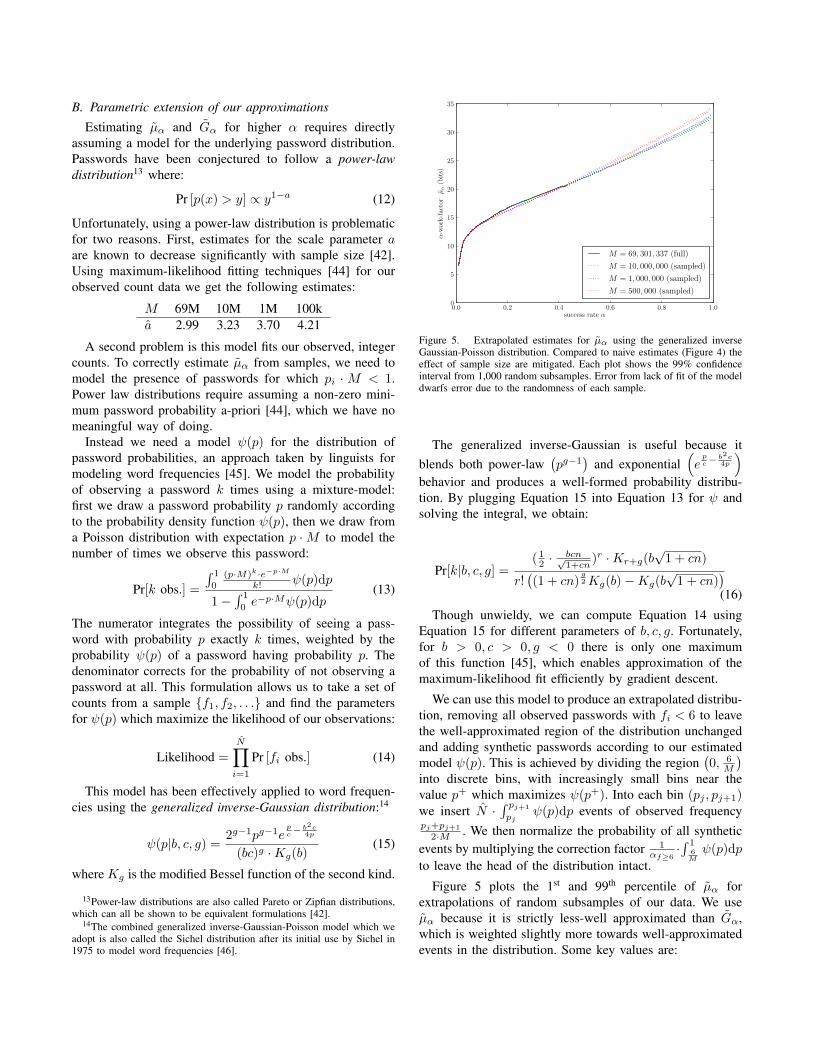
Figure 5. Extrapolated estimates for µα using the generalized inverseGaussian-Poisson distribution. Compared to naive estimates (Figure 4) theeffect of sample size are mitigated. Each plot shows the 99% confidenceinterval from 1,000 random subsamples. Error from lack of fit of the modeldwarfs error due to the randomness of each sample.
The generalized inverse-Gaussian is useful because itblends both power-law
(pg−1
)and exponential
(epc−
b2c4p
)behavior and produces a well-formed probability distribu-tion. By plugging Equation 15 into Equation 13 for ψ andsolving the integral, we obtain:
Pr[k|b, c, g] =( 12 · bcn√
1+cn)r ·Kr+g(b
√1 + cn)
r!((1 + cn)
g2Kg(b)−Kg(b
√1 + cn)
)(16)
Though unwieldy, we can compute Equation 14 usingEquation 15 for different parameters of b, c, g. Fortunately,for b > 0, c > 0, g < 0 there is only one maximumof this function [45], which enables approximation of themaximum-likelihood fit efficiently by gradient descent.
We can use this model to produce an extrapolated distribu-tion, removing all observed passwords with fi < 6 to leavethe well-approximated region of the distribution unchangedand adding synthetic passwords according to our estimatedmodel ψ(p). This is achieved by dividing the region
(0, 6
M
)into discrete bins, with increasingly small bins near thevalue p+ which maximizes ψ(p+). Into each bin (pj , pj+1)we insert N ·
∫ pj+1
pjψ(p)dp events of observed frequency
pj+pj+1
2·M . We then normalize the probability of all syntheticevents by multiplying the correction factor 1
αf≥6·∫ 1
6Mψ(p)dp
to leave the head of the distribution intact.
Figure 5 plots the 1st and 99th percentile of µα forextrapolations of random subsamples of our data. We useµα because it is strictly less-well approximated than Gα,which is weighted slightly more towards well-approximatedevents in the distribution. Some key values are:

69M 10M 1M 500kˆµ0.25 17.74 17.67–17.67 17.24–17.25 17.07–17.17ˆµ0.5 22.01 22.09–22.11 22.06–22.11 22.28–22.48ˆµ0.75 27.07 26.98-27.01 27.25–27.35 27.02–27.89
Our estimates are biased towards under-correction forlower values of α and over-biased for higher values. Still,even with a 500k sample the estimates for µα agree to within1 bit for all values of α.
C. Limitations and estimating confidence
We can not conclude that the underlying probabilitydistribution of passwords is completely modeled. Indeed,using a Kolmogorov-Smirnov test we can reject with veryhigh confidence (p > 0.99) the hypothesis that our samplewas drawn from the modeled distribution.
Our goal is to accurately compare statistics for differently-sized subsamples of our data. Doing so using our empiricalprecision estimates directly is accurate only under the as-sumption that two different subpopulations have each chosena distribution of passwords which our model fits equallywell.15 If some definable population of user-generated pass-words form a very different underlying distribution (forexample, uniform or exponential), then our model mightproduce much more variable estimates. When analyzingour data in Section VI we thus make a weaker claimonly that different demographic subsamples of users aresignificantly different from the global population of users ifour extrapolation produces estimates which are outside the1st or 99th percentile of estimates observed for similarly-sized random samples as listed in this section.
VI. ANALYSIS OF YAHOO! DATA
A. External comparison
We first compare our collected data to several knowndata sets. To the author’s knowledge, there have been twolarge-scale leaks of password data suitable for statisticalanalysis:16 the 2009 RockYou leak and a 2011 leak ofroughly 500k passwords from the gaming website BattlefieldHeroes.17 Guessing metrics for these distributions and ourcollected data are listed in Table III. All three distributions,despite being taken from substantially different populations,agree to within 1 bit for estimates of online attacks (H∞and λ10), and within 2 bits for offline attacks (G0.25 andG0.5).
We plot the guessing curve for our collected data inFigure 6 along with that of the RockYou distribution. We
15Supporting this assumption, we find that our model produces similarlyaccurate estimates for subsamples of the RockYou distribution, the onlyother large password data set to which we have access.
16A prominent 2010 leak revealed nearly 1M passwords from the blog-ging site Gawker, but these were salted via the Unix crypt() function,preventing full analysis of the distribution.
17The Battlefield Heroes passwords were hashed with MD5, but withoutany salt, making analysis of the distribution possible.
M H∞ˆλ10
ˆG0.25ˆG0.5
Yahoo! (2011) 69301337 6.5 9.1 17.6 21.6RockYou (2009) 32603388 6.8 8.9 15.9 19.8Battlefield Heroes (2011) 548774 7.7 9.8 16.5 20.0
Table IIICOMPARISON OF YAHOO! DATA WITH LEAKED DATA SETS
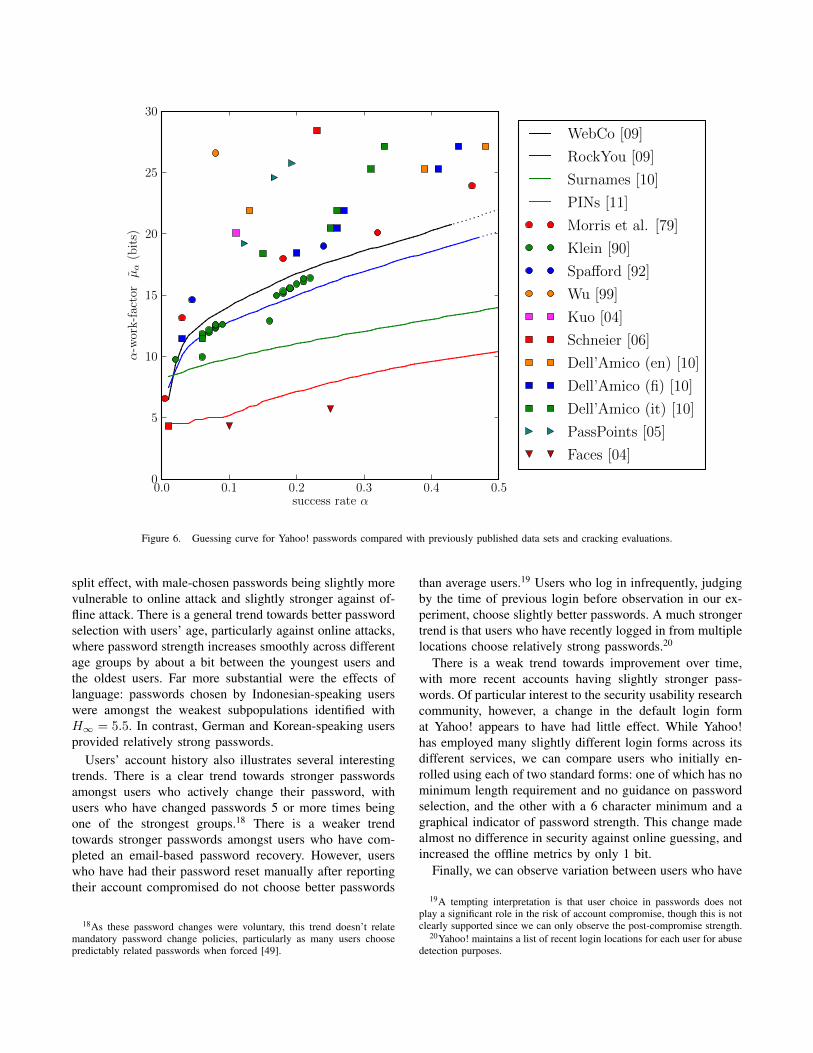
also include guessing curves for two distributions fromnon-password-based authentication schemes: a distributionof four-digit unlock codes used for an iPhone applicationleaked in 2011 [33] and the distribution of surnames (themost common category of answer to personal knowledgequestions) from a large-scale crawl of Facebook [34]. Withinour plot we add estimated data points from cracking experi-ments. We include both the password-cracking experimentsdiscussed in Section II-A and cracking attempts on twographical schemes: a 2004 study of user choice in a face-based graphical PIN scheme [47] and a 2005 study of user-selected image points in the PassPoints scheme [48]. Notethat due to our use of published cracking results, we arerestricted to using µα instead of Gα.
The guessing curve shows how close the distribution ofpasswords at both Yahoo! and RockYou are compared toother authentication schemes. Both password distributionshave a much sharper increase for very low success-rateattackers than the surname or PIN distributions do, meaningpasswords are particularly vulnerable to a trawling attackerwho only makes a few attempts at a large number ofaccounts. However, passwords have comparatively high α-work-factor against brute-force attackers. The 1990 crackingstudy by Klein provided estimates very close to the optimalattack for our observed data, suggesting that passwords havechanged only marginally since then.
B. Comparing subpopulations
Of the 328 subpopulations for which we compiled sepa-rate distributions, we summarize the most interesting whichgathered a sufficient number of samples in Table IV. All ofour sub-distributions had similar guessing metrics: the rangeof H∞ was 5.0–9.1 bits and for λ10 from 7.5–10.9 bits, justover one decimal order of magnitude in variation. Variationin G0.5 was substantially larger, with the weakest populationhaving an estimated 17.0 bits and the strongest 26.6 (nearlythree decimal orders of magnitude).
Thus, while there is no “good” population of users whichisn’t generally vulnerable to guessing attacks, there is stillvariation which is strongly detectable within the limits of oursampling confidence: our estimates of H∞ and λ10 are allaccurate to within at least 0.1 bit based on our calculationsin Section V-A, while our extrapolation of Gα allows us toidentify many groups which are statistically different fromthe overall population as discussed in Section V-C.
Demographically, users’ reported gender had a small but
0.0 0.1 0.2 0.3 0.4 0.5success rate α
0
5
10
15
20
25
30
α-w
ork-f
acto
rµα
(bit
s)WebCo [09]
RockYou [09]
Surnames [10]
PINs [11]
Morris et al. [79]
Klein [90]
Spafford [92]
Wu [99]
Kuo [04]
Schneier [06]
Dell’Amico (en) [10]
Dell’Amico (fi) [10]
Dell’Amico (it) [10]
PassPoints [05]
Faces [04]
Figure 6. Guessing curve for Yahoo! passwords compared with previously published data sets and cracking evaluations.
split effect, with male-chosen passwords being slightly morevulnerable to online attack and slightly stronger against of-fline attack. There is a general trend towards better passwordselection with users’ age, particularly against online attacks,where password strength increases smoothly across differentage groups by about a bit between the youngest users andthe oldest users. Far more substantial were the effects oflanguage: passwords chosen by Indonesian-speaking userswere amongst the weakest subpopulations identified withH∞ = 5.5. In contrast, German and Korean-speaking usersprovided relatively strong passwords.
Users’ account history also illustrates several interestingtrends. There is a clear trend towards stronger passwordsamongst users who actively change their password, withusers who have changed passwords 5 or more times beingone of the strongest groups.18 There is a weaker trendtowards stronger passwords amongst users who have com-pleted an email-based password recovery. However, userswho have had their password reset manually after reportingtheir account compromised do not choose better passwords
18As these password changes were voluntary, this trend doesn’t relatemandatory password change policies, particularly as many users choosepredictably related passwords when forced [49].
than average users.19 Users who log in infrequently, judgingby the time of previous login before observation in our ex-periment, choose slightly better passwords. A much strongertrend is that users who have recently logged in from multiplelocations choose relatively strong passwords.20
There is a weak trend towards improvement over time,with more recent accounts having slightly stronger pass-words. Of particular interest to the security usability researchcommunity, however, a change in the default login format Yahoo! appears to have had little effect. While Yahoo!has employed many slightly different login forms across itsdifferent services, we can compare users who initially en-rolled using each of two standard forms: one of which has nominimum length requirement and no guidance on passwordselection, and the other with a 6 character minimum and agraphical indicator of password strength. This change madealmost no difference in security against online guessing, andincreased the offline metrics by only 1 bit.
Finally, we can observe variation between users who have
19A tempting interpretation is that user choice in passwords does notplay a significant role in the risk of account compromise, though this is notclearly supported since we can only observe the post-compromise strength.
20Yahoo! maintains a list of recent login locations for each user for abusedetection purposes.

M H∞ˆλ10
ˆG0.25ˆG0.5
all passwords 69301337 6.5 9.1 17.6 21.6gender (self-reported)
female 30545765 6.9 9.3 17.2 21.1male 38624554 6.3 8.8 17.7 21.8
age (self-reported)13–24 18199547 6.3 8.7 16.7 20.925–34 22380694 6.2 8.8 17.1 21.235–44 12983954 6.8 9.4 17.4 21.345–54 8075887 7.3 9.8 17.3 21.3≥ 55 7110689 7.5 9.8 17.3 21.4
language preferenceChinese 1564364 6.5 8.6 17.3 22.0German 1127474 7.4 9.7 15.8 19.7English 55805764 6.5 9.0 17.4 21.5French 2084219 6.9 9.0 14.8 18.6Indonesian 1061540 5.5 7.9 14.3 17.0Italian 811133 6.8 9.0 14.5 18.0Korean 530759 7.5 9.5 18.1 22.7Portuguese 2060256 6.5 9.0 15.6 18.8Spanish 3065901 6.6 9.1 15.6 19.7
tenure of account≤ 1 y 5182527 6.9 9.1 18.0 22.51–2 years 5182527 6.9 9.1 18.0 22.52–3 years 12261556 6.2 8.6 17.7 21.83–4 years 10332348 6.2 8.8 17.5 21.64–5 years 9290840 6.1 8.8 17.2 21.2≥ 5 years 29104856 6.8 9.3 17.2 21.2
password requirements at registrationnone 20434875 6.6 9.2 16.8 20.76 char. minimum 13332334 6.5 9.0 17.6 21.6
last recorded login< 30 days 32627777 6.5 9.0 17.5 21.5< 90 days 55777259 6.5 9.0 17.5 21.5> 90 days 8212643 7.0 9.5 17.7 21.9
number of login locations1 16447906 6.0 8.6 17.1 21.1≥2 52853431 6.7 9.2 17.7 21.7≥ 10 17146723 7.3 9.7 18.3 22.6
number of password changesnone 52117133 6.2 8.8 17.1 20.91 9608164 8.3 10.4 18.8 23.2>1 7576040 8.6 10.7 19.5 24.2≥5 930035 9.1 10.9 19.7 25.9
number of password resets (forgotten password)none 61805038 6.4 8.9 17.3 21.31 4378667 8.2 10.5 19.2 23.8>1 3117632 8.7 10.8 19.7 24.6≥5 387469 8.7 10.6 19.9 26.6
amount of data stored with Yahoo!1st quartile 9830792 5.6 8.2 17.3 21.52nd quartile 20702119 6.3 8.8 17.5 21.53rd quartile 21307618 6.8 9.3 17.5 21.44th quartile 17447029 7.6 10.0 17.8 22.0
usage of different Yahoo! featuresmedia sharing 5976663 7.7 10.1 18.0 22.3retail 2139160 8.8 10.5 16.8 21.4webmail 15965774 6.3 8.8 17.4 21.2chat 37337890 6.2 8.7 17.1 21.2social networking 14204900 7.1 9.6 17.7 21.8mobile access 20676566 6.7 9.3 17.1 21.1Android client 1359713 8.3 10.3 17.3 21.5iPhone client 6222547 8.1 10.1 17.6 21.6RIM client 3843404 7.6 10.0 17.2 21.1
Note: Estimates in italics are not significantly different from the aggregatepopulation of users, as discussed in Section V-C.
Table IVGUESSING STATISTICS FOR VARIOUS GROUPS OF YAHOO! USERS.
actively used different Yahoo! services. Users who haveused Yahoo!’s online retail platform (which means they havestored a payment card) do choose very weak passwordswith lower frequency, with λ10 increasing by about 2 bits.However, the distribution is indistinguishable from averageusers against offline attack. A similar phenomenon occursfor users of some other features, such as media sharingor dedicated smartphone clients for Android, Blackberry,or iOS, which see slightly better security against onlineattacks but are indistinguishable otherwise. Other popularfeatures, such as webmail, chat, and social networking, sawslightly fewer weak passwords than normal, but again wereindistinguishable against offline attacks.
One other interesting categorization is the amount of datathat users have stored with Yahoo!. While this is a veryrough proxy for how active user accounts have been, thereis a clear trend that users with a large amount of stored datachoose better passwords.
C. Effects of dictionary specificity
While we have focused so far only on comparing theshape of distributions, it is also interesting to compare theircontent to examine the extent to which an inappropriatecracking dictionary might slow down attackers (or skewthe conclusions of academic studies). To do this, we cansimulate a guessing attack on one distribution by guessingpasswords in the order they appear in another distribution,instead of an optimal attack. We tested the top 1,000passwords in each subpopulation, comparing λ1000 for anattack with the optimal dictionary to a sub-optimal one.A simple example is to compare male and female-chosenpasswords:
dictionary♀ ♂
targ
et ♀ 7.8% 6.8%♂ 6.3% 7.1%
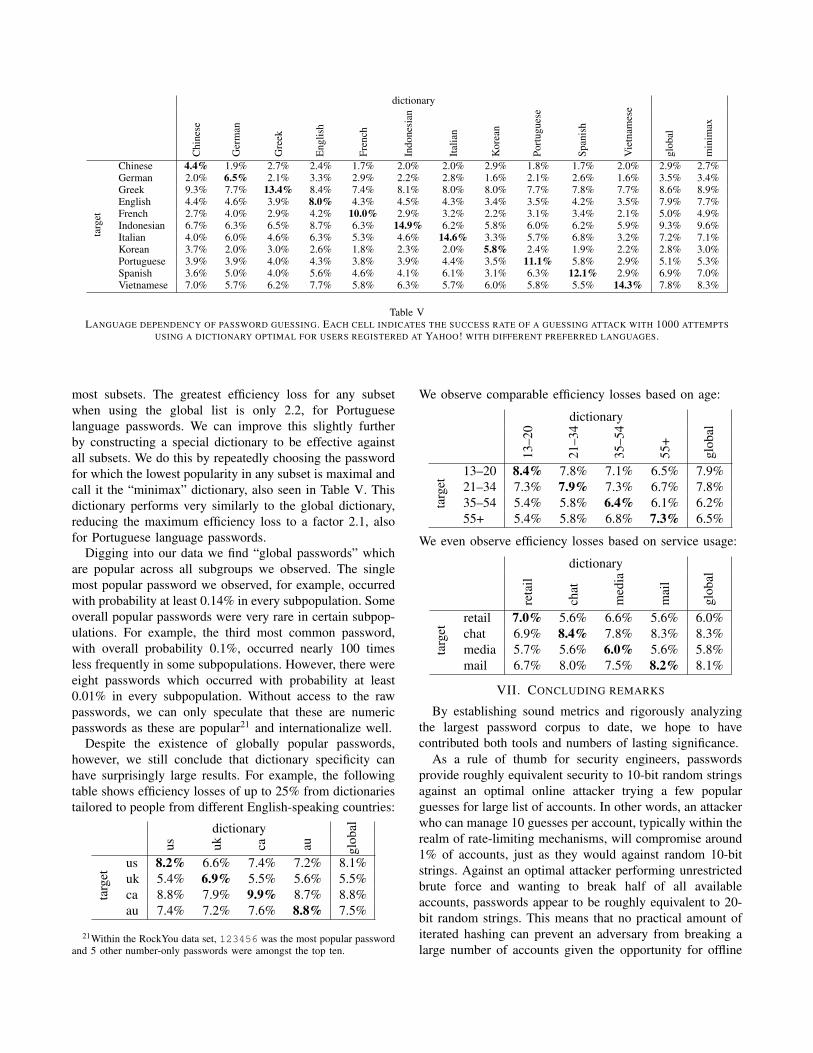
There is a 10–15% loss in efficiency if an attacker uses theoptimal male dictionary against female-chosen passwords, orvice-versa. This is small enough that we may conclude real-world attackers are unlikely to tailor their guessing approachbased on the gender distribution of their target users. Ingeneral, using an inappropriate dictionary has surprisinglylittle impact on guessing efficiency, at least for an attackerwith a desired success rate α < 10%, which we tested to stayin the well-approximated region given our data. In Table Vwe compare the efficiency loss when using a passworddictionary from users of different languages, perhaps themost inappropriate dictionaries possible. Surprisingly, theworst efficiency loss observed is only a factor of 4.8, whenusing an optimal Vietnamese-language password dictionaryagainst French speakers’ passwords.
We also observe in Table V that simply using the globallist of most popular passwords performs very well against
dictionary
Chi
nese
Ger
man
Gre
ek
Eng
lish
Fren
ch
Indo
nesi
an
Ital
ian
Kor
ean
Port
ugue
se
Span
ish
Vie
tnam
ese
glob
al
min
imax
targ
et
Chinese 4.4% 1.9% 2.7% 2.4% 1.7% 2.0% 2.0% 2.9% 1.8% 1.7% 2.0% 2.9% 2.7%German 2.0% 6.5% 2.1% 3.3% 2.9% 2.2% 2.8% 1.6% 2.1% 2.6% 1.6% 3.5% 3.4%Greek 9.3% 7.7% 13.4% 8.4% 7.4% 8.1% 8.0% 8.0% 7.7% 7.8% 7.7% 8.6% 8.9%English 4.4% 4.6% 3.9% 8.0% 4.3% 4.5% 4.3% 3.4% 3.5% 4.2% 3.5% 7.9% 7.7%French 2.7% 4.0% 2.9% 4.2% 10.0% 2.9% 3.2% 2.2% 3.1% 3.4% 2.1% 5.0% 4.9%Indonesian 6.7% 6.3% 6.5% 8.7% 6.3% 14.9% 6.2% 5.8% 6.0% 6.2% 5.9% 9.3% 9.6%Italian 4.0% 6.0% 4.6% 6.3% 5.3% 4.6% 14.6% 3.3% 5.7% 6.8% 3.2% 7.2% 7.1%Korean 3.7% 2.0% 3.0% 2.6% 1.8% 2.3% 2.0% 5.8% 2.4% 1.9% 2.2% 2.8% 3.0%Portuguese 3.9% 3.9% 4.0% 4.3% 3.8% 3.9% 4.4% 3.5% 11.1% 5.8% 2.9% 5.1% 5.3%Spanish 3.6% 5.0% 4.0% 5.6% 4.6% 4.1% 6.1% 3.1% 6.3% 12.1% 2.9% 6.9% 7.0%Vietnamese 7.0% 5.7% 6.2% 7.7% 5.8% 6.3% 5.7% 6.0% 5.8% 5.5% 14.3% 7.8% 8.3%
Table VLANGUAGE DEPENDENCY OF PASSWORD GUESSING. EACH CELL INDICATES THE SUCCESS RATE OF A GUESSING ATTACK WITH 1000 ATTEMPTS
USING A DICTIONARY OPTIMAL FOR USERS REGISTERED AT YAHOO! WITH DIFFERENT PREFERRED LANGUAGES.
most subsets. The greatest efficiency loss for any subsetwhen using the global list is only 2.2, for Portugueselanguage passwords. We can improve this slightly furtherby constructing a special dictionary to be effective againstall subsets. We do this by repeatedly choosing the passwordfor which the lowest popularity in any subset is maximal andcall it the “minimax” dictionary, also seen in Table V. Thisdictionary performs very similarly to the global dictionary,reducing the maximum efficiency loss to a factor 2.1, alsofor Portuguese language passwords.
Digging into our data we find “global passwords” whichare popular across all subgroups we observed. The singlemost popular password we observed, for example, occurredwith probability at least 0.14% in every subpopulation. Someoverall popular passwords were very rare in certain subpop-ulations. For example, the third most common password,with overall probability 0.1%, occurred nearly 100 timesless frequently in some subpopulations. However, there wereeight passwords which occurred with probability at least0.01% in every subpopulation. Without access to the rawpasswords, we can only speculate that these are numericpasswords as these are popular21 and internationalize well.
Despite the existence of globally popular passwords,however, we still conclude that dictionary specificity canhave surprisingly large results. For example, the followingtable shows efficiency losses of up to 25% from dictionariestailored to people from different English-speaking countries:
dictionary
glob
al
us uk ca au
targ
et
us 8.2% 6.6% 7.4% 7.2% 8.1%uk 5.4% 6.9% 5.5% 5.6% 5.5%ca 8.8% 7.9% 9.9% 8.7% 8.8%au 7.4% 7.2% 7.6% 8.8% 7.5%
21Within the RockYou data set, 123456 was the most popular passwordand 5 other number-only passwords were amongst the top ten.
We observe comparable efficiency losses based on age:
dictionary
13–2
0
21–3
4
35–5
4
55+
glob
al
targ
et
13–20 8.4% 7.8% 7.1% 6.5% 7.9%21–34 7.3% 7.9% 7.3% 6.7% 7.8%35–54 5.4% 5.8% 6.4% 6.1% 6.2%55+ 5.4% 5.8% 6.8% 7.3% 6.5%
We even observe efficiency losses based on service usage:
dictionary
reta
il
chat
med
ia
mai
l
glob
al
targ
et
retail 7.0% 5.6% 6.6% 5.6% 6.0%chat 6.9% 8.4% 7.8% 8.3% 8.3%media 5.7% 5.6% 6.0% 5.6% 5.8%mail 6.7% 8.0% 7.5% 8.2% 8.1%
VII. CONCLUDING REMARKS
By establishing sound metrics and rigorously analyzingthe largest password corpus to date, we hope to havecontributed both tools and numbers of lasting significance.
As a rule of thumb for security engineers, passwordsprovide roughly equivalent security to 10-bit random stringsagainst an optimal online attacker trying a few popularguesses for large list of accounts. In other words, an attackerwho can manage 10 guesses per account, typically within therealm of rate-limiting mechanisms, will compromise around1% of accounts, just as they would against random 10-bitstrings. Against an optimal attacker performing unrestrictedbrute force and wanting to break half of all availableaccounts, passwords appear to be roughly equivalent to 20-bit random strings. This means that no practical amount ofiterated hashing can prevent an adversary from breaking alarge number of accounts given the opportunity for offline
search. An important caveat is that these passwords werechosen with very few restrictions—a stricter password se-lection policy might produce distributions with significantlyhigher resistance to guessing.
Still, these numbers represents a minimal benchmarkwhich any serious password replacement scheme shouldaim to decisively clear. The enormous gap between a realpassword distribution and the theoretical space of passwordsshows why research proposals involving human-chosen se-crets should estimate security using metrics like µα and Gαto model partial guessing attacks. Where possible, compar-ison to past empirical estimates of guessing attacks shouldbe provided, as we have done with Figures 1 and 6.
The most troubling finding of our study is how littlepassword distributions seem to vary, with all populationsof users we were able to isolate producing similar skeweddistributions with effective security varying by no more thana few bits. Factors increasing security motivation like regis-tering a payment card only seem to nudge users away fromthe weakest passwords, and a limited natural experimenton actively encouraging stronger passwords seems to havemade little difference. Passwords have been argued to be“secure enough” for the web with users rationally choosingweak passwords for accounts of little importance [50], butthese results may undermine this explanation as user choicedoes not vary greatly with changing security concerns aswould be expected if weak passwords arose primarily dueto user apathy. This may indicate an underlying problemwith passwords that users aren’t willing or able to managehow difficult their passwords are to guess.
ACKNOWLEDGMENTS
This research would not have been possible without thegracious cooperation and support of many people at Yahoo!,in particular Henry Watts, my mentor, Elizabeth Zwickywho provided extensive help collecting and analyzing data,as well as Ram Marti, Clarence Chung, and ChristopherHarris who helped set up data collection experiments. Iwould also like to thank my supervisor Ross Anderson, thepaper’s shepherd Arvind Narayanan, as well as Paul vanOorschot, Richard Clayton, Andrew Lewis, Cormac Herley,Saar Drimer, Markus Kuhn and Bruce Christianson forhelpful comments and discussions about password statistics.My research is funded by the Gates Cambridge Trust.
REFERENCES
[1] M. V. Wilkes, Time-sharing computer systems. New York:Elsevier, 1968.
[2] J. H. Saltzer, “Protection and the Control of InformationSharing in Multics,” Commun. ACM, vol. 17, pp. 388–402,1974.
[3] R. Morris and K. Thompson, “Password Security: A CaseHistory,” Commun. ACM, vol. 22, no. 11, pp. 594–597, 1979.
[4] D. Klein, “Foiling the Cracker: A Survey of, and Improve-ments to, Password Security,” in Proceedings of the 2nd
USENIX Security Workshop, 1990, pp. 5–14.
[5] E. Spafford, “Observations on Reusable Password Choices,”in Proceedings of the 3rd USENIX Security Workshop, 1992.
[6] B. Schneier, “Real-World Passwords,” December 2006.[Online]. Available: www.schneier.com/blog/archives/2006/12/realworld passw.html
[7] M. Dell’Amico, P. Michiardi, and Y. Roudier, “PasswordStrength: An Empirical Analysis,” in INFOCOM’10: Pro-ceedings of the 29th Conference on Information Communi-cations. IEEE, 2010, pp. 983–991.
[8] M. Weir, S. Aggarwal, M. Collins, and H. Stern, “Testingmetrics for password creation policies by attacking large setsof revealed passwords,” in CCS ’10: Proceedings of the 17th
ACM Conference on Computer and Communications Security.ACM, 2010, pp. 162–175.
[9] D. Seeley, “Password Cracking: A Game of Wits,” Commun.ACM, vol. 32, pp. 700–703, 1989.
[10] “John the Ripper,” http://www.openwall.com/john/.
[11] M. Weir, S. Aggarwal, B. de Medeiros, and B. Glodek, “Pass-word Cracking Using Probabilistic Context-Free Grammars,”in SP ’09: Proceedings of the 30th IEEE Symposium onSecurity and Privacy. IEEE, 2009, pp. 391–405.
[12] T. Wu, “A Real-World Analysis of Kerberos Password Se-curity,” in NDSS ’99: Proceedings of the 1999 Network andDistributed System Security Symposium, 1999.
[13] C. Kuo, S. Romanosky, and L. F. Cranor, “Human Selec-tion of Mnemonic Phrase-based Passwords,” in SOUPS ’06:Proceedings of the 2nd Symposium on Usable Privacy andSecurity. ACM, 2006, pp. 67–78.
[14] J. A. Cazier and B. D. Medlin, “Password Security: An Em-pirical Investigation into E-Commerce Passwords and TheirCrack Times.” Information Systems Security, vol. 15, no. 6,pp. 45–55, 2006.
[15] B. L. Riddle, M. S. Miron, and J. A. Semo, “Passwords inuse in a university timesharing environment,” Computers andSecurity, vol. 8, no. 7, pp. 569–578, 1989.
[16] A. Narayanan and V. Shmatikov, “Fast dictionary attackson passwords using time-space tradeoff,” in CCS ’05: Pro-ceedings of the 12th ACM Conference on Computer andCommunications Security. ACM, 2005, pp. 364–372.
[17] C. Castelluccia, M. Durmuth, and D. Perito, “AdaptivePassword-Strength Meters from Markov Models,” NDSS ’12:Proceedings of the Network and Distributed System SecuritySymposium, 2012.
[18] M. Zviran and W. J. Haga, “Password security: an empiricalstudy,” Journal of Management Information Systems, vol. 15,no. 4, pp. 161–185, 1999.
[19] M. M. Devillers, “Analyzing Password Strength,” RadboudUniversity Nijmegen, Tech. Rep., 2010.
[20] W. E. Burr, D. F. Dodson, and W. T. Polk, “ElectronicAuthentication Guideline,” NIST Special Publication 800-63,2006.
[21] D. Florencio and C. Herley, “A large-scale study of webpassword habits,” in WWW ’07: Proceedings of the 16th
International Conference on the World Wide Web. ACM,2007, pp. 657–666.
[22] R. Shay, S. Komanduri, P. G. Kelley, P. G. Leon, M. L.Mazurek, L. Bauer, N. Christin, and L. F. Cranor, “Encoun-tering Stronger Password Requirements: User Attitudes andBehaviors,” in SOUPS ’10: Proceedings of the 6th Symposiumon Usable Privacy and Security. ACM, 2010.
[23] P. G. Kelley, S. Komanduri, M. L. Mazurek, R. Shay, T. Vidas,L. Bauer, N. Christin, L. F. Cranor, and J. Lopez, “Guessagain (and again and again): Measuring password strength bysimulating password-cracking algorithms,” Carnegie MellonUniversity, Tech. Rep. CMU-CyLab-11-008, 2011.
[24] J. Yan, A. Blackwell, R. Anderson, and A. Grant, “PasswordMemorability and Security: Empirical Results,” IEEE Secu-rity and Privacy Magazine, vol. 2, no. 5, pp. 25–34, 2004.
[25] B. Stone-Gross, M. Cova, L. Cavallaro, B. Gilbert, M. Szyd-lowski, R. Kemmerer, C. Kruegel, and G. Vigna, “Your botnetis my botnet: Analysis of a botnet takeover,” in CCS ’09:Proceedings of the 16th ACM Conference on Computer andCommunications Security. ACM, 2009, pp. 635–647.
[26] C. E. Shannon, “A Mathematical Theory of Communication,”in Bell System Technical Journal, vol. 7, 1948, pp. 379–423.
[27] C. Cachin, “Entropy measures and unconditional security incryptography,” Ph.D. dissertation, ETH Zurich, 1997.
[28] J. O. Pliam, “On the Incomparability of Entropy andMarginal Guesswork in Brute-Force Attacks,” in Progress inCryptology-INDOCRYPT 2000, 2000.
[29] S. Boztas, “Entropies, Guessing, and Cryptography,” Depart-ment of Mathematics, Royal Melbourne Institute of Technol-ogy, Tech. Rep. 6, 1999.
[30] J. L. Massey, “Guessing and Entropy,” in Proceedings of the1994 IEEE International Symposium on Information Theory,1994, p. 204.
[31] A. Renyi, “On measures of information and entropy,” Pro-ceedings of the 4th Berkeley Symposium on Mathematics,Statistics and Probability, pp. 547–561, 1961.
[32] R. V. Hartley, “Transmission of Information,” Bell SystemTechnical Journal, vol. 7, no. 3, pp. 535–563, 1928.
[33] J. Bonneau, S. Preibusch, and R. Anderson, “A birthdaypresent every eleven wallets? The security of customer-chosenbanking PINs,” FC ’12: The 16th International Conference onFinancial Cryptography and Data Security, 2012.
[34] J. Bonneau, M. Just, and G. Matthews, “What’s in a name?Evaluating statistical attacks against personal knowledgequestions,” FC ’10: The 14th International Conference onFinancial Cryptography and Data Security, 2010.
[35] S. Brostoff and A. Sasse, ““Ten strikes and you’re out”: In-creasing the number of login attempts can improve passwordusability,” in Proceedings of CHI 2003 Workshop on HCI andSecurity Systems. John Wiley, 2003.
[36] J. Bonneau and S. Preibusch, “The password thicket: technicaland market failures in human authentication on the web,”WEIS ’10: Proceedings of the 9th Workshop on the Economicsof Information Security, 2010.
[37] M. Alsaleh, M. Mannan, and P. van Oorschot, “RevisitingDefenses Against Large-Scale Online Password GuessingAttacks,” IEEE Transactions on Dependable and Secure Com-puting, vol. 9, no. 1, pp. 128–141, 2012.
[38] S. Egelman, J. Bonneau, S. Chiasson, D. Dittrich, andS. Schechter, “Its Not Stealing If You Need It: On the ethics ofperforming research using public data of illicit origin (paneldiscussion),” WECSR ’12: The 3rd Workshop on Ethics inComputer Security Research, 2012.
[39] B. Kaliski, RFC 2898: PKCS #5: Password-Based Cryptog-raphy Specification Version 2.0, IETF, 2000.
[40] D. E. Denning and P. J. Denning, “The tracker: a threat tostatistical database security,” ACM Transactions on DatabaseSystems, vol. 4, pp. 76–96, 1979.
[41] A. Narayanan and V. Shmatikov, “How To Break Anonymityof the Netflix Prize Dataset,” eprint arXiv:cs/0610105, 2006.
[42] H. R. Baayen, Word Frequency Distributions, ser. Text,Speech and Language Technology. Springer, 2001.
[43] W. A. Gale, “Good-Turing smoothing without tears,” Journalof Quantitative Linguistics, vol. 2, 1995.
[44] A. Clauset, C. R. Shalizi, and M. E. J. Newman, “Power-Law Distributions in Empirical Data,” SIAM Rev., vol. 51,pp. 661–703, 2009.
[45] M. Font, X. Puig, and J. Ginebra, “A Bayesian analysis offrequency count data,” Journal of Statistical Computation andSimulation, 2011.
[46] H. Sichel, “On a distribution law for word frequencies,”Journal of the American Statistical Association, 1975.
[47] D. Davis, F. Monrose, and M. K. Reiter, “On User Choicein Graphical Password Schemes,” in Proceedings of the 13th
USENIX Security Symposium, 2004.
[48] S. Wiedenbeck, J. Waters, J.-C. Birget, A. Brodskiy, andN. Memon, “PassPoints: design and longitudinal evaluationof a graphical password system,” International Journal ofHuman-Computer Studies, vol. 63, pp. 102–127, 2005.
[49] Y. Zhang, F. Monrose, and M. K. Reiter, “The security ofmodern password expiration: an algorithmic framework andempirical analysis,” in CCS ’10: Proceedings of the 17th
ACM Conference on Computer and Communications Security.ACM, 2010, pp. 176–186.
[50] C. Herley, P. van Oorschot, and A. S. Patrick, “Passwords: IfWe’re So Smart, Why Are We Still Using Them?” FC ’09:The 13th International Conference on Financial Cryptographyand Data Security, 2009.