the school district of osceola county,...
TRANSCRIPT

The School District of Osceola County, Florida
Educa on which inspires all to their highest poten al
AN EQUAL OPPORTUNITY EMPLOYER
School Board Members
Tim Weisheyer, Chair
Kelvin Soto, Vice Chair
Jay Wheeler
Clarence Thacker
Ricky Booth
Melba Luciano
Superintendent
Todd Seis
Chief Business & Finance Officer
Jose Gonzalez
Director of Budget
School Board Mee ng
July 14, 2015

A Letter from the Superintendent
The 2015-2016 school year marks an exciting time for the Osceola School District. Our district continues
to maintain a strategic focus on providing the highest quality of educational experience for all children
within a framework of economic responsibility to the citizens of Osceola County. It is through the
strongest collaboration among staff, students, parents, School Board members, and the community that
we will take student achievement to new heights this year.
As we work towards continuous improvement, I firmly believe that all students are capable of learning and
achieving high standards. Hundreds of stakeholders have joined me in providing input into the goals that will
drive our efforts this school year: 1. Increase student achievement in every school, as measured by statewide assessments, resulting in
improvement in school grades, learning gains, and graduation rates.
2. Use technology to increase student achievement, communication, assessment, and overall productivity.
3. Employees will attend professional development that is aligned with the district and school goals in order toenhance student achievement and their professional growth.
4. Cultivate and communicate a safe and positive environment for students, parents, staff, and community.
5. Ensure that resources are allocated to achieve maximum student success while complying with legalrequirements and maintaining the long-term financial health of the District.
Our commitment to preparing our students for college and careers is unwavering, and engaging our
community for the purpose of increased student achievement has never been more important. For more
information about our fully-accredited school district, please visit us online at www.osceola.k12.fl.us. I also
encourage you to visit our schools to see first-hand the outstanding offerings and learning environments that
are in place to contribute to all of our students’ successes.
Sincerely,
Melba Luciano Superintendent
School District of Osceola County 817 Bill Beck Blvd. Kissimmee, Florida 34744
407-870-4600

SCHOOL INSTRUCTION AND SUPPORT 396,378,320$
Instruction 303,119,928$ Pupil Personnel Services 22,310,471 Instructional Media Services 4,688,675 Instructional and Curriculum Development Services 10,869,531 Instructional Staff Training Services 5,600,544 Instruction Related Technology 4,082,469 School Administration 23,402,382 Pupil Transportation Services 22,304,320 OPERATIONS 46,827,997 Facilities Acquisition and Construction 2,637,316 Food Services 76,275 Operation of Plant 35,093,741 Maintenance of Plant 9,020,665 OTHER 22,210,300 School Board 2,196,653 General Administration 1,412,291 Fiscal Services 2,233,471 Central Services 7,634,077 Administrative Technology Services 4,380,085 Community Services 4,278,723 Debt Services 75,000
Operating Budget by Category
THE SCHOOL DISTRICT OF OSCEOLA COUNTY, FLDISTRICT OVERVIEW ‐ 2015‐16
Federal12%
State47%
Local41%
Funding Sources
Federal
State
Local
Traditional72%
Virtual4%
Charter & Choice
24%
Schools by Type
Traditional
Virtual
Charter & Choice
‐ 50,000 100,000 150,000 200,000 250,000 300,000 350,000
Osceola County Population*
Total Students
Total District Employees
310,211
59,731
7,329
*U.S. Census Bureau Data
$250,000,000
$275,000,000
$300,000,000
$325,000,000
$350,000,000
$375,000,000
$400,000,000
$425,000,000
$450,000,000
$475,000,000
School Instruction and
Support
$396,378,320
Operations$46,827,997
Other$22,210,300

TABLE OF CONTENTS
2015‐16 PROPOSED TENTATIVE BUDGET
INTRODUCTION
Budget Timeline I-2
Budget Conven ons I-3
Budget Summary - All Funds I-6
Ini al FTE Projec ons by School I-7
FTE - Historical and Projected I-9
Cer fica on of Taxable Value (DR-420S) I-10
Tax Millage & Levy - Historical and Projected I-12
FEFP Funding Comparison I-13
FEFP Components I-14
Total and Per FTE Funding - Historical and Projected I-19
Historical Base Student Alloca on Analysis I-20
Policy for Expenditure of Lo ery Funds I-21
RESOLUTIONS
Resolu on Adop ng Tenta ve Millage Rates R-2
Resolu on Adop ng Tenta ve Budget R-3
ADVERTISEMENTS
Sample No ce of Budget Hearing A-2
Sample No ce of Proposed Tax Increase A-3
Sample Budget Summary Ad A-4
Sample No ce for School Capital Outlay A-5
I ‐ GENERAL FUND 100
General Fund Narra ve 1-2
Long Range Forecast 1-3
General Fund Budget Summary 1-4
Es mated Revenues and Beginning Fund Balance 1-5
Es mated Revenue Detail 1-6
Appropria ons and Ending Fund Balance 1-7
Line Item Budget Alloca ons 1-8
II ‐ DEBT SERVICE FUND 2XX
Debt Service Fund Narra ve 2-2
Es mated Revenues and Beginning Fund Balance 2-3
Appropria ons and Ending Fund Balance 2-4
Es mated Revenues and Appropria on by Fund 2-5
Future Debt Service Payments 2-7
Debt Capacity Analysis 2-9

TABLE OF CONTENTS
2015‐16 PROPOSED TENTATIVE BUDGET
III ‐ CAPITAL PROJECTS FUND 3XX
Capital Projects Fund Narra ve 3-2
Capital Revenue - Historical and Projected 3-3
Proposed Five Year Capital Plan 3-4
Es mated Revenues and Beginning Fund Balance 3-7
Appropria ons and Ending Fund Balance 3-8
Es mated Revenues by Fund 3-9
Appropria ons by Fund 3-11
Technology Infrastructure Carryover 3-13
Technology Infrastructure New Items 3-14
Cyclical Capital Carryover 3-15
Cyclical Capital Renewal New Items 3-18
IV ‐ SPECIAL REVENUE FUND 4XX
Special Revenue Fund Narra ve 4-2
Combined Special Revenue Funds
Es mated Revenues and Beginning Fund Balance Summary 4-3
Appropria ons and Ending Fund Balance Summary 4-4
Special Revenue Fund ‐ Food Service
Es mated Revenues and Beginning Fund Balance Summary 4-5
Appropria ons and Ending Fund Balance Summary 4-6
Special Revenue Fund ‐ Other
Es mated Revenues and Beginning Fund Balance Summary 4-7
Appropria ons and Ending Fund Balance Summary 4-8
Es mated Revenues and Beginning Fund Balances by Fund 4-9
Appropria ons and Ending Fund Balances by Fund 4-10
Special Revenue Fund ‐ ARRA Stabiliza on/S mulus
Es mated Revenues and Beginning Fund Balance Summary 4-11
Appropria ons and Ending Fund Balance Summary 4-12
Es mated Revenues and Beginning Fund Balances by Fund 4-13
Appropria ons and Ending Fund Balances by Fund 4-14
V ‐ INTERNAL SERVICE FUND 7XX
Internal Service Fund Narra ve 5-2
Combined Internal Service Funds
Es mated Revenues and Beginning Net Assets 5-3
Appropria ons and Ending Net Assets 5-4
Health and Life Insurance Trust Fund
Es mated Revenues and Beginning Net Assets 5-5
Appropria ons and Ending Net Assets 5-6
Casualty Insurance Loss Fund
Es mated Revenues and Beginning Net Assets 5-7
Appropria ons and Ending Net Assets 5-8
2015-16 Insurance Rates 5-9
Board Contribu on for Health Insurance - Historical and Projected 5-10

INTRODUCTION
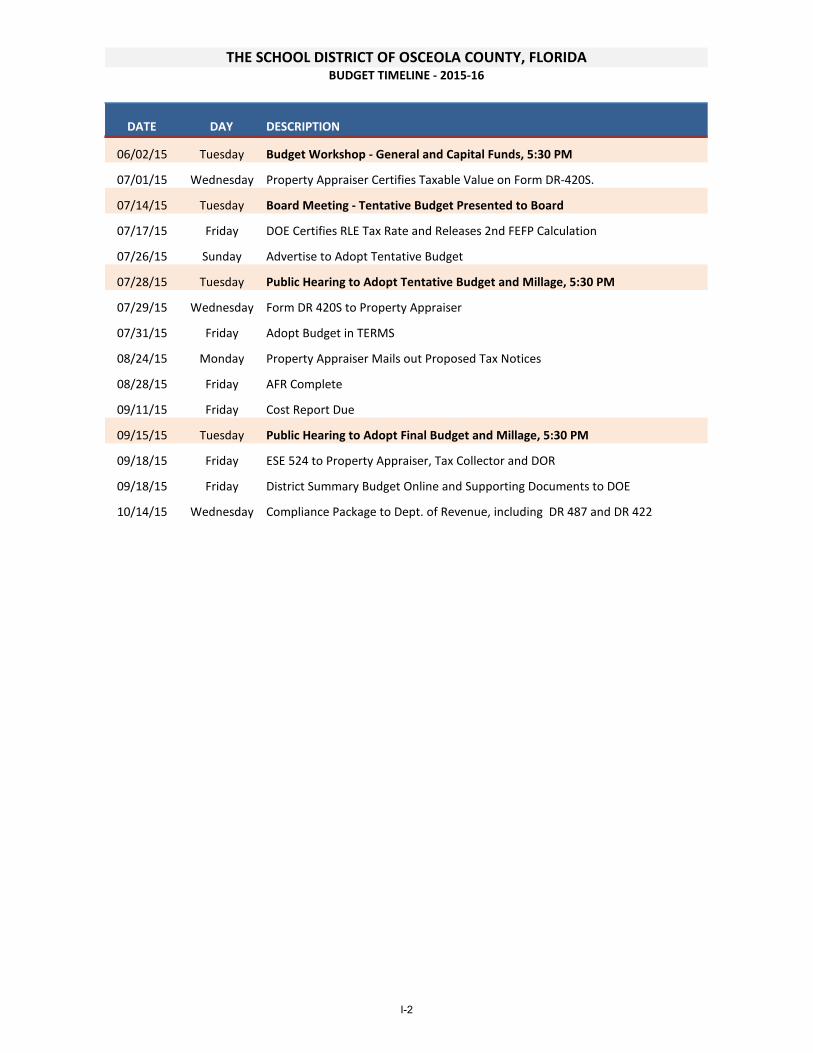
DATE DAY DESCRIPTION
06/02/15 Tuesday Budget Workshop - General and Capital Funds, 5:30 PM
07/01/15 Wednesday Property Appraiser Certifies Taxable Value on Form DR-420S.
07/14/15 Tuesday Board Meeting - Tentative Budget Presented to Board
07/17/15 Friday DOE Certifies RLE Tax Rate and Releases 2nd FEFP Calculation
07/26/15 Sunday Advertise to Adopt Tentative Budget
07/28/15 Tuesday Public Hearing to Adopt Tentative Budget and Millage, 5:30 PM
07/29/15 Wednesday Form DR 420S to Property Appraiser
07/31/15 Friday Adopt Budget in TERMS
08/24/15 Monday Property Appraiser Mails out Proposed Tax Notices
08/28/15 Friday AFR Complete
09/11/15 Friday Cost Report Due
09/15/15 Tuesday Public Hearing to Adopt Final Budget and Millage, 5:30 PM
09/18/15 Friday ESE 524 to Property Appraiser, Tax Collector and DOR
09/18/15 Friday District Summary Budget Online and Supporting Documents to DOE
10/14/15 Wednesday Compliance Package to Dept. of Revenue, including DR 487 and DR 422
THE SCHOOL DISTRICT OF OSCEOLA COUNTY, FLORIDABUDGET TIMELINE - 2015-16
I-2

BUDGET CONVENTIONS
ASSIGNED FUND BALANCE:
Unrestricted fund balance in the General Fund is assigned for the following purposes in the priority listed. Any remaining fund balance is unassigned. Items 1 and 2 are included as carryover appropriations each year.
1. Assigned for Contract Commitments – The amount needed to pay the balance ofoutstanding purchase orders
2. Assigned for Carryover Appropriations – The unspent balances in specific programs thatcarry forward due to internal policy rather than external requirements, e.g. facility usefees
3. Assigned for Projected Operating Deficit – To fund the projected operating deficit for thenext year
NON‐SALARY BUDGETS:
Schools are allocated non‐salary funds on a per student basis. These are budgeted at the school’s discretion to cover non‐salary operating costs of the school and may be moved between accounts as necessary. Allowable expenses include supplies, equipment, substitutes, overtime, travel, repairs, and communications.
Departments are allocated non‐salary funds on a per employee basis. These are budgeted at the department’s discretion to cover non‐salary operating costs of the department and may be moved between accounts as necessary. Allowable expenses include supplies, equipment, overtime, travel, and communications.
Other non‐salary budgets in the General Fund are controlled by project number and restricted for designated purposes. These budgets are controlled by the Budget Department and cannot be changed by schools or departments. Expenses from these budgets are reviewed to ensure reasonableness, allowability and compliance with the designated purpose. Examples of these non‐salary budget appropriations are the Comprehensive Reading Allocation, Instructional Materials Allocation, Supplemental Academic Instruction (SAI) funding and line items.
Non‐salary budgets for grants in the Special Revenue fund are managed by project managers in the department that receives the grant. The Grant Management Department monitors the reasonableness and allowability of expenses from these budgets and ensures compliance with applicable Federal, State and local regulations.
I-3

OVERTIME:
Overtime is recorded in three different categories:
Straight overtime for hours worked between the employee’s regularly scheduled hoursper week (37.5 hours for most employees, 25 hours for bus drivers and attendants) and40 hours per week.
Extra pay for time worked in a different assignment than the employee’s normal job.
Time and one half overtime for hours worked over 40 hours per week.
Overtime is normally not included in salary budgets, but is paid from the non‐salary allocations of schools and departments. The average salary for bus drivers and attendants, however, includes overtime and is included in the original salary budget.
REIMBURSEMENTS:
Reimbursements frequently occur within the budget when salary or non‐salary expenditures originally occur in one fund or department and are later charged to another fund or department either directly or as an overhead cost allocation. In these cases, reimbursement accounts are normally used in the fund or department where the original charge occurred in order to maintain tracking of the original cost. Such cost reimbursements would allow the gross expenditures in a fund or department to exceed the budget by the amount of the expenditures reallocated to other funds or departments. The net expenditures in every fund or department will be covered by the appropriations approved by the Board. Reimbursements typically occur, for example, in the Transportation department for field trips charged to schools, in the Facilities and Maintenance department for costs later charged to capital projects, and in other departments for overhead costs allocated to charter schools.
RESTRICTED FUND BALANCE:
The unspent balances in Federal, State, and local grant programs are restricted by external authorities for specific purposes. These are reported as restrictions of beginning fund balance and included as carryover appropriations in the current year.
RESTRICTED NET ASSETS:
In the Internal Service Fund, the balance of unspent appropriations is restricted for the administration and support of the District’s group health and life self‐insurance and the casualty insurance programs. These amounts are reported as restricted net assets.
I-4
SALARY BUDGETS:
Salary budgets include salaries, FICA, retirement, and board insurance contributions for all allocated positions.
Position allocations and salary budgets are controlled by the Budget Department and cannot be changed by schools or departments. There must be an allocated position for anyone to be hired and paid.
The cost per allocated position is based on the actual current salary of the employee assigned to that position. The cost of vacant positions is estimated based on the average salaries of employees currently filling similar positions. Bus drivers and bus attendants are budgeted at average cost per person in the prior year, including overtime.
UNASSIGNED FUND BALANCE:
Unassigned fund balance in the General Fund is allocated for the following purposes in the priority listed.
1. Unassigned – 6% Minimum per Board – Six percent (6%) of the total of revenues andincoming transfers in the General Fund per direction of the School Board
2. Unassigned Fund Balance – All remaining fund balance
I-5

BUDGET SUMMARY ‐ ALL FUNDS
SCHOOL DISTRICT OF OSCEOLA COUNTY, FLORIDA
FISCAL YEAR 2015‐16
PROPOSED MILLAGE LEVIES SUBJECT TO 10‐MILL CAP:
5.1140 0.0000
Operating or Capital Not to 0.00001.5000 0.0000 Exceed 2 Years0.7480 (Operating) Debt Service 0.0000
0.0000 7.3620
GENERAL SPECIAL DEBT CAPITAL INTERNAL PERMANENT TOTAL ALL
ESTIMATED REVENUES: FUND REVENUE SERVICE PROJECTS SERVICE FUND FUNDS
Federal sources 500,000 77,087,555 2,177,523 79,765,078
State sources 296,746,566 424,000 1,617,717 2,975,904 301,764,187
Local sources 132,807,173 2,774,000 12,909,399 56,839,894 57,098,746 262,429,212
TOTAL SOURCES $430,053,739 $80,285,555 $16,704,639 $59,815,798 $57,098,746 $0 $643,958,477
Transfers In 13,519,741 20,890,665 5,530,357 39,940,763
Fund Balances/Reserves/Net Assets 63,746,363 9,050,888 9,827,716 47,329,780 21,986,067 151,940,814
TOTAL REVENUES, TRANSFERS &
BALANCES $507,319,843 $89,336,442 $47,423,020 $112,675,935 $79,084,813 $0 $835,840,054
EXPENDITURES
Instruction 303,119,928 27,152,961 330,272,889
Pupil Personnel Services 22,310,471 2,314,020 24,624,491
Instructional Media Services 4,688,675 140,571 4,829,246
Instructional and Curriculum Development Services 10,869,531 9,115,831 19,985,362
Instructional Staff Training Services 5,600,544 5,879,163 11,479,707
Instruction Related Technology 4,082,469 712,882 4,795,351
School Board 2,196,653 2,196,653
General Administration 1,412,291 1,077,058 2,489,349
School Administration 23,402,382 23,402,382
Facilities Acquisition and Construction 2,637,316 43,126,681 45,763,997
Fiscal Services 2,233,471 2,233,471
Food Services 76,275 34,007,251 34,083,526
Central Services 7,634,077 482,299 57,345,791 65,462,167
Pupil Transportation Services 22,304,320 345,847 22,650,167
Operation of Plant 35,093,741 46,575 35,140,316
Maintenance of Plant 9,020,665 9,020,665
Administrative Technology Services 4,380,085 60,347 4,440,432
Community Services 4,278,723 1,200,000 5,478,723
Debt Services 75,000 30,017,781 30,092,781
TOTAL EXPENDITURES $465,416,617 $82,534,806 $30,017,781 $43,126,681 $57,345,791 $0 $678,441,675
Transfers Out 5,530,357 34,410,406 39,940,763
Fund Balances/Reserves/Net Assets 41,903,227 6,801,637 11,874,882 35,138,848 21,739,022 117,457,615
TOTAL APPROPRIATED EXPENDITURES
TRANSFERS, RESERVES & BALANCES $507,319,843 $89,336,442 $47,423,020 $112,675,935 $79,084,813 $0 $835,840,054
TOTAL MILLAGE
Funding Adjustment Millage) (Operating)Local Capital Improvement (Capital Outlay) Additional Millage Not to Exceed 4 YearsDiscretionary Operating
Discretionary Capital Improvement
THE PROPOSED OPERATING BUDGET EXPENDITURES OF THE OSCEOLA COUNTY SCHOOL DISTRICT ARE 7.4%
MORE THAN LAST YEAR'S TOTAL OPERATING EXPENDITURES.
NOT SUBJECT TO 10‐MILL CAP:Discretionary Critical NeedsRequired Local Effort (Including Prior Period
PROPOSED MILLAGE LEVIES
I-6

2015 2016
CENTER NAME
2014‐15
4TH CALC
2015‐16
PROJECTION CHANGE
0401 BOGGY CREEK ELEMENTARY 714.36 680.74 (33.62)
0061 CENTRAL AVENUE ELEMENTARY 711.60 643.79 (67.81)
0957 CHESTNUT ELEM SCIENCE & ENGIN 751.69 678.78 (72.91)
0851 CYPRESS ELEMENTARY 726.56 699.37 (27.19)
0831 DEERWOOD ELEMENTARY 671.79 642.84 (28.95)
0961 EAST LAKE ELEMENTARY 973.93 1,000.27 26.34
0931 FLORA RIDGE ELEMENTARY 921.16 868.16 (53.00)
0501 HICKORY TREE SCHOOL 715.80 718.94 3.14
0071 HIGHLANDS ELEMENTARY 937.74 915.50 (22.24)
0042 KISSIMMEE ELEMENTARY SCHOOL 995.95 970.02 (25.93)
0300 KOA ELEMENTARY SCHOOL 758.97 697.94 (61.03)
0801 LAKEVIEW ELEMENTARY 649.26 649.65 0.39
0271 MICHIGAN AVENUE ELEMENTARY 644.75 637.17 (7.58)
0701 MILL CREEK ELEMENTARY 975.45 939.13 (36.32)
0043 NARCOOSSEE ELEMENTARY 767.22 803.97 36.75
0933 NEPTUNE ELEMENTARY 983.65 973.16 (10.49)
0904 PARTIN SETTLEMENT ELEMENTARY 791.22 787.87 (3.35)
0811 PLEASANT HILL ELEMENTARY 889.68 835.71 (53.97)
0901 POINCIANA ACADEMY OF FINE ARTS 764.91 739.94 (24.97)
0301 REEDY CREEK ELEMENTARY 967.12 949.49 (17.63)
0111 ST. CLOUD ELEMENTARY SCHOOL 970.15 945.58 (24.57)
0958 SUNRISE ELEMENTARY 1,001.07 996.92 (4.15)
0101 THACKER AVE ELEM INTL STUDIES 891.26 871.46 (19.80)
0321 VENTURA ELEMENTARY 946.53 896.66 (49.87)
Subtotal Elementary Schools 20,121.82 19,543.07 (578.75)
0091 DENN JOHN MIDDLE SCHOOL 1,021.92 951.35 (70.57)
0041 DISCOVERY INTERMEDIATE 6‐8 1,138.29 1,160.10 21.81
0341 HORIZON MIDDLE SCHOOL 1,219.78 1,238.78 19.00
0251 KISSIMMEE MIDDLE SCHOOL 1,257.94 1,252.48 (5.46)
0040 NARCOOSSEE MIDDLE SCHOOL 1,089.56 1,155.51 65.95
0311 NEPTUNE MIDDLE SCHOOL 1,295.64 1,298.88 3.24
0821 PARKWAY MIDDLE SCHOOL 938.18 909.16 (29.02)
0272 ST. CLOUD MIDDLE SCHOOL 1,172.09 1,170.80 (1.29)
Subtotal Middle Schools 9,133.40 9,137.07 3.67
0902 CELEBRATION HIGH SCHOOL 2,154.87 2,271.35 116.48
0601 GATEWAY HIGH SCHOOL 2,416.78 2,475.90 59.12
0922 HARMONY HIGH SCHOOL 1,822.41 1,867.41 45.00
0842 LIBERTY HIGH SCHOOL 1,913.85 1,995.94 82.09
0081 OSCEOLA HIGH SCHOOL 2,543.04 2,612.82 69.78
0862 PATHS AT TECO 606.76 615.76 9.00
0841 POINCIANA HIGH SCHOOL 1,547.71 1,557.81 10.10
0201 ST. CLOUD HIGH SCHOOL 2,214.50 2,240.39 25.89
9003 ZENITH SCHOOL 504.61 513.80 9.19
Subtotal High Schools 15,724.53 16,151.19 426.66
0711 CELEBRATION SCHOOL (KG‐8) 1,278.62 1,307.80 29.18
0011 HARMONY COMMUNITY SCHOOL K‐8 830.52 867.09 36.57
9036 NEW BEGINNINGS 230.79 191.88 (38.91)
0921 OSCEOLA CNTY SCH FOR THE ARTS 911.42 920.41 8.99
0302 WESTSIDE SCHOOL K‐8 1,486.91 1,501.38 14.47
Multi‐Level Schools 4,738.26 4,788.56 50.30
9020 OASIS ADOLESCENT CAMPUS 21.88 19.51 (2.37)
9041 HOSPITAL/HOMEBOUND 9.48 5.03 (4.45)
0859 OSCEOLA CO COMMITMENT FACILITY 28.69 26.60 (2.09)
7004 OSCEOLA SECONDARY VIRTUAL 77.76 72.66 (5.10)
7001 OSCEOLA VIRTUAL INSTRUCTION 61.39 78.87 17.48
7006 OSCEOLA VIRTUAL INSTRUCTION 0.00 0.00 0.00
Subtotal Alternative Schools 199.20 202.66 3.46
THE SCHOOL DISTRICT OF OSCEOLA COUNTY, FLORIDAINITIAL FTE PROJECTIONS BY SCHOOL ‐ 2015‐16
I-7

CENTER NAME
2014‐15
4TH CALC
2015‐16
PROJECTION CHANGE
0149 RENAISSANCE CHARTER SOUTH 1,090.04 1,094.91 4.87
0151 ACCLAIM ACADEMY OF FLORIDA 384.39 0.00 (384.39)
0155 AVANT GARDE 513.06 535.75 22.69
0162 ST. CLOUD PREPARATORY 245.10 259.79 14.69
0932 BELLALAGO CHARTER ACADEMY KG‐8 1,329.60 1,313.36 (16.24)
0916 CANOE CREEK CHARTER (KG‐8) 543.88 541.28 (2.60)
0153 FLORIDA VIRTUAL ACADEMY 109.97 131.18 21.21
0863 FOUR CORNERS CHARTER ELEM (KG‐5) 1,072.06 685.31 (386.75)
0152 FOUR CORNERS CHARTER MIDDLE 0.00 381.01 381.01
0866 KISSIMMEE CHARTER (KG‐8) 777.68 776.37 (1.31)
0959 MAVERICKS HIGH SCHOOL 539.29 512.33 (26.96)
0853 NEW DIMENSIONS HIGH SCHOOL 409.89 408.56 (1.33)
0881 P M WELLS CHARTER (KG‐8) 853.11 866.66 13.55
0900 UCP SCHOOL BIRTH‐5 YEARS 60.00 78.46 18.46
9999 NEW CHARTER SCHOOLS 0.00 985.62 460.00
Subtotal Charter Schools 7,928.07 8,570.57 642.50
3518 MCKAY SCHOLARSHIP 723.64 781.60 57.96
Subtotal McKay Schools 723.64 781.60 57.96
9000 UNDISTRIBUTED 0.00 555.94 555.94
Subtotal McKay Schools 0.00 555.94 555.94
GRAND TOTAL 58,568.92 59,730.66 1,161.74
I-8
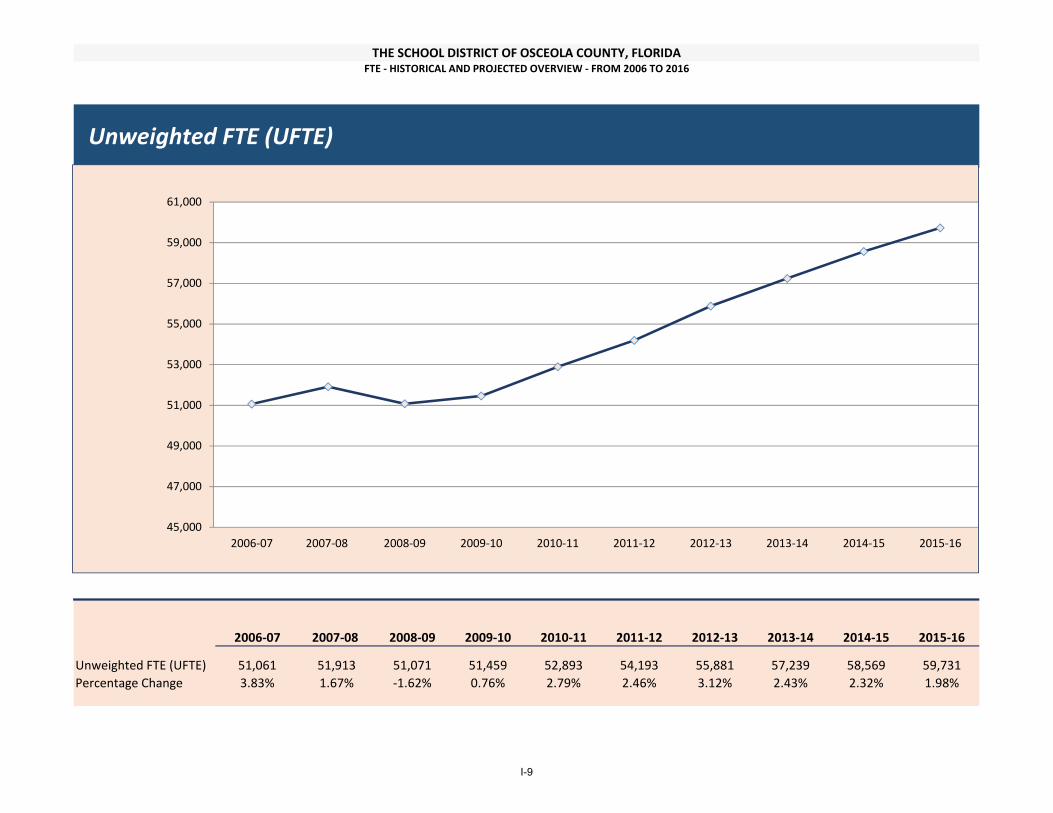
2006‐07 2007‐08 2008‐09 2009‐10 2010‐11 2011‐12 2012‐13 2013‐14 2014‐15 2015‐16
Unweighted FTE (UFTE) 51,061 51,913 51,071 51,459 52,893 54,193 55,881 57,239 58,569 59,731
Percentage Change 3.83% 1.67% ‐1.62% 0.76% 2.79% 2.46% 3.12% 2.43% 2.32% 1.98%
THE SCHOOL DISTRICT OF OSCEOLA COUNTY, FLORIDAFTE ‐ HISTORICAL AND PROJECTED OVERVIEW ‐ FROM 2006 TO 2016
Unweighted FTE (UFTE)
45,000
47,000
49,000
51,000
53,000
55,000
57,000
59,000
61,000
2006‐07 2007‐08 2008‐09 2009‐10 2010‐11 2011‐12 2012‐13 2013‐14 2014‐15 2015‐16
I-9

CERTIFICATION OF SCHOOL TAXABLE VALUEDR-420S
R. 5/13 Rule 12D-16.002, FAC
Effective 5/13 Provisional
Year : County :
Name of School District :
SECTION I : COMPLETED BY PROPERTY APPRAISER. SEND TO SCHOOL DISTRICTCurrent year taxable value of real property for operating purposes1. $ (1)
2. Current year taxable value of personal property for operating purposes $ (2)
3. Current year taxable value of centrally assessed property for operating purposes $ (3)
4. Current year gross taxable value for operating purposes (Line 1 plus Line 2 plus Line 3) $ (4)
5.
Current year net new taxable value (Add new construction, additions, rehabilitativeimprovements increasing assessed value by at least 100%, annexations, and tangiblepersonal property value over 115% of the previous year's value. Subtract deletions.) $ (5)
6. Current year adjusted taxable value (Line 4 minus Line 5) $ (6)
7. Prior year FINAL gross taxable value from prior year applicable Form DR-403 Series $ (7)
8.Does the taxing authority levy a voted debt service millage or a millage voted for 2 yearsor less under s. 9(b), Article VII, State Constitution?(If yes, complete and attach form DR-420DEBT, Certification of Voted Debt Millage.)
Yes No (8)
SIGN
HERE
Property Appraiser Certification I certify the taxable values above are correct to the best of my knowledge.
Signature of Property Appraiser : Date :
SECTION II : COMPLETED BY SCHOOL DISTRICTS. RETURN TO PROPERTY APPRAISERLocal board millage includes discretionary and capital outlay.
9. Prior year state law millage levy: Required Local Effort (RLE) (Sum of previous year's RLE andprior period funding adjustment)
per $1,000 (9)
10. Prior year local board millage levy (All discretionary millages) per $1,000 (10)
11. Prior year state law proceeds (Line 9 multiplied by Line 7, divided by 1,000) $ (11)
12. Prior year local board proceeds (Line 10 multiplied by Line 7, divided by 1,000) $ (12)
13. Prior year total state law and local board proceeds (Line 11 plus Line 12) $ (13)
14. Current year state law rolled-back rate (Line 11 divided by Line 6, multiplied by 1,000) per $1,000 (14)
15. Current year local board rolled-back rate (Line 12 divided by Line 6, multiplied by 1,000) per $1,000
16. Current year proposed state law millage rate (Sum of RLE and prior period funding adjustment) per $1,000
(15)
(16)
A.Capital Outlay B. Discretionary Operating
C. Discretionary Capital Improvement
D. Use only with instructions from the Department of Revenue
Continued on page 2
E. Additional Voted Millage
17.
Current year proposed local board millage rate (17A plus 17B, plus 17C, plus 17D, plus 17E) per $1,000
(17)
OSCEOLA2015
100,539,275
2.1463
4.8951
20,538,554,240
✔
0.0000
4,493,484
44,082,756
2.2480
Electronically Certified by Property Appraiser 6/29/2015 11:17 AM
591,378,765
2.2480
19,746,221,919
19,609,766,981
5.1140
0.7480
SCHOOL DISTRICT OF OSCEOLA COUNTY
144,622,031
1.5000
21,129,933,005
1,379,217,602
0.0000
5.1270
I-10

DR-420S R. 5/13 Page 2
Name of School District :
18. Current year state law proceeds (Line 16 multiplied by Line 4, divided by 1,000) $ (18)
19. Current year local board proceeds (Line 17 multiplied by Line 4, divided by 1,000) $ (19)
20. Current year total state law and local board proceeds (Line 18 plus Line 19) $ (20)
21. Current year proposed state law rate as percent change of state law rolled-back rate(Line 16 divided by Line 14, minus 1, multiplied by 100)
% (21)
22. Current year total proposed rate as a percent change of rolled-back rate{[(Line 16 plus Line 17) divided by (Line 14 plus Line 15)], minus 1}, multiplied by 100
% (22)
Final public budget hearing
Date : Time : Place :
S I G N
H E R E
Taxing Authority CertificationI certify the millages and rates are correct to the best of my knowledge. The millages comply with the provisions of s. 200.065, F.S.
Signature of Chief Administrative Officer : Date :
Title : Contact Name And Contact Title :
Mailing Address : Physical Address :
City, State, Zip : Phone Number : Fax Number :KISSIMMEE, FL 34744
108,058,477
817 BILL BECK BLVD
47,500,089
817 Bill Beck Boulevard, Kissimmee, FL 34744-44955:30 PM
407.518.2906
9/15/2015
155,558,567
4.47
4.55
ADMINISTRATION CENTER
407.870.4823
TODD SEIS, CHIEF BUSINESS & FINANCE OFFICERMELBA LUCIANO, SUPERINTENDENT
I-11

Millage History 2006‐07 2007‐08 2008‐09 2009‐10 2010‐11 2011‐12 2012‐13 2013‐14 2014‐15 2015‐16
Required Local Effort (RLE) 5.022 5.052 5.059 5.165 5.175 5.300 5.054 5.261 5.104 5.114
RLE Prior Period Adjustment 0.000 0.000 0.000 0.000 0.042 0.029 0.021 0.000 0.023 0.000
Discretionary 0.510 0.510 0.498 0.748 0.748 0.748 0.748 0.748 0.748 0.748
Supplemental Discretionary 0.250 0.210 0.206 0.250 0.250 0.000 0.000 0.000 0.000 0.000
Subtotal Operating 5.782 5.772 5.763 6.163 6.215 6.077 5.823 6.009 5.875 5.862
Capital Outlay 2.000 2.000 1.750 1.500 1.500 1.500 1.500 1.500 1.500 1.500
Debt Service 0.000 0.000 0.000 0.000 0.000 0.000 0.000 0.000 0.000 0.000
Total 7.782 7.772 7.513 7.663 7.715 7.577 7.323 7.509 7.375 7.362
Percentage Change ‐7.0% ‐0.1% ‐3.3% 2.0% 0.7% ‐1.8% ‐3.4% 2.5% ‐1.8% ‐0.2%
FINAL TAX ROLL
Tax Roll History 2006‐07 2007‐08 2008‐09 2009‐10 2010‐11 2011‐12 2012‐13 2013‐14 2014‐15 2015‐16
Final Tax Roll 21,855,346,996 26,387,763,807 27,185,791,325 22,781,942,148 19,181,131,226 17,752,827,760 17,486,188,635 18,327,239,420 19,627,447,692 21,129,933,005
Percentage Change 34.97% 20.74% 3.02% ‐16.20% ‐15.81% ‐7.45% ‐1.50% 4.81% 7.09% 7.66%
Total Tax Levy 170,078,310 205,085,700 204,246,850 174,578,023 147,982,427 134,513,176 128,051,359 137,619,241 144,752,427 155,558,567
Percentage Change 25.53% 20.58% ‐0.41% ‐14.53% ‐15.23% ‐9.10% ‐4.80% 7.47% 5.18% 7.47%
THE SCHOOL DISTRICT OF OSCEOLA COUNTY, FLORIDATAX MILLAGE AND LEVY ‐ HISTORICAL AND PROJECTED OVERVIEW ‐ FROM 2006 TO 2016
0
5,000,000,000
10,000,000,000
15,000,000,000
20,000,000,000
25,000,000,000
30,000,000,000
2006‐07 2007‐08 2008‐09 2009‐10 2010‐11 2011‐12 2012‐13 2013‐14 2014‐15 2015‐16
I-12

FLORIDA EDUCATION FINANCE PROGRAM (FEFP) FUNDING COMPARISONThe School District of Osceola County
2015 2016
Line DESCRIPTION Fourth Calculation Conference Report Change % Change4/20/2015 6/16/2015
1 Unweighted FTE
2 Traditional 49,917.21 50,004.23 87.02 0.17%
3 Charter 7,928.07 8,570.57 642.50 8.10%
4 McKay 723.64 781.60 57.96 8.01%
5 Undistributed 0.00 374.26 374.26 n/a
6 Total Unweighted FTE 58,568.92 59,730.67 1,161.75 1.98%
12 Total Weighted FTE 63,297.67 64,697.70 1,400.03 2.21%
13 Weighted to Unweighted FTE Ratio 1.0807 1.0832 0.0024 0.22%
14 Tax Roll ‐ School Taxable Value 19,627,447,692 21,212,584,163 1,585,136,471 8.08%
15 Required Local Effort Millage 5.104 5.114 0.010 0.20%16 Prior Period Adjustment Millage 0.023 0.000 (0.023) ‐100.00%17 Basic Discretionary Millage 0.748 0.748 0.000 0.00%18 Critical Needs Operating Discretionary 0.000 0.000 0.000 n/a19 Total Millage 5.875 5.862 (0.013) ‐0.22%
20 Base Student Allocation 4,031.77 4,154.45 122.68 3.04%21 District Cost Differential 0.9867 0.9850 (0.0017) ‐0.17%22 BSA * DCD 3,978.15 4,092.13 113.99 2.87%
23 FEFP Detail24 WFTE x BSA x DCD (Base FEFP) 251,807,465 264,751,610 12,944,145 5.14%25 0.748 Mills Discretionary Compression 9,512,178 10,087,911 575,733 6.05%26 0.250 Mills Discretionary Compression 0 0 0 n/a27 DJJ Supplemental Allocation 35,418 38,983 3,565 10.07%28 Safe Schools 1,073,534 1,058,930 (14,604) ‐1.36%29 ESE Guaranteed Allocation 15,493,798 15,868,495 374,697 2.42%30 Supplemental Academic Instruction (SAI) 12,770,625 13,045,597 274,972 2.15%31 Instructional Materials 4,901,048 4,996,303 95,255 1.94%32 Student Transportation 10,851,581 10,937,915 86,334 0.80%33 Teachers Lead Program 986,528 986,635 107 0.01%34 Reading Allocation 2,661,158 2,682,807 21,649 0.81%35 Teacher Salaries & Benefits 0 0 0 n/a36 Merit Award Program 0 0 0 n/a37 Digital Learning Allocation 719,583 1,159,582 439,999 61.15%38 Virtual Education Contribution 99,274 71,128 (28,146) ‐28.35%39 Additional Allocation 0 0 0 n/a
40 Total FEFP 310,912,190 325,685,896 14,773,706 4.75%
41 Adjustments42 Required Local Effort Taxes (96,171,353) (104,141,909) (7,970,556) 8.29%43 Federal Fiscal Stabilization Fund 0 0 0 n/a44 Proration to Funds Available (2,213,981) 0 2,213,981 ‐100.00%45 Proration for Veto 0 0 0 n/a46 Total Adjustments (98,385,334) (104,141,909) (5,756,575) 5.85%
47 Net State FEFP 212,526,856 221,543,987 9,017,131 4.24%
48 Lottery Funds49 Discretionary Lottery 208,608 210,382 1,774 0.85%50 School Recognition 1,483,702 1,483,702 0 0.00%
51 Total Lottery Funding 1,692,310 1,694,084 1,774 0.10%
52 State Categorical Programs53 Class Size Reduction 63,808,009 64,886,476 1,078,467 1.69%
54 Total State Funding 278,027,175 288,124,547 10,097,372 3.63%k
55 Local Funding:56 Required Local Effort 96,171,353 104,141,909 7,970,556 8.29%57 .748 Mills Discretionary Tax 14,094,078 15,232,332 1,138,254 8.08%58 .25 Mills Critical Needs Discretionary Tax 0 0 0 n/a
59 Total Local Funding 110,265,431 119,374,241 9,108,810 8.26%
60 Total State and Local Funding 388,292,606 407,498,788 19,206,182 4.95%
61 $ Per Unweighted FTE Total 6,629.67 6,822.27 192.60 2.91%
62 $ Per Weighted FTE Total 6,134.39 6,298.51 164.11 2.68%
I-13

FLORIDA EDUCATION FINANCE PROGRAM (FEFP)
COMPONENTS
ADJUSTMENTS:
The Department of Education is authorized to make prior year adjustments in the allocation of funds to a district for adjudication of litigation, arithmetical errors, assessment roll change, FTE student membership errors, or allocation errors revealed in an audit report. If state revenue collections are not sufficient to fund the amount appropriated for the FEFP, a special session may be held to reduce the appropriation and allocations. If the program calculates an amount that exceeds the appropriation, a proration of available funds will be deducted from districts’ calculated funding in proportion to each district’s relative share of state and local FEFP dollars. This procedure preserves equity in the distribution of available dollars.
BASE STUDENT ALLOCATION:
The Base Student Allocation from state and local funds is determined annually by the Legislature and is a component in the calculation of Base Funding. For the 2015‐16 fiscal year, the base student allocation is $4,080.59.
BASE FUNDING:
Base Funding is derived from the product of the weighted FTE (WFT E) students, multiplied by the Base Student Allocation and the District Cost Differential. For the 2015‐16 fiscal year, the Base Funding per WFTE is $4,019.38.
CATEGORICAL PROGRAM FUNDS:
Categorical program funds are added to the FEFP allocation that is distributed to districts. Currently, class size reduction is the sole categorical program. As a result of the voter‐approved amendment to Article IX, Section 1, of the Florida Constitution, regarding class size reduction, additional operating and capital outlay funds were appropriated to assist districts in their efforts to not exceed the class size maximums. Beginning with the 2010‐11 school year, Florida classrooms may have no more than 18 students in grades PK‐3, 22 students in grades 4‐8, and 25 students in grades 9‐12. The 2011 legislature amended Section 1003.03, Florida Statutes (F.S.), (Section 15, Chapter 2011‐55, Laws of Florida), by providing class size flexibility to schools that enroll students after the October student membership survey. If a district school board determines that it is impractical, educationally unsound, or disruptive to student learning,
I-14
students may be temporarily assigned to a class that exceeds the maximums cited above. Up to three students may be assigned to a teacher in grade group K‐3. Up to five students may be assigned to a teacher in grade groups 4‐8 and 9‐12. The district school board must develop a plan that provides that the school will be in full compliance by the next October student survey.
DEPARTMENT OF JUVENILE JUSTICE (DJJ):
The total K‐12 weighted full‐time equivalent student membership in juvenile justice education programs in each school district shall be multiplied by the amount of the state average class‐size reduction factor multiplied by the district’s cost differential. An amount equal to the sum of this calculation shall be allocated in the FEFP to each school district to supplement other sources of funding for students in juvenile justice education programs.
DECLINING ENROLLMENT SUPPLEMENT:
The declining enrollment supplement is determined by comparing the unweighted FTE (UFTE) for the current year to the UFTE of the prior year. In those districts where there is a decline in UFTE, 25 percent of the decline is multiplied by the prior‐year base funding per UFTE.
DISTRICT COST DIFFERENTIAL:
Section 1011.62(2), F.S., requires the Commissioner to annually compute district cost differentials (DCDs) by adding each district’s Florida Price Level Index for the most recent three years and dividing the sum by three. The result is multiplied by 0.800, and 0.200 is added to the product to obtain the DCD. For the 2015‐16 fiscal year, the DCD is 0.9850.
EXCEPTIONAL STUDENT EDUCATION (ESE) GUARANTEED ALLOCATION:
This allocation provides funding to support the additional cost for exceptional education students that are identified for services in program levels 111, 112, or 113. Funding is calculated based on a different methodology for exceptional students that are in a support level of 4 or 5.
FLORIDA DIGITAL CLASSROOMS ALLOCATION:
H.B. 5101 created the Florida Digital Classrooms Allocation to support efforts to improve student performance outcomes by integrating technology in classroom teaching and learning. The District must adopt a district digital classrooms plan and submit the plan to the department of education for approval.
I-15

FLORIDA TEACHERS CLASSROOM SUPPLY ASSISTANCE:
Pursuant to Section 1012.71, F.S., these funds are to be used only by classroom teachers for the purchase of classroom instructional materials and supplies for use in teaching students. The Florida Teachers Lead Program appropriation provides an allocation to each school district based on the prorated total of each school district’s share of the total K‐12 unweighted FTE student enrollment.
INSTRUCTIONAL MATERIALS:
The Instructional Materials allocation provides for core subject instructional materials, as well as library/media materials and science lab materials. The funding supports Florida's Next Generation Sunshine State Standards and a learning environment conducive to teaching and learning using appropriate educational materials. These funds are allocated to provide growth and maintenance funding for each District school, purchase dual enrollment textbooks, library/media and science lab materials, and to cover the cost of district‐wide textbooks adoptions.
Effective July 1, 2014, districts must spend at least 50% of this allocation to purchase digital instructional materials.
READING PROGRAM:
The Reading Program is designed to create a K‐12 comprehensive, district‐wide system of research‐based reading instruction. The District uses these funds for Reading Coach salaries, summer reading camp and other reading‐based professional development.
REQUIRED LOCAL EFFORT:
The district required local effort is subtracted from the state and local FEFP dollars. This is the amount of required local effort that each district must provide to participate in the Florida Education Finance Program. The Commissioner computes and certifies the required local effort millage rate for each district. For the current fiscal year FEFP calculation, each district’s contribution for required local effort is the product of the certified mills times 96 percent of the district’s taxable value for school purposes. Section 1011.62(4), F.S., directs the Commissioner to adjust required local effort millage rates if the millage would produce more than 90 percent of a district’s total FEFP entitlement.
The Department of Revenue provides the Commissioner with its most recent determination of the assessment level of the prior year’s assessment roll for each district and for the state. A millage rate is computed based on the positive or negative variation of each district from the state average assessment level. The millage rate resulting from application of this equalization factor is added to the state average required local effort millage. The sum of these two rates becomes each district’s certified required local effort millage.
I-16

SAFE SCHOOLS:
The Safe Schools allocation shall be used to promote and create a safe learning environment for children to development and learn. The funds are to be allocated so that each district is guaranteed a minimum amount of funding. If there is a remaining appropriation, 67 percent shall be allocated based on the latest official Florida Crime Index provided by the Department of Law Enforcement, and 33 percent shall be allocated based on each district’s share of the state’s total unweighted student enrollment. In the School District of Osceola County, this allocation is used to provide School Resource Officers at each school.
SCHOOL RECOGNITION PROGRAM FUNDS & DISCRETIONARY LOTTERY:
The state legislature has the authority to appropriate for school recognition funds and district discretionary lottery funds. The first priority is to fund the Florida School Recognition Program, which is authorized by Section 1008.36, F.S. The Florida School Recognition Program provides monetary awards to schools that earn an “A” grade, improve at least one performance grade from the previous year, or sustain the previous year’s improvement of more than one letter grade. The funds can be used for nonrecurring bonuses to the faculty and staff, nonrecurring expenditures for educational equipment or materials, or for temporary personnel to assist the school in maintaining or improving student performance. The District will receive $1.96 million in School Recognition funding for 2015‐16 and $571,313 in discretionary lottery dollars.
SPARSITY SUPPLEMENT:
The FEFP recognizes the relatively higher operating cost of smaller districts due to sparse student population. This index is computed by dividing the FTE of the district by the number of permanent senior high school centers (not to exceed three). By Appropriations Act proviso, participation is limited to districts of 20,000 or fewer FTE.
STUDENT TRANSPORTATION:
The Student Transportation allocation provides for safe and efficient transportation services in school districts to support student learning. The formula for allocating the funds is outlined in Section 1011.68, F.S., and contains the following provisions in the state allocation for student transportation: 1) students with special transportation needs earn a higher rate of funding than base students; 2) base funding for each district is established by the district's proportionate share of the total statewide students eligible for transportation; and 3) indices are applied that modify the base funding amount to reward more efficient bus utilization, compensate for rural population density, and adjust funding based on the cost of living. The funds are to be distributed based on the formula in Section 1011.68, F.S.
I-17

SUPPLEMENTAL ACADEMIC INSTRUCTION:
The Supplemental Academic Instruction (SAI) component of the FEFP formula provides for additional funding to pay for supplemental and remedial instruction. The District’s SAI allocation supports the cost of remediation programs at each school, district‐wide professional development, the Elementary Swim Program, ESE summer school and other curriculum enhancement and assessment tools.
Part of this funding, together with funds provided through the research‐based reading instruction allocation and other available funds, shall be used by districts with one or more of the 300 lowest performing schools based on the state reading assessment to provide an additional hour of instruction beyond the normal school day for each day of the entire school year for intensive reading instruction for the students in each of these schools. Students enrolled in these schools who have level 5 reading assessment scores may choose to participate in the additional hour of instruction on an optional basis.
VIRTUAL EDUCATION CONTRIBUTION:
The virtual education contribution shall be allocated pursuant to the formula provided in Section 1011.62(11), F.S. The contribution for the 2015‐16 fiscal year is based on $5,230 per FTE student in virtual programs.
0.748 MILLS DISCRETIONARY COMPRESSION:
If any school district levies the full 0.748 mill levy and it generates an amount of funds per unweighted FTE (UFTE) that is less than the state average amount per UFTE, the school district shall receive a discretionary millage compression supplement that, when added to the funds generated by the district’s 0.748 mill levy, shall be equal to the state average as provided in Section 1011.62(5), F.S.
I-18

2008‐09 End 2009‐10 End 2010‐11 End 2011‐12 End 2012‐13 End 2013‐14 End 2014‐15 4th 2015‐16 ConfTotal Funding 342,737,128 348,208,369 354,653,303 328,058,898 345,639,365 373,647,023 388,292,606 407,498,788$ Per Student 6,711 6,767 6,705 6,054 6,185 6,528 6,630 6,822UWFTE 51,071 51,459 52,893 54,193 55,881 57,239 58,569 59,731
Total FEFP Funding
FEFP Revenue Per Student
THE SCHOOL DISTRICT OF OSCEOLA COUNTY, FLORIDATOTAL AND PER FTE FUNDING ‐ HISTORICAL AND PROJECTED OVERVIEW ‐ FROM 2009 TO 2016
320,000,000
340,000,000
360,000,000
380,000,000
400,000,000
420,000,000
2008‐09 End 2009‐10 End 2010‐11 End 2011‐12 End 2012‐13 End 2013‐14 End 2014‐15 4th 2015‐16 Conf
5,000
5,500
6,000
6,500
7,000
2008‐09 End 2009‐10 End 2010‐11 End 2011‐12 End 2012‐13 End 2013‐14 End 2014‐15 4th 2015‐16 Conf
I-19

YEAR
SOH
CPI*
Change DCD
BSA Based on
CPI
BSA x DCD Based on
CPI
BSA
Actual
BSA x DCD Actual DIFF UFTE WFTE
Funding Surplus/
(Shortfall)
2016 0.80% 0.9850 4,617 4,548 4,154 4,092 (456) 59,731 64,681 (29,498,681) 2015 1.50% 0.9867 4,581 4,520 4,032 3,978 (542) 58,569 63,298 (34,290,846) 2014 1.70% 0.9858 4,513 4,449 3,913 3,857 (592) 57,239 61,996 (36,674,530) 2013 3.00% 0.9877 4,438 4,383 3,583 3,539 (844) 55,892 60,790 (51,317,853) 2012 1.50% 0.9896 4,308 4,264 3,479 3,443 (821) 54,193 58,665 (48,139,202) 2011 2.70% 0.9902 4,245 4,203 3,624 3,588 (615) 52,893 57,158 (35,146,802) 2010 0.10% 0.9906 4,133 4,094 3,631 3,596 (498) 51,459 55,296 (27,526,840) 2009 4.10% 0.9903 4,129 4,089 3,886 3,848 (241) 51,071 55,508 (13,351,279) 2008 2.50% 0.9902 3,966 3,928 4,080 4,040 112 51,913 57,726 6,478,367 2007 3.40% 0.9891 3,870 3,827 3,982 3,938 111 51,061 57,246 6,338,694 2006 3.30% 0.9823 3,742 3,676 3,742 3,676 ‐ 49,175 55,416 ‐
(263,128,974)
Base Funding
THE SCHOOL DISTRICT OF OSCEOLA COUNTY, FLORIDA
Base Funding Analysis
3,400
3,600
3,800
4,000
4,200
4,400
4,600
4,800
2006 2007 2008 2009 2010 2011 2012 2013 2014 2015 2016
Base Funding per WFTE
Actual Based on CPI
The consumer price index (CPI) is the most widely used measure of consumer price changes. The CPI measures the average change over time in the prices paid by urban consumers for goods and services. The Bureau of Labor Statistics (BLS) of the U.S. Department of Labor collects the CPI price information and calculates the CPI statistics.
SOH CPI ‐ Save Our Home CPI is the amount stated in Section 193.155(1), F.S., that stipulates the allowable annual increase in assessed property value for homestead exempt property.
The Base Student Allocation from state and local funds is determined annually by the Legislature and is a component in the calculation of Base Funding.
Base Funding is derived from the product of the weighted FTE (WFTE) students, multiplied by the Base Student Allocation and the District Cost Differential.
*Source: http://dor.myflorida.com/dor/property/resources/limitations.html.
I-20

THE SCHOOL DISTRICT OF OSCEOLA COUNTY, FL
Enhancement for the year 2015-16 is defined as the expenditure of the District Discretionary Lottery Dollars for the following purposes:
THE AMOUNT OF DISCRETIONARY LOTTERY FUNDS = $ 210,382THE AMOUNT OF DISCRETIONARY LOTTERY FUNDS = $ 210,382
THE AMOUNT OF SCHOOL RECOGNITION FUNDS = $ 1,483,702THE AMOUNT OF SCHOOL RECOGNITION FUNDS = $ 1,483,702
1. To provide school recognition funds to qualifying schools;2. To provide up to $5 per UFTE, if funds are available, in school
improvement funds to be allocated by the School Advisory Committee;
3. To continue programs which were previously funded through state funds;
4. To supplement partially funded state program dollars; 5. To provide start up supplies, books and equipment for new
facilities and programs.
POLICY FOR EXPENDITURE OF LOTTERY FUNDS – 2015-16
I-21

RESOLUTIONS

SAMPLE
Resolution Number 16‐004
RESOLUTION ADOPTING TENTATIVE MILLAGE RATES
WHEREAS, the School Board of Osceola County, Florida, did, pursuant to Chapters 200 and 1011, Florida Statutes, approve tentative millage rates for the fiscal year July 1, 2015 to June 30, 2016; and
WHEREAS, at the public hearing and in full compliance with Chapter 200, Florida Statutes, the Osceola County School Board adopted the tentative millage rates for fiscal year 2015‐2016 in the amounts of:
Tentative Proposed Amount Millage Levy To Be Raised
________________________________________________________________________
Required Local Effort (RLE) 5.114 $103,736,138 Prior Period Adjustment 0.000 0 Capital Outlay 1.500 30,427,104 Discretionary Operating 0.748 15,172,982 Discretionary Capital Improvement 0.000 0 Critical Capital Outlay 0.000 0 Critical Operating 0.000 0 Additional Voted Millage 0.000 0 Debt Service 0.000 0 Total 7.362 $149,336,224
NOW THEREFORE, BE IT RESOLVED:
That the Osceola County School Board, adopted each tentative millage rate for the fiscal year July 1, 2015 to June 30, 2016, on July 28, 2015 by separate vote prior to adopting the tentative budget.
_________________________________________ Chairman July 28, 2015
R-2

SAMPLE
Resolution Number 16‐005
RESOLUTION ADOPTING TENTATIVE BUDGET A RESOLUTION OF THE OSCEOLA COUNTY SCHOOL BOARD ADOPTING THE TENTATIVE BUDGET FOR FISCAL YEAR 2015‐2016. WHEREAS, the School Board of Osceola County, Florida, did, pursuant to Chapters 200 and 1011, Florida Statutes, approve tentative millage rates and a tentative budget for the fiscal year July 1, 2015 to June 30, 2016; and WHEREAS, the Osceola County School Board set forth the appropriations and revenue estimate for the Budget for fiscal year 2015‐2016. WHEREAS, at the public hearing and in full compliance with Chapter 200, Florida Statutes, the Osceola County School Board adopted the tentative millage rates and the budget in the amount of $835,840,054 for fiscal year 2015‐2016. NOW THEREFORE, BE IT RESOLVED: That the attached budget of Osceola County School Board, including the millage rates as set forth therein, is hereby adopted by the School Board of Osceola County as a tentative budget for the categories indicated for the fiscal year July 1, 2015 to June 30, 2016. _________________________________________ Chairman July 28, 2015
R-3

ADVERTISEMENTS

SAMPLE
NOTICE OF BUDGET HEARING
The Osceola County School Board will soon consider a
budget for 2015‐16.
A public hearing to make a DECISION
on the budget AND TAXES will be held on:
July 28, 2015
5:30 p.m.
at
Osceola County School District Administration Center
817 Bill Beck Boulevard
Kissimmee, Florida.
A-2

SAMPLE
NOTICE OF PROPOSED TAX INCREASE
The Osceola County School Board will soon consider a measure to increase its property tax levy.
Last year’s property tax levy:
A. Initially proposed tax levy..................................... $144,752,427
B. Less tax reductions due to Value Adjustment Board
and other assessment changes.............................. $ 130,396
C. Actual property tax levy........................................ $144,622,031
This year’s proposed tax levy..................................$155,558,567
A portion of the tax levy is required under state law in order for the school board to receive $221,543,987 in state education grants.
The required portion has increased by 4.47 percent, and represents approximately seven tenths of the total proposed taxes.
The remainder of the taxes is proposed solely at the discretion of the school board.
All concerned citizens are invited to a public hearing on the tax increase to be held on July 28, 2015, 5:30 p.m., at:
Osceola County School District Administration Center 817 Bill Beck Boulevard
Kissimmee, Florida 34744
A DECISION on the proposed tax increase and the budget will be made at this hearing.
A-3

SAMP
LE
BUDGET SUMMARY
SCHOOL DISTRICT OF OSCEOLA COUNTY, FLORIDA
FISCAL YEAR 2015‐16
PROPOSED MILLAGE LEVIES SUBJECT TO 10‐MILL CAP:
5.1140 0.0000Operating or Capital Not to 0.0000
1.5000 0.0000 Exceed 2 Years0.7480 (Operating) Debt Service 0.0000
0.0000 7.3620
GENERAL SPECIAL DEBT CAPITAL PERMANENT ENTERPRISE TOTAL ALL
ESTIMATED REVENUES: FUND REVENUE SERVICE PROJECTS FUND FUND FUNDS
Federal sources 500,000 77,087,555 2,177,523 79,765,078
State sources 296,746,566 424,000 1,617,717 2,975,904 301,764,187
Local sources 132,807,173 2,774,000 12,909,399 56,839,894 205,330,466
TOTAL SOURCES $430,053,739 $80,285,555 $16,704,639 $59,815,798 $0 $0 $586,859,731
Transfers In 13,519,741 20,890,665 5,530,357 39,940,763
Fund Balances/Reserves/Net Assets 63,746,363 9,050,888 9,827,716 47,329,780 129,954,747
TOTAL REVENUES, TRANSFERS &
BALANCES $507,319,843 $89,336,442 $47,423,020 $112,675,935 $0 $0 $756,755,241
EXPENDITURES
Instruction 303,119,928 27,152,961 330,272,889
Pupil Personnel Services 22,310,471 2,314,020 24,624,491
Instructional Media Services 4,688,675 140,571 4,829,246
Instructional and Curriculum Development Services 10,869,531 9,115,831 19,985,362
Instructional Staff Training Services 5,600,544 5,879,163 11,479,707
Instruction Related Technology 4,082,469 712,882 4,795,351
School Board 2,196,653 2,196,653
General Administration 1,412,291 1,077,058 2,489,349
School Administration 23,402,382 23,402,382
Facilities Acquisition and Construction 2,637,316 43,126,681 45,763,997
Fiscal Services 2,233,471 2,233,471
Food Services 76,275 34,007,251 34,083,526
Central Services 7,634,077 482,299 8,116,376
Pupil Transportation Services 22,304,320 345,847 22,650,167
Operation of Plant 35,093,741 46,575 35,140,316
Maintenance of Plant 9,020,665 9,020,665
Administrative Technology Services 4,380,085 60,347 4,440,432
Community Services 4,278,723 1,200,000 5,478,723
Debt Services 75,000 30,017,781 30,092,781
TOTAL EXPENDITURES $465,416,617 $82,534,806 $30,017,781 $43,126,681 $0 $0 $621,095,884
Transfers Out 5,530,357 34,410,406 39,940,763
Fund Balances/Reserves/Net Assets 41,903,227 6,801,637 11,874,882 35,138,848 95,718,593
TOTAL APPROPRIATED EXPENDITURES
TRANSFERS, RESERVES & BALANCES $507,319,843 $89,336,442 $47,423,020 $112,675,935 $0 $0 $756,755,241
The tentative, adopted, and/or final budgets are on file in the office of the above mentioned taxing authority as a public record.
TOTAL MILLAGE
Funding Adjustment Millage) (Operating)Local Capital Improvement (Capital Outlay) Additional Millage Not to Exceed 4 YearsDiscretionary Operating
Discretionary Capital Improvement
THE PROPOSED OPERATING BUDGET EXPENDITURES OF THE OSCEOLA COUNTY SCHOOL DISTRICT ARE 7.4%
MORE THAN LAST YEAR'S TOTAL OPERATING EXPENDITURES.
PROPOSED MILLAGE LEVIES
Required Local Effort (Including Prior Period Discretionary Critical Needs NOT SUBJECT TO 10‐MILL CAP:
A-4

SAMPLE
NOTICE OF TAX FOR SCHOOL CAPITAL OUTLAY The Osceola County School Board will soon consider a measure to continue to impose a 1.5 mill property tax for the capital outlay projects listed herein. This tax is in addition to the school board’s proposed tax of 5.862 mills for operating expenses and is proposed solely at the discretion of the school board. THE PROPOSED COMBINED SCHOOL BOARD TAX INCREASE FOR BOTH OPERATING EXPENSES AND CAPITAL OUTLAY IS SHOWN IN THE ADJACENT NOTICE. The capital outlay tax will generate approximately $30,427,104 to be used for the following projects: CONSTRUCTION AND REMODELING: Various new construction projects as listed in the Educational Plant Survey MAINTENANCE, RENOVATION, AND REPAIR: Repairs and set‐up costs for portable classrooms General school facility maintenance Corrections to health and safety code violations Roof and gutter repairs and replacement District‐wide cyclical renovations Heating, ventilation and air conditioning installation and repairs at schools and ancillary facilities Electrical, data and communication upgrades/retrofit Replace marquee signs Interior/exterior painting and wall covering Install fencing/sidewalk/safety wall Parking area repairs and expansion Restroom refurbishment Piping and plumbing repairs Covered walkways Ceiling repairs Safety door and entryway remodeling Storm shutter hardware replacement Locker replacement Handrail modifications Arrival & drop‐off access upgrade Drainage improvements Security modifications at schools and ancillary facilities MOTOR VEHICLE PURCHASES: Purchase of fourteen (14) school buses Purchase of motor vehicles used for the maintenance or operation of plants and equipment NEW AND REPLACEMENT EQUIPMENT, COMPUTERS, ENTERPRISE RESOURCE SOFTWARE, AND S. 1011.71(2), F.S., ELIGIBLE EXPENDITURES IN SUPPORT OF DIGITAL CLASSROOMS PLANS PURSUANT TO S. 1011.62(12), F.S.:
A-5

SAMPLE
Educational technology equipment (computer labs/networks) School furniture and equipment Enterprise technology PAYMENTS FOR EDUCATIONAL FACILITIES AND SITES DUE UNDER A LEASE‐PURCHASE AGREEMENT: Annual master lease payments for various facilities and renovations Kissimmee Elementary Poinciana High School Horizon Middle School Kissimmee Middle School Celebration High School Osceola County School of the Arts Black box theatres/auditoriums at Osceola High School, St. Cloud High School and Poinciana High School Classrooms and chiller plant at Osceola High School Chestnut Elementary Liberty High School Osceola High School comprehensive renovations Highlands Avenue Elementary comprehensive renovations Thacker Avenue Elementary comprehensive renovations PAYMENTS FOR RENTING AND LEASING EDUCATIONAL FACILITIES AND SITES: One (1) year lease of portable classrooms and classroom space Elementary school at BellaLago PAYMENT OF PREMIUMS FOR PROPERTY AND CASUALTY INSURANCE NECESSARY TO INSURE THE EDUCATIONAL AND ANCILLARY PLANTS OF THE SCHOOL DISTRICT Insurance premiums on district facilities All concerned citizens are invited to a public hearing to be held on July 28, 2015 at 5:30 p.m. at the Osceola County School District Administrative Center, 817 Bill Beck Boulevard, Kissimmee, Florida. A DECISION on the proposed CAPITAL OUTLAY TAXES will be made at this hearing.
A-6

FUND 100
GENERAL FUND

GENERAL FUND BUDGET
This budget is often referred to as the “Operating Budget”.
The major revenue sources for the General Fund are the Florida Education Finance Program (FEFP) and local discretionary taxes. Other significant revenue sources are Workforce funds, Voluntary Pre‐Kindergarten funds, Extended Day fees and transfers from Capital Projects Funds.
Appropriations include most of the District’s salaries and benefits, utilities, fuel, supplies, transportation costs, and other operating expenses. The District has more discretion in appropriating General Fund revenues than other funds. However, even within the General Fund, much of the revenue is restricted for specified purposes (e.g., Reading Allocation, Teachers Classroom Supply Assistance Program, School Recognition, etc.).
Fund balances in the General Fund are the District’s reserves against revenue shortfalls, emergencies, and other unplanned needs.
FUND 100
1-2

THE SCHOOL DISTRICT OF OSCEOLA COUNTY, FLGENERAL FUND LONG RANGE FORECAST
2013‐14 2014‐15 2015‐16 2016‐17 2017‐1811 FEFP % change per Student 5.48% 1.65% 2.91% 2.20% 2.20%
12 Beginning Fund Balance 76.0 70.2 63.7 62.4 64.3
13 Revenues 405.0 422.7 443.6 460.8 478.8
14 Projected Expenditures 410.8 429.2 444.9 459.0 475.3
15 Operating Surplus/(Loss) ‐5.8 ‐6.5 ‐1.3 1.9 3.5
16 Total Ending Fund Balance 70.2 63.7 62.4 64.3 67.8
Fund Balance Break Down:17 Nonspendable 2.1 2.1 2.1 2.1 2.118 Restricted & Assigned 28.5 21.8 20.5 20.5 20.519 Unassigned 6% Board Policy Reserve 24.3 25.4 26.6 27.6 28.720 Unassigned 15.3 14.4 13.2 14.1 16.5
Total Ending Fund Balance 70.2 63.7 62.4 64.3 67.8
Unassigned as a % of Expenditures 9.7% 9.3% 9.0% 9.1% 9.5%
1-3

BEGINNING FUND BALANCE
1 Non‐spendable ‐ Inventory 2,100,000 2 Restricted for State Categorical Programs 11,663,824 3 Restricted for Other Grants and Programs 4,953,494 4 Assigned for Contract Commitments 2,156,996 5 Assigned for Carryover Appropriations 1,772,049 6 Assigned for Projected Operating Deficit 1,300,000 7 Unassigned ‐ 6% Minimum per Board 25,400,000 8 Unassigned Fund Balance 14,400,000 Total Beginning Fund Balance 63,746,363
ESTIMATED REVENUES
9 Florida Education Finance Program 0310 221,543,987 49.9%10 District School Taxes 0411 119,374,241 26.9%11 Class Size Reduction 0355 64,886,476 14.6%12 Transfer From Capital Projects 0630 13,519,741 3.0%13 Miscellaneous Local 049? 6,651,210 1.5%14 Workforce Development 0315 6,187,151 1.4%
15 Child Care Fees 047? 2,892,040 0.7%
16 Voluntary Pre‐K Program 0371 2,176,897 0.5%
17 Adult Education Fees 046? 1,850,000 0.4%
18 School Recognition Funds 0361 1,483,702 0.3%
19 Rent/ Facilities Use Fees 0425 665,000 0.1%
20 R.O.T.C. 0191 500,000 0.1%
21 Interest On Investments 043? 500,000 0.1%
22 Gifts, Grants, and Bequests 0440 449,682 0.1%
23 Tax Redemptions 0421 360,000 0.1%
24 Discretionary Lottery 0344 210,382 0.0%
25 State License Tax 0343 150,000 0.0%
26 Miscellaneous State 0399 69,971 0.0%
27 Insurance Loss Recovery 0741 65,000 0.0%
28 CO&DS Withheld For Admin Expense 0323 38,000 0.0%
29 Adults With Disabilities 0318 0 0.0%
30 Workforce Performance Based Incentives 0317 0 0.0%
31 Federal Through State 0290 0 0.0%
32 Early Education Grant 0280 0 0.0%
33 Sale of Equipment 0733 0 0.0%
Total Estimated Revenues 443,573,480 100.0%
APPROPRIATIONS
34 Salaries and Benefits 1 309,605,481 69.6%
35 Charter & Choice Schools 2 57,262,676 12.9%
36 Categoricals/Restricted Programs 3 20,153,066 4.5%37 Line Items Non‐Salary 4 19,286,728 4.3%38 Utilities and Fuel 5 16,264,856 3.7%39 School and Department Non‐Salary 6 13,054,706 2.9%
40 McKay Scholarship Program 7 5,587,703 1.3%
41 Holdback ‐ Undistributed FTE 8 3,655,038 0.8%
Current Appropriations 444,870,254 100.0%
42 Projected Operating Deficit (1,296,773)
43 Carryover Appropriations 20,546,363
Total Appropriations 465,416,617
PROJECTED ENDING FUND BALANCE
44 Non Spendable ‐ Inventory 2,100,000
45 Restricted for State Categorical Programs 0
46 Restricted for Other Grants and Programs 047 Assigned for Contract Commitments 048 Assigned for Carryover Appropriations 0
49 Assigned for Projected Operating Deficit 050 Unassigned ‐ 6% Reserve per Board 26,600,000
51 Unassigned Fund Balance 13,203,227 Total Projected Ending Fund Balance 41,903,227
THE SCHOOL DISTRICT OF OSCEOLA COUNTY, FLGENERAL FUND BUDGET SUMMARY
As of the Conference ReportFiscal Year Ending June 30, 2016
1-4

ACCT. 2015‐16 2014‐15Source NO. Tentative Budget Difference
FEDERAL:ROTC 191 500,000.00 624,000.00 (124,000.00)Federal Other* 2XX 0.00 117,171.00 (117,171.00) Total Federal 500,000.00 741,171.00 (241,171.00)
STATE:Florida Education Finance Program* 310 221,543,987.00 214,999,313.00 6,544,674.00Workforce Development 315 6,187,151.00 6,159,721.00 27,430.00Workforce Development Performance Incentives 317 0.00 50,000.00 (50,000.00)Adults With Disabilities 318 0.00 42,500.00 (42,500.00)CO & DS Withheld for Administrative Expense 323 38,000.00 38,000.00 0.00State License Tax 343 150,000.00 150,000.00 0.00Discretionary Lottery Funds 344 210,382.00 571,722.00 (361,340.00)Class Size Reduction 355 64,886,476.00 64,463,100.00 423,376.00School Recognition Funds 361 1,483,702.00 1,958,226.00 (474,524.00)Voluntary Prekindergarten 371 2,176,896.75 2,651,460.00 (474,563.25)Miscellaneous State* 399 69,971.00 74,592.21 (4,621.21) Total State 296,746,565.75 291,158,634.21 5,587,931.54
LOCAL:District School Tax ‐ RLE 411 104,141,909.00 96,171,353.00 7,970,556.00 ‐ Prior Period Adjustment 411 0.00 433,374.00 (433,374.00) ‐ Discretionary 411 15,232,332.00 14,094,078.00 1,138,254.00Tax Redemptions 421 360,000.00 300,000.00 60,000.00Facility Use Fees/Rent 425 665,000.00 650,000.00 15,000.00Interest, Including Profit on Investments 43X 500,000.00 400,000.00 100,000.00Gifts, Grants, & Bequests* 440 449,682.14 252,000.00 197,682.14Adult Education Fees 46X 1,850,000.00 2,600,000.00 (750,000.00)Pre‐K Early Intervention Fees 472 392,040.00 0.00 392,040.00School Aged Child Care Fees 473 2,500,000.00 0.00 2,500,000.00Bus Fees 491 300,000.00 350,000.00 (50,000.00)Bus Fees School Activities 492 150,000.00 150,000.00 0.00Sale of Surplus Property 493 50,000.00 75,000.00 (25,000.00)Federal Indirect Cost 494 1,500,000.00 1,000,000.00 500,000.00Miscellaneous Local Sources* 495 4,651,210.31 4,832,411.80 (181,201.49)Lost and Damaged Textbooks 498 0.00 0.00 0.00Sale of Equipment 733 0.00 0.00 0.00Insurance Loss Recovery 741 65,000.00 64,000.00 1,000.00 Total Local 132,807,173.45 121,372,216.80 11,434,956.65
OTHER SOURCES:Transfers In* 630 13,519,741.00 15,892,550.42 (2,372,809.42) Total Other Sources 13,519,741.00 15,892,550.42 (2,372,809.42) TOTAL EST REVENUE & OTHER SOURCES 443,573,480.20 429,164,572.43 14,408,907.77
FUND BALANCE AT BEGINNING OF YEAR: Nonspendable ‐ Inventory 2711 2,100,000.00 2,077,676.52 22,323.48 Restricted for State Categorical Programs ** 2723 11,663,824.00 15,795,186.36 (4,131,362.36) Restricted for Other Grants and Programs ** 2729 4,953,494.00 5,287,290.47 (333,796.47) Assigned for Contract Commitments ** 2749 2,156,996.00 445,249.15 1,711,746.85 Assigned for Carryover Appropriations ** 2749 1,772,049.00 1,849,135.96 (77,086.96) Assigned for Projected Operating Deficit 2749 1,300,000.00 5,100,000.00 (3,800,000.00) Unassigned ‐ 6% Minimum per Board 2750 25,400,000.00 24,300,000.00 1,100,000.00 Unassigned 2750 14,400,000.00 15,393,131.86 (993,131.86) Total Beginning Fund Balance 27XX 63,746,363.00 70,247,670.32 (6,501,307.32)
TOTAL EST REVENUE AND BEGINNING FD BAL 507,319,843.20 499,412,242.75 7,907,600.45
* See Detail** Included in Carryover Appropriations
THE SCHOOL DISTRICT OF OSCEOLA COUNTY, FLGENERAL FUND ‐ ESTIMATED REVENUES AND BEGINNING FUND BALANCE
1-5
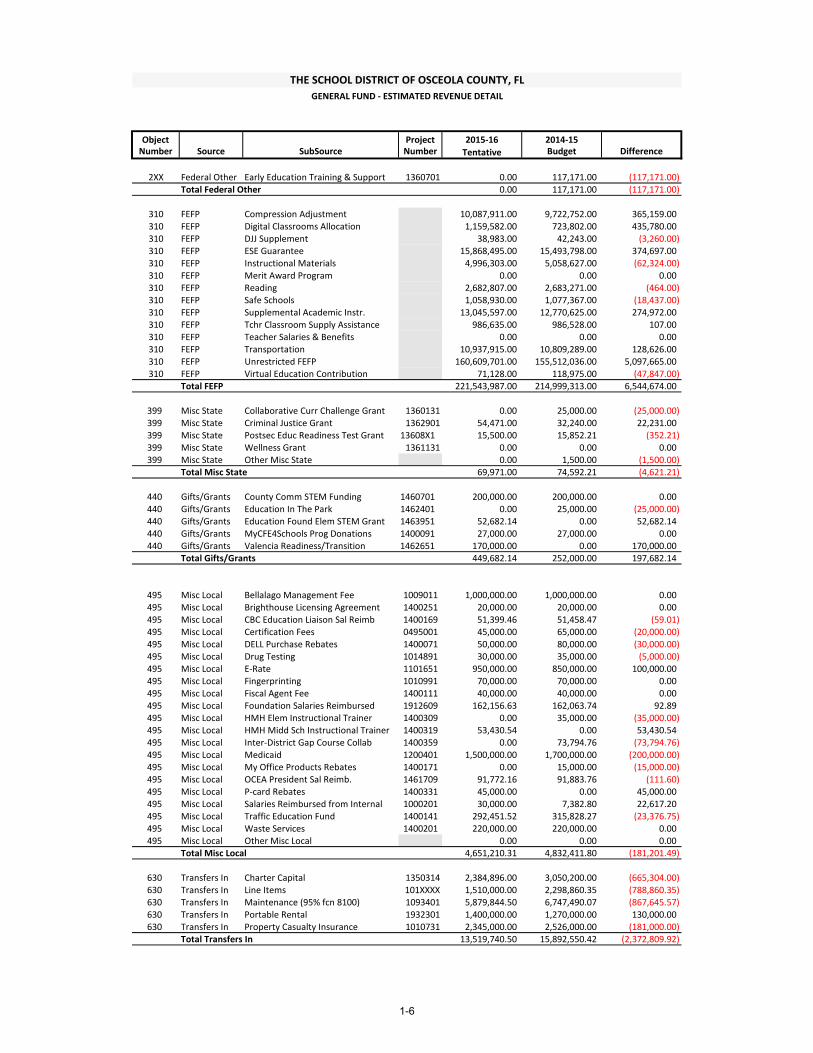
Object Project 2015‐16 2014‐15Number Source SubSource Number Tentative Budget Difference
2XX Federal Other Early Education Training & Support 1360701 0.00 117,171.00 (117,171.00)Total Federal Other 0.00 117,171.00 (117,171.00)
310 FEFP Compression Adjustment 10,087,911.00 9,722,752.00 365,159.00310 FEFP Digital Classrooms Allocation 1,159,582.00 723,802.00 435,780.00310 FEFP DJJ Supplement 38,983.00 42,243.00 (3,260.00)310 FEFP ESE Guarantee 15,868,495.00 15,493,798.00 374,697.00310 FEFP Instructional Materials 4,996,303.00 5,058,627.00 (62,324.00)310 FEFP Merit Award Program 0.00 0.00 0.00310 FEFP Reading 2,682,807.00 2,683,271.00 (464.00)310 FEFP Safe Schools 1,058,930.00 1,077,367.00 (18,437.00)310 FEFP Supplemental Academic Instr. 13,045,597.00 12,770,625.00 274,972.00310 FEFP Tchr Classroom Supply Assistance 986,635.00 986,528.00 107.00310 FEFP Teacher Salaries & Benefits 0.00 0.00 0.00310 FEFP Transportation 10,937,915.00 10,809,289.00 128,626.00310 FEFP Unrestricted FEFP 160,609,701.00 155,512,036.00 5,097,665.00310 FEFP Virtual Education Contribution 71,128.00 118,975.00 (47,847.00)
Total FEFP 221,543,987.00 214,999,313.00 6,544,674.00
399 Misc State Collaborative Curr Challenge Grant 1360131 0.00 25,000.00 (25,000.00)399 Misc State Criminal Justice Grant 1362901 54,471.00 32,240.00 22,231.00399 Misc State Postsec Educ Readiness Test Grant 13608X1 15,500.00 15,852.21 (352.21)399 Misc State Wellness Grant 1361131 0.00 0.00 0.00399 Misc State Other Misc State 0.00 1,500.00 (1,500.00)
Total Misc State 69,971.00 74,592.21 (4,621.21)
440 Gifts/Grants County Comm STEM Funding 1460701 200,000.00 200,000.00 0.00440 Gifts/Grants Education In The Park 1462401 0.00 25,000.00 (25,000.00)440 Gifts/Grants Education Found Elem STEM Grant 1463951 52,682.14 0.00 52,682.14440 Gifts/Grants MyCFE4Schools Prog Donations 1400091 27,000.00 27,000.00 0.00440 Gifts/Grants Valencia Readiness/Transition 1462651 170,000.00 0.00 170,000.00
Total Gifts/Grants 449,682.14 252,000.00 197,682.14
495 Misc Local Bellalago Management Fee 1009011 1,000,000.00 1,000,000.00 0.00495 Misc Local Brighthouse Licensing Agreement 1400251 20,000.00 20,000.00 0.00495 Misc Local CBC Education Liaison Sal Reimb 1400169 51,399.46 51,458.47 (59.01)495 Misc Local Certification Fees 0495001 45,000.00 65,000.00 (20,000.00)495 Misc Local DELL Purchase Rebates 1400071 50,000.00 80,000.00 (30,000.00)495 Misc Local Drug Testing 1014891 30,000.00 35,000.00 (5,000.00)495 Misc Local E‐Rate 1101651 950,000.00 850,000.00 100,000.00495 Misc Local Fingerprinting 1010991 70,000.00 70,000.00 0.00495 Misc Local Fiscal Agent Fee 1400111 40,000.00 40,000.00 0.00495 Misc Local Foundation Salaries Reimbursed 1912609 162,156.63 162,063.74 92.89495 Misc Local HMH Elem Instructional Trainer 1400309 0.00 35,000.00 (35,000.00)495 Misc Local HMH Midd Sch Instructional Trainer 1400319 53,430.54 0.00 53,430.54495 Misc Local Inter‐District Gap Course Collab 1400359 0.00 73,794.76 (73,794.76)495 Misc Local Medicaid 1200401 1,500,000.00 1,700,000.00 (200,000.00)495 Misc Local My Office Products Rebates 1400171 0.00 15,000.00 (15,000.00)495 Misc Local OCEA President Sal Reimb. 1461709 91,772.16 91,883.76 (111.60)495 Misc Local P‐card Rebates 1400331 45,000.00 0.00 45,000.00495 Misc Local Salaries Reimbursed from Internal 1000201 30,000.00 7,382.80 22,617.20495 Misc Local Traffic Education Fund 1400141 292,451.52 315,828.27 (23,376.75)495 Misc Local Waste Services 1400201 220,000.00 220,000.00 0.00495 Misc Local Other Misc Local 0.00 0.00 0.00
Total Misc Local 4,651,210.31 4,832,411.80 (181,201.49)
630 Transfers In Charter Capital 1350314 2,384,896.00 3,050,200.00 (665,304.00)630 Transfers In Line Items 101XXXX 1,510,000.00 2,298,860.35 (788,860.35)630 Transfers In Maintenance (95% fcn 8100) 1093401 5,879,844.50 6,747,490.07 (867,645.57)630 Transfers In Portable Rental 1932301 1,400,000.00 1,270,000.00 130,000.00630 Transfers In Property Casualty Insurance 1010731 2,345,000.00 2,526,000.00 (181,000.00)
Total Transfers In 13,519,740.50 15,892,550.42 (2,372,809.92)
THE SCHOOL DISTRICT OF OSCEOLA COUNTY, FL
GENERAL FUND ‐ ESTIMATED REVENUE DETAIL
1-6
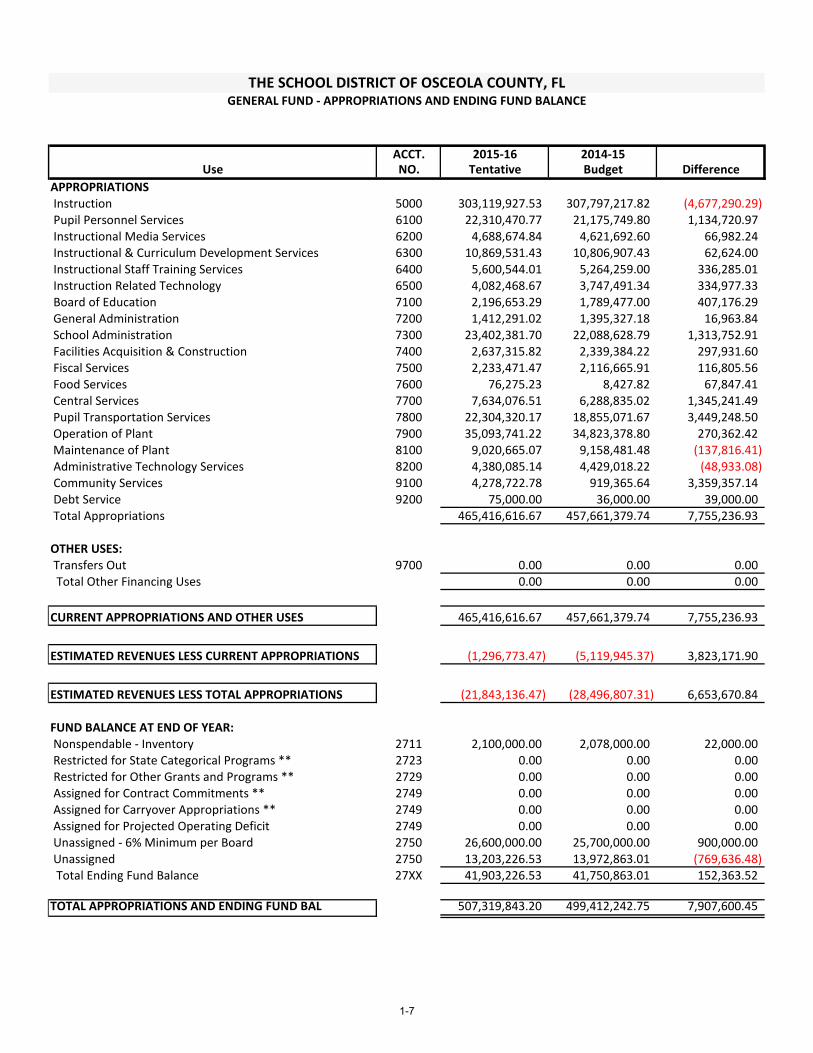
ACCT. 2015‐16 2014‐15Use NO. Tentative Budget Difference
APPROPRIATIONS Instruction 5000 303,119,927.53 307,797,217.82 (4,677,290.29) Pupil Personnel Services 6100 22,310,470.77 21,175,749.80 1,134,720.97 Instructional Media Services 6200 4,688,674.84 4,621,692.60 66,982.24 Instructional & Curriculum Development Services 6300 10,869,531.43 10,806,907.43 62,624.00 Instructional Staff Training Services 6400 5,600,544.01 5,264,259.00 336,285.01 Instruction Related Technology 6500 4,082,468.67 3,747,491.34 334,977.33 Board of Education 7100 2,196,653.29 1,789,477.00 407,176.29 General Administration 7200 1,412,291.02 1,395,327.18 16,963.84 School Administration 7300 23,402,381.70 22,088,628.79 1,313,752.91 Facilities Acquisition & Construction 7400 2,637,315.82 2,339,384.22 297,931.60 Fiscal Services 7500 2,233,471.47 2,116,665.91 116,805.56 Food Services 7600 76,275.23 8,427.82 67,847.41 Central Services 7700 7,634,076.51 6,288,835.02 1,345,241.49 Pupil Transportation Services 7800 22,304,320.17 18,855,071.67 3,449,248.50 Operation of Plant 7900 35,093,741.22 34,823,378.80 270,362.42 Maintenance of Plant 8100 9,020,665.07 9,158,481.48 (137,816.41) Administrative Technology Services 8200 4,380,085.14 4,429,018.22 (48,933.08) Community Services 9100 4,278,722.78 919,365.64 3,359,357.14 Debt Service 9200 75,000.00 36,000.00 39,000.00 Total Appropriations 465,416,616.67 457,661,379.74 7,755,236.93
OTHER USES: Transfers Out 9700 0.00 0.00 0.00 Total Other Financing Uses 0.00 0.00 0.00
CURRENT APPROPRIATIONS AND OTHER USES 465,416,616.67 457,661,379.74 7,755,236.93
ESTIMATED REVENUES LESS CURRENT APPROPRIATIONS (1,296,773.47) (5,119,945.37) 3,823,171.90
ESTIMATED REVENUES LESS TOTAL APPROPRIATIONS (21,843,136.47) (28,496,807.31) 6,653,670.84
FUND BALANCE AT END OF YEAR: Nonspendable ‐ Inventory 2711 2,100,000.00 2,078,000.00 22,000.00 Restricted for State Categorical Programs ** 2723 0.00 0.00 0.00 Restricted for Other Grants and Programs ** 2729 0.00 0.00 0.00 Assigned for Contract Commitments ** 2749 0.00 0.00 0.00 Assigned for Carryover Appropriations ** 2749 0.00 0.00 0.00 Assigned for Projected Operating Deficit 2749 0.00 0.00 0.00 Unassigned ‐ 6% Minimum per Board 2750 26,600,000.00 25,700,000.00 900,000.00 Unassigned 2750 13,203,226.53 13,972,863.01 (769,636.48) Total Ending Fund Balance 27XX 41,903,226.53 41,750,863.01 152,363.52
TOTAL APPROPRIATIONS AND ENDING FUND BAL 507,319,843.20 499,412,242.75 7,907,600.45
THE SCHOOL DISTRICT OF OSCEOLA COUNTY, FLGENERAL FUND ‐ APPROPRIATIONS AND ENDING FUND BALANCE
1-7

ADMINISTRATOR PROJ NO PROJECT DESCRIPTION FUNDING
2016
RECOMMENDED
1 Belynda Pinkston 1015271 EMPLOYEE CHAPERONES STUDENT TRAVEL FEFP 4,000.00
2 1016351 ICARNEGIE LOCAL 49,500.00
3 1016601 ADOBE SOFTWARE FEFP 58,000.00
4 Beth Rattie 1015401 SUMMER OPS ARC AND COMMITMENT FEFP 60,000.00
5 Clyde Wells 1010101 SOFTWARE (EBUILDER), CONSULT FEES CAPITAL REIMB 111,500.00
6 1010111 CONTINGENCY FOR MAJOR MAINT CAPITAL 600,000.00
7 1010221 BACKFLOW INSPECTIONS & REPAIR CAPITAL 15,000.00
8 1010251 CHILLER MAINT AGREEMENT/REPAIR CAPITAL 160,000.00
9 1010261 INSPECTION/BLEACHERS & STAIRS CAPITAL 20,000.00
10 1010411 MAINTENANCE COUNTY OFFICE FEFP 85,000.00
11 1010611 MAINTENANCE SHOES FEFP 17,000.00
12 1010711 HVAC PREVENTIVE MAINT & FILTER CAPITAL 90,000.00
13 1010801 INSPECTION FIRE ALARM,EXT HOOD CAPITAL 140,000.00
14 1010831 FIRE SPRINKLER SYSTEM INSPECTIONS CAPITAL 75,000.00
15 1011221 RETENTION PONDS CLEAN/MAINT CAPITAL 20,000.00
16 1012251 REFRIGERANT RECOVERY CAPITAL 5,000.00
17 1014251 IMPACT FEE STUDY FEFP 0.00
18 1014881 ELEVATOR INSPECTION CAPITAL 26,000.00
19 1015011 ENERGY PERSONNEL NON SAL FEFP 0.00
20 1015019 ENERGY PERSONNEL SALARY FEFP 0.00
21 1015121 BUILDING OFFICIAL CAPITAL REIMB 18,500.00
22 1015651 VEHICLE REPLACEMENTS CAPITAL 0.00
23 1016011 ENERGY SAVINGS PRG CONSULTANT FEFP 0.00
24 1016161 GENERATOR REPAIR/MAINT COUNTYWIDE FEFP 8,000.00
25 1016371 FIRE EXTINGUISHER INSPECTIONS, REPAIR FEFP 75,000.00
26 1016381 WATER TREATMENT SVCS CAPITAL 25,000.00
27 1016541 PROCEDURES MANUAL & PROF SERV GUIDE CAPITAL 0.00
28 1016631 CUSTODIAL EQUIPMENT FOR SPT FEFP 10,000.00
29 1016641 ENVIRONMENTAL DRINKING WATER TESTING FEFP 5,000.00
30 Dalia Medina 1016311 INSYNC EDUCATION LICENSE FEFP 32,500.00
31 Dana Schafer 1011501 PUBLICATIONS & ADVERTISING LOCAL 50,000.00
32 1013351 PARENT GUIDE/CALENDAR FEFP 22,000.00
33 1014771 WEBSITE/MOBIL APP/EMERGENCY NOTIFICATION FEFP 152,000.00
34 1014921 CHOICE POINT CRIMINAL HISTORY FEFP 32,000.00
35 Daryla Bungo 1016391 PSYCHOEDUCATIONAL EVAL INSTRUMENTS & PROTOCOLS FEFP 55,000.00
36 1016401 OPS FOR PSYCHOLOGICAL SERVICES FEFP 25,000.00
37 1016411 SPOT VISION SCREENER FEFP 0.00
38 Janice Franceschi 1012311 NEW TEACHER MENTOR FEFP 60,000.00
39 1014981 PROFESSIONAL DEV ACTIVITIES FEFP 150,000.00
40 1015361 PROFESSIONAL DEV OPS CONTRACTS FEFP 5,000.00
41 Janine Jarvis 1014551 COLLEGE BD/DATA ANALYSIS CONTRACT FEFP 933.00
42 1015101 TESTING PRINTER/SCANNER MAINT FEFP 10,000.00
THE SCHOOL DISTRICT OF OSCEOLA COUNTY, FLORIDALINE ITEM BUDGET ALLOCATIONS 2015 16
1-8

ADMINISTRATOR PROJ NO PROJECT DESCRIPTION FUNDING
2016
RECOMMENDED
THE SCHOOL DISTRICT OF OSCEOLA COUNTY, FLORIDALINE ITEM BUDGET ALLOCATIONS 2015 16
43 Janine Jarvis 1015341 FORMATIVE ASSESSMENT PRINTING FEFP 0.00
44 1016101 SUMMER END OF COURSE (EOC) RETAKES FEFP 20,000.00
45 1016461 END OF YEAR ASSESSMENTS FEFP 250,000.00
46 1016471 PERT MATH SUBTEST FEFP 4,000.00
47 1016581 EOC PERT MATH FEFP 12,000.00
48 John Boyd 1010361 LEGISLATIVE CONSULTANT (MIXON) FEFP 30,000.00
49 1010451 OCEA/TEAMSTERS LEAVE (SUBS) FEFP 5,000.00
50 1011491 NEGOTIATION TEAM FEFP 7,500.00
51 1012671 SCHOOL BOARD POLICY MANUAL FEFP 5,500.00
52 Karen Strickland 1015481 TRANSPORTATION SUMMER PAY FEFP 175,000.00
53 1015591 TRANSP RADIO COMMUNICATIONS FEFP 57,600.00
54 1016491 TRANSPORTATION ROUTING MGMT SYSTEM FEFP 76,000.00
55 Ken DeBord 1010051 ATHLETIC INSURANCE FEFP 247,730.00
56 1010331 INSURANCE REIMBURSEMENT FEFP 65,000.00
57 1010731 PROPERTY CASUALTY INSURANCE CAPITAL 2,345,000.00
58 1010901 LIGHT DUTY/ADA ACCOMODATIONS FEFP 10,000.00
59 1011481 PUBLIC OFFICIAL BONDS FEFP 306.00
60 1011821 ACTUARIAL SERVICES FEFP 16,000.00
61 1011851 TAX SHELTER PLAN ADMIN FEFP 45,000.00
62 1012111 W/C SELF INSURER ASSESSMENT FEFP 75,000.00
63 1012121 FLOOD INSURANCE FEFP 25,000.00
64 1014731 HEP B / TRAINING & SHOTS FEFP 2,250.00
65 1015181 STATE & FEDERAL LABOR LAW POST FEFP 3,600.00
66 1015421 WORKERS COMPENSATION INSURANCE FEFP 1,706,000.00
67 1016231 FUEL STORAGE TANK REGISTRATION FEE FEFP 600.00
68 1016561 EMPLOYEE HEALTH AND WELLNESS CENTER FEFP 2,000,000.00
69 Lissette Brizendine 1015021 ENVIRONMENTAL CENTER FEFP 58,020.00
70 1015281 STIPENDS FOR PRE PLANNING TRNG FEFP 2,000.00
71 1015331 GRANT WRITING SERVICES FEFP 2,000.00
72 1016081 ADMINISTRATOR'S ACADEMY FEFP 5,000.00
73 Mark Munas 1014971 ADMIN COMPLEX SECURITY FEFP 13,500.00
74 1016181 SECURITY SYSTEM REPAIRS DIST WIDE CAPITAL 242,000.00
75 1016271 SUPPLEMENTAL SAFE SCHOOLS FEFP 268,350.00
76 Mel Pace 1015051 PRINT SHOP HARDWARE & SOFTWARE FEFP 21,000.00
77 1015071 PRINT SHP COPIER LEASE FEFP 75,000.00
78 1015641 FOCUS GRADEBOOK TRAINING FEFP 30,000.00
79 1016201 DESTINY RESOURCE MGMT MAINTENANCE FEFP 86,536.00
80 1016361 RFID ID BADGES FEFP 0.00
81 1016421 DISTRICT COMPUTER LABS IMC 1 & 3 FEFP 0.00
82 1016431 ELECTRONIC RESOURCES FEFP 350,000.00
83 1016591 OFFICE 365 STAFF TRAINING FEFP 35,900.00
84 Michael Akes 1010521 RENTAL OF FACILITIES (GRAD) FEFP 73,000.00
1-9

ADMINISTRATOR PROJ NO PROJECT DESCRIPTION FUNDING
2016
RECOMMENDED
THE SCHOOL DISTRICT OF OSCEOLA COUNTY, FLORIDALINE ITEM BUDGET ALLOCATIONS 2015 16
85 Michael Akes 1010541 SACS ANNUAL DUES SCHOOLS FEFP 31,850.00
86 1010601 SAC MEETINGS, TRNG & SUPPORT FEFP 2,500.00
87 1010871 CERTIFIED ATHLETIC TRAINING FEFP 17,500.00
88 1011521 ATHLETIC OFFICIALS & REFEREES FEFP 140,000.00
89 1013971 OCSA RENTAL SUMMER GRADUATION FEFP 0.00
90 1015261 MIDDLE SCHOOL ATHLETICS FEFP 50,000.00
91 1015291 STUDENT TUTORING & SMARTHINKING FEFP 30,000.00
92 1015381 SUMMER OPS GUIDANCE COUNSELORS FEFP 160,000.00
93 1015441 POOL RENTAL AND HEATING FEFP 40,000.00
94 1015621 SUMMER OPS ATHLETIC DIRECTORS FEFP 10,000.00
95 1016301 GIFTED CONSULTANT SERVICES FEFP 40,000.00
96 Michael Allen 1011071 FINE ARTS SUPPORT FEFP 122,000.00
97 Migdalia Mercado 1012151 ANNUAL AUDITS FEFP 180,000.00
98 1012301 FINANCE PRINTED MATERIALS & ANALYSIS FEFP 7,500.00
99 1012431 CO & DS ADMIN EXPENSE CO&DS 37,500.00
100 Randy George 1011011 IBM COMPUTER SYSTEM ANN PMT FEFP 12,098.00
101 1013381 MICROFILMING/SCANNING FEFP 10,000.00
102 1014051 EDULOG ADMIN & MAINT FEFP 0.00
103 1014631 TAPE VAULTING, DATA PROJECT FEFP 24,900.00
104 1014751 MIS SOFTWARE MAINTENANCE FEFP 27,980.00
105 1015001 COMP OPERATIONS SUPP & MAINT FEFP 10,000.00
106 1015041 RECORDS MGMT OPERATIONS FEFP 9,000.00
107 1016341 MIS CONTRACTED SERVICES FEFP 0.00
108 1016441 SHAREPOINT LICENSE & SUPPORT FEFP 22,338.00
109 1016571 SOFTWARE APP TO ENCRYPT SENSITIVE DATA FEFP 12,335.00
110 Rhonda Blake 1011031 DDP AND REDISTRICTING FEFP 28,560.00
111 1016611 FISH SIGNAGE FEFP 5,000.00
112 1016621 EDUCATIONAL PLANT SURVEY FEFP 38,192.00
113 Russell Holmes 1010081 COMPUTER/SERVER SUPPORT FEFP 70,000.00
114 1010651 PHONE SYSTEM/FAX SERVER CAPITAL 27,000.00
115 1010661 INTERCOM REPAIRS DIST WIDE CAPITAL 50,000.00
116 1010671 DIST WIDE TELECOMMUNICATIONS FEFP 505,000.00
117 1010961 NETWORK HRDWR, SFTWR & MAINT FEFP 622,900.00
118 1011341 TECHNOLOGY OVERTIME TESTING FEFP 12,000.00
119 1015451 MICROSOFT EES FEFP 360,000.00
120 Sonia Esposito 1016261 CHOICE PROGRAMS MARKETING FEFP 6,500.00
121 Stacey Mcmillian 1010501 POSTAGE & UPS CO FEFP 50,000.00
122 1010741 XEROX PAPER & COPY CHARGES CO FEFP 30,000.00
123 1010821 TERMITE TREATMENTS CAPITAL 15,000.00
124 1010851 STORAGE TRAILER RENT/SUPPLIES FEFP 5,000.00
125 1015511 MOVING/ SURPLUS PROP PK UP FEFP 20,000.00
126 1016481 DELIVERY TRUCKS AND FORKLIFT CAPITAL 0.00
1-10
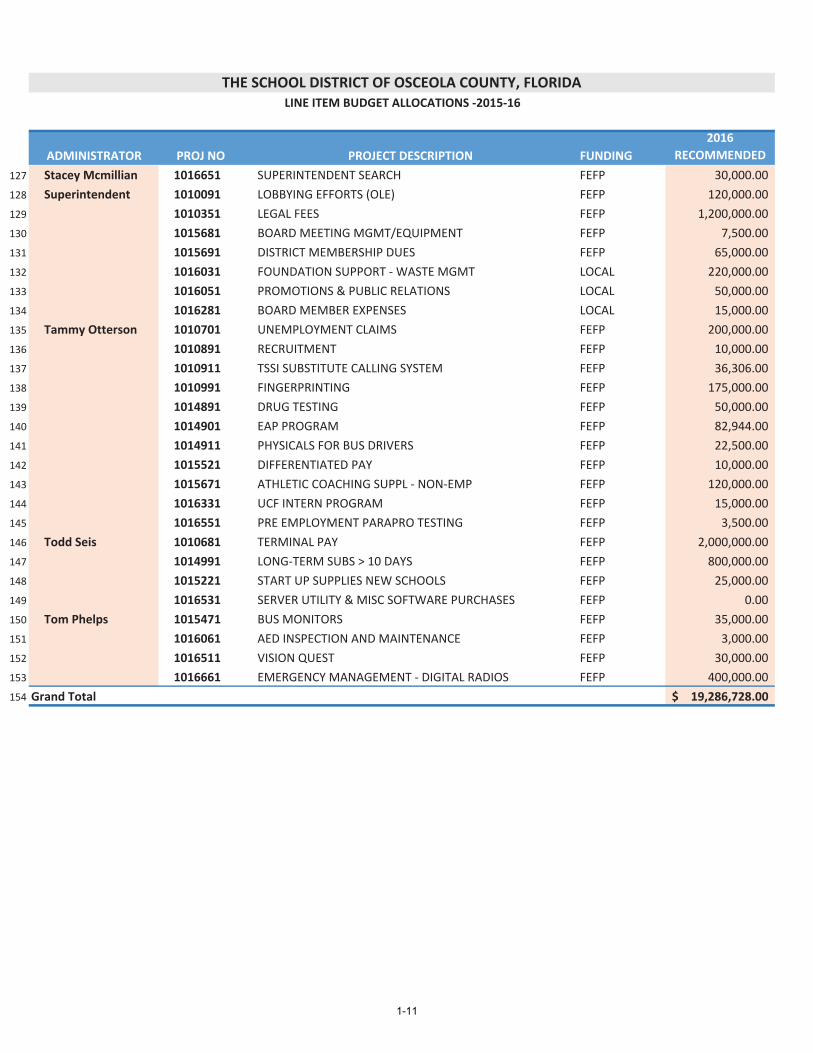
ADMINISTRATOR PROJ NO PROJECT DESCRIPTION FUNDING
2016
RECOMMENDED
THE SCHOOL DISTRICT OF OSCEOLA COUNTY, FLORIDALINE ITEM BUDGET ALLOCATIONS 2015 16
127 Stacey Mcmillian 1016651 SUPERINTENDENT SEARCH FEFP 30,000.00
128 Superintendent 1010091 LOBBYING EFFORTS (OLE) FEFP 120,000.00
129 1010351 LEGAL FEES FEFP 1,200,000.00
130 1015681 BOARD MEETING MGMT/EQUIPMENT FEFP 7,500.00
131 1015691 DISTRICT MEMBERSHIP DUES FEFP 65,000.00
132 1016031 FOUNDATION SUPPORT WASTE MGMT LOCAL 220,000.00
133 1016051 PROMOTIONS & PUBLIC RELATIONS LOCAL 50,000.00
134 1016281 BOARD MEMBER EXPENSES LOCAL 15,000.00
135 Tammy Otterson 1010701 UNEMPLOYMENT CLAIMS FEFP 200,000.00
136 1010891 RECRUITMENT FEFP 10,000.00
137 1010911 TSSI SUBSTITUTE CALLING SYSTEM FEFP 36,306.00
138 1010991 FINGERPRINTING FEFP 175,000.00
139 1014891 DRUG TESTING FEFP 50,000.00
140 1014901 EAP PROGRAM FEFP 82,944.00
141 1014911 PHYSICALS FOR BUS DRIVERS FEFP 22,500.00
142 1015521 DIFFERENTIATED PAY FEFP 10,000.00
143 1015671 ATHLETIC COACHING SUPPL NON EMP FEFP 120,000.00
144 1016331 UCF INTERN PROGRAM FEFP 15,000.00
145 1016551 PRE EMPLOYMENT PARAPRO TESTING FEFP 3,500.00
146 Todd Seis 1010681 TERMINAL PAY FEFP 2,000,000.00
147 1014991 LONG TERM SUBS > 10 DAYS FEFP 800,000.00
148 1015221 START UP SUPPLIES NEW SCHOOLS FEFP 25,000.00
149 1016531 SERVER UTILITY & MISC SOFTWARE PURCHASES FEFP 0.00
150 Tom Phelps 1015471 BUS MONITORS FEFP 35,000.00
151 1016061 AED INSPECTION AND MAINTENANCE FEFP 3,000.00
152 1016511 VISION QUEST FEFP 30,000.00
153 1016661 EMERGENCY MANAGEMENT DIGITAL RADIOS FEFP 400,000.00
154 Grand Total 19,286,728.00$
1-11
FUND 2XX
DEBT SERVICE FUND
DEBT SERVICE FUND BUDGET
This fund is used to account for the accumulation of resources for, and thepayment of, long term debt principal, interest, and related costs. Fundingsources, as projected in the attached statement, consist of the following:
Federal direct subsidy related to Qualified School Construction Bonds.
State Capital Outlay and Debt Service allocations used to retire bondsissued on behalf of the District by the State.
The Board’s share of the one cent local option sales tax levied by thecounty used to retire revenue bonds issued in 2007.
Lease payments from Four Corners Charter School, Inc. used to retireCertificates of Participation issued to construct the Four Corners facilities.
Transfers from capital projects funds used to retire Certificates ofParticipation, loans from Indian River and Collier School Boards fromClassrooms First funds, and obligations to the Bellalago EducationalFacilities Benefit District.
FUND2XX
2-2

FEDERAL:Federal Direct QSCB Subsidy 3199 2,177,523.00 2,179,872.00 (2,349.00) Total Federal 2,177,523.00 2,179,872.00 (2,349.00)
STATE:CO & DS withheld for SBE/COBI Bonds 3322 1,617,716.80 445,863.91 1,171,852.89 SBE.COBI Bond 3326 - Total State 1,617,716.80 445,863.91 1,171,852.89
LOCAL:Sales Tax 3418 11,790,543.00 11,337,061.00 453,482.00Lease Payments and Other 3425 1,118,856.26 1,121,209.70 (2,353.44) Interest on Investments (incl. net change) 3430 168,005.72 (168,005.72) Total Local 12,909,399.26 12,626,276.42 283,122.84
OTHER SOURCES:Transfers In 3630 20,890,664.63 20,060,119.11 830,545.52Interfund Transfers 3650 - - -Proceeds/Premium on Refunding Bonds 3700 12,268,661.25 (12,268,661.25) Total Other Sources 20,890,664.63 32,328,780.36 (11,438,115.73)
TOTAL ESTIMATED REVENUE & OTHER SOURCES 37,595,303.69 47,580,792.69 (9,985,489.00)
Restricted for Debt Service 2752 9,827,715.71 8,592,432.54 1,235,283.17 Total Beginning Fund Balance 9,827,715.71 8,592,432.54 1,235,283.17
TOTAL EST REVENUE AND BEGINNING FD BAL 47,423,019.40 56,173,225.23 (8,750,205.83)
Source
ACCT.
NO.
2015‐16
Tentative
2014‐15
Budget Difference
THE SCHOOL DISTRICT OF OSCEOLA COUNTY, FLDEBT SERVICE FUND ‐ ESTIMATED REVENUES ‐ 2015‐16
2-3

ACCT. 2015‐16 2014‐15Use NO. Tentative Budget Difference
Redemption of Principal 9271 17,795,123.37 16,933,916.45 861,206.92 Interest 9272 12,177,357.40 12,995,365.03 (818,007.63) Dues and Fees 9273 45,300.00 175,336.80 (130,036.80) Payments to Refunding Bond Escrow Agent 9276 - 12,134,168.24 (12,134,168.24) Total Debt Service Appropriations 30,017,780.77 42,238,786.52 (86,837.51)
OTHER USES: Transfers Out 9793 5,530,356.56 4,106,723.00 1,423,633.56 Total Other Financing Uses 5,530,356.56 4,106,723.00 1,423,633.56
TOTAL APPROPRIATIONS AND OTHER USES 35,548,137.33 46,345,509.52 1,336,796.05
ESTIMATED REVENUE LESS APPROPRIATIONS 2,047,166.36 1,235,283.17 811,883.19
FUND BALANCE AT END OF YEAR: Restricted for Debt Sevice 2752 11,874,882.07 9,827,715.71 2,047,166.36 Total Ending Fund Balance 11,874,882.07 9,827,715.71 2,047,166.36
TOTAL APPROPRIATIONS AND ENDING FD BAL 47,423,019.40 56,173,225.23 (8,750,205.83)
THE SCHOOL DISTRICT OF OSCEOLA COUNTY, FLDEBT SERVICE FUND ‐ SUMMARY OF APPROPRIATIONS AND FUND BALANCES ‐ 2015‐16
2-4

210 29A 2A1 298 29C 29Y 29Z
ACCT. SBE Bonds Classrooms First 2007 Sales Tax Bd Bellalago EFBD 1999 COP 2004 COP 2005 COP
Source NO. N01, N02 Series A & B
CURRENT BALANCE 167,425.12 ‐ 1,581,308.35 3.09 ‐ 921,378.13 Est Additional Receipts ‐ ‐ ‐ ‐ ‐ ‐ ‐ (Est Additional Expenditures) ‐ ‐ ‐ ‐ ‐ ‐ ‐
BEGINNING FUND BALANCE 167,425.12 ‐ 1,581,308.35 ‐ 3.09 ‐ 921,378.13
ESTIMATED REVENUE: 0.9505.0000000..
FEDERAL DIRECT QSCBs 0199
CO&DS 0322 1,617,716.80 LOCAL SALES TAX 0418 11,790,543.00 LEASE 0425 1,118,856.26 TRANSFERS IN 0630 3,708,892.00 440,727.26 ‐ ‐
TOTAL ESTIMATED REVENUE & OTHER SOURCES 1,617,716.80 3,708,892.00 11,790,543.00 440,727.26 ‐ ‐ 1,118,856.26
TOTAL ESTIMATED REVENUES AND BEGINNING FD BAL 1,785,141.92 3,708,892.00 13,371,851.35 440,727.26 3.09 ‐ 2,040,234.39
APPROPRIATIONS: 9501.2000001.9200
PRINCIPAL 7100 1,314,000.00 3,372,420.17 4,520,000.00 183,703.20 ‐ 730,000.00 INTEREST 7200 334,848.75 336,471.83 2,714,687.50 257,024.06 ‐ 368,156.26 DUES & FEES 7300 4,000.00 ‐ 5,300.00 TRANSFERS OUT 9300 5,530,356.56 ‐
TOTAL APPROPRIATIONS & OTHER USES 1,648,848.75 3,708,892.00 12,769,044.06 440,727.26 ‐ ‐ 1,103,456.26
ESTIMATED REVENUE LESS APPROPRIATIONS (31,131.95) ‐ (978,501.06) ‐ ‐ ‐ 15,400.00
FUND BALANCE AT END OF YEAR:
RESTRICTED 275200 136,293.17 ‐ 602,807.29 ‐ 3.09 ‐ 936,778.13
ENDING FUND BALANCE 136,293.17 ‐ 602,807.29 ‐ 3.09 ‐ 936,778.13
TOTAL APPROPRIATIONS AND ENDING FD BAL 1,785,141.92 3,708,892.00 13,371,851.35 440,727.26 3.09 ‐ 2,040,234.39
THE SCHOOL DISTRICT OF OSCEOLA COUNTY, FLDEBT SERVICES FUND ‐ ESTIMATED REVENUES AND APPROPRIATIONS BY FUND ‐ 2015‐16
2-5
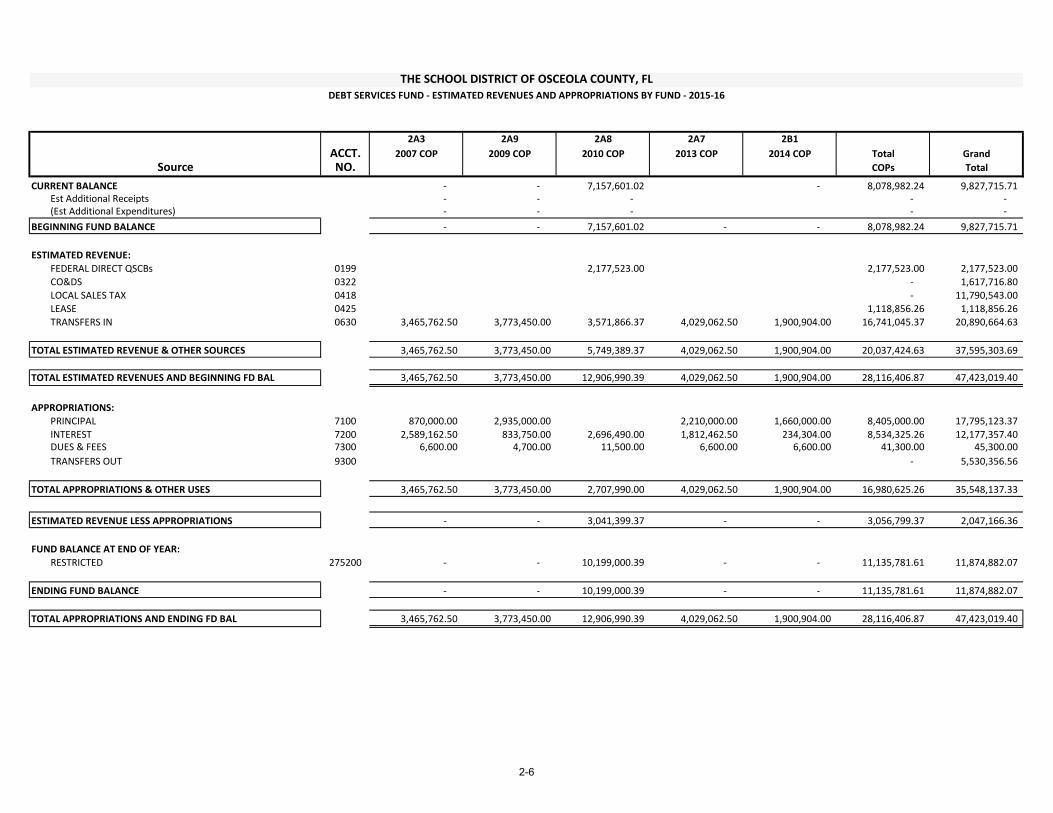
2A3 2A9 2A8 2A7 2B1
ACCT. 2007 COP 2009 COP 2010 COP 2013 COP 2014 COP Total Grand
Source NO. COPs Total
CURRENT BALANCE ‐ ‐ 7,157,601.02 ‐ 8,078,982.24 9,827,715.71 Est Additional Receipts ‐ ‐ ‐ ‐ ‐ (Est Additional Expenditures) ‐ ‐ ‐ ‐ ‐
BEGINNING FUND BALANCE ‐ ‐ 7,157,601.02 ‐ ‐ 8,078,982.24 9,827,715.71
ESTIMATED REVENUE: 0.9505.0000000..
FEDERAL DIRECT QSCBs 0199 2,177,523.00 2,177,523.00 2,177,523.00 CO&DS 0322 ‐ 1,617,716.80 LOCAL SALES TAX 0418 ‐ 11,790,543.00 LEASE 0425 1,118,856.26 1,118,856.26 TRANSFERS IN 0630 3,465,762.50 3,773,450.00 3,571,866.37 4,029,062.50 1,900,904.00 16,741,045.37 20,890,664.63
TOTAL ESTIMATED REVENUE & OTHER SOURCES 3,465,762.50 3,773,450.00 5,749,389.37 4,029,062.50 1,900,904.00 20,037,424.63 37,595,303.69
TOTAL ESTIMATED REVENUES AND BEGINNING FD BAL 3,465,762.50 3,773,450.00 12,906,990.39 4,029,062.50 1,900,904.00 28,116,406.87 47,423,019.40
APPROPRIATIONS: 9501.2000001.9200
PRINCIPAL 7100 870,000.00 2,935,000.00 2,210,000.00 1,660,000.00 8,405,000.00 17,795,123.37 INTEREST 7200 2,589,162.50 833,750.00 2,696,490.00 1,812,462.50 234,304.00 8,534,325.26 12,177,357.40 DUES & FEES 7300 6,600.00 4,700.00 11,500.00 6,600.00 6,600.00 41,300.00 45,300.00 TRANSFERS OUT 9300 ‐ 5,530,356.56
TOTAL APPROPRIATIONS & OTHER USES 3,465,762.50 3,773,450.00 2,707,990.00 4,029,062.50 1,900,904.00 16,980,625.26 35,548,137.33
ESTIMATED REVENUE LESS APPROPRIATIONS ‐ ‐ 3,041,399.37 ‐ ‐ 3,056,799.37 2,047,166.36
FUND BALANCE AT END OF YEAR:
RESTRICTED 275200 ‐ ‐ 10,199,000.39 ‐ ‐ 11,135,781.61 11,874,882.07
ENDING FUND BALANCE ‐ ‐ 10,199,000.39 ‐ ‐ 11,135,781.61 11,874,882.07
TOTAL APPROPRIATIONS AND ENDING FD BAL 3,465,762.50 3,773,450.00 12,906,990.39 4,029,062.50 1,900,904.00 28,116,406.87 47,423,019.40
THE SCHOOL DISTRICT OF OSCEOLA COUNTY, FLDEBT SERVICES FUND ‐ ESTIMATED REVENUES AND APPROPRIATIONS BY FUND ‐ 2015‐16
2-6

210 29A 2A1 298 29Z 2A3SBE Bonds Classrooms First 2007 Sales Tax Bd Bellalago EFBD 2005 COP 2007 COP
N01, N02 Series A & B
Various Projects
Narcoossee Comm. School, Discovery
Int., Kissimmee Middle, Reedy Creek Elem., Liberty High
Partin Settlement Elem., Poinciana
Elem., Celebration High, buses, other misc. renovations
Bellalago Charter School
Four Corners Charter School
Celebration High, Poinciana High
Auditorium, Osceola County School for
the Arts
3.0 - 5.0 5.26 - 5.776 3.5 - 5.0 5.83 - 6.05 3.25 - 4.5 3.625 - 4.5
7,114,000.00 6,926,368.44 56,220,000.00 3,863,448.69 8,850,000.00 59,160,000.00
Principal & Interest Payments Due in:2016 1,648,848.75 3,708,892.00 7,234,687.50 440,727.26 1,098,156.26 3,459,162.502017 1,611,585.00 3,708,892.00 7,233,687.50 428,501.51 1,098,356.26 3,469,362.502018 975,675.00 7,231,437.50 422,479.51 1,101,759.38 3,467,762.502019 804,912.50 7,231,737.50 407,508.64 1,092,937.50 3,468,812.502020 726,006.25 7,231,737.50 392,971.77 1,091,637.50 7,532,975.002021 709,362.50 7,230,987.50 383,389.52 1,093,184.38 7,528,700.002022 627,037.50 7,232,250.00 368,878.64 1,093,153.13 7,539,300.002023 573,412.50 7,229,750.00 355,015.76 1,090,762.50 7,538,650.002024 410,637.50 7,232,500.00 342,597.26 1,090,875.00 7,536,750.002025 288,481.25 7,234,500.00 331,833.38 1,088,962.50 9,268,350.002026 177,862.50 312,745.50 10,385,375.002027 305,012.01 10,388,437.502028 288,306.02
2029 272,486.14
2030 253,169.26
2031 240,925.38
2032 229,115.00
2033 207,675.50
2034 69,042.50
2035
TOTAL: 8,553,821.25 7,417,784.00 72,323,275.00 6,052,380.56 10,939,784.41 81,583,637.50
*Principal and interest payments shown for the 2010 COP's are net of an annual federal direct subsidy of $2,177,523
School District of Osceola County, FLFuture Debt Service Payments
As of 06/30/15
PRINCIPAL AMOUNT OUTSTANDING
PROJECTS FUNDED
INTEREST RATE
2-7

Principal & Interest Payments Due in:20162017201820192020202120222023202420252026202720282029203020312032203320342035
TOTAL:
School District of Osceola County, FLFuture Debt Service Payments
As of 06/30/15
PRINCIPAL AMOUNT OUTSTANDING
PROJECTS FUNDED
INTEREST RATE
2A9 2A8 2A7 2A7 Total Total2009 COP 2010 COP 2013 COP 2014 COP COPs Debt
Poinciana High, Horizon Middle,
Kissimmee Elem, Osceola High
Additions
Renovations: Osceola High,
Thacker Avenue Elementary, Highlands
ElementaryRefinance 2004A
COP
Refinance remaining portion of 2004A
COP; 2004B COP and 2004C COP
3.0 - 5.00.858
(net of subsidy)* 2.5 - 5.0 2.24
20,140,000.00 40,500,000.00 39,580,000.00 10,460,000.00 178,690,000.00 252,813,817.13
3,768,750.00 3,370,921.87 4,022,462.50 1,894,304.00 17,613,757.13 30,646,912.643,775,475.00 3,370,921.87 4,014,062.50 1,892,120.00 17,620,298.13 30,602,964.143,772,975.00 3,370,921.87 4,017,462.50 1,889,152.00 17,620,033.25 26,249,625.263,767,975.00 3,370,921.87 4,018,212.50 1,890,400.00 17,609,259.37 26,053,418.011,720,375.00 3,370,921.87 3,877,962.50 80,752.00 17,674,623.87 26,025,339.391,724,375.00 3,370,921.87 3,878,462.50 80,752.00 17,676,395.75 26,000,135.271,724,150.00 3,370,921.87 3,873,862.50 80,752.00 17,682,139.50 25,910,305.641,724,550.00 3,370,921.87 3,870,262.50 80,752.00 17,675,898.87 25,834,077.131,722,187.50 3,370,921.87 3,874,262.50 80,752.00 17,675,748.87 25,661,483.63
3,370,921.87 3,871,012.50 80,752.00 17,679,998.87 25,534,813.503,370,921.87 2,755,512.50 80,752.00 16,592,561.37 17,083,169.37
43,870,921.87 2,752,950.00 80,752.00 57,093,061.37 57,398,073.389,560,249.99 3,685,752.00 13,246,001.99 13,534,308.01
0.00 272,486.140.00 253,169.260.00 240,925.380.00 229,115.000.00 207,675.500.00 69,042.500.00 0.00
23,700,812.50 80,951,062.44 54,386,737.49 11,897,744.00 263,459,778.34 357,807,039.15
2-8

Debt Capacity Analysis ‐ BoardRevised 07/07/2015
Estimated Revenue 2016 2017 2018 2019 2020 2021Tax Roll 21,129,933,005 21,975,130,325 22,854,135,538 23,768,300,960 24,719,032,998 25,707,794,318Millage 1.5 1.5 1.5 1.5 1.5 1.5 Total Tax (Tax Roll * Millage * Collection) 0.96 30,427,103.53 31,644,187.67 32,909,955.18 34,226,353.38 35,595,407.52 37,019,223.82
Debt Service Appropriations SERIES CHARGE IDCOP 2004 Debt Service A * ‐ ‐ ‐ ‐ ‐ ‐ COP 2004 Debt Service B * ‐ ‐ ‐ ‐ ‐ ‐ COP 2004 Debt Service C * ‐ ‐ ‐ ‐ ‐ ‐ COP 2005 Debt Service A * 1,106,181.26 1,106,381.26 1,109,784.38 1,100,962.50 1,099,662.50 1,101,209.38 COP 2007 Debt Service A * 3,465,762.50 3,472,812.50 3,471,212.50 3,472,262.50 7,536,425.00 7,532,150.00 COP 2009 Debt Service A * 3,773,450.00 3,778,925.00 3,776,425.00 3,771,425.00 1,723,825.00 1,727,825.00 COP 2010 Debt Service A * 5,559,944.87 5,551,894.87 5,551,894.87 5,551,894.87 5,551,894.87 5,551,894.87 COP 2010 Debt Service A QSCB Subsidy (2,177,523.00) (2,177,523.00) (2,177,523.00) (2,177,523.00) (2,177,523.00) (2,177,523.00) COP 2013 Debt Service A * 4,029,062.50 4,018,812.50 4,022,212.50 4,022,962.50 3,882,712.50 3,883,212.50 COP 2014 Debt Service A * 1,900,904.00 1,892,120.00 1,889,152.00 1,890,400.00 80,752.00 80,752.00 Bellalago Benefit District PF * 440,727.26 428,501.51 422,479.51 407,508.64 392,971.77 383,389.52 N01 Classroom First Loan ‐ Collier County * 2,811,853.00 2,811,853.00 ‐ ‐ ‐ ‐ N02 Classroom First Loan ‐ Indian River * 897,039.00 897,039.00 ‐ ‐ ‐ ‐
Total Debt Service Needs 21,807,401.39 21,780,816.64 18,065,637.76 18,039,893.01 18,090,720.64 18,082,910.27
Estimated Debt Service Minus Needs 8,619,702.14 9,863,371.03 14,844,317.42 16,186,460.37 17,504,686.88 18,936,313.55
Millage Required to Meet Debt Service Needs 1.075 1.032 0.823 0.791 0.762 0.733
Millage Available for Capital Expenditures 0.425 0.468 0.677 0.709 0.738 0.767
Percent Indebted 71.7% 68.8% 54.9% 52.7% 50.8% 48.8%
2-9

FUND 3XX
CAPITAL PROJECTS FUND

CAPITAL PROJECTS FUND BUDGET
This fund reports the revenue and expenditures for construction and renovations of school buildings and grounds. Funds are accounted for by source and year of appropriation.
Public Education Capital Outlay funds (PECO) are one source of state revenue for Capital Projects. These funds are derived from utility taxes throughout the state and are allocated by the Legislature each year. PECO funds provide for maintenance and renovation of existing facilities and health and safety needs.
Capital Outlay (CO) and Debt Service (DS) revenues are derived from motor vehicle license tag fees.
The Board also generates capital revenue by levying capital outlay taxes. By law, this tax millage is limited to 1.5 mills and is currently set at the maximum.
The District also receives impact fees charged against new residential construction.
The District receives a portion of the one‐cent infrastructure sales tax levied by the county. The excess of these revenues are transferred in from the debt service fund after payment of the sales tax bonds. Based on an inter‐local agreement the District receives 25% of the revenue generated through 2025.
The majority of funds must be expended on Capital Outlay Projects in accordance with State Board Regulations. These regulations require recommendation of a school plant survey which must be conducted at least every five years.
FUND 3XX
3-2

2005‐06 31,289,374 ‐ 2006‐07 42,088,335 34.5%
2007‐08 51,335,368 22.0%
2008‐09 46,092,399 ‐10.2%
2009‐10 33,142,748 ‐28.1%
2010‐11 27,783,883 ‐16.2%
2011‐12 25,707,956 ‐7.5%
2012‐13 25,367,760 ‐1.3%
2013‐14 26,438,255 4.2%
2014‐15* 28,263,525 6.9%
2015‐16* 30,427,104 7.7%
2016‐17* 31,644,188 4.0%
2017‐18* 32,909,955 4.0%
2018‐19* 34,226,353 4.0%
2019‐20* 35,595,408 4.0%
2005‐06 40,493,821 ‐ 2006‐07 40,535,828 0.1%
2007‐08 18,428,721 ‐54.5%
2008‐09 8,680,988 ‐52.9%
2009‐10 8,523,234 ‐1.8%
2010‐11 6,768,300 ‐20.6%
2011‐12 9,651,482 42.6%
2012‐13 12,286,659 27.3%
2013‐14 21,612,978 75.9%
2014‐15* 24,000,000 11.0%
2015‐16* 26,040,242 8.5%
2016‐17* 27,472,455 5.5%
2017‐18* 28,983,440 5.5%
2018‐19* 30,577,529 5.5%
2019‐20* 32,259,293 5.5%
2005‐06 7,948,681 ‐ 2006‐07 9,998,541 25.8%
2007‐08 10,292,844 2.9%
2008‐09 9,143,244 ‐11.2%
2009‐10 9,035,938 ‐1.2%
2010‐11 9,511,482 5.3%
2011‐12 9,925,207 4.3%
2012‐13 10,416,923 5.0%
2013‐14 10,600,770 1.8%
2014‐15* 11,337,061 6.9%
2015‐16* 11,790,543 4.0%
2016‐17* 12,262,165 4.0%
2017‐18* 12,752,652 4.0%
2018‐19* 13,262,758 4.0%
2019‐20* 13,793,268 4.0%
2005‐06 1,875,100 ‐ 2006‐07 4,749,977 153.3%
2007‐08 9,776,617 105.8%
2008‐09 17,453,825 78.5%
2009‐10 10,719,386 ‐38.6%
2010‐11 527,713 ‐95.1%
2011‐12 1,515,743 187.2%
2012‐13 ‐ ‐100.0%
2013‐14 ‐ 0.0%
2014‐15 1,016,151 100.0%
2015‐16* ‐ 0.0%
2016‐17* ‐ 0.0%
2017‐18* ‐ 0.0%
2018‐19* ‐ 0.0%
2019‐20* ‐ 0.0%
*Projections
PECO
Capital Outlay Tax
Impact Fees
Sales Tax
THE SCHOOL DISTRICT OF OSCEOLA COUNTY, FLCAPITAL REVENUE HISTORY & PROJECTIONS ‐ 2015‐16
‐
10,000,000
20,000,000
30,000,000
40,000,000
50,000,000
60,000,000
‐ 5,000,000
10,000,000
15,000,000
20,000,000
25,000,000
30,000,000
35,000,000
40,000,000
45,000,000
‐
2,000,000
4,000,000
6,000,000
8,000,000
10,000,000
12,000,000
14,000,000
16,000,000
‐ 2,000,000
4,000,000
6,000,000
8,000,000
10,000,000
12,000,000
14,000,000
16,000,000
18,000,000
20,000,000
3-3

2015‐16 2016‐17 2017‐18 2018‐19 2019‐2020
BEGINNING FUND BALANCE & ESTIMATED REVENUES
BEGINNING FUND BALANCE
Capacity 26,289,967 32,984,211 21,157,887 6,976,068 13,307,765 Carryover ‐ Capacity 6,939,149 ‐ ‐ ‐ ‐ Non‐Capacity 1,371,889 2,154,637 3,050,057 5,688,845 10,146,780 Carryover ‐ Non‐Capacity 12,728,775 ‐ ‐ ‐ ‐ Total Beginning Fund Balance 47,329,780 35,138,848 24,207,943 12,664,913 23,454,546
ESTIMATED REVENUES
Capacity Sources 26,402,848 27,857,734 29,345,210 30,910,022 32,613,916 Non‐Capacity Sources 38,943,307 39,181,417 40,922,149 42,737,668 44,627,699 Total Estimated Revenues 65,346,155 67,039,152 70,267,359 73,647,690 77,241,615
Total Beginning Fund Balance & Estimated Revenues 112,675,935 102,178,000 94,475,302 86,312,603 100,696,161
APPROPRIATIONS & PROJECTED ENDING FUND BALANCE
APPROPRIATIONS
Capacity 26,647,753 39,684,059 43,527,029 24,578,324 3,741,532 Non‐Capacity 50,889,333 38,285,998 38,283,360 38,279,733 40,235,988
Total Appropriations 77,537,086 77,970,057 81,810,389 62,858,057 43,977,519
PROJECTED ENDING FUND BALANCE
Capacity 32,984,211 21,157,887 6,976,068 13,307,765 42,180,150 Non‐Capacity 2,154,637 3,050,057 5,688,845 10,146,780 14,538,491
Total Ending Fund Balance 35,138,848 24,207,943 12,664,913 23,454,546 56,718,641 Total Appropriations & Projected Ending Fund Balance 112,675,935 102,178,000 94,475,302 86,312,603 100,696,161
THE SCHOOL DISTRICT OF OSCEOLA COUNTY, FL
SUMMARY PROPOSED FIVE YEAR CAPITAL OUTLAY PLAN
3-4

2015‐16 2016‐17 2017‐18 2018‐19 2019‐20
BEGINNING FUND BALANCE & ESTIMATED REVENUES
BEGINNING FUND BALANCE
Restricted for Capital Projects 26,289,967 32,984,211 21,157,887 6,976,068 13,307,765 Restricted for Carryover Appropriations 6,939,149 Total Beginning Fund Balance 33,229,116 32,984,211 21,157,887 6,976,068 13,307,765
ESTIMATED REVENUES
Impact Fees 26,040,242 27,472,455 28,983,440 30,577,529 32,259,293 Flora Ridge EFBD 296,881 302,819 308,875 315,053 321,354 Interest 65,725 82,461 52,895 17,440 33,269 Total Estimated Revenues 26,402,848 27,857,734 29,345,210 30,910,022 32,613,916
Total Beginning Fund Balance & Estimated Revenues 59,631,964 60,841,945 50,503,096 37,886,090 45,921,682
APPROPRIATIONS & ENDING FUND BALANCE
APPROPRIATIONS
NEW SCHOOL PROJECTS
HIGH SCHOOLS
High School HHH 3,000,000 30,000,000 35,000,000 Total New School Projects 3,000,000 30,000,000 35,000,000 ‐ ‐
DEBT SERVICE USED TO FUND CAPACITY
Repay LOANS ‐ Long Term (COPs) 4,197,470 4,182,843 4,181,813 4,183,489 2,293,898 Repay LOANS ‐ Long Term (Class 1st) 3,708,892 3,708,892 ‐ ‐ ‐ Repay LOANS ‐ EFBD 440,727 428,502 422,480 407,509 392,972 Total Debt Service Used To Fund Capacity 8,347,089 8,320,237 4,604,293 4,590,997 2,686,870
CLASSROOM CAPACITY PROJECTS
Discovery Intermediate Space Reconfiguration 1,700,000 ‐ ‐ ‐ ‐ Gateway High School Space Reconfiguration 1,500,000 ‐ ‐ ‐ ‐ Harmony High School Space Reconfiguration 700,000 ‐ ‐ ‐ ‐ Horizon Middle School Space Reconfiguration ‐ 500,000 ‐ ‐ ‐ Poinciana High School Wing Addition ‐ ‐ ‐ 7,000,000 ‐ Total Classroom Capacity Projects 3,900,000 500,000 ‐ 7,000,000 ‐
OTHER CAPACITY PROJECTS
Buses ‐ New 461,515 863,822 922,736 987,327 1,054,662 Transportation Ancillary Facility 4,000,000 ‐ ‐ ‐ ‐ Land ‐ ‐ 3,000,000 12,000,000 ‐
Total Other Capacity Projects 4,461,515 863,822 3,922,736 12,987,327 1,054,662
CARRYOVER
Celebration K8: Space Reconfiguration 766,257 Celebration High School Wing Addition 13,857 Central Avenue Elem Wing Addition 8,150 Chestnut Elementary Space Reconfiguration 104,837 Portables 1,112,208 Gateway Rifle Range (ROTC) 60,000 Harmony High School Wing Addition 3,473,593 Hickory Tree Elem Wing Addition 4,540 Horizon Middle Space Reconfiguration 600,578 Kissimmee Middle Space Reconfiguration 684,027 Sunrise Elementary Space Reconfiguration 111,103
Total Carryover 6,939,149 ‐ ‐ ‐ ‐
Total Appropriations 26,647,753 39,684,059 43,527,029 24,578,324 3,741,532
Annual Surplus/(Deficiency) (244,905) (11,826,324) (14,181,819) 6,331,698 28,872,384
PROJECTED ENDING FUND BALANCE
Restricted for Capital Projects 32,984,211 21,157,887 6,976,068 13,307,765 42,180,150 Total Ending Fund Balance 32,984,211 21,157,887 6,976,068 13,307,765 42,180,150
Total Appropriations & Ending Fund Balance 59,631,964 60,841,945 50,503,096 37,886,090 45,921,682
THE SCHOOL DISTRICT OF OSCEOLA COUNTY, FL
PROPOSED FIVE YEAR CAPITAL OUTLAY PLAN ‐ CAPACITY
3-5

2015‐16 2016‐17 2017‐18 2018‐19 2019‐20
BEGINNING FUND BALANCE & ESTIMATED REVENUES
BEGINNING FUND BALANCE
Restricted for Capital Projects 1,371,889 2,154,637 3,050,057 5,688,845 10,146,780 Restricted for Carryover Appropriations 12,728,775 Total Beginning Fund Balance 14,100,664 2,154,637 3,050,057 5,688,845 10,146,780
ESTIMATED REVENUES
CO&DS Flowthrough 591,008 591,008 591,008 591,008 591,008 1.5 Mill CO TAX 30,427,104 31,644,188 32,909,955 34,226,353 35,595,408 1/4 Cent Sales Tax Net Flowthrough 5,530,357 4,555,939 5,028,665 5,521,189 6,031,020 Charter Capital 2,384,896 2,384,896 2,384,896 2,384,896 2,384,896 Interest 9,942 5,387 7,625 14,222 25,367 Total Estimated Revenues 38,943,307 39,181,417 40,922,149 42,737,668 44,627,699
Total Beginning Fund Balance & Estimated Revenues 53,043,971 41,336,055 43,972,205 48,426,513 54,774,479
APPROPRIATIONS & ENDING FUND BALANCE
APPROPRIATIONS
REOCCURRING PROJECTS
Health & Safety 950,000 950,000 950,000 950,000 950,000 General School Maintenance Salaries (Tsf to General Fund) 5,879,845 5,879,845 5,879,845 5,879,845 5,879,845 General School Maintenance Non‐Salary (Tsf to General Fund) 242,000 242,000 242,000 242,000 242,000 General School Maintenance Line Items (Tsf to General Fund) 1,268,000 1,268,000 1,268,000 1,268,000 1,268,000 Property Casualty Insurance (Tsf to General Fund) 2,345,000 2,345,000 2,345,000 2,345,000 2,345,000 Charter Capital (Tsf to General Fund) 2,384,896 2,384,896 2,384,896 2,384,896 2,384,896 Portable Rent (Tsf to General Fund) 1,400,000 1,600,000 1,600,000 1,600,000 1,600,000 General Schools Facilities Operations (Reimb to General Fund) 1,804,814 1,804,814 1,804,814 1,804,814 1,804,814 General Schools Facilities Line Items (Reimb to General Fund) 222,800 222,800 222,800 222,800 222,800 Athletic Facilities 70,000 70,000 70,000 70,000 70,000 Technology Infrastructure 1,350,000 1,350,000 1,350,000 1,350,000 1,350,000 School Computers 1,000,000 1,000,000 1,000,000 1,000,000 1,000,000 LIIS 440,000 440,000 440,000 440,000 440,000 Buses ‐ Replacement 1,185,000 1,185,000 1,185,000 1,185,000 1,185,000 Portable Installation (Includes technology) 1,074,628 1,000,000 1,000,000 1,000,000 1,000,000 Total Reoccurring Projects 21,616,983 21,742,355 21,742,355 21,742,355 21,742,355
RENOVATION/REMODELING PROJECTS
Cyclical Capital Renewal 4,000,000 4,000,000 4,000,000 4,000,000 4,000,000 Total Renovation/Remodeling 4,000,000 4,000,000 4,000,000 4,000,000 4,000,000
DEBT SERVICE
Repay LOANS ‐ Long Term (COPs) (Total) 16,741,045 16,726,486 16,722,818 16,720,866 16,787,531 Repay LOANS ‐ Long Term (Classrooms 1st) 3,708,892 3,708,892 ‐ ‐ ‐ Repay LOANS ‐ EFBD 440,727 428,502 422,480 407,509 392,972 Charge to Capacity (8,347,089) (8,320,237) (4,604,293) (4,590,997) (2,686,870) Total Debt Service 12,543,576 12,543,643 12,541,005 12,537,378 14,493,633
CARRYOVER
RECURRING PROJECTSHealth & Safety 1,259,325 Athletic Facilities 84,268 Technology Infrastructure 223,260 School Computers 522,545 LIIS 205,950 Buses ‐ Replacement 1,855,826 Maintenance 2,467,279 Portable Installation 68,592
RENOVATION/REMODELING PROJECTSCelebration K8‐Hearth Remodel 634,142 Thacker Avenue Elementary 2,490 TECO Poinciana 147,785 Cyclical Capital Renewal 5,257,313
Total Carryover 12,728,775 ‐ ‐ ‐ ‐
Total Appropriations 50,889,333 38,285,998 38,283,360 38,279,733 40,235,988
Annual Surplus/(Deficiency) (11,946,027) 895,419 2,638,789 4,457,935 4,391,711
PROJECTED ENDING FUND BALANCE
Restricted for Capital Projects 2,154,637 3,050,057 5,688,845 10,146,780 14,538,491 Total Ending Fund Balance 2,154,637 3,050,057 5,688,845 10,146,780 14,538,491
Total Appropriations & Ending Fund Balance 53,043,971 41,336,055 43,972,205 48,426,513 54,774,479
THE SCHOOL DISTRICT OF OSCEOLA COUNTY, FL
PROPOSED FIVE YEAR CAPITAL OUTLAY PLAN ‐ NON‐CAPACITY
3-6

ACCT. 2015‐16 2014‐15
Source NO. Budget Budget Difference
STATE:Capital Outlay & Debt Service 321 591,008.00 539,786.00 51,222.00Interest on Undistributed CO&DS 325 0.00 0.00 0.00PECO 391 0.00 1,016,151.00 (1,016,151.00)Charter Capital 397 2,384,896.00 3,050,200.00 (665,304.00)Other Miscellaneous State 399 0.00 0.00 0.00 Total State 2,975,904.00 4,606,137.00 (1,630,233.00)
LOCAL:Capital Outlay Tax (1.5 Mills) 413 30,427,104.00 28,263,525.00 2,163,579.00Interest 431 75,667.00 51,337.34 24,329.66Grants 440 0.00 0.00 0.00Miscellaneous 296,881.00 291,060.00 5,821.00Impact Fees 496 26,040,242.00 17,000,000.00 9,040,242.00 Total Local 56,839,894.00 45,605,922.34 11,233,971.66
OTHER SOURCES:Transfers In 620 5,530,357.00 4,684,711.00 845,646.00 Total Other Sources 5,530,357.00 4,684,711.00 845,646.00
TOTAL ESTIMATED REVENUE & OTHER SOURCES 65,346,155.00 54,896,770.34 10,449,384.66
FUND BALANCE AT BEGINNING OF YEAR:Restricted for Capital Projects 2726 47,329,780.10 41,252,756.66 6,077,023.44 Total Beginning Fund Balance 47,329,780.10 41,252,756.66 6,077,023.44
TOTAL EST REVENUE AND BEGINNING FD BAL 112,675,935.10 96,149,527.00 16,526,408.10
THE SCHOOL DISTRICT OF OSCEOLA COUNTY, FLCAPITAL PROJECTS FUND ‐ ESTIMATED REVENUES ‐ 2015‐16
3-7

ACCT. 2015‐16 2014‐15
Use NO. Budget Budget Difference
APPROPRIATIONS:Audio‐Visual Materials 6200 0.00 1,036.90 (1,036.90)Buildings and Additions 6300 15,319,742.87 16,819,680.60 (1,499,937.73)Furniture, Fixtures and Equipment 6410‐20 432,398.06 444,986.68 (12,588.62)Computer Equipment 6430‐40 723,324.53 913,142.24 (189,817.71)Vehicle Purchase 6510 3,502,341.20 6,759,925.70 (3,257,584.50)Land Purchase 6600 1,600.00 2,261.58 (661.58)Site Improvements 6700 862,829.89 192,539.68 670,290.21Remodeling and Renovations 6800 21,609,965.65 16,466,655.33 5,143,310.32Computer Software 6900 674,478.30 699,766.54 (25,288.24)Fees 7300 0.00 0.00 0.00 Total Function 7400 Appropriations 43,126,680.50 42,299,995.25 826,685.25
OTHER USES:To General Fund 9100 13,519,740.50 15,892,550.42 (2,372,809.92)To Debt Service Fund 9200 20,890,665.00 19,972,338.20 918,326.80 Total Other Financing Uses 34,410,405.50 35,864,888.62 (1,454,483.12)
TOTAL APPROPRIATIONS AND OTHER USES 77,537,086.00 78,164,883.87 (627,797.87)
ESTIMATED REVENUES LESS APPROPRIATIONS (12,190,931.00) (23,268,113.53) 11,077,182.53
FUND BALANCE AT END OF YEAR:Restricted for Capital Projects 2726 35,138,849.10 17,984,643.13 17,154,205.97 Total Ending Fund Balance 35,138,849.10 17,984,643.13 17,154,205.97
TOTAL APPROPRIATIONS AND ENDING FD BAL 112,675,935.10 96,149,527.00 16,526,408.10
THE SCHOOL DISTRICT OF OSCEOLA COUNTY, FLCAPITAL PROJECTS FUND ‐ SUMMARY OF APPROPRATIONS AND FUND BALANCES‐ 2015‐16
3-8
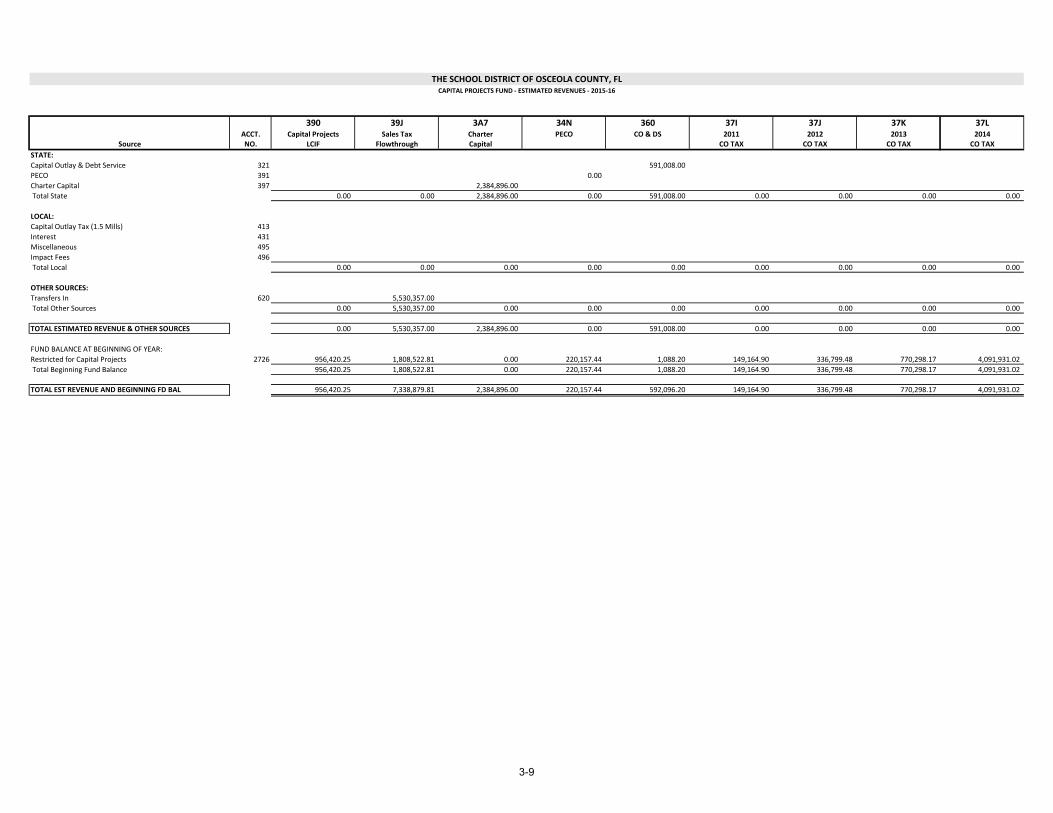
THE SCHOOL DISTRICT OF OSCEOLA COUNTY, FLCAPITAL PROJECTS FUND ‐ ESTIMATED REVENUES ‐ 2015‐16
390 39J 3A7 34N 360 37I 37J 37K 37LACCT. Capital Projects Sales Tax Charter PECO CO & DS 2011 2012 2013 2014
Source NO. LCIF Flowthrough Capital CO TAX CO TAX CO TAX CO TAX
STATE:
Capital Outlay & Debt Service 321 591,008.00
PECO 391 0.00
Charter Capital 397 2,384,896.00
Total State 0.00 0.00 2,384,896.00 0.00 591,008.00 0.00 0.00 0.00 0.00
LOCAL:
Capital Outlay Tax (1.5 Mills) 413
Interest 431
Miscellaneous 495
Impact Fees 496
Total Local 0.00 0.00 0.00 0.00 0.00 0.00 0.00 0.00 0.00
OTHER SOURCES:
Transfers In 620 5,530,357.00
Total Other Sources 0.00 5,530,357.00 0.00 0.00 0.00 0.00 0.00 0.00 0.00
TOTAL ESTIMATED REVENUE & OTHER SOURCES 0.00 5,530,357.00 2,384,896.00 0.00 591,008.00 0.00 0.00 0.00 0.00
FUND BALANCE AT BEGINNING OF YEAR:
Restricted for Capital Projects 2726 956,420.25 1,808,522.81 0.00 220,157.44 1,088.20 149,164.90 336,799.48 770,298.17 4,091,931.02
Total Beginning Fund Balance 956,420.25 1,808,522.81 0.00 220,157.44 1,088.20 149,164.90 336,799.48 770,298.17 4,091,931.02
TOTAL EST REVENUE AND BEGINNING FD BAL 956,420.25 7,338,879.81 2,384,896.00 220,157.44 592,096.20 149,164.90 336,799.48 770,298.17 4,091,931.02
3-9

ACCT.Source NO.
STATE:
Capital Outlay & Debt Service 321
PECO 391
Charter Capital 397
Total State
LOCAL:
Capital Outlay Tax (1.5 Mills) 413
Interest 431
Miscellaneous 495
Impact Fees 496
Total Local
OTHER SOURCES:
Transfers In 620
Total Other Sources
TOTAL ESTIMATED REVENUE & OTHER SOURCES
FUND BALANCE AT BEGINNING OF YEAR:
Restricted for Capital Projects 2726
Total Beginning Fund Balance
TOTAL EST REVENUE AND BEGINNING FD BAL
37N 37O 380 39K 39L 39N 39O2015 2016 Flora Ridge 2013 2014 2015 2016
CO TAX CO TAX EFBD Impact Fees Impact Fees Impact Fees Impact Fees Total
591,008.00
0.00
2,384,896.00
0.00 0.00 0.00 0.00 0.00 0.00 0.00 2,975,904.00
30,427,104.00 30,427,104.00
9,942.00 65,725.00 75,667.00
296,881.00 296,881.00
26,040,242.00 26,040,242.00
0.00 30,437,046.00 296,881.00 0.00 0.00 0.00 26,105,967.00 56,839,894.00
5,530,357.00
0.00 0.00 0.00 0.00 0.00 0.00 0.00 5,530,357.00
0.00 30,437,046.00 296,881.00 0.00 0.00 0.00 26,105,967.00 65,346,155.00
5,766,892.73 0.00 296,881.00 4,208,322.25 13,439,882.94 15,283,418.91 0.00 47,329,780.10
5,766,892.73 0.00 296,881.00 4,208,322.25 13,439,882.94 15,283,418.91 0.00 47,329,780.10
5,766,892.73 30,437,046.00 593,762.00 4,208,322.25 13,439,882.94 15,283,418.91 26,105,967.00 112,675,935.10
3-10

THE SCHOOL DISTRICT OF OSCEOLA COUNTY, FLCAPITAL PROJECTS FUND ‐ SUMMARY OF APPROPRATIONS AND FUND BALANCES‐ 2015‐16
390 39J 3A7 34N 360 37I 37J 37K 37LACCT. Capital Projects Sales Tax Charter PECO CO & DS 2011 2012 2013 2014
Use NO. LCIF Flowthrough Capital CO TAX CO TAX CO TAX CO TAX
APPROPRIATIONS:Audio‐Visual Materials 6200Buildings and Additions 6300 103,784.39 571,762.36 2,490.00 388,567.64 356,996.57Furniture, Fixtures and Equipment 6410‐20 124,718.38 4,580.65Computer Equipment 6430‐40 272,431.39Vehicle Purchase 6510 360,227.53 511,419.75Land Purchase 6600 1,600.00Site Improvements 6700 2,383.39 379,393.20 254,849.40 9,667.14Remodeling and Renovations 6800 850,252.47 3,543,223.94 220,157.44 591,008.00 149,164.90 62,244.99 11,975.64 1,038,633.48Computer Software 6900 674,237.31Fees 7300 Total Function 7400 Appropriations 956,420.25 5,567,366.58 0.00 220,157.44 591,008.00 149,164.90 324,165.04 760,770.81 1,916,716.94
OTHER USES:To General Fund 9100 2,384,896.00To Debt Service Fund 9200 2,165,165.00 Total Other Financing Uses 0.00 0.00 2,384,896.00 0.00 0.00 0.00 0.00 0.00 2,165,165.00
TOTAL APPROPRIATIONS AND OTHER USES 956,420.25 5,567,366.58 2,384,896.00 220,157.44 591,008.00 149,164.90 324,165.04 760,770.81 4,081,881.94
ESTIMATED REVENUES LESS APPROPRIATIONS (956,420.25) (37,009.58) 0.00 (220,157.44) 0.00 (149,164.90) (324,165.04) (760,770.81) (4,081,881.94)
FUND BALANCE AT END OF YEAR:Restricted for Capital Projects 2726 0.00 1,771,513.23 0.00 0.00 1,088.20 0.00 12,634.44 9,527.36 10,049.08 Total Ending Fund Balance 0.00 1,771,513.23 0.00 0.00 1,088.20 0.00 12,634.44 9,527.36 10,049.08
TOTAL APPROPRIATIONS AND ENDING FD BAL 956,420.25 7,338,879.81 2,384,896.00 220,157.44 592,096.20 149,164.90 336,799.48 770,298.17 4,091,931.02
3-11

ACCT.Use NO.
APPROPRIATIONS:Audio‐Visual Materials 6200Buildings and Additions 6300Furniture, Fixtures and Equipment 6410‐20Computer Equipment 6430‐40Vehicle Purchase 6510Land Purchase 6600Site Improvements 6700Remodeling and Renovations 6800Computer Software 6900Fees 7300 Total Function 7400 Appropriations
OTHER USES:To General Fund 9100To Debt Service Fund 9200 Total Other Financing Uses
TOTAL APPROPRIATIONS AND OTHER USES
ESTIMATED REVENUES LESS APPROPRIATIONS
FUND BALANCE AT END OF YEAR:Restricted for Capital Projects 2726 Total Ending Fund Balance
TOTAL APPROPRIATIONS AND ENDING FD BAL
37N 37O 380 39K 39L 39N 39O2015 2016 Flora Ridge 2013 2014 2015 2016
CO TAX CO TAX EFBD Impact Fees Impact Fees Impact Fees Impact Fees Total
0.002,541,598.04 461,721.61 188,943.47 3,703,878.79 7,000,000.00 15,319,742.87
76,255.18 226,843.85 432,398.06285,634.61 28,774.86 136,483.67 723,324.53
984,178.92 1,185,000.00 461,515.00 3,502,341.201,600.00
211,536.76 5,000.00 862,829.892,029,579.01 7,102,242.00 103,043.98 30,895.00 1,977,544.80 3,900,000.00 21,609,965.65
240.99 674,478.300.00
5,766,892.73 8,572,876.61 0.00 669,795.63 219,838.47 6,049,992.10 11,361,515.00 43,126,680.50
11,134,844.50 13,519,740.5010,378,411.00 4,173,544.50 4,173,544.50 20,890,665.00
0.00 21,513,255.50 0.00 0.00 0.00 4,173,544.50 4,173,544.50 34,410,405.50
5,766,892.73 30,086,132.11 0.00 669,795.63 219,838.47 10,223,536.60 15,535,059.50 77,537,086.00
(5,766,892.73) 350,913.89 296,881.00 (669,795.63) (219,838.47) (10,223,536.60) 10,570,907.50 (12,190,931.00)
0.00 350,913.89 593,762.00 3,538,526.62 13,220,044.47 5,059,882.31 10,570,907.50 35,138,849.100.00 350,913.89 593,762.00 3,538,526.62 13,220,044.47 5,059,882.31 10,570,907.50 35,138,849.10
5,766,892.73 30,437,046.00 593,762.00 4,208,322.25 13,439,882.94 15,283,418.91 26,105,967.00 112,675,935.10
3-12
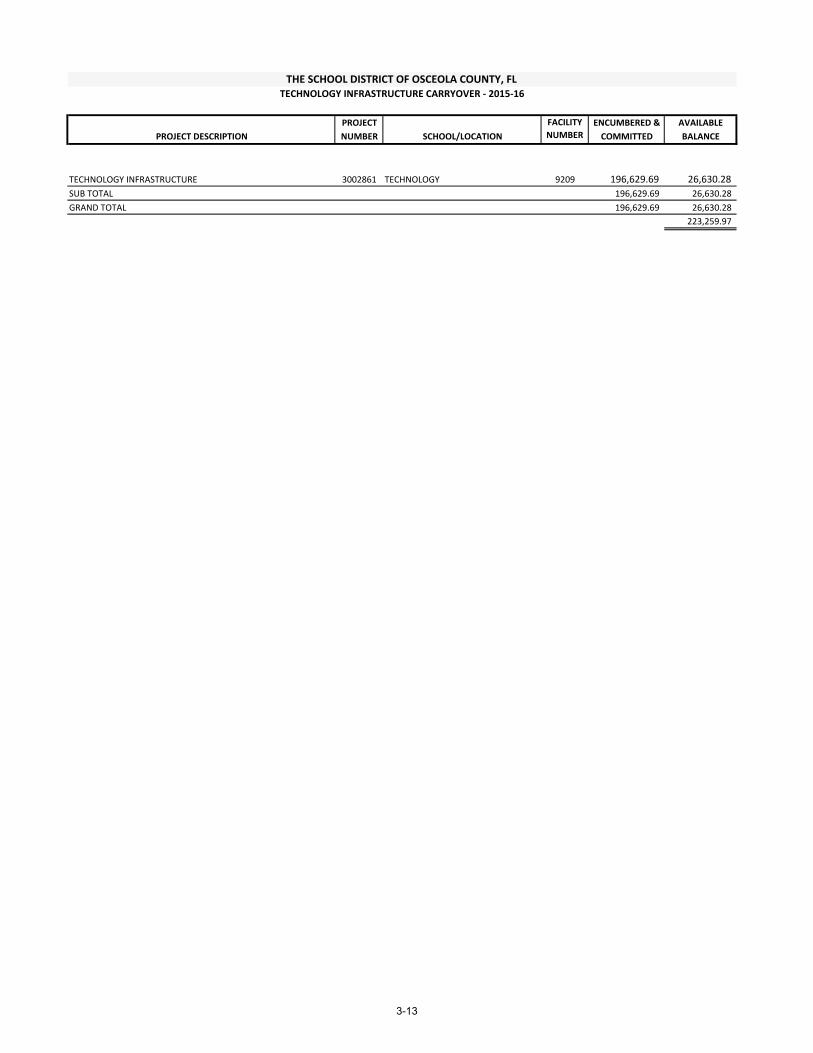
PROJECT FACILITY ENCUMBERED & AVAILABLE
PROJECT DESCRIPTION NUMBER SCHOOL/LOCATION NUMBER COMMITTED BALANCE
TECHNOLOGY INFRASTRUCTURE 3002861 TECHNOLOGY 9209 196,629.69 26,630.28 SUB TOTAL 196,629.69 26,630.28 GRAND TOTAL 196,629.69 26,630.28
223,259.97
THE SCHOOL DISTRICT OF OSCEOLA COUNTY, FLTECHNOLOGY INFRASTRUCTURE CARRYOVER ‐ 2015‐16
3-13

PROJECT PROJECT
NAME PROJECT DESCRIPTION COST
ERATE eRate captial funding to cover District costs at the 9 elementary schools that we applied for. 500,000.00
UPS REPLACEMENTS UPS replacements (for Data Center, MDFs, and IDFs backup power) ‐ District and School Level 150,000.00
DATA STORAGE Data Storage upgrade for Compellent System 50,000.00
SERVERS Server Upgrades ‐ District and School Level 250,000.00
DATA CENTER EQUIPMENT UPGRADES
Chassis Switch replacement for Building 1000 2nd Floor IDF 50,000.00
SECURITY Security Solution 100,000.00
SCHOOL UPGRADES Core Switch upgrades for SCMS, CLK8, HRMS 150,000.00
END POINT SOFTWARE Telephony replacement routers for end of life equipment 50,000.00
INTERCOM
Intercom Group Capital Needs ‐ to replace copper system at HZMS with a fiber system. (Keeps getting damaged do to lightning) Current system can be reused at another school to replace end of life/support unit. 50,000.00
TOTAL 1,350,000.00
THE SCHOOL DISTRICT OF OSCEOLA COUNTY, FLTECHNOLOGY INFRASTRUCTURE NEW ITEMS ‐ 2015‐16
3-14

PROJECT FACILITY BEGINNING ENCUMBERED AVAILABLE
NUMBER NUMBER BUDGET & COMMITTED BALANCE
MAINT/RENOV 3200001 DISTRICT 9505 1,497,029.55 ‐ ‐ 1,497,029.55 MAINTENANCE 9403 78,614.93 30,136.80 9,674.59 38,803.54
SUB TOTAL 1,575,644.48 30,136.80 9,674.59 1,535,833.09
SAFETY WALLS 3201031 PATHS AT TECO 0862 25,000.00 266.57 22,536.00 2,197.43 SUB TOTAL 25,000.00 266.57 22,536.00 2,197.43
DOORS/DOOR HARDWARE 3201041 BOGGY CREEK ELEMENTARY 0401 25,000.00 ‐ ‐ 25,000.00 SUB TOTAL 25,000.00 ‐ ‐ 25,000.00
BIKE RACK 3201121 FLORA RIDGE ELEMENTARY 0931 25,000.00 ‐ ‐ 25,000.00 SUB TOTAL 25,000.00 ‐ ‐ 25,000.00
SIDEWALKS 3201131 THE OSC CNTY FOR THE ARTS 0921 25,000.00 ‐ ‐ 25,000.00 SUB TOTAL 25,000.00 ‐ ‐ 25,000.00
SITE DRAINAGE 3202121 PLEASANT HILL ELEMENTARY 0811 15,000.00 ‐ ‐ 15,000.00 TRANSPORTATION 9402 30,000.00 ‐ 22,131.36 7,868.64 VENTURA ELEMENTARY 0321 35,400.00 5,500.00 29,900.00 ‐
SUB TOTAL 80,400.00 5,500.00 52,031.36 22,868.64
REPAIR/REPAINT 3202131 DISCOVERY 6‐8 0041 350,000.00 ‐ ‐ 350,000.00 SUB TOTAL 350,000.00 ‐ ‐ 350,000.00
DRIVEWAY/PARKING LOT RESURFACE 3202151 ADMINISTRATIVE CENTER 9408 75,000.00 ‐ ‐ 75,000.00 CELEBRATION K‐8 0711 80,000.00 78,048.76 1,066.24 885.00 GATEWAY HIGH SCHOOL 0601 50,000.00 9,651.75 28,018.25 12,330.00 REEDY CREEK ELEMENTARY 0301 75,000.00 5,670.00 2,550.00 66,780.00
SUB TOTAL 280,000.00 93,370.51 31,634.49 154,995.00
ROOFING 3202281 ADULT LEARNING CENTER OSCEOLA 9002 324,728.00 18,120.00 8,785.00 297,823.00 BOGGY CREEK ELEMENTARY 0401 3,260.86 370.40 2,890.46 ‐ CELEBRATION HIGH SCHOOL 0902 11,000.00 ‐ 3,260.86 7,739.14 CELEBRATION K‐8 0711 3,260.86 ‐ 3,260.86 ‐ CENTRAL ELEMENTARY 0061 3,260.86 ‐ 3,260.86 ‐ CYPRESS ELEMENTARY 0851 3,260.87 ‐ 3,260.87 ‐ DISCOVERY 6‐8 0041 3,260.86 81.75 3,179.11 ‐ EAST LAKE ELEMENTARY SCHOOL 0961 3,260.87 ‐ 3,260.87 ‐ FLORA RIDGE ELEMENTARY 0931 3,260.87 18.75 3,242.12 ‐ GATEWAY HIGH SCHOOL 0601 26,000.00 ‐ 26,000.00 ‐ HARMONY HIGH SCHOOL 0922 22,000.00 ‐ 22,000.00 ‐ HORIZON MIDDLE SCHOOL 0341 88,260.87 49,226.63 3,186.49 35,847.75 KISSIMMEE ELEMENTARY SCHOOL 0042 3,260.87 136.25 3,124.62 ‐ KISSIMMEE MIDDLE SCHOOL 0251 17,000.00 ‐ 17,000.00 ‐ KOA ELEMENTARY 0300 3,260.87 ‐ 3,260.87 ‐ LAKEVIEW ELEMENTARY 0801 65,000.00 4,385.00 15,150.00 45,465.00 LIBERTY HIGH SCHOOL 0842 17,000.00 ‐ ‐ 17,000.00 MICHIGAN AVENUE ELEMENTARY 0271 3,260.87 ‐ 3,260.87 ‐ NARCOOSSEE ELEMENTARY SCHOOL 0043 23,000.00 142.04 22,857.96 ‐ NARCOOSSEE MIDDLE SCHOOL 0040 3,260.87 78.91 3,181.96 ‐ NEPTUNE ELEMENTARY 0933 3,260.87 ‐ 3,260.87 ‐ NEPTUNE MIDDLE SCHOOL 0311 18,260.87 8,906.00 3,260.87 6,094.00 OSCEOLA HIGH SCHOOL 0081 3,260.87 ‐ 3,260.87 ‐ PARTIN SETTLEMENT ELEMENTARY 0904 143,260.87 427.16 127,207.71 15,626.00 POINCIANA ELEMENTARY SCHOOL 0901 22,000.00 ‐ 22,000.00 ‐ POINCIANA HIGH SCHOOL 0841 3,260.87 ‐ 3,260.87 ‐ REEDY CREEK ELEMENTARY 0301 3,260.87 ‐ 3,260.87 ‐ ST. CLOUD ELEMENTARY 0111 3,260.87 159.97 3,100.90 ‐ ST. CLOUD HIGH SCHOOL 0201 3,260.87 ‐ 3,260.87 ‐ ST. CLOUD MIDDLE SCHOOL 0272 72,637.24 57,858.99 2,640.00 12,138.25 SUNRISE ELEMENTARY 0958 3,260.87 154.39 3,106.48 ‐ TECO 0861 20,000.00 ‐ 20,000.00 ‐
THE SCHOOL DISTRICT OF OSCEOLA COUNTY, FLCYCLICAL CAPITAL CARRYOVER ‐ 2015‐16
PROJECT DESCRIPTION SCHOOL/LOCATION EXPEND
3-15
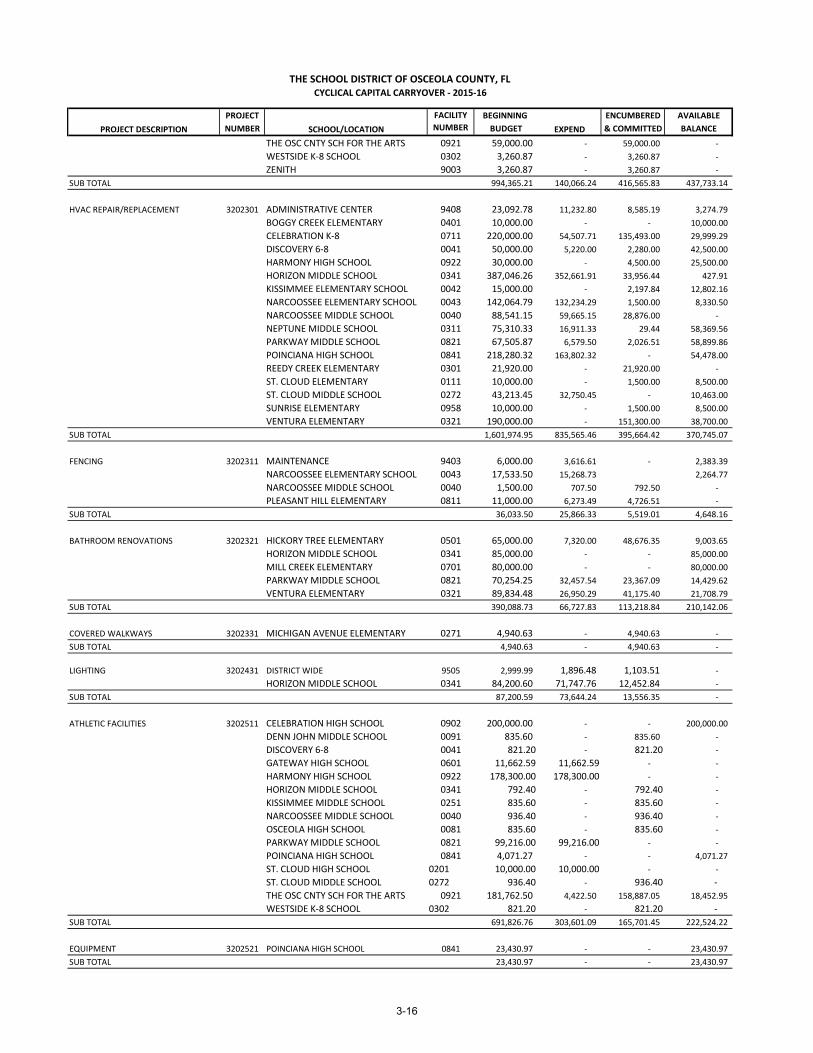
PROJECT FACILITY BEGINNING ENCUMBERED AVAILABLE
NUMBER NUMBER BUDGET & COMMITTED BALANCE
THE SCHOOL DISTRICT OF OSCEOLA COUNTY, FLCYCLICAL CAPITAL CARRYOVER ‐ 2015‐16
PROJECT DESCRIPTION SCHOOL/LOCATION EXPEND
THE OSC CNTY SCH FOR THE ARTS 0921 59,000.00 ‐ 59,000.00 ‐ WESTSIDE K‐8 SCHOOL 0302 3,260.87 ‐ 3,260.87 ‐ ZENITH 9003 3,260.87 ‐ 3,260.87 ‐
SUB TOTAL 994,365.21 140,066.24 416,565.83 437,733.14
HVAC REPAIR/REPLACEMENT 3202301 ADMINISTRATIVE CENTER 9408 23,092.78 11,232.80 8,585.19 3,274.79 BOGGY CREEK ELEMENTARY 0401 10,000.00 ‐ ‐ 10,000.00 CELEBRATION K‐8 0711 220,000.00 54,507.71 135,493.00 29,999.29 DISCOVERY 6‐8 0041 50,000.00 5,220.00 2,280.00 42,500.00 HARMONY HIGH SCHOOL 0922 30,000.00 ‐ 4,500.00 25,500.00 HORIZON MIDDLE SCHOOL 0341 387,046.26 352,661.91 33,956.44 427.91 KISSIMMEE ELEMENTARY SCHOOL 0042 15,000.00 ‐ 2,197.84 12,802.16 NARCOOSSEE ELEMENTARY SCHOOL 0043 142,064.79 132,234.29 1,500.00 8,330.50 NARCOOSSEE MIDDLE SCHOOL 0040 88,541.15 59,665.15 28,876.00 ‐ NEPTUNE MIDDLE SCHOOL 0311 75,310.33 16,911.33 29.44 58,369.56 PARKWAY MIDDLE SCHOOL 0821 67,505.87 6,579.50 2,026.51 58,899.86 POINCIANA HIGH SCHOOL 0841 218,280.32 163,802.32 ‐ 54,478.00 REEDY CREEK ELEMENTARY 0301 21,920.00 ‐ 21,920.00 ‐ ST. CLOUD ELEMENTARY 0111 10,000.00 ‐ 1,500.00 8,500.00 ST. CLOUD MIDDLE SCHOOL 0272 43,213.45 32,750.45 ‐ 10,463.00 SUNRISE ELEMENTARY 0958 10,000.00 ‐ 1,500.00 8,500.00 VENTURA ELEMENTARY 0321 190,000.00 ‐ 151,300.00 38,700.00
SUB TOTAL 1,601,974.95 835,565.46 395,664.42 370,745.07
FENCING 3202311 MAINTENANCE 9403 6,000.00 3,616.61 ‐ 2,383.39 NARCOOSSEE ELEMENTARY SCHOOL 0043 17,533.50 15,268.73 2,264.77 NARCOOSSEE MIDDLE SCHOOL 0040 1,500.00 707.50 792.50 ‐ PLEASANT HILL ELEMENTARY 0811 11,000.00 6,273.49 4,726.51 ‐
SUB TOTAL 36,033.50 25,866.33 5,519.01 4,648.16
BATHROOM RENOVATIONS 3202321 HICKORY TREE ELEMENTARY 0501 65,000.00 7,320.00 48,676.35 9,003.65 HORIZON MIDDLE SCHOOL 0341 85,000.00 ‐ ‐ 85,000.00 MILL CREEK ELEMENTARY 0701 80,000.00 ‐ ‐ 80,000.00 PARKWAY MIDDLE SCHOOL 0821 70,254.25 32,457.54 23,367.09 14,429.62 VENTURA ELEMENTARY 0321 89,834.48 26,950.29 41,175.40 21,708.79
SUB TOTAL 390,088.73 66,727.83 113,218.84 210,142.06
COVERED WALKWAYS 3202331 MICHIGAN AVENUE ELEMENTARY 0271 4,940.63 ‐ 4,940.63 ‐ SUB TOTAL 4,940.63 ‐ 4,940.63 ‐
LIGHTING 3202431 DISTRICT WIDE 9505 2,999.99 1,896.48 1,103.51 ‐ HORIZON MIDDLE SCHOOL 0341 84,200.60 71,747.76 12,452.84 ‐
SUB TOTAL 87,200.59 73,644.24 13,556.35 ‐
ATHLETIC FACILITIES 3202511 CELEBRATION HIGH SCHOOL 0902 200,000.00 ‐ ‐ 200,000.00 DENN JOHN MIDDLE SCHOOL 0091 835.60 ‐ 835.60 ‐ DISCOVERY 6‐8 0041 821.20 ‐ 821.20 ‐ GATEWAY HIGH SCHOOL 0601 11,662.59 11,662.59 ‐ ‐ HARMONY HIGH SCHOOL 0922 178,300.00 178,300.00 ‐ ‐ HORIZON MIDDLE SCHOOL 0341 792.40 ‐ 792.40 ‐ KISSIMMEE MIDDLE SCHOOL 0251 835.60 ‐ 835.60 ‐ NARCOOSSEE MIDDLE SCHOOL 0040 936.40 ‐ 936.40 ‐ OSCEOLA HIGH SCHOOL 0081 835.60 ‐ 835.60 ‐ PARKWAY MIDDLE SCHOOL 0821 99,216.00 99,216.00 ‐ ‐ POINCIANA HIGH SCHOOL 0841 4,071.27 ‐ ‐ 4,071.27 ST. CLOUD HIGH SCHOOL 0201 10,000.00 10,000.00 ‐ ‐ ST. CLOUD MIDDLE SCHOOL 0272 936.40 ‐ 936.40 ‐ THE OSC CNTY SCH FOR THE ARTS 0921 181,762.50 4,422.50 158,887.05 18,452.95 WESTSIDE K‐8 SCHOOL 0302 821.20 ‐ 821.20 ‐
SUB TOTAL 691,826.76 303,601.09 165,701.45 222,524.22
EQUIPMENT 3202521 POINCIANA HIGH SCHOOL 0841 23,430.97 ‐ ‐ 23,430.97 SUB TOTAL 23,430.97 ‐ ‐ 23,430.97
3-16
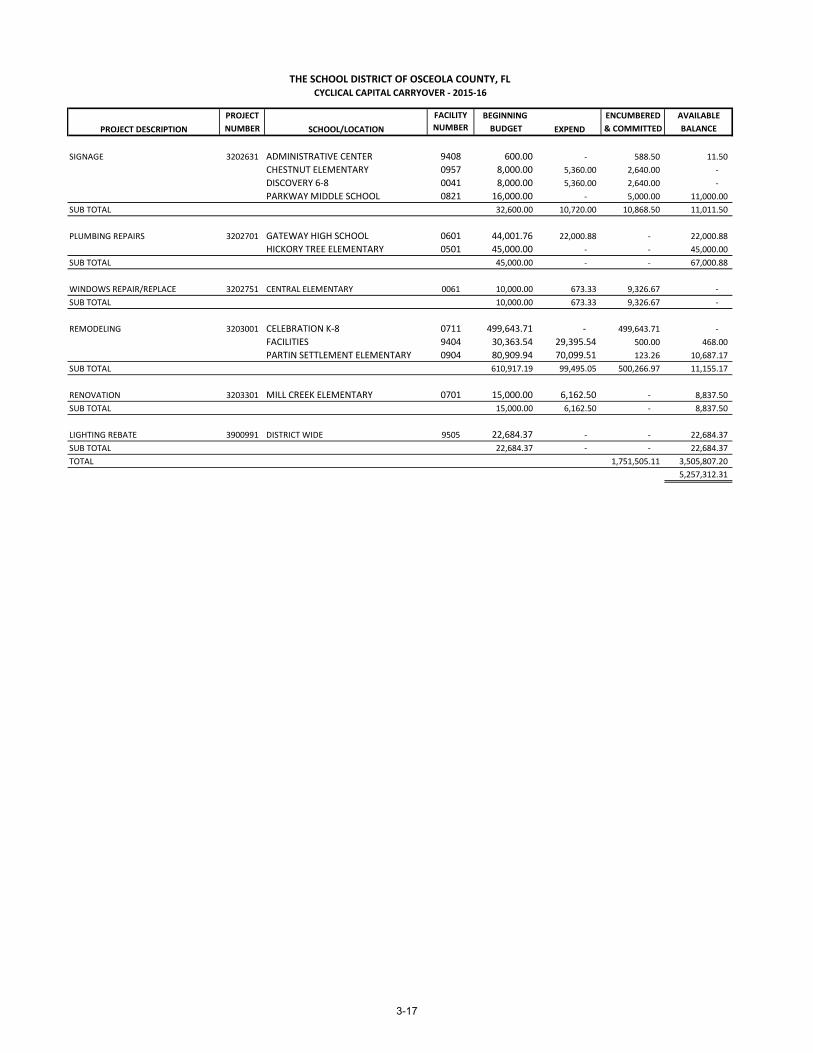
PROJECT FACILITY BEGINNING ENCUMBERED AVAILABLE
NUMBER NUMBER BUDGET & COMMITTED BALANCE
THE SCHOOL DISTRICT OF OSCEOLA COUNTY, FLCYCLICAL CAPITAL CARRYOVER ‐ 2015‐16
PROJECT DESCRIPTION SCHOOL/LOCATION EXPEND
SIGNAGE 3202631 ADMINISTRATIVE CENTER 9408 600.00 ‐ 588.50 11.50 CHESTNUT ELEMENTARY 0957 8,000.00 5,360.00 2,640.00 ‐ DISCOVERY 6‐8 0041 8,000.00 5,360.00 2,640.00 ‐ PARKWAY MIDDLE SCHOOL 0821 16,000.00 ‐ 5,000.00 11,000.00
SUB TOTAL 32,600.00 10,720.00 10,868.50 11,011.50
PLUMBING REPAIRS 3202701 GATEWAY HIGH SCHOOL 0601 44,001.76 22,000.88 ‐ 22,000.88 HICKORY TREE ELEMENTARY 0501 45,000.00 ‐ ‐ 45,000.00
SUB TOTAL 45,000.00 ‐ ‐ 67,000.88
WINDOWS REPAIR/REPLACE 3202751 CENTRAL ELEMENTARY 0061 10,000.00 673.33 9,326.67 ‐ SUB TOTAL 10,000.00 673.33 9,326.67 ‐
REMODELING 3203001 CELEBRATION K‐8 0711 499,643.71 ‐ 499,643.71 ‐ FACILITIES 9404 30,363.54 29,395.54 500.00 468.00 PARTIN SETTLEMENT ELEMENTARY 0904 80,909.94 70,099.51 123.26 10,687.17
SUB TOTAL 610,917.19 99,495.05 500,266.97 11,155.17
RENOVATION 3203301 MILL CREEK ELEMENTARY 0701 15,000.00 6,162.50 ‐ 8,837.50 SUB TOTAL 15,000.00 6,162.50 ‐ 8,837.50
LIGHTING REBATE 3900991 DISTRICT WIDE 9505 22,684.37 ‐ ‐ 22,684.37 SUB TOTAL 22,684.37 ‐ ‐ 22,684.37 TOTAL 1,751,505.11 3,505,807.20
5,257,312.31
3-17

The School District of Osceola County, FLFacilities Division and Maintenance Department
Capital Projects for FY 2015‐2016
Facility Project Details Budget Request
Administration Building 2000 Door and Door Frames Replacement 15,000Remove and replace the doors and door frames on both front entranceways that lead into building 2000.
Celebration High Carpet Install‐ Bldg. 1 40,000Replace all carpet in the administration building, Bldg. 1
Celebration High Paint Hallways‐ Bldg. 1 40,000Paint the hallways in the administration building, Bldg. 1
Celebration High Paint Exterior 200,000
Paint the entire exterior of the school campus.
Celebration K‐8 HVAC Chiller Replacement‐ Two 23XL Units 180,000
Additional funding request of $180,000. These additional funds will allow for the replacement of the 200 ton chiller, which needs to be replaced with a 325 ton chiller. This additional chiller capacity will allow for the proper block load cooling for the buildings.
Celebration K‐8 PVC Chilled Water Lines 450,000PVC under ground chilled water lines are leaking and must be replaced. Design was funded FY 2014‐2015.
Celebration K‐8 School Grounds 100,000Upgrade grass walkway to solid surface or rework the grounds to maintain healthy grounds. Need formal architect drawings noting drainage, surface material, other items (existing playgrounds, underground utilities, etc.).
Central Avenue Elementary HVAC Controls Replacement 30,000
Replace HVAC control system.
Denn John Middle Door Buzzer & Actuator 30,000
Install a door in the main lobby area that would require the front desk personnel to "buzz" people into the building corridors.
East Lake Elementary Bike Rack Install 5,000
Installation of an additional bike rack on the Spring Lake side of the school.
Harmony High Site Drainage Modifications‐ Pole Barn 50,000
3-18

Facility Project Details Budget Request
Resolve site drainage issues near the pole barn. Design funded FY 2014‐2015
Hickory Tree Elementary Roof Cleaning 15,000
Soft Wash the roof of each building to remove existing algae and fungus. Soft Wash process shall incorporate an applied algaecide in a light spray to clean existing condition.
Lakeview Elementary Arrival and drop‐off access upgrade 125,000
Extend sidewalks in car loop area to provide students access to the cafeteria during arrival (drop‐off) and to vehicle during dismissal (pick‐up). Also install overhanging canopy to shelter stakeholders from weather elements, during the same process.
Lakeview Elementary Gutter System Install & Sidewalk Repair 200,000
Replace sections of sidewalks. Install gutter system on every building to eliminate water erosion of sidewalks. Also, gutters and downspouts will need to be incorporated into an underground drainage system. This will require engineered drawings. Design funded FY 2014‐2015.
Lakeview Elementary Roof Cleaning 15,000
Soft Wash the roof of each building to remove existing algae and fungus. Soft Wash process shall incorporate an applied algaecide in a light spray to clean existing condition.
Mill Creek Elementary Roof Cleaning 15,000
Soft Wash the roof of each building to remove existing algae and fungus. Soft Wash process shall incorporate an applied algaecide in a light spray to clean existing condition.
Narcoossee Middle Concrete Repair Second Floor Walkway 300,000
Repair concrete on the second floor walkway as indicated by the project manager.
Narcoossee Middle Traffic Flow Improvement 35,000
Improve the traffic flow to include fencing and directional signage.
Neptune Middle Roof Cleaning 20,000
Soft Wash the roof of each building to remove existing algae and fungus. Soft Wash process shall incorporate an applied algaecide in a light spray to clean existing condition.
Parkway Middle Carpet Replacement 8,000
3-19
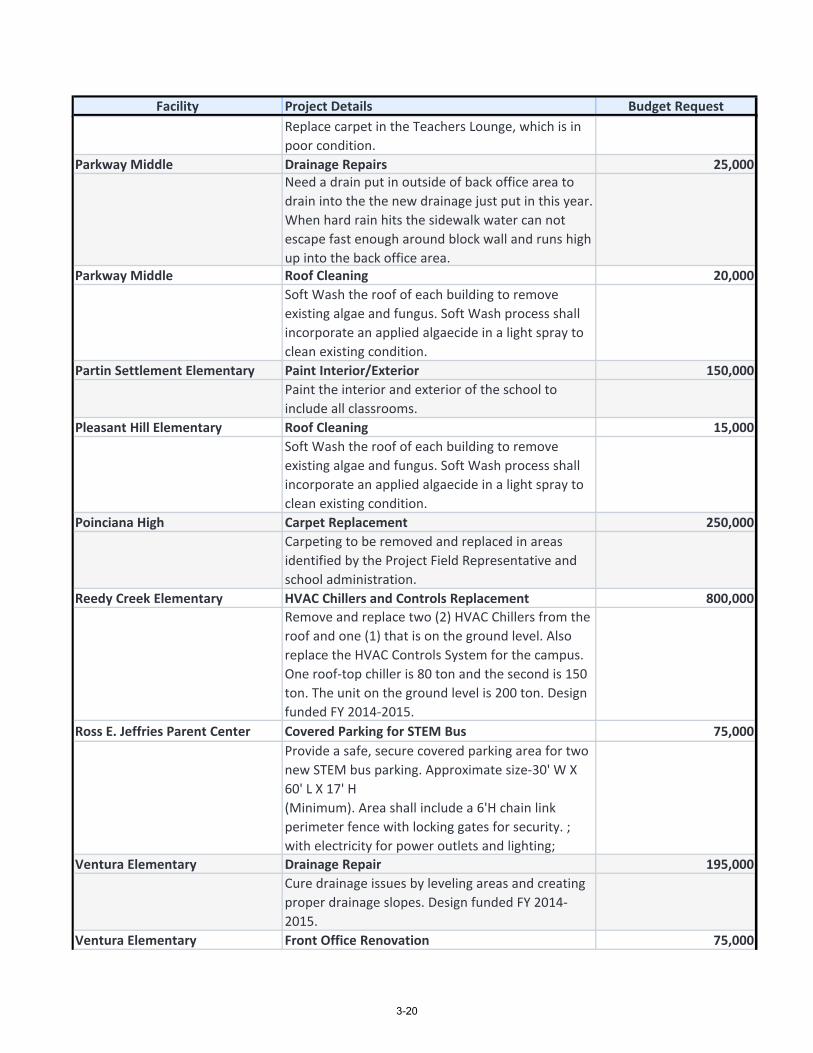
Facility Project Details Budget Request
Replace carpet in the Teachers Lounge, which is in poor condition.
Parkway Middle Drainage Repairs 25,000Need a drain put in outside of back office area to drain into the the new drainage just put in this year. When hard rain hits the sidewalk water can not escape fast enough around block wall and runs high up into the back office area.
Parkway Middle Roof Cleaning 20,000
Soft Wash the roof of each building to remove existing algae and fungus. Soft Wash process shall incorporate an applied algaecide in a light spray to clean existing condition.
Partin Settlement Elementary Paint Interior/Exterior 150,000
Paint the interior and exterior of the school to include all classrooms.
Pleasant Hill Elementary Roof Cleaning 15,000
Soft Wash the roof of each building to remove existing algae and fungus. Soft Wash process shall incorporate an applied algaecide in a light spray to clean existing condition.
Poinciana High Carpet Replacement 250,000
Carpeting to be removed and replaced in areas identified by the Project Field Representative and school administration.
Reedy Creek Elementary HVAC Chillers and Controls Replacement 800,000
Remove and replace two (2) HVAC Chillers from the roof and one (1) that is on the ground level. Also replace the HVAC Controls System for the campus. One roof‐top chiller is 80 ton and the second is 150 ton. The unit on the ground level is 200 ton. Design funded FY 2014‐2015.
Ross E. Jeffries Parent Center Covered Parking for STEM Bus 75,000
Provide a safe, secure covered parking area for two new STEM bus parking. Approximate size‐30' W X 60' L X 17' H (Minimum). Area shall include a 6'H chain link perimeter fence with locking gates for security. ; with electricity for power outlets and lighting;
Ventura Elementary Drainage Repair 195,000
Cure drainage issues by leveling areas and creating proper drainage slopes. Design funded FY 2014‐2015.
Ventura Elementary Front Office Renovation 75,000
3-20

Facility Project Details Budget Request
Renovate the front office area to better accommodate staff and manage visitors.
Ventura Elementary Roof Cleaning 15,000
Soft Wash the roof of each building to remove existing algae and fungus. Soft Wash process shall incorporate an applied algaecide in a light spray to clean existing condition.
Total: 3,493,000
Contingency 507,000
27 Projects Total Budget Request: 4,000,000
3-21

FUND 4XX
SPECIAL REVENUE FUND

SPECIAL REVENUE FUND BUDGET
The Special Revenue Fund is comprised of three major sections: Food Service,Special Revenue Other, and American Recovery and Reinvestment Act (ARRA)funds.
The Food Service Fund reflects revenues and expenditures of the District's foodservice program. Federal reimbursements and local collections are the primaryrevenue sources which support this program. Some State support is alsoprovided. The District does not subsidize the food service program from anyother funding sources.
The Special Revenue Other Fund accounts for federal entitlements and competitive grants.
Special Revenue ARRA Fund contains targeted Federal Stimulus funds including Title I School Improvement and Race to the Top.
FUND4XX
4-2

FEDERAL:Other Federal Direct 190 68,059.39 0.00 68,059.39Miscellaneous Federal Direct 199 1,200,000.00 1,100,000.00 100,000.00Vocational Education Act 201 953,516.27 664,477.73 289,038.54Race to the Top 214 398,683.44 957,170.44 (558,487.00)Teacher and Principal Training 225 1,977,224.24 1,304,429.00 672,795.24Math and Science Partnerships 226 1,221,487.19 0.00 1,221,487.19Individuals with Disabilities Education Act, PL94‐142 230 12,713,956.96 12,283,399.33 430,557.63Title I Targeted Assistance 240 24,591,082.93 16,273,924.84 8,317,158.09Adult General Education 251 746,964.69 662,037.89 84,926.80National School Lunch Act Lunch 261 20,000,000.00 18,000,000.00 2,000,000.00National School Lunch Act Breakfast 262 5,700,000.00 5,500,000.00 200,000.00National School Lunch Act Snack 263 310,000.00 400,000.00 (90,000.00)U.S.D.A Commodities 265 1,500,000.00 1,550,000.00 (50,000.00)Summer Feeding 267 800,000.00 1,000,000.00 (200,000.00)
Other Federal Through State 290 3,505,245.70 2,227,289.41 1,277,956.29 Emergency Immigrant 293 1,401,333.69 1,439,284.65 (37,950.96)
Total Federal 77,087,554.50 63,362,013.29 13,725,541.21
STATE:School Breakfast Supplement 337 193,000.00 120,000.00 73,000.00Food Service Supplement 338 231,000.00 175,000.00 56,000.00Miscellaneous State Sources 399 0.00 8,400.00 (8,400.00)
Total State 424,000.00 303,400.00 120,600.00
LOCAL:Interest, Including Profit on Investments 431 16,000.00 15,000.00 1,000.00Food Service Sales 450 2,728,000.00 6,035,000.00 (3,307,000.00)Pre‐K Early Intervention 472 0.00 479,520.00 (479,520.00)School‐Aged Child Care Fees 473 0.00 2,500,000.00 (2,500,000.00)Miscellaneous Local Sources 495 30,000.00 26,000.00 4,000.00
Total Local 2,774,000.00 9,055,520.00 (6,281,520.00)
OTHER SOURCES:Transfers In 610 0.00 0.00 0.00
Total Other Sources 0.00 0.00 0.00 TOTAL ESTIMATED REVENUE & OTHER SOURCES 80,285,554.50 72,720,933.29 7,564,621.21
FUND BALANCE AT BEGINNING OF YEAR:Nonspendable‐Inventory 2711 724,169.68 1,148,872.07 (424,702.39)Restricted for Grants and Programs 2729 8,326,718.25 9,274,572.65 (947,854.40)Assigned for Other Programs 2749 0.00 1,393,759.51 (1,393,759.51)Unassigned 2750 0.00 0.00 0.00
Total Beginning Fund Balance 9,050,887.93 11,817,204.23 (2,766,316.30)
TOTAL EST REVENUE AND BEGINNING FD BAL 89,336,442.43 84,538,137.52 4,798,304.91
THE SCHOOL DISTRICT OF OSCEOLA COUNTY, FLSPECIAL REVENUE FUNDS (COMBINED) ‐ ESTIMATED REVENUES ‐ 2015‐16
Source
ACCT.
NO.
2015‐16
Tentative
2014‐15
Budget Difference
4-3
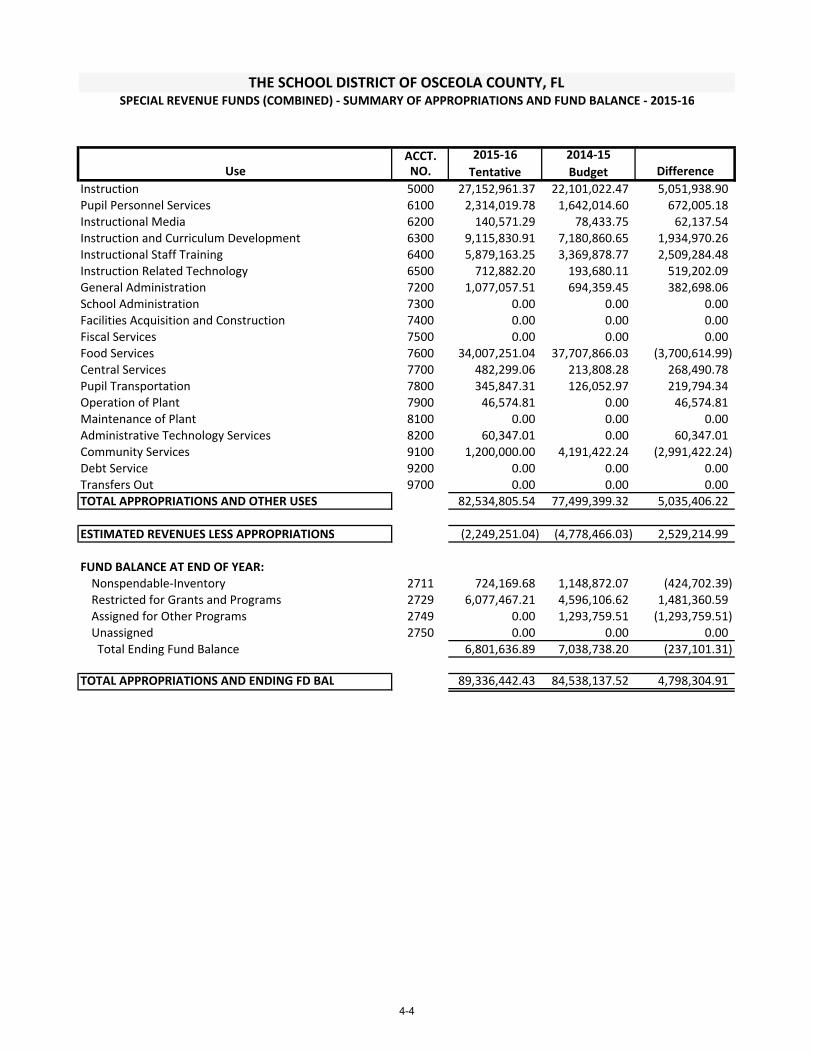
ACCT.Use NO. Difference
Instruction 5000 27,152,961.37 22,101,022.47 5,051,938.90Pupil Personnel Services 6100 2,314,019.78 1,642,014.60 672,005.18Instructional Media 6200 140,571.29 78,433.75 62,137.54Instruction and Curriculum Development 6300 9,115,830.91 7,180,860.65 1,934,970.26Instructional Staff Training 6400 5,879,163.25 3,369,878.77 2,509,284.48Instruction Related Technology 6500 712,882.20 193,680.11 519,202.09General Administration 7200 1,077,057.51 694,359.45 382,698.06School Administration 7300 0.00 0.00 0.00Facilities Acquisition and Construction 7400 0.00 0.00 0.00Fiscal Services 7500 0.00 0.00 0.00Food Services 7600 34,007,251.04 37,707,866.03 (3,700,614.99)Central Services 7700 482,299.06 213,808.28 268,490.78Pupil Transportation 7800 345,847.31 126,052.97 219,794.34Operation of Plant 7900 46,574.81 0.00 46,574.81Maintenance of Plant 8100 0.00 0.00 0.00Administrative Technology Services 8200 60,347.01 0.00 60,347.01Community Services 9100 1,200,000.00 4,191,422.24 (2,991,422.24)Debt Service 9200 0.00 0.00 0.00Transfers Out 9700 0.00 0.00 0.00TOTAL APPROPRIATIONS AND OTHER USES 82,534,805.54 77,499,399.32 5,035,406.22
ESTIMATED REVENUES LESS APPROPRIATIONS (2,249,251.04) (4,778,466.03) 2,529,214.99
FUND BALANCE AT END OF YEAR:Nonspendable‐Inventory 2711 724,169.68 1,148,872.07 (424,702.39)Restricted for Grants and Programs 2729 6,077,467.21 4,596,106.62 1,481,360.59Assigned for Other Programs 2749 0.00 1,293,759.51 (1,293,759.51)Unassigned 2750 0.00 0.00 0.00 Total Ending Fund Balance 6,801,636.89 7,038,738.20 (237,101.31)
TOTAL APPROPRIATIONS AND ENDING FD BAL 89,336,442.43 84,538,137.52 4,798,304.91
THE SCHOOL DISTRICT OF OSCEOLA COUNTY, FLSPECIAL REVENUE FUNDS (COMBINED) ‐ SUMMARY OF APPROPRIATIONS AND FUND BALANCE ‐ 2015‐16
2015‐16
Tentative
2014‐15
Budget
4-4

FEDERAL:Other Federal Direct 190 0.00 0.00 0.00Miscellaneous Federal Direct 199 0.00 0.00 0.00Vocational Education Act 201 0.00 0.00 0.00Race to the Top 214 0.00 0.00 0.00Safe and Drug Free Schools 227 0.00 0.00 0.00Individuals with Disabilities Education Act, PL94‐142 230 0.00 0.00 0.00Title I Targeted Assistance 240 0.00 0.00 0.00Adult General Education 251 0.00 0.00 0.00National School Lunch Act Lunch 261 20,000,000.00 18,000,000.00 2,000,000.00National School Lunch Act Breakfast 262 5,700,000.00 5,500,000.00 200,000.00National School Lunch Act Snack 263 310,000.00 400,000.00 (90,000.00)U.S.D.A Commodities 265 1,500,000.00 1,550,000.00 (50,000.00)Cash in Lieu of Commodities 266 0.00 0.00Summer Feeding 267 800,000.00 1,000,000.00 (200,000.00)
Other Federal Through State 290 250,000.00 200,000.00 50,000.00 Emergency Immigrant 293 0.00 0.00 0.00
Total Federal 28,560,000.00 26,650,000.00 1,910,000.00
STATE:School Breakfast Supplement 337 193,000.00 120,000.00 73,000.00Food Service Supplement 338 231,000.00 175,000.00 56,000.00Miscellaneous State Sources 399 0.00 8,400.00 (8,400.00) Total State 424,000.00 303,400.00 120,600.00
LOCAL:Interest, Including Profit on Investments 431 16,000.00 15,000.00 1,000.00Food Service Sales 450 2,728,000.00 6,035,000.00 (3,307,000.00)Pre‐K Early Intervention 472 0.00 0.00 0.00School‐Aged Child Care Fees 473 0.00 0.00 0.00Miscellaneous Local Sources 495 30,000.00 26,000.00 4,000.00 Total Local 2,774,000.00 6,076,000.00 (3,302,000.00)
OTHER SOURCES:Transfers In 610 0.00 0.00 0.00 Total Other Sources 0.00 0.00 0.00
TOTAL ESTIMATED REVENUE & OTHER SOURCES 31,758,000.00 33,029,400.00 (1,271,400.00)
FUND BALANCE AT BEGINNING OF YEAR:Nonspendable‐Inventory 2711 724,169.68 1,148,872.07 (424,702.39)Restricted for Grants and Programs 2729 8,326,718.25 9,274,572.65 (947,854.40)Assigned for Other Programs 2749 0.00 0.00 0.00Unassigned 2750 0.00 0.00 0.00 Total Beginning Fund Balance 9,050,887.93 10,423,444.72 (1,372,556.79)
TOTAL EST REVENUE AND BEGINNING FD BAL 40,808,887.93 43,452,844.72 (2,643,956.79)
THE SCHOOL DISTRICT OF OSCEOLA COUNTY, FLSPECIAL REVENUE FUNDS (FOOD SERVICE) ‐ ESTIMATED REVENUES ‐ 2015‐16
Source
ACCT.
NO.
2015‐16
Tentative
2014‐15
Budget Difference
4-5

ACCT.Use NO. Difference
FOOD SERVICE (Function 7600)Salaries 100 9,160,203.30 9,957,229.90 (797,026.60)Salaries‐Overtime 102 415,900.00 336,000.00 79,900.00Retirement 210 694,030.64 767,772.49 (73,741.85)Social Security 220 732,755.58 795,727.96 (62,972.38)Group lnsurance 230 2,806,316.43 2,737,947.47 68,368.96Workers' Compensation 240 200,000.00 200,000.00 0.00Purchased Service 310 58,200.00 608,407.61 (550,207.61)Insurance & Bond Premiums 320 0.00 25.00 (25.00)Travel 330 32,970.00 38,950.00 (5,980.00)Administrative Travel 331 1,300.00 1,700.00 (400.00)Repairs and Maintenance 350 101,097.52 67,466.88 33,630.64Rentals 360 25,700.00 54,850.00 (29,150.00)Communications 370 6,517.66 15,300.00 (8,782.34)Postage 371 250.00 200.00 50.00Other Purchased Services 390 222,012.40 367,831.60 (145,819.20)Natural Gas 410 12,510.00 13,500.00 (990.00)Propane or Bottled Bas 420 68,127.00 86,400.00 (18,273.00)Electricity 430 10,000.00 12,000.00 (2,000.00)Gasoline 450 18,046.94 14,000.00 4,046.94Diesel Fuel 460 14,230.22 11,900.00 2,330.22Supplies 510 2,203,166.19 734,372.94 1,468,793.25Periodicals 530 0.00 0.00 0.00Grease and Oil/Other 540 0.00 10.00 (10.00)Repair Parts 550 6,200.00 9,000.00 (2,800.00)Tires and Tubes 560 0.00 10.00 (10.00)Food 570 14,032,612.70 13,325,000.00 707,612.70USDA Donated Foods 580 1,515,595.24 1,550,000.00 (34,404.76)Other Materials and Supplies 590 0.00 0.00 0.00Budget Reserves 593 611,724.05 134,381.19 477,342.86Pest Control 595 25,110.00 39,460.00 (14,350.00)AV Material 622 0.00 10.00 (10.00)Bldgs & Fixed Equipment 630 0.00 0.00 0.00Furniture, Fixtures & Equipment (prop. rec.) 641 510,000.00 724,671.32 (214,671.32)Furniture, Fixtures & Equipment (no prop. rec.) 642 160,607.05 374,803.95 (214,196.90)Capitalized Computer Equipment 643 45,000.00 30,370.00 14,630.00Non‐capitalized Computer Equipment 644 28,000.00 182,876.60 (154,876.60)Motor Vehicles Other Than Buses 652 64,000.00 250,000.00 (186,000.00)Improvements Other Than Buildings 670 0.00 0.00 0.00Remodeling & Renovations 680 10.00 70,000.00 (69,990.00)Remodeling Capitalized 681 21,768.12 3,978,936.58 (3,957,168.46)Non‐Capitalized Remodel & Renovate 682 0.00 25,315.54 (25,315.54)Capitalized Software 691 10.00 10.00 0.00Non‐capitalized Software 692 10.00 10.00 0.00Dues and Fees 730 26,270.00 21,419.00 4,851.00Other Personnel Services 750 170,000.00 165,000.00 5,000.00Misc Exp/lndirect Cost 790 7,000.00 5,000.00 2,000.00
Total Appropriations 34,007,251.04 37,707,866.03 (3,700,614.99)
OTHER USES:Transfers Out 9700 0.00 0.00 0.00
Total Other Financing Uses 0.00 0.00 0.00
TOTAL APPROPRIATIONS AND OTHER USES 34,007,251.04 37,707,866.03 (3,700,614.99)
ESTIMATED REVENUE LESS APPROPRIATIONS (2,249,251.04) (4,678,466.03) 2,429,214.99
FUND BALANCE AT END OF YEAR:Nonspendable‐Inventory 2711 724,169.68 1,148,872.07 (424,702.39)Restricted for Grants and Programs 2729 6,077,467.21 4,596,106.62 1,481,360.59Assigned for Other Programs 2749 0.00 0.00 0.00Unassigned 2750 0.00 0.00 0.00
Total Ending Fund Balance 6,801,636.89 5,744,978.69 1,056,658.20
TOTAL APPROPRIATIONS AND ENDING FD BAL 40,808,887.93 43,452,844.72 (2,643,956.79)
THE SCHOOL DISTRICT OF OSCEOLA COUNTY, FLSPECIAL REVENUE FUNDS (FOOD SERVICE) ‐ SUMMARY OF APPROPRIATIONS AND FUND BALANCE ‐ 2015‐16
2015‐16
Tentative
2014‐15
Budget
4-6

FEDERAL:Head Start 130 0.00 0.00 0.00Civil Rights Act Title IV 140 0.00 0.00 0.00Emergency School Assistance 161 0.00 0.00 0.00Community Action Program 180 0.00 0.00 0.00Other Federal Direct 190 68,059.39 0.00 68,059.39ROTC 191 0.00 0.00 0.00Miscellaneous Federal Direct 199 1,200,000.00 1,100,000.00 100,000.00Vocational Education Act 201 953,516.27 664,477.73 289,038.54State Fiscal Stabilization, K‐12 210 0.00 0.00 0.00State Fiscal Stabilization, Workforce Dev 211 0.00 0.00 0.00State Fiscal Stabilization, Voluntary Pre‐K 212 0.00 0.00 0.00Race to the Top 214 0.00 0.00 0.00Education Jobs Fund 215 0.00 0.00 0.00Workforce Investment Act 220 0.00 0.00 0.00Teacher and Principal Training 225 1,977,224.24 1,304,429.00 672,795.24Math and Science Partnerships 226 1,221,487.19 0.00 1,221,487.19Safe and Drug Free Schools 227 0.00 0.00 0.00Individuals with Disabilities Education Act, PL94‐142 230 12,713,956.96 12,283,399.33 430,557.63Title I Targeted Assistance 240 24,591,082.93 16,273,924.84 8,317,158.09Adult General Education 251 746,964.69 662,037.89 84,926.80Higher Education Act 252 0.00 0.00 0.00Vocational Rehabilitation 253 0.00 0.00 0.00National School Lunch Act Lunch 261 0.00 0.00 0.00National School Lunch Act Breakfast 262 0.00 0.00 0.00
National School Lunch Act Snack 263 0.00 0.00 0.00U.S.D.A Commodities 265 0.00 0.00 0.00Cash in Lieu of Commodities 266 0.00 0.00 0.00Summer Feeding 267 0.00 0.00 0.00
Nutrition Education and Training Program 268 0.00 0.00 0.00 Innovative Education Program Strategies 270 0.00 0.00 0.00 Other Federal Through State 290 3,255,245.70 2,027,289.41 1,227,956.29 Emergency Immigrant 293 1,401,333.69 1,439,284.65 (37,950.96)
Total Federal 48,128,871.06 35,754,842.85 12,374,028.21
STATE:Categorical State Sources 330 0.00 0.00 0.00School Breakfast Supplement 337 0.00 0.00 0.00Food Service Supplement 338 0.00 0.00 0.00Miscellaneous State Sources 399 0.00 0.00 0.00 Total State 0.00 0.00 0.00
LOCAL:Interest, Including Profit on Investments 431 0.00 0.00 0.00Food Service Sales 450 0.00 0.00 0.00Pre‐K Early Intervention 472 0.00 479,520.00 (479,520.00)School‐Aged Child Care Fees 473 0.00 2,500,000.00 (2,500,000.00)Miscellaneous Local Sources 495 0.00 0.00 0.00 Total Local 0.00 2,979,520.00 (2,979,520.00)
OTHER SOURCES:Transfers In 610 0.00 0.00 0.00 Total Other Sources 0.00 0.00 0.00
TOTAL ESTIMATED REVENUE & OTHER SOURCES 48,128,871.06 38,734,362.85 9,394,508.21
FUND BALANCE AT BEGINNING OF YEAR:Nonspendable‐Inventory 2711 0.00 0.00 0.00Restricted for Grants and Programs 2729 0.00 0.00 0.00Assigned for Other Programs 2749 0.00 1,393,759.51 (1,393,759.51)Unassigned 2750 0.00 0.00 0.00 Total Beginning Fund Balance 0.00 1,393,759.51 (1,393,759.51)
TOTAL EST REVENUE AND BEGINNING FD BAL 48,128,871.06 40,128,122.36 8,000,748.70
THE SCHOOL DISTRICT OF OSCEOLA COUNTY, FLSPECIAL REVENUE FUNDS (OTHER) ‐ ESTIMATED REVENUES ‐ 2015‐16
Source
ACCT.
NO.
2015‐16
Tentative
2014‐15
Budget Difference
4-7

ACCT.Use NO. Difference
Instruction 5000 27,152,102.36 22,099,495.72 5,052,606.64
Pupil Personnel Services 6100 2,314,019.78 1,642,014.60 672,005.18Instructional Media 6200 140,571.29 78,433.75 62,137.54Instruction and Curriculum Development 6300 9,115,830.91 6,618,357.21 2,497,473.70Instructional Staff Training 6400 5,878,921.07 3,024,357.32 2,854,563.75Instruction Related Technology 6500 322,378.52 193,680.11 128,698.41General Administration 7200 1,076,553.75 653,669.53 422,884.22School Administration 7300 0.00 0.00 0.00Facilities Acquisition and Construction 7400 0.00 0.00 0.00Fiscal Services 7500 0.00 0.00 0.00Food Services 7600 0.00 0.00 0.00Central Services 7700 482,299.06 206,879.40 275,419.66Pupil Transportation 7800 345,847.31 126,052.97 219,794.34Operation of Plant 7900 40,000.00 0.00 40,000.00Maintenance of Plant 8100 0.00 0.00 0.00Administrative Technology Services 8200 60,347.01 0.00 60,347.01Community Services 9100 1,200,000.00 4,191,422.24 (2,991,422.24)Debt Service 9200 0.00 0.00 0.00Transfers Out 9700 0.00 0.00 0.00TOTAL APPROPRIATIONS AND OTHER USES 48,128,871.06 38,834,362.85 9,294,508.21
ESTIMATED REVENUES LESS APPROPRIATIONS 0.00 (100,000.00) 100,000.00
FUND BALANCE AT END OF YEAR:Nonspendable‐Inventory 2711 0.00 0.00 0.00Restricted for Grants and Programs 2729 0.00 0.00 0.00Assigned for Other Programs 2749 0.00 1,293,759.51 (1,293,759.51)Unassigned 2750 0.00 0.00 0.00
Total Ending Fund Balance 0.00 1,293,759.51 (1,293,759.51)
TOTAL APPROPRIATIONS AND ENDING FD BAL 48,128,871.06 40,128,122.36 8,000,748.70
THE SCHOOL DISTRICT OF OSCEOLA COUNTY, FLSPECIAL REVENUE FUNDS (OTHER) ‐ SUMMARY OF APPROPRIATIONS AND FUND BALANCE ‐ 2015‐16
2015‐16
Tentative
2014‐15
Budget
4-8

ACCT. 420 421 422Source NO. Fed‐State Pell Grants Federal Direct Total
FEDERAL:Head Start 130 0.00 0.00 0.00 0.00Civil Rights Act Title IV 140 0.00 0.00 0.00 0.00Emergency School Assistance 161 0.00 0.00 0.00 0.00Community Action Program 180 0.00 0.00 0.00 0.00Other Federal Direct 190 0.00 0.00 68,059.39 68,059.39Miscellaneous Federal Direct 199 0.00 1,200,000.00 0.00 1,200,000.00Vocational Education Act 201 953,516.27 0.00 0.00 953,516.27Race to the Top 214 0.00 0.00 0.00 0.00Education Jobs Fund 215 0.00 0.00 0.00 0.00Workforce Investment Act 220 0.00 0.00 0.00 0.00Teacher and Principal Training 225 1,977,224.24 0.00 0.00 1,977,224.24Math and Science Partnerships 226 1,221,487.19 0.00 0.00 1,221,487.19Safe and Drug Free Schools 227 0.00 0.00 0.00 0.00Individuals with Disabilities Education Act, PL94‐142 230 12,713,956.96 0.00 0.00 12,713,956.96Title I Targeted Assistance 240 24,591,082.93 0.00 0.00 24,591,082.93Adult General Education 251 746,964.69 0.00 0.00 746,964.69National School Lunch Act Lunch 261 0.00 0.00 0.00 0.00National School Lunch Act Breakfast 262 0.00 0.00 0.00 0.00National School Lunch Act Snack 263 0.00 0.00 0.00 0.00U.S.D.A Commodities 265 0.00 0.00 0.00 0.00Summer Feeding 267 0.00 0.00 0.00 0.00
Other Federal Through State 290 3,255,245.70 0.00 0.00 3,255,245.70 Emergency Immigrant 293 1,401,333.69 0.00 0.00 1,401,333.69
Total Federal 46,860,811.67 1,200,000.00 68,059.39 48,128,871.06
STATE:School Breakfast Supplement 337 0.00 0.00 0.00 0.00Food Service Supplement 338 0.00 0.00 0.00 0.00Miscellaneous State Sources 399 0.00 0.00 0.00 0.00 Total State 0.00 0.00 0.00 0.00
LOCAL:Interest, Including Profit on Investments 431 0.00 0.00 0.00 0.00Food Service Sales 450 0.00 0.00 0.00 0.00Pre‐K Early Intervention 472 0.00 0.00 0.00 0.00School‐Aged Child Care Fees 473 0.00 0.00 0.00 0.00Miscellaneous Local Sources 495 0.00 0.00 0.00 0.00 Total Local 0.00 0.00 0.00 0.00
OTHER SOURCES:Transfers In 610 0.00 0.00 0.00 0.00 Total Other Sources 0.00 0.00 0.00 0.00
TOTAL ESTIMATED REVENUE & OTHER SOURCES 46,860,811.67 1,200,000.00 68,059.39 48,128,871.06
FUND BALANCE AT BEGINNING OF YEAR:Nonspendable‐Inventory 2711 0.00 0.00 0.00 0.00Restricted for Grants and Programs 2729 0.00 0.00 0.00 0.00Assigned for Other Programs 2749 0.00 0.00 0.00 0.00Unassigned 2750 0.00 0.00 0.00 0.00 Total Beginning Fund Balance 0.00 0.00 0.00 0.00
0.00TOTAL EST REVENUE AND BEGINNING FD BAL 46,860,811.67 1,200,000.00 68,059.39 48,128,871.06
THE SCHOOL DISTRICT OF OSCEOLA COUNTY, FLSPECIAL REVENUE FUNDS (OTHER) ‐ ESTIMATED REVENUE BY FUND‐ 2015‐16
4-9

ACCT. 420 421 422Use NO. Fed‐State Pell Grants Federal Direct Total
Instruction 5000 27,152,102.36 0.00 0.00 27,152,102.36Pupil Personnel Services 6100 2,254,692.91 0.00 59,326.87 2,314,019.78Instructional Media 6200 140,571.29 0.00 0.00 140,571.29Instruction and Curriculum Development 6300 9,115,830.91 0.00 0.00 9,115,830.91Instructional Staff Training 6400 5,870,853.15 0.00 8,067.92 5,878,921.07Instruction Related Technology 6500 322,378.52 0.00 0.00 322,378.52General Administration 7200 1,075,889.15 0.00 664.60 1,076,553.75School Administration 7300 0.00 0.00 0.00 0.00Facilities Acquisition and Construction 7400 0.00 0.00 0.00 0.00Fiscal Services 7500 0.00 0.00 0.00 0.00Food Service 7600 0.00 0.00 0.00 0.00Central Services 7700 482,299.06 0.00 0.00 482,299.06Pupil Transportation 7800 345,847.31 0.00 0.00 345,847.31Operation of Plant 7900 40,000.00 0.00 0.00 40,000.00Maintenance of Plant 8100 0.00 0.00 0.00 0.00Administrative Technology Services 8200 60,347.01 0.00 0.00 60,347.01Community Services 9100 0.00 1,200,000.00 0.00 1,200,000.00Debt Service 9200 0.00 0.00 0.00 0.00Transfers Out 9700 0.00 0.00 0.00 0.00TOTAL APPROPRIATIONS AND OTHER USES 46,860,811.67 1,200,000.00 68,059.39 48,128,871.06
ESTIMATED REVENUES LESS APPROPRIATIONS 0.00 0.00 0.00 0.00
FUND BALANCE AT END OF YEAR:Nonspendable‐Inventory 2711 0.00 0.00 0.00 0.00Restricted for Grants and Programs 2729 0.00 0.00 0.00 0.00Assigned for Other Programs 2749 0.00 0.00 0.00 0.00Unassigned 2750 0.00 0.00 0.00 0.00
Total Ending Fund Balance 0.00 0.00 0.00 0.00
TOTAL APPROPRIATIONS AND ENDING FD BAL 46,860,811.67 1,200,000.00 68,059.39 48,128,871.06
THE SCHOOL DISTRICT OF OSCEOLA COUNTY, FLSPECIAL REVENUE FUNDS (OTHER) ‐ SUMMARY OF APPROPRIATIONS AND FUND BALANCE BY FUND ‐ 2015‐16
4-10

FEDERAL:
Head Start 130 0.00 0.00 0.00Civil Rights Act Title IV 140 0.00 0.00 0.00Emergency School Assistance 161 0.00 0.00 0.00Community Action Program 180 0.00 0.00 0.00Other Federal Direct 190 0.00 0.00 0.00ROTC 191 0.00 0.00 0.00Miscellaneous Federal Direct 199 0.00 0.00 0.00Vocational Education Act 201 0.00 0.00 0.00State Fiscal Stabilization, K‐12 210 0.00 0.00 0.00Race to the Top 214 398,683.44 957,170.44 (558,487.00)Education Jobs Fund 215 0.00 0.00 0.00Workforce Investment Act 220 0.00 0.00 0.00Eisenhower 226 0.00 0.00 0.00Safe and Drug Free Schools 227 0.00 0.00 0.00Math and Science Partnerships 226 0.00 0.00 0.00Individuals with Disabilities Education Act, PL94‐142 230 0.00 0.00 0.00Title I Targeted Assistance 240 0.00 0.00 0.00Adult General Education 251 0.00 0.00 0.00National School Lunch Act Lunch 261 0.00 0.00 0.00National School Lunch Act Breakfast 262 0.00 0.00 0.00National School Lunch Act Snack 263 0.00 0.00 0.00U.S.D.A Commodities 265 0.00 0.00 0.00Summer Feeding 267 0.00 0.00 0.00
Other Federal Through State 290 0.00 0.00 0.00 Emergency Immigrant 293 0.00 0.00 0.00
Total Federal 398,683.44 957,170.44 (558,487.00)
STATE:School Breakfast Supplement 337 0.00 0.00 0.00Food Service Supplement 338 0.00 0.00 0.00Miscellaneous State Sources 399 0.00 0.00 0.00 Total State 0.00 0.00 0.00
LOCAL:Interest, Including Profit on Investments 431 0.00 0.00 0.00Food Service Sales 450 0.00 0.00 0.00Pre‐K Early Intervention 472 0.00 0.00 0.00School‐Aged Child Care Fees 473 0.00 0.00 0.00Miscellaneous Local Sources 495 0.00 0.00 0.00 Total Local 0.00 0.00 0.00
OTHER SOURCES:Transfers In 610 0.00 0.00 0.00 Total Other Sources 0.00 0.00 0.00
TOTAL ESTIMATED REVENUE & OTHER SOURCES 398,683.44 957,170.44 (558,487.00)
FUND BALANCE AT BEGINNING OF YEAR:Nonspendable‐Inventory 2711 0.00 0.00 0.00Restricted for Grants and Programs 2729 0.00 0.00 0.00Assigned for Other Programs 2749 0.00 0.00 0.00Unassigned 2750 0.00 0.00 0.00 Total Beginning Fund Balance 0.00 0.00 0.00
TOTAL EST REVENUE AND BEGINNING FD BAL 398,683.44 957,170.44 (558,487.00)
THE SCHOOL DISTRICT OF OSCEOLA COUNTY, FLSPECIAL REVENUE FUNDS (ARRA) ‐ ESTIMATED REVENUES ‐ 2015‐16
Source
ACCT.
NO.
2015‐16
Tentative
2014‐15
Budget Difference
4-11

ACCT.Use NO. Difference
Instruction 5000 859.01 1,526.75 (667.74)
Pupil Personnel Services 6100 0.00 0.00 0.00Instructional Media 6200 0.00 0.00 0.00Instruction and Curriculum Development 6300 0.00 562,503.44 (562,503.44)Instructional Staff Training 6400 242.18 345,521.45 (345,279.27)Instruction Related Technology 6500 390,503.68 0.00 390,503.68General Administration 7200 503.76 40,689.92 (40,186.16)School Administration 7300 0.00 0.00 0.00Facilities Acquisition and Construction 7400 0.00 0.00 0.00Fiscal Services 7500 0.00 0.00 0.00Food Services 7600 0.00 0.00 0.00Central Services 7700 0.00 6,928.88 (6,928.88)Pupil Transportation 7800 0.00 0.00 0.00Operation of Plant 7900 6,574.81 0.00 6,574.81Maintenance of Plant 8100 0.00 0.00 0.00Administrative Technology Services 8200 0.00 0.00 0.00Community Services 9100 0.00 0.00 0.00Debt Service 9200 0.00 0.00 0.00Transfers Out 9700 0.00 0.00 0.00TOTAL APPROPRIATIONS AND OTHER USES 398,683.44 957,170.44 (558,487.00)
ESTIMATED REVENUES LESS APPROPRIATIONS 0.00 0.00 0.00
FUND BALANCE AT END OF YEAR:Nonspendable‐Inventory 2711 0.00 0.00 0.00Restricted for Grants and Programs 2729 0.00 0.00 0.00Assigned for Other Programs 2749 0.00 0.00 0.00Unassigned 2750 0.00 0.00 0.00
Total Ending Fund Balance 0.00 0.00 0.00
TOTAL APPROPRIATIONS AND ENDING FD BAL 398,683.44 957,170.44 (558,487.00)
THE SCHOOL DISTRICT OF OSCEOLA COUNTY, FLSPECIAL REVENUE FUNDS (ARRA) ‐ SUMMARY OF APPROPRIATIONS AND FUND BALANCE ‐ 2015‐16
2015‐16
Tentative
2014‐15
Budget
4-12
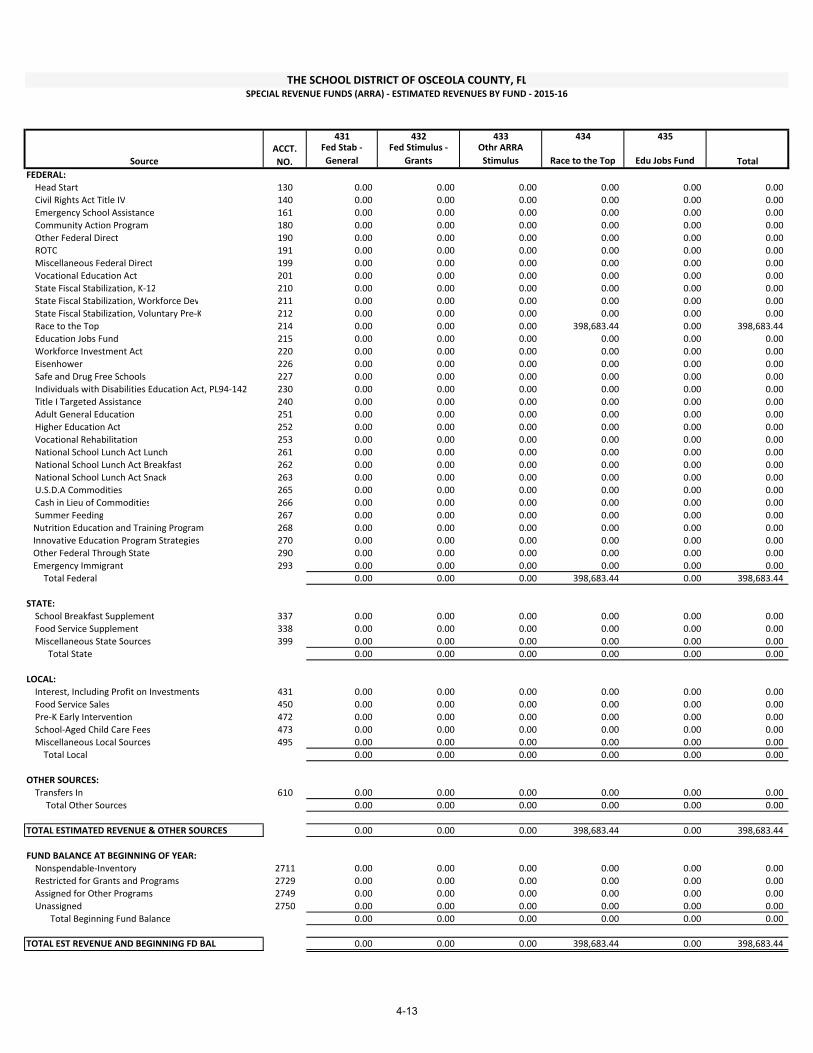
431 432 433 434 435
Source
Fed Stab ‐
General
Fed Stimulus ‐
Grants
Othr ARRA
Stimulus Race to the Top Edu Jobs Fund Total
FEDERAL:
Head Start 130 0.00 0.00 0.00 0.00 0.00 0.00
Civil Rights Act Title IV 140 0.00 0.00 0.00 0.00 0.00 0.00
Emergency School Assistance 161 0.00 0.00 0.00 0.00 0.00 0.00
Community Action Program 180 0.00 0.00 0.00 0.00 0.00 0.00
Other Federal Direct 190 0.00 0.00 0.00 0.00 0.00 0.00
ROTC 191 0.00 0.00 0.00 0.00 0.00 0.00
Miscellaneous Federal Direct 199 0.00 0.00 0.00 0.00 0.00 0.00
Vocational Education Act 201 0.00 0.00 0.00 0.00 0.00 0.00
State Fiscal Stabilization, K‐12 210 0.00 0.00 0.00 0.00 0.00 0.00
State Fiscal Stabilization, Workforce Dev 211 0.00 0.00 0.00 0.00 0.00 0.00
State Fiscal Stabilization, Voluntary Pre‐K 212 0.00 0.00 0.00 0.00 0.00 0.00
Race to the Top 214 0.00 0.00 0.00 398,683.44 0.00 398,683.44
Education Jobs Fund 215 0.00 0.00 0.00 0.00 0.00 0.00
Workforce Investment Act 220 0.00 0.00 0.00 0.00 0.00 0.00
Eisenhower 226 0.00 0.00 0.00 0.00 0.00 0.00
Safe and Drug Free Schools 227 0.00 0.00 0.00 0.00 0.00 0.00
Individuals with Disabilities Education Act, PL94‐142 230 0.00 0.00 0.00 0.00 0.00 0.00
Title I Targeted Assistance 240 0.00 0.00 0.00 0.00 0.00 0.00
Adult General Education 251 0.00 0.00 0.00 0.00 0.00 0.00
Higher Education Act 252 0.00 0.00 0.00 0.00 0.00 0.00
Vocational Rehabilitation 253 0.00 0.00 0.00 0.00 0.00 0.00
National School Lunch Act Lunch 261 0.00 0.00 0.00 0.00 0.00 0.00
National School Lunch Act Breakfast 262 0.00 0.00 0.00 0.00 0.00 0.00
National School Lunch Act Snack 263 0.00 0.00 0.00 0.00 0.00 0.00
U.S.D.A Commodities 265 0.00 0.00 0.00 0.00 0.00 0.00
Cash in Lieu of Commodities 266 0.00 0.00 0.00 0.00 0.00 0.00
Summer Feeding 267 0.00 0.00 0.00 0.00 0.00 0.00
Nutrition Education and Training Program 268 0.00 0.00 0.00 0.00 0.00 0.00
Innovative Education Program Strategies 270 0.00 0.00 0.00 0.00 0.00 0.00
Other Federal Through State 290 0.00 0.00 0.00 0.00 0.00 0.00
Emergency Immigrant 293 0.00 0.00 0.00 0.00 0.00 0.00
Total Federal 0.00 0.00 0.00 398,683.44 0.00 398,683.44
STATE: School Breakfast Supplement 337 0.00 0.00 0.00 0.00 0.00 0.00
Food Service Supplement 338 0.00 0.00 0.00 0.00 0.00 0.00
Miscellaneous State Sources 399 0.00 0.00 0.00 0.00 0.00 0.00
Total State 0.00 0.00 0.00 0.00 0.00 0.00
LOCAL:
Interest, Including Profit on Investments 431 0.00 0.00 0.00 0.00 0.00 0.00
Food Service Sales 450 0.00 0.00 0.00 0.00 0.00 0.00
Pre‐K Early Intervention 472 0.00 0.00 0.00 0.00 0.00 0.00
School‐Aged Child Care Fees 473 0.00 0.00 0.00 0.00 0.00 0.00
Miscellaneous Local Sources 495 0.00 0.00 0.00 0.00 0.00 0.00
Total Local 0.00 0.00 0.00 0.00 0.00 0.00
OTHER SOURCES:
Transfers In 610 0.00 0.00 0.00 0.00 0.00 0.00
Total Other Sources 0.00 0.00 0.00 0.00 0.00 0.00
TOTAL ESTIMATED REVENUE & OTHER SOURCES 0.00 0.00 0.00 398,683.44 0.00 398,683.44
FUND BALANCE AT BEGINNING OF YEAR:
Nonspendable‐Inventory 2711 0.00 0.00 0.00 0.00 0.00 0.00
Restricted for Grants and Programs 2729 0.00 0.00 0.00 0.00 0.00 0.00
Assigned for Other Programs 2749 0.00 0.00 0.00 0.00 0.00 0.00
Unassigned 2750 0.00 0.00 0.00 0.00 0.00 0.00
Total Beginning Fund Balance 0.00 0.00 0.00 0.00 0.00 0.00
TOTAL EST REVENUE AND BEGINNING FD BAL 0.00 0.00 0.00 398,683.44 0.00 398,683.44
THE SCHOOL DISTRICT OF OSCEOLA COUNTY, FLSPECIAL REVENUE FUNDS (ARRA) ‐ ESTIMATED REVENUES BY FUND ‐ 2015‐16
ACCT.
NO.
4-13

431 432 433 434 435
Use
Fed Stab ‐
General
Fed Stimulus ‐
Grants
Othr ARRA
Stimulus Race to the Top Edu Jobs Fund Total
Instruction 5000 0.00 0.00 0.00 859.01 0.00 859.01
Pupil Personnel Services 6100 0.00 0.00 0.00 0.00 0.00 0.00
Instructional Media 6200 0.00 0.00 0.00 0.00 0.00 0.00
Instruction and Curriculum Development 6300 0.00 0.00 0.00 0.00 0.00 0.00
Instructional Staff Training 6400 0.00 0.00 0.00 242.18 0.00 242.18
Instruction Related Technology 6500 0.00 0.00 0.00 390,503.68 0.00 390,503.68
General Administration 7200 0.00 0.00 0.00 503.76 0.00 503.76
School Administration 7300 0.00 0.00 0.00 0.00 0.00 0.00
Facilities Acquisition and Construction 7400 0.00 0.00 0.00 0.00 0.00 0.00
Fiscal Services 7500 0.00 0.00 0.00 0.00 0.00 0.00
Food Service 7600 0.00 0.00 0.00 0.00 0.00 0.00
Central Services 7700 0.00 0.00 0.00 0.00 0.00 0.00
Pupil Transportation 7800 0.00 0.00 0.00 0.00 0.00 0.00
Operation of Plant 7900 0.00 0.00 0.00 6,574.81 0.00 6,574.81
Maintenance of Plant 8100 0.00 0.00 0.00 0.00 0.00 0.00
Administrative Technology Services 8200 0.00 0.00 0.00 0.00 0.00 0.00
Community Services 9100 0.00 0.00 0.00 0.00 0.00 0.00
Debt Service 9200 0.00 0.00 0.00 0.00 0.00 0.00
Transfers Out 9700 0.00 0.00 0.00 0.00 0.00 0.00
TOTAL APPROPRIATIONS AND OTHER USES 0.00 0.00 0.00 398,683.44 0.00 398,683.44
ESTIMATED REVENUES LESS APPROPRIATIONS 0.00 0.00 0.00 0.00 0.00 0.00
FUND BALANCE AT END OF YEAR:
Nonspendable‐Inventory 2711 0.00 0.00 0.00 0.00 0.00 0.00
Restricted for Grants and Programs 2729 0.00 0.00 0.00 0.00 0.00 0.00
Assigned for Other Programs 2749 0.00 0.00 0.00 0.00 0.00 0.00
Unassigned 2750 0.00 0.00 0.00 0.00 0.00 0.00
Total Ending Fund Balance 0.00 0.00 0.00 0.00 0.00 0.000.00
TOTAL APPROPRIATIONS AND ENDING FD BAL 0.00 0.00 0.00 398,683.44 0.00 398,683.44
THE SCHOOL DISTRICT OF OSCEOLA COUNTY, FLSPECIAL REVENUE FUNDS (ARRA) ‐ SUMMARY OF APPROPRIATIONS AND FUND BALANCE BY FUND ‐ 2015‐16
ACCT.
NO.
4-14

FUND 7XX
INTERNAL SERVICE FUND

INTERNAL SERVICE FUND BUDGET
This fund records the premium revenue and expenditures associated with theDistrict’s self insured group health and life insurance program and casualtyinsurance programs.
The premium revenue in the Health & Life Insurance Trust Fund is from Boardcontributions for employee coverage, deductions for dependent coverage, andcontributions by retirees for post employment coverage. The expenditures of thisfund are for claims payments, insurance premiums, and professional/technicalservices.
The District maintains a stand alone insurance program for workerscompensation and property casualty. The District is also self insured for auto andgeneral liability risk. All of these are accounted for in a separate casualty internalservice fund.
FUND7XX
5-2

ACCT. 2015‐16 2014‐15
Source NO. Tentative Budget Difference
FEDERAL:
0.00 0.00 0.00
Total Federal 0.00 0.00 0.00
STATE:
0.00 0.00 0.00
Total State 0.00 0.00 0.00
LOCAL:
Interest 431 45,000.00 40,000.00 5,000.00
Premiums 484 57,053,746.00 56,830,764.00 222,982.00
Total Local 57,098,746.00 56,870,764.00 227,982.00
OTHER SOURCES:
Transfers In 0.00 0.00 0.00
Total Other Sources 0.00 0.00 0.00
TOTAL ESTIMATED REVENUE & OTHER SOURCES 57,098,746.00 56,870,764.00 227,982.00
NET ASSETS AT BEGINNING OF YEAR:
Restricted Net Assets 21,986,067.00 20,257,439.65 1,728,627.35
Total Beginning Net Assets 21,986,067.00 20,257,439.65 1,728,627.35
TOTAL EST REVENUE AND BEGINNING NET ASSETS 79,084,813.00 77,128,203.65 1,956,609.35
THE SCHOOL DISTRICT OF OSCEOLA COUNTY, FLINTERNAL SERVICE FUND 700 COMBINED ‐ ESTIMATED REVENUES ‐ 2015‐16
5-3

ACCT. 2015‐16 2014‐15
Use NO. Tentative Budget Difference
GROUP INSURANCE APPROPRIATIONS: 7770
Professional & Technical Services 3100 3,420,000.00 3,831,769.00 (411,769.00)
Insurance & Bond Premiums 3200 3,462,806.00 3,406,659.00 56,147.00
Supplies 5100 5,000.00 5,000.00 0.00
Buidlings and Fixed Equipment 6300 2,280,000.00 0.00 2,280,000.00
Claims Expense 7700 48,177,985.00 53,095,985.00 (4,918,000.00)
Total Group Insurance Appropriations 57,345,791.00 60,339,413.00 (2,993,622.00)
OTHER USES:
Transfers Out 0.00 0.00 0.00
Total Other Finacing Uses 0.00 0.00 0.00
TOTAL APPROPRIATIONS AND OTHER USES 57,345,791.00 60,339,413.00 (2,993,622.00)
ESTIMATED REVENUES LESS APPROPRIATIONS (247,045.00) (3,468,649.00) 3,221,604.00
NET ASSETS AT END OF YEAR:
Restricted Net Assets 21,739,022.00 16,788,790.65 4,950,231.35
Total Ending Net Assets 21,739,022.00 16,788,790.65 4,950,231.35
TOTAL APPROPRIATIONS AND ENDING NET ASSETS 79,084,813.00 77,128,203.65 1,956,609.35
THE SCHOOL DISTRICT OF OSCEOLA COUNTY, FLINTERNAL SERVICE FUND 700 COMBINED ‐ SUMMARY OF APPROPRATIONS AND NET ASSETS ‐ 2015‐16
5-4

ACCT. 2015‐16 2014‐15
Source NO. Tentative Budget Difference
FEDERAL:
0.00 0.00 0.00
Total Federal 0.00 0.00 0.00
STATE:
0.00 0.00 0.00
Total State 0.00 0.00 0.00
LOCAL:
Interest 431 30,000.00 25,000.00 5,000.00
Premiums 484
‐ Employer .070 44,500,000.00 40,548,000.00 3,952,000.00
‐ Employee .071 6,200,000.00 8,928,000.00 (2,728,000.00)
‐ Retiree/LOA .072 2,220,000.00 3,012,000.00 (792,000.00)
‐ COBRA .073 85,200.00 108,000.00 (22,800.00)
Total Local 53,035,200.00 52,621,000.00 414,200.00
OTHER SOURCES:
Transfers In 0.00 0.00 0.00
Total Other Sources 0.00 0.00 0.00
TOTAL ESTIMATED REVENUE & OTHER SOURCES 53,035,200.00 52,621,000.00 414,200.00
NET ASSETS AT BEGINNING OF YEAR:
Restricted Net Assets 15,181,554.00 12,856,364.54 2,325,189.46
Total Beginning Net Assets 15,181,554.00 12,856,364.54 2,325,189.46
TOTAL EST REVENUE AND BEGINNING NET ASSETS 68,216,754.00 65,477,364.54 2,739,389.46
THE SCHOOL DISTRICT OF OSCEOLA COUNTY, FLHEALTH AND LIFE INSURANCE TRUST FUND ‐ ESTIMATED REVENUES ‐ 2015‐16
5-5

ACCT. 2015‐16 2014‐15
Use NO. Tentative Budget Difference
HEALTH & LIFE INS APPROPRIATIONS: 7770
Professional & Technical Services 3100 3,200,000.00 3,611,769.00 (411,769.00)
Insurance & Bond Premiums 3200 1,260,000.00 900,000.00 360,000.00
Supplies 5100 5,000.00 5,000.00 0.00
Buidlings and Fixed Equipment 6300 2,280,000.00 0.00 2,280,000.00
Claims Expense 7700 46,670,000.00 51,588,000.00 (4,918,000.00)
Total Health & Life Ins Appropriations 53,415,000.00 56,104,769.00 (2,689,769.00)
OTHER USES:
Transfers Out 0.00 0.00 0.00
Total Other Finacing Uses 0.00 0.00 0.00
TOTAL APPROPRIATIONS AND OTHER USES 53,415,000.00 56,104,769.00 (2,689,769.00)
ESTIMATED REVENUES LESS APPROPRIATIONS (379,800.00) (3,483,769.00) 3,103,969.00
NET ASSETS AT END OF YEAR:
Restricted Net Assets 14,801,754.00 9,372,595.54 5,429,158.46
Total Ending Net Assets 14,801,754.00 9,372,595.54 5,429,158.46
TOTAL APPROPRIATIONS AND ENDING NET ASSETS 68,216,754.00 65,477,364.54 2,739,389.46
THE SCHOOL DISTRICT OF OSCEOLA COUNTY, FLHEALTH AND LIFE INSURANCE TRUST FUND 711 ‐ SUMMARY OF APPROPRATIONS AND NET ASSETS ‐ 2015‐16
5-6

ACCT. 2015‐16 2014‐15
Source NO. Tentative Budget Difference
FEDERAL:
0.00 0.00 0.00
Total Federal 0.00 0.00 0.00
STATE:
0.00 0.00 0.00
Total State 0.00 0.00 0.00
LOCAL:
Interest 431 15,000.00 15,000.00 0.00
Premiums 484
‐ Property & Casualty 2,343,324.00 2,526,000.00 (182,676.00)
‐ Workers Compensation 1,705,222.00 1,708,764.00 (3,542.00)
Total Local 4,063,546.00 4,249,764.00 (186,218.00)
OTHER SOURCES:
Transfers In 0.00 0.00 0.00
Total Other Sources 0.00 0.00 0.00
TOTAL ESTIMATED REVENUE & OTHER SOURCES 4,063,546.00 4,249,764.00 (186,218.00)
NET ASSETS AT BEGINNING OF YEAR:
Restricted Net Assets 6,804,513.00 7,401,075.11 (596,562.11)
Total Beginning Net Assets 6,804,513.00 7,401,075.11 (596,562.11)
TOTAL EST REVENUE AND BEGINNING NET ASSETS 10,868,059.00 11,650,839.11 (782,780.11)
THE SCHOOL DISTRICT OF OSCEOLA COUNTY, FLCASUALTY INSURANCE LOSS FUND 712 ‐ ESTIMATED REVENUES ‐ 2015‐16
5-7

ACCT. 2015‐16 2014‐15
Use NO. Tentative Budget Difference
CASUALTY INSURANCE APPROPRIATIONS: 7770
Professional & Technical Services 3100 220,000.00 220,000.00 0.00
Insurance & Bond Premiums 3200 2,202,806.00 2,506,659.00 (303,853.00)
Supplies 5100 0.00 0.00 0.00
Buidlings and Fixed Equipment 6300 0.00 0.00 0.00
Claims Expense 7700 1,507,985.00 1,507,985.00 0.00
Total Casualty Insurance Appropriations 3,930,791.00 4,234,644.00 (303,853.00)
OTHER USES:
Transfers Out 0.00 0.00 0.00
Total Other Finacing Uses 0.00 0.00 0.00
TOTAL APPROPRIATIONS AND OTHER USES 3,930,791.00 4,234,644.00 (303,853.00)
ESTIMATED REVENUES LESS APPROPRIATIONS 132,755.00 15,120.00 117,635.00
NET ASSETS AT END OF YEAR:
Restricted Net Assets 6,937,268.00 7,416,195.11 (478,927.11)
Total Ending Net Assets 6,937,268.00 7,416,195.11 (478,927.11)
TOTAL APPROPRIATIONS AND ENDING NET ASSETS 10,868,059.00 11,650,839.11 (782,780.11)
THE SCHOOL DISTRICT OF OSCEOLA COUNTY, FLCASUALTY INSURANCE LOSS FUND 712 ‐ SUMMARY OF APPROPRATIONS AND NET ASSETS ‐ 2015‐16
5-8

ANNUALACTIVE EMPLOYEES RATEBOARD CONTRIBUTION $6,398.00
CIGNA LocalPlusSINGLE $0.00SPOUSE $5,500.00CHILD(REN) $2,540.00FAMILY $8,040.00HALF-FAMILY $2,540.00
CIGNA WELLNESS LocalPlusSINGLE $0.00SPOUSE $6,700.00CHILD(REN) $2,900.00FAMILY $9,600.00HALF-FAMILY $2,900.00
CIGNA WELLNESS Open Access PlusSINGLE $900.00SPOUSE $8,200.00CHILD(REN) $4,000.00FAMILY $12,200.00HALF-FAMILY $4,000.00
RETIREESBOARD CONTRIBUTION $0.00
CIGNA LocalPlusSINGLE $6,033.60SPOUSE $13,273.92CHILD(REN) $9,050.40FAMILY $16,290.72
CIGNA WELLNESS LocalPlusSINGLE $6,547.80SPOUSE $14,405.28CHILD(REN) $9,821.76FAMILY $17,679.24
CIGNA WELLNESS Open Access PlusSINGLE $6,953.52SPOUSE $15,297.60CHILD(REN) $10,430.16FAMILY $18,774.24
THE SCHOOL BOARD OF OSCEOLA COUNTY, FLORIDAINSURANCE RATES - 2015-16
5-9

THE SCHOOL DISTRICT OF OSCEOLA COUNTY, FLBOARD CONTRIBUTION FOR HEALTH INSURANCE ‐ HISTORICAL AND PROJECTED COST ‐ FROM 2010 TO 2016
Board Health Insurance Contribution
2011 2012 2013 2014 2015 2016
EXPENDITURES 37,907,537 38,458,022 39,197,561 39,997,399 41,098,600 45,147,707
% CHANGE 1.45% 1.92% 2.04% 2.75% 9.85%
34,000,000
36,000,000
38,000,000
40,000,000
42,000,000
44,000,000
46,000,000
2011 2012 2013 2014 2015 2016
5-10