the rural non-farm economy in romania: overview …gala.gre.ac.uk/11663/1/11663_davis_the rural non...
TRANSCRIPT

N A T U R A L R E S O U R C E S I N S T I T U T E
NRI Report No: 2730
Rural Non-Farm Economy Project
The Rural Non-Farm Economyin Romania: Overview
of Findings
Dirk Bezemer and Junior Davis
This document is an output from a project funded by the UK Departmentfor International Development (DFID) and the Worldbank for the benefitof developing countries. The views expressed are not necessarily those of
DFID or the Worldbank.
World Bank
Contents
1 INTRODUCTION...........................................................................................................................1 1.1 BACKGROUND TO THE RESEARCH...........................................................................................1 1.2 CONCEPTUAL FRAMEWORK ......................................................................................................2 1.3 AIMS AND RATIONALE OF APPROACH .....................................................................................2
2 COUNTRY BACKGROUND .......................................................................................................5 2.1 ROMANIAN MACROECONOMIC AND AGRICULTURAL SECTOR DEVELOPMENTS ............5 2.2 MAIN ISSUES/PROBLEMS FOR THE RURAL ECONOMY IN ROMANIA ...................................7
3 THE SURVEY...................................................................................................................................9
4 OVERVIEW OF FINDINGS......................................................................................................14
5 ANALYSIS: ASSETS, ACTIVITIES, AND POVERTY.........................................................19
6 CONCLUSIONS AND POLICY IMPLICATIONS ...............................................................24 6.1 THE RNFE DURING TRANSITION..........................................................................................24 6.2 REQUIREMENTS FOR DEVELOPMENT OF THE RNFE .........................................................25 6.3 RECOMMENDATIONS FOR GOVERNMENT POLICY TOWARD THE RNFE .........................27 6.4 FUTURE RNFE POLICY AND RESEARCH QUESTIONS..........................................................28
REFERENCES..........................................................................................................................................29
ANNEX 1 LIST OF COMMUNES INCLUDED IN THE SAMPLE ON REGIONS AND SUB-REGIONS.........................................................................................................................................30
ANNEX 2 NUMBER OF HOUSEHOLDS IN EACH COMMUNE BY TYPE OF HOUSEHOLDS........................................................................................................................................32
ANNEX 3 NUMBER OF INDIVIDUALS IN THE SAMPLES DISTRIBUTED ON REGIONS AND TYPES NON-FARM ACTIVITIES .....................................................................33
Tables TABLE 1. MACROECONOMIC INDICATORS 1995 – 2002.........................................................................6 TABLE 2. SAMPLE SIZES BY REGION, DEVELOPMENT LEVEL, ETHNICITY AND RURALITY (COUNTS)
..............................................................................................................................................................11 TABLE 3. RURALITY, ETHNICITY & HOUSEHOLD TYPES BY REGIONAL DEVELOPMENT LEVEL
(COUNTS).............................................................................................................................................11 TABLE 4. DESCRIPTION OF THE REGIONS: GENERAL DEVELOPMENT INDICATORS ........................11 TABLE 5. DESCRIPTION OF THE REGIONS: BASIC DEMOGRAPHIC DATA............................................11 TABLE 6. DESCRIPTION OF THE REGIONS: LABOUR & OCCUPATIONAL STATUS...............................12 TABLE 7. 'CAPITALS' BY REGIONAL TYPES, REGIONAL DEVELOPMENT, & POVERTY INCIDENCE.14 TABLE 8. ECONOMIC ACTIVITY INDICATORS BY REGION, DEVELOPMENT LEVEL, AND POVERTY
INCIDENCE .........................................................................................................................................16 TABLE 9 FACTORS IN HOUSEHOLDS’ INVOLVEMENT IN NON-AGRICULTURAL ACTIVITIES ............21 TABLE 10 FACTORS AFFECTING THE RISK OF POVERTY.......................................................................22
i

Figures FIGURE 1: SCHEMATIC DIAGRAM OF THE PROPOSED FIELDWORK CRITERIA/STRUCTURE ...............3 FIGURE 2 MAP OF LOCATION OF SURVEY SITES (SHADED AREAS) ......................................................10 FIGURE 3. EARNED INCOME NON-FARM SHARES IN RURAL ROMANIA............................................17 FIGURE 4. SECTORAL COMPOSITION OF THE RNFE IN ROMANIA.....................................................18
ii

1 Introduction The literature on transition economies devotes relatively little attention to agriculture and the rural non-farm economy, despite the importance of the sector and its relevance to the livelihoods of the majority of the world’s poor. This report is part of growing volume of empirical work on agriculture in transition countries and especially on the topic of the rural non-farm economy and livelihood diversification among the poor. The empirical work presented in this report is primarily based on a large (nationwide) rural household survey and other field-related research projects representing a broad range of methodologies borrowed from economics, sociology and social anthropology. The report has been a collaborative endeavour involving significant contributions from the following individuals: Mr Sebastian Lazariou (CSOP) who organised and implemented the survey in Romania; Mr David Humphreys (DFID), Mr Gabriel Ionita (World Bank), Mrs. Ana Bleahu (Institute for the Quality of Life, Romanian Academy), Mrs Angela Gaburici (Academy of Economic Sciences, Romania). The authors’ gratefully acknowledge the support of the DFID/ World Bank Collaborative Program for Rural Development. However, the views in this report are solely those of the authors and do not necessarily represent the official view of the agencies or individuals concerned. 1.1 Background to the research The focus of this paper is on rural non-farm livelihoods in Romania. It was prepared as part of the Natural Resources Institute (NRI) project entitled ‘Characterisation and Analysis of the Non-Farm Rural Sector in Transition Economies’, undertaken for the World Bank and the Department for International Development (DFID). This programme of applied policy research began in March 2000 as a result of the Rural Non-Farm Economy (RNFE) workshop held within the World Bank in Washington in June 1999. This document is intended to summarise the key findings from a national survey of the RNFE in Romania conducted during November 2001 to January 2002. The intended outputs of this study are (1) to improve understanding of the dynamics of the RNFE in providing employment and income diversification opportunities in Romania, and (2) to promote mechanisms for integrating research results into relevant policy processes. Improved policy-making in this context may involve: • A focus on improving the well-being and livelihoods of the rural population in Romania,
through developing their capacity to access resources and actively participate in non-farm rural enterprise and employment opportunities;
• An emphasis on the diversity and diversification of income sources in the face of vulnerability to shocks and stresses - particularly on the part of the poorest members of society; and
• An acceptance of the need for an in-depth understanding of the context (socio-cultural, economic, agronomic) in which non-farm rural livelihood options are currently pursued and in which new options can be developed.
The paper contributes to the above NRI project which aims to identify the institutional and policy deficiencies constraining non-farm rural livelihoods in Central and Eastern Europe (CEE) and the Commonwealth of Independent States (CIS), to analyse the factors determining infrastructural and policy factors and to work with policy-makers to improve non-farm rural economy opportunities.
1

1.2 Conceptual framework This paper is structured around the concepts of livelihood and diversity. ‘A livelihood comprises the assets (natural, physical, human, financial and social capital), the activities, and the access gained to these … that together determine the living gained by … the household’ (Ellis, 2000:10). Assets form households’ endowment of resources with which to gain their living. In this definition, the conventional meaning of assets is expanded to include, besides material and financial resources, also household members’ skills and experience (human capital) and their relations within wider communities (social capital). This inclusive definition, as well as use of the term ‘capital’ in these senses, is not uncontroversial (Davis & Bezemer, 2003), but it serves to highlight several unifying features of diverse resources. They require investment, in terms of time or money, in order to be obtained or formed. They can (but need not) be used in an economically productive way. And in doing so, they are (imperfectly) substitutable and complement household labour. Activities comprise all the ways in which household members utilise their non-leisure time to support their livelihoods. This broad definition includes work and care, employment and entrepreneurship, agricultural production and trade, and a range of other dichotomies (some of these are depicted in Davis & Bezemer, 2003). Engagement in activities both requires assets and may increase households’ stock of assets. Households’ endowment of assets and involvement in activities jointly support their level of well-being. The second central term in this report is diversity, which follows naturally from the idea of livelihood. Diversity in a household’s activities and income (which is one measure for a household’s living standard) ‘refers to the existence, at a point in time, of … different household income sources…’ (Ellis, 2000:14). Given heterogeneity in assets, diversity in income is almost implied. Indeed, both individual and household income normally derives from more than one source: income diversification is the norm, specialisation the exception (Barrett et al, 2001). Typically, household income diversity is especially large in rural areas. Rural households are more often producers as well as consumers, which implies the presence of profit (from sold output) or in-kind income (if output is consumed) as income components in addition to, for instance, wages. Several other factors make it less likely that any single source of income is sufficient to meet rural household needs: larger household sizes, relatively lower remuneration of capital and labour, seasonality of agricultural revenues, and the more limited market development that often characterises rural areas 1.3 Aims and rationale of approach In recent years there has been growing recognition of the role of the non-farm sector for employment and income smoothing and generation in rural areas in the developing countries as well as in the European Union (EU), the CIS and CEE countries. However, there has been relatively little focus on the factors that determine people’s capacity to take advantage of or to generate these opportunities. It is hypothesised that two processes are apparent: demand-pull, where rural people respond to new opportunities; and distress-push, where the poorest are driven to seek non-farm employment as a survival strategy. Sometimes these processes work together. The non-farm sector is thus vital for rural employment and incomes in situations of both stagnant and buoyant agricultural sectors and rural economy as a whole. It is also important for Romania's EU accession, currently foreseen in 2007, as the development of remunerative and sustainable non-farm employment opportunities will have important effects in terms of the use
2

of future structural funds, regional assistance and the implementation of the Common Agricultural Policy. This research aims to identify the key socio-economic factors, resources, activities and constraints to rural households and enterprises in the non-farm rural economy. These data will be collected at the micro-level and analysed in the context of farm systems theory and contemporary econometric methodologies. The aim is to derive policy conclusions conducive to the development of sustainable rural livelihoods. Figure 1 provides a schematic diagram of the survey fieldwork criteria/structure. Certain secondary data and conceptual problems were encountered. Romania has municipal (unofficially NUTS)1 and regional data. There is no standardised definition of rural in the transition economies. Therefore, we have used a definition of 'rural' based on the following criteria2: • A population density of less than 60 persons per km2. • The largest city in the municipality must have a population below 30,000. • Share of agricultural output at least 20% higher than the country average. • Share of people employed in the agricultural sector at least 20% higher than the country
average.
Figure 1: Schematic diagram of the proposed fieldwork criteria/structure
Potential for job Different areas of potential
NUTS 4 Not special (ethnicity,
1 hour bus
Sample: households Less favoured areas
Sample: householdsMore favoured areas
PERI-URBAN (Max pop. 300,000)
Population density < per km sq.
Rural town pop < 30,000
> 20% above national averageof the agricultural labour
> 20% above national averageof agricultural output at NUTS
Different areas of potential
Sample: householdsLFA
Sample: householdsMFA
RURAL
DEMAND PULL /DISTRESS SDriving NFA
The survey structure has two tiers. The regional tier is where we disaggregate according to peri-urban and rural regions. Variability at this level is important statistically and the local knowledge of the project team was crucial, as they made the final decisions concerning less favoured areas (LFA) and more favoured area (MFA) designations. For complementarity reasons the project followed the EU definition of less favoured regions as closely as possible. The second tier is
1 The NUTS nomenclature (Nomenclature of Territorial Units for Statistics) is a five-level hierarchical classification (three regional levels and two local levels) drawn up by Eurostat to provide a single uniform breakdown of territorial units for the production of Community regional statistics, for socio-economic analyses of the regions and for the framing of Community regional policies. 2 Rural and urban regions are defined by the OECD (1996) as follows: (1) in a mainly rural area more than 50% of the population inhabit rural municipalities; (2) in an area with essentially rural features between 15% and 50% of the population live in rural municipalities and (3) in mainly urban areas fewer than 15% of the population live in rural municipalities. A rural municipality is classified as such if it has a population density of fewer than 150 persons per square kilometre. The idea of 'rural' also includes municipalities with fewer than 5,000 inhabitants (Lanjouw and Lanjouw, 1997).
3

comprised of less favoured and more favoured areas, within which 1100 households were selected in Romania. The survey focused on 4 types of households, each represented by a quarter of the total sample size: • Full-time farm household • Part-time with dependent/wage employment • Part-time with self-employment • Non-farm household In order to ensure that there was consistency in the approach and methodology in the different field sites where micro-level data were collected, and to ensure that the micro-level data collection and the modelling work is well-integrated, NRI organized in-country meetings and workshops with relevant research and government agencies.
4

2 Country background More than 45% of Romania’s population lives in the rural environment, in localities known as “communes”. A commune is made up of several small villages, but there are also communes that consist of a single larger village. The rural area in Romania is considered to be the administrative territory of the 2,685rural communes in the country. The past communist regime left an unfortunate inheritance in the rural area of vast mono-agricultural areas with a dilapidated infrastructure and with many villages deprived of elementary conditions for a decent living (e.g., potable water, electricity etc.). 2.1 Romanian Macroeconomic and Agricultural Sector Developments In 2000, the year in which survey respondents reported, Gross Domestic Product (GDP) increased by 1.8 per cent, together with a decline in the rate of inflation compared to 1999. With GDP growth of 5.3% and 3.5% for 2001 and 2002, these may be the first spring shoots of a long awaited economic recovery in Romania (EBRD, 2002). The value of services in 2000 was 92.4% of its 1999 value. The rate of unemployment in 2000 was 10.5% and for 2001 was down to 8.6%. Public debt service was 6.5% of GDP for 1999 (see Table 1). Despite these generally improving conditions, there remains tremendous demand for adequate poverty alleviation programmes and policies, particularly in rural areas. Also, with the current slowdown in the world economy, it is possible that a further deterioration of living standards and increased poverty (in the short run) could occur. While the decline in the rate of inflation was a positive development, a rate of 30.2% for 2000 was well above the average for most transition countries (EBRD, 2002). Government borrowing remains high, with budgets inflated by redundancy payments to workers dismissed from loss-making state-owned enterprises (SOE). During the period 1996-2002, the government has managed to reduce the budget deficit from 4.0% of GDP to 3.0%. Despite significant worsening of the terms of trade for agriculture during the period 1999 to 2002, it remains an important sector for the Romanian domestic economy. In 2000 the share of agricultural trade in GDP was 3.5%. Indeed, like most other CEE countries except Albania, agricultural output in Romania has recorded a decline during the transition period. During 1997-2000, its share in GDP fell from 18.8 to 11.4 %. Agricultural output declined by 14.1% in 2000 as compared to 1999 (see Table 1). This had a negative impact on farm incomes whilst urban consumers faced higher meat and milk prices due to world price developments and domestically, a dramatic decline in livestock herds. It also had a disastrous impact on the financial performance of meat, milk and animal processing firms. Some of these firms have ceased production due to the lack of raw materials, others face bankruptcy while a few have recently decided to re-orient their livestock production towards high-export value livestock (e.g. ostriches, see Davidovici, 1998).
5

Table 1. Macroeconomic Indicators 1995 – 2002
1995 1996 1997 1998 1999 2000 2001* 2002*
Percentage change Real GDP Growth 7.1 4.1 -6.1 -7.3 -3.2 1.8 5.3 3.5 Industrial output 9.4 9.9 -5.6 -17.3 -8.8 -3.8 na na Agricultural output 4.5 1 3.4 -7.6 5.5 -14.1 na na Inflation (end of year) 27.8 56.9 151.4 40.6 54.8 40.7 30.2 17.6 In millions of US $ Current account -1,732 -2,811 -2,338 -2,917 -1,296 -1,347 -2,349 -2,065Trade balance -1,685 -2,494 -1,980 -2,625 -1,092 -1,684 -2,969 -2,573Foreign direct investment 417 283 1,267 2,079 1,025 1,051 1,154 1,200 Denominations as indicated GDP per capita (US$) 1,243 1,290 1,395 1,845 1,517 1,636 1,743 na General government balance (% of GDP) -2.6 -4 -4.6 -5.0 -3.5 -3.7 -3.5 -3.0
Share of agriculture in GDP (%) 19.8 19.1 18.8 14.5 13.9 11.4 na na Share of industry in GDP (%) 32.9 34.2 35.6 27.5 27.8 27.6 na na Unemployment (% of labour force) 8.2 6.6 7.4 10.4 11.8 10.5 8.6 na
Source: EBRD Transition Report (2002). Note: * denotes estimate. The share of crop production in total GAO has fluctuated annually during the transition period (between 53% and 63%). The fluctuations were mainly due to weather conditions (especially erratic rainfall), to which Romanian farmers have become more sensitive with the decline in fertiliser and pesticide use and other technologies3. Other factors, which have exacerbated this situation, are changes in input/output prices, the impact of land reform and the collapsing irrigation system. Overall, average crop production in 1998 was at about the same level as in 1989, but changes in the volume of production differed across commodities. The structure of crop production has been strongly influenced by the land reform and the emergence of several million small-scale (largely subsistence) farms. These mainly produce crops with relatively high-labour and low technological requirements. Approximately 70% of the Romanian arable area is cultivated with cereals (mainly wheat, barley, two-row barley, oats and maize). The share of these crops in the arable area is greater in the private sector than in the state sector. In their private farm survey, Davis and Gaburici (1999) found that grains accounted for between 74 - 78% of the arable area, cultivated during the period 1995 - 1997. The predominant crop is wheat, followed by maize. The regional differences are determined by the natural and economic conditions, as well as by the local cultivation techniques. Since 1989, the number of the farms cultivating wheat has grown, whereas those farms growing maize have declined (Davis and Cristoiu, 2001).
3 The major drop in production during 1992 was mainly caused by bad weather, but was reinforced by a fall in the area planted. Good weather conditions contributed to a recovery in crop production in 1995 and 1997. However, this performance has not been sustainable; 2002 was a drought year again.
6

Romanian farmers face significant constraints in maximising the commercial potential of two-row barley, sugar beet and potatoes because of the collapse of the Romanian food processing industry. As a result, some farms have shifted their activity towards the production of fodder for livestock. Thus, the number of farms that produced raw material for breweries, sugar and starch industries has declined sharply since 1999. The main vegetables produced in Romania are melons, tomatoes, cauliflower, root vegetables, garlic and cabbages. Compared to the pre-reform period the area allocated to fruit and grape production has not changed substantially (Davidovici et al, 1998:131). The area sown to vegetables fluctuated, but since 1998 has been around 20% lower than in 1989. Approximately 90% of vegetable production are grown by small household plots and are mainly used for self-consumption and sale on local markets. General problems for fruit producers arise from a lack of finance for the renewal of trees and for purchasing inputs together with a still reduced ability to fulfil the export market requirements. The domestic production of fruits and grapes covers domestic demand whilst wine during the period 1990-1999 has become an important export product to the European Union (EU). Livestock sector production has also fluctuated and in 1998 was around 12% lower than in 1989, with a share in total GAO that varied between 34% and 46% (Davis and Cristoiu, 2001). The declining trend in livestock production in recent years was caused by several factors including: transitional problems due to dissolution of co-operatives specialised in livestock production; poor/obsolete production buildings and equipment; inefficiency of the upstream sector (generating price scissors unfavourable to farmers) and downstream sector (passing its high production costs onto producers and consumers); and the slow adaptation of marketing systems to the new land ownership pattern. In addition, the decline in the size of the herd is a consequence of: a) the uncontrolled cull of animals in the early ‘90s; b) failure of the large industrial-type of livestock production in state farms and their supply-sales network collapse, including the closure of industrial production units of concentrated forages (so called Fabrici de Nutreturi Combinate (FNC) – Factories for Combined Forages); c) redistribution of the land ownership which increased the number of livestock per land unit; d) monopolistic power (at least at the beginning of the 1990s) of state units in the downstream livestock processing and sales chain; e) consumer-protectionist agricultural policies (including low farm-gate price) that penalised livestock producers (see also Davidovici et al., 1998: 25). As a result, livestock numbers have declined and small-scale mainly private farmers have adjusted livestock number to their household consumption needs. At present, the average land area owned by households is around 2.3 hectares. Assuming that such a household includes 3 persons (of which 1.6 on average are economically active), this means about 1.4 hectares per active person. Cultivating this area would typically not fully utilise family labour which implies under-employment for the 10 million of land-using households in Romania. Moreover, the seasonal character of agricultural production, with labour peaks in summer-autumn and troughs in winter accentuates the employment problems experienced in rural areas, resulting in low labour productivity. 2.2 Main issues/problems for the rural economy in Romania The key problems for the rural economy in Romania include the following: • long-term unemployment, low incomes and lack of economic opportunity; • Rising incidence of poverty, social dislocation and crime in rural areas; • High levels of hidden unemployment - and under-employment;
7

• Levels of human capital, in terms of education and skills, are often significantly lower than in urban areas;
• Health and other social services are not adequate; • A whole range of infrastructure components including roads, telecommunications, water
and waste management are in need of upgrading; • A lack of access to suitable rural finance and micro-small to medium sized enterprise
(MSME) credit facilities; and • Little support for business in the form of information and mutual organisation. Rural poverty in Romania is both deepening and growing (Milanovic, 1998). An additional issue related to rural poverty concerns the measurement of rural incomes. Most of the assessments of poverty conducted in the region have been based on monetary indicators. This tends to show that rural incomes are lower than urban averages and peasants are almost universally poor. However, if one considers self-consumption and income in-kind the picture is less clear (see Davis and Gaburici, 1999; Davis, 2002). The ‘new’ rural poor of Romania are sometimes highly educated with work experience. They face a combination of declining job opportunities resulting from the restructuring of former SOEs and a slow influx of private investment into new ventures.
8

3 The Survey The study is based on a stratified sample of 1,101 households selected across rural Romania (see Figure 1). There were three stratification criteria: (i) location of the commune to the closest city (thus a categorisation of peri-urban or rural). Peri-urban communes were defined according to the distance to the closest city (<10 km for cities of 30-100K inhabitants; 10-20 km for cities of 100-200K inhabitants; and 20-30 km for cities of >200K inhabitants); (ii) regional characteristics (8 development regions4), community development5 (poor-rich), depth of poverty; and (iii) whether the area was of low or high economic, natural resource and agricultural potential, i.e. a less favoured area (LFA) or more favoured area (MFA). Four types of households were initially considered: • Type 1: all members occupied full time in agriculture; • Type 2: members occupied in agriculture part-time and part-time dependent activities, • Type 3: members occupied in agriculture part-time and part-time in self-employment
activities; and • Type 4: members who abandoned agriculture for non-farm activities. Type 4 households were accorded greater emphasis in the study because members of these households had abandoned agriculture to take-up full-time non-farm activities. However, an initial random sampling procedure only delivered a few of these households. The initial sample comprised 1005 households. Therefore, we decided to include another 96 type 4 households which were randomly selected in each settlement, as it was very likely that a small number of these households will be represented in the whole sample (see Annex 2: number of households in each commune by type of households). The randomly selected households represented different levels of development, rurality, age profiles and ethnic communities (see Table 2 and Table 3). As shown in Figure 2, one county was selected in each region (North Eastern (NE) – Botosani, South Eastern (SE) – Tulcea, South (S) – Calarasi, South Western (SW) – Dolj, Western (W) – Hunedoara, North Western (NW) – Salaj, Center (C) – Covasna, Bucharest – Ilfov). In each stratum a number of settlements (52) were randomly selected, and in each settlement a voting district was drawn (see Annex 1 for a list of communes included in the sample). Voting districts are administrative units within each community, comprising between 1000-2000 voters (all voters were listed). The number of households was estimated based on the size of the voting districts. The voting districts (52) represent both centres of the communes as well as peripheral villages. Centre-villages are administratively defined as those where the most important local authorities are located (Town Hall, Post Office, etc.). In Romania, each rural settlement may be comprised of one or more villages, but only one is the administrative centre of the commune. Based on the 4 Using National Institute of Statistics from Romania definition. 5 In order to rank communes by the level of development, a statistical index – level98 – developed by Prof. D. Sandu for the World Bank was used. The statistical index is a composed measure of community capital using demographic, human capital, physical infrastructure and regional statistical indicators. Demographic indicators: children delivered by 15-49 y.o. women, village population, % of population between 15-59 y.o., % of population in the village from total commune population; human capital: education stock, population occupied, population occupied in agriculture; physical infrastructure: number of dwellings with running water, number of dwellings with modern construction material, number of dwellings with electricity, regional statistical indicators: distance to the closest city, distance to an European road, position of the village within the commune, out migration, net migration. All these indicators were aggregated in level-98 using factor analysis. (see D. Sandu, Dezvoltare si saracie in satele Romaniei, in Sociologie Romaneasca, 4/1999).
9

estimated number of households in each voting district, a statistical interval was computed, and a random route sampling procedure completed the final households’ selection.6
Figure 2 Map of location of survey sites (shaded areas)
The initial stratification has undergone two modifications: 1. Since the distribution of cases for poor peri-urban and poor-rural was unbalanced, an equal
number of households from poor settlements were distributed across “peri-uban – rural” areas (see Table 2 and Table 3).
2. Since there were no settlements matching criteria such as “rural and rich” (Botosani) and "peri-urban and poor" (Salaj), other neighbouring counties in the same regions were included for selecting these types of communes (Suceava – NE – communes: Dorna Arini and Brosteni, and Cluj – W – communes: Suatu, Ploscos).
6 A random route procedure for sample selection is based on the map of a geographical area covered by a specific population. Households or individuals are selected using a statistical interval computed as the ratio between the total population within the geographical boundaries and the number of units to be selected. In our case the unit of selection was the household and the area was defined as voting districts. The number of households in each voting district was estimated and the statistical interval was then computed prior to selection.
10

Table 2. Sample sizes by region, development level, ethnicity and rurality (counts) Region Development levela Ethnicityb 'Rurality' Low High Hungarian (peri-)urban rural Northeast 149 78 0 111 116 Southeast 87 48 0 63 72 South 67 151 0 110 108 Southwest 76 70 0 81 65 West 16 70 0 46 40 Northwest 66 82 30 80 68 Centre 29 85 91 55 59 Bucharest 0 27 0 27 0 TOTAL 490 611 121 573 528
Notes: a. Development level: In order to rank communes by the level of development, a statistical index – level98 – is a composed measure of community capital using demographic, human capital, physical infrastructure and regional statistical indicators. b. Ethnicity was defined as the main language spoken at home. The only non-Romanian group observed in the survey were ethnic Hungarians. Source: survey findings
Table 3. Rurality, ethnicity & household types by regional development level (counts) Regional type Ethnicity Household types Development level (peri-)urban Rural Romanian Hungarian 1 2 3 4 5 Low 236 254 483 7 282 102 31 46 29 High 337 27 497 114 312 198 28 70 3 ALL 573 528 980 121 594 300 59 116 32
Note: Household of 5 types were sampled: 1: household is involved only in agricultural production. 2: household is involved in agricultural production and wage employment. 3: household is involved in agricultural production and independent non-farm enterprise. 4: household is involved in agricultural production, wage employment and independent non-farm enterprise. 5: Other households. Source: survey findings The interviews were conducted with the head of the household (or best informed available member of the household) and lasted around 90 minutes on average. The initial questionnaire was pre-tested on a small number of households (24) and minor changes were made in order to adapt it to the target population. The questionnaires were electronically checked for consistency of data inputting, codification and validation; and 20% of the sample was randomly controlled in the field to ensure consistency of interviews and data recording.
11


Table 4. Description of the regions: general development indicators Regional GDP
Agriculture (bill.Euro)
Regional GDP (bill.Euro)
Regonal GDp.c. (Euro)
Share of agriculture in
Regional GDP
p.c. Poverty rate %
Romania 2,46 13,94 618 17,6% 25,32 North East 0,40 1,81 478 22,3% 29,29 Botosani South East 0,40 1,84 625 21,6% 23,52 Tulcea South 0,45 1,94 555 23,4% 25,91 Calarasi South West 0,33 1,41 583 23,5% 21,41 Dolj West 0,26 1,45 697 17,9% 25,66 Hunedoara North West 0,31 1,63 568 19,2% 23,69 Salaj Center 0,26 1,85 695 14,1% 26,7 Covasna Bucharest 0,04 2,00 869 2,0% 24,38 Ilfov
Source: National Institute for Statistic, Annual Yearbook 2001, statistic from July1, 2000. The figures presented in Table 4 show a relatively high level of general economic development (regional Gross Domestic Product (GDP)) for W, C and Bucharest regions and low levels for NE and SW regions. The contribution of agricultural production to total regional GDP is higher for NE, S, SW, W and NW regions; but lower for the C region and Bucharest. The per capita poverty levels are highest in the NE region and lowest in the SW region. In terms of rural community poverty levels the NE and SE regions are the poorest.
Table 5. Description of the regions: basic demographic data Total population Population % of
RomaniaRural
population% of rural
population of Romania
Infant mortality
rate ‰
Infant mortality
rate rural‰
Romania 22435205 100,0% 10190607 100,0% 18,6 20,8North East 3823492 17,0% 2159807 21,2% 23 24,3Botosani 463808 2,1% 281435 2,8% 26,8 29,8South East 2934319 13,1% 1267980 12,4% 19,1 21,4Tulcea 262692 1,2% 135032 1,3% 17 19,1South 3465468 15,4% 2024380 19,9% 19,3 20,3Calarasi 331843 1,5% 201655 2,0% 22 22,6South West 2399831 10,7% 1311720 12,9% 17,1 17,9Dolj 744243 3,3% 360069 3,5% 20,9 20,4West 2041129 9,1% 772523 7,6% 18,3 19,4Hunedoara 523073 2,3% 125664 1,2% 15,1 10,6North West 2844042 12,7% 1349443 13,2% 17,3 20,4Salaj 256307 1,1% 148600 1,5% 16 16,6Center 2642242 11,8% 1048672 10,3% 16,1 17,8Covasna 230537 1,0% 110544 1,1% 13,8 15,7Bucharest 2284682 10,2% 256082 2,5% 12,9 12,8Ilfov 275482 1,2% 256082 2,5% 14,4 12,8Source: National Institute for Statistic, Annual Yearbook 2001, statistic from July 1,2000
11

The regions have similar population sizes. S, NE, W and Bucharest are the most populous. Dolj is the surveyed county with the largest population. SE, W and B are the regions with the highest level of urbanization, but each of these has its own specific characteristics. Bucharest region includes the national capital, SE region has a high level of urbanization because of the industrial importance of Constanta County,7 and W region also includes Timis (a large urban and trading centre) and the urban communities located within the Valea Jiului mining zone. Infant mortality rates are above the national average in NE, S and SE regions, although Tulcea and Botosani are counties with a higher than average level of infant mortality for these regions. Also Dolj (which is a very poor county) has a high infant mortality rate, even though the SW region is around the national average. The highest level of infant mortality is found in the rural communities of the NE, SE and S. In terms of the level of community development, those three regions (NE, SE and S) are acknowledged as the poorest ones in Romania. The only exception concerns the SE region which includes Constanta district. It differs from the other SE region counties in terms of the level of urbanization and development.
Table 6. Description of the regions: labour & occupational status Pop Occupied
in Agriculture (,000)
Pop. Occ Agric % of Romania
Active occupied %
Inactive % Unemployment rate%
Salaries (euro)
Salaries % of Romania
Romania 3522,5 100,0% 10,5 118 100%North East 710,3 20,2% 50,6 45,7 13,2 102 87%Botosani 108,5 3,1% 16,7 94 80%South East 480,2 13,6% 45,6 50,1 11,4 120 101%Tulcea 42,5 1,2% 11,4 104 88%South 621,5 17,6% 49,3 46,7 10,4 114 97%Calarasi 72,1 2,0% 11,9 92 78%South West 484 13,7% 54 42,8 11,6 125 106%Dolj 157,9 4,5% 12,3 121 103%West 288,4 8,2% 46,7 50 10,4 113 95%Hunedoara 58,7 1,7% 16,4 131 111%North West 530,6 15,1% 47,5 48,8 8,5 105 89%Salaj 50,1 1,4% 10 102 87%Center 353,5 10,0% 44 52,5 10,3 109 92%Covasna 34 1,0% 11,2 99 84%Bucharest 54 1,5% 44 52,7 5,8 152 129%Ilfov 49,3 1,4% 6,2 136 116%Source: National Institute for Statistic, Annual Yearbook 2001, statistic from July 1,2000 Table 6 shows the labour market characteristics of the surveyed regions and counties. The highest proportion of population occupied in agriculture is found in the NE region; and the lowest in the West and Bucharest (due to a high rate of urbanization). However, at the county level, the highest proportion of the population occupied in agriculture is in Dolj (SW region), even if the figures are lower for the region as a whole. The proportion of the active population is below the national average for the Bucharest and C regions, while the highest is in the NE and SW regions of the country. The highest rates of unemployment are reported in NE, S, NW and Bucharest regions.
7 Constanta County has a capital with the same name. The capital is one of the largest cities in Romania, a centre of tourism, industry, and also the biggest harbour in Romania.
12

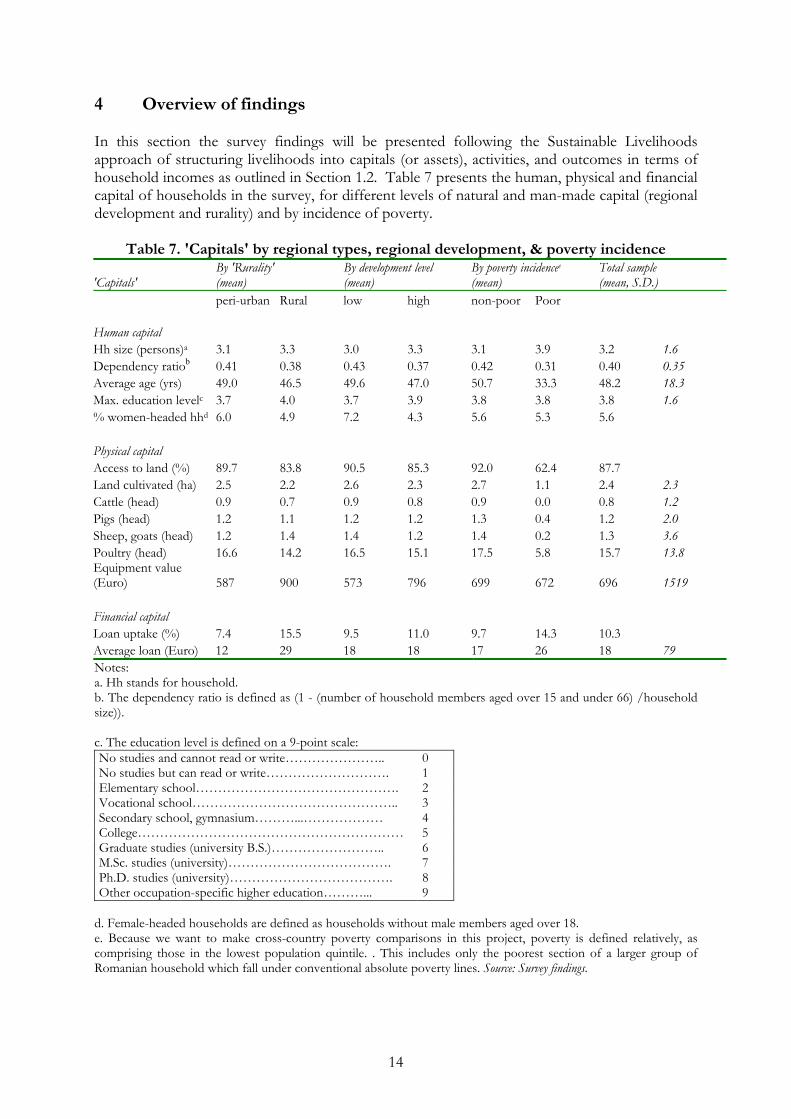
4 Overview of findings In this section the survey findings will be presented following the Sustainable Livelihoods approach of structuring livelihoods into capitals (or assets), activities, and outcomes in terms of household incomes as outlined in Section 1.2. Table 7 presents the human, physical and financial capital of households in the survey, for different levels of natural and man-made capital (regional development and rurality) and by incidence of poverty.
Table 7. 'Capitals' by regional types, regional development, & poverty incidence
'Capitals' By 'Rurality' (mean)
By development level (mean)
By poverty incidencee
(mean) Total sample (mean, S.D.)
peri-urban Rural low high non-poor Poor Human capital Hh size (persons)a 3.1 3.3 3.0 3.3 3.1 3.9 3.2 1.6 Dependency ratiob 0.41 0.38 0.43 0.37 0.42 0.31 0.40 0.35 Average age (yrs) 49.0 46.5 49.6 47.0 50.7 33.3 48.2 18.3 Max. education levelc 3.7 4.0 3.7 3.9 3.8 3.8 3.8 1.6 % women-headed hhd 6.0 4.9 7.2 4.3 5.6 5.3 5.6 Physical capital Access to land (%) 89.7 83.8 90.5 85.3 92.0 62.4 87.7 Land cultivated (ha) 2.5 2.2 2.6 2.3 2.7 1.1 2.4 2.3 Cattle (head) 0.9 0.7 0.9 0.8 0.9 0.0 0.8 1.2 Pigs (head) 1.2 1.1 1.2 1.2 1.3 0.4 1.2 2.0 Sheep, goats (head) 1.2 1.4 1.4 1.2 1.4 0.2 1.3 3.6 Poultry (head) 16.6 14.2 16.5 15.1 17.5 5.8 15.7 13.8 Equipment value (Euro) 587 900 573 796 699 672 696 1519 Financial capital Loan uptake (%) 7.4 15.5 9.5 11.0 9.7 14.3 10.3 Average loan (Euro) 12 29 18 18 17 26 18 79 Notes: a. Hh stands for household. b. The dependency ratio is defined as (1 - (number of household members aged over 15 and under 66) /household size)). c. The education level is defined on a 9-point scale: No studies and cannot read or write………………….. 0 No studies but can read or write………………………. 1 Elementary school………………………………………. 2 Vocational school……………………………………….. 3 Secondary school, gymnasium………...……………… 4 College…………………………………………………… 5 Graduate studies (university B.S.)…………………….. 6 M.Sc. studies (university)………………………………. 7 Ph.D. studies (university)………………………………. 8 Other occupation-specific higher education………... 9
d. Female-headed households are defined as households without male members aged over 18. e. Because we want to make cross-country poverty comparisons in this project, poverty is defined relatively, as comprising those in the lowest population quintile. . This includes only the poorest section of a larger group of Romanian household which fall under conventional absolute poverty lines. Source: Survey findings.
14

As to human capital, Table 7 shows that compared to peri-urban households, rural households are slightly smaller and younger, with more working-age household members and higher education, and are less often without men. Poorly developed regions are typically characterized by smaller households with more dependents and slightly older household members, which are much more often female-headed. Poor households are found to be large and young, but not with lower education levels or more often without men. The data show that access to land is widespread, while landlessness is common among a large minority of the poorest households. Also areas used do not vary much over peri-urban and rural areas or with levels of economic development. Poor households have access to on average less than half the average used land area, implying that land owning poor households have smaller areas than landowning non-poor households. Absence of animals is another characteristic of poor households. Interestingly, livestock is more common in peri-urban than in rural areas. While nearly all households where found to have equipment of some sort, mostly used in agricultural production, the value of these assets varies greatly. Unsurprisingly, it appears that households in more rural and higher developed areas have more productive assets; but income poverty is not associated with a lack of ownership of equipment. Loan uptake and the amount of (formal and informal) credit taken in 2001 follow a similar pattern: larger in more rural and higher developed areas, while poor households borrow more and more often than the non-poor. This suggests that rural retail credit markets are used to satisfy household consumption needs rather than investments. These findings should however be interpreted with caution since standard deviations of loan data are large. This is also more generally true of all differences in means over groups in Table 7 above, and Table 8 below. In order to preserve legibility, no results of t-tests for statistical significance of differences are included, and the figures should be taken as indicative rather than the basis for definite conclusions. An advanced statistical analysis follows below. Table 8 displays indicators for households' involvement in economic activities, again categorized by different levels of regional development and rurality and by incidence of poverty. In line with widespread access to land, virtually all non-poor households and three quarters of the poor produce food. A third of all households have an additional on-farm activity, such as food processing or renting out machinery and buildings, with little variation in this incidence between rural and peri-urban areas or with levels of regional development. However, poor households have such activities much less often. A tenth of households’ engage in non-farm enterprise, mainly in services; the poor more often than the non-poor. This may suggest that operating a non-farm enterprise represents a distress-push strategy that may provide a refuge from deeper destitution. The same is true for wage employment. Migration labour, in contrast, is more common between the non-poor than the poor. It appears that non-poor households prefer to concentrate more on farming because they can afford to do so; while poor households access non-agricultural earned income more often, plausibly out of need rather than opportunity. These suggestions will be more rigorously investigated below. Labour allocation figures in Table 8 can be interpreted in the light of both land allocation patterns and involvement in agriculture. They show that poor households, even though they are larger and with more active household members, supply only half the amount of labour to agricultural production of non-poor households. This must be accounted for by greater landlessness and smaller holdings among those who have land. Interestingly, members of poor
15

households do not on average spend much more time away from home in migration labour, even though the incidence of this activity is clearly larger among them. This suggests that migration for the poor is more often of short duration, such as seasonal migration to urban areas. Typically, these are also the less remunerative sources of remittances.
Table 8. Economic Activity Indicators By Region, Development Level, And Poverty
Incidence
Rurality (means)
Regional development (means)
income poverty (means)
Total sample (mean, S.D.)
Peri-urban Rural Low High non-poor poor N 1101 Incidence of income from …(%) Agriculture 93 92 94 92 96 75 93 Other farm-based 28 38 29 33 35 13 31 Non-farm enterprise 6 15 6 11 8 11 9 Wage employment 29 37 24 38 31 37 32 Migration labour 7 8 8 7 8 2 7 Social transfers 88 87 88 88 91 68 88 Labour allocation (hours per year per household) Agriculture 3,068 2,852 3,388 2,668 3,232 1,612 2,993 2,600 Wage employment 827 1,282 695 1,222 952 1,170 984 1,712 Migration labour 170 418 214 289 253 267 255 792 Non-farm enterprise 274 629 257 511 381 489 397 1,429 Share of household income from different sources (%) Agriculturea 57 54 62 51 58 37 56 Other farm-based 1 3 2 2 2 1 2 Non-farm enterprise 0 1 0 1 1 2 1 Wage employment 4 4 4 5 3 18 4 Migration labourb 1 2 1 2 2 1 2 Social transfers 36 35 31 39 35 42 35 # Income sources 2.5 2.8 2.5 2.6 2.5 2.9 2.6 2.0 Diversity indexc 0.31 0.34 0.31 0.33 0.33 0.21 0.32 0.18
Notes: a. Agricultural income is calculated on the basis of reported output levels valued based on price data collected in a separate farm survey. Annual agricultural income is the difference between these revenues and the sum of reported variable costs and 10 % nominal depreciation of the asset stock. Agricultural income includes both marketed and non-marketed produce, and can take negative values. b. Income from migration includes remittances in money, food, and other goods sent by household members resident in other parts of the country or abroad. c. Diversity of income is measured as 1 - Σ(income share j)2 , with j=1,2,…,i. With one source of income, the index equals zero, approaching 1as i increases. It is based on non-negative incomes. Source: Survey findings Regionally, it is worth noting that peri-urban households do not spend less time in agriculture than rural households, which might be related to their larger specialization in labour-intensive products grown in garden plots, such as fruit and vegetables. Wage employment appears to be concentrated more in rural than in peri-urban areas. Still, rural households also migrate more
16
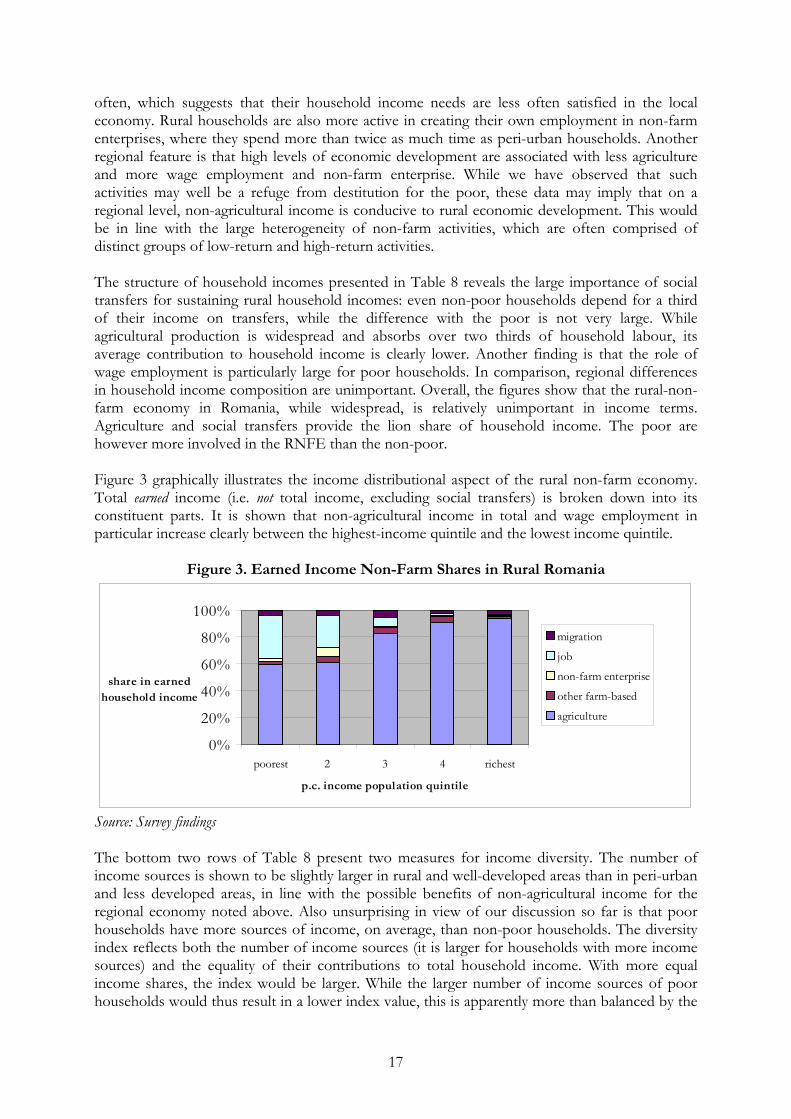
often, which suggests that their household income needs are less often satisfied in the local economy. Rural households are also more active in creating their own employment in non-farm enterprises, where they spend more than twice as much time as peri-urban households. Another regional feature is that high levels of economic development are associated with less agriculture and more wage employment and non-farm enterprise. While we have observed that such activities may well be a refuge from destitution for the poor, these data may imply that on a regional level, non-agricultural income is conducive to rural economic development. This would be in line with the large heterogeneity of non-farm activities, which are often comprised of distinct groups of low-return and high-return activities. The structure of household incomes presented in Table 8 reveals the large importance of social transfers for sustaining rural household incomes: even non-poor households depend for a third of their income on transfers, while the difference with the poor is not very large. While agricultural production is widespread and absorbs over two thirds of household labour, its average contribution to household income is clearly lower. Another finding is that the role of wage employment is particularly large for poor households. In comparison, regional differences in household income composition are unimportant. Overall, the figures show that the rural-non-farm economy in Romania, while widespread, is relatively unimportant in income terms. Agriculture and social transfers provide the lion share of household income. The poor are however more involved in the RNFE than the non-poor. Figure 3 graphically illustrates the income distributional aspect of the rural non-farm economy. Total earned income (i.e. not total income, excluding social transfers) is broken down into its constituent parts. It is shown that non-agricultural income in total and wage employment in particular increase clearly between the highest-income quintile and the lowest income quintile.
Figure 3. Earned Income Non-Farm Shares in Rural Romania
0%
20%
40%
60%
80%
100%
poorest 2 3 4 richest
p.c. income population quintile
share in earned household income
migration
job
non-farm enterprise
other farm-based
agriculture
Source: Survey findings The bottom two rows of Table 8 present two measures for income diversity. The number of income sources is shown to be slightly larger in rural and well-developed areas than in peri-urban and less developed areas, in line with the possible benefits of non-agricultural income for the regional economy noted above. Also unsurprising in view of our discussion so far is that poor households have more sources of income, on average, than non-poor households. The diversity index reflects both the number of income sources (it is larger for households with more income sources) and the equality of their contributions to total household income. With more equal income shares, the index would be larger. While the larger number of income sources of poor households would thus result in a lower index value, this is apparently more than balanced by the
17

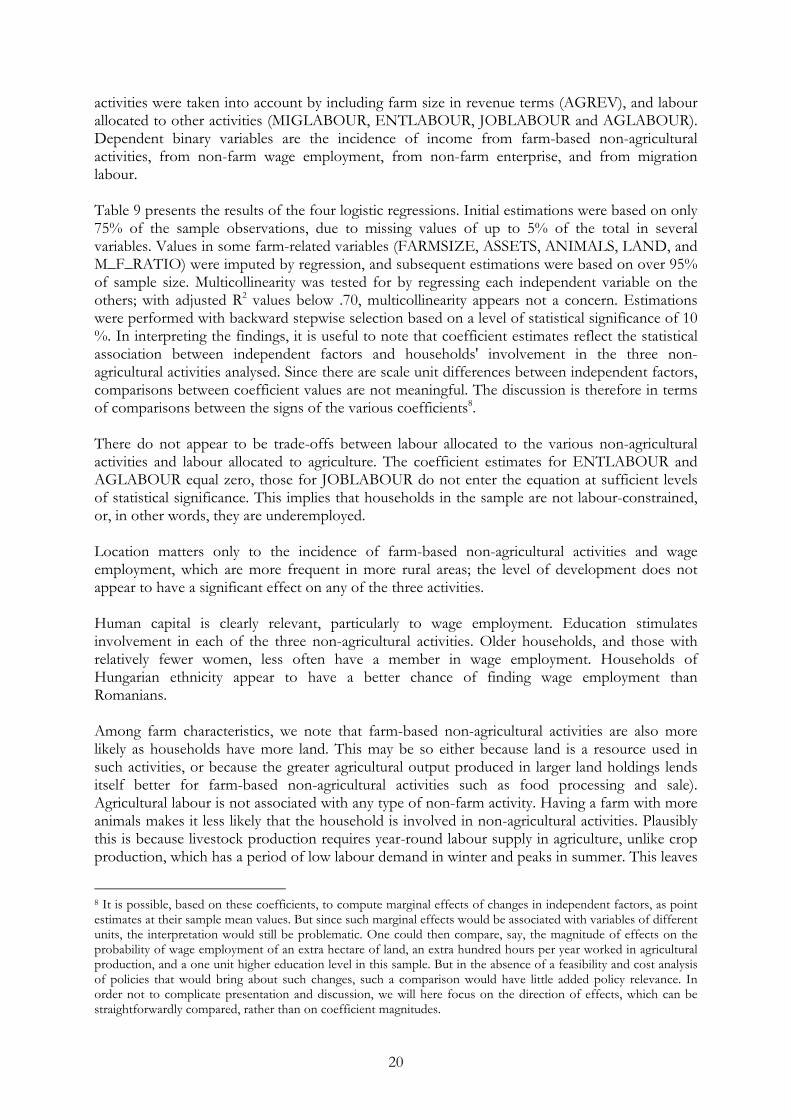
larger differences between the levels of those incomes. They typically depend more heavily on one source than the non-poor, and are thus more vulnerable to changes in income sources. Figure 4 provides an impression of the activities found within the RNFE, as reported for non-farm enterprises and wage employment (no such information was reported for migration labour). Small-scale services (e.g. tourism, communications, restaurants, health care, sales, tailoring, security services, car repairs) are most important, particularly for enterprises. The state sector appears to play a large role in rural employment, by employing teachers, administrators, and other public service workers.
Figure 4. Sectoral composition of the RNFE in Romania
0%20%40%60%80%
100%
non-farm enterprise
wage employment
sector incidence
Unspecified
Industry
Other Services
State Sector,professionsTrade
Source: survey findings
18

5 Analysis: assets, activities, and poverty The previous section introduced the building blocks of rural households' livelihoods, and the distribution of these over regions and between poor and non-poor households. The patterns observed in Table 7 and Table 8 suggest some inferences on the nature of the rural non-farm economy. These will now be taken up in a more comprehensive analysis. We will ask two questions. First, what are the determinants of households' involvement in the rural non-farm economy? Second, how, if at all, do rural non-farm activities contribute to poverty alleviation? It is useful to briefly set out some methodological decisions we made in addressing these questions. A first issue is to decide how to measure involvement in the RNFE. A number of candidates can be suggested:
(a) Involvement as a binary (yes/no) variable, as indicated by deriving income from, or allocating labour to, non-agricultural activities;
(b) income derived from non-agricultural activities, either in money units or as a share in total income;
(c) labour allocated to non-agricultural activities, either in time units or as a share in total household labour time.
Agricultural incomes can be negative since they are calculated by subtracting costs from revenues, and in these cases income shares cannot be calculated. This would exclude close to a fifth of the sample, with a bias towards excluding poor household (of 183 poor households, 135 have non-negative agricultural incomes). This would be a disadvantage of using income shares. When choosing between labour time and income as measures of the extent of involvement, it is useful to note that this analysis aims to provide guidance to policies fostering the economic benefits to rural households from participating in the rural non-farm economy. We are not primarily interested in providing advice on how to bring households to allocate more time to rural non-farm activities. The two measures will largely, but not completely overlap. Gainful employment mostly, but not always, brings income (income can occasionally be zero). We therefore selected as the binary variable the incidence of income from specific non-agricultural activities. A further methodological choice is whether to use a binary of continuous measure for non-agricultural income (options (a) or (b) above). The latter is more informative since it reflects not only participation itself but also the extent in income terms. Exploration of this option, however, shows that the data better allow us to estimate with some significance participation in non-agricultural activities, but not its extent, as measured in a continuous income variable. Hence option (a) above was selected. The logistic specification, appropriate for binary dependent variables, was then employed (the 'probit' specification yielded very similar results). The variables reflecting natural, human, physical, and financial capitals, presented in Table 7 and Table 8, were used as independents. Locational variables included dummies for the level of development and for rural or peri-urban location (DEVELOPED and RURAL). Independent variables representing human capital included ethnicity (ROMANIAN), household size (HHSIZE), dependency ratio and male/female ratios (DEPRATIO and M_F_RATIO), average age (AGE), highest level of education (MAXEDU) and a dummy denoting households without adult men (WOMENHEAD). Variables representing wealth included the area of land (LAND), the value of equipment (ASSETS), the number of livestock (ANIMALS) and amount of credit taken up in 2001 (LOAN). Possible synergies or trade-offs between agricultural and other
19
activities were taken into account by including farm size in revenue terms (AGREV), and labour allocated to other activities (MIGLABOUR, ENTLABOUR, JOBLABOUR and AGLABOUR). Dependent binary variables are the incidence of income from farm-based non-agricultural activities, from non-farm wage employment, from non-farm enterprise, and from migration labour. Table 9 presents the results of the four logistic regressions. Initial estimations were based on only 75% of the sample observations, due to missing values of up to 5% of the total in several variables. Values in some farm-related variables (FARMSIZE, ASSETS, ANIMALS, LAND, and M_F_RATIO) were imputed by regression, and subsequent estimations were based on over 95% of sample size. Multicollinearity was tested for by regressing each independent variable on the others; with adjusted R2 values below .70, multicollinearity appears not a concern. Estimations were performed with backward stepwise selection based on a level of statistical significance of 10 %. In interpreting the findings, it is useful to note that coefficient estimates reflect the statistical association between independent factors and households' involvement in the three non-agricultural activities analysed. Since there are scale unit differences between independent factors, comparisons between coefficient values are not meaningful. The discussion is therefore in terms of comparisons between the signs of the various coefficients8. There do not appear to be trade-offs between labour allocated to the various non-agricultural activities and labour allocated to agriculture. The coefficient estimates for ENTLABOUR and AGLABOUR equal zero, those for JOBLABOUR do not enter the equation at sufficient levels of statistical significance. This implies that households in the sample are not labour-constrained, or, in other words, they are underemployed. Location matters only to the incidence of farm-based non-agricultural activities and wage employment, which are more frequent in more rural areas; the level of development does not appear to have a significant effect on any of the three activities. Human capital is clearly relevant, particularly to wage employment. Education stimulates involvement in each of the three non-agricultural activities. Older households, and those with relatively fewer women, less often have a member in wage employment. Households of Hungarian ethnicity appear to have a better chance of finding wage employment than Romanians. Among farm characteristics, we note that farm-based non-agricultural activities are also more likely as households have more land. This may be so either because land is a resource used in such activities, or because the greater agricultural output produced in larger land holdings lends itself better for farm-based non-agricultural activities such as food processing and sale). Agricultural labour is not associated with any type of non-farm activity. Having a farm with more animals makes it less likely that the household is involved in non-agricultural activities. Plausibly this is because livestock production requires year-round labour supply in agriculture, unlike crop production, which has a period of low labour demand in winter and peaks in summer. This leaves
8 It is possible, based on these coefficients, to compute marginal effects of changes in independent factors, as point estimates at their sample mean values. But since such marginal effects would be associated with variables of different units, the interpretation would still be problematic. One could then compare, say, the magnitude of effects on the probability of wage employment of an extra hectare of land, an extra hundred hours per year worked in agricultural production, and a one unit higher education level in this sample. But in the absence of a feasibility and cost analysis of policies that would bring about such changes, such a comparison would have little added policy relevance. In order not to complicate presentation and discussion, we will here focus on the direction of effects, which can be straightforwardly compared, rather than on coefficient magnitudes.
20

less room for taking up employment or developing non-agricultural activities in livestock-orientated farms.
Table 9 Factors in households’ involvement in non-agricultural activities independent variables: coefficient estimates and standard
errors Regression statistics
farm-based non-agricultural activities
ASSETS 0.000 *** 0.000 Number of obs 1,075 ENTLABOUR 0.000 ** 0.000 LR chi2(5) 103.60 LAND 0.197 *** 0.031 Prob > chi2 0.000 MAXEDU 0.143 *** 0.042 Pseudo R2 0.0695 RURAL 0.499 *** 0.129 Log likelihood -692.995 CONSTANT -1.439 *** 0.194
waged employment
AGE -0.021 *** 0.005 AGLABOUR 0.000 *** 0.000 ANIMALS -0.412 *** 0.076 Number of obs 1,081 ASSETS 0.000 *** 0.000 LR chi2(5) 253.66 ENTLABOUR 0.000 ** 0.000 Prob > chi2 0.000 HHSIZE 0.132 ** 0.059 Pseudo R2 0.1718 M_F_RATIO -0.155 * 0.089 Log likelihood -611.312 MAXEDU 0.294 *** 0.049 ROMANIAN -0.471 ** 0.228 CONSTANT 0.102 * 0.483
non-farm enterprise
AGLABOUR 0.000 *** 0.000 Number of obs 1,077 ANIMALS -0.442 *** 0.089 LR chi2(5) 114.06 ASSETS 0.000 *** 0.000 Prob > chi2 0.0000 MAXEDU 0.180 *** 0.045 Pseudo R2 0.0892 CONSTANT -1.262 *** 0.197 Log likelihood -581.995
migration labour AGLABOUR 0.000 *** 0.000 Number of obs 1,079 ANIMALS -0.527 *** 0.096 LR chi2(5) 115.10 ASSETS 0.000 *** 0.000 Prob > chi2 0.000 ENTLABOUR 0.000 *** 0.000 Pseudo R2 0.093 MAXEDU 0.140 *** 0.046 Log likelihood -561.261 CONSTANT -1.347 *** 0.204 Note: *** statistical significance, p < 0.01; ** statistically significance, p < 0.05; * statistically significance , p < 0.10 Source: survey findings and authors’ calculations This brings us to the second analytical question. How, if at all, do rural non-farm activities contribute to poverty alleviation? This possible connection, and its complex nature, has been the rationale for much recent research into the RNFE. We will analyze it by looking at the association between a household’s assets and economic activities and its risk of poverty. The appropriate analysis is again a binary logit regression, where the dependent variable reflects whether (1) or not (0) a household is in poverty, as defined by a per capita income level in the
21
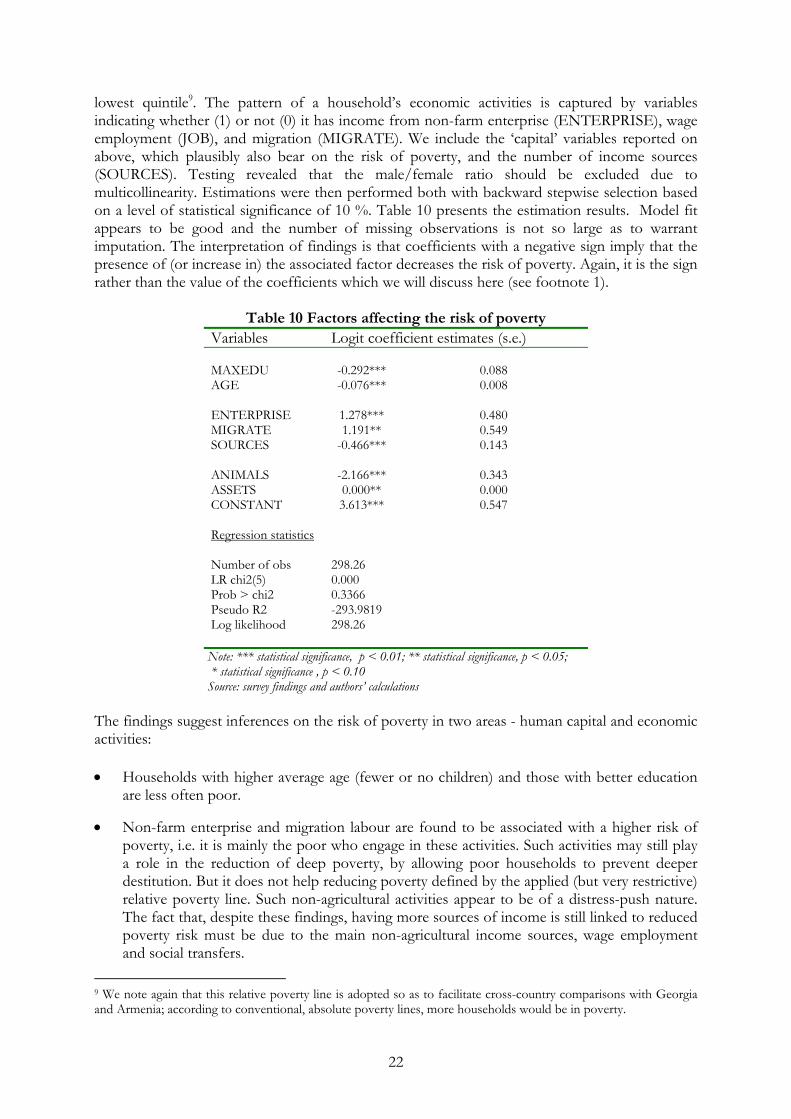
lowest quintile9. The pattern of a household’s economic activities is captured by variables indicating whether (1) or not (0) it has income from non-farm enterprise (ENTERPRISE), wage employment (JOB), and migration (MIGRATE). We include the ‘capital’ variables reported on above, which plausibly also bear on the risk of poverty, and the number of income sources (SOURCES). Testing revealed that the male/female ratio should be excluded due to multicollinearity. Estimations were then performed both with backward stepwise selection based on a level of statistical significance of 10 %. Table 10 presents the estimation results. Model fit appears to be good and the number of missing observations is not so large as to warrant imputation. The interpretation of findings is that coefficients with a negative sign imply that the presence of (or increase in) the associated factor decreases the risk of poverty. Again, it is the sign rather than the value of the coefficients which we will discuss here (see footnote 1).
Table 10 Factors affecting the risk of poverty Variables Logit coefficient estimates (s.e.) MAXEDU -0.292*** 0.088 AGE -0.076*** 0.008 ENTERPRISE 1.278*** 0.480 MIGRATE 1.191** 0.549 SOURCES -0.466*** 0.143 ANIMALS -2.166*** 0.343 ASSETS 0.000** 0.000 CONSTANT 3.613*** 0.547
Regression statistics
Number of obs 298.26 LR chi2(5) 0.000 Prob > chi2 0.3366 Pseudo R2 -293.9819 Log likelihood 298.26
Note: *** statistical significance, p < 0.01; ** statistical significance, p < 0.05; * statistical significance , p < 0.10 Source: survey findings and authors’ calculations
The findings suggest inferences on the risk of poverty in two areas - human capital and economic activities: • Households with higher average age (fewer or no children) and those with better education
are less often poor.
• Non-farm enterprise and migration labour are found to be associated with a higher risk of poverty, i.e. it is mainly the poor who engage in these activities. Such activities may still play a role in the reduction of deep poverty, by allowing poor households to prevent deeper destitution. But it does not help reducing poverty defined by the applied (but very restrictive) relative poverty line. Such non-agricultural activities appear to be of a distress-push nature. The fact that, despite these findings, having more sources of income is still linked to reduced poverty risk must be due to the main non-agricultural income sources, wage employment and social transfers.
9 We note again that this relative poverty line is adopted so as to facilitate cross-country comparisons with Georgia and Armenia; according to conventional, absolute poverty lines, more households would be in poverty.
22

• Households with livestock-orientated farm operations are less at risk of poverty, in line with the generally higher returns to livestock production compared to crop growing.
It is interesting to note that location has not statistically significant relation to the risk of poverty. This is not to say that less developed areas, or more rural areas do not have higher incidences of poverty; rather, that any location-specific effects are incorporated in the other variables. This is desirable in an applied study, since polices cannot influence locality; but they can affect those other factors that may make households, and indeed localities, vulnerable to poverty. Another component of the livelihoods framework that is absent in Table 10 is financial capital. In Romania's rural economy, characterized by high levels of subsistence food production, low levels of savings, and faltering financial markets (if any), it is indeed plausibly that physical and human capitals are the main determinants of income and poverty levels.
23

6 Conclusions and Policy Implications 6.1 The RNFE during transition The radical changes that have occurred in the Romanian economy during the last decade have created new pressures on the country’s rural areas. Increasing industrial unemployment generated an urban-rural migratory flow of the population. The collapse of the agri-industrial processing and industrial sector increased rural unemployment. Since 1991, land reform has also generated new relationships in rural areas, and a massive redistribution of land. However, agriculture continues to function inefficiently, and is unable to provide a decent and sustainable standard of living for most rural inhabitants. Therefore, many donors and multilateral agencies are focusing on the potential of the RNFE and more specifically, non-farm diversification to reduce rural underemployment. Non-farm diversification through the development of the RNFE may also provide a means of increasing rural incomes, assisting the improved utilisation of locally available resources and promoting a better standard of living for rural population through enhanced non-farm employment opportunities and growth. There are several reasons underlying the rural poor decision to diversify: low on-farm incomes or returns on labour, the existence of a surplus of resources (land, capital, labour or knowledge), as a strategy to spread risk, or to smooth the impact of the fluctuations in a unique source of income (e.g. agriculture), falling employment levels during transition, and new opportunities for self-employment The main lessons from research to date suggest that the factors essential for growth of the RNFE in transition economies are improvements in i) levels of education, ii) rural physical infrastructure, iii) access to capital and credit, iv) the land market, and v) the business environment for micro, and small – medium sized enterprises. The involvement of local actors is important, and the heterogeneity of the RNFE must be recognised, with policies adjusted accordingly. In Romania non-farm income accounts for 44% of total household income, the bulk of which is comprised of social transfers. Our findings tentatively suggest that wide access to social transfers among the rural populace may mitigate the need to access or develop non-farm activities in response to distress-push motivations. However, the main reasons for involvement in non-farm activities varied according to the level of different types of capital. Poor households are most involved in non-farm activities due to distress-push factors; better-off, higher-status households tend to be involved due to demand-pull factors. The most important labour market instruments in Romania include social protection policy, minimum salaries, and national and regional programmes for reducing unemployment (independently, or in partnership with national or international bodies or with representatives of civil society). A large proportion of social benefits are also comprised of pensions, since inactive/age-retired persons represent an important share of the Romanian rural population (33% of the adult Romanian population is represented by pensioners). Social protection and welfare benefits appear to be very important sources of non-farm income for both poor and non-poor households. However, social protection policies in Romania are not focused on supporting the poorest people, but aimed at compensating losses suffered by employees, through the social insurance system. Government will certainly need to address this issue, if they are to adequately address rural unemployment and poverty. Romanian government policies to create new jobs in rural areas from the Unemployment Relief Fund (1991-1997) have had a very low impact. In the rural environment, programmes for retraining and re-qualification have also had a low impact. The programmes have failed because
24

they were not adequately targeted at the rural poor, were intermittently funded and in some counties poorly administered (see Davis, 2002). An increase in the informal sector and limited job offers is forcing people to develop self-employed non-farm activities, especially in services and for the non-poor, in agriculture. Long-term unemployment leads to the development of an informal economy. The job market is not transparent and most appointments are not made along meritocratic lines, such as professional competence. Access to employment is often based on a system of contacts and acquaintances (significant social capital), especially for jobs in small rural towns and communes. Personal recommendations are often vital in accessing a job or entering a market as a non-farm entrepreneur. 6.2 Requirements for development of the RNFE In rural areas dominated by poor, subsistence based farming, non-farm enterprise development will to some extent depend on restructuring the small farm sector, increasing agricultural incomes and creating a demand for inputs and services. This will require public sector involvement, support and incentives. Incentives should encourage the development of private associations and co-operatives to begin to add value to farm produce and bring agriculture-industry-trade multiplier effects into the rural sector. Thus, this paper aims to understand the determinants of access to the RNFE, and to identify potential areas for non-farm economic activity, investment and particularly job creation. Thus, on the basis of our survey we now focus on the development of sustainable models of RNF micro-small-medium enterprise and agribusiness development, and employment creation. Here we both propose and consider an approach/model towards improving and developing a pro-poor RNFE in Romania This is aimed at the development of rural service co-operatives and non-agricultural private businesses. (i) Development of rural service co-operatives. This is critical for stimulating the supply of good quality agricultural and social services at affordable prices. Where existing institutions such as agricultural extension services remain we propose that these are built on to facilitate contact and service provision. These institutions (mainly state-owned) are widespread throughout Romania, but remain under-funded and are characterised by poorly motivated staff operating within thin budgets. However, through support from donors/NGOs (e.g. in the context of Sector-Wide Approaches and PRSPs) in partnership with municipal authorities we feel that these institutions, which are already embedded in rural localities, can be effectively utilised to support the economic development of rural regions. We propose a programme of re-training (focusing on the management of projects, business, accounting, information technology and project development skills) allied to investment to provide enterprise development support, professional planning, information, and economic advice, training and employment services to rural communities. These institutions, if properly funded and monitored could also act as useful conduits and facilitators of expressed demand for particular services and investment from the municipal or state authorities. Over time, we would envisage rural people paying either a small fee for these services at the point of delivery, or through locally raised taxation so that the institutions become self-financing. We also recognise that there are some obstacles which would need to be addressed, many of which have been outlined above. For example, rural households and individuals tend to be risk averse and reluctant to make radical changes in their lives. Most face difficulties in accessing
25

MSME start-up capital. Furthermore, existing employment centres are often reluctant to become deeply involved in the process. Similarly, the sustainability of business advisory services beyond donor involvement remains a difficult challenge. (ii) Development of non-agricultural private businesses. This model comprised three main elements, which are also found in other projects, including the UNDP/Government of Bulgaria “Beautiful Bulgaria Project Model” (see Davis, 2002) and DFID Rural Livelihoods Projects in Ukraine, Moldova and Russia (Burachenko et al, 2002; also see Wandschneider and Davis, 2002). Partnership with the local government employment centres. The function of developing alternative employment in rural areas lies with these centres. Although lacking the expertise to provide business start-up training to the unemployed, they have substantial resources for re-training unemployed individuals and supplying new entrepreneurs with start-up capital. The selection of beneficiaries should be based on the business plans individuals or communities present. Training of entrepreneurs. This includes professional up-grading or re-training of those who lack skills to start a business; seminars to inform the unemployed about self-employment opportunities and locally available training and business services; seminars to help aspiring entrepreneurs to refine their business ideas; and courses on how to start and run a successful business. The latter emphasis is on business plan development. Follow-up support to the newly created businesses. Emphasis is given to business registration, access to start-up capital, accounting, and tax payment procedures. Promotion of business clubs. The formation of informal business clubs where entrepreneurs have the opportunity to share experiences and support each other is being encouraged. The project is exploring the possibility of formalising such clubs so that they will eventually play the role of business incubators. We propose a package of projects working in some of the poorest areas of Romania directly related to the non-farm economy. In primarily subsistence agriculture-based regions, for example Dolj County, we propose the following: rural finance support schemes, development of alternative employment in rural areas, and social support infrastructure. These overarching initiatives would complement (subject to further rationalisation of NGO activity in Dolj) the following: training packages for emerging entrepreneurs, support to the handicrafts sector to enhance employment opportunities for women, and promotion of youth employment. These initiatives should address key business development constraints, such as inadequate business management skills and the lack of start-up capital. In addition micro-projects could be implemented to support RNF development, which include micro-credit provision, inward investment concessions, and in areas of natural beauty or conservation (with tourist potential, for example Mures County) the granting of protected area logos, and delivery of tourism training and advice. An encouraging example is a DIFD sponsored pilot project focusing on including activities in Russian National Parks in locals' livelihoods (see Travkina et al (2002). Special efforts must be made to ensure that micro-projects are designed and implemented in an open and transparent way with the participation of local communities. In rural regions with good economic potential, for example Mures, we feel that particular attention should be given to micro, small-medium sized enterprise development in the tourism sector and related activities. This sector is already regarded as central to the sustainable development of areas in and around the mountains and nature reserves in the county. Rather
26

than stressing prohibitions, programmes should encourage residents and investors to develop income and employment generating activities that do not undermine environmental protection objectives while contributing to local development. The relevance of effective public-private partnerships to RNFE development should also be stressed. Partnerships already play an important role in many donor-funded rural livelihood development programmes, even though the process is just starting. For example, DFID rural livelihood programmes in Russia and Ukraine have been experimenting with innovative institutional models where different stakeholders interact and co-operate in service provision for local employment creation and enterprise development (see Wandschneider and Davis, 2002). Stakeholders involved in such programmes include commercial service providers, rural co-operatives, small private firms, NGOs, and central and local government agencies and authorities. These experiences provide much-needed insight into institutional models, which have the potential for replication and scaling-up. Experience shows that sustainability in service provision poses considerable challenges and in many cases may only be achievable if public funding is made available over a considerable time period and key public agencies are actively involved in the process. 6.3 Recommendations for government policy toward the RNFE In section 2.2 of this study, we outlined some of the key constraints on the RNFE and rural development in Romania. In addressing these problems, the role of government is to support the following key factors, which could both increase the attractiveness of rural areas for investment and assist the creation of rural non-farm employment opportunities in Romania: 1. The creation of an “enabling environment”, entailing a low inflation and incentive-oriented
agriculture within a legal system based upon property rights. This task entails accelerating privatisation and land reform, and enforcing legislation on contracts and corrupt commercial behaviour.
2. Development of viable farming structures and consolidation of private farms through the
development of a functional land market. Encouragement of the emergence of agricultural producer and/or marketing associations that would allow better access to local resources, agricultural inputs and services.
3. Encouragement and development of a flexible, customer-oriented marketing network, and
of local industry and food processing that would allow both a better use of local resources and provision of employment for the local labour force (hence, a reduction of qualified labour migration to urban areas or abroad).
4. Development of local infrastructure through improvement of roads, sanitation, access to
health, educational and informational services. Creation of a favourable environment for the emergence of rural organisations at county and commune level, which would facilitate a better flow of information and decentralised decision-making processes.
5. Provision of an appropriate enabling environment so that a sound rural financial network
may be developed. This would provide better access to financial capital for the rural population.
6. Improved sensitivity of rural development programmes to local ethnic, social and cultural
structures.
27
6.4 Future RNFE policy and research questions The following RNFE policy and research questions mainly follow from the findings in this report. These are issues which will need further policy analysis and research as they reflect existing gaps in knowledge and understanding in transition economies. Some are factual and context-specific questions unrelated to central issues, while others are the ‘big’ questions of the RNFE touching on growth, investment and income: 1. Are RNFE activities novel, or the continuation of either old ‘informal sector’ activities, or
activities previously performed by other socialist local enterprises or households? Or are they delivering goods and services that used to be delivered by non-local firms?
2. Are most RNF products and goods confined to the local market, or also exported? Is there a link, as hypothesised, between tradability of goods and services, and capital investment and employment opportunities?
3. Is the RNFE stimulated by labour mobility, or does it mainly depend on local labour? 4. Are RNFE products tradables or non-tradables? Do they thrive in local markets functioning
as Giffen goods (those for which consumption rises as incomes fall)? Is this accompanied by lack of access to credit? Do tradables provide more income, so that trade would indeed be an engine of growth?
5. Have RNF MSMEs started as a result of urban-rural migration, or because of declining profitability on farms? To what extent do local labour markets reflect trade-offs in local employment between farms and RNFE activities, or between urban and RNFE activities?
6. Are locals or recent immigrants more successful in RNF livelihood diversification? Does integration into local society, or in a stratum of it, matter? If it does, this would indicate the importance of networks and social capital.
7. Are there spillovers from successful RNFE? Do these go through production linkages, or through labour linkages? What are the multipliers in the different linkages?
28

References
Burachenko, V., S. Fyodorov, I, Houseman, and M Osipova (2002). DFID Rural Livelihoods Projects in Moldova, Russia, and Ukraine. Paper Presented at the workshop Rural Non-Farm Employment and Development in Transition Economies, March 6-7, University of Greenwich, London.
Davidovici, D., Esanu, C., Firici, C., Gavrilescu, D.S., Iacob, L., Luca, L., Serbanescu, C., (1998) Changes in the Romanian Agricultural and Food Sector. Ministry of Agriculture and Food 1997 Annual report. Agris: Bucharest.
Davis, J (2002) Diversification of income and employment opportunities: RNFE feasibility study in selected areas in Bulgaria and Romania, DFID and UN-FAO/SEUR (unpublished mimeo).
Davis, J. and Bezemer, D. (2003) Key emerging and conceptual issues in the development of the rural non-farm economy in developing countries and transition economies, unpublished mimeo.
Davis, J. and Adriana Cristoiu (2001) Patterns of rural non-farm diversification and employment in Romania: A county level analysis. Forthcoming in NRI Social and Economic Series.
Davis, J. and Angela Gaburici (2001) Non-Farm Employment in Small-Scale Enterprises in Romania: Policy & Development Issues. Forthcoming in NRI Social and Economic Series
Davis J and Gaburici A (1999). The economic activity of private farms in Romania during transition Europe-Asia Studies. Vol. 51 No. 5: 843-869.
Davis, J. and Hare, P.G. (1997). Reforming the Systems of Rural Finance Provision in Romania: Some Options for Privatisation and Change, Quarterly Journal of International Agriculture, Vol. 36 No. 3 July – Sept. 1997.
EBRD (2002). Transition Report 2002: Agriculture and rural transition.
Lanjouw JO and Lanjouw P (1997) The rural non-farm sector: an update. Paper presented at the XXIII International Conference of Agricultural Economists (IAAE) on Food security, diversification and resource management: refocusing the role of agriculture. 10-16 August, Sacramento, USA.
Milanovic, M., (1998) Income, Inequality, and Poverty during the Transition from Planned to Market Economy, World Bank Regional and Sectoral Studies, 1998.
Travkina, M., J. Rudge, and C. Rock (2002) DFID 1999-2002 National Parks Management Strategy Sustainable Livelihoods Component. Paper Presented at the workshop Rural Non-Farm Employment and Development in Transition Economies, March 6-7, University of Greenwuch. London.
Wandschneider, T., and Davis, J.R. (2002) Proceedings from Rural non-farm employment and development in transition economies workshop, March 6th – 7th, 2002, Old Royal Naval College,, University of Greenwich, London.
29

Annex 1 List of communes included in the sample on regions and sub-regions
Region and sub-region Name of the commune NE-PERI-URBAN BUCECEA
GEORGE ENESCU HILISEU-HORIA MIHAI EMINESCU VLADENI
NE-RURAL ALBESTI AVRAMENI LUNCA BROSTENI DORNA-ARINI
SE-PERI-URBAN CEATALCHIOI GRECI LUNCAVITA
SE-RURAL CERNA NICULITEL TOPOLOG
S-PERI-URBAN CUZA VODA MITRENI BELCIUGATELE FRUMUSANI FUNDENI
S-RURAL PERISORU ULMU UNIREA CASCIOARELE VALEA ARGOVEI
SV-PERI-URBAN DIOSTI LEU LIPOVU SOPOT
SV-RURAL BISTRET CARAULA GINGIOVA
V-PERI-URBAN HARAU PESTISU MIC
V-RURAL TOPLITA VORTA
NV-PERI-URBAN PLOSCOS SUATU CREACA MIRSID
NV-RURAL CHIESD GALGAU IP NUSFALAU
C-PERI-URBAN CHICHIS GHIDFALAU VALCELE
C-RURAL BELIN
30

POIAN ZAGON
B-PERI-URBAN DOMNESTI
31

Annex 2 Number of households in each commune by type of households Commune type 1 type 2 type 3 type 4 type 5 Total ALBESTI 12 3 3 0 0 18 AVRAMENI 14 1 3 0 0 18 BUCECEA 10 5 2 0 0 18 GEORGE ENESCU 30 3 1 1 0 35 HILISEU-HORIA 22 7 1 1 1 32 LUNCA 8 8 2 0 0 17 MIHAI EMINESCU 16 2 0 0 0 19 VLADENI 27 6 4 0 0 37 PLOSCOS 17 11 0 0 0 29 SUATU 30 0 0 0 0 30 BELIN 1 0 0 0 4 5 CHICHIS 7 8 2 1 0 17 GHIDFALAU 7 10 1 1 0 19 POIAN 14 5 1 1 0 21 VALCELE 7 0 0 16 24 ZAGON 11 9 2 0 0 22 BISTRET 3 1 0 0 0 5 CARAULA 8 18 1 0 0 27 DIOSTI 16 5 0 0 0 22 GINGIOVA 4 1 0 0 0 5 LEU 18 4 0 0 0 22 LIPOVU 27 6 0 0 0 33 SOPOT 31 6 0 0 0 37 HARAU 11 9 3 0 0 23 PESTISU MIC 10 12 0 1 0 22 TOPLITA 10 13 0 1 0 24 VORTA 13 1 1 0 0 15 CUZA VODA 16 10 1 0 0 27 PERISORU 4 7 0 3 0 14 ULMU 5 0 0 0 5 UNIREA 23 2 0 0 0 26 MITRENI 21 5 1 0 0 28 BELCIUGATELE 28 0 0 1 0 28 CASCIOARELE 12 7 7 0 0 26 DOMNESTI 14 12 0 1 0 27 FRUMUSANI 0 26 0 1 0 27 FUNDENI 5 18 0 1 0 24 VALEA ARGOVEI 3 0 2 0 0 5 CHIESD 3 1 0 0 0 5 CREACA 12 10 2 0 0 24 GALGAU 2 2 0 0 2 5 IP 14 2 0 0 0 17 MIRSID 22 3 0 0 0 25 NUSFALAU 7 9 0 0 3 19 BROSTENI 8 9 3 1 0 20 DORNA-ARINI 13 8 1 0 0 22 CEATALCHIOI 15 11 0 2 0 28 CERNA 2 2 1 1 0 6
0
32

GRECI 13 9 0 0 0 22 LUNCAVITA 11 20 2 0 7 40 NICULITEL 20 7 2 0 0 29 TOPOLOG 3 3 1 0 0 7 Total 652 341 53 22 34 1102
33

Annex 3 Number of individuals in the samples distributed on regions and types non-farm activities
Transport Tourism Services Intellectual professions
Handicrafts Manufacturing
NE 0 1 28 42 8 19 S 11 0 27 26 6 31 Centre 0 0 16 18 5 28 SW 5 0 13 9 8 9 W 7 5 18 10 5 20 Bucharest 1 0 12 3 4 6 NW 6 0 19 19 5 25 SE 3 1 21 26 12 14
33 7 154 153 53 152
33

Enterprise Trade and Finance Group Natural Resources Institute
University of Greenwich at Medway Central Avenue
Chatham Maritime Kent ME4 4TB Unted Kingdom
Tel: +44 (0)1634 883199Fax: +44 (0)1634 883706
Email: [email protected]://www.nri.org/rnfe/index.html
FS 54723ISO 9001