india 1960-2010 : structural change, the rural non-farm sector
TRANSCRIPT

Center on Food Security and the Environment
Stanford Symposium Series on Global Food Policy and
Food Security in the 21st Century
India 1960-2010: Structural Change, the Rural Non-farm Sector,
and the Prospects for Agriculture
Hans P. Binswanger-Mkhize
Adjunct Professor, College of Economics and Management, China Agricultural University, Beijing
May 10, 2012
Acknowledgements: The research in this paper was generously supported by the Centennial Group, Washington DC, and the Syngenta Foundation for Sustainable Agriculture, Basel, Switzerland. The analytical work was also supported by Integrated Research and Development (IRADE), New Delhi, India. The sections in this paper on the structural transformation of the Indian economy are based on Binswanger and D’Souza 2011.
The Center on Food Security and the Environment (FSE) is a joint center between Stanford’s Freeman Spogli Institute for International Studies (FSI) and Stanford Woods Institute for the Environment.
© 2012 Stanford University
1
Abstract
This paper looks at past and likely future agricultural growth and rural poverty reduction in the context of the overall Indian economy. The growth of India’s economy has accelerated sharply since the late 1980s, but agriculture has not followed suit. Rural population and especially the labor force are continuing to rise rapidly. Meanwhile, rural-urban migration remains slow, primarily because the urban sector is not generating large numbers of jobs in labor-intensive manufacturing. Despite a sharply rising labor productivity differential between non-agriculture and agriculture, limited rural-urban migration, and slow agricultural growth, urban-rural consumption, income, and poverty differentials have not been rising. Urban-rural spillovers have become important drivers of the rapidly growing rural non-farm sector—the sector now generates the largest number of jobs in India. Rural non-farm self-employment has become especially dynamic with farm households rapidly diversifying into the sector to increase income. The growth of the rural non-farm sector is a structural transformation of the Indian economy, but it is a stunted one. It generates few jobs at high wages with job security and benefits. It is the failure of the urban economy to create enough jobs, especially in labor-intensive manufacturing, that prevents a more favorable structural transformation of the classic kind. Nevertheless, non-farm sector growth has allowed for accelerated rural income growth, contributed to rural wage growth, and prevented the rural economy from falling dramatically behind the urban economy. The bottling up of labor in rural areas, however, means that farm sizes will continue to decline, agriculture will continue its trend to feminization, and part-time farming will become the dominant farm model. Continued rapid rural income growth depends on continued urban spillovers from accelerated economic growth, and a significant acceleration of agricultural growth based on more rapid productivity and irrigation growth. Such an acceleration is also needed to satisfy the increasing growth in food demand that follows rapid economic growth and fast growth of per capita incomes.

2
India 1960-2010: Structural change, the rural non-farm sector, and the prospects for agriculture
Introduction
All across the industrialized world, prior to rapid economic growth and structural transformation, agriculture accounted for the bulk of the economic output and labor force. Because productivity in the non-agricultural sector was higher than in the agricultural sector, the share of agriculture in total GDP fell short of its share in the labor force. As industrial growth took off, industry became even more productive, and the productivity differential with agriculture increased. As a result of rapid economic growth the share of agriculture in GDP fell much faster than the share of agricultural labor, and the inter-sectoral differential in labor productivity widened. Farm incomes visibly fell behind incomes earned in the rest of the economy. “This lag in real earnings from agriculture is the fundamental cause of the deep political tensions generated by the structural transformation” (Timmer 2009, p6, emphasis in original). During structural transformation employment grows rapidly in the non-agricultural sector and labor is pulled out of agriculture at a speed that depends on the labor intensity of industry and services. Convergence is driven by rapid agricultural productivity growth that allows for a reduction of labor input per unit of output. A turning point is reached when the labor productivity differential between the sectors starts to diminish and the share of labor in agriculture starts to decline faster than its share in output. Korea from the late 1960s is a typical example, as illustrated in Figure 1, that shows the share of agriculture in employment and in GDP, and the difference between them, plotted against GDP per capita. Figure 1: Structural transformation in Korea
Source: Timmer and Akkus 2008.
3
This paper deals with the following topics: It first characterizes the structural transformation in India and China. It then looks at the Indian case in greater detail, first its agricultural growth and productivity growth, and then at employment, unemployment, and wage trends. The next section asks the question why, in the presence of rapid growth of the differential in labor productivity between the non-agricultural sector and the agricultural sector, and in the presence of limited rural-urban migration, has there not been a rising divergence in rates of poverty, and in per capita incomes and consumption? The next section on the rural non-farm sector shows that this is explained by the rapid growth of the rural non-farm sector, especially rural non-farm enterprises of farmers, and associated employment growth. After summarizing the findings on employment and poverty trends across sectors of the economy, the paper shows that the structural transformation in India is a stunted one, in which workers move primarily from the agricultural sector to the rural non-farm sector, rather than to more secure jobs with pension and health benefits in the urban economy. The final section develops a vision for agriculture and rural poverty reduction, and discusses policy implications on how, under the constraints of limited urban labor absorption, rural incomes can nevertheless be increased.
Structural transformation in India and China
Compared to international experience India’s structural transformation has been slow and atypical, mainly on account of a low share of manufacturing in the economy and of its disappointing growth and employment performance. At the same time, the share of the agricultural sector in GDP has declined and the remaining industrial sectors and services have shown growing GDP shares. Absorption of labor in the urban economy has been slow, and rural-urban migration has been far less than could have been expected in a rapidly growing economy. Therefore, the difference between the share of agriculture in the economy and its share in the labor force has widened significantly (Figure 2). At the same time, the accelerating growth of the economy since the 1980s did not lead to an acceleration of the agricultural growth rate. As a consequence of high non-agricultural growth, low agricultural growth, and continued growth of the agricultural labor force, labor productivity in the non-agricultural sector and the agricultural sector has widened at an accelerating rate, and their ratio now stands at over 4.2. These data show that India is still far away from a turning point in its structural transformation, where the shares of agriculture in GDP and in the labor force are starting to converge, and the productivity differential between the non-agricultural and the agricultural sector starts to narrow.

4
Figure 2: Structural transformation of the Indian economy, 1961-2010
Source: Binswanger-Mkhize and d’Souza 2011a.
0
10
20
30
40
50
60
70
80
1960
1963
1966
1969
1972
1975
1978
1981
1984
1987
1990
1993
1996
1999
2002
2005
2008
Year
(a) Share of agriculture in labour force and in GDP
Share of labor force
Share of Ag. In GDp
0
500
1,000
1,500
2,000
2,500
3,000
3,500
1961
1963
1965
1967
1969
1971
1973
1975
1977
1979
1981
1983
1985
1987
1989
1991
1993
1995
1997
1999
2001
2003
2005
2007
2009
(b) Agricultural and non-‐agricultural output per worker
Ag output per ag worker
Non Ag. Output per worker
In p
erce
ntag
e
Year
US
dolla
rs
5
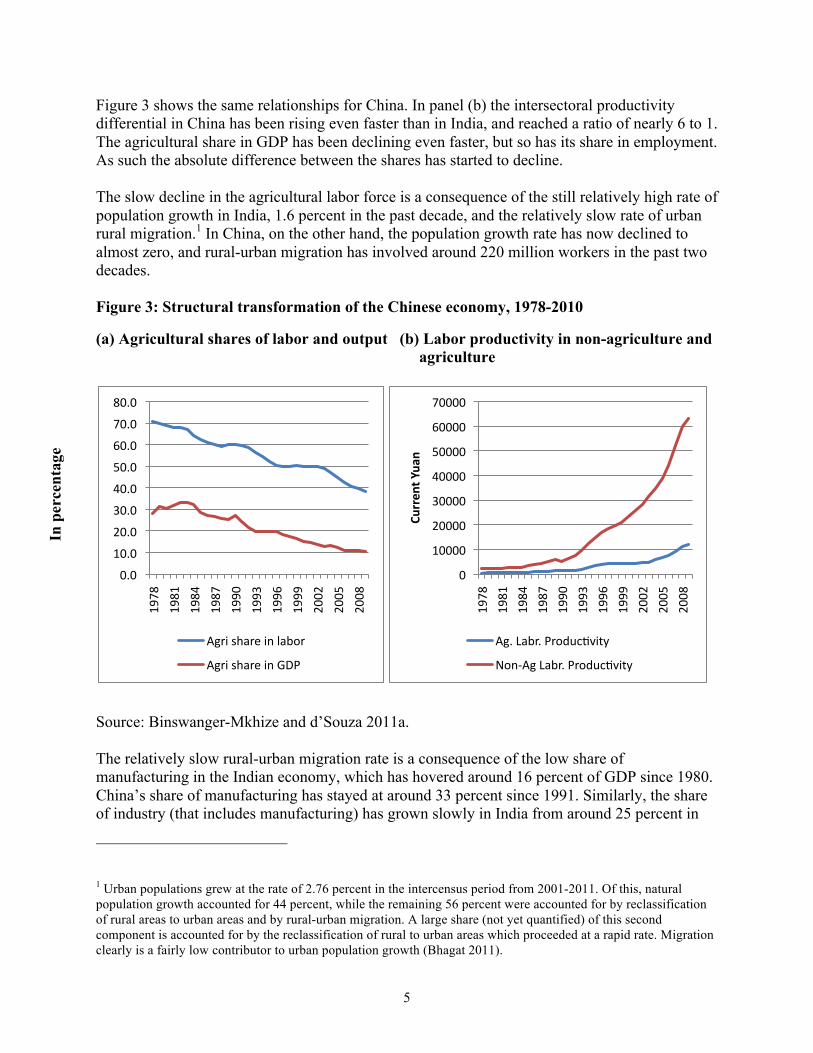
Figure 3 shows the same relationships for China. In panel (b) the intersectoral productivity differential in China has been rising even faster than in India, and reached a ratio of nearly 6 to 1. The agricultural share in GDP has been declining even faster, but so has its share in employment. As such the absolute difference between the shares has started to decline. The slow decline in the agricultural labor force is a consequence of the still relatively high rate of population growth in India, 1.6 percent in the past decade, and the relatively slow rate of urban rural migration.1 In China, on the other hand, the population growth rate has now declined to almost zero, and rural-urban migration has involved around 220 million workers in the past two decades. Figure 3: Structural transformation of the Chinese economy, 1978-2010
(a) Agricultural shares of labor and output (b) Labor productivity in non-agriculture and agriculture
Source: Binswanger-Mkhize and d’Souza 2011a. The relatively slow rural-urban migration rate is a consequence of the low share of manufacturing in the Indian economy, which has hovered around 16 percent of GDP since 1980. China’s share of manufacturing has stayed at around 33 percent since 1991. Similarly, the share of industry (that includes manufacturing) has grown slowly in India from around 25 percent in
1 Urban populations grew at the rate of 2.76 percent in the intercensus period from 2001-2011. Of this, natural population growth accounted for 44 percent, while the remaining 56 percent were accounted for by reclassification of rural areas to urban areas and by rural-urban migration. A large share (not yet quantified) of this second component is accounted for by the reclassification of rural to urban areas which proceeded at a rapid rate. Migration clearly is a fairly low contributor to urban population growth (Bhagat 2011).
0.0
10.0
20.0
30.0
40.0
50.0
60.0
70.0
80.0
1978
1981
1984
1987
1990
1993
1996
1999
2002
2005
2008
Agri share in labor
Agri share in GDP
0
10000
20000
30000
40000
50000
60000
70000
1978
1981
1984
1987
1990
1993
1996
1999
2002
2005
2008
Curren
t Yua
n
Ag. Labr. ProducAvity
Non-‐Ag Labr. ProducAvity
In p
erce
ntag
e

6
1989 to around 28 pecent today, while it has been around 46 percent in China ever since 1993. As a consequence, the GDP share of services has grown to well over 50 percent in India, more than 20 percent above the industry share, while in China it remains below the industry share at around 43 percent (Binswanger and d’Souza 2011a). The poor development of industry in India, and of labor intensive manufacturing in particular, has led to adverse urban employment consequences. Figure 4: Share of sectors in GDP in India
Source: Binswanger-Mkhize and d’ Souza 2011a.
Agricultural growth and productivity growth
The 1980s were the golden years of Indian agriculture during which the growth of agriculture (3.3 percent), labor productivity (2.3 percent), and total factor productivity growth (2.0 percent) were at their peak (Table 1). Much of this growth can be attributed to the spreading of the Green Revolution across most regions of India.
0
10
20
30
40
50
60
1960
1962
1964
1966
1968
1970
1972
1974
1976
1978
1980
1982
1984
1986
1988
1990
1992
1994
1996
1998
2000
2002
2004
2006
2008
Shares (%
)
Year
Share of sectors in GDP (%)
Agriculture
Industry
Manufacturing Services
7
Table 1: Growth of agriculture, agricultural productivity and labor force
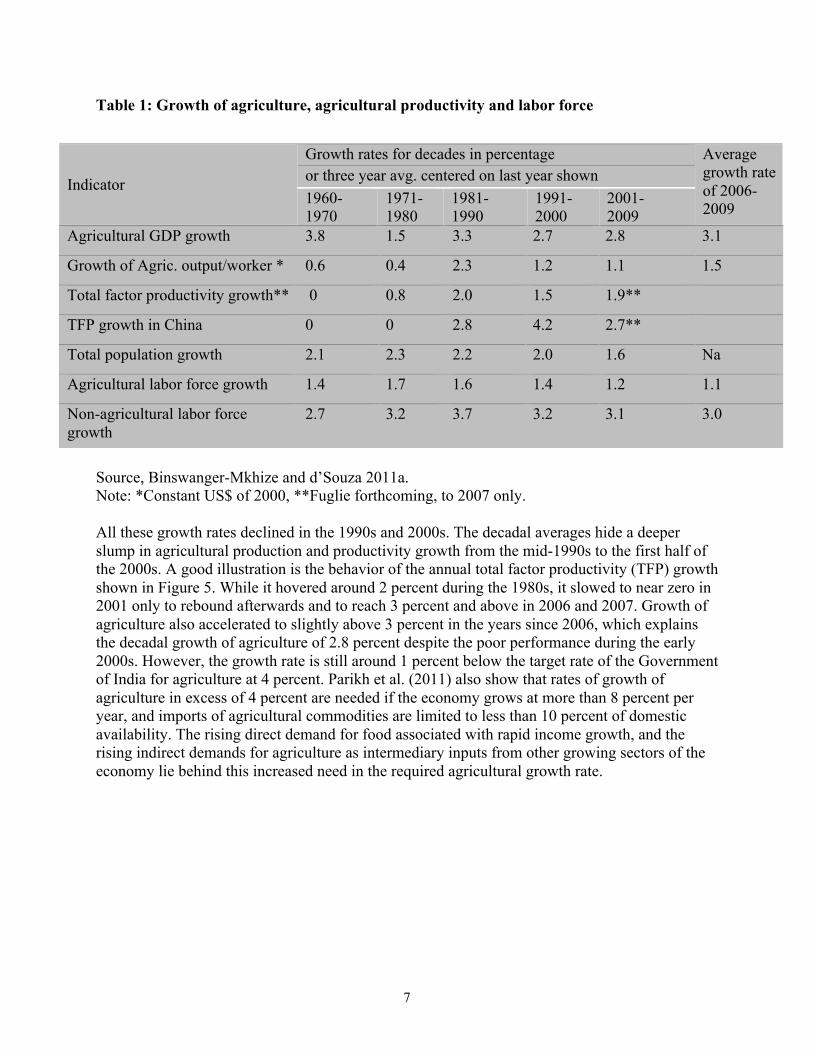
Source, Binswanger-Mkhize and d’Souza 2011a. Note: *Constant US$ of 2000, **Fuglie forthcoming, to 2007 only. All these growth rates declined in the 1990s and 2000s. The decadal averages hide a deeper slump in agricultural production and productivity growth from the mid-1990s to the first half of the 2000s. A good illustration is the behavior of the annual total factor productivity (TFP) growth shown in Figure 5. While it hovered around 2 percent during the 1980s, it slowed to near zero in 2001 only to rebound afterwards and to reach 3 percent and above in 2006 and 2007. Growth of agriculture also accelerated to slightly above 3 percent in the years since 2006, which explains the decadal growth of agriculture of 2.8 percent despite the poor performance during the early 2000s. However, the growth rate is still around 1 percent below the target rate of the Government of India for agriculture at 4 percent. Parikh et al. (2011) also show that rates of growth of agriculture in excess of 4 percent are needed if the economy grows at more than 8 percent per year, and imports of agricultural commodities are limited to less than 10 percent of domestic availability. The rising direct demand for food associated with rapid income growth, and the rising indirect demands for agriculture as intermediary inputs from other growing sectors of the economy lie behind this increased need in the required agricultural growth rate.
Growth rates for decades in percentage or three year avg. centered on last year shown Indicator 1960-1970
1971- 1980
1981- 1990
1991-2000
2001- 2009
Average growth rate of 2006-2009
Agricultural GDP growth 3.8 1.5 3.3 2.7 2.8 3.1
Growth of Agric. output/worker * 0.6 0.4 2.3 1.2 1.1 1.5
Total factor productivity growth** 0 0.8 2.0 1.5 1.9**
TFP growth in China 0 0 2.8 4.2 2.7**
Total population growth 2.1 2.3 2.2 2.0 1.6 Na
Agricultural labor force growth 1.4 1.7 1.6 1.4 1.2 1.1
Non-agricultural labor force growth
2.7 3.2 3.7 3.2 3.1 3.0
8
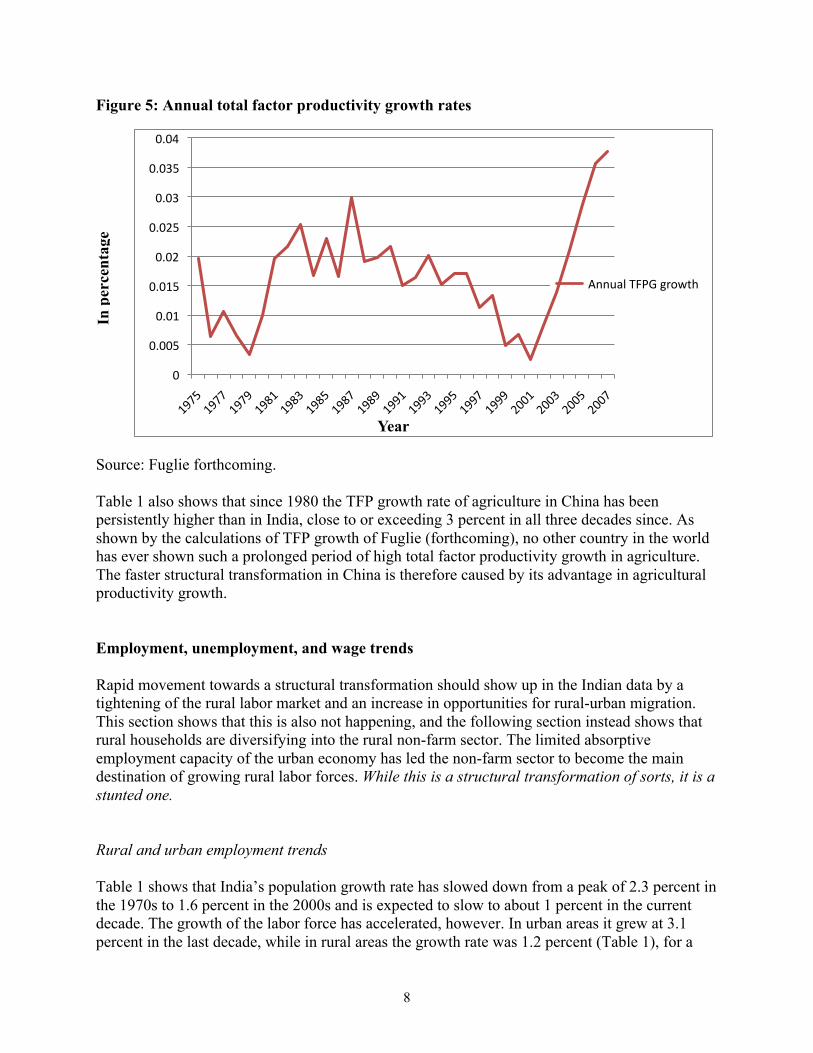
Figure 5: Annual total factor productivity growth rates
Source: Fuglie forthcoming. Table 1 also shows that since 1980 the TFP growth rate of agriculture in China has been persistently higher than in India, close to or exceeding 3 percent in all three decades since. As shown by the calculations of TFP growth of Fuglie (forthcoming), no other country in the world has ever shown such a prolonged period of high total factor productivity growth in agriculture. The faster structural transformation in China is therefore caused by its advantage in agricultural productivity growth. Employment, unemployment, and wage trends Rapid movement towards a structural transformation should show up in the Indian data by a tightening of the rural labor market and an increase in opportunities for rural-urban migration. This section shows that this is also not happening, and the following section instead shows that rural households are diversifying into the rural non-farm sector. The limited absorptive employment capacity of the urban economy has led the non-farm sector to become the main destination of growing rural labor forces. While this is a structural transformation of sorts, it is a stunted one. Rural and urban employment trends Table 1 shows that India’s population growth rate has slowed down from a peak of 2.3 percent in the 1970s to 1.6 percent in the 2000s and is expected to slow to about 1 percent in the current decade. The growth of the labor force has accelerated, however. In urban areas it grew at 3.1 percent in the last decade, while in rural areas the growth rate was 1.2 percent (Table 1), for a
0
0.005
0.01
0.015
0.02
0.025
0.03
0.035
0.04
Year
Annual TFPG growth
In p
erce
ntag
e

9
total labor force growth rate of 2.8 percent. This is significantly larger than the population growth rate on account of the “demographic dividend” associated with a slowdown in the population growth rate. Hazell et al. (2011) cite UN population projections that suggest that the rural population will peak at 900 million in 2022, and that the rural labor force may continue to grow until 2045. Clearly, the Indian economy as a whole is facing an enormous employment generation challenge in both urban and rural areas for more than the next 30 years. Rural and urban males have always had fairly similar labor participation rates while the rates for rural females have been much lower, and even lower for urban females (Figure 6). Figure 6: Trends in labor participation rates
Source: Choudhury 2011. Since 1973 there has been little discernible trend in rural male labor participation and only limited fluctuations. Female rural and urban participation rates fluctuated from 1977-78 to 2004-05. During the early years of the century there were significant increases in participation rates, especially for females, in both rural and urban areas. Since then labor participation rates have gone down for rural females to their lowest level over the entire period. Himanshu et al. (2011) interprets the movement of rural women into the labor force between 1999-00 and 2004-05 as a response to the agrarian crisis of the period. The subsequent sharp drop in labor participation to 2009-10 is interpreted as a withdrawal from the labor markets as economic conditions improved again. Others have pointed to the very large increase in participation in education as a major reason for withdrawal of women from the labor market, but careful analysis by Choudhury (2012) suggests that this is not a good expanation. Choudhury (2011) also shows that in both rural and urban areas there are some common trends: a slight decline in the manufacturing share of employment, which is consistent with the constancy of the manufacturing share in the Indian economy and its far slower growth in the past decade than planned; a decline in the share of agriculture and allied industries; a sharp increase in construction; and a large share of the labor force in urban areas in trade, hotels and restaurants

10
(much smaller in rural areas) and in both areas they have stayed fairly constant. As a consequence, rural non-farm sector employment has grown especially fast. The employment data also reveal a significant trend towards the feminization of agriculture. Among rural workers, females have always been more likely to be engaged in the primary sectors, most of which is agriculture, than men, and, correspondingly, less in the secondary sectors. For example, in 1977-78, 88.1 percent of female workers were engaged in primary sectors compared to 80.6 percent of males (Table 2). By 2009-10, these percentages had gone down for both males and females as a consequence of the rise of the rural non-farm sector. However, for males, engagement in the primary sector had gone down to 62.8 percent, or by 25 percent, while for females they had gone down to 79.3 percent, or by only about 10 percent. On account of their higher labor participation rate there are still more men working in agriculture than women. Nevertheless, there is a clear trend towards the feminization of the agriculture labor force. Table 2: Changes in the sectoral composition of the rural labor force
Source: Himanshu 2011. As shown in Table 3, employment in India is very much concentrated in the informal sector. Between 1999-2000 and 2004-05 the proportion of workers in the formal sector declined from 8.8 to 7.5 percent. The National Commission for Employment in the Unorganized Sector (NCEUS) defines organized employment as employees who receive provident fund and social security benefits. Within the organized (formal) sector, the proportion of employees with informal contracts rose from 37.8 percent to 46.7 percent. The Indian labor market has shown a marked tendency to informalization of labor relationships, and only limited creation of high quality jobs with secure contracts and pension and health benefits for urban workers as well as for migrants from rural areas. Employment in the rural non-farm sector has always been primarily informal, but the small formal sector employment share has followed the trend to informalization as well (World Bank 2010).

11
Table 3: Distribution of workers by type of employment and sector organization
Source: Government of India 2008, Table 4.7. Urban employment growth, particularly in the manufacturing sector, has been inadequate to provide enough employment opportunities for workers from rural areas. The great informality of employment in the Indian economy and in the organized sector, and the deepening of urban poverty discussed in the next section sharply reduce the attractiveness of urban areas for rural migrants, especially for unskilled and semi-skilled ones. Urban areas remain a pole of attraction of highly skilled workers. Nevertheless, the poor employment prospects for low-skilled workers in urban areas means that male, and especially female workers, are stuck in rural areas. Agricultural employment, unemployment and wages Employment growth in Indian agriculture slowed down between the early 1990s to 2004-05 (World Bank 2010). As discussed in Choudhury (2011), in 2009-10 the current daily status unemployment rates were the lowest for urban males at 5.5 percent, followed by rural males at 6.2 percent, 8 percent for rural females, and slightly over 9 percent for urban females. Unemployment rates were higher for 2004-05, with the growth of labor participation in the period preceding that year partly or fully driven by distress (World Bank 2010; Himanshu 2011). Urban unemployment rates, but not rural ones, today are also lower than in the 1990s. Nevertheless, the urban labor market is still very hostile for females, deterring rural-urban migration. The growth rate of real agricultural wages declined between 1980 to the middle of the last decade, but has started to increase recently. As shown in Table 4, since then real wages in the entire economy have risen at a fairly rapid pace. The fastest real wage growth is observed for urban female salaried workers at 7.8 percent, followed by rural female casual workers at 6.2 percent and by urban male salaried workers. Since female participation rates fell, their faster rising wages are consistent with a voluntary withdrawal of females from labor markets, either as a consequence of growing family income and/or greater participation in education. Wages of casual male workers rose at 4.5 percent in rural areas and 4.2 percent for urban males, which in each case means a compound wage growth of close to 25 percent over the past five years. There is no recent trend in divergence of unskilled wages between rural and urban areas.

12
Table 4: Average daily real wage rate for workers In 2004-05 Prices (Rs) Year Rural Urban Male Female Male Female Regular Salaried 2004-05 145 86 203 153 2009-10 165 103 260 213 Growth rate (%) 2.8 4.2 5.6 7.8 Casual 2004-05 55 35 75 44 2009-10 67 46 91 53 Growth rate (%) 4.5 6.2 4.2 4.1 Source: Choudhury 2011. Note: The wages for urban workers have been deflated by consumer price index (industrial workers) (CPI(IW)) and that of rural workers by consumer price index (agricultural labour) (CPI(AL)). This wage refers to the wage for casual workers engaged in work other than public work. How can one explain the recent rise in rural wages? First, after a sharp slowdown in agricultrual growth from the early-1990s to the middle of the last decade (which reflected itself in the slowdown of agricultural employment growth), the agricultural GDP growth rate has accelerated again. Second, since the middle of the last decade, agricultural prices have increased significantly in real terms on account of rapid increases in procurement prices of major agricultural crops (Oxus 2011), and perhaps under the influence of rising and high world market prices since 2008. Third, rural non-farm sector employment growth has also accelerated significantly over the past 20 years. Fourth, there has been a withdrawal of women from the rural labor force since 2004-05 with a shift of women to education. A fifth explanation is the growth in public expenditures in rural areas that have increased rural purchasing power. Since before the beginning of the 11th Plan, public expenditures for the 13 flagship programs for agriculture, rural development and social development have been increasing rapidly, and now amount to Rs 186,539 crore, or approximately US$ 37 billion dollars. Two-thirds of the expenditures are in programs that are only operating in rural areas. The rural component of the social programs will likely take the lion’s share of these expenditures. The rural component of all programs therefore must reach or exceed 85 percent of the total expenditures, or about 158,000 crore, which is nearly 17 percent of agricultural GDP. Therefore, rural development, employment and social development programs, even if they encountered large leakages, are increasingly transferring purchasing power into the rural economy. These are likely to lead to increases in the demand for food and non-farm goods and services, generating multiplier effects on both agriculture and on rural non-farm incomes. In addition, a number of programs will also impact agriculture and rural development via their direct program impacts on output in these sectors. These direct and indirect impacts will be the drivers of the increase in real rural wages.

13
A highly visible component of the growing public rural expenditures has been the the Mahatma Ghandi National Rural Employment Guarantee Act (MNREGA). The program has been described by the Planning Commission as: “With a people-‐centered, demand-‐driven architecture, completely different from the earlier rural employment programmes, MGNREGA has directly led to the creation of 987 crore person-‐days of work since its inception in 2006-‐07. In financial year 2010-‐11, MGNREGA provided employment to 5.45 crore households generating 253.68 crore person-‐days. It has also successfully raised the negotiating power of agricultural labour, resulting in higher agricultural wages and improved economic outcomes leading to reduction in distress migration.” (Government of India 2011). The program has been widely seen as the major cause of rural wage rate rises. However, it is only a relatively small share of total rural government expenditures and of rural employment. It is likely that the other five factors discussed above together have been a more important driver of the recent real rural wage rate rises, and that rural wages would have increased even in the absence of MNREGA. Urban-rural differences in poverty, inequality, income and consumption The analysis presented so far raises a major puzzle: For the past few years economic growth has accelerated sharply to more than 8 percent. The inter-sectoral labor productivity differential has risen rapdily; agriculture grew fairly slowly in the period between 1990 and 2005; agricultural productivity growth also slumped in the same period; urban employment opportunities have grown fairly slowly, especially for lower skilled workers and for women; and migration has been fairly slow. With these trends one would expect a rising differential between urban and rural per capita incomes and consumptions, and a rising differential between urban and rural poverty rates. However, this has not been the case. As seen in Table 5, the rural poverty rate (using the old poverty line) declined from 50.1 percent in 1993-94 to 31.8 percent in 2004-05, or by 18.3 percent, while urban poverty declined from 41.8 percent to 25.7 percent, or by 6.1 percent.2 In absolute terms the decline in rural areas is larger than in urban areas, but in relative terms the rate of poverty decline in urban areas is slightly faster than in rural areas. By 2004-05, in urban areas both the poverty gap and the squared poverty gap had become deeper, indicating a progressive urbanization of poverty (World Bank 2010). The poverty data with the higher poverty line resulting from the Tendulkar Committee report show similar convergence for the period 1993-94 to 2004-05 (Table 5). These trends are inconsistent with a growing divergence of rural and urban poverty.
2 Preliminary estimates of the national poverty rate prepared by Ravi and cited in Ahluwahlia (2011) suggest that the national poverty rate under the new Tendulkar committee poverty line has declined further from 37.2 percent in 2004-05 to 37.2 percent in 2009-10, or at an accelerated rate of about 1 percent per year. The urban-rural poverty rates for 2009-10 have not yet become available.
14
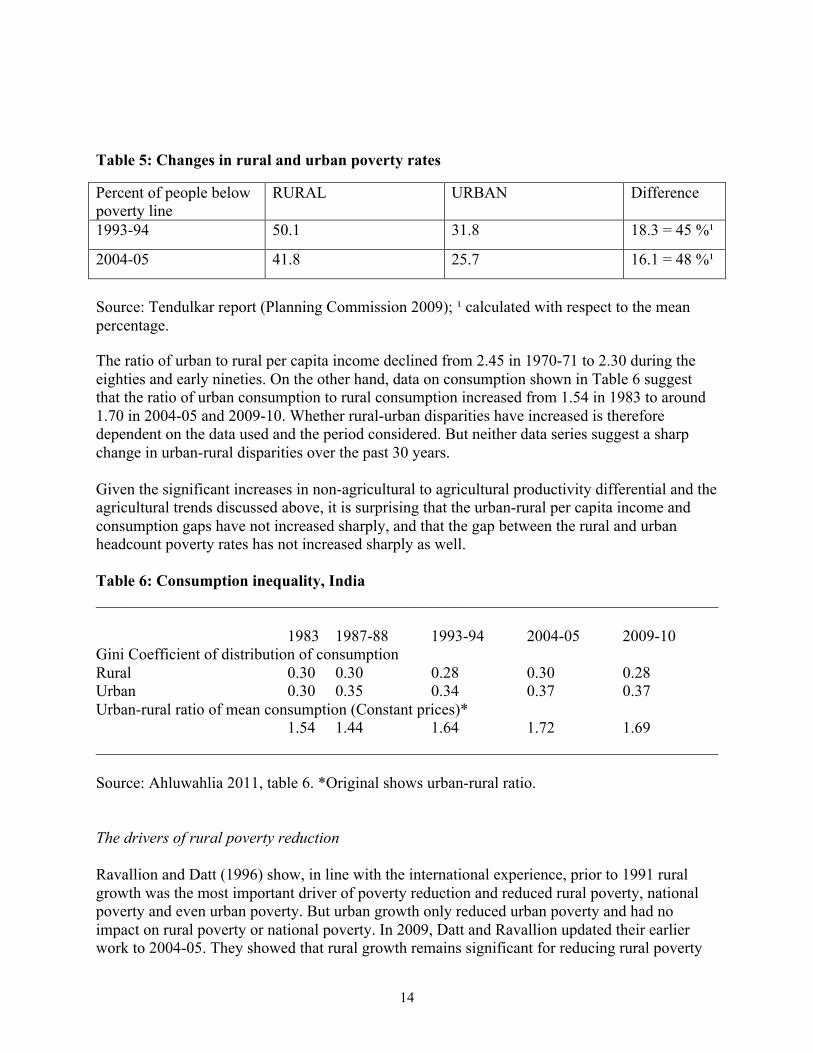
Table 5: Changes in rural and urban poverty rates
Percent of people below poverty line
RURAL URBAN Difference
1993-94 50.1 31.8 18.3 = 45 %¹
2004-05 41.8 25.7 16.1 = 48 %¹
Source: Tendulkar report (Planning Commission 2009); ¹ calculated with respect to the mean percentage. The ratio of urban to rural per capita income declined from 2.45 in 1970-71 to 2.30 during the eighties and early nineties. On the other hand, data on consumption shown in Table 6 suggest that the ratio of urban consumption to rural consumption increased from 1.54 in 1983 to around 1.70 in 2004-05 and 2009-10. Whether rural-urban disparities have increased is therefore dependent on the data used and the period considered. But neither data series suggest a sharp change in urban-rural disparities over the past 30 years. Given the significant increases in non-agricultural to agricultural productivity differential and the agricultural trends discussed above, it is surprising that the urban-rural per capita income and consumption gaps have not increased sharply, and that the gap between the rural and urban headcount poverty rates has not increased sharply as well. Table 6: Consumption inequality, India ______________________________________________________________________________
1983 1987-88 1993-94 2004-05 2009-10 Gini Coefficient of distribution of consumption Rural 0.30 0.30 0.28 0.30 0.28 Urban 0.30 0.35 0.34 0.37 0.37 Urban-rural ratio of mean consumption (Constant prices)*
1.54 1.44 1.64 1.72 1.69 ______________________________________________________________________________ Source: Ahluwahlia 2011, table 6. *Original shows urban-rural ratio. The drivers of rural poverty reduction Ravallion and Datt (1996) show, in line with the international experience, prior to 1991 rural growth was the most important driver of poverty reduction and reduced rural poverty, national poverty and even urban poverty. But urban growth only reduced urban poverty and had no impact on rural poverty or national poverty. In 2009, Datt and Ravallion updated their earlier work to 2004-05. They showed that rural growth remains significant for reducing rural poverty

15
and national poverty. But since 1991, when economic growth started to accelerate, urban growth has become the major driver not only of urban poverty reduction, but for both national and rural poverty reduction. Datt and Ravallion’s new findings suggest that a spillover has emerged from more rapid urban growth to rural growth. Since agricultural growth had slowed down during the period 2004-05, the spillovers must have been felt primarily in the non-farm sector. In the past, the rural non-farm sector was viewed as driven primarily by agriculture (Hazell and Hagbladde 1993), so to add an urban driver is a novelty. But there is more direct evidence of such a driver: Himanshu et al. (2010) show via a multiple regression using the within estimator in panel data of regions in India that higher non-farm employment by rural adults also significantly reduces rural poverty. These results do not imply that agriculture has lost its impact on the rural non-farm sector, and more broadly on rural poverty. In Datt and Ravaillion’s 2009 update, agricultural growth remains an important determinant of rural poverty reduction. This conclusion is reinforced by the same regression analysis of Himanshu et al. (2010) that showed that higher yields are associated with declining rural poverty, suggesting the impact of agricultural productivity growth on poverty remains high. In the same regression they also show a strong and negative impact of higher agricultural wage growth on rural poverty. This strong impact is not surprising as agricultural workers constitute about half of India’s overall poverty population. In conclusion, neither poverty nor per capita income and consumption show signs of rapid divergence between rural and urban areas as a consequence of the rising disparity of labor productivity between agricultural and non-agricultural sectors. Consumption inequality has recently increased in urban areas but stayed fairly constant in rural areas. While rural growth and agriculture were the main drivers of poverty reduction before 1991, since then urban growth has become a quantitatively more important driver of poverty reduction overall even in rural areas. Nevertheless, growth in agriculture, in agricultural productivity (as measured by yields), and in agricultural wages remain important drivers of rural poverty reduction. The rising importance of the rural non-farm sector If urban areas are inhospitable to migrants from rural areas then where has the growing rural labor force found employment and opportunities for increasing their incomes? If there had been no such opportunities, undoubtedly rural poverty would not have improved as fast as urban poverty and rural-urban income and consumption parities would have declined. However, the rural non-farm sector has become much more dynamic than the farming sector, both in terms of GDP growth and employment generation. Between 1983-2004 rural non-farm GDP has grown at a rate of 7.1 percent, more than a percentage point faster than non-farm GDP, and 4.5 percent faster than agricultural GDP (Table 7). This faster growth of the non-farm sector started in the decade from 1983-1993. In the period 1993-2004, non-agricultural employment growth in rural areas accelerated from 3.5 to 4.8 percent. In the 1980s, 4 out of 10 rural jobs were in the non-farm sector, now it is 6 out of 10 (ibid). Given the large size of the rural labor force these numbers mean that the rural non-farm sector has emerged as the largest source of new jobs in the Indian economy.

16
Table 7: Trends in non-farm employment and in national, rural non-farm and agricultural GDP (Annualized rates of growth, %)
Year Non-farm employment
GDPN Non-farm GDP
Agriculture GDP
1983-2004 3.3 5.8 7.1 2.6 1983-1993 3.5 5.2 6.4 2.9 1993-2004 4.8 6.0 7.2 1.8
Source: Himanshu et al. (2010), Table 3. Note: GDP at factor cost at 1993-94 prices. Agriculture GDP originating in agriculture, forestry, and fishing. Non-farm GDP defined as a residual. Growth in rural non-farm sector employment has occurred all over India, but has been highly uneven. It is highest in Kerala, West Bengal, and Tamil Nadu, and lowest in Chhattisgarh, Madhya Pradesh, followed by Uttarakhand, Karnataka Gujarat and Maharashtra (World Bank 2010, Binswanger and d’Souza, 2011b). Until 2004, the growth in non-farm jobs had come primarily from increases in services, transport, and construction. In 1983, close to 40 percent of rural non-farm jobs were in manufacturing. Despite continued growth of rural manufacturing, this share has declined to just a little above 30 percent in 2004-05. In 1983, social services and trade, transport, and communication both generated about 26 percent of non-farm jobs. Social services have since declined to about 18 percent of the jobs, while trade, transport, and communications have grown rapidly to about 33 percent. In 1983, construction was by far the smallest sector, with a share of only 10 percent. Since then it has grown the fastest and now generates close to 19 percent of the rural non-farm jobs. The high level of rural construction has visually transformed villages all over India, with much better village infrastructure and housing. Foster and Rosenzweig (2005) show that non-farm enterprises producing tradable goods (the rural factory sector) locate in settings where reservation wages are lower. If the rural factory sector seeks out low-wage areas, factory growth will be largest in those areas that have not experienced local agricultural productivity growth. Thus, rural non-farm growth reduces spatial inequalities in economic opportunities and incomes. Nevertheless, the location of factories where wages are low has an equalizing impact on income distribution in rural areas. Datt and Ravallion’s 2009 analysis, suggests that since 1992 urban growth has also fueled the rural non-farm sector. More direct evidence of spillovers comes from World Bank (2010), p 66: “During the two periods of analysis, 1983 to 1993-94 and 1993-94 to 2004-05, regression estimates suggest that non-farm employment increased more in regions where urban incomes also grew faster. Disaggregating the analysis by different types of non-farm employment, the results show that it is regular salaried jobs and self-employment activities that appear to be most strongly and positively correlated with urban growth; casual non-farm employment is uncorrelated with urban growth.” Additional drivers of recent rural non-farm growth can be inferred from a closer look at the composition of employment growth (Box 1).
17
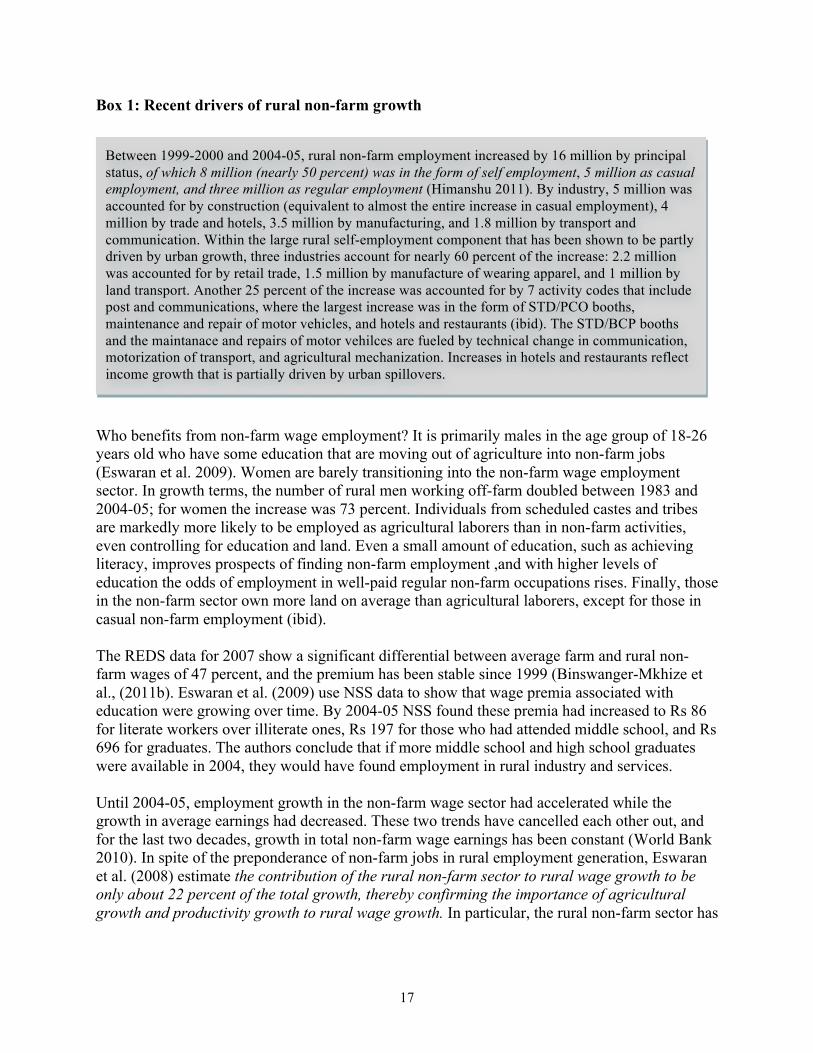
Box 1: Recent drivers of rural non-farm growth
Who benefits from non-farm wage employment? It is primarily males in the age group of 18-26 years old who have some education that are moving out of agriculture into non-farm jobs (Eswaran et al. 2009). Women are barely transitioning into the non-farm wage employment sector. In growth terms, the number of rural men working off-farm doubled between 1983 and 2004-05; for women the increase was 73 percent. Individuals from scheduled castes and tribes are markedly more likely to be employed as agricultural laborers than in non-farm activities, even controlling for education and land. Even a small amount of education, such as achieving literacy, improves prospects of finding non-farm employment ,and with higher levels of education the odds of employment in well-paid regular non-farm occupations rises. Finally, those in the non-farm sector own more land on average than agricultural laborers, except for those in casual non-farm employment (ibid). The REDS data for 2007 show a significant differential between average farm and rural non-farm wages of 47 percent, and the premium has been stable since 1999 (Binswanger-Mkhize et al., (2011b). Eswaran et al. (2009) use NSS data to show that wage premia associated with education were growing over time. By 2004-05 NSS found these premia had increased to Rs 86 for literate workers over illiterate ones, Rs 197 for those who had attended middle school, and Rs 696 for graduates. The authors conclude that if more middle school and high school graduates were available in 2004, they would have found employment in rural industry and services. Until 2004-05, employment growth in the non-farm wage sector had accelerated while the growth in average earnings had decreased. These two trends have cancelled each other out, and for the last two decades, growth in total non-farm wage earnings has been constant (World Bank 2010). In spite of the preponderance of non-farm jobs in rural employment generation, Eswaran et al. (2008) estimate the contribution of the rural non-farm sector to rural wage growth to be only about 22 percent of the total growth, thereby confirming the importance of agricultural growth and productivity growth to rural wage growth. In particular, the rural non-farm sector has
Between 1999-2000 and 2004-05, rural non-farm employment increased by 16 million by principal status, of which 8 million (nearly 50 percent) was in the form of self employment, 5 million as casual employment, and three million as regular employment (Himanshu 2011). By industry, 5 million was accounted for by construction (equivalent to almost the entire increase in casual employment), 4 million by trade and hotels, 3.5 million by manufacturing, and 1.8 million by transport and communication. Within the large rural self-employment component that has been shown to be partly driven by urban growth, three industries account for nearly 60 percent of the increase: 2.2 million was accounted for by retail trade, 1.5 million by manufacture of wearing apparel, and 1 million by land transport. Another 25 percent of the increase was accounted for by 7 activity codes that include post and communications, where the largest increase was in the form of STD/PCO booths, maintenance and repair of motor vehicles, and hotels and restaurants (ibid). The STD/BCP booths and the maintanace and repairs of motor vehilces are fueled by technical change in communication, motorization of transport, and agricultural mechanization. Increases in hotels and restaurants reflect income growth that is partially driven by urban spillovers.

18
not contributed to wage growth among the illiterate, but only among the more educated (Eswaran et al. 2009). Box 2 shows that the rural labor market is significantly connected to the urban labor market, and that the farm and non-farm labor markets, while supporting a significant wage differential between them, are highly integrated. Box 2: The behavior and impacts of farm, non-farm and urban labor markets
Econometric results from Binswanger et al. (2011b) for the period of 1999-2007 are used to discuss labor market behavior. These come from the REDS national panel data set of over 5000 households. A first finding in the table below is that in Indian villages the farm and non-farm labor markets are linked closely in a symmetric manner: The elasticity of the rural farm wage with respect to the predicted non-farm wage is close to 0.5 and the converse elasticity of the non-farm wage is almost the same size. A rise in the urban wage increases both these wages with an elasticity of around 0.17. Morover, the elasticity of the farm and non-farm wage to the aggregate agricultural price is almost identical at 0.04. Finally, a rise in either of the two wages leads to large reallocations of labor to the sector that has experienced the wage rate rise. The elasticities far exceed all other elasticities examined so far. The reason the two labor markets are so integrated is that the slightest change in their relative wage trends induces a lot of movement of the family labor to the other sector, quickly reducing the disparity.
The responses of rural labor to changes in wages
Predicted farm wage
Predicted non-farm wage
Urban wage Sum
Labor force 0.020** 0.075** -0.059** 0.036¹
Share of family labor in agric. 3.262*** -5.571** Na -2.309¹
Share of labor in non-agriculture -2.282** 4.944** Na 2.662¹
Share of students -.980¹ .637¹ -- -.353¹
Farm wage -- 0.484** 0.166**
Non-farm wage 0.488** -- 0.171**
¹Standard errors yet to be calculated, ** significant at 1 percent level.
A rise in the urban wage leads to a reduction in family labor force, which means that it induces rural-urban migration. The last column sums up the elasticities of the left hand variables with respect to the wages on the top. The resulting sum tells what would happen if the farm, the non-farm and the rural wage were to rise by the same proportion. Such a rise of the national wage level would induce slightly more people to commit to work in rural areas. This suggests that people would prefer the rural areas if there was an overall income impact from higher wages. These preferences may well reflect their perception of the relatively hostile nature of the urban labor market discussed in section one. However, looking at the shares, the sums show that people would tend to move their work force from agriculture to non-agriculture, suggesting that while they prefer rural areas they would prefer to work in the non-farm sector. This supports the notion that people would rather move out of agriculture if they could.

19
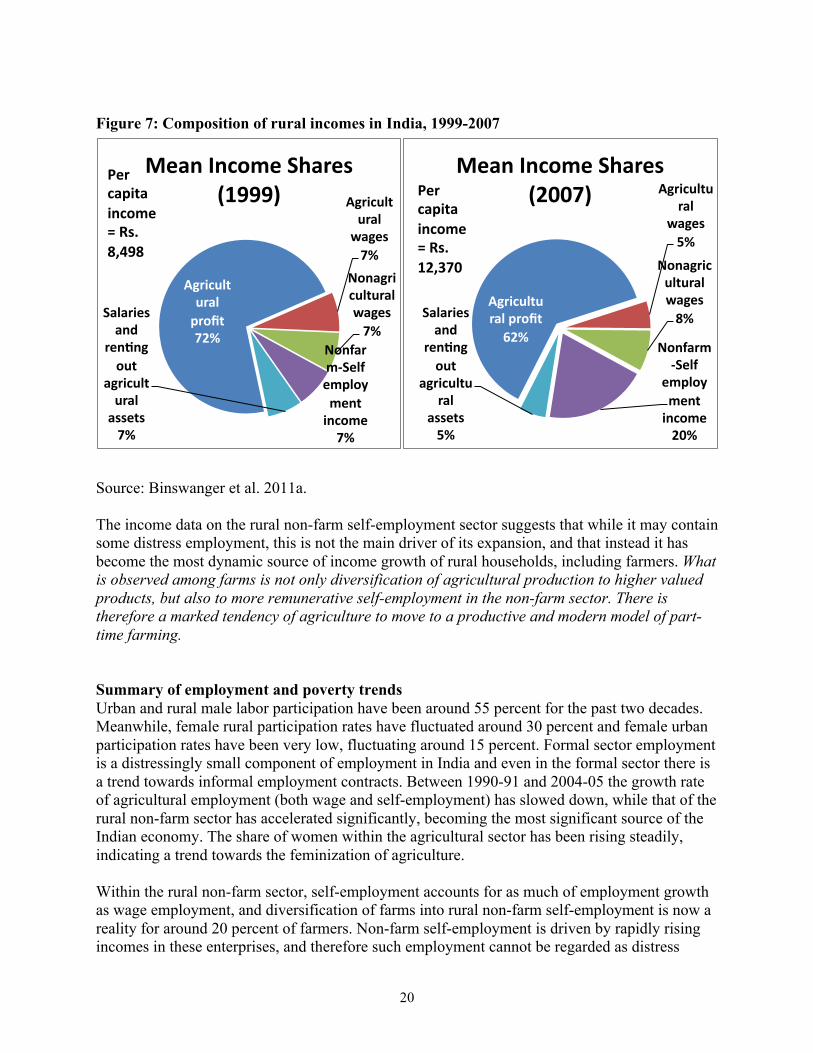
As discussed in Box 1, a particularly dynamic development has been the growth in self-employment in the non-farm sector. The question has arisen whether such employment is a consequence of economic distress or of rising self-employment income opportunities (World Bank 2010). In order to answer this question, data on income earned by rural non-farm self-employment is required that is not available in the standard NSS consumption, poverty and employment surveys. Binswanger-Mkhize et al. (2011a) analyzed data from the 1999 and 2007 round of the Rural Economic and Demographic Surveys (REDS) of the National Council of Applied Economic research to fill this gap. REDS is a nationally representative panel of rural households that were originally selected in 1971 to study the Green Revolution with a slight tilt towards better agricultural areas. Because of population growth and household subdivision, the sample grew from 4690 households in 1999 to 5759 households. Households have become smaller in size, contain a lower proportion of farm households, and, on average, own less land. (The decline in average owned and operational holding sizes, a consequence of rural population and labor force growth, has been a long-term trend in India since 1962 (Basole and Basu 2011)). Despite these trends, per capita income grew from 8498 Rs in 1999 to 12,370 Rs in 2007, i. e. by Rs 3881 (in Rs of 1999), or at an annual rate of 5.7 percent, which is similar to urban per capita income growth. These data also show rising rural wages, but also a more than doubling of the prices of agricultural land between the two periods. Since the wealth of farmers is primarily in the form of land, they have experienced a significant increase in their real wealth. Between 1999 and 2007, the number of households engaged in non-farm self-employment more than doubled from under 10 percent to nearly 20 percent. Unfortunately, the gender of the owners of these enterprises is not known, but given the growth of the rural self-help movement, it is possible that women participated significantly in this self-employment growth. While agricultural profits and agricultural labor incomes grew in absolute terms, it was the rural non-farm self-employment income component that grew the fastest: For households engaged in rural non-farm employment this component of income rose from Rs. 36,767 to Rs.64,045, i.e. by 74 percent in only 8 years, or at an simple annual rate of 9.3 percent. Figure 7 shows that for the sample as a whole, the shares of income shifted from agricultural profits and wages (-9.26 percent and - 2.10 percent) towards non-farm self employment income (+12.19 percent). At the same time the share of non-farm wage income has stayed nearly constant at around 7.5 percent.
20
Figure 7: Composition of rural incomes in India, 1999-2007
Source: Binswanger et al. 2011a. The income data on the rural non-farm self-employment sector suggests that while it may contain some distress employment, this is not the main driver of its expansion, and that instead it has become the most dynamic source of income growth of rural households, including farmers. What is observed among farms is not only diversification of agricultural production to higher valued products, but also to more remunerative self-employment in the non-farm sector. There is therefore a marked tendency of agriculture to move to a productive and modern model of part-time farming. Summary of employment and poverty trends Urban and rural male labor participation have been around 55 percent for the past two decades. Meanwhile, female rural participation rates have fluctuated around 30 percent and female urban participation rates have been very low, fluctuating around 15 percent. Formal sector employment is a distressingly small component of employment in India and even in the formal sector there is a trend towards informal employment contracts. Between 1990-91 and 2004-05 the growth rate of agricultural employment (both wage and self-employment) has slowed down, while that of the rural non-farm sector has accelerated significantly, becoming the most significant source of the Indian economy. The share of women within the agricultural sector has been rising steadily, indicating a trend towards the feminization of agriculture. Within the rural non-farm sector, self-employment accounts for as much of employment growth as wage employment, and diversification of farms into rural non-farm self-employment is now a reality for around 20 percent of farmers. Non-farm self-employment is driven by rapidly rising incomes in these enterprises, and therefore such employment cannot be regarded as distress
Agricultural profit 72%
Agricultural wages 7%
Nonagricultural wages 7%
Nonfarm-‐Self employment income 7%
Salaries and
renKng out
agricultural assets 7%
Mean Income Shares (1999)
Per capita income = Rs. 8,498
Agricultural profit 62%
Agricultural
wages 5%
Nonagricultural wages 8%
Nonfarm-‐Self
employment income 20%
Salaries and
renKng out
agricultural
assets 5%
Mean Income Shares (2007) Per
capita income = Rs. 12,370
21
employment. Indeed non-farm self-employment income has become the largest source of rural income growth. Rural non-farm wage employment is accessed primarily by young males with some education, suggesting that females are at a disadvantage in obtaining such employment, perhaps because much of it requires mobility. Rural non-farm wages are significantly higher than agricultural wages, which means that lack of access to such employment is a significant disadvantage. Unfortunately, this implies a significant impediment to women, who have increasingly concentrated on agriculture, contributing to a progressive feminization of agriculture, and on rural non-farm self-employment. In spite of the wage differential, the farm and non-farm rural labor markets are highly integrated. Both are also integrated with the urban labor maket, but to a lesser extent. Non-farm sector growth and employment growth have not only happened in favorable agro-climate zones but also in less favored areas, mitigating inter-regional income and poverty differentials. Poverty continues to be concentrated among agricultural workers. The differences between urban and rural poverty rates, and urban-rural per capita income and consumption have not increased despite the slow migration and the very rapid rate of growth of the agricultural-nonagricultural productivity differential. This is clearly a consequence of the growth of employment and income in the rural non-farm sector, and especially in rural non-farm self-employment and income. Since the early 1990s, this rural non-farm self-employment sector has become increasingly fueled by accelerating urban growth. Implications for structural change The new growing rural non-farm dynamic has led to a revision of the standard model of structural transformation that equates non-agriculture with urban areas. It now has to include the rural non-farm sector. Structural transformation in the form of a decline in agricultural employment and in favor of nonagricultural employment is happening in India. However, the new form of structural transformation in India is a stunted one, because it primarily generates employment that is informal and/or insecure, and without the benefits of health and unemployment insurance and pensions. The structural transformation trends are in sharp contrast to the trends in China. Near zero population growth rates and rapid growth of labor-intensive manufacturing and in other urban sectors have led to a world record rural-urban migration that has left rural areas without young workers. Farms are increasingly operated by older farmers, many of whom are also women. Even in China, the rural non-farm sector has emerged as a dynamic sector, probably on account of spillovers from rapid urban growth to rural areas, as well as continued rapid agricultural growth. Urban and rural wages have started to grow very rapidly at around the same time as Indian rural wages, but the pace of real wage growth is much faster. It appears that China is on the way towards a normal structural transformation.

22
In spite of rapid economic growth, India’s structural transformation is constrained by the weakness of employment growth in the urban economy, and most specifically in labor-intensive manufacturing. Most experts attribute the slow growth in labor-intensive manufacturing to restrictive labor legislation in India and to poor infrastructure for power, water, and transport. The dream of a structural transformation directly to a service economy with good and secure urban jobs has not been realized and is unlikely in the future as well. That there is nevertheless a structural transformation from agricultural production and employment towards non-agriculture appears to be a consequence of rising urban spillovers to rural non-farm self-employment, and this has prevented a greater divergence in poverty rates and per capita incomes and consumption. Continued growth of high urban economic growth is therefore critical for rural income growth. However, agricultural growth and higher productivity continue to be powerful drivers of rural poverty reduction, rural non-farm sector growth, and agricultural and rural wages. An acceleration of agricultural growth and agricultural productivity growth to sustained higher levels than in the past two decades would therefore be highly beneficial for rural areas. As a consequence, agricultural and rural development policies, institutions, and programs remain important determinants of rural welfare. Vision of agriculture and rural poverty reduction Using the results and insights from the past sections a vision for the agricultural sector and for rural poverty reduction over the next decades can be developed. The structural transformation in India and rural-urban migration will likely remain constrained by the slow growth of employment in urban areas, in industry, and especially in labor-intensive manufacturing. This is because it appears to be politically impossible to reform restrictive labor legislation, and because it will take a long time to overcome infrastructure bottlenecks. For most unskilled and semi-skilled workers, urban migration opportunities are likely to remain constrained, and limited to the informal sector, or to informal contracts in the formal sector. There is little chance that the urban economy will provide enough employment for the growing rural labor force to allow a large proportion to move to the urban economy. The rural labor force will therefore have to find a way to improve their incomes in rural areas. Given the need to raise agricultural income and the economies of scale that mechanization and credit constraints bring to agriculture (Foster and Rosenzweig 2011), it may appear paradoxical that farm sizes would continue to decline. However, this tendency is in line with past trends in India, where farm sizes have grown modestly only in the Punjab, and declined everywhere else. This decline is in line with continued rises in rural populations and labor forces, and with the limited labor absorption potential of urban areas.3 The rapidly rising prices of agricultural land
3 It is also consistent with trends in advanced economies that are dominated by small family farms, such as Japan, Taiwan, Korea, or European countries such as Italy, Spain, Switzerland, and Norway. However, in many of these countries the heavy subsidization of agriculture and constraints imposed on agricultural land markets have limited land consolidation via sales and rental markets.
23
will impart a portfolio motivation to hang on to land in the households owning land and remaining in the country side. While land rental markets could lead to land consolidation, up to the latest data available, land renting has also continued to decline. To provide self-employment opportunities for family labor, and especially for women, most households will be reluctant to rent out or sell land in the future as well. With males having better opportunities in rural non-farm employment than females, agriculture will continue to feminize. With these trends agriculture will be dominated by even smaller part-time farm households; with a few full-time farmers at the top and a large majority of part-time marginal, small and medium farmers. Some of these trends are in contrast to China: Absent or old owners of rural land rights are increasingly renting them out to relatives, to larger farmers, and to enterprises. Land rentals have risen from close to zero in the 1990s to around 20 percent of total agricultural land. As a consequence average operational holdings have started to rise, while the ownership distribution of land rights remains unaffected. These trends are also likely to continue. Part-time farmers in India will get more income from non-agriculture than from agriculture. All types of farmers will focus much more on horticulture, milk, poultry and eggs. Consumer demand will drive a trend towards traceability of agricultural output, quality control, and organic farming that will provide additional income opportunities. Farms will be much more capital-intensive, and use advanced biological and mechanical technology for crops, horticulture, livestock and aquaculture. Water markets and other cooperative ways will be used to realize economies of scale. Depending on economy-wide growth, farmers will try to increase their agricultural incomes by adoption of modern technology, further diversification towards higher valued crops, use of more machinery, and increasing reliance on family labor. The rural non-farm sector will continue to grow faster than agriculture, provide more income opportunities than agriculture, and produce an increased range of services and products, using progressively more modern technology. Declining farm size trends and the diversification of households into the non-farm sector will undoubtedly continue. As a consequence, the emergence of a farm sector dominated by modern part-time farmers, many of them female, whose households will combine farming with non-farm employment of the men and/or self-employment in the non-farm sector is likely. While these trends are likely to continue under both very rapid and more moderate economic growth, and regardless of agricultural policies and programs, both an optimistic and a more pessimistic future are possible for agricultural and rural incomes, and for rural poverty reduction. The optimistic version is based on a combination of rapid economy-wide growth as well as rapid agricultural and rural non-farm growth; both partly driven by urban demand and technology spillovers. Agricultural growth will be driven by rapid technological change and productivity growth, improvements in water use efficiency and irrigation growth, and the diversification of agriculture. Both full-time and part-time farmers will have plenty of new technologies available and be able to adopt it, and many remunerative diversification opportunities in agriculture and non-agriculture. This will result in the emergence of a highly modern part-time farming sector and rapid agricultural income growth, which will also spillover into more rapid rural non-farm growth. At the same time, the demand and technology spillovers from the urban economy will further accelerate rural non-farm sector growth. Non-farm opportunities will continue to be more accessible to young and educated males than to females, accelerating the feminization of
24
agriculture. However, this may be associated with rising entrepreneurial opportunities for the female farmers. The combination of rising agricultural and rural non-farm incomes will support rapid income growth in rural areas, including rapid rural wage growth. Rural-urban incomes and consumption ratios will improve, or at least not deteriorate, and rural poverty will decline very rapidly, except in remote regions with poor agricultural endowments and poor prospects for rural non-agricultural development. Rising incomes from agriculture and the non-farm sector will not only sharply reduce absolute poverty in rural areas but hunger as well, except perhaps in some tribal areas. Malnutrition may, however, continue to persist, as it has in the developed world, via the addition of obesity problems. Under a pessimistic vision, economy-wide growth will be slower, and the slowdown in economy-wide growth will reduce the urban spillovers to higher agricultural and non-agricultural demand, and technology spillovers in the non-farm sector. Slow agricultural growth could not only result from reduced demand for food, but also if (a) technical change in agriculture remains slow, (b) services for part-time smallholders are not scaled up and improved, (c) technology adoption are limited more to the full-time farmers, and (d) female farmers have limited entrepreneurial opportunities. The combination of relatively slow agricultural growth will reduce rural non-farm sector growth, which will also suffer from reduced urban spillovers. Rural income growth and wage growth will be lower. Rural-urban incomes and consumption ratios will deteriorate, and rural poverty will decline fairly slowly, even in better located and endowed rural areas. The private sector is emerging as a key driver of many components of agricultural and rural development. All of the non-farm sector development and all of farm investment is a private sector activity. In addition, the private sector is transforming the marketing system from the farm to consumers; it has become a major source of new technology, including GMOs, and seeds supplies; it has entered agricultural extension in a significant way, via contract farming and in input supply; the private sector is providing piped water in canal systems to irrigators; it has entered agricultural credit via contract farming and microfinance; and it is assisting in the administration of land record systems. NGOs have also entered agricultural extension, natural resources management, fostering of linkages of farmers to market opportunities, and micro-finance. Opportunities for public-private partnerships and partnerships with the private sector and NGOs are growing significantly, and need to be mobilized much better. Despite the constraints arising for rural welfare from slow urban employment growth, rapid agricultural growth can also contribute significantly. Over the coming decades, agriculture will continue to diversify rapidly towards high value commodities, and deal with declining farm sizes, feminization of the labor force, increasing water stress, and climate change. These opportunities and challenges cannot be managed by small adjustments in existing institutions, policies and programs. In Centennial Group (2012), a full set of bold recommendations is spelled out that would help bring about an optimistic vision for agriculture. Box 3 further details how land reform, land administration, and land markets can support an optimistic vision.
25
Box 3. How land reform, land administration, and land markets can support an optimistic vision
Even though under our visions for the future of agriculture large scale consolidation of land holdings is neither necessary nor likely, flexible and secure land transactions contribute in several ways to the realization of the vision, as demonstrated by a series of careful studies using the REDS data of NCAER:
• Land reform has not led to inefficient small holdings, but instead has led to higher asset accumulation in states that underwent more land reform, higher income growth, and higher educational attainments of children.
• Land rentals have steadily declined, and are unlikely to become a major avenue for the aggregation of large farms. Instead (i) land rental has been an important avenue for land access for poor, land scarce and landless households, and therefore has supported poverty reduction in an environment with limited rural-urban migration options. (ii) Those who rent land obtain higher returns to their labor than available in the casual labor market. (iii) State level land rental restrictions reduce the ability of the poor to get access to land and their productivity.
• Land sales markets transferred land to more efficient producers who increased their incomes. However, village weather shocks encouraged distress sales by poor households. Where employment guarantee schemes were operating, they reduced such distress sales; MGNREGA will reinforce this mechanism. With such safeguards in place, constraints on land sales among land reform beneficiaries and in tribal areas can be safely eliminated.
• Amendments in the Hindu Succession Act that give equal rights to sons and daughters to inherit land significantly increased women’s probability of inheriting land, although it did not bring about full gender equality. Girls raised by women who had inherited land had significantly higher levels of education than those raised by women not subject to the amended Act. In a feminizing agriculture, women’s rights to inherit land is even more important.
• Computerizing registration of deeds and/or textual records is fully or partly completed in AP, GU, KA, MA, RJ, and TN. Computerization of textual records was facilitated through private sector contracting. In Maharashtra, computerizing registration of deeds has been associated with a 50% increase in the number of registered transfers. Stamp duty collected during the same period has more than doubled. Land transactions in sales and rental markets have been simplified and made more secure. Better land records will also make it easier to use small parcels of highly valuable land as collateral for loans to finance investments in agriculture and in the non-agricultural sector.
• In tribal areas, individual or community land rights are neither recorded nor can they be transacted. There is also no system of land administration for traditionally ‘marginal’ lands. In tribal areas land administration should first focus on the registration of communal tenure, and eventually of individual tenure, if the communities decided in an open and transparent vote to move to private property. This is the approach that is now used in Mexico and other countries. Improved land administration would ensure greater security of tenure and facilitate rental and sales to enable tribal populations to obtain the same benefits associated with land ownership as other farmer groups.
The key recommendations resulting from these studies are as follows:
• Consider further provision of land to landless and land poor people; • Eliminate remaining constraints on land rental; • Strengthen land inheritance rights for women; • Clarify and record rights in marginal areas traditionally outside the system, and tribal areas, by
recognizing and recording communal tenure, and by systematically resolving conflicts; and • Further improve land administration in rural areas via computerization and spatial records.
Source: Deininger and Nagarajan (2011).
26
An optimistic future for Indian agriculture - vision and policies Over the next few decades, accelerating investment and productivity growth, and maintaining income parity in agriculture will require much accelerated technical change, further diversification into high valued crops, continued growth of irrigation, and further diversification of farmers to the non-farm sector. Agricultural research will continue to be provided by both the public and the private sector, with the public sector having a particularly important role in upstream technologies and in technologies with limited private appropriability such as open pollinated varieties or agronomic practices and soil conservation. The public sector will have to become more accountable to farmers and consumers more efficient. As the failure to document adverse side effects of transgenic crops becomes ever more apparent, biotechnology and transgenic crops will become more widely accepted, and competition among private sector providers will reduce the costs of biotech inputs. Transgenic crops will therefore become a major source of total factor productivity growth. Agricultural extension will become much more pluralistic with rapid growth of extension by input suppliers and contractors of output, via scaling up of NGO extension efforts and of mobile applications for agricultural information on technologies and practices, inputs and output markets. At the same time, the public sector, via stronger support from the state levels, should be able to strengthen the ATMA model of coordination and provision of extension in much closer coordination with private sector providers. All extension providers will continue to struggle with the issue of how to provide extension to the many small and part-time farmers, and to the rising share of women farmers. The challenges of how best to provide extension in rainfed farming, semi-arid, arid areas, and tribal areas will continue to preoccupy the public and NGO sectors, which should find it useful to cooperate more. Technical change, diversification, and continued irrigation growth may not be enough to maintain agricultural and rural incomes in line with rapidly growing urban incomes. Instead, significant financial support to farmers may be required. Current subsidies to fertilizer, electricity, water, and support to crop prices are tied to inputs and outputs. Subsidies are large but an inefficient means to transfer income to farmers, and they have adverse environmental impacts. Reformed, and more efficient subsidies, will have to shift to broad cash transfers on a per farm basis rather than linked to products, and include input vouchers favoring small farmers. Existing constraints on agricultural marketing via regulated markets will have to be eliminated, and marketing and value chains will have to be modernized at an accelerated pace from the farm to the retail outlet. Intense competition in marketing will help constrain the markups in the value chain and therefore assist in combating food inflation. Although some small and part-time farmers may encounter greater marketing problems than larger and full-time farmers, all classes of farmers will be able to avail themselves of better marketing options thanks to the cell phone and rising incentives of retailers and processors to ensure themselves of high quality outputs via contract farming. Water management under canal irrigation will have shifted to more demand-driven modes of providing water in a timely and controlled manner, often via pumping and in pipes, and at much higher water use efficiencies. Groundwater irrigation as well as private pumping from canals and
27
other water sources will continue to be the major source of irrigation growth. The problems of reliable electricity supply to both agricultural water users and rural consumers will be resolved in many states, but not without complex political problems and twists and turns. Groundwater depletion will remain a major threat in semi-arid, arid, and hard rock areas, but solutions that are responsive to the aspirations of millions of irrigators, rather than of a command and control type, will emerge in many places. Water harvesting, groundwater recharge, and drip and sprinkler irrigation will help significantly in reducing depletion. Nevertheless, command and control interventions may be required in some of the most critical watersheds. It is hard to see how the enormous challenges of agricultural growth, natural resource management, and social services for rural areas can be resolved without greater citizen empowerment and decentralization. Such reforms have been under discussion in India for a very long time but all initiatives so far have failed to bring them about. Reforms will have to be driven primarily by the states, but with support from strong incentives and perhaps further legislative interventions provided by the Center as well. They will not come about without pressures from below. Therefore, support for transformative institutions such as SHGs, farmer associations, and organizations of the poor and marginalized will have to expand. More than in other areas the possibility of continued failure to reach these policy intentions is high. Agricultural and rural development programs of the Center will be consolidated from the hundreds of central and centrally-sponsored schemes to a sharply reduced set of block grants that will provide much more flexibility for implementers at state, district, block and village levels. Many of them will also become much more empowering of the final beneficiaries who will take a much greater role in planning and implementation of the schemes. Roles and accountabilities will be clarified and strengthened, along with monitoring, evaluation, and impact evaluation. As a consequence, implementation of agricultural and rural development programs could be significantly improved, become more transparent, and less a source of corruption.

28
References Ahluwahlia, Montek. 2011. Prospects and policy challenges in the twelfth plan. Economic and
Political Weekly 46(21): 88-105. Basole, Amit and Deepankar Basu. 2011. Relations of production and modes of surplus
extraction in India: Part I. Agriculture, Economic and Political Weekly 46(42): p 41-58. Bhagat, R.B.. 2011. Emerging pattern of urbanization. Economic and Political Weekly 46(34):
10-12. Binswanger-Mkhize, Hans P. and Alwin d’Souza. 2011a. Structural transformation of the
Indian economy and of its agriculture. Backgound paper to Centennial Group (2012). Binswanger-Mkhize and Alwin d’Souza. 2011b. India, 1980-2008, structural change at the state
level. Background paper to Centennial Group (2012). Binswanger-Mkhize, Hans P., K. Pradhan, and Sudhir Singh. 2011(a). Impact of changing prices
and rising wages of Indian agriculture, 1999–2007. Background paper to Centennial Group 2012.
Binswanger-Mkhize, Hans-P., Kailash C. Pradhan, Hari K. Nagarajan, Sudhir K. Singh, and J.P. Singh. 2011(b). India 1999-2007: Structural change of Indian agriculture at the village and household level. Background Paper to Centennial Group 2012.
Centennial Group. 2012. India 2039: Transforming agriculture.
Chowdury, Subhanil. 2011. Employment in India: What does the latest data show? Economic and Political Weekly 46(32): 23-26.
Datt, Gaurav and Martin Ravallion. 2009. Has India’s economic growth become more pro-poor in the wake of economic reforms? Washington, DC: World Bank, Policy Research Working Paper 5103.
Deininger, Klaus and Hari Nagarajan. 2011. Land policy and land administration in an environment of rapid economic growth. Background Paper to Centennial Group, India, 2039: Transforming Agriculture, Washington DC.
Eswaran, M, Kotwal, B Ramaswami and W Wadhwa. 2008. How does poverty decline: Suggestive evidence from India, 1983-1999. Bread Policy Paper No 14, http://ipl.econ.duke.edu/bread/papers/policy/p014.pdf
Eswaran, Mukesh, Ashok Kotwal, Bharat Ramaswami and Wilima Wadhwa. 2009. Sectoral labour flows and agricultural wages in India, 1983-2004: Has growth trickled down? Economic and Political Weekly 44(2): 46-55.
Foster, Andrew D. and Mark R. Rosenzweig. 2003. Agricultural development, industrialization and rural inequality. Providence, RI: Brown University, Mimeo.
Government of India, 2008, 11th 5-Year Plan: Inclusive Growth, Planning Commission, New Delhi
Government of India. 2011. Faster, sustainable and more inclusive growth: An approach paper to the 12th 5-Five Year Plan. Planning Commission, New Delhi.

29
Fuglie, Keith O., forthcoming. Total factor productivity in the global agricultural economy: Evidence from FAO data. In Julian Alston, Bruce Babcock and Philip Pardey, eds, The shifting patterns of agricultural production and productivity worldwide. Midwest Agribusiness Trade and Research Information Center (MATRIC): Iowa State University.
Hazell, P., and S. Hagbladde. 1993. Farm-nonfarm growth linkages and the welfare of the poor. In M. Lipton, and J. van der Gaag,eds., Including the poor pp. 190–204. Washington, DC: World Bank.
Hazell, Peter B., Derek Headey, Alejandro Nin Pratt and Derek Byerlee. 2011. Structural imbalances and farm and nonfarm employment prospects in rural South Asia. Washington DC: Report for the World Bank.
Himanshu, Peter Lanjouw, Abhiroop Mukhopadhyay and Rinku Murgai. 2011. Non-farm diversification and rural poverty decline: A perspective from Indian sample survey and village study. London, UK: Working Paper 44. Asia Research Centre, London School of Economics and Political Science.
Oxus. 2011. Indian inflation: Populism, politics, and procurement prices. Developing Trends 1(2). New Delhi: Oxus Research Report.
Parikh, Kirit, Hans P. Binswanger-Mkhize, Probal Ghosh and Alwin d’Souza. 2011.Double digit inclusive growth: Not without robust agricultural growth. Backround Paper to Centennial Group, India 2039: Transforming Agriculture. Washington DC.
Planning Commission, Government of India. 2009. Report of the expert group on methodology for estimation of poverty. New Delhi: Tendulkar Report.
Ravallion, Martin and Gaurav Datt. 1996. How important to India's Poor is the sectoral composition of economic growth? World Bank Economic Review 10: 1-26.
Timmer, C. Peter. 2009. A world without agriculture: The structural transformation in historical perspective. Washington, DC: American Enterprise Institute.
Timmer, C. Peter, and Selvin Akkus. 2008. The structural transformation as a pathway out of poverty: Analytics, empirics, and politics. Working paper 15 (with accompanying technical annexes). Washington DC: Center for Global Development.
World Bank. 2010. Perspectives on poverty in India: Stylized facts from survey data. Washington DC: March 11.

30
Core literature on India 1960-2010: Structural change, the rural non-farm sector, and the prospects for agriculture Timmer, C. Peter. 2009. A world without agriculture: The structural transformation in historical perspective. Washington, DC: American Enterprise Institute. This paper reviews the theory of structural transformation elaborated in the1950s and confronts it with data from recently industrialized and developing countries. It concludes that it has become more difficult to reach the point where the agricultural and the nonagricultural sectors start to converge in labor productivity.
Johnston, Bruce F. and John W. Mellor. 1961. The role of agriculture in economic development. American Economic Review 51(4): 566-93. This classic paper develops the basic ideas and models that show the pathways by which agricultural growth can contribute to economic development and poverty reduction. Its ideas have been empirically tested many times and stood up very well.
Hazell, P., and S. Hagbladde. 1993. Farm-nonfarm growth linkages and the welfare of the poor. In M. Lipton, and J. van der Gaag,eds., Including the poor pp. 190–204. Washington, DC: World Bank.
The authors summarize the literature that emerged in the 1970s and 1980s on the composition and drivers of the rural non-farm sector. The drivers of non-farm growth are shown to be mostly the linkages with agriculture, via forward, backward and consumer demand linkages, but they have been much stronger in Asia than in Africa.
Datt, Gaurav and Martin Ravallion. 2009. Has India’s economic growth become more pro-poor in the wake of economic reforms? Washington, DC: World Bank, Policy Research Working Paper 5103.
In this paper the authors update their analysis up to the early 1990s where they measured the contributions to urban, rural and national poverty reduction of urban and rural growth. They show that before 1991 rural growth was the main driver of urban, rural and national poverty reduction, which is consistent with the ideas of Johnston and Mellor (1961) in the second paper listed above. They then show that since the early 1990s, rural growth still contributes to rural poverty reduction, but that urban growth has emerged as a more important driver of urban and rural poverty reduction than rural growth.
Foster, Andrew D. and Mark R. Rosenzweig. 2003. Agricultural development, industrialization and rural inequality. Providence, RI: Brown University, Mimeo.
This paper shows that rural industrialization is particularly strong in areas that were bypassed by the green revolution, and therefore had slower wage growth and lower wages than the green revolution areas. This means that rural industrialization has sought out low wage environments and thereby has contributed to the inter-regional equalization of rural incomes.

31
Hazell, Peter B., Derek Headey, Alejandro Nin Pratt and Derek Byerlee. 2011. Structural imbalances and farm and nonfarm employment prospects in rural South Asia. Washington, DC: Report for the World Bank.
This paper updates paper number three in this list with special reference to South Asia. It shows that non-farm employment and self employment has become a very important component of overall employment growth. It also warns that rural labor force growth in South Asia will continue for several decades and pose an enormous employment challenge for the countries.
Ahluwahlia, Montek. 2011. Prospects and policy challenges in the twelfth plan. Economic and Political Weekly 46(21): 88-105.
This paper reviews achievements of the Indian economy in the current five year plan, such as the accelerating poverty reduction, and uses this background to analyze the challenges that have to be addressed in the coming five year plan that will start in late 2012.
Chowdury, Subhanil. 2011. Employment in India: What does the latest data show? Economic and Political Weekly 46(32): 23-26.
The author reviews the disappointing employment trends in the Indian economy in the last decade and analyzes the reasons for it.
Eswaran, Mukesh, Ashok Kotwal, Bharat Ramaswami and Wilima Wadhwa. 2009. Sectoral labour flows and agricultural wages in India, 1983-2004: Has growth trickled down? Economic and Political Weekly 44(2): 46-55.
This paper analyzes the rapid growth of the rural nonfarm sector and the employment and wage growth that has been associated with it.
Himanshu, Peter Lanjouw, Abhiroop Mukhopadhyay and Rinku Murgai. 2011. Non-farm diversification and rural poverty decline: A perspective from Indian sample survey and village study. London, UK: Working Paper 44. Asia Research Centre, London School of Economics and Political Science.
This paper brings together a number of studies that analyze the drivers of rural non-farm growth and shows how the rural non-farm sector has helped in reducing rural poverty in India.