the role of the pim1 kinase in t-cell acute lymphoblastic ... · t-cell acute lymphoblastic...
TRANSCRIPT
The role of the PIM1 kinase in T-cell acute
lymphoblastic leukemia/lymphoma
Wordcount: 22,067
Paula Gomez Garcia Student number: 01007606
Supervisor: Prof. Dr. Pieter Van Vlierberghe
Tutor: Renate De Smedt
A dissertation submitted to Ghent University in partial fulfilment of the requirements for the degree of
Master of Science in the Biomedical Sciences
Academic year: 2016-2017

PREFACE
In the next few lines, I would like to thank everyone who, in one way or another, contributed in
the making of this thesis.
So, thank you to everyone at the PVV lab for the help and patience. A thank you to my
promotor, Prof Dr. Pieter Van Vlierberghe, for the opportunity to work in his research group
and all the help provided. Thank you to Renate De Smedt, for answering all my questions and
the energy and effort put in guiding me the past year. Also, thank you to all the friends who
had to put up with my complaining for months. And last but definitely not least, thank you to
my parents for the unconditional emotional and financial support throughout the years.
Without your help and support, this work would not have reached its present form.

TABLE OF CONTENTS
Samenvatting ............................................................................................................ 1
Summary ................................................................................................................... 2
1 Introduction .......................................................................................................... 3
1.1 The Immune System and Normal T Cell Development ................................................. 3
1.1.1 Hematopoiesis ....................................................................................................... 3
1.1.2 The Immune system .............................................................................................. 4
1.1.3 Types of T lymphocytes ......................................................................................... 4
1.1.4 T cell development ................................................................................................. 5
1.2 Leukemia ..................................................................................................................... 7
1.2.1 T-cell acute lymphoblastic leukemia ....................................................................... 8
1.2.2 Acute T-cell lymphoblastic lymphoma ...................................................................12
1.2.3 Treatment .............................................................................................................13
1.3 PIM1 as a potential oncogene in T-ALL/T-LBL ............................................................13
1.3.1 Structure and regulation ........................................................................................14
1.3.2 Downstream targets of PIM1 .................................................................................15
1.3.3 PIM1 overexpression in cancer .............................................................................16
1.3.4 PIM1 as a possible therapeutic target in T-ALL/T-LBL ..........................................17
2 Materials and Methdos ....................................................................................... 17
2.1 Patient samples and human cell lines .........................................................................17
2.1.1 Patient sample and Sanger validation ...................................................................17
2.1.2 Cell line and culture conditions .............................................................................18
2.2 Compound assays and cell viability measurement ......................................................18
2.3 RNA sequencing .........................................................................................................20
2.3.1 GSEA and DAVID analysis ...................................................................................20
2.3.2 qPCR validation ....................................................................................................21
2.4 Western blot analysis of phosphoproteins ...................................................................21
2.5 Apoptosis and cell cycle analysis ................................................................................23
2.5.1 Cell cycle analysis ................................................................................................24
2.5.2 Apoptosis assay ....................................................................................................24
2.6 Animal studies .............................................................................................................25
3 Results ................................................................................................................ 25
3.1 HSB-2 as an in vitro model and TP3654 as inhibitor of choice ....................................26
3.1.1 PIM1 expression in T-ALL/T-LBL cell lines and PIM1 translocation patient ...........26

3.1.2 PIM1 inhibitors ......................................................................................................27
3.2 The oncogenic role of PIM1 in T-ALL/T-LBL ................................................................28
3.2.1 Possible cooperation between PIM1, NOTCH1 and loss of EP300 in a T-LBL
patient............................................................................................................................28
3.2.2 RNA sequencing of HSB-2 cells before and after TP3654 treatment ....................30
3.2.3 Phosphorylation effects of PIM1 inhibition can be perceived after a 6h treatment .33
3.2.4 PIM1 phosphorylates GSK3β leading to lowered MCL1 protein levels ..................37
3.2.5 PIM1 levels rise after a 6h treatment and decline after an 18h treatment ..............37
3.3 Therapeutic potential of PIM1 inhibition in T-ALL/T-LBL ..............................................38
3.3.1 PIM1 inhibitors reduce viability through apoptosis and cell cycle arrest ................38
3.3.2 Glucocorticoids and TP3654 work synergistically to reduce viability in HSB-2 ......40
3.3.3 TP3654 reduces %hCD45 in blood and spleen from engrafted mice ....................41
4 Discussion .......................................................................................................... 42
4.1 HSB-2 as in vitro model and TP3654 as inhibitor of choice .........................................42
4.2 The oncogenic role of the PIM1 kinase in T-ALL/T-LBL...............................................43
4.3 The PIM1 kinase a potential therapeutic target in T-ALL/T-LBL...................................46
5 Conclusion and future perspectives ................................................................ 47
6 References .......................................................................................................... 49
Appendix .................................................................................................................... I
Appendix 1: PCR master mixes and programmes for IKZF1, EP300 and NOTCH1 primers I
Appendix 2: DNA extraction from gel ................................................................................. II
Appendix 3: monotherapy and combination therapy in HSB-2 ............................................ II
Appendix 4: HSB-2 treatment for RNA sequencing ............................................................ V
Appendix 5: cell collection ................................................................................................. VI
Appendix 6: RNA isolation ................................................................................................ VI
Appendix 7: cDNA synthesis ............................................................................................ VII
Appendix 8: qPCR ........................................................................................................... VII
Appendix 9: cell lysis and protein extraction from cells ...................................................... IX
Appendix 10: Total protein concentration measurement .................................................... IX
Appendix 11: Western blot ................................................................................................. X
Appendix 12: cell cycle analysis ....................................................................................... XII
Appendix 13: apoptosis assay .......................................................................................... XII
Appendix 14: bleeding mice ............................................................................................ XIII
Appendix 15: Cell harvesting from mice .......................................................................... XIII
Appendix 16: Gel electrophoresis on NOTCH1, EP300 and IKZF1 cell lines .................... XV
Appendix 17: Top 30 differentially expressed genes according to RNAseq ...................... XV

Appendix 18: qPCR of differentially expressed genes in HSB-2 ...................................... XVI
Appendix 19: qPCR of differentially expressed genes in spleen and bone marrow ......... XVI
Appendix 20: GSEA snapshot of enrichment results ..................................................... XVIII
Appendix 21: Monotherapy in HSB-2 .............................................................................. XIX

1
SAMENVATTING
Achtergrond: T-cel acute lymphoblastische leukemie/lymfoom (T-ALL/T-LBL) is een
hematopoietische maligniteit te wijten aan genetische mutaties in thymocyten. Behandeling
bestaat uit agressieve combinatie chemotherapie die gepaard gaat met cytotoxiciteiten en
neveneffecten. Onlangs werd een T-LBL geïdentificeerd met verhoogde niveaus van het PIM1
kinase. Deze thesis heeft als doel te achterhalen hoe PIM1 bijdraagt tot maligne transformatie
van thymocyten, en of gerichte PIM1 inhibitie een mogelijke behandeling zou kunnen zijn in T-
ALL/T-LBL.
Methoden: Sanger sequencing werd uitgevoerd om de T-LBL patiënt mutaties te valideren.
Compound assays met PIM1 inhibitoren en chemotherapeutica werden uitgevoerd om de
IC50’s en combinatie indices te bepalen. De fosforylatie effecten van PIM1 inhibitie werden
bestudeerd d.m.v. western blot. De werking van de PIM1 inhibitoren werd geanalyseerd met
apoptose en cel cyclus analyse. Het in vivo potentieel van PIM1 inhibitie werd bestudeerd in
muizen.
Resultaten: Er is mogelijke coöpereatie tussen PIM1, NOTCH1 en verlies van EP300 in de T-
LBL patiënt. In vitro PIM1 inhibitie leidt tot een daling aan fosforylatie op cMyc en GSK3β (gaat
gepaard met vermindering aan MCL1 niveaus), en een stijging van BAD (Ser136) fosforylatie.
In vitro verlagen PIM1 inhibitoren celviabiliteit door het induceren van cel cyclus arrest en
apoptose. PIM1 inhibitor TP3654 werkt op een synergistische manier met glucocorticoïden.
TP3654 In vivo behandeling in muizen vermindert %hCD45.
Conclusies: Stabilisatie van cMyc, inhibitie van apoptose (door fosforylatie van BAD en
GSK3β) verklaart deels hoe PIM1 meehelpt bij maligne transformatie in T-ALL/T-LBL. In vitro
en in vivo gerichte PIM1 inhibitie in T-ALL/T-LBL heeft een veelbelovende toekomst.
2
SUMMARY
Background: T-cell acute lymphoblastic leukemia/lymphoma (T-ALL/T-LBL) is an aggressive
hematopoietic malignancy that results from genetic mutations in the thymocytes. Aggressive
chemotherapeutic treatment results in toxicities and side effects. Recently a T-LBL patient with
elevated levels of the PIM1 kinase was identified. This thesis aimes to uncover how PIM1
contributes to malignant transformation of thymocytes, and whether targeted PIM1 inhibition
could be a feasible treatment for T-ALL/T-LBL.
Methods: Validation of the T-LBL patient mutations was done using Sanger sequencing.
IC50’s and combination indexes were determined by performing compound assays with PIM1
inhibitors and chemotherapeutics. Phosphorylation effects of PIM1 inhibition were studied by
western blot. The mechanism of action of the PIM1 inhibitors was studied by apoptosis and
cell cycle analysis. In vivo potential of PIM1 inhibition was studied on patient derived xenografts
in mice.
Results: There is a possible cooperation between PIM1, NOTCH1 and loss of EP300 in the
T-LBL patient. In vitro PIM1 inhibition leads to an increase in BAD (Ser136) phosphorylation
and a decline in phosphorylation on cMyc and GSK3β (that coincides with lowered MCL1
protein levels). In vitro PIM1 inhibitors reduce viability by inducing G1 cell cycle arrest and
apoptosis. PIM1 inhibitor TP3654 works synergistically with glucocorticoids to reduce cell
viability. In vivo treatment with TP3654 in mice reduces %hCD45.
Conclusions: Stabilization of cMyc, inhibition of apoptosis (through the phosphorylation of
BAD and GSK3β) partly explains how PIM1 helps induce malignant transformation in T-ALL/T-
LBL. In vitro and in vivo PIM1 targeted therapy in T-ALL/T-LBL holds a promising future.

3
1 INTRODUCTION
T-cell acute lymphoblastic leukemia/lymphoma (T-ALL/T-LBL) is an aggressive hematopoietic
malignancy that is the result of genetic mutations in the thymocytes during T-cell development.
Current T-ALL/T-LBL treatments consist of aggressive chemotherapy that correlates with
dangerous toxicities and side effects. In addition, there still exists a subset of patients that do
not respond to treatment and patients that relapse have a very poor prognosis.
The therapy resistant subgroups and the current therapeutic toxicity highlight the need for more
effective and specific treatments. The genetic basis of T-ALL/T-LBL can be used to uncover
new therapeutic targets for targeted therapies.
1.1 The Immune System and Normal T Cell Development
1.1.1 Hematopoiesis
Mature blood cells need to be constantly replenished due to their relatively short lifespan. The
process by which they are formed takes place in the bone marrow (BM) and is called
hematopoiesis.
As different as all blood cells are, they all originate from a common progenitor cell: the
hematopoietic stem cell (HSC). HSCs are multipotent cells capable of self-renewal and
differentiation; they can form exact copies of themselves, maintaining a pool of HSCs and thus
preventing their depletion, and/or they can give rise to cells that will further differentiate into
specialized cells [1].
The HSCs progeny can differentiate into either the common myeloid progenitor, that will
ultimately give rise to red blood cell (RBC) and most cells of the innate immune system, or the
common lymphoid progenitor, that ultimately differentiates into natural killer (NK) cells and
lymphocytes.
Figure 1 Simplified hematopoiesis [2]. The hematopoietic stem cell gives rise to all blood cells through the myeloid and lymphoid cell lineage.

4
1.1.2 The Immune system
The immune system is the entirety of biological processes within an organism that protects it
against external (e.g. bacteria) and internal threats (e.g. cancer cells) and the damage they
cause. It consists of a variety of effector cells and molecules, and unlike most other systems
of the body, the immune system is not localized to a specific region or organ.
To function properly, the immune system must fulfill four important tasks:
immunological recognition (the ability to recognize foreign agents and distinguish them from
oneself), immune effector functions (the ability to contain and, if possible, eliminate the
infection), immune regulation (the ability to self-regulate, failure to do so can results in allergies
and autoimmune diseases), and generating immunological memory (this is the ability of
protecting the body against repeated infection. If an individual is infected with a pathogen to
which they have previously been exposed, they will be able to produce an immediate and
stronger specific response. This long lived specific immunity is the result of memory B and T
lymphocytes) [1,3].
The immune system can be divided into two types:
Innate immunity is non-specific and provides an immediate response to pathogens that cross
the physical (skin) and chemical barriers (mucous membranes). It does not discriminate and
attacks pathogens through several specialized cells such as phagocytes and neutrophils.
Adaptive immunity is, in contrast to the innate immune response, specific and takes several
days to develop and kick in. Because of its specificity, the adaptive immune response is
capable of removing pathogens efficiently. This specificity is the result of the remarkably
specific antigen receptors on the surface of B and T lymphocytes; these receptors show a very
wide range of antigen specificity unique to each lymphocyte, enabling them to recognize
practically any antigen. How this wide variety of receptors is achieved will be discussed in
paragraph 1.1.3.1 [1,3].
1.1.3 Types of T lymphocytes
Lymphocytes are predominantly inactive, dormant cells with largely inactive chromatin. These
naïve lymphocytes become activated when their receptors come in contact with their specific
antigen, after which they differentiate into effector lymphocytes. When activated, B
lymphocytes will proliferate and differentiate into plasma cells that produce antibodies (ABs).
Professional antigen presenting cells (APCs), such as dendritic cells (DC), ؚؚpresent a specific
antigen (under the form of peptides bound to proteins of the major histocompatibility
complex(MHC)) to naïve T cells for the first time. The antigen T-cell receptor (TCR) binding

5
leads to proliferation and differentiation of the naïve T cell into one of three different types of
effector T cells, each with a different function.
Cytotoxic T cells (responsible for killing cells that have been infected with intracellular
pathogens), T helper cells (help activate and modulate the behavior of other immune cells by
providing different sorts of signals through the release of cytokines. For example, they
stimulate the production of ABs by the B cells) or regulatory T cells (they make sure that the
immune response doesn’t get out of control by suppressing T cell mediated immunity) [1,3].
1.1.4 T cell development
Although both B and T lymphocytes originate from the common lymphoid progenitor in the BM,
only the B cells mature there. The thymic seeding progenitors (TSPs) leave the BM and migrate
through blood vessels to the thymus where the final T cell specification takes place; the thymic
microenvironment is essential as it provides the signals required for T cell development.
Murine T cell development models show that upon arrival TSPs come in contact with the thymic
epithelium and they progress to the early thymic progenitor (ETP) stage. ETPs are still
uncommitted and retain some myeloid, NK, and B cell potential. They lack any expression of
T-cell receptor (TCR) and CD4 or CD8 and are thus also termed double negative (DN) cells.
There are four subsequent steps in the DN thymocyte stage: DN1, DN2, DN3 and DN4; the
difference between these four major DN cell populations lies in the surface expression of CD44
and CD25 [4].
ETPs arrive in the thymus at the cortical-medullary junction. The DN1 cells then migrate deeper
in the cortex where they receive signals from the cortical thymic epithelial cells (cTECs) and
lose their multipotency. An important signal provided by cTECs activates the NOTCH1
pathway in DN1 thymocytes. During the DN1 stage, thymocytes express NOTCH1, it’s
expression will then increase until the DN3 stage. NOTCH1 signaling helps these early
thymocytes suppress their multipotency and guarantee T cell identity. DN2 thymocytes thus
lose their multipotency [5].
During the DN2 stage gene rearrangements of the TCRγ, TCRδ, and TCRβ loci begin and are
completed at the DN3 stage. At this stage, NOTCH1 no longer influences lineage commitment,
it rather promotes cell survival and metabolism through the PI3K/AKT pathways [4].
Nevertheless, NOTCH1 expression mediates TCRβ rearrangements [6].
The minority of DN2 thymocytes will develop into γδ T cells (which lack CD4 and CD8 surface
expression even when mature); DN2 cells expressing high levels of IL-7 (Interleukin 7) tend to
become γδ T lymphocytes. So, the majority of cells undergo TCRβ rearrangements. Cells that
are unable to rearrange the TCRβ locus remain at the DN3 stage and soon after undergo

6
apoptosis, this is called β-selection [5]. Thymocytes with successful TCRβ rearrangements
progress to the DN4 stage; from here out thymocytes will begin to migrate to the inner cortex.
After successful recombination, the expressed β-chains will pair up with pre-rearranged α
chains, assembling a pre-TCR, that forms a complex with CD3. The pre-TCR signals in a ligand
independent manner leading to: thymocyte proliferation, arrest of any additional TCRβ
rearrangements, and the expression of CD4 and CD8. During this double positive (DP) stage,
thymocytes rearrange their TCRα locus.
DP cells will then express functional TCRs and undergo positive selection: only DP cells that
recognize and interact correctly with self-MHC:self-peptide complexes (presented by cTECs
and dendritic cells) survive and mature into either CD8 or CD4 single positive (SP) thymocytes.
IL-7 appears to be important for positive selection in thymocytes. These SP cells will then
migrate to the medulla where they undergo negative selection: SP thymocytes with high affinity
(these are autoreactive T cells) for self-peptides are eliminated. These SP cells mature into
naïve T-lymphocytes that emigrate to secondary lymphoid organs where they differentiate into
effector lymphocytes when their receptor comes in contact with their specific antigen [4,5].
Figure 2 Thymic T cell maturation [4]. TSPs enter thymus at the cortical-medullary junction and then move through the thymic cortex and subcapsular zone where they mature through the different DN stages. The DN2 and DN3 populations can be divided into two different subpopulations; DN2 according to CD117 cell-surface marker expression and DN3 according to CD27 expression. Checkpoints during T cell maturation are shown as circled numbers. DN1 checkpoint, where Notch1 signaling ensures T cell lineage commitment. β-selection checkpoint. Positive and negative selection checkpoint. The colors indicate key developmental stages. Blue: early uncommitted progenitors. Pink: T cell-committed progenitors before the separation of γδ and αβ T cells. Yellow: αβ committed T cells.
1.1.4.1 T cell receptor rearrangements
TCRs are heterodimeric structures consisting of an α and a β chain (or alternatively, in a
minority of T cells: γ and δ) connected by a disulfide bond. Each transmembrane polypeptide
7
chain’s extracellular domain consists of a variable (V) region and a constant (C) region; the V-
region is responsible for antigen recognition.
The variable region of the α chain is encoded by two DNA gene segments (V and J) at the
TCRα locus on chromosome 14. The V region of the β chain however, is encoded by 3 gene
segments (V, D (diversity) and J) at TCRβ locus, on chromosome 7 (Fig 3.).
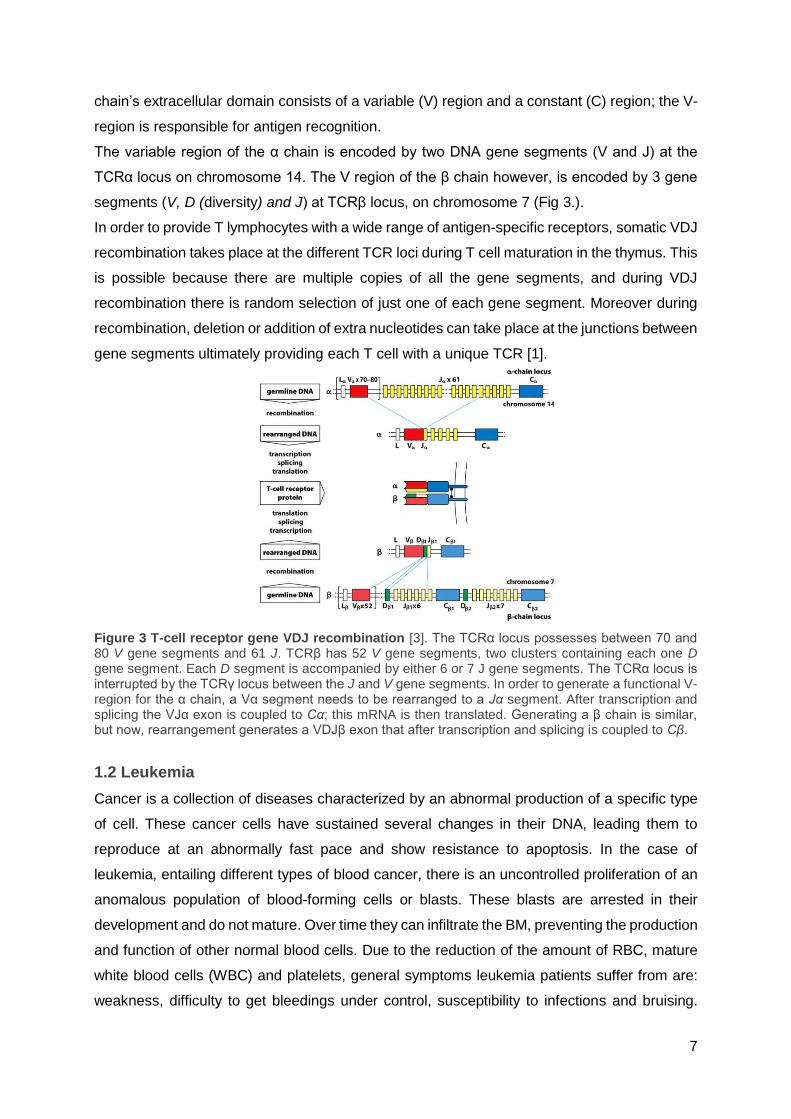
In order to provide T lymphocytes with a wide range of antigen-specific receptors, somatic VDJ
recombination takes place at the different TCR loci during T cell maturation in the thymus. This
is possible because there are multiple copies of all the gene segments, and during VDJ
recombination there is random selection of just one of each gene segment. Moreover during
recombination, deletion or addition of extra nucleotides can take place at the junctions between
gene segments ultimately providing each T cell with a unique TCR [1].
Figure 3 T-cell receptor gene VDJ recombination [3]. The TCRα locus possesses between 70 and 80 V gene segments and 61 J. TCRβ has 52 V gene segments, two clusters containing each one D gene segment. Each D segment is accompanied by either 6 or 7 J gene segments. The TCRα locus is interrupted by the TCRγ locus between the J and V gene segments. In order to generate a functional V-region for the α chain, a Vα segment needs to be rearranged to a Jα segment. After transcription and splicing the VJα exon is coupled to Cα; this mRNA is then translated. Generating a β chain is similar, but now, rearrangement generates a VDJβ exon that after transcription and splicing is coupled to Cβ.
1.2 Leukemia
Cancer is a collection of diseases characterized by an abnormal production of a specific type
of cell. These cancer cells have sustained several changes in their DNA, leading them to
reproduce at an abnormally fast pace and show resistance to apoptosis. In the case of
leukemia, entailing different types of blood cancer, there is an uncontrolled proliferation of an
anomalous population of blood-forming cells or blasts. These blasts are arrested in their
development and do not mature. Over time they can infiltrate the BM, preventing the production
and function of other normal blood cells. Due to the reduction of the amount of RBC, mature
white blood cells (WBC) and platelets, general symptoms leukemia patients suffer from are:
weakness, difficulty to get bleedings under control, susceptibility to infections and bruising.

8
Aside from the BM, leukemia cells can also infiltrate organs such as the spleen, liver, lymph
nodes, and in some cases even the central nervous system (CNS) [7,8].
There are numerous types of leukemia, but overall, they can be grouped according to the
precursor cell from which they originate: lymphoblastic vs. myelogenous. Within this two
groups, leukemia can be further divided according to the speed with which the disease
advances. In the case of chronic leukemia, there is a slow buildup of blasts resulting in patients
that do not experience any symptoms for several months to years. Whereas with acute
leukemia, it can suddenly appear and progress rapidly over the span of days to weeks, which
is why it needs to be treated as soon as possible [7,8].
1.2.1 T-cell acute lymphoblastic leukemia
Acute lymphoblastic leukemia (ALL) is an aggressive genetic heterogeneous hematopoietic
malignancy that can arise from both immature B-cells (B-ALL) and immature T-cells (T-ALL).
There were an estimated of 81 837 (2014) people living with ALL in the United States, and
approximately 5 970 new cases of ALL will be diagnosed in 2017 [9]. T-ALL accounts for about
15% of childhood and 25% of adult ALL cases. It can arise at any age but most cases occur
in young children between the age of two and five. T-ALL is the result of genetic mutations
and/or chromosomal translocations in thymocytes. These genetic changes interfere with the
transcriptional programs that control T cell development, which leads to stage-specific
thymocyte arrest and subsequent clonal expansion [10,11].
The disease is characterized by an elevated number of immature T-cells in BM and peripheral
blood, enlargement of the mediastinal lymph nodes with pleural effusions,
hepatosplenomegaly and frequent infiltration of the CNS [10,11]. Invasion of the CNS is an
aspect that greatly affects the prognosis and CNS-directed therapy greatly improves patient
survival [12].
T-ALL originates in the thymus, where T cell development takes place, and spreads through
the blood to the rest of the body. Due to its acute nature, there is a rapid accumulation of
thymocytes, leaving the BM unable to produce healthy blood cells and if left untreated, patients
will quickly succumb [11,13].
T-ALL leukemogenesis is a multistep process that can happen at nearly all stages of
intrathymic T-cell differentiation [14]. A broad variety of genetic alterations cooperate to
deregulate the mechanisms that control cell growth, proliferation, survival, and differentiation.
These changes lead to thymocyte stage-specific developmental arrest along with uncontrolled
growth and clonal expansion [10,11]. T-ALL genetic alterations can be roughly divided in four
categories of mutations depending on their repercussions: cell cycle defects, impaired

9
differentiation caused by TF defects, proliferative and survival advantage, and self-renewal
properties [10].
1.2.1.1 Genetic basis of T-ALL
1.2.1.1.1 Mutations leading to cell cycle defects
Cell division enables organisms to renew and repair tissues by replacing cells that age and
die. Progression through the cell cycle is a strongly regulated process; if these control systems
malfunction, cells could proliferate uncontrollably. The cell cycle is regulated at certain
checkpoints through internal and external signals [15].
The cell cycle consists of four phases: The S (synthesis) phase during which DNA replication
takes place, the M (mitosis) phase during which sister chromatids go to the opposite poles of
the cell, and two gap phases, G1 and G2; during these gaps the cell prepares for the S and M
phase.
Progression through the different checkpoints relies on cyclin-dependent kinases (CDKs) and
their phosphorylation of the retinoblastoma protein (RB1). CDKs need to bind to a specific
cyclin in order to phosphorylate RB1, which inhibits the cell cycle, however, phosphorylated
RB1 is no longer able to do this [15,16].
During early G1 phase RB1 is hypophosphorylated. Cyclin D binds and activates CDK4 and -
6, this complex phosphorylates RB1 for the first time, after which cyclin E activates CDK2 and
further phosphorylates RB1. Thanks to this last phosphorylation the cell can advance through
the first check point, in the late G1 phase. During the S phase, cyclin A binds CDK2 and later
CDK1. During G2 cyclin B partners with CDK1; this last complex remains important throughout
the M phase.
CDKs are, in turn, controlled by cyclin-dependent kinase inhibitors (CKIs). There are two
groups within CKI: the INK4A and the CIP/KIP family. p15 and p16 (encoded by CDKN2A) are
part of INK4A and they inhibit the association between cyclin D and CDK4 and -6. p21, member
of CIP/KIP, inhibits association of cyclin E/CDK and cyclin A/CDK [15,16].
Another important regulator of the cell cycle is p53. This transcription factor (TF) prevents the
start of the S- or M phase when the cell has accumulated DNA damage by instigating G1 or
G2 arrest. If the DNA damage is such that the cell is no longer able to repair it, p53 induces
apoptosis. p53 is bound and inhibited by MDM2. In turn, interaction between MDM2 and p53
can be broken by ARF (encoded by CDKN2B) so that p53 can activate p21 and inhibit cyclin
A/CDK association and thus arrest the cell cycle at G1, or activate the BAX gene and induce
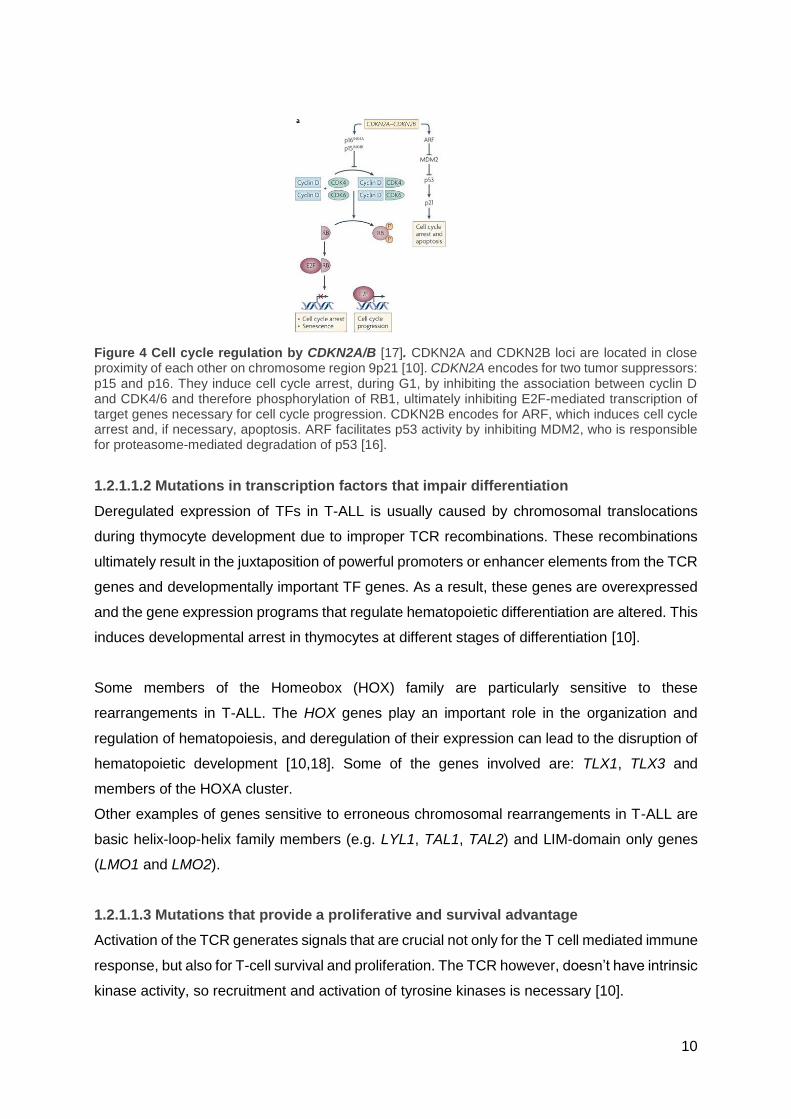
apoptosis [16]. The most common cell cycle alteration found in T-ALL is inactivation of
CDKN2A and CDKN2B by mutation, promoter hypermethylation or focal deletion. Inactivation
of CDKN2A and CDKN2B in T-AL at DNA, RNA or protein levels can be found in about 93%
and 99% of T-ALL samples respectively [10].
10
Figure 4 Cell cycle regulation by CDKN2A/B [17]. CDKN2A and CDKN2B loci are located in close proximity of each other on chromosome region 9p21 [10]. CDKN2A encodes for two tumor suppressors: p15 and p16. They induce cell cycle arrest, during G1, by inhibiting the association between cyclin D and CDK4/6 and therefore phosphorylation of RB1, ultimately inhibiting E2F-mediated transcription of target genes necessary for cell cycle progression. CDKN2B encodes for ARF, which induces cell cycle arrest and, if necessary, apoptosis. ARF facilitates p53 activity by inhibiting MDM2, who is responsible for proteasome-mediated degradation of p53 [16].
1.2.1.1.2 Mutations in transcription factors that impair differentiation
Deregulated expression of TFs in T-ALL is usually caused by chromosomal translocations
during thymocyte development due to improper TCR recombinations. These recombinations
ultimately result in the juxtaposition of powerful promoters or enhancer elements from the TCR
genes and developmentally important TF genes. As a result, these genes are overexpressed
and the gene expression programs that regulate hematopoietic differentiation are altered. This
induces developmental arrest in thymocytes at different stages of differentiation [10].
Some members of the Homeobox (HOX) family are particularly sensitive to these
rearrangements in T-ALL. The HOX genes play an important role in the organization and
regulation of hematopoiesis, and deregulation of their expression can lead to the disruption of
hematopoietic development [10,18]. Some of the genes involved are: TLX1, TLX3 and
members of the HOXA cluster.
Other examples of genes sensitive to erroneous chromosomal rearrangements in T-ALL are
basic helix-loop-helix family members (e.g. LYL1, TAL1, TAL2) and LIM-domain only genes
(LMO1 and LMO2).
1.2.1.1.3 Mutations that provide a proliferative and survival advantage
Activation of the TCR generates signals that are crucial not only for the T cell mediated immune
response, but also for T-cell survival and proliferation. The TCR however, doesn’t have intrinsic
kinase activity, so recruitment and activation of tyrosine kinases is necessary [10].
11
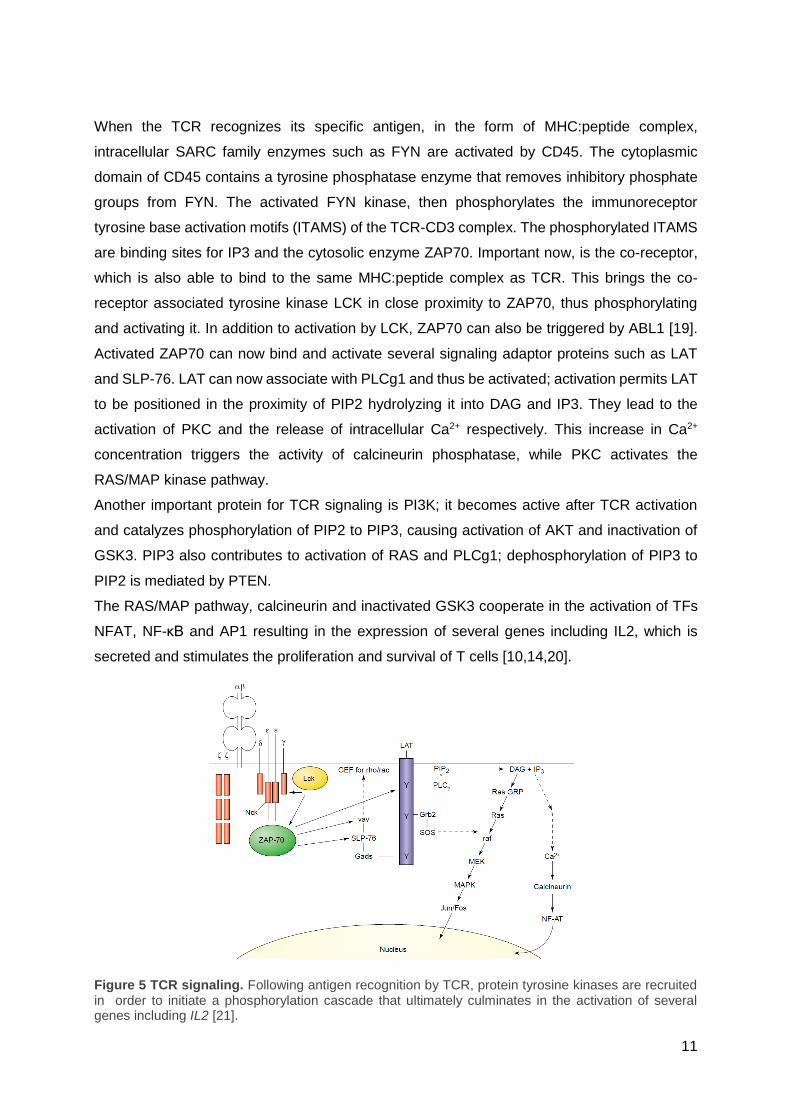
When the TCR recognizes its specific antigen, in the form of MHC:peptide complex,
intracellular SARC family enzymes such as FYN are activated by CD45. The cytoplasmic
domain of CD45 contains a tyrosine phosphatase enzyme that removes inhibitory phosphate
groups from FYN. The activated FYN kinase, then phosphorylates the immunoreceptor
tyrosine base activation motifs (ITAMS) of the TCR-CD3 complex. The phosphorylated ITAMS
are binding sites for IP3 and the cytosolic enzyme ZAP70. Important now, is the co-receptor,
which is also able to bind to the same MHC:peptide complex as TCR. This brings the co-
receptor associated tyrosine kinase LCK in close proximity to ZAP70, thus phosphorylating
and activating it. In addition to activation by LCK, ZAP70 can also be triggered by ABL1 [19].
Activated ZAP70 can now bind and activate several signaling adaptor proteins such as LAT
and SLP-76. LAT can now associate with PLCg1 and thus be activated; activation permits LAT
to be positioned in the proximity of PIP2 hydrolyzing it into DAG and IP3. They lead to the
activation of PKC and the release of intracellular Ca2+ respectively. This increase in Ca2+
concentration triggers the activity of calcineurin phosphatase, while PKC activates the
RAS/MAP kinase pathway.
Another important protein for TCR signaling is PI3K; it becomes active after TCR activation
and catalyzes phosphorylation of PIP2 to PIP3, causing activation of AKT and inactivation of
GSK3. PIP3 also contributes to activation of RAS and PLCg1; dephosphorylation of PIP3 to
PIP2 is mediated by PTEN.
The RAS/MAP pathway, calcineurin and inactivated GSK3 cooperate in the activation of TFs
NFAT, NF-κB and AP1 resulting in the expression of several genes including IL2, which is
secreted and stimulates the proliferation and survival of T cells [10,14,20].
Figure 5 TCR signaling. Following antigen recognition by TCR, protein tyrosine kinases are recruited in order to initiate a phosphorylation cascade that ultimately culminates in the activation of several genes including IL2 [21].
12
Activating mutations in the TCR signaling pathway that lead to the constitutive activation of
tyrosine kinases, or in other molecules in this pathway may give cells a proliferative and
survival advantage.
Proteins in the TCR pathway associated with T-ALL are: ABL1 (usually through protein
fusions), LCK, RAS (involved in other signal transduction pathways and frequently mutated in
many other malignancies, RAS mutations can be found in about 4–10% of T-ALL samples),
PTEN (a tumor suppressor protein that opposes the activity of PI3K), FLT3 (a receptor tyrosine
kinase important for hematopoietic stem cell development; activating mutations are rather rare
in T-ALL), and JAK2 (a receptor tyrosine kinase involved in cytokine signaling; it has been
found constitutively active in T-ALL due to fusion with ETV6) [10,14].
1.2.1.1.4 Mutations that provide self-renewal properties
Binding of its ligand to the NOTCH1 receptor, is followed by proteolytic cleavage of NOTCH1.
This leads to the release of the intracellular domain (ICN), which is then translocated to the
nucleus where it activates the transcription of target genes, which are important for
commitment of hematopoietic progenitors to T-cell lineage and regulation of cell proliferation.
Furthermore, NOTCH has also been established as a pivotal regulator of hematopoietic stem
cell maintenance.
About 50% of T-ALL samples harbor activating NOTCH1 mutations, this results in a constant
activation of the NOTCH1 pathway [22]. NOTCH1 mutations in T-ALL are usually carried in
the heterodimerization (HD) and the C-terminal PEST domains.
Mutations in the HD domain increase the accessibility of the NOTCH1 receptor for proteolytic
cleavage ultimately leading to ligand independent cleavage.
PEST domain mutations usually lead to truncated protein resulting in the removal of
Cdc phosphodegron domains (CPDs). CPDs are involved in the degradation of ICN by
FBXW7. Mutations in the PEST domain thus lead to stabilization of ICN.
FBXW7 is a subunit of the SCF-type E3 ubiquitin ligase complex responsible for the
ubiquitination and subsequent degradation of its targets. Mutations in FBXW7 can result in
loss of recognition of NOTCH1 and thus hyperactivation of the NOTCH1 pathway [14,23].
1.2.2 Acute T-cell lymphoblastic lymphoma
Lymphoblastic lymphoma (LBL), just like ALL, is a neoplasm that can arise from immature B
or T cells at different stages of differentiation[24]. LBL accounts for approximately 2% of all non-
Hodgkin lymphoma cases (characterized by the absence of Reed-Sternberg cell derived from
B-cells), and T-LBL comprises 90% of all LBL cases [24]. T-ALL and T-LBL have many of the
same characteristics; they share overlapping clinical, morphological and immunophenotypic
features. According to the WHO (world health organization) classification, they are even

13
considered to be the same disease. There are no set clinical criteria to diagnose T-ALL from
T-LBL aside from the arbitrary cut-off of 25% BM infiltration. Cases with lymphoblast infiltration
below 25% are diagnosed as T-LBL and above as T-ALL [25–27].
While they are very similar malignancies (they are considered to be different manifestations of
the same disease), there are still differences between the two.
The primary site of involvement in T-ALL patients is the BM with lymphoblasts in the peripheral
blood, while in T-LBL, the anterior mediastinum is generally affected accompanied with pleural
and/or pericardial effusions. Furthermore, the frequency of CNS involvement is twice as high
in T-ALL [27].
T-ALL cells have generally a more immature phenotype compared to T-LBL and although T-
LBL and T-ALL have similar cytogenetic alterations they are different from each other in their
gene expression profile. This could explain the differences between T-ALL and T-LBL, such
as their differences in homing patterns [26,28,29].
1.2.3 Treatment
Current treatment for T-ALL/T-LBL consists of a multi-agent chemotherapy combination;
thanks to this intensive chemotherapy, about 85% of children and adolescents are cured.
There are however still subgroups resistant to treatment with a very poor prognosis and
patients that relapse have a poor five-year event-free survival of only about 20%. Additionally,
the intensive chemotherapy also correlates with significant short-term and possibly some long-
term side effects due to therapy-related toxicity [30].
The therapy resistant subgroups and the current therapeutic toxicity highlight the need for more
effective and specific treatments. The genetic basis of T-ALL/T-LBL can thus be used to
uncover new therapeutic targets for targeted therapies [11,13].
1.3 PIM1 as a potential oncogene in T-ALL/T-LBL
As mentioned before, improper TCR recombinations during thymocyte development can result
in chromosomal translocations that lead to the juxtaposition of strong TCR gene promoters or
enhancers and TF genes. In T-ALL/T-LBL, approximately 50% of patients have cytogenetically
detectable chromosomal abnormalities. And about 35% of these observed abnormalities are
translocations that involve the TCRα/δ, TCRβ or TCRγ loci [31].
Recently, in some as of yet unpublished results, a new TCRβ translocation was found in a T-
LBL patient using FISH. The new TCRβ translocation partner was then identified using a novel
technique called targeted locus amplification (TLA). This is a targeted resequencing method
able to selectively amplify and sequence entire genes based on the crosslinking of sequences
with physical proximity. It allows for detection of single nucleotide variants, structural variants

14
and gene fusions amongst others [32]. The new TCRβ translocation partner proved to be the
PIM1 proto-oncogene; the translocation resulted in an elevated PIM1 activation.
The PIM proteins are a family of short lived serine/threonine protein kinases that are highly
evolutionarily conserved. The family consists of three members, PIM1, PIM2 and PIM3. These
kinases are highly homologous and although they are mostly ubiquitous, they have a
somewhat different tissue distribution. PIM1 is mainly expressed in thymus, spleen, BM,
prostate, hippocampus and hematopoietic cells, PIM2 in brain and lymphoid cells, and PIM3
in the kidney, breast and brain tissue [33,34].
PIM1 gene was discovered as an insertion site for the Moloney Murine Leukemia Virus and
was quickly established as an important player of malignant transformation [33].
1.3.1 Structure and regulation
The human PIM1 gene is situated on chromosome 6, while in mice it can be found on
chromosome 17, and consists of six exons and five introns. PIM1 mRNA transcripts contain
large untranslated regions (UTRs).
PIM1 codes for two isoforms (34 and 44 kDa) through the use of alternative translation initiation
sites. Both isoforms contain the kinase domain and display analogous in vitro kinase activity.
Interestingly, PIM1 kinase has no regulatory domains [34–36].
Figure 6 [35]. PIM1 mRNA transcripts contain large UTRs. The 3' UTR has five copies of the AUUUA destabilizing motif and the 5' UTR is GC-rich and contains a stem-loop-pair, that is capable of inducing export of the PIM1 transcript to the cytoplasm and enhances translation.
PIM1 expression is quickly upregulated after mitogenic stimuli. Transcription of PIM1 is in fact
induced by cytokines that signal through structurally related receptors. Moreover, PIM1 is a
major downstream target of the STAT3 and STAT5 transcription factors, that can be induced
by a large variety of growth factors such as interleukins, interferons, Granulocyte/Macrophage
Colony Stimulating Factor (GM-CSF) and Granulocyte Colony Stimulating Factor (G-CSF)
[36]. Additionally, PIM1 expression can also be induced by the TFs NF-κB and HOXA9 [37].
PIM1 has no regulatory domain and as thus the activity of PIM1, in contrast to other kinases,
is not regulated by membrane recruitment or phosphorylation. It is a constitutively active
kinase, and regulation happens by rates of transcription, translation, and proteasomal

15
degradation. Although phosphorylation is not required for kinase activity, phosphorylation by
the tyrosine kinase ETK enhances the activity of PIM1 [35].
PIM1 mRNA has a short half-life due to the presence of the five copies of the AUUUA
destabilizing motif on the 3’ UTR. Furthermore it is considered a weak transcript due to the
presence of a GC-region in the 5′ UTR, leading it to require cap-dependent translation [35].
Protein stability is done by stabilization and ubiquitylation followed by proteasomal
degradation. Several proteins play a role in the regulation of PIM1. First off, PIM1 can be bound
and dephosphorylated by the PP2A phosphatase, which leads to its ubiquitylation and
degradation. Furthermore, PIM1 is also abound by two heat shock proteins. HSP90
significantly protects PIM1 from proteasomal degradation (thus increasing its half-life), while
HSP70 binds ubiquitylated PIM1 and stimulates degradation. [35,38,39].
1.3.2 Downstream targets of PIM1
PIM1 kinase mediates cellular activities through the phosphorylation of cellular substrates. It
phosphorylates proteins involved in cell cycle progression, transcription, apoptosis, drug
resistance, cellular metabolism, homing and cell migration.
PIM1 phosphorylates substrates important for cell cycle progression.
For instance, PIM1 phosphorylates and magnifies the effects of the Cdc25A phosphatase, a
crucial G1/S-phase protein, because Cdc25A dephosphorylates the inhibitory phosphorylation
of certain CDKs. Furthermore, PIM1 also phosphorylates and inactivates p21, an inhibitor of
the cyclin E/CDK and cyclin A/CDK association, thus allowing G1/S-phase progression.
Aside from G1/S-phase progression, PIM1 also plays a role in G2/M-phase progression by
phosphorylating NuMa (nuclear mitotic apparatus protein), which plays a role in organizing the
mitotic spindle. Moreover, phosphorylation of C-TAK1 and Cdc25C promotes transition into
mitosis [40].
PIM1 phosphorylates proteins involved in transcription. The most important transcription factor
PIM1 phosphorylates is Myc, consequently increasing its stability and transcriptional activity
[41]. Additionally, PIM1 is recruited to the E-box elements of Myc, thus forming a Myc–MAX–
PIM1 complex. This leads to functional cooperation between PIM1 and Myc, mediated through
the phosphorylation of histone H3 by PIM1. This phosphorylation activates RNA polymerase
II, ultimately contributing to the transcriptional activation of Myc-dependent genes, which may
be crucial for transformation. Myc is thus a synergistic partner of PIM1 in tumorigenesis [36,38].
PIM1 can also stimulate the transcriptional activity of Myb, which regulates differentiation and
proliferation, by phosphorylating the Myb coactivator p100.
16
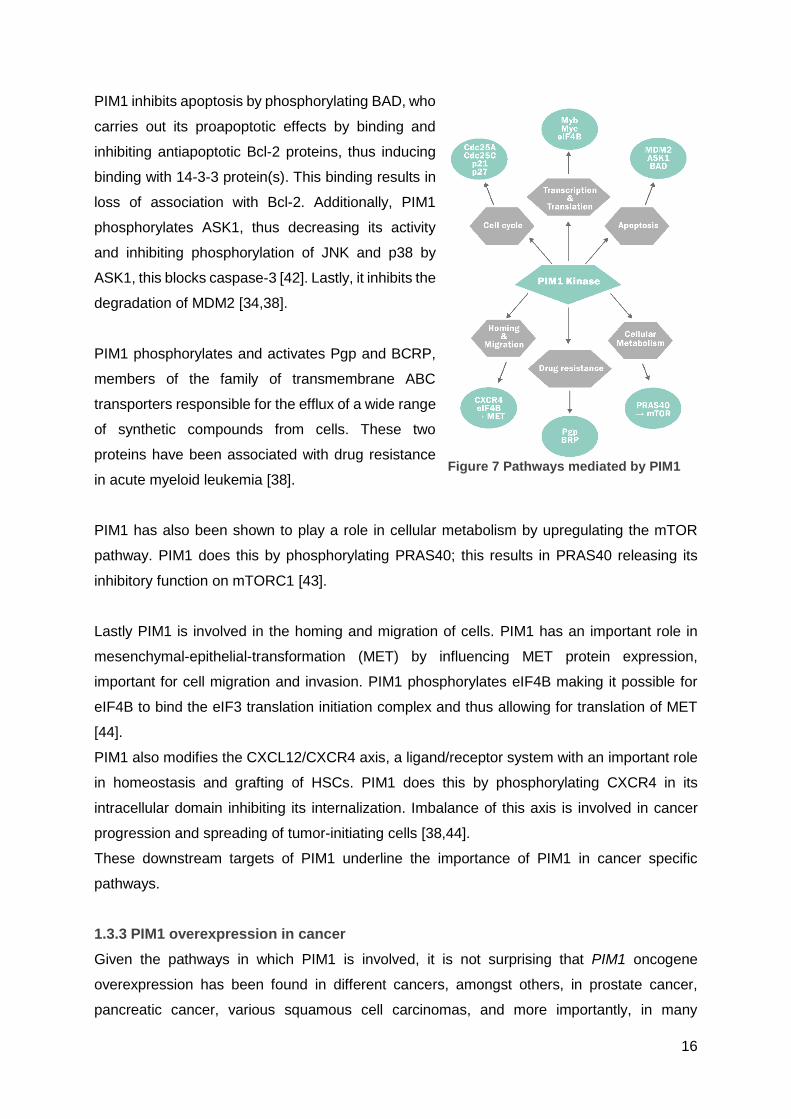
PIM1 inhibits apoptosis by phosphorylating BAD, who
carries out its proapoptotic effects by binding and
inhibiting antiapoptotic Bcl-2 proteins, thus inducing
binding with 14-3-3 protein(s). This binding results in
loss of association with Bcl-2. Additionally, PIM1
phosphorylates ASK1, thus decreasing its activity
and inhibiting phosphorylation of JNK and p38 by
ASK1, this blocks caspase-3 [42]. Lastly, it inhibits the
degradation of MDM2 [34,38].
PIM1 phosphorylates and activates Pgp and BCRP,
members of the family of transmembrane ABC
transporters responsible for the efflux of a wide range
of synthetic compounds from cells. These two
proteins have been associated with drug resistance
in acute myeloid leukemia [38].
PIM1 has also been shown to play a role in cellular metabolism by upregulating the mTOR
pathway. PIM1 does this by phosphorylating PRAS40; this results in PRAS40 releasing its
inhibitory function on mTORC1 [43].
Lastly PIM1 is involved in the homing and migration of cells. PIM1 has an important role in
mesenchymal-epithelial-transformation (MET) by influencing MET protein expression,
important for cell migration and invasion. PIM1 phosphorylates eIF4B making it possible for
eIF4B to bind the eIF3 translation initiation complex and thus allowing for translation of MET
[44].
PIM1 also modifies the CXCL12/CXCR4 axis, a ligand/receptor system with an important role
in homeostasis and grafting of HSCs. PIM1 does this by phosphorylating CXCR4 in its
intracellular domain inhibiting its internalization. Imbalance of this axis is involved in cancer
progression and spreading of tumor-initiating cells [38,44].
These downstream targets of PIM1 underline the importance of PIM1 in cancer specific
pathways.
1.3.3 PIM1 overexpression in cancer
Given the pathways in which PIM1 is involved, it is not surprising that PIM1 oncogene
overexpression has been found in different cancers, amongst others, in prostate cancer,
pancreatic cancer, various squamous cell carcinomas, and more importantly, in many
Figure 7 Pathways mediated by PIM1

17
lymphoid and hematopoietic tumors (e.g. B-CLL or AML). In most hematopoietic malignancies,
PIM1 expression correlates with a poor prognosis and its regulation is usually the result of
alterations in its transcriptional regulation [35,38].
1.3.4 PIM1 as a possible therapeutic target in T-ALL/T-LBL
PIM1 kinase is a weak oncoprotein that induces strong phenotypes in combination with other
oncogenes such as Myc; sole PIM1 overexpression is not sufficient to transform cells, it can
however strengthen tumorigenesis by enhancing different cancer-specific pathways.
PIM1 and Myc work synergistically in tumorigenesis/leukemogenesis, and while neither
(especially PIM1) of them is very oncogenic, when they are both overexpressed, tumor-
formation in mice is striking. This synergism is particularly dependent on PIM1 activity,
highlighting the idea of PIM1 as an attractive therapeutic target, especially because PIM1
knockout mice are viable and fertile lacking an obvious phenotype, with the only known effect
being erythrocytic microcytosis [39,45].
Altogether, this evidence suggests that PIM1 may play a role in the pathogenesis of T-ALL/T-
LBL and thus might be an attractive therapeutic target for those patients in which PIM1 is
overexpressed.
2 MATERIALS AND METHDOS
2.1 Patient samples and human cell lines
2.1.1 Patient sample and Sanger validation
Pleural effusion DNA from a T-LBL patient with a PIM1 translocation was used to validate
certain mutations found by exome sequencing (Novogene).
Mutations were validated by polymerase chain reaction (PCR) amplification using KAPA2G
Robust PCR Kit (Kapa Biosystems) for IKZF1 and EP300, and the PCRX Enhancer System
(Thermo Fisher) for NOTCH1 seen as the sequence to be amplified was GC rich. After
amplification using the ProFlex™ PCR system (Thermo Fischer), the PCR products were sent
for Sanger sequencing (GATC Biotech).
Table 1. Primer sequences for Sanger validation
Gene Primer sequence
NOTCH1 5’-AGCCGCACCTTGGCGTGAGC-3' 3’-TGGTCGGCCCTGGCATCCAC-5'
IKZF1 5’-TTAACATTGGACGCGACTGAAC-3' 3’-CTCTTACGTTTGGCGACGTTA-5'
EP300 5’-TCCTGGGTTCTCCATTTCTG-3' 3’-CTTCAGTGTTTTCCATGGTTTT-5'
18
For EP300 and IKZF1 (NOTCH1 primers were already available) primer design, gene
sequences were obtained from Ensembl genome browser whereafter primer sequences were
selected using Primer3. Primer pairs had to meet certain criteria. Firstly, GC% had to fluctuate
between 40% and 60%, with ideally 50% GC. Secondly, the melting temperature (Tm) had to
be around 60°C, and the Tm difference between forward and reverse primer could not surpass
2°C. Lastly, there could not be more than 3 C’s or G’s in a row.
After selecting primer pairs that met the criteria, the specificity of the primers was tested using
Primer Blast (NCBI). After blasting, there had to be a minimum of 4 mismatches with other
sequences throughout the genome whereof a maximum of 2 T’s or A’s (table).
Before validating the mutations, the PCR protocol (appendix 1) for each primer pair (table 1)
was optimized using human cell lines: the PCR reaction was repeated and run through gel
electrophoresis until a single band was seen at the desired height. After running the PCR with
the patient’s genomic DNA, part of this PCR product was run through gel electrophoresis to
make sure there is only one band. If two bands were seen, DNA from the two bands was
extracted from the gel (appendix 2) and sent for sequencing separately.
2.1.2 Cell line and culture conditions
Human T cell leukemia suspension cell line HSB-2 (DMSZ) was cultured in 90% RPMI 1640
medium (Gibco) supplemented with 10% h.i. FBS (Biochrome) and antibiotics (1%
penicillin/streptomycin, kanamycin and L-glutamine) at 37°C under 5% CO2. The cells were
split twice a week at 0,5.106 cells per milliliter (ml).
Cells were counted by mixing 10 microliters (µl) cell suspension with 10µl trypan blue (Gibco);
from this mixture, 10µl was pipetted onto a slide and inserted into the Countess™ II Automated
Cell Counter (Thermo Fisher). The percentage live population (i.e. cells that do not color bleu
because of their intact cell membrane, making them able to expulse this dye) was then used
to make further calculations. The cells were centrifuged; old medium was aspirated and the
cell pellet was resuspended in the appropriate amount of fresh medium as to obtain the
required concentration.
2.2 Compound assays and cell viability measurement
In order to determine the in vitro potential of PIM1 inhibition, compound assays were preformed
using three PIM1 inhibitors: SMI4a (Bio-Connect), AZD1208 (Bio-Connect) and TP3654
(Toledo Pharmaceuticals) on the HSB-2 cell line. To do so, cells were seeded at a
concentration of 25.000 per 100µl in a Nunclon™ Delta Surface 96 well plate (Thermo Fisher).
A dilution series of TP3654 was made in serum-free medium (SFM); afterwards 1µl of each
concentration was added in duplicate to the 100µl cell suspension. Because the compound
was dissolved in dimethyl sulfoxide (DMSO, Serva), this solvent was used as control condition,
19
to make sure loss in cell viability was not due to solvent toxicity. The 96 well plate was then
incubated at 37°C and 5% CO2. After 72h, cell viability was calculated by adding 50µl CellTiter-
Glo® Reagens (Promega) and measuring the luminescence (luciferin is converted into light in
the presence of ATP and luciferase, which is directly proportional to the ATP present in the
sample, which in turn is proportional to the amount of viable cells), with the GloMax® Navigator
System (Promega). From these measurements, a dose response curve was constructed, with
the DMSO control used as a baseline equal to 100% viability.
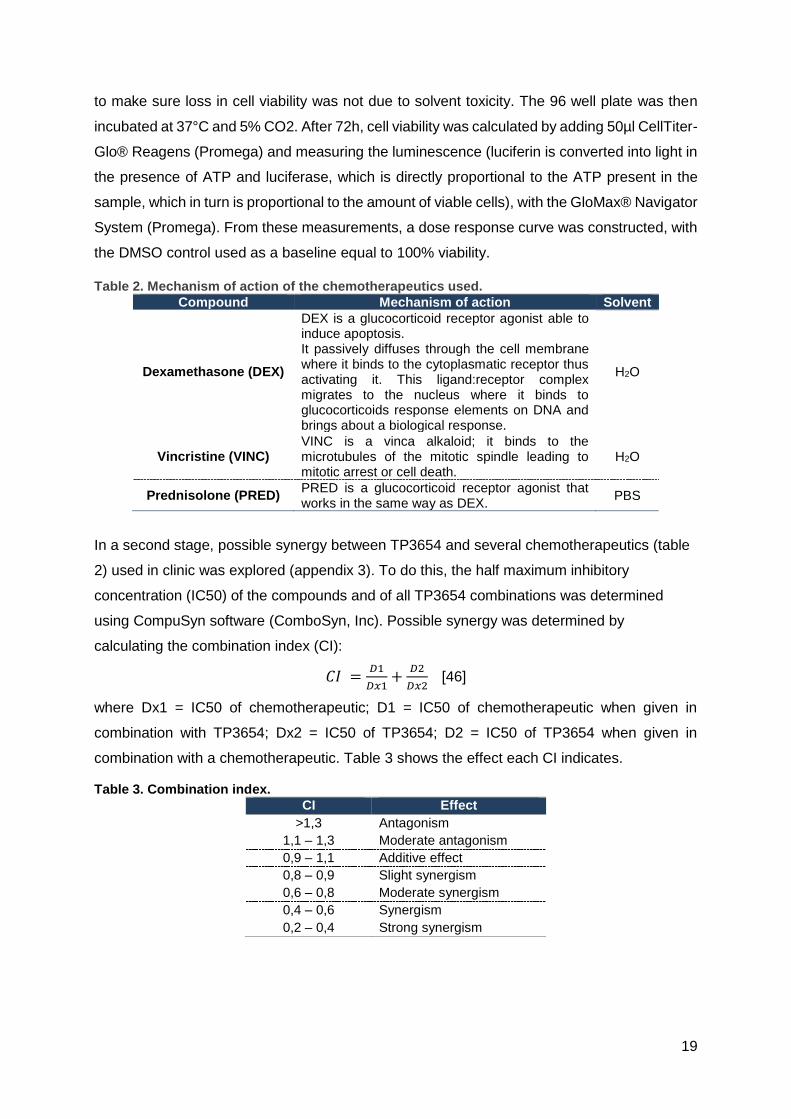
Table 2. Mechanism of action of the chemotherapeutics used.
Compound Mechanism of action Solvent
Dexamethasone (DEX)
DEX is a glucocorticoid receptor agonist able to induce apoptosis. It passively diffuses through the cell membrane where it binds to the cytoplasmatic receptor thus activating it. This ligand:receptor complex migrates to the nucleus where it binds to glucocorticoids response elements on DNA and brings about a biological response.
H2O
Vincristine (VINC) VINC is a vinca alkaloid; it binds to the microtubules of the mitotic spindle leading to mitotic arrest or cell death.
H2O
Prednisolone (PRED) PRED is a glucocorticoid receptor agonist that works in the same way as DEX.
PBS
In a second stage, possible synergy between TP3654 and several chemotherapeutics (table
2) used in clinic was explored (appendix 3). To do this, the half maximum inhibitory
concentration (IC50) of the compounds and of all TP3654 combinations was determined
using CompuSyn software (ComboSyn, Inc). Possible synergy was determined by
calculating the combination index (CI):
𝐶𝐼 =𝐷1
𝐷𝑥1+
𝐷2
𝐷𝑥2 [46]
where Dx1 = IC50 of chemotherapeutic; D1 = IC50 of chemotherapeutic when given in
combination with TP3654; Dx2 = IC50 of TP3654; D2 = IC50 of TP3654 when given in
combination with a chemotherapeutic. Table 3 shows the effect each CI indicates.
Table 3. Combination index.
CI Effect
>1,3 Antagonism
1,1 – 1,3 Moderate antagonism
0,9 – 1,1 Additive effect
0,8 – 0,9 Slight synergism
0,6 – 0,8 Moderate synergism
0,4 – 0,6 Synergism
0,2 – 0,4 Strong synergism
20
2.3 RNA sequencing
To investigate differential gene expression in HSB-2 cells before and after TP3654 treatment,
Ribonucleic acid (RNA) sequencing was performed.
Cells were treated with the PIM1 inhibitor at a concentration of 200nM so that cells remained
about 80% to 70% viable. A compound assay as described in section 2.2 was performed for
48h at 37°C to determine this concentration.
Cells were seeded at 0,5 million per ml: 3 million cells were counted, resuspended in 6ml fresh
medium and an appropriate amount of inhibitor was added so as to obtain a final concentration
of 200nM. Parallelly, a control flask with DMSO was incubated. Four biological replicates
(treated and collected at different time points) were made in this manner (appendix 4).
After the 48h treatment cell viability was measured with CellTiter-Glo® and cells were collected
(appendix 5). Cell pellets were washed with ice cold phosphate-buffered saline (PBS, Lonza)
after which they were lysed and prepared for RNA extraction by adding 700µl qiazol™
(Qiagen). For this extraction, the miRNeasy Mini Kit (Qiagen) was used (appendix 6).
Afterwards, the RNA concentration was measured using NanoDrop™ ND-1000 (Thermo
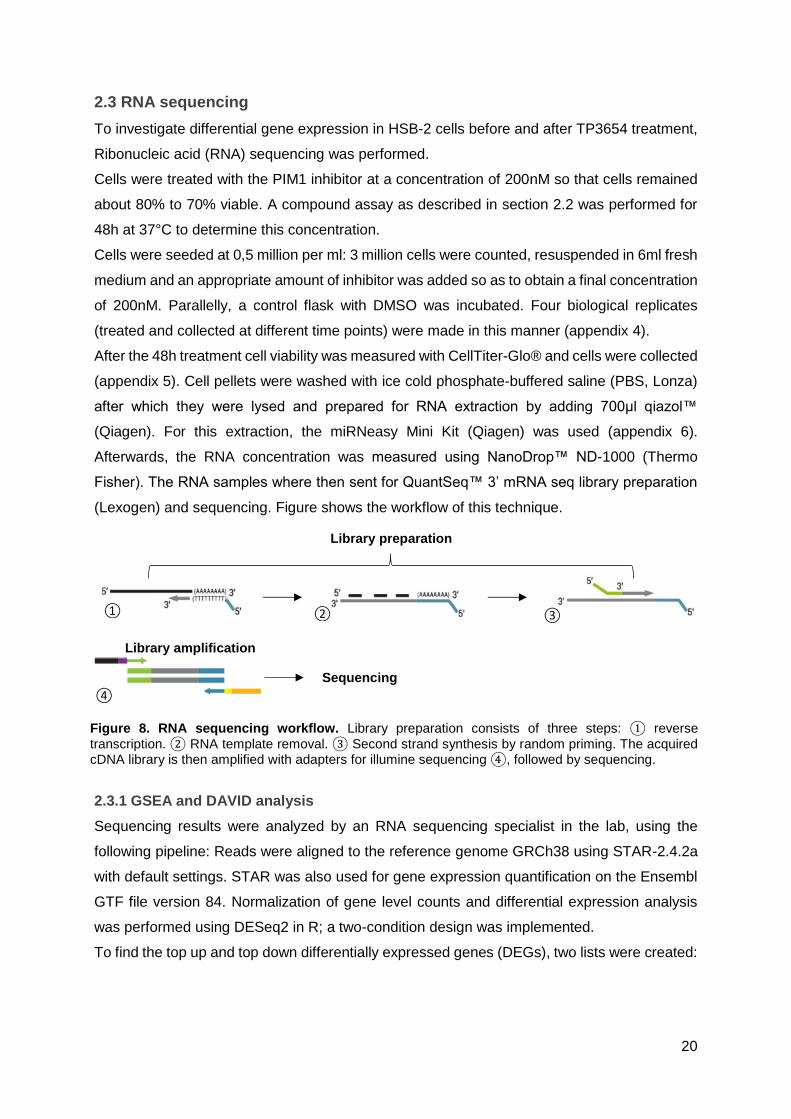
Fisher). The RNA samples where then sent for QuantSeq™ 3’ mRNA seq library preparation
(Lexogen) and sequencing. Figure shows the workflow of this technique.
2.3.1 GSEA and DAVID analysis
Sequencing results were analyzed by an RNA sequencing specialist in the lab, using the
following pipeline: Reads were aligned to the reference genome GRCh38 using STAR-2.4.2a
with default settings. STAR was also used for gene expression quantification on the Ensembl
GTF file version 84. Normalization of gene level counts and differential expression analysis
was performed using DESeq2 in R; a two-condition design was implemented.
To find the top up and top down differentially expressed genes (DEGs), two lists were created:
Library amplification
Sequencing
Library preparation
① ② ③
④
Figure 8. RNA sequencing workflow. Library preparation consists of three steps: ① reverse
transcription. ② RNA template removal. ③ Second strand synthesis by random priming. The acquired cDNA library is then amplified with adapters for illumine sequencing ④, followed by sequencing.
21
The top upregulated genes (positive Log2 Fold Change) and the top downregulated genes
(negative Log2 Fold Change) after PIM1 inhibition, both lists were ranked from lowest to
highest p adjusted value.
To biologically interpret the results, gene set enrichment analysis (GSEA) and DAVID analysis
was performed on the dataset.
GSEA looks for the overrepresentation of a set of genes. The GSEA Broad Institute software
was used for this purpose. The input file was a .rnk with two columns. The left column consisted
of the official gene names and the right of (1/padj)x(sign of the Fold Change).
In the GSEA software the following parameters were used:
• Pre-ranked list
• Gene set database: c2.all.v5.2.symbols.gmt
• Number of permutations: 1000
• Enrichment statistic: classic
RNA sequencing data was further analyzed using the online tool DAVID (Database for
Annotation, Visualization and Integrated Discovery) to see if any signaling pathways were
overrepresented in the dataset. Two gene lists were generated. They consist respectively of
downregulated genes with a padj<0,05 and upregulated genes with padj<0,05.
2.3.2 qPCR validation
In order to validate the RNA sequencing data, a number of the top up- and downregulated
genes were validated with quantitative PCR (qPCR). In preparation, RNA was converted into
the more stable complementary DNA (cDNA) using the iScript™ advanced cDNA Synthesis
Kit (Bio-Rad) and the SimpliAmp™ Thermal Cycler (Thermo Fisher) (appendix 7).
This cDNA was then used to perform qPCR with the Sso Advanced SYBR™ Green Supermix
(Bio-Rad) and the Lightcycler®480 (Roche): 5µl of the qPCR reaction mixture with suitable
primers was added to a 384-well plate in duplicate, including the no template control, where
cDNA was substituted by water. Four reference genes were added so as to normalize the
results in further analyses (appendix 8).
The obtained Cq values were analyzed with qBase+ (Biogazelle) and the relative expression
levels were calculated by the software. Only stable reference genes, a minimum of 2 is
necessary for analysis, that allowed for a reliable normalization were used.
2.4 Western blot analysis of phosphoproteins
To look at the direct phosphorylation effects of PIM1 inhibition, HSB-2 cells were treated with
the PIM inhibitors TP3654 and AZD1208, at different concentrations, or DMSO as a control.

22
This treatment lasted for either 48h (here only the TP3654 inhibitor was used at 200nM)), 18h,
6h or 90 minutes (min) to help determine at what point the effects on phosphorylation were
visible after PIM1 inhibition.
For each condition 1,5 million cells were resuspended in 3ml medium after which an
appropriate amount of compound was added.
After treatment time had lapsed, cells were collected (see 2.3) and lysed so as to extract
proteins. To do this 100 to 150µl RIPA lysis buffer supplemented with protease and
phosphatase inhibitors was added to the cell pellets (appendix 9). After centrifuging, getting
rid of the debris and collecting the proteins in the supernatants, the total protein concentration
was measured with the Pierce™ BCA protein assay kit (Thermo Fisher): 200µl of BCA master
mix was mixed with ascending volumes of 1mg/ml bovine serum albumin (BSA) in duplicate,
or 2µl of a cell lysate in triplicate in a Corning® 96 well clear bottom microplate (Sigma)
(Appendix 10). Absorbance was measured with the GloMax® and an Excel (Microsoft)
template was used to calculate the concentration of the lysates.
To load a total of 20µg of proteins on the gel, each lysate was diluted with the appropriate
amount of RIPA buffer so that the final volume was of 20µl. The cell lysates were denatured
and prepared for loading by adding Laemmli loading buffer supplemented with β-2-
mercaptoethanol (Sigma) and heated to 95°C for 10 minutes.
The denatured samples were loaded on the Novex 10% Tris-Glycine Mini Protein Gel (Thermo
Fisher), additionally the PageRuler™ Prestained Protein Ladder (Thermo Fisher) and a
Biotinylated Protein Ladder (CST) were loaded. Afterwards, the proteins were separated by
size using the Invitrogen™ Mini Gel Tank (Thermo Fisher). The separated proteins were then
transferred onto a nitrocellulose membrane, which was blocked in 5% BSA (Sigma) or 5% non-
fat milk (Nestlé) in tris-buffered saline supplemented with TWEEN® 20 (TBST, Sigma) and
subsequently incubated with the desired antibody over night (table 4 shows a list of all
antibodies used). After washing the membrane with TBST, the membrane was incubated for
1h with a horseradish peroxidase (HRP) linked secondary antibody and anti-biotin (CST).
For detection, the membranes were covered with either SuperSignal™ West Dura or West
Femto (Thermo Fisher) for 1min in the dark whereafter chemiluminescence was captured by
the ChemiDoc-It® Imager (UVP) and the proteins visualized. On some occasions, different
proteins had to be visualized on the same membrane; if they did not overlap in size, the
membrane would simply be incubated with the new primary antibody. However, if they did, the
membrane was stripped for 5 to 10min with the Restore™ PLUS Stripping Buffer (Thermo
Fisher). The membrane was then reblocked before it was incubated with the new primary
23
antibody. To be able to properly interpret the results a tubulin antibody (CST) was used as a
loading control (appendix 11).
The image processing software Fiji is Just ImageJ was used to quantify the band intensities of
the target proteins. The band intensities of the loading control were used to normalize the
target proteins protein levels, whereafter the normalized level of DMSO control sample was
equated to 100%.
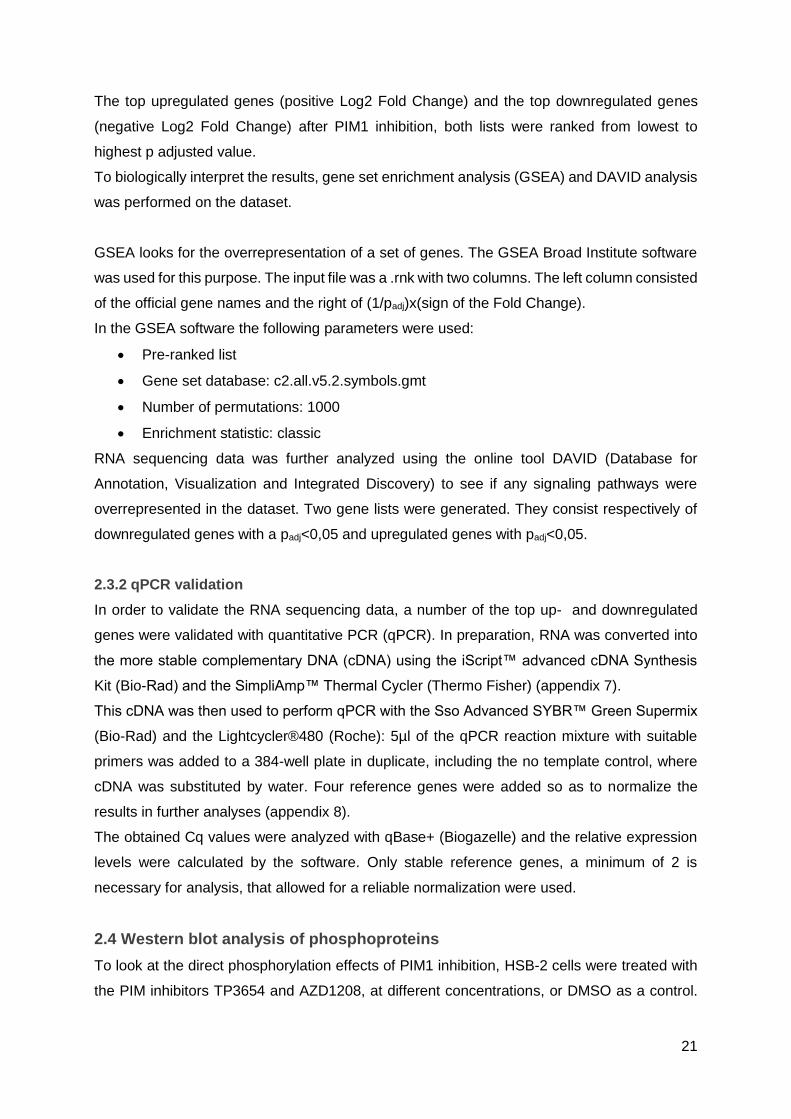
Table 4. Characteristics of the antibodies used
Antibody Dilution Animal Dura/Femto company
Prim
ary
antibod
ies
p-BAD (Ser 112) 1/250 5% BSA/TBST
Rabbit Femto CST
p-BAD (Ser136) 1/500 5% BSA/TBST
Rabbit Femto CST
p-GSK3β (Ser9) 1/1000 5% BSA/TBST
Rabbit Femto CST
p-cMyc (Thr58/Ser62) 1/1000 5% BSA/TBST
Rabbit Femto Santa Cruz
PIM1 1/1000 5% milk/TBST
Rabbit Dura Abcam
PIM1 1/1000 5% milk/TBST
Mouse Dura Santa Cruz
MCL1 1/500 5% BSA/TBST
Rabbit Dura CST
Control Tubulin 1/10000 5% milk/TBST
Mouse Dura CST
Secon
dary
antibod
ies
Anti-mouse 1/50000 5% milk/TBST
Horse / CST
Anti-rabbit 1/50000 5% milk/TBST
Goat / CST
Anti-biotin 1/10000 5% milk/TBST
Goat / CST
2.5 Apoptosis and cell cycle analysis
To determine how PIM1 inhibition is capable of reducing cell viability in HSB-2 cells, the effects
of AZD1208 and TP3654 on cell cycle and apoptosis were analyzed.
For this purpose, five times 2,5 million HSB-2 cells were resuspended in 5ml medium and
inhibitor was added to final concentrations of 1 µM and 2 µM AZD1208 or TP3654.
In addition, DMSO was added as a negative control and 50nM of etoposide (ETO, Sigma) was
used as a positive control. After 48h, 50µl of each condition was added in triplicate to a
Nunclon™ Delta Surface 96 well plate and cell viability was measured through a Cell Titer
Glo® assay (see 2.2). The cell pellets were then resuspended in 5ml PBS and the cells were
counted.
24
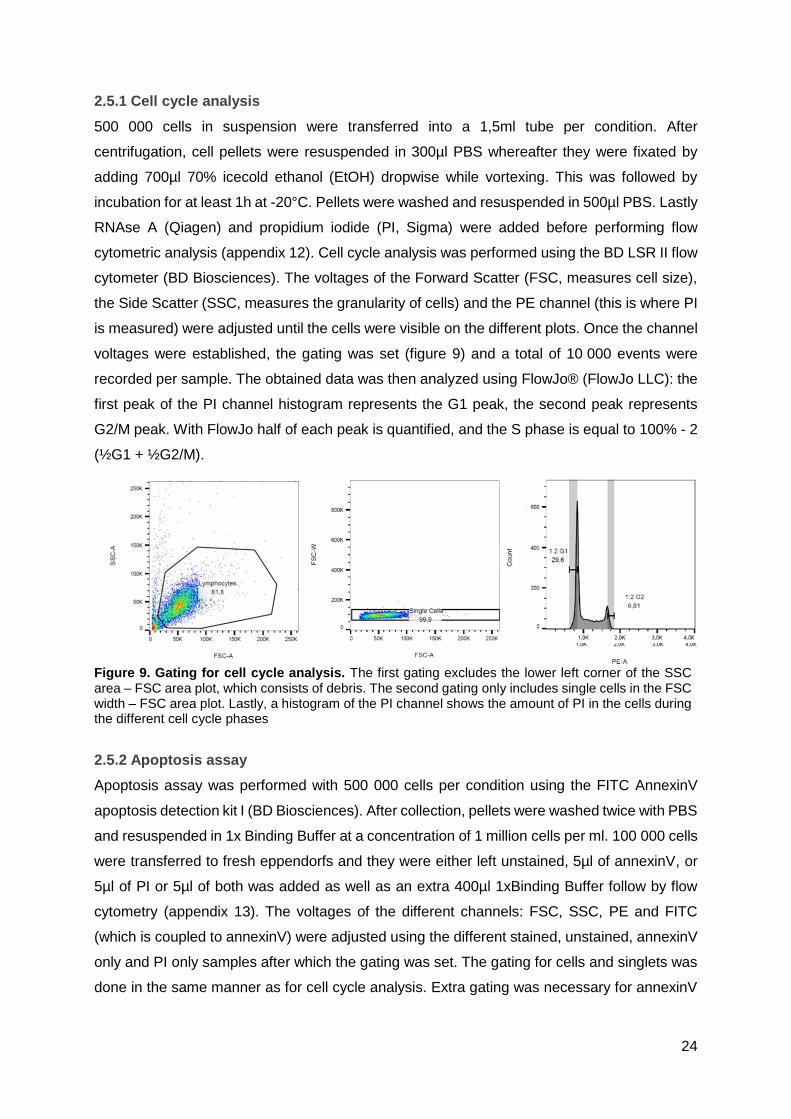
2.5.1 Cell cycle analysis
500 000 cells in suspension were transferred into a 1,5ml tube per condition. After
centrifugation, cell pellets were resuspended in 300µl PBS whereafter they were fixated by
adding 700µl 70% icecold ethanol (EtOH) dropwise while vortexing. This was followed by
incubation for at least 1h at -20°C. Pellets were washed and resuspended in 500µl PBS. Lastly
RNAse A (Qiagen) and propidium iodide (PI, Sigma) were added before performing flow
cytometric analysis (appendix 12). Cell cycle analysis was performed using the BD LSR II flow
cytometer (BD Biosciences). The voltages of the Forward Scatter (FSC, measures cell size),
the Side Scatter (SSC, measures the granularity of cells) and the PE channel (this is where PI
is measured) were adjusted until the cells were visible on the different plots. Once the channel
voltages were established, the gating was set (figure 9) and a total of 10 000 events were
recorded per sample. The obtained data was then analyzed using FlowJo® (FlowJo LLC): the
first peak of the PI channel histogram represents the G1 peak, the second peak represents
G2/M peak. With FlowJo half of each peak is quantified, and the S phase is equal to 100% - 2
(½G1 + ½G2/M).
2.5.2 Apoptosis assay
Apoptosis assay was performed with 500 000 cells per condition using the FITC AnnexinV
apoptosis detection kit I (BD Biosciences). After collection, pellets were washed twice with PBS
and resuspended in 1x Binding Buffer at a concentration of 1 million cells per ml. 100 000 cells
were transferred to fresh eppendorfs and they were either left unstained, 5µl of annexinV, or
5µl of PI or 5µl of both was added as well as an extra 400µl 1xBinding Buffer follow by flow
cytometry (appendix 13). The voltages of the different channels: FSC, SSC, PE and FITC
(which is coupled to annexinV) were adjusted using the different stained, unstained, annexinV
only and PI only samples after which the gating was set. The gating for cells and singlets was
done in the same manner as for cell cycle analysis. Extra gating was necessary for annexinV
Figure 9. Gating for cell cycle analysis. The first gating excludes the lower left corner of the SSC area – FSC area plot, which consists of debris. The second gating only includes single cells in the FSC width – FSC area plot. Lastly, a histogram of the PI channel shows the amount of PI in the cells during the different cell cycle phases

25
and PI gating so that definition of the four quadrants was possible (figure 10). Quantification of
the quadrants was done using FlowJo®.
2.6 Animal studies
During the summer of 2016, mice experiments were conducted in the lab.
The immunodeficient NOD scid gamma (NSG) strain of laboratory mice was used for
engraftment of pleural effusion cells from a T-LBL patient with PIM1 translocation.
5 million patient cells, suspended in 150 µl PBS, were retro-orbitally injected in an NSG mouse.
After developing full-blown leukemia, the mouse was sacrificed and spleen cells (full of
leukemic blasts) were transferred in a secondary xenograft to 14 NSG mice, using tail vein
injection. Their weight and blast percentage (% of human CD45) in the blood was consistently
monitored and from the moment of engraftment, mice were treated daily for three weeks either
with vehicle or with 125mg/kg TP3654 through oral gavage. %hCD45 was weekly determined
(appendix 14) and after three weeks of treatment, the mice were sacrificed and spleens and
bone marrow were collected (appendix 15).
During this thesis, RNA was extracted from these BM and spleen to validate RNA sequencing
data obtained in the HSB-2 tumor line in patient cells. This was done in the same way as
described in 2.4.
3 RESULTS
The results of this research can be divided in three major segments:
The first part (3.1) consists of the characterization of PIM1 expression in T-ALL/T-LBL cell lines
and the efficacy of different PIM1 inhibitors. The second part (3.2) comprises experiments
Figure 10. Gating for apoptosis assay. Extra gating for annexinV only (left) and PI only staining (right) was necessary so as to define the four quadrants, ETO treated cells were used as a positive control because the cell suspension consisted of viable as well as dead cells, which is necessary to determine PI an annexinV background. Q2: PI and annexinV stained late apoptotic cells Q3: annexinV stained early apoptotic cells. Q4: annexinV and PI background of viable cells.

26
regarding the oncogenic role of the PIM1 kinase in T-ALL/T-LBL. The third and final part (3.3)
explores the therapeutic potential of a PIM1 targeted therapy in T-ALL/T-T-LBL.
3.1 HSB-2 as an in vitro model and TP3654 as inhibitor of choice
3.1.1 PIM1 expression in T-ALL/T-LBL cell lines and PIM1 translocation patient
Seen as the T-LBL patient with the PIM1 translocation showed elevated expression of this
kinase, a qPCR was performed (figure 11) on a panel of human T-ALL/T-LBL cell lines in order
to assess which cell lines show high PIM1 expression. The panel consisted of ALL-SIL,
CUTLL-1, DND-41, HPB-ALL, HSB-2, JURKAT, KE-37, KOPTK-1, KP-45, LOUCY, MOLT-16,
PEER and TALL-1. Out of these cell lines, only five showed measurable PIM1 expression:
ALL-SIL, DND-41, HSB-2, KOPTK-1 and TALL-1, with HSB-2 showing the highest expression.
For this reason, HSB-2 was selected for further experiments.
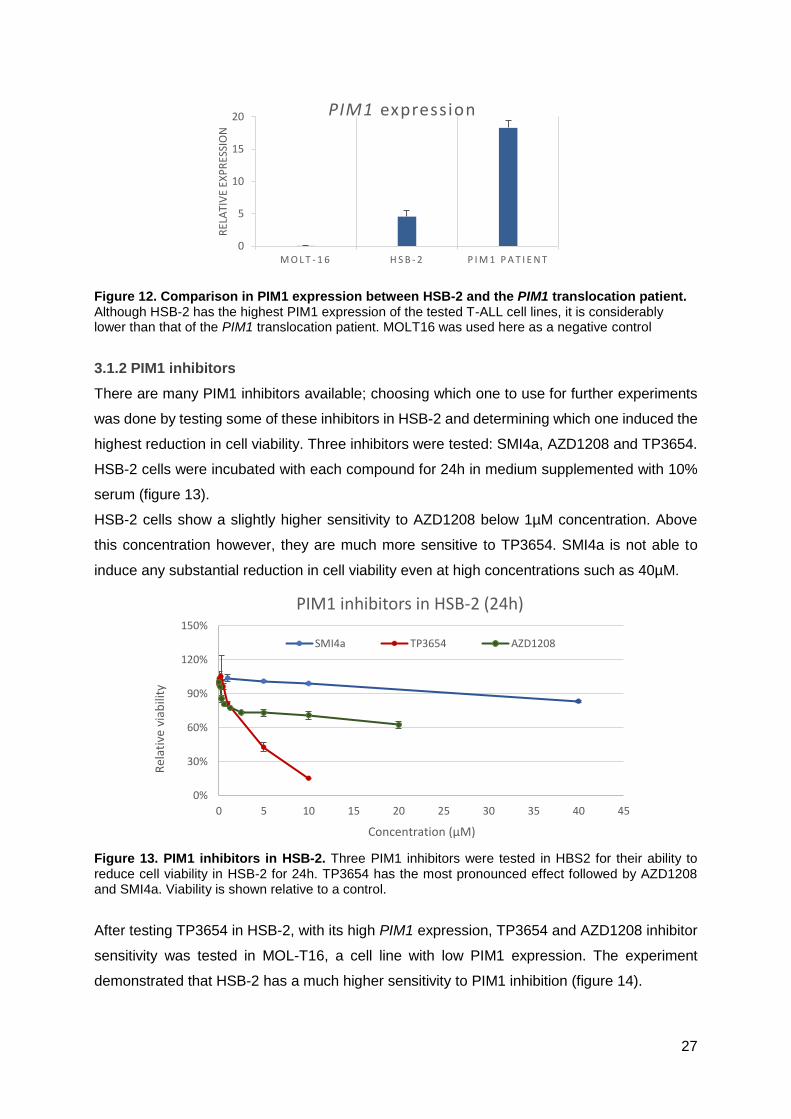
A second qPCR was run to compare PIM1 expression between HSB-2, and the PIM1
translocation patient (figure 12). qPCR results show that even though HSB-2 has the highest
expression among T-ALL cell lines, it still doesn’t compare to the patient’s PIM1 expression,
with around four times lower expression.
Figure 11. PIM1 expression in T-ALL cell lines. qPCR analysis revealed that five of the tested cell lines express PIM1: ALL-SIL, DND-41, HSB-2, KOPTK-1 and TALL-1. Out of these, HSB-2 has the highest expression. The height of the bars represents the expression relative to reference genes.
0
0,2
0,4
0,6
0,8
1
1,2
1,4
1,6
PIM1 expression
27
Figure 12. Comparison in PIM1 expression between HSB-2 and the PIM1 translocation patient. Although HSB-2 has the highest PIM1 expression of the tested T-ALL cell lines, it is considerably lower than that of the PIM1 translocation patient. MOLT16 was used here as a negative control
3.1.2 PIM1 inhibitors
There are many PIM1 inhibitors available; choosing which one to use for further experiments
was done by testing some of these inhibitors in HSB-2 and determining which one induced the
highest reduction in cell viability. Three inhibitors were tested: SMI4a, AZD1208 and TP3654.
HSB-2 cells were incubated with each compound for 24h in medium supplemented with 10%
serum (figure 13).
HSB-2 cells show a slightly higher sensitivity to AZD1208 below 1µM concentration. Above
this concentration however, they are much more sensitive to TP3654. SMI4a is not able to
induce any substantial reduction in cell viability even at high concentrations such as 40µM.
Figure 13. PIM1 inhibitors in HSB-2. Three PIM1 inhibitors were tested in HBS2 for their ability to reduce cell viability in HSB-2 for 24h. TP3654 has the most pronounced effect followed by AZD1208 and SMI4a. Viability is shown relative to a control.
After testing TP3654 in HSB-2, with its high PIM1 expression, TP3654 and AZD1208 inhibitor
sensitivity was tested in MOL-T16, a cell line with low PIM1 expression. The experiment
demonstrated that HSB-2 has a much higher sensitivity to PIM1 inhibition (figure 14).
0
5
10
15
20
M O L T - 1 6 H S B - 2 P I M 1 P A T I E N T
REL
ATI
VE
EXP
RES
SIO
N
PIM1 expression
0%
30%
60%
90%
120%
150%
0 5 10 15 20 25 30 35 40 45
Rel
ativ
e vi
abili
ty
Concentration (µM)
PIM1 inhibitors in HSB-2 (24h)
SMI4a TP3654 AZD1208

28
Figure 14. TP3654 and AZD1208 sensitivity in HSB-2 and MOLT16. Two cell lines, one with high (HSB-2) and one with low (MOL-T16) PIM1 expression where incubated with two PIM1 inhibitors to test their sensitivity. HSB-2 shows a much higher sensitivity to PIM1 inhibition
When performing compound assays it is important to determine if the cells should be cultured
in serum free medium (SFM) or in medium supplemented with 10% serum. For this purpose,
a compound assay with TP3654 was performed in both conditions (figure 15). Results show
that in the absence of serum in the medium, the compound has a greater effect. However, cells
also deteriorate even in the absence of a compound; SFM lowers cell viability considerably
even in the DMSO control sample by around 23%.
Figure 15. Serum effect for TP3654 in HSB-2 after 24h. a: the viability relative to the DMSO control of the cells shows that in the absence of serum, the inhibitor has a greater effect on the cells. b: luminescence signal shows that incubation in SFM considerably reduces viability. The first data point,
where cells were only treated with the DMSO control, shows that in the absence of inhibitor cell viability
was reduced by 22,6% in comparison to viability of cells cultivated with 10% serum.
3.2 The oncogenic role of PIM1 in T-ALL/T-LBL
3.2.1 Possible cooperation between PIM1, NOTCH1 and loss of EP300 in a T-LBL patient
After exome sequencing of bone marrow and pleural effusion DNA from the PIM1 translocation
patient, a multitude of variations were found (as compared to a reference genome). After
0%
40%
80%
120%
DMSO 250 500 1000 5000 10000
Rel
ativ
e vi
abili
ty
Concentration (nM)
TP3654 sensitivity (24h)HSB2 MOLT16
0%
50%
100%
150%
DMSO 200 500 2000 10000
Rel
ativ
e vi
abili
ty
Concetration (nM)
AZD1208 sensitivity (60h)HSB2 MOLT16
0%
20%
40%
60%
80%
100%
120%
Rel
ativ
e vi
abili
ty
concentration (nM)
24h serum effectSerum No Serum
0,00E+00
2,00E+06
4,00E+06
6,00E+06
8,00E+06
1,00E+07
Sign
al
concentration (nM)
24h Serum effect
Serum No Serum
b
a
;

29
filtering for variations that were present in the pleural effusion DNA but not in bone marrow
DNA, three potentially interesting mutations were selected for validation (table 5).
Table 5. Validated mutations
Gene Exon gDNA Protein
NOTCH1 34 c.7476_7477insTAAGGG p.2493delinsX
EP300 21 c.3728dupT p.1243fs
IKZF1 7 c.725_745del p.242_249del
These mutations were validated using PCR amplification and subsequent Sanger sequencing.
(In appendix 16: PCR optimization with T-ALL cell lines)
After PCR amplification, the PCR product was run through gel electrophoresis to make sure
that the product sent for sequencing had the appropriate length. For NOTCH1 two bands could
be seen on the gel; DNA from each band was extracted and sent separately for sequencing.
EP300 and IKZF1 only had one band (figure 16).
Only the EP300 and NOTCH1 mutations could be validated as shown in figures 17 and 18,
IKZF1 sequencing didn’t reveal a mutation.
Figure 16. Gel electrophoresis of the patient's PCR products. L stands for ladder
IKZF1 EP300 NOTCH
11
L
L
L
Figure 17. Validation of EP300 mutation. The duplication of a T nucleotide could only be demonstrated
by sequencing with the forward primer. Reverse primer sequencing could not be demonstrated.
However, from the place where the mutation should be onward there is an overlap in peaks.

30
3.2.2 RNA sequencing of HSB-2 cells before and after TP3654 treatment
An RNA sequencing approach was used to find differentially expressed genes in HSB-2 before
and after treatment with TP3654.
After arranging the genes as described in 2.3, the top up- and down regulated genes were
obtained (table 6 shows the top 10).
Table 6. The top 10 up- and downregulated genes after TP3654 treatment with their respective log2 Fold Change and p adjusted value.
Top up Log2FC padj Top down Log2FC padj
MALAT1 0,51 2,13E-07 SLC27A2 -0,63 2,84E-13
PHF10 0,34 2,03E-04 GZMA -0,98 6,34E-11
TP53INP1 0,50 2,84E-04 CD52 -0,57 9,98E-10
BAHCC1 0,44 3,40E-04 ARPC2 -0,35 4,07E-09
ATHL1 0,41 3,64E-04 JUN -0,47 3,55E-08
ANKRD36 0,44 4,25E-04 NPM3 -0,54 3,55E-08
EPHB6 0,38 4,25E-04 PHLDA2 -0,64 5,57E-08
CXCR4 0,33 4,25E-04 HMGCS1 -0,52 2,53E-07
NDUFAF6 0,42 4,26E-04 ARPC1B -0,37 8,55E-07
NRXN3 0,35 4,76E-04 YWHAH -0,38 8,55E-07
A handful of interesting genes from the top 30 (appendix 17) were validated in HSB-2 using
qPCR on two biological replicates of each condition. Additionally, qPCR on PIM1 was also
performed although according to the RNAseq data, it was not significantly downregulated, with
a log2 Fold Change of -0,0421 and a p adjusted value of 0,817.
qPCR was performed on the following upregulated genes: MALAT1, PHF10, CXCR4, BCL11B,
SYNE2, ARID5B, RUNX1, ZBTB20 and ARID1B (appendix 18). qPCR validated most genes
(figure 19) except for PHF10, BCL11B, and ARID1B, where gene expression appears to
remain unchanged, or even drop (in the case of BCL11B) after TP3654 treatment.
A A T
G G
G
T
C C C
T
A
Figure 18. Validation of NOTCH1 mutation. The insertion of 6 nucleotides was demonstrated by
sequencing with both forward and reverse primers.
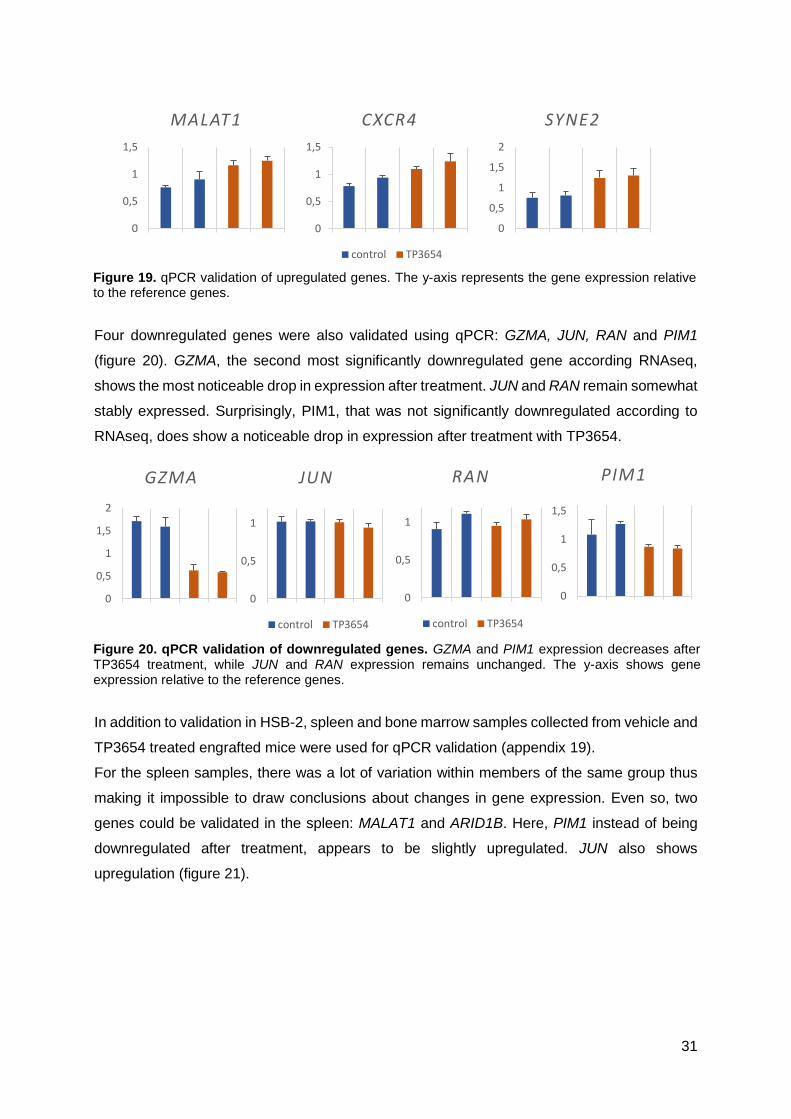
31
Four downregulated genes were also validated using qPCR: GZMA, JUN, RAN and PIM1
(figure 20). GZMA, the second most significantly downregulated gene according RNAseq,
shows the most noticeable drop in expression after treatment. JUN and RAN remain somewhat
stably expressed. Surprisingly, PIM1, that was not significantly downregulated according to
RNAseq, does show a noticeable drop in expression after treatment with TP3654.
In addition to validation in HSB-2, spleen and bone marrow samples collected from vehicle and
TP3654 treated engrafted mice were used for qPCR validation (appendix 19).
For the spleen samples, there was a lot of variation within members of the same group thus
making it impossible to draw conclusions about changes in gene expression. Even so, two
genes could be validated in the spleen: MALAT1 and ARID1B. Here, PIM1 instead of being
downregulated after treatment, appears to be slightly upregulated. JUN also shows
upregulation (figure 21).
0
0,5
1
1,5
CXCR4
control TP3654
0
0,5
1
1,5
MALAT1
0
0,5
1
1,5
2
SYNE2
Figure 19. qPCR validation of upregulated genes. The y-axis represents the gene expression relative to the reference genes.
0
0,5
1
1,5
2
GZMA
0
0,5
1
JUN
control TP3654
0
0,5
1
RAN
control TP3654
0
0,5
1
1,5
PIM1
Figure 20. qPCR validation of downregulated genes. GZMA and PIM1 expression decreases after TP3654 treatment, while JUN and RAN expression remains unchanged. The y-axis shows gene expression relative to the reference genes.
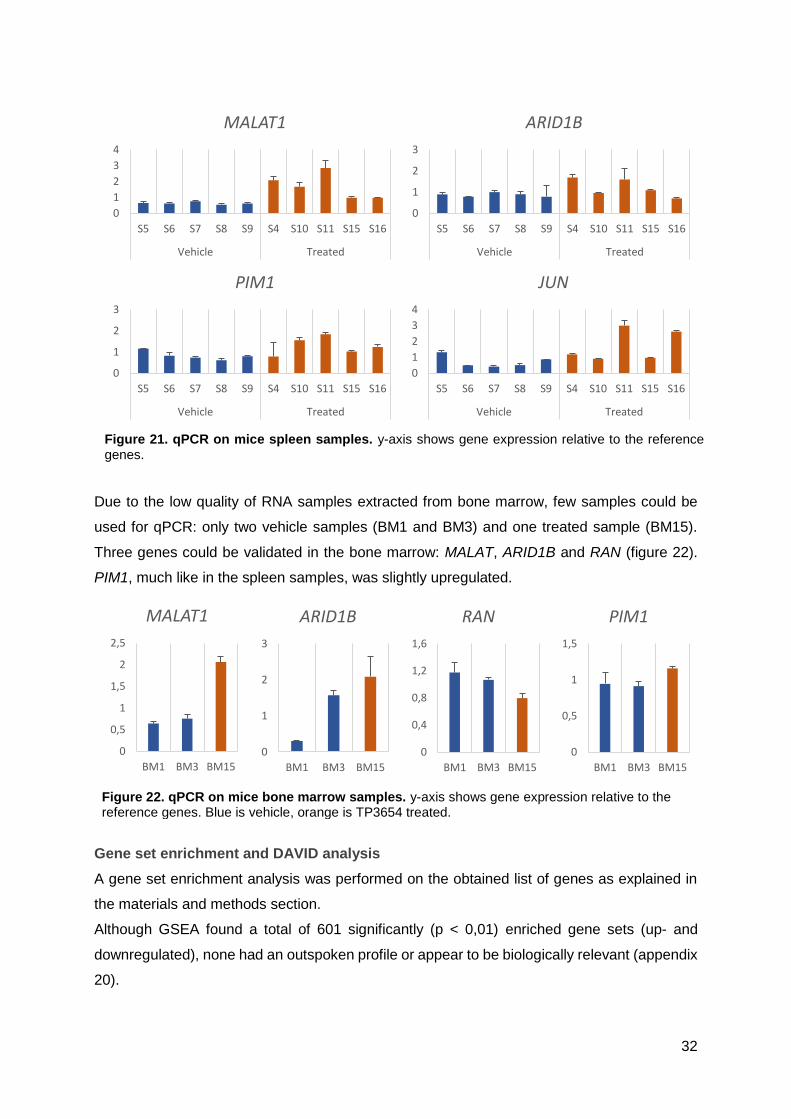
32
Due to the low quality of RNA samples extracted from bone marrow, few samples could be
used for qPCR: only two vehicle samples (BM1 and BM3) and one treated sample (BM15).
Three genes could be validated in the bone marrow: MALAT, ARID1B and RAN (figure 22).
PIM1, much like in the spleen samples, was slightly upregulated.
Gene set enrichment and DAVID analysis
A gene set enrichment analysis was performed on the obtained list of genes as explained in
the materials and methods section.
Although GSEA found a total of 601 significantly (p < 0,01) enriched gene sets (up- and
downregulated), none had an outspoken profile or appear to be biologically relevant (appendix
20).
0
1
2
3
S5 S6 S7 S8 S9 S4 S10 S11 S15 S16
Vehicle Treated
ARID1B
0
1
2
3
4
S5 S6 S7 S8 S9 S4 S10 S11 S15 S16
Vehicle Treated
MALAT1
0
1
2
3
S5 S6 S7 S8 S9 S4 S10 S11 S15 S16
Vehicle Treated
PIM1
0
1
2
3
4
S5 S6 S7 S8 S9 S4 S10 S11 S15 S16
Vehicle Treated
JUN
Figure 21. qPCR on mice spleen samples. y-axis shows gene expression relative to the reference genes.
0
0,5
1
1,5
2
2,5
BM1 BM3 BM15
MALAT1
0
0,4
0,8
1,2
1,6
BM1 BM3 BM15
RAN
0
0,5
1
1,5
BM1 BM3 BM15
PIM1
0
1
2
3
BM1 BM3 BM15
ARID1B
Figure 22. qPCR on mice bone marrow samples. y-axis shows gene expression relative to the reference genes. Blue is vehicle, orange is TP3654 treated.
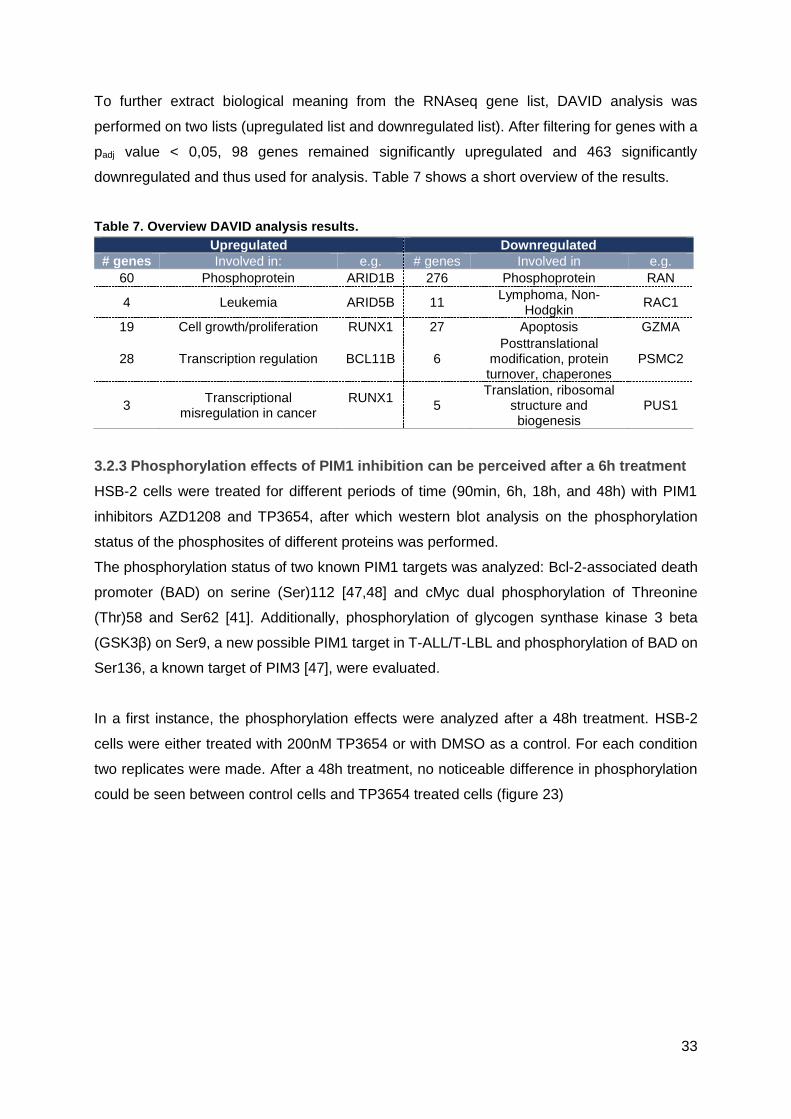
33
To further extract biological meaning from the RNAseq gene list, DAVID analysis was
performed on two lists (upregulated list and downregulated list). After filtering for genes with a
padj value < 0,05, 98 genes remained significantly upregulated and 463 significantly
downregulated and thus used for analysis. Table 7 shows a short overview of the results.
Table 7. Overview DAVID analysis results.
Upregulated Downregulated
# genes Involved in: e.g. # genes Involved in e.g.
60 Phosphoprotein ARID1B 276 Phosphoprotein RAN
4 Leukemia ARID5B 11 Lymphoma, Non-
Hodgkin RAC1
19 Cell growth/proliferation RUNX1 27 Apoptosis GZMA
28 Transcription regulation BCL11B 6 Posttranslational
modification, protein turnover, chaperones
PSMC2
3 Transcriptional
misregulation in cancer RUNX1
5
Translation, ribosomal structure and biogenesis
PUS1
3.2.3 Phosphorylation effects of PIM1 inhibition can be perceived after a 6h treatment
HSB-2 cells were treated for different periods of time (90min, 6h, 18h, and 48h) with PIM1
inhibitors AZD1208 and TP3654, after which western blot analysis on the phosphorylation
status of the phosphosites of different proteins was performed.
The phosphorylation status of two known PIM1 targets was analyzed: Bcl-2-associated death
promoter (BAD) on serine (Ser)112 [47,48] and cMyc dual phosphorylation of Threonine
(Thr)58 and Ser62 [41]. Additionally, phosphorylation of glycogen synthase kinase 3 beta
(GSK3β) on Ser9, a new possible PIM1 target in T-ALL/T-LBL and phosphorylation of BAD on
Ser136, a known target of PIM3 [47], were evaluated.
In a first instance, the phosphorylation effects were analyzed after a 48h treatment. HSB-2
cells were either treated with 200nM TP3654 or with DMSO as a control. For each condition
two replicates were made. After a 48h treatment, no noticeable difference in phosphorylation
could be seen between control cells and TP3654 treated cells (figure 23)
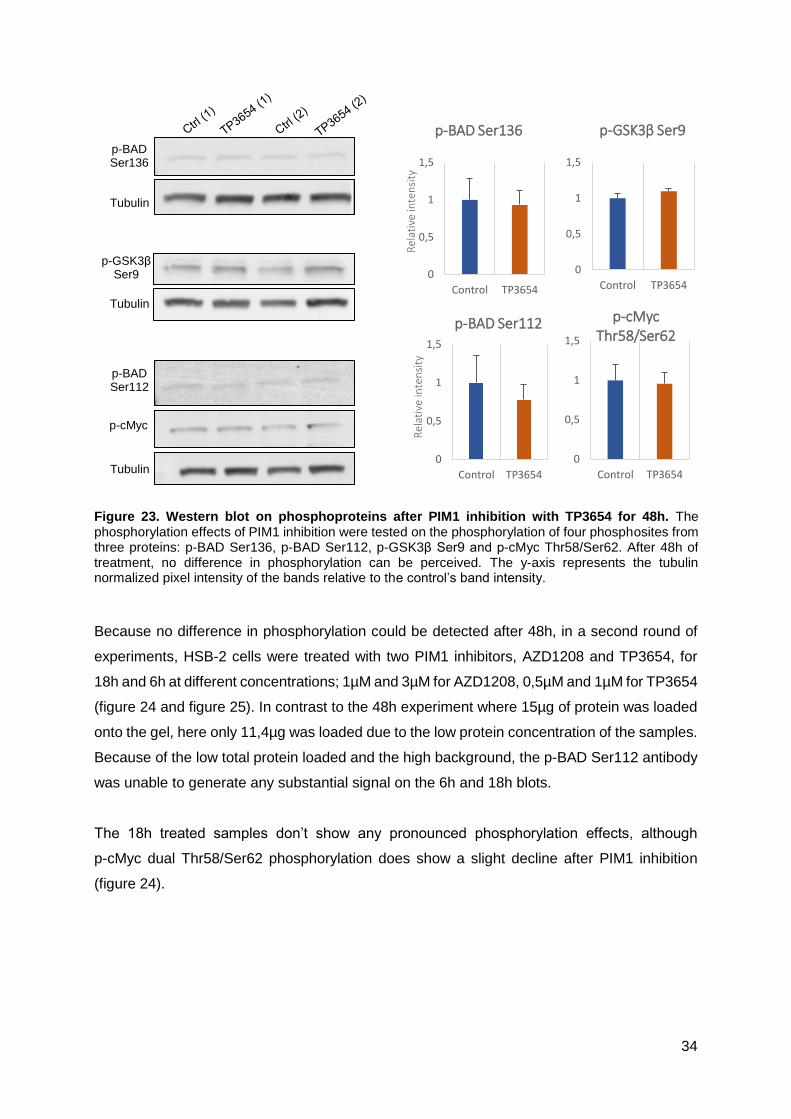
34
Because no difference in phosphorylation could be detected after 48h, in a second round of
experiments, HSB-2 cells were treated with two PIM1 inhibitors, AZD1208 and TP3654, for
18h and 6h at different concentrations; 1µM and 3µM for AZD1208, 0,5µM and 1µM for TP3654
(figure 24 and figure 25). In contrast to the 48h experiment where 15µg of protein was loaded
onto the gel, here only 11,4µg was loaded due to the low protein concentration of the samples.
Because of the low total protein loaded and the high background, the p-BAD Ser112 antibody
was unable to generate any substantial signal on the 6h and 18h blots.
The 18h treated samples don’t show any pronounced phosphorylation effects, although
p-cMyc dual Thr58/Ser62 phosphorylation does show a slight decline after PIM1 inhibition
(figure 24).
p-BAD Ser136
Tubulin
p-GSK3β Ser9
Tubulin
p-BAD Ser112
p-cMyc
Tubulin
0
0,5
1
1,5
Control TP3654
Rel
ativ
e in
ten
sity
p-BAD Ser136
0
0,5
1
1,5
Control TP3654
p-GSK3β Ser9
0
0,5
1
1,5
Control TP3654
Rel
ativ
e in
ten
sity
p-BAD Ser112
0
0,5
1
1,5
Control TP3654
p-cMyc Thr58/Ser62
Figure 23. Western blot on phosphoproteins after PIM1 inhibition with TP3654 for 48h. The phosphorylation effects of PIM1 inhibition were tested on the phosphorylation of four phosphosites from three proteins: p-BAD Ser136, p-BAD Ser112, p-GSK3β Ser9 and p-cMyc Thr58/Ser62. After 48h of treatment, no difference in phosphorylation can be perceived. The y-axis represents the tubulin normalized pixel intensity of the bands relative to the control’s band intensity.

35
The 6h treated samples give the biggest difference in phosphorylation signal. p-GSK3β Ser9
shows a concentration-dependent decline in phosphorylation, p-cMyc dual phosphorylation on
Thr58/Ser62, aside from the 0,5µM TP3654 treated samples, shows a modest decline
comparable to that of the 18h treated samples. Lastly BAD Ser136 phosphorylation increases
after treatment (figure 25).
Ctrl 0,5 1
p-GSK3β Ser9
Tubulin
p-BAD Ser136
p-cMyc Thr58/Ser62
1 3
AZD1208(µM) TP3654(µM)
p-BAD Ser112
0
0,5
1
1,5
ctrl AZD 1 AZD 3 TP 0,5 TP 1
Rel
ativ
e in
ten
sity
p-GSK3β Ser9
0
0,5
1
1,5
ctrl AZD 1 AZD 3 TP 0,5 TP 1R
elat
ive
inte
nsi
ty
p-BAD Ser136
0
0,5
1
1,5
ctrl AZD 1 AZD 3 TP 0,5 TP 1
Rel
ativ
e in
ten
sity
p-cMyc Thr58/Ser62
Figure 24. Western blot on phosphoproteins after treatment with PIM1 inhibitors AZD1208 and TP3654 for 18h. Neither p-GSK3β Ser9 nor p-BAD Ser136 show any meaningful changes in phosphorylation after treatment, cMyc Thr58/Ser62 phosphorylation however, shows a slight decline. p-BAD Ser112 didn’t give any substantial quantifiable signal. Blue represent the control, DMSO treated sample. Green: AZD1208 treated. Orange: TP3654 treated

36
To find out if phosphorylation effects could be perceived as early as 90 minutes after PIM1
inhibition, HSB-2 cells were treated with three different concentrations of AZD1208 and
TP3654 (1, 3 and 5µM). This was only done for p-GSK3β Ser9 and p-BAD Ser112 (11,9µg of
protein was loaded resulting in a weak but clear and quantifiable signal). Here, no real pattern
(increase or decrease) of phosphorylation can be seen (figure 26).
Ctr
l
0,5
1
1
3
AZD1208(µM) TP3654(µM)
p-GSK3β Ser9
Tubulin
p-BAD Ser136
p-cMyc
Thr58/Ser62
Tubulin
p-BAD Ser112
0
0,2
0,4
0,6
0,8
1
ctrl AZD 1 AZD 3 TP 0,5 TP 1
Rel
ativ
e in
ten
sity
p-GSK3β Ser9
0
1
2
ctrl AZD 1 AZD 3 TP 0,5 TP 1
Rel
ativ
e in
ten
sity
p-cMyc Thr58/Ser62
0
1
2
3
ctrl AZD 1 AZD 3 TP 0,5 TP 1
Rel
ativ
e in
ten
sity
p-BAD Ser136
Figure 25. Western blot on phosphoproteins before and after treatment with PIM1 inhibitors AZD1208 and TP3654 for 6h. After treatment p-GSK3β Ser9 signal drops in a concentration-dependent manner, p-cMyc Thr58/Ser62 slightly lowers except for the sample treated with the lowest TP3654 concentration. BAD Ser136 shows a considerable increase in phosphorylation. The blue dotted line represents the location where the p-BAD Ser112 should have given a signal (around 33kDa).
Ctr
l
1 3 1 3
p-GSK3β Ser9
Tubulin
TP3654(µM) AZD1208(µM)
5 5
p-BAD Ser112
Figure 26. Figure 16. Western blot on phosphoproteins before and after treatment with PIM1 inhibitors AZD1208 and TP3654 for 90min.
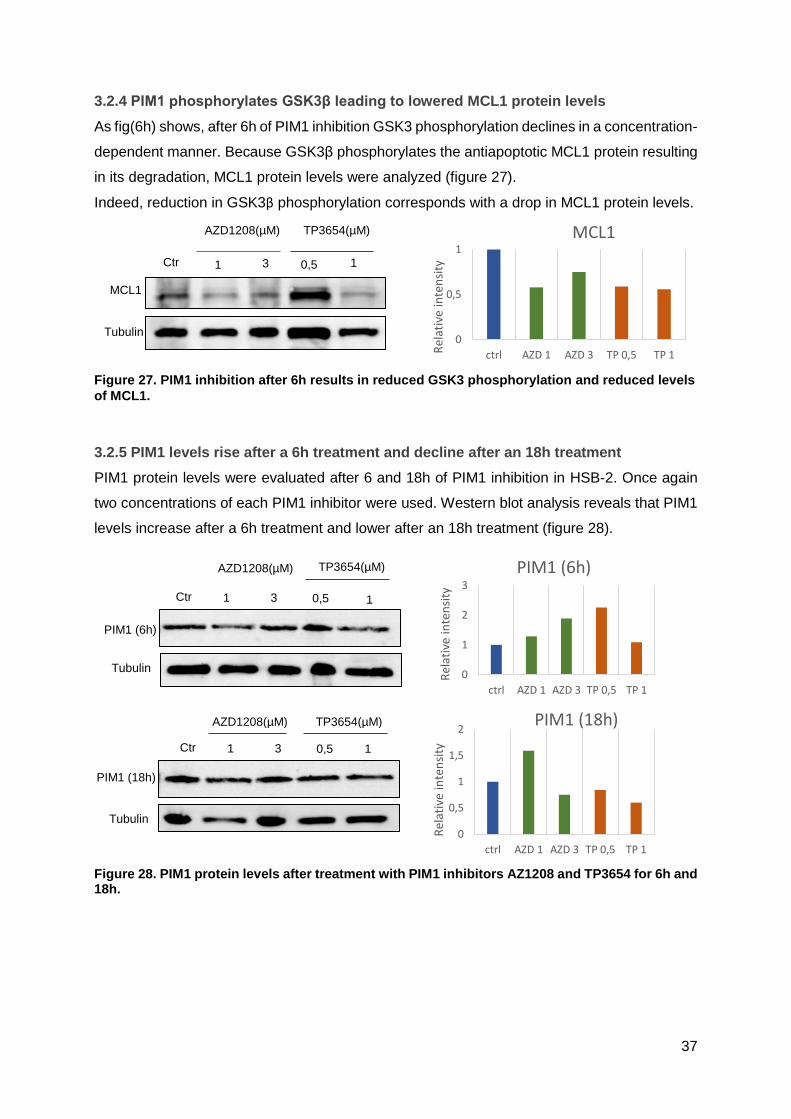
37
3.2.4 PIM1 phosphorylates GSK3β leading to lowered MCL1 protein levels
As fig(6h) shows, after 6h of PIM1 inhibition GSK3 phosphorylation declines in a concentration-
dependent manner. Because GSK3β phosphorylates the antiapoptotic MCL1 protein resulting
in its degradation, MCL1 protein levels were analyzed (figure 27).
Indeed, reduction in GSK3β phosphorylation corresponds with a drop in MCL1 protein levels.
3.2.5 PIM1 levels rise after a 6h treatment and decline after an 18h treatment
PIM1 protein levels were evaluated after 6 and 18h of PIM1 inhibition in HSB-2. Once again
two concentrations of each PIM1 inhibitor were used. Western blot analysis reveals that PIM1
levels increase after a 6h treatment and lower after an 18h treatment (figure 28).
Ctr
l 0,5 1 1 3
AZD1208(µM) TP3654(µM)
Tubulin
MCL1
0
0,5
1
ctrl AZD 1 AZD 3 TP 0,5 TP 1Rel
ativ
e in
ten
sity
MCL1
Figure 27. PIM1 inhibition after 6h results in reduced GSK3 phosphorylation and reduced levels
of MCL1.
PIM1 (6h)
Tubulin
Ctr 0,5 1 1
3
AZD1208(µM) TP3654(µM)
Ctr 0,5 1 1 3
PIM1 (18h)
Tubulin
AZD1208(µM) TP3654(µM)
0
1
2
3
ctrl AZD 1 AZD 3 TP 0,5 TP 1
Rel
ativ
e in
ten
sity
PIM1 (6h)
0
0,5
1
1,5
2
ctrl AZD 1 AZD 3 TP 0,5 TP 1
Rel
ativ
e in
ten
sity
PIM1 (18h)
Figure 28. PIM1 protein levels after treatment with PIM1 inhibitors AZ1208 and TP3654 for 6h and 18h.

38
3.3 Therapeutic potential of PIM1 inhibition in T-ALL/T-LBL
3.3.1 PIM1 inhibitors reduce viability through apoptosis and cell cycle arrest
To investigate how the PIM1 inhibitors AZD1208 and TP3654 cause reduced cell viability in
HSB-2, apoptosis and cell cycle distribution in response to two concentrations (1 and 2µM) of
these compounds for 48h was measured compared to a DMSO control.
First, the effect of the inhibitors on apoptosis by annexinV and PI double staining was
measured (figure 29). No difference was detected between control and treated (TP3654 or
AZD1208) for early apoptotic cells, with all samples having around 5%. The percentage late
apoptotic cells however, does differ between treated and control. DMSO consists of 24% late
apoptotic cells, AZD1208 at 1µM has slightly more late apoptotic cells than TP3654 at 1µM
(57% vs 55%). At 2µM however, TP3654 (78%) shows a clear increase in late apoptotic cells
compared to AZD1208 (61%).
Second, the effects of the PM1 inhibitors on cell cycle distribution was analyzed by PI staining
(figure 30). PIM1 inhibitor treatment with AZD1208 and TP3654 of HSB-2 cells increased the
population of cells in G1 in a concentration-dependent manner. TP3654 (77% for 1µM and
0
10
20
30
40
50
60
70
80
90
Early Late
% o
f ap
op
tosi
s
Apoptosis
DMSO
AZD 1µM
AZD 2µM
TP 1µM
TP 2µM
TP3654 2µM
PI
AnnexinV
TP3654 1µM
PI
AnnexinV
AZD1208 2µM
PI
AnnexinV
AZD1208 1µM
PI
AnnexinV
DMSO
PI
AnnexinV
Figure 29. Apoptosis in response to PIM1 inhibitors. There is no difference between treated and control samples for the percentage early apoptotic cells (i.e. annexinV positive and PI negative cells). The percentage late apoptotic cells (i.e. annexin an PI positive) increase after treatment, with the greatest increase after 2µM TP3654 treatment. The plots show the PI signal intensity on the y-axis and the annexinV signal intensity on the x-axis.

39
88% for 2µM)) had a more outspoken effect compared to AZD1208 (73% for 1µM and 78% for
2µM). The DMSO control had 59% of cells in G1.
While the percentage of cells in G1 increased after inhibition, cells in S and G2/M phase
declined, also in a concentration-dependent manner. The control sample had 29% of cells in
the S phase and 14% in G2/M. TP3654 treated samples had 15% of cells in S for 1µM and 6%
for 2µM. For 1µM there were 8% of cells in G2/M phase and 6% for 2µM. AZD1208 had a more
moderate decline in S phase: 19% for 1µM and 15% for 2µM, and a comparable decline to
TP3654 in G2/M: 8% for 1µM and 7% for 2µM.
0
20
40
60
80
100
G1 S G2/M
% o
f ce
lls
Cell cycle distributionDMSO
AZD 1µM
AZD 2µM
TP 1µM
TP 2µM
DMSO
Co
un
t
PI
AZD1208 1µM
PI
Co
un
t AZD1208 2µM
Co
un
t
PI
TP3654 1µM
Cou
nt
PI
TP3654 2µM
Cou
nt
PI
Figure 30. Cell cycle distribution in response to PIM1 inhibitors. PIM1 inhibitor treatment of HSB-2 cells increased the population of cells in G1 and decreased the percentage of cells in S and G2/M phase in a concentration-dependent manner. The DMSO vs inhibitor plot shows the cell cycle distribution for each inhibitor compared to DMSO. The x-axis of the histogram shows the intensity of the PI signal, which is proportional to the amount of DNA present in the cell at a given moment. This means that the first peak in the histogram represents the cells at the G1 phase of the cell cycle while the second peak represents the cells in the G2/M phase. Cells between these two peaks are in the S phase.
0
25
50
75
100
G1 S G2/M
% o
f ce
lls
DMSO vs AZDDMSO AZD 1µM AZD 2µM
0
25
50
75
100
G1 S G2/M
% o
f ce
lls
DMSO vs TP3654DMSO TP 1µM TP 2µM

40
3.3.2 Glucocorticoids and TP3654 work synergistically to reduce viability in HSB-2
To evaluate possible synergy between the PIM1 inhibitor TP3654 and the chemotherapeutics
dexamethasone, prednisolone and vincristine, several compound assays were performed.
First an approximate IC50 was calculated through monotherapy treatment in HSB-2 for 72h
(appendix 21), in order to find appropriate concentrations for combination therapy (figure 31).
The IC50’s of each compound and combination therapy was estimated using CompuSyn
software (table 8), after which the combination index (CI) was calculated (table) with the
formula described in 2.2.
0%
50%
100%
150%
Rel
ativ
e vi
abili
ty
Prednisolone & TP3654TP3654 PRED Combo
TP3654 DMSO 75 150 300 600 1200 2400 4800 PRED PBS 3,75 7,5 15 30 60 120 240
Concentration (nM)
0%
50%
100%
150%
Rel
ativ
e vi
abili
ty
Vincristine & TP3654TP3654 VINC Combo
VINC H20 120 135 150 160 170 185 200 TP3654 DMSO 75 150 300 600 1200 2400 4800
Concentration (nM)
0%
50%
100%
150%
Rel
ativ
e vi
abili
ty
Dexamethasone & TP3654TP3654 DEX Combo
DEX H20 0,375 0,75 1,5 3 6 12 24
TP3654 DMSO 75 150 300 600 1200 2400 4800
Concentration (nM)
Figure 31. TP3654 and chemotherapeutics combination therapy.
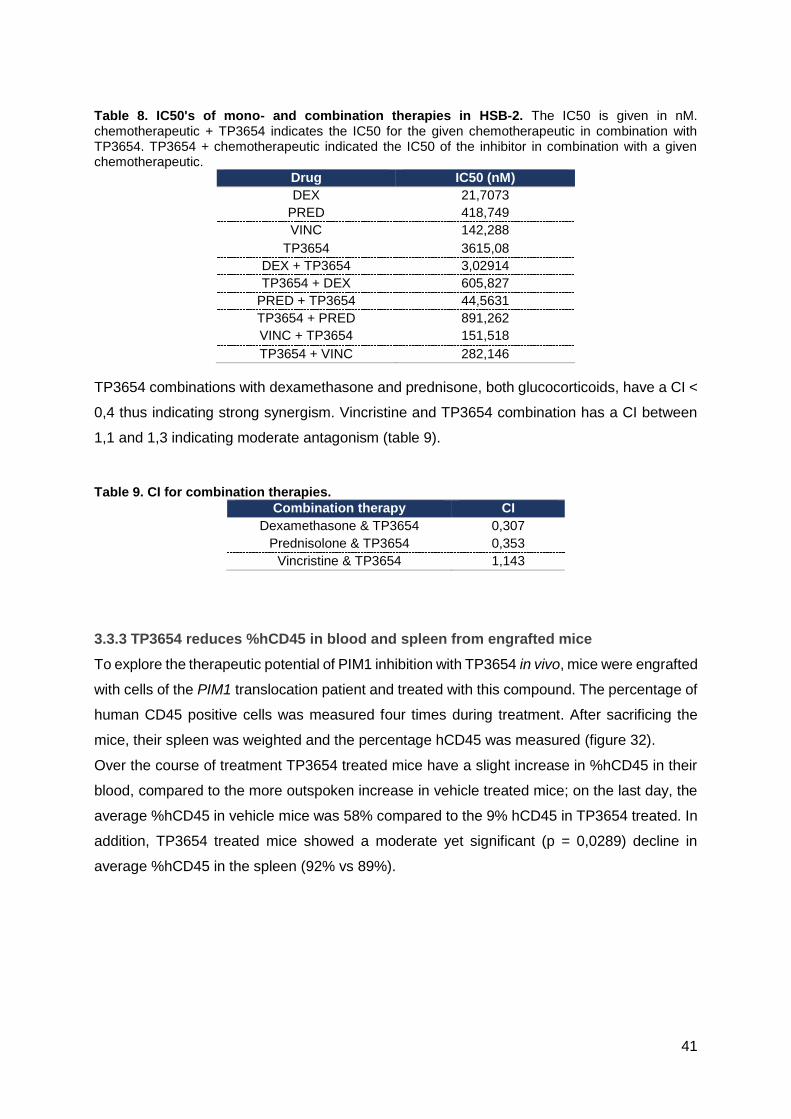
41
Table 8. IC50's of mono- and combination therapies in HSB-2. The IC50 is given in nM. chemotherapeutic + TP3654 indicates the IC50 for the given chemotherapeutic in combination with TP3654. TP3654 + chemotherapeutic indicated the IC50 of the inhibitor in combination with a given chemotherapeutic.
Drug IC50 (nM)
DEX 21,7073
PRED 418,749
VINC 142,288
TP3654 3615,08
DEX + TP3654 3,02914
TP3654 + DEX 605,827
PRED + TP3654 44,5631
TP3654 + PRED 891,262
VINC + TP3654 151,518
TP3654 + VINC 282,146
TP3654 combinations with dexamethasone and prednisone, both glucocorticoids, have a CI <
0,4 thus indicating strong synergism. Vincristine and TP3654 combination has a CI between
1,1 and 1,3 indicating moderate antagonism (table 9).
Table 9. CI for combination therapies.
Combination therapy CI
Dexamethasone & TP3654 0,307
Prednisolone & TP3654 0,353
Vincristine & TP3654 1,143
3.3.3 TP3654 reduces %hCD45 in blood and spleen from engrafted mice
To explore the therapeutic potential of PIM1 inhibition with TP3654 in vivo, mice were engrafted
with cells of the PIM1 translocation patient and treated with this compound. The percentage of
human CD45 positive cells was measured four times during treatment. After sacrificing the
mice, their spleen was weighted and the percentage hCD45 was measured (figure 32).
Over the course of treatment TP3654 treated mice have a slight increase in %hCD45 in their
blood, compared to the more outspoken increase in vehicle treated mice; on the last day, the
average %hCD45 in vehicle mice was 58% compared to the 9% hCD45 in TP3654 treated. In
addition, TP3654 treated mice showed a moderate yet significant (p = 0,0289) decline in
average %hCD45 in the spleen (92% vs 89%).

42
4 DISCUSSION
T-cell acute lymphoblastic leukemia/lymphoma is an aggressive hematopoietic malignancy
that results from genetic mutations in the thymocytes during T-cell development in the thymus.
The aggressive chemotherapeutic treatment results in dangerous toxicities and side effects,
highlighting the need for more specific and less toxic treatments. The genetic basis of T-ALL/T-
LBL can thus be used to uncover new therapeutic targets for targeted therapies. Recently the
Van Vlierberghe lab identified a T-LBL patient (= patient x) with a PIM1 translocation that
resulted in elevated levels of this serine/threonine kinase. Given the pathways in which PIM1
is involved and the fact that this kinase is overexpressed in multiple cancers including several
hematological malignancies, this project aims to unravel the oncogenic role of PIM1 in T-
ALL/T-LBL and explore the potential of a PIM1 targeted therapy in T-ALL/T-LBL.
4.1 HSB-2 as in vitro model and TP3654 as inhibitor of choice
PIM1 expression was tested in a panel of T-ALL cell lines, in order to find one with high
expression. HSB-2, DND- 41, ALL-SIL and KOPTK-1 showed the highest expression, with the
0
20
40
60
80
day 1 day 11 day 18 day 26
%h
CD
45
Days of treatment
%hCD45 in bloodvehicle TP3654
Figure 32. Percentages hCD45 in blood and spleen in TP3654 and vehicle treated mice. A: %hCD45 over the course of treatment. B: box plot %hCD45 in blood on the day of sacrifice for vehicle and treated mice. C: box plot %hCD45 in spleen on the day of sacrifice.
A
B C

43
other cell lines having very low or even non-measurable PIM1 expression. The human T-ALL
tumor cell line HSB-2 was chosen as an in vitro model for further experiments because it
showed the highest PIM1 expression in this panel. qPCR revealed that the PIM1 expression
in patient x is still four times higher compared to the PIM1 levels in HSB-2.
PIM1 inhibitors were tested in HSB-2 and in MOLT-16, a T-ALL cell line with low PIM1
expression, the results show that the higher the PIM1 expression, the more outspoken the
effects of the inhibitor, validating the choice of HSB-2 as in vitro model.
For experiments with compounds that lasted less than 24h, cells could be cultivated in serum
free medium (SFM). This is desirable, as some compounds can interact with the proteins
present in serum. This explains why cells appear to be more sensitive to TP3654 in absence
of serum, as the inhibitor is not interacting with proteins in serum and is more easily available
to the cells. If the cells needed to be incubated with a compound for longer than 24h, medium
supplemented with serum is needed as experiments showed that cells deteriorate considerably
after only 24h in the absence of serum. Nevertheless, even if cells were incubated with serum
supplemented medium, the dilution series of all the compounds was made in SFM, because
at high concentrations, some compounds can precipitate in the presence of serum.
Though many PIM1 inhibitors are currently available, three were tested in HSB-2 for 24h in
SFM: AZD1208, TP3654 and SMI4a. This last inhibitor is incapable of inducing any substantial
viability reduction even at 40µM. HSB-2 cells are noticeably more sensitive to TP3654 than to
AZD1208, although it should be noted that below 1µM HSB-2 cells are slightly more sensitive
to AZD1208. Because of the more outspoken effects of TP3654 in HSB-2, it was chosen as
the main PIM1 inhibitor for in vitro and in vivo experiments; for some in vitro experiments
however, AZD1208 was also used to explore whether both PIM1 inhibitors show the same
effect and to exclude aspecific effects.
4.2 The oncogenic role of the PIM1 kinase in T-ALL/T-LBL
As mentioned in section 1.3.5, PIM1 is a weak oncogene that is only able to induce a strong
phenotype and thus T-cell malignant transformation in combination with other oncogenes.
Even though it is not capable of inducing malignant transformation on its own, it contributes to
tumorigenesis by selectively enhancing pathways activated by the other cooperating
oncogenes. For patient x, one mutation was selected as possible cooperating oncogene:
NOTCH1; and two tumor suppressors: EP300 and IKZF1.
NOTCH1 oncogene was selected because it plays a role in the commitment of hematopoietic
progenitors to T-cell lineage, the regulation of cell proliferation and in the regulation of
hematopoietic stem cell maintenance. Furthermore, mutations in this gene are prevalent in
50% of T-ALL cases [22]. The mutation found in patient x, corresponds with a TAAGGG
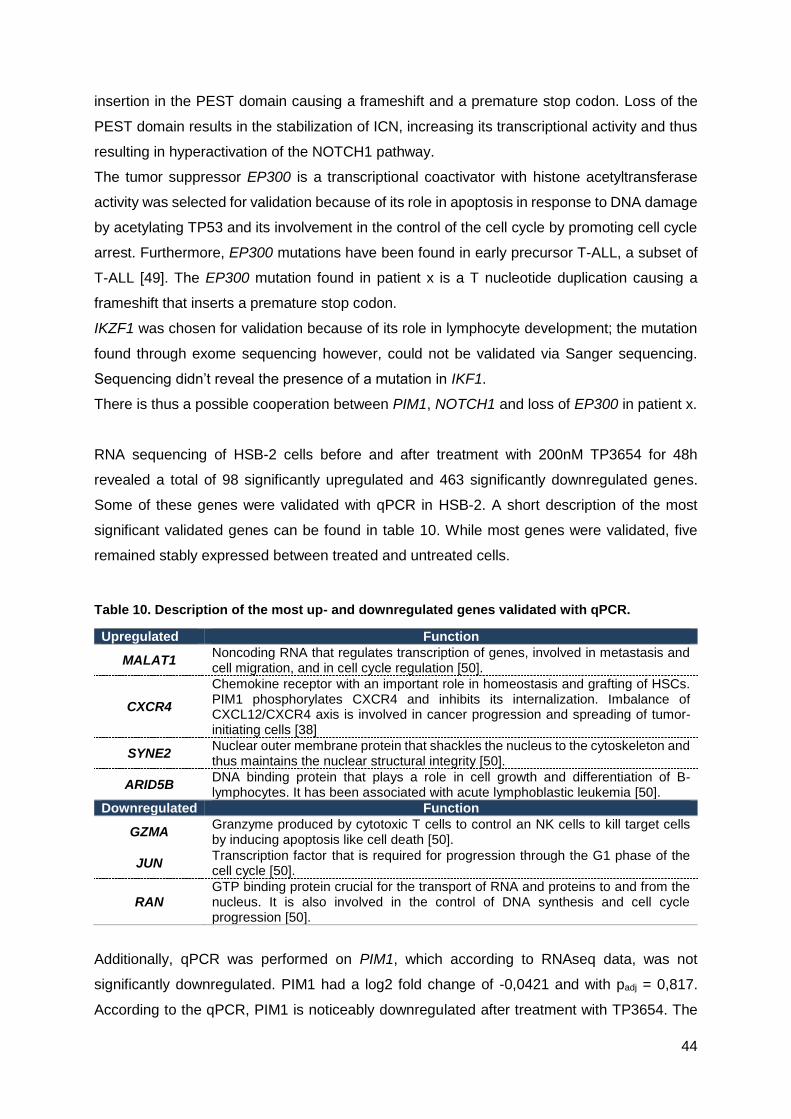
44
insertion in the PEST domain causing a frameshift and a premature stop codon. Loss of the
PEST domain results in the stabilization of ICN, increasing its transcriptional activity and thus
resulting in hyperactivation of the NOTCH1 pathway.
The tumor suppressor EP300 is a transcriptional coactivator with histone acetyltransferase
activity was selected for validation because of its role in apoptosis in response to DNA damage
by acetylating TP53 and its involvement in the control of the cell cycle by promoting cell cycle
arrest. Furthermore, EP300 mutations have been found in early precursor T-ALL, a subset of
T-ALL [49]. The EP300 mutation found in patient x is a T nucleotide duplication causing a
frameshift that inserts a premature stop codon.
IKZF1 was chosen for validation because of its role in lymphocyte development; the mutation
found through exome sequencing however, could not be validated via Sanger sequencing.
Sequencing didn’t reveal the presence of a mutation in IKF1.
There is thus a possible cooperation between PIM1, NOTCH1 and loss of EP300 in patient x.
RNA sequencing of HSB-2 cells before and after treatment with 200nM TP3654 for 48h
revealed a total of 98 significantly upregulated and 463 significantly downregulated genes.
Some of these genes were validated with qPCR in HSB-2. A short description of the most
significant validated genes can be found in table 10. While most genes were validated, five
remained stably expressed between treated and untreated cells.
Table 10. Description of the most up- and downregulated genes validated with qPCR.
Upregulated Function
MALAT1 Noncoding RNA that regulates transcription of genes, involved in metastasis and cell migration, and in cell cycle regulation [50].
CXCR4
Chemokine receptor with an important role in homeostasis and grafting of HSCs. PIM1 phosphorylates CXCR4 and inhibits its internalization. Imbalance of CXCL12/CXCR4 axis is involved in cancer progression and spreading of tumor-initiating cells [38]
SYNE2 Nuclear outer membrane protein that shackles the nucleus to the cytoskeleton and thus maintains the nuclear structural integrity [50].
ARID5B DNA binding protein that plays a role in cell growth and differentiation of B-lymphocytes. It has been associated with acute lymphoblastic leukemia [50].
Downregulated Function
GZMA Granzyme produced by cytotoxic T cells to control an NK cells to kill target cells by inducing apoptosis like cell death [50].
JUN Transcription factor that is required for progression through the G1 phase of the cell cycle [50].
RAN GTP binding protein crucial for the transport of RNA and proteins to and from the nucleus. It is also involved in the control of DNA synthesis and cell cycle progression [50].
Additionally, qPCR was performed on PIM1, which according to RNAseq data, was not
significantly downregulated. PIM1 had a log2 fold change of -0,0421 and with padj = 0,817.
According to the qPCR, PIM1 is noticeably downregulated after treatment with TP3654. The

45
opposite is true when performing qPCR on bone marrow and spleen samples from patient
engrafted mice, where PIM1 was upregulated in TP3654 treated mice compared to vehicle.
For these mice samples, only ARID1B and MALAT1 (for both spleen and BM samples) and
RAN (only BM samples) could be validated using qPCR. For the other genes, a lot of gene
expression variation could be seen between samples of the same group, not making it possible
to compare gene expression between treated and vehicle.
As mentioned in the results, the gene set enrichment analysis did not reveal any biologically
relevant results. DAVID analysis shows that most of the significantly up- and downregulated
genes code for phosphoproteins. A considerable amount of the upregulated genes is involved
in cell growth and proliferation, but also in transcription regulation; while a small portion is
involved in misregulation in cancer and leukemia. Downregulated genes are involved in
apoptosis, translation, post-translational modification and Non-Hodgkin lymphoma.
After performing western blot analysis on HSB-2 cells after treatment with PIM1 inhibitors for
different periods of time, it became apparent that a 90 minute treatment was too early and a
48 hour treatment was too late to detect direct phosphorylation effects of PIM1 inhibition.
Although after an 18 hour treatment cMyc was slightly less phosphorylated on Thr58 and Ser62
compared to a control, all other examined phosphosites remained unchanged. It was after 6
hours, that the effects of PIM1 inhibition became apparent.
Unphosphorylated BAD induces apoptosis by binding and sequestering the antiapoptotic BCL-
XL and BCL-2 proteins. These antiapoptotic proteins inhibit BAX from forming pores in the
mitochondrial membrane thus releasing cytochrome c into the cytoplasm. Phosphorylated BAD
on Ser112 promotes binding by 14-3-3 proteins thus rendering it unable to bind and inhibit
antiapoptotic proteins [45]. PIM1 predominantly phosphorylates BAD on Ser112, but also on
Ser136 at a reduced rate, while PIM3 mainly phosphorylates BAD on Ser136 [47]. It has been
suggested that phosphorylation on Ser136 is necessary for Ser112 phosphorylation [51]. In
contrast to this, dephosphorylation of Ser112 is required for the dephosphorylation of Ser136
[48]. While this study was not able to show a decline of Ser112 phosphorylation after PIM1
inhibition due to a lack of signal, it has already been demonstrated that treatment with
AZD1208 in an acute myeloid leukemia cell line leads to dose-dependent decrease of BAD
phosphorylation on Ser112 after a 3 hours treatment [52], and TP3654 treatment has also
shown to reduce levels of p-BAD in a bladder cancer cell line after a 12h treatment [53]. Here,
after a 6 hour PIM1 inhibition treatment phosphorylation of BAD on Ser136 had more or less
doubled compared to DMSO. It should be noted that phosphorylated Ser136 alone is not
enough to inactivate BAD [51]. It is possible that PIM3 and other kinases that phosphorylate
BAD on Ser136 such as AKT, up their phosphorylation activity because Ser136

46
phosphorylation is insufficient to inactivate BAD and PIM1 inhibition keeps Ser112
dephosphorylated.
PIM1 promotes cell transformation by stabilizing c-Myc; it mediates dephosphorylation on
Thr58 and phosphorylation on Ser62, these residues are important in regulating cMyc levels
during cell-cycle progression. Thr58 phosphorylation destabilizes cMyc while Ser62
phosphorylation stabilizes it.
GSK3β (Ser9) was recently discovered as a direct PIM1 target in prostate cancer. Here PIM1
phosphorylates and inactivates GSK3β and its anti-migratory activity [54]. Active GSK3β
phosphorylates the antiapoptotic member of the Bcl2 family MCL1 thus tagging it for
ubiquitination and proteasomal degradation, making MCL1 incapable of sequestrating
proapoptotic BIM, which would otherwise permeabilize the mitochondrial membrane releasing
cytochrome c. However, when PIM1 phosphorylates GSK3β, it results in a lack of
phosphorylation of MCL1 thus stabilizing it and preventing apoptosis. Further, regulation of
MCL1 protein stability by GSK3β is important (see 1.1.3 T cell development) in IL-7-mediated
survival of immature T cells [55]. This study shows that PIM1 phosphorylates GSK3β on Ser9
thus inactivating it in HSB-2, a T-ALL cell line. This inactivation coincides with lowered MCL1
protein levels.
Looking at PIM1 protein levels shows that initially, after a 6h treatment, PIM1 levels rise only
to decline after an 18h PIM1 inhibitor treatment. A drop in PIM1 protein level is consistent with
the results generated by qPCR validation of RNAseq, where HSB-2 cells were treated for 48h.
This could be because PIM1 operates within a negative feedback loop that hinders its own
transcription: PIM1 phosphorylates, stabilizes and enhances the inhibitory effects of
suppressor of cytokine signaling1 (SOCS1) and SOCS3 on JAK/STAT signaling [45]. As
discussed in 1.3.1, PIM1 is a major target of STAT3 and STAT5 transcription factors. So, it is
possible that in the beginning (6h) of PIM1 inhibition there is a decline of SOCS inhibitory
activity on JAK/STAT signaling, thus enhancing PIM1 transcription and elevating protein levels.
However, the longer the inhibition lasts (18h, 48h), the higher the PIM1 protein levels, resulting
in higher SOCS activity ultimately lowering protein levels.
4.3 The PIM1 kinase a potential therapeutic target in T-ALL/T-LBL
PIM1 inhibitors TP3654 and AZD1208 inhibited cell growth in HSB-2 through the induction of
apoptosis and cell cycle arrest in G1 phase in HSB-2 cells.
No difference was found between control, AZD1208 and TP3654 treated cells in terms of early
apoptotic cells. For late apoptotic cells, there was little difference between cells treated with
1µM of either inhibitor. At 2µM, it is demonstrated that TP3654 induces considerably more
47
apoptosis than AZD1208 at the same concentration (78% vs 61%). As previously discussed,
PIM1 inhibitors bring about apoptosis though reduced phosphorylation of BAD and GSK3β.
For cell cycle distribution, treatment with AZD1208 and TP3654 increased the population of
cells in G1 while reducing cells in S and G2/M phase in a concentration-dependent manner,
with TP3654 having a more outspoken effect. This G1 phase arrest can be explained because
inhibiting PIM1 will lead to a decrease in phosphorylation of Cdc25A and p21 (see 1.3.3), but
also the downregulation of JUN thus inhibiting G1/S phase progression.
Combination therapy with the PIM1 inhibitor TP3654 and different chemotherapeutics shows
that combination with vincristine has a moderate antagonistic effect in HSB-2, while
combination with dexamethasone and prednisolone has a strong synergistic effect.
Prednisolone and dexamethasone are glucocorticoids commonly used in chemotherapy for
leukemia, lymphoma and myeloma. The BCL-2 family of proteins has a crucial role in
regulating glucocorticoid-induced cell death, as they are downstream targets of the
glucocorticoid receptor. It has been found that downregulation of MCL1, an antiapoptotic
member of the BCL-2 family, enhances glucocorticoid-induced cell death [56]. We suggest that
PIM1 inhibition leads to MCL1 destabilization and degradation through GSK3β, explaining why
TP3654 and glucocorticoids work synergistically but not TP3654 and vincristine.
In vivo treatment with TP3654 in patient engrafted mice shows a clear decline in %hCD45 in
peripheral blood and in the spleen, showing that PIM1 inhibition not only works in vitro in HSB-
2 cells but is also a promising treatment in vivo.
5 CONCLUSION AND FUTURE PERSPECTIVES
Overexpression of PIM1 in various cancers and specifically in hematological malignancies has
been extensively described. With the discovery of a T-LBL patient with a PIM1 translocation
that led to overexpression of this constitutively active kinase, came the possibility that PIM1
could also play a role in T-ALL/T-LBL. This thesis aimed to uncover how PIM1 contributes to
malignant transformation of thymocytes, and whether targeted PIM1 inhibition could be a
feasible treatment for T-ALL/T-LBL.
These results show that in the T-LBL patient with PIM1 overexpression, PIM1 probably
cooperates with NOTCH1 and loss of the tumor suppressor EP300 in inducing malignant
thymocyte transformation.
48
Further, western blot analysis showed that a 6h PIM1 inhibition leads to a reduction in cMyc
phosphorylation (destabilizing cMyc), an increase in BAD phosphorylation on Ser136 (that
without phosphorylation of Ser112 is incapable of inactivating BAD thus leading to apoptosis)
and a reduction in GSK3β phosphorylation on Ser9 (that leads to destabilization of MCL1 and
apoptosis), thus partly explaining how overexpression of PIM1 contributes to malignant
transformation. In order to get a complete picture of PIM1 phosphorylation targets, patient
derived xenografted mice will be sacrificed and the spleens will be collected. Spleen cells will
then be treated for six hours with PIM1 inhibitors AZD1208 and TP3654 after which
phosphoproteomics will be performed.
The therapeutic potential of a PIM1 targeted therapy was tested in vivo and in vitro. In HSB-2
cells, PIM1 inhibition monotherapy leads to reduced cell viability through the induction of
apoptosis and the induction of G1 cell cycle arrest, with cells being more sensitive to TP3654
than to AZD1208. Additionally, TP3654 combination therapy with the glucocorticoids
dexamethasone and prednisolone worked synergistically to induce reduced viability. In a next
stage, PIM1 will be knocked down with shRNA in HBS-2, after which cells will be treated with
glucocorticoids to make sure that the effects shown here are undeniably the result of PIM1
inhibition.
Inhibition of PIM1 not only reduced leukemic cell growth in vitro, in vivo treatment of engrafted
mice showed a clear reduction of hCD45, demonstrating that targeted PIM1 inhibition is a
promising therapy if PIM1 is overexpressed. In a next stage patient derived xenografted mice
will be treated with a combination of TP3654 and dexamethasone to see if combination
treatment in vivo results in a more profound anti-leukemic effect compared to monotherapy. If
so, this could mean that in the future patient treatment could consist of low concentration, and
thus less damaging, glucocorticoid chemotherapy in combination with a PIM1 inhibitor.

49
6 REFERENCES
1 . Murphy, K. (2011) .Janeway’s Immunobiology, (8th edn) Garland Science. 2 . Winslow, T. (2008) , Hematopoietic Tree, Expanded Lymphoid Line. . [Online]. Available:
https://visualsonline.cancer.gov/details.cfm?imageid=7150 3 . Parham, P. (2009) .The Immune System, (3rd edn) Garland Science. 4 . Koch, U. and Radtke, F. (2011) .Mechanisms of T cell development and transformation. Annual
review of cell and developmental biology.27, 539–562 5 . Ma, D. et al. (2013) .Regulatory mechanisms of thymus and T cell development.
Developmental and Comparative Immunology.39, 91–102 6 . Wolfer, A. et al. (2002) .Inactivation of Notch1 impairs VDJbeta rearrangement and allows pre-
TCR- independent survival of early alpha beta Lineage Thymocytes. Immunity.16, 869–79. 7 . Angle, A. Leukaemia. at <http://www.cancervic.org.au/about-cancer/cancer_types/leukaemia> 8 . Leukemia. . [Online]. Available: http://www.hematology.org/Patients/Cancers/Leukemia.aspx 9 . National Cancer Institute T-all incidence. . [Online]. Available: https://seer.cancer.gov 10 . De Keersmaecker, K. et al. (2005) .Genetic insights in the pathogenesis of T-cell acute
lymphoblastic leukemia. Haematologica.90, 1116–1127 11 . Van Vlierberghe, P. et al. (2012) .The molecular es basis of T cell acute lymphoblastic
leukemia. The Journal of Clinical Investigation.122, 3398–3406 12 . Jost, T.R. et al. (2016) .Role of CXCR4-mediated bone marrow colonization in CNS infiltration
by T cell acute lymphoblastic leukemia. Journal of Leukocyte Biology.99, 1077–1087 13 . Kraszewska, M.D. et al. (2012) .T-cell acute lymphoblastic leukaemia: Recent molecular
biology findings. British Journal of Haematology.156, 303–315 14 . Van Vlierberghe, P. et al. (2008) .Molecular-genetic insights in paediatric T-cell acute
lymphoblastic leukaemia. British Journal of Haematology.143, 153–168 15 . Reece, J. (2011) .Campbell Biology, (9th edn) Pearson Education. 16 . Speleman, F. (2016) .Cursus Kankergenetica, 17 . Mills, A. (2010) .Throwing the cancer switch: reciprocal roles of polycomb and trithorax
proteins. Nature reviews. Cancer.10, 669–82 18 . van Oostveen, J. et al. (1999) .The role of homeobox genes in normal hematopoiesis and
hematological malignancies. Leukemia.13, 1675–1690 19 . Wange, R.L. (2004) .TCR signaling: Another Abl-bodied kinase joins the cascade. Current
Biology.14, 562–564 20 . Brownlie, R.J. and Zamoyska, R. (2013) .T cell receptor signalling networks: branched,
diversified and bounded. Nature reviews. Immunology.13, 257–69 21 . Pitcher, L.A. and Van Oers, N.S.C. (2003) .T-cell receptor signal transmission: Who gives an
ITAM? Trends in Immunology.24, 554–560 22 . Weng, A.P. et al. (2004) .Activating mutations of NOTCH1 in human T cell acute lymphoblastic
leukemia. Science.306, 269–71 23 . O’Neil, J. et al. (2007) .FBW7 mutations in leukemic cells mediate NOTCH pathway activation
and resistance to gamma-secretase inhibitors. The Journal of experimental medicine.204, 1813–1824
24 . Cortelazzo, S. et al. (2011) .Lymphoblastic lymphoma. Critical Reviews in Oncology/Hematology.79, 330–343
25 . Uyttebroeck, A. et al. (2007) .Is there a difference in childhood T-cell acute lymphoblastic leukaemia and T-cell lymphoblastic lymphoma? Leukemia & lymphoma.48, 1745–1754
26 . Hoelzer, D. and Gökbuget, N. (2009) .T-cell lymphoblastic lymphoma and T-cell acute lymphoblastic leukemia: a separate entity? Clinical lymphoma & myeloma.9 Suppl 3, S214–S221
27 . Burkhardt, B. (2010) .Paediatric lymphoblastic T-cell leukaemia and lymphoma: One or two diseases? British Journal of Haematology.149, 653–668
28 . Aifantis, I. et al. (2008) .Molecular pathogenesis of T-cell leukaemia and lymphoma. Nature reviews. Immunology.8, 380–90
29 . Basso, K. et al. (2011) .T-Cell Lymphoblastic Lymphoma Shows Differences and Similarities with T-Cell Acute Lymphoblastic Leukemia by Genomic and Gene Expression Analyses. Genes, chromosomes & cancer.50, 1063–1075
30 . Patrick, K. and Vora, A. (2015) .Update on biology and treatment of T-cell acute lymphoblastic leukaemia. Current opinion in pediatrics.27, 44–9

50
31 . Litt, M. et al. (2013) .Molecular Morphogenesis of T-Cell Acute Leukemia. In T-Cell Leukemia - Characteristics, Treatment and Prevention InTech
32 . de Vree, P.J.P. et al. (2014) .Targeted sequencing by proximity ligation for comprehensive variant detection and local haplotyping. Nature biotechnology.32, 1–9
33 . Bachmann, M. and Möröy, T. (2005) .The serine/threonine kinase Pim-1. International Journal of Biochemistry and Cell Biology.37, 726–730
34 . Narlik-Grassow, M. et al. (2013) .The PIM Family of Serine/Threonine Kinases in Cancer. Medicinal Research Reviews.34, 136–159
35 . Nawijn, M.C. et al. (2011) .For better or for worse: the role of Pim oncogenes in tumorigenesis. Nature reviews. Cancer.11, 23–34
36 . Brault, L. et al. (2010) .Pim serine/threonine kinases in the pathogenesis and therapy of hematologic malignancies and solid cancers. Haematologica.95, 1004–1015
37 . Hu, Y.-L. et al. (2007) .Evidence that the Pim1 kinase gene is a direct target of HOXA9. Blood.109, 4732–4738
38 . Alvarado, Y. et al. (2012) .The PIM kinases in hematological cancers. Expert review of hematology.5, 81–96
39 . Shay, K.P. et al. (2005) .Pim-1 Kinase Stability Is Regulated by Heat Shock Proteins and the Ubiquitin-Proteasome Pathway Pim-1 Kinase Stability Is Regulated by Heat Shock Proteins and the Ubiquitin-Proteasome Pathway. Molecular Cancer Research.1, 170–181
40 . Shah, N. et al. (2008) .Potential roles for the PIM1 kinase in human cancer - A molecular and therapeutic appraisal. European Journal of Cancer.44, 2144–2151
41 . Zhang, Y. et al. (2008) .Pim kinase-dependent inhibition of c-Myc degradation. Oncogene.27, 4809–4819
42 . Gu, J. et al. (2009) .PIM1 Phosphorylates and Negatively Regulates ASK1-mediated Apoptosis. Oncogene.28, 4261–4271
43 . Zhang, F. et al. (2009) .PIM1 protein kinase regulates PRAS40 phosphorylation and mTOR activity in FDCP1 cells. Cancer Biology and Therapy.8, 846–853
44 . Mondello, P. et al. (2014) .Pim kinases in hematological malignancies: where are we now and where are we going? Journal of Hematology & Oncology.7, 9392–9404
45 . Magnuson, N.S. et al. (2010) .Why target PIM1 for cancer diagnosis and treatment? Future oncology.6, 1461–78
46 . Ichite, N. et al. (2009) .Enhancement of docetaxel anticancer activity by a novel diindolylmethane compound in human non- small cell lung cancer. Clinical Cancer Research.15, 543–552
47 . Macdonald, A. et al. (2006) .Pim kinases phosphorylate multiple sites on Bad and promote 14-3-3 binding and dissociation from Bcl-XL. BMC Cell Biology.7, 1
48 . Aho, T.L.T. et al. (2004) .Pim-1 kinase promotes inactivation of the pro-apoptotic Bad protein by phosphorylating it on the Ser112 gatekeeper site. FEBS Letters.571, 43–49
49 . Haydu, J.E. and Ferrando, A.A. (2013) .Early T-cell precursor acute lymphoblastic leukaemia. Current opinion in hematology.20, 369–73
50 . Genecards. . [Online]. Available: http://www.genecards.org/ 51 . Datta, S.R. et al. (2000) .14-3-3 proteins and survival kinases cooperate to inactivate BAD by
BH3 domain phosphorylation. Molecular cell.6, 41–51 52 . Keeton, E.K. et al. (2014) .AZD1208 , a potent and selective pan-Pim kinase inhibitor ,
demonstrates ef fi cacy in preclinical models of acute myeloid leukemia. Blood.123, 905–914 53 . Foulks, J.M. et al. (2014) .A Small-Molecule Inhibitor of PIM Kinases as a Potential Treatment
for Urothelial Carcinomas. Neoplasia (United States).16, 403–412 54 . Santio, N.M. et al. (2016) .The PIM1 kinase promotes prostate cancer cell migration and
adhesion via multiple signalling pathways. Experimental Cell Research.342, 113–124 55 . Maurer, U. et al. (2006) .Glycogen synthase kinase-3 regulates mitochondrial outer membrane
permeabilization and apoptosis by destabilization of MCL-1. Molecular Cell.21, 749–760 56 . Heidari, N. et al. (2010) .GX15-070 (obatoclax) overcomes glucocorticoid resistance in acute
lymphoblastic leukemia through induction of apoptosis and autophagy. Cell Death & Disease.1, e76
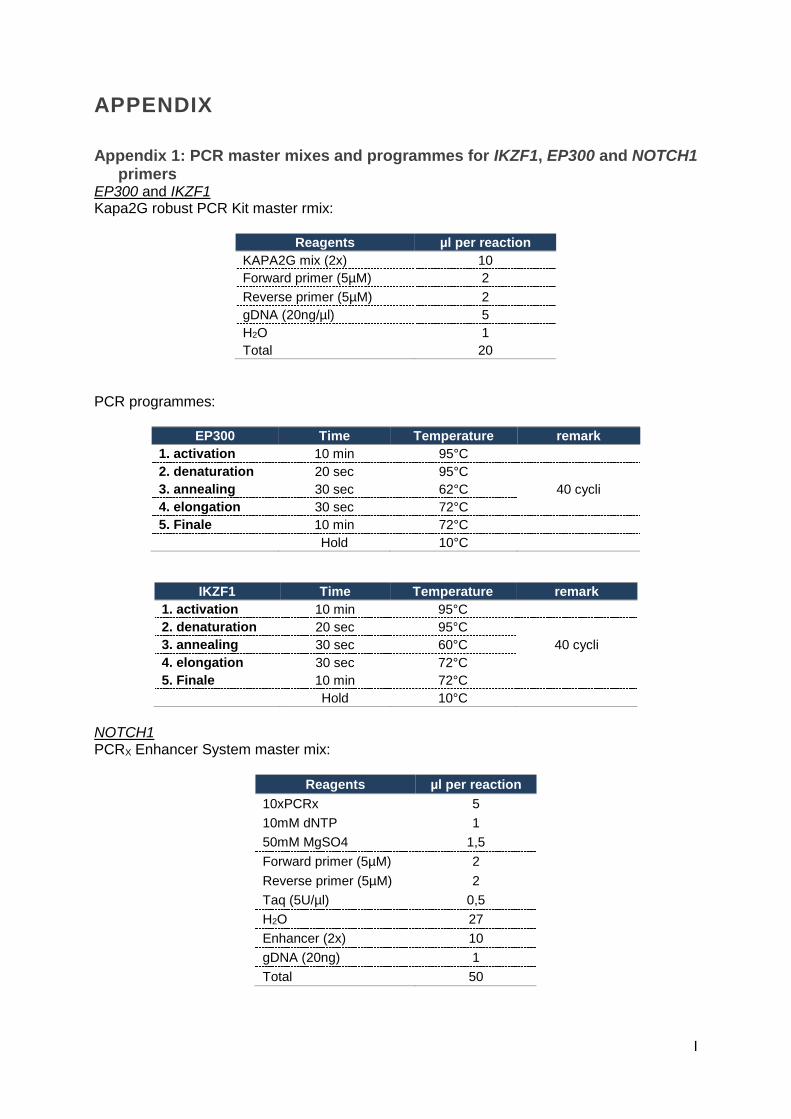
I
APPENDIX
Appendix 1: PCR master mixes and programmes for IKZF1, EP300 and NOTCH1 primers
EP300 and IKZF1 Kapa2G robust PCR Kit master rmix:
Reagents µl per reaction
KAPA2G mix (2x) 10
Forward primer (5µM) 2
Reverse primer (5µM) 2
gDNA (20ng/µl) 5
H2O 1
Total 20
PCR programmes:
EP300 Time Temperature remark
1. activation 10 min 95°C
2. denaturation 20 sec 95°C
40 cycli 3. annealing 30 sec 62°C
4. elongation 30 sec 72°C
5. Finale 10 min 72°C
Hold 10°C
IKZF1 Time Temperature remark
1. activation 10 min 95°C
2. denaturation 20 sec 95°C
40 cycli 3. annealing 30 sec 60°C
4. elongation 30 sec 72°C
5. Finale 10 min 72°C
Hold 10°C
NOTCH1 PCRX Enhancer System master mix:
Reagents µl per reaction
10xPCRx 5
10mM dNTP 1
50mM MgSO4 1,5
Forward primer (5µM) 2
Reverse primer (5µM) 2
Taq (5U/µl) 0,5
H2O 27
Enhancer (2x) 10
gDNA (20ng) 1
Total 50

II
PCR programme:
NOTCH1 Time Temperature remark
1. activation 10 min 95°C
2. denaturation 15 sec 96°C
40 cycli 3. annealing 60 sec 57°C
4. elongation 60 sec 72°C
5. Finale 10 min 72°C
Hold 10°C
Appendix 2: DNA extraction from gel All centrifugation steps should be performed between 10,000 - 16,000g.
• Excise the DNA fragment1 from the agarose gel using a razor blade, scalpel or other device and transfer it into a 1.5 ml microcentrifuge tube.
• Add 3 volumes of agarose dissolving buffer (ADB) to each volume of agarose excised from the gel (e.g. for 100 µl (mg) of agarose gel slice add 300 µl of ADB).
• Incubate at 37-55 °C for 5-10 minutes until the gel slice is completely dissolved2
• Transfer the melted agarose solution to a Zymo-Spin™ Column in a Collection Tube.
• Centrifuge for 30-60 seconds. Discard the flow-through
• Add 200 µl of DNA Wash Buffer to the column and centrifuge for 30 seconds.
• Discard the flow-through. Repeat the wash step.
• Add 12 µl DNA Elution Buffer directly to the column matrix. Place column into a 1.5 ml tube and centrifuge for 30-60 seconds to elute DNA.
Appendix 3: monotherapy and combination therapy in HSB-2
Monotherapy with chemotherapeutics
- Prednisolone: 13,95 mM (in PBS) - Dexamethasone: 9,6824 mM (in H2O) - Vincristine: 1,0834 mM (in H2O)
Seed HSB-2 cells at 0,25.106 per ml in 100µl
• 250 000 cellen per ml -> 25 000 cellen per 100µl
• 46 wells with 10 wells excess -> 25 000 x 56 = 1,4.106 cells
• Count cells: 10µl trypan blue + 10µl cell suspension → 10µl on slide = x cellen/ml
• How much cell suspension?
Transfer 1,4.10^6
𝑥 ml into a 15ml or 50ml falcon -> centrifuge (1200 RPM, 5min)
• Resuspend pellet in 5,6ml 10% RPMI medium and transfer 100µl to a 96 well plate
Make dilution series of each compound in Serum Free medium (SFM)
• Add 1µl of each concentration in duplicate to the 100µl cell suspension as shown below.
• Mix thoroughly with multichannel
• Pipet with a multichannel H2O in wells around cells to prevent evaporation in incubator.
Put in incubator for 72h and measure viability with CellTiter-Glo®
• Add 50µl CellTiter-Glo® reagent and mix
• Open protocol with 2min shaking, 10min incubation and luminescence measurement in the Glomax®

III
Setup:
DEX / H2O 8 7 6 5 4 3 2 1
PRED / PBS 8 7 6 5 4 3 2 1
VINC / H2O 6 5 4 3 2 1
DEX Final conc (nM) 100x stock (µM) SFM (µl) Higher stock (µl)
H2O 192,65 1
1 3,90625 0,390625 5 5
2 7,8125 0,78125 5 5
3 15,625 1,5625 5 5
4 31,25 3,125 5 5
5 62,5 6,25 5 5
6 125 12,5 5 5
7 250 25 5 5
8 500 50 192,65 1 9,6824 mM
PRED Final conc (nM) 100x stock (µM) SFM (µl) Higher stock (µl)
PBS 33,88 1 1 31,25 3,125 5 5 2 62,5 6,25 5 5 3 125 12,5 5 5 4 250 25 5 5 5 500 50 5 5 6 1000 100 5 5 7 2000 200 5 5 8 4000 400 33,88 1 13,95 mM
VINC Final conc (nM) 100x stock (µM) SFM (µl) Higher stock (µl)
H2O 35,1 1 1 50 5 5 5 2 100 10 5 10 3 150 15 5 15 4 200 20 5 20 5 250 25 5 25 6 300 30 35,1 1 1,0834 mM
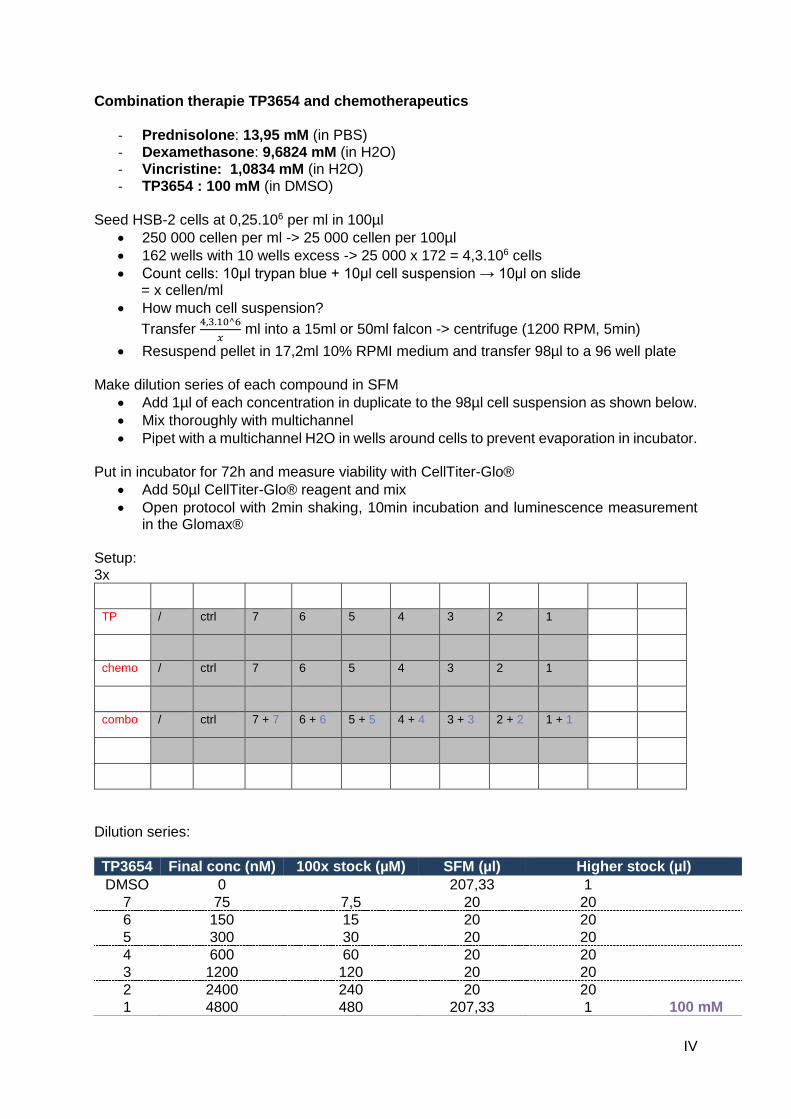
IV
Combination therapie TP3654 and chemotherapeutics
- Prednisolone: 13,95 mM (in PBS) - Dexamethasone: 9,6824 mM (in H2O) - Vincristine: 1,0834 mM (in H2O) - TP3654 : 100 mM (in DMSO)
Seed HSB-2 cells at 0,25.106 per ml in 100µl
• 250 000 cellen per ml -> 25 000 cellen per 100µl
• 162 wells with 10 wells excess -> 25 000 x 172 = 4,3.106 cells
• Count cells: 10µl trypan blue + 10µl cell suspension → 10µl on slide = x cellen/ml
• How much cell suspension?
Transfer 4,3.10^6
𝑥 ml into a 15ml or 50ml falcon -> centrifuge (1200 RPM, 5min)
• Resuspend pellet in 17,2ml 10% RPMI medium and transfer 98µl to a 96 well plate
Make dilution series of each compound in SFM
• Add 1µl of each concentration in duplicate to the 98µl cell suspension as shown below.
• Mix thoroughly with multichannel
• Pipet with a multichannel H2O in wells around cells to prevent evaporation in incubator.
Put in incubator for 72h and measure viability with CellTiter-Glo®
• Add 50µl CellTiter-Glo® reagent and mix
• Open protocol with 2min shaking, 10min incubation and luminescence measurement in the Glomax®
Setup: 3x
TP / ctrl 7 6 5 4 3 2 1
chemo / ctrl 7 6 5 4 3 2 1
combo / ctrl 7 + 7 6 + 6 5 + 5 4 + 4 3 + 3 2 + 2 1 + 1
Dilution series:
TP3654 Final conc (nM) 100x stock (µM) SFM (µl) Higher stock (µl)
DMSO 0 207,33 1 7 75 7,5 20 20
6 150 15 20 20
5 300 30 20 20
4 600 60 20 20 3 1200 120 20 20 2 2400 240 20 20
1 4800 480 207,33 1 100 mM

V
PRED Final conc (nM) 100x stock (µM) SFM (µl) Higher stock (µl)
PBS 0 580,25 1 7 3,75 0,375 10 10
6 7,5 0,75 10 10
5 15 1,5 10 10
4 30 3 10 10 3 60 6 10 10 2 120 12 10 10
1 240 24 580,25 1 13,95 mM
DEX Final conc (nM) 100x stock (µM) SFM (µl) Higher stock (µl)
H2O 0 4033,33 1 7 0,375 0,0375 10 10
6 0,75 0,075 10 10
5 1,5 0,15 10 10
4 3 0,3 10 10 3 6 0,6 10 10 2 12 1,2 10 10
1 24 2,4 4033,33 1 9,6824 mM
VINC Final conc (nM) 100x stock (µM) SFM (µl) Higher stock (µl)
H2O 0 53,17 1
7 120 12 4,5 36
6 135 13,5 4,5 40,5
5 150 15 3 45
4 160 16 3 48
3 170 17 4,5 51
2 185 18,5 4,5 55,5
1 200 20 106,34 2 1,0834 mM
Appendix 4: HSB-2 treatment for RNA sequencing
Seed HSB-2 cells at 0,5.106 per ml
• There are 3.106 cells needed for RNA seq ⇒ resuspend 3.106 cells in 6ml 10% RPMI medium.
• Count cells: 10µl trypan blue + 10µl cell suspension → 10µl on slide = x cellen/ml
• How much ml cell suspension nodig? (3.10^6)/x ml
• Transfer 3.10^6
𝑥 to 2 falcons (1 control + 1 treated) and centrifuge (1200 RPM, 5min)
• Resuspend pellets in 6 ml 10% RPMI medium and transfer to two T25 flasks Treat one T25 flask with TP3654
• TP3654 stock = 100mM Finale concentration: 200nM
• Make higher stock of 200µM 1µl TP3654 + 499µl SVM

VI
• Add 6µl higher stock to T25 flask Put T25 flasks in incubator for 48h Measure viability
• After 48h, transfer 100µl cell suspension from both conditions to a 96 well plate in triplicate and measure cell viability with CellTiter-Glo®
Collect cells and add 700µl QIAzol (qiagen) to the pellets and extract RNA (or save at -80°C)
Appendix 5: cell collection
For collection of suspension cells:
• collect the cells by pipetting into 15 ml or 50 ml tubes;
• centrifuge the cells (3000 rpm, 5 min, 4 °C or room temperature);
• remove the medium; then
• wash the cells by adding ice-cold PBS (e.g. 5 ml) to the cells, and homogenize the cells by pipetting up and down; from this moment, everything needs to be on ice (cold);
• centrifuge the cells again (3000 rpm, 5 min, 4 °C!!); remove the supernatant and put the cell pellet on ice
Appendix 6: RNA isolation
miRNeasy mini kit (Qiagen) Things to do before starting
• Buffers RWT and RPE are supplied as concentrates. Before using for the first time, add the required amounts of absolute ethanol (100%), as indicated on the bottle, to obtain a working solution.
• Cool the centrifuge to 4°C. Starting material
• Cells: Harvest cells and dissolve the pellet into 700µl QIAzol.
• Freeze the samples at -80°C or Homogenize cells by using a syringe and needle.
Protocol
• Place the tube containing the homogenate on the benchtop at room temperature (15-25°C) for 5min.
• Add 140µl chloroform. Mix well by pulsed vortexing.
• Place the tubes on the benchtop at room temperature for 2min.
• Centrifuge for 15min at 12000g at 4°C. After centrifugation, heat the centrifuge up to room temperature (15-25°C).
• Transfer the upper aqueous phase to a new collection tube and place this tube on ice.
• Add 1,5 volumes of 100% ethanol and mix thoroughly by pipetting up and down several times. DO NOT CENTRIFUGE!
• Pipet up to 700µl of the sample, including any precipitate that may have formed, into an RNeasy Mini spin column in a 2ml collection tube, at RT. Close the lid gently and centrifuge at ≥8000 x g (≥10,000 RPM) for 15s. Discard the flow-through.
• Repeat step 7 using the remainder of the sample. Discard the flow-through and reuse the collection tube.

VII
• Add 350µl Buffer RWT to the RNeasy Mini spin column. Close the lid gently and centrifuge for 15s at ≥8000 x g (≥10,000 RPM) to wash the column. Discard the flow-through and reuse the collection tube.
• Pipet 80µl DNase I (10µl DNase I stock solution + 70µl buffer RDD) directly onto the RNeasy Mini spin column membrane and place on the benchtop at RT for 15min.
• Add 350µl Buffer RWT to the RNeasy Mini spin column. Close the lid gently and centrifuge for 15s at ≥8000 x g (≥10,000 RPM) to wash the column. Discard the flow-through and reuse the collection tube.
• Pipet 500µl Buffer RPE into the RNeasy Mini spin column. Close the lid gently and centrifuge for 15s at ≥8000 x g (≥10,000 RPM) to wash the column. Discard the flow-through and reuse the collection tube.
• Add another 500µl Buffer RPE to the RNeasy Mini spin column. Close the lid gently and centrifuge for 2min at ≥8000 x g (≥10,000 RPM) to dry the RNeasy Mini spin column membrane.
• Place the RNeasy Mini spin column into a new 2ml collection tube. Centrifuge at full speed for 1min. Discard the old collection tube with the flow-through.
• Transfer the RNeasy Mini spin column to a new 1,5ml collection tube. Pipet 30-50µl RNase free water directly onto the RNeasy Mini spin column membrane. Close the lid gently and centrifuge for 1 min at ≥8000 x g (≥10,000 RPM) to elute the RNA.
• Remove the RNeasy Mini spin column and close the collection tube.
• Place the samples on ice.
• Measure the concentration with Nanodrop® ND 1000 (Thermo Fisher) and store samples at -80°C.
Appendix 7: cDNA synthesis
iScript™ Advanced cDNA synthesis kit (Bio-Rad)
• Measure RNA concentration of samples with Nanodrop® ND 1000
• Calculate volume of RNA needed for 500ng and dilute in sigma water until 15μl
• make mix: Reagents µl per reaction
Reverse transcriptase 1
5x iScript mix 4
RNA (500ng) 15
Total 20
cDNA synthesis programme:
Temperature Time
46°C 20min
95°C 1min
4°C hold
concentration cDNA = 25 ng/µl → dilute 10x for qPCR in sigma water → 20µl cDNA + 180 µl water = 2,5ng/µl
Appendix 8: qPCR
SsoAdvanced™ Universal SYBR® Green Supermix (Bio-rad)
• Prepare a master mix for the appropriate number of samples plus 10 excess. Each sample should be run in duplicate, including the NTC (no template control) Master mix:

VIII
Reagents µl for 1 reaction
SsoAdvanced™ supermix 2,5
Forward primer (5µM) 0,25
Reverse primer (5µM) 0,25
Total 3
• Dispense 3 µl master mix in each well of a 384-well plate, using a distriman® (Gilson).
• Add 2 µl template (2,5 ng/µl, 5 ng in total). Use a multichannel.
• Seal the 384-well plate and centrifuge for + 10 seconds at 1500 rpm and run plate.
• qPCR programme:
Temperature Time remark
Activation 95°C 2min
Denaturation 95°C 5sec
44 cycli Annealing 60°C 30sec
Elongation 72°C 1sec
Disassociation curve 62 → 95°C ↑0,11°C per sec
Cooling 37°C 3min
Primer sequences:
Gene Primer sequence
Refe
rence g
enes
HMBS GGCAATGCGGCTGCAA
GGGTACCCACGCGAATCAC
B2M TGCTGTCTCCATGTTTGATGTATCT
TCTCTGCTCCCCACCTCTAAGT
HPRT1 TGACACTGGCAAAACAATGCA
GGTCCTTTTCACCAGCAAGCT
TBP CACGAACCACGGCACTGATT
TTTTCTTGCTGCCAGTCTGGAC
Targ
et g
enes
PIM1 CGAGCATGACGAAGAGATCAT
TCGAAGGTTGGCCTATCTGA
GZMA ATTCTTGGGGCTCACTCAATAAC
GGGTCATAGCATGGATAGGGAAA
ARID5B TCTTAAAGGCAGACCACGCAA
TGCCATCGGAATTGTTGTTGG
ARID1B GCAAGGTGTGAGTGGTTACTG
GGACTGGGACGGCAGATACT
MALAT1 GGATCCTAGACCAGCATGCC
AAAGGTTACCATAAGTAAGTTCCAGAAAA
RUNX1 GAGTAATGTGATCGCTTGGT
AGTGACCCTCAGTGTCTAAA
CXCR4 ACGCCACCAACAGTCAGAG
AGTCGGGAATAGTCAGCAGGA
RAN CAGCAGTTCACACTACACCG
CTGCCCCACTGTGCATATTC
BCL11B TCCAGCTACATTTGCACAACA
GCTCCAGGTAGATGCGGAAG
ZBTB20 GCGACCACCACATGGAAGA
TTGCCCACTAGGGTCTGGA
PHF10 ACACTGCTCCCAATGTGAGA
TTCCATACACTGCCATGGGT
SYNE2 TAAAGCAGGTGGACAGCGTA
CCACGAGCCAACTGATAAGC
JUN TCCAAGTGCCGAAAAAGGAAG
CGAGTTCTGAGCTTTCAAGGT

IX
Appendix 9: cell lysis and protein extraction from cells
• Prepare RIPA lysis buffer (for 50ml) o 40.5 ml water (distillated) o 250 mg sodium deoxycholate (Sigma) o 1.5 ml of a 5 M NaCl solution o 2.5 ml of a 1 M TrisHCl (pH 7.5) solution o 0.5 ml of a 10 % SDS solution (Sigma) o 5 ml of a 10 % NP-40 solution (Sigma)
• Although RIPA buffer is stable for about 1 month at 4 °C, adding the required protease inhibitors (inhibit protein degradation by proteases that are freely moving upon cell lysis) or phosphatase inhibitors (prevent dephosphorylation of certain proteins) has to be done just before starting the lysis (only stable for hours to 1 day in suspension)
• 1 Roche tablet would be sufficient for 10 ml lysis buffer; or make a stock solution by dissolving the tablet in 1.5 ml water and use this as a 7 x stock; the stock can be stored for several weeks at -20°C
• Thus: add the appropriate volume of the inhibitor stock solution to the RIPA lysis buffer in a 1:6 ratio (eg. 100 µl stock to 600 µl RIPA; in that way)
• The buffer has to be chilled before adding it to the cells, and every step following also has to be performed on ice or at 4 °C (prevents unwanted thermal or enzymatic degradation of proteins)
• thaw the cell pellets on ice
• Add lysis buffer (supplemented with the protease inhibitor cocktail) to the cells E.g. for 1,5 million HSB-2 cells, an amount of 100µl RIPA buffer can be used. Pipet up/down to dissolve and lyse the cells
• To obtain more complete lysis (for example to bring membrane proteins in solution more efficiently), the eppendorfs with RIPA lysate can be rotated for 1h at 4 °C
• Centrifuge the lysates to pellet down cellular debris (fragments from membranes for example) at 10000 RPM for 10 min, at 4 °C;
• Transfer the cleared lysate to fresh eppendorfs (prechilled!) and discard the eppendorfs with the debris pellets
Appendix 10: Total protein concentration measurement
Pierce™ BCA protein assay kit (Thermo Fisher)
• Make BCA master mix with reagents A and B. Master mix consists of 50 times more A than B.
• Pipet 200µl master mix per well in a Corning® 96 well clear bottom microplate
• Add BSA (1mg/ml) to the first 2 columns of the plate in ascending volumes:
A B
1 0 µl 0 µl
2 2 µl 2 µl
3 4 µl 4 µl
4 6 µl 6 µl
5 8 µl 8 µl
6 10 µl 10 µl
7 / /
8 / /
• Add 2µl of each sample in triplicate (horizontally)
• Mix with multichannel
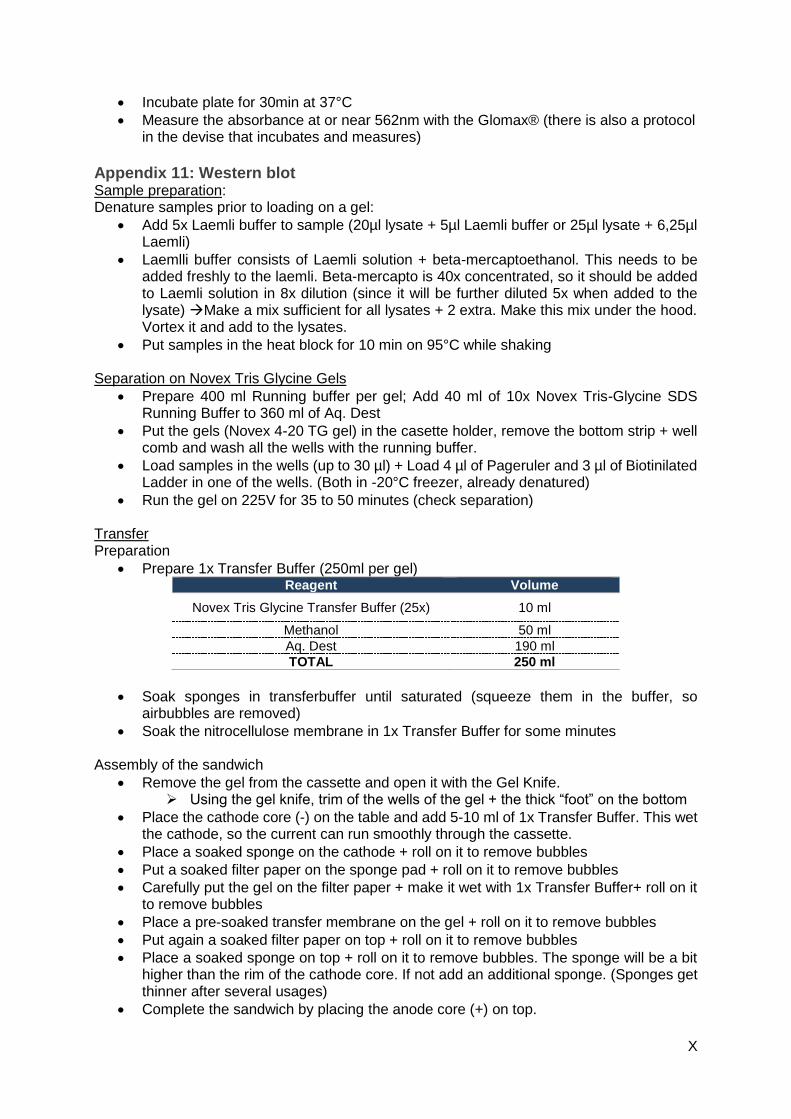
X
• Incubate plate for 30min at 37°C
• Measure the absorbance at or near 562nm with the Glomax® (there is also a protocol in the devise that incubates and measures)
Appendix 11: Western blot Sample preparation: Denature samples prior to loading on a gel:
• Add 5x Laemli buffer to sample (20µl lysate + 5µl Laemli buffer or 25µl lysate + 6,25µl Laemli)
• Laemlli buffer consists of Laemli solution + beta-mercaptoethanol. This needs to be added freshly to the laemli. Beta-mercapto is 40x concentrated, so it should be added to Laemli solution in 8x dilution (since it will be further diluted 5x when added to the lysate) Make a mix sufficient for all lysates + 2 extra. Make this mix under the hood. Vortex it and add to the lysates.
• Put samples in the heat block for 10 min on 95°C while shaking
Separation on Novex Tris Glycine Gels
• Prepare 400 ml Running buffer per gel; Add 40 ml of 10x Novex Tris-Glycine SDS Running Buffer to 360 ml of Aq. Dest
• Put the gels (Novex 4-20 TG gel) in the casette holder, remove the bottom strip + well comb and wash all the wells with the running buffer.
• Load samples in the wells (up to 30 µl) + Load 4 µl of Pageruler and 3 µl of Biotinilated Ladder in one of the wells. (Both in -20°C freezer, already denatured)
• Run the gel on 225V for 35 to 50 minutes (check separation)
Transfer Preparation
• Prepare 1x Transfer Buffer (250ml per gel) Reagent Volume
Novex Tris Glycine Transfer Buffer (25x) 10 ml
Methanol 50 ml
Aq. Dest 190 ml
TOTAL 250 ml
• Soak sponges in transferbuffer until saturated (squeeze them in the buffer, so airbubbles are removed)
• Soak the nitrocellulose membrane in 1x Transfer Buffer for some minutes
Assembly of the sandwich
• Remove the gel from the cassette and open it with the Gel Knife. ➢ Using the gel knife, trim of the wells of the gel + the thick “foot” on the bottom
• Place the cathode core (-) on the table and add 5-10 ml of 1x Transfer Buffer. This wet the cathode, so the current can run smoothly through the cassette.
• Place a soaked sponge on the cathode + roll on it to remove bubbles
• Put a soaked filter paper on the sponge pad + roll on it to remove bubbles
• Carefully put the gel on the filter paper + make it wet with 1x Transfer Buffer+ roll on it to remove bubbles
• Place a pre-soaked transfer membrane on the gel + roll on it to remove bubbles
• Put again a soaked filter paper on top + roll on it to remove bubbles
• Place a soaked sponge on top + roll on it to remove bubbles. The sponge will be a bit higher than the rim of the cathode core. If not add an additional sponge. (Sponges get thinner after several usages)
• Complete the sandwich by placing the anode core (+) on top.
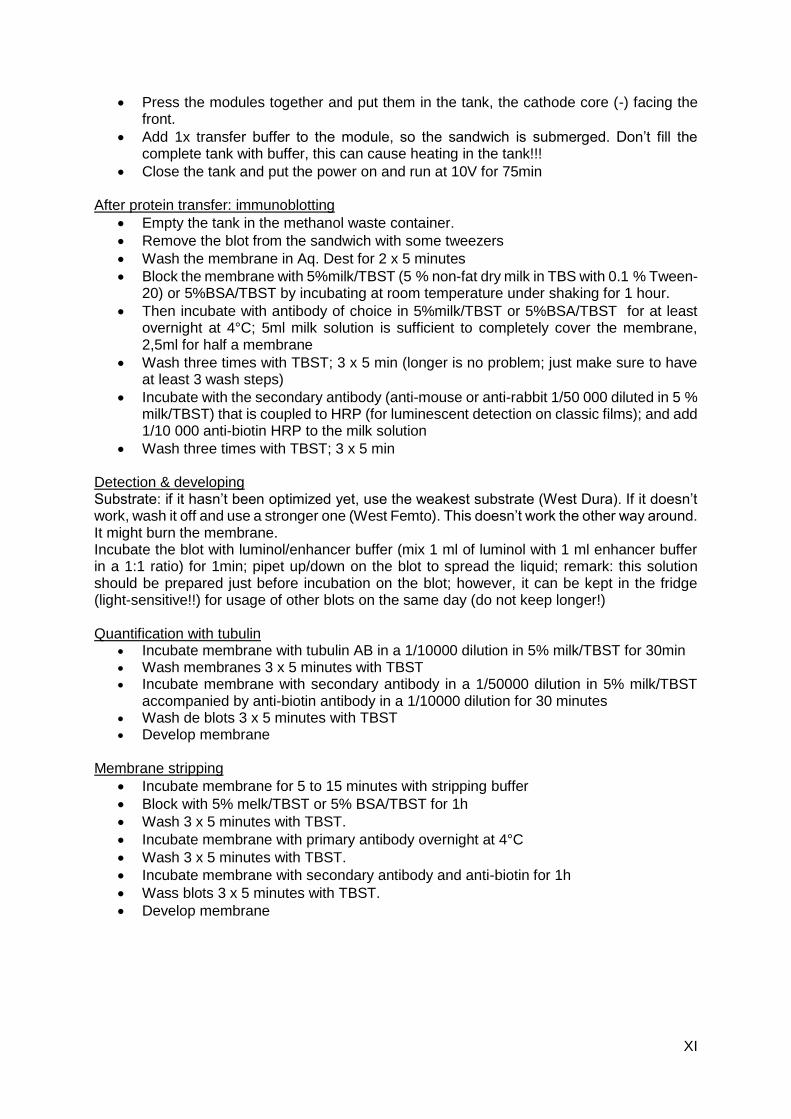
XI
• Press the modules together and put them in the tank, the cathode core (-) facing the front.
• Add 1x transfer buffer to the module, so the sandwich is submerged. Don’t fill the complete tank with buffer, this can cause heating in the tank!!!
• Close the tank and put the power on and run at 10V for 75min
After protein transfer: immunoblotting
• Empty the tank in the methanol waste container.
• Remove the blot from the sandwich with some tweezers
• Wash the membrane in Aq. Dest for 2 x 5 minutes
• Block the membrane with 5%milk/TBST (5 % non-fat dry milk in TBS with 0.1 % Tween-20) or 5%BSA/TBST by incubating at room temperature under shaking for 1 hour.
• Then incubate with antibody of choice in 5%milk/TBST or 5%BSA/TBST for at least overnight at 4°C; 5ml milk solution is sufficient to completely cover the membrane, 2,5ml for half a membrane
• Wash three times with TBST; 3 x 5 min (longer is no problem; just make sure to have at least 3 wash steps)
• Incubate with the secondary antibody (anti-mouse or anti-rabbit 1/50 000 diluted in 5 % milk/TBST) that is coupled to HRP (for luminescent detection on classic films); and add 1/10 000 anti-biotin HRP to the milk solution
• Wash three times with TBST; 3 x 5 min
Detection & developing Substrate: if it hasn’t been optimized yet, use the weakest substrate (West Dura). If it doesn’t work, wash it off and use a stronger one (West Femto). This doesn’t work the other way around. It might burn the membrane. Incubate the blot with luminol/enhancer buffer (mix 1 ml of luminol with 1 ml enhancer buffer in a 1:1 ratio) for 1min; pipet up/down on the blot to spread the liquid; remark: this solution should be prepared just before incubation on the blot; however, it can be kept in the fridge (light-sensitive!!) for usage of other blots on the same day (do not keep longer!) Quantification with tubulin
• Incubate membrane with tubulin AB in a 1/10000 dilution in 5% milk/TBST for 30min • Wash membranes 3 x 5 minutes with TBST • Incubate membrane with secondary antibody in a 1/50000 dilution in 5% milk/TBST
accompanied by anti-biotin antibody in a 1/10000 dilution for 30 minutes • Wash de blots 3 x 5 minutes with TBST • Develop membrane
Membrane stripping
• Incubate membrane for 5 to 15 minutes with stripping buffer
• Block with 5% melk/TBST or 5% BSA/TBST for 1h
• Wash 3 x 5 minutes with TBST.
• Incubate membrane with primary antibody overnight at 4°C
• Wash 3 x 5 minutes with TBST.
• Incubate membrane with secondary antibody and anti-biotin for 1h
• Wass blots 3 x 5 minutes with TBST.
• Develop membrane

XII
Appendix 12: cell cycle analysis
Collect treated cells
• Centrifuge and resuspend in 5ml PBS
• Count cells
• Transfer 500 000 cells per condition into Eppendorfs
• Centrifuge (1200 RPM, 5min) and wash in 1ml PBS Fixate cell in ethanol
• Resuspend pellet in 300µl COLD PBS (keep on ice)
• Add 700µl ice-cold 70% EtOh dropwise while vortexing
• Incubate for minimum 1h at -20°C
• centrifuge (5min, 1200 RPM)
• carefully aspirate SN
• wash in 1 ml PBS
• spin down 5min, 1200 rpm; remove SN
• resuspend in 500 µl cold PBS and keep cells on ice add RNAse A (final conc 0.2 – 0.5 mg/ml)
• zodat PI enkel met DNA intercaleert
• 100 mg/ml 200x verdunnen + 2,5 µl
• incubate 1h at 37°C
add PI (final conc 40 µg/ml)
• PI stock = 1 mg/ml 25x verdunnen + 20 µl
• Transfer cells to FACS tubes
• Keep covered from light
perform flow cytometry
Appendix 13: apoptosis assay
FITC AnnexinV apoptosis detection kit I (BD) Collect treated cells
• Centrifuge and resuspend in 5ml PBS
• Count cells
• Transfer 1 million cells per condition into Eppendorfs
• Centrifuge (1200 RPM, 5min) and wash in 1ml PBS Stain cells
• Add 1xBinding buffer (the 10x buffer from the kit needs to be diluted first in H2O!) so that cells are at a concentration of 1 million per ml. thus add 1ml to 1 million cells
• transfer 100 000 cells (=100 µl) to fresh eppendorfs and add 5µl annexinV, 5µl PI, both or leave unstained
• Vortex samples where annexinV/PI was added
• Incubate at room temperature in the dark for 15min
• Transfer samples into FACS tube with filter strainer cap
• Add an extra 400µl 1x Binding buffer perform flow cytometry
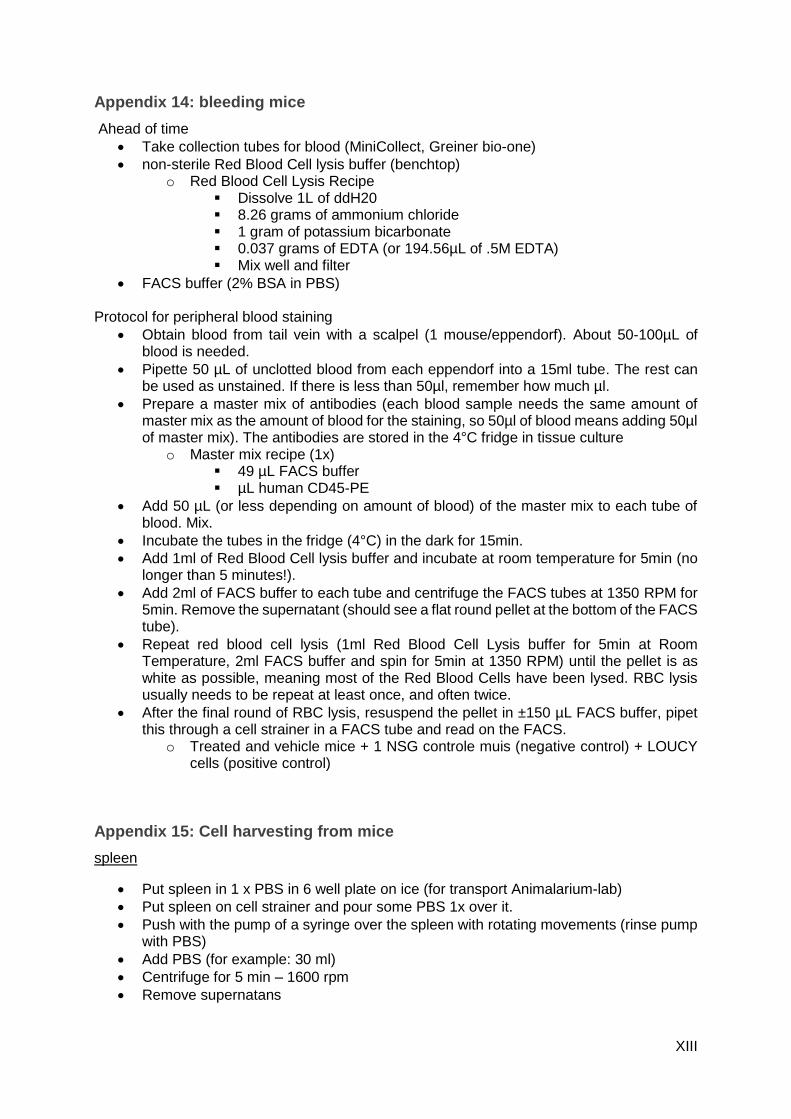
XIII
Appendix 14: bleeding mice
Ahead of time
• Take collection tubes for blood (MiniCollect, Greiner bio-one)
• non-sterile Red Blood Cell lysis buffer (benchtop) o Red Blood Cell Lysis Recipe
▪ Dissolve 1L of ddH20 ▪ 8.26 grams of ammonium chloride ▪ 1 gram of potassium bicarbonate ▪ 0.037 grams of EDTA (or 194.56µL of .5M EDTA) ▪ Mix well and filter
• FACS buffer (2% BSA in PBS) Protocol for peripheral blood staining
• Obtain blood from tail vein with a scalpel (1 mouse/eppendorf). About 50-100µL of blood is needed.
• Pipette 50 µL of unclotted blood from each eppendorf into a 15ml tube. The rest can be used as unstained. If there is less than 50µl, remember how much µl.
• Prepare a master mix of antibodies (each blood sample needs the same amount of master mix as the amount of blood for the staining, so 50µl of blood means adding 50µl of master mix). The antibodies are stored in the 4°C fridge in tissue culture
o Master mix recipe (1x) ▪ 49 µL FACS buffer ▪ µL human CD45-PE
• Add 50 µL (or less depending on amount of blood) of the master mix to each tube of blood. Mix.
• Incubate the tubes in the fridge (4°C) in the dark for 15min.
• Add 1ml of Red Blood Cell lysis buffer and incubate at room temperature for 5min (no longer than 5 minutes!).
• Add 2ml of FACS buffer to each tube and centrifuge the FACS tubes at 1350 RPM for 5min. Remove the supernatant (should see a flat round pellet at the bottom of the FACS tube).
• Repeat red blood cell lysis (1ml Red Blood Cell Lysis buffer for 5min at Room Temperature, 2ml FACS buffer and spin for 5min at 1350 RPM) until the pellet is as white as possible, meaning most of the Red Blood Cells have been lysed. RBC lysis usually needs to be repeat at least once, and often twice.
• After the final round of RBC lysis, resuspend the pellet in ±150 µL FACS buffer, pipet this through a cell strainer in a FACS tube and read on the FACS.
o Treated and vehicle mice + 1 NSG controle muis (negative control) + LOUCY cells (positive control)
Appendix 15: Cell harvesting from mice
spleen
• Put spleen in 1 x PBS in 6 well plate on ice (for transport Animalarium-lab)
• Put spleen on cell strainer and pour some PBS 1x over it.
• Push with the pump of a syringe over the spleen with rotating movements (rinse pump with PBS)
• Add PBS (for example: 30 ml)
• Centrifuge for 5 min – 1600 rpm
• Remove supernatans
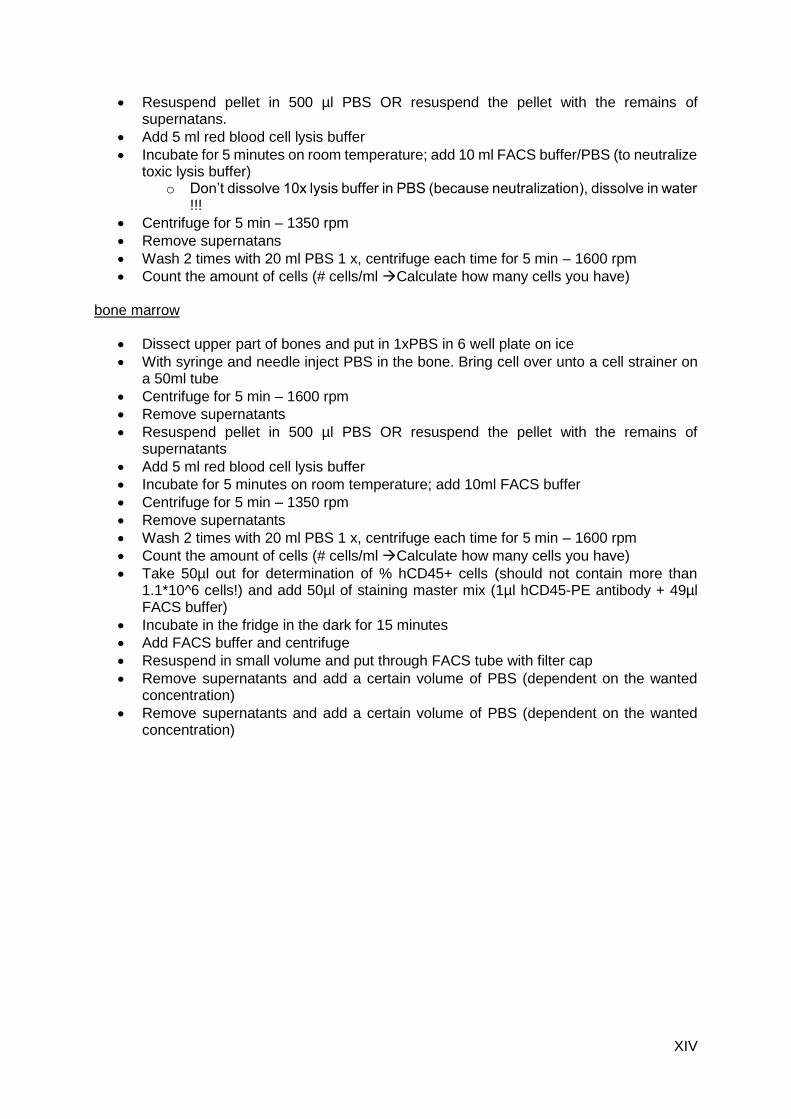
XIV
• Resuspend pellet in 500 µl PBS OR resuspend the pellet with the remains of supernatans.
• Add 5 ml red blood cell lysis buffer
• Incubate for 5 minutes on room temperature; add 10 ml FACS buffer/PBS (to neutralize toxic lysis buffer)
o Don’t dissolve 10x lysis buffer in PBS (because neutralization), dissolve in water !!!
• Centrifuge for 5 min – 1350 rpm
• Remove supernatans
• Wash 2 times with 20 ml PBS 1 x, centrifuge each time for 5 min – 1600 rpm
• Count the amount of cells (# cells/ml Calculate how many cells you have) bone marrow
• Dissect upper part of bones and put in 1xPBS in 6 well plate on ice
• With syringe and needle inject PBS in the bone. Bring cell over unto a cell strainer on a 50ml tube
• Centrifuge for 5 min – 1600 rpm
• Remove supernatants
• Resuspend pellet in 500 µl PBS OR resuspend the pellet with the remains of supernatants
• Add 5 ml red blood cell lysis buffer
• Incubate for 5 minutes on room temperature; add 10ml FACS buffer
• Centrifuge for 5 min – 1350 rpm
• Remove supernatants
• Wash 2 times with 20 ml PBS 1 x, centrifuge each time for 5 min – 1600 rpm
• Count the amount of cells (# cells/ml Calculate how many cells you have)
• Take 50µl out for determination of % hCD45+ cells (should not contain more than 1.1*10^6 cells!) and add 50µl of staining master mix (1µl hCD45-PE antibody + 49µl FACS buffer)
• Incubate in the fridge in the dark for 15 minutes
• Add FACS buffer and centrifuge
• Resuspend in small volume and put through FACS tube with filter cap
• Remove supernatants and add a certain volume of PBS (dependent on the wanted concentration)
• Remove supernatants and add a certain volume of PBS (dependent on the wanted concentration)
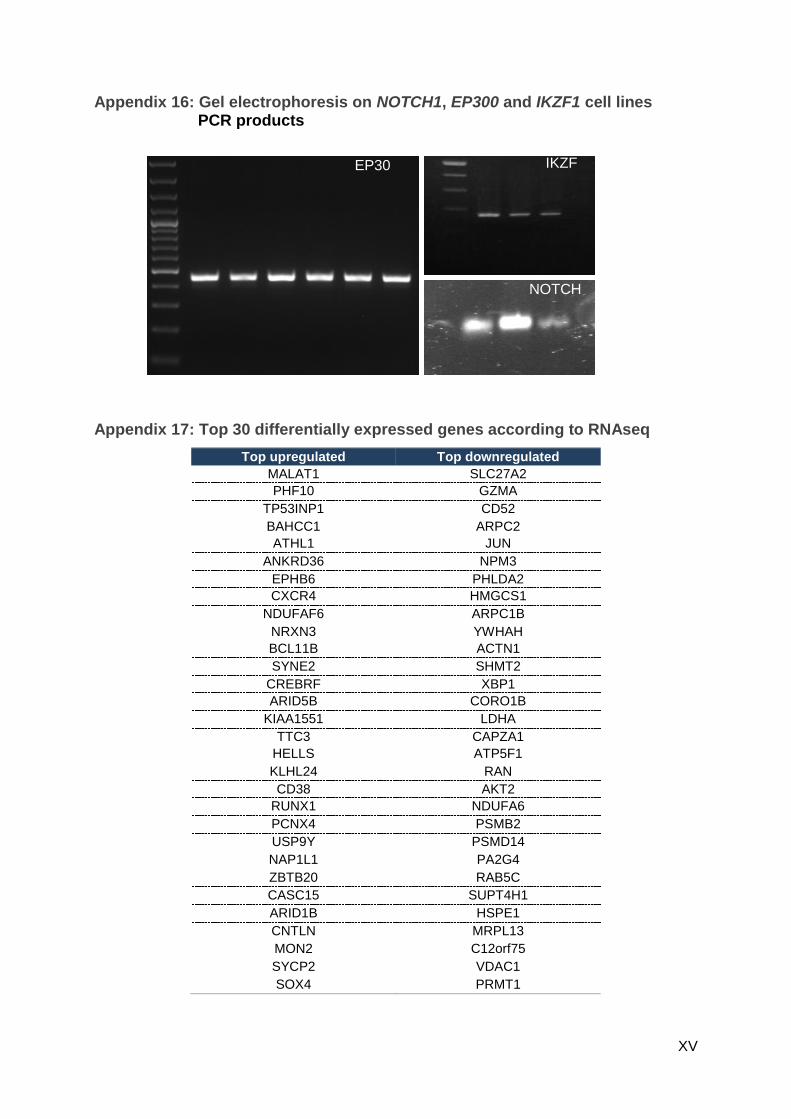
XV
Appendix 16: Gel electrophoresis on NOTCH1, EP300 and IKZF1 cell lines PCR products
Appendix 17: Top 30 differentially expressed genes according to RNAseq
Top upregulated Top downregulated
MALAT1 SLC27A2
PHF10 GZMA
TP53INP1 CD52
BAHCC1 ARPC2
ATHL1 JUN
ANKRD36 NPM3
EPHB6 PHLDA2
CXCR4 HMGCS1
NDUFAF6 ARPC1B
NRXN3 YWHAH
BCL11B ACTN1
SYNE2 SHMT2
CREBRF XBP1
ARID5B CORO1B
KIAA1551 LDHA
TTC3 CAPZA1
HELLS ATP5F1
KLHL24 RAN
CD38 AKT2
RUNX1 NDUFA6
PCNX4 PSMB2
USP9Y PSMD14
NAP1L1 PA2G4
ZBTB20 RAB5C
CASC15 SUPT4H1
ARID1B HSPE1
CNTLN MRPL13
MON2 C12orf75
SYCP2 VDAC1
SOX4 PRMT1
EP30
0
IKZF
1
NOTCH
1

XVI
Appendix 18: qPCR of differentially expressed genes in HSB-2
Appendix 19: qPCR of differentially expressed genes in spleen and bone
marrow
0
0,5
1
PHF10
0
0,5
1
1,5CXCR4
0
0,5
1
1,5MALAT1
0
0,5
1
1,5
BCL11B
0
0,5
1
1,5ZBTB20
0
0,5
1
1,5ARID1B
0
0,5
1
1,5RUNX1
0
0,5
1
1,5
2SYNE2
0
0,5
1
ARID5B
control TP3654
qPCR of upregulated genes. The y-axis represents the gene expression relative to the reference genes.
0
0,5
1
1,5
2
2,5
S5 S6 S7 S8 S9 S4 S10 S11 S15 S16
Vehicle Treated
Rel
ativ
e ex
pre
ssio
n
PIM1
0
1
2
3
4
S5 S6 S7 S8 S9 S4 S10 S11 S15 S16
Vehicle Treated
Rel
ativ
e ex
pre
ssio
n
JUN
qPCR of downregulated genes in spleen samples.

XVII
0
1
2
3
4
S5 S6 S7 S8 S9 S4 S10 S11 S15 S16
Vehicle TreatedRel
ativ
e ex
pre
ssio
n
CXCR4
0
1
2
3
4
S5 S6 S7 S8 S9 S4 S10 S11 S15 S16
Vehicle TreatedRel
ativ
e ex
pre
ssio
nMALAT1
0
1
2
3
S5 S6 S7 S8 S9 S4 S10 S11 S15 S16
Vehicle TreatedRel
ativ
e ex
pre
ssio
n
ARID1B
0
1
2
3
S5 S6 S7 S8 S9 S4 S10 S11 S15 S16
Vehicle TreatedRel
ativ
e ex
pre
ssio
n
ZTBT20
0
1
2
3
4
S5 S6 S7 S8 S9 S4 S10 S11 S15 S16
Vehicle TreatedRel
ativ
e ex
pre
ssio
n
ARID5B
0
0,5
1
1,5
2
S5 S6 S7 S8 S9 S4 S10 S11 S15 S16
Vehicle TreatedRel
ativ
e ex
pre
ssio
n
RUNX1
0
0,5
1
1,5
2
S5 S6 S7 S8 S9 S4 S10 S11 S15 S16
Vehicle TreatedRel
ativ
e ex
pre
ssio
n
BCL11B
0
2
4
6
S5 S6 S7 S8 S9 S4 S10 S11 S15 S16
Vehicle TreatedRel
ativ
e ex
pre
ssio
n
SYNE2
qPCR of upregulated genes in spleen samples.
0
0,5
1
1,5
BM1 BM3 BM15
PIM1
0
2
4
6
BM1 BM3 BM15
GZMA
0
0,5
1
1,5
2
2,5
BM1 BM3 BM15
JUN
0
0,4
0,8
1,2
1,6
BM1 BM3 BM15
RAN
qPCR of downregulated genes in bone marrow samples. The y-axis represents relative expression.
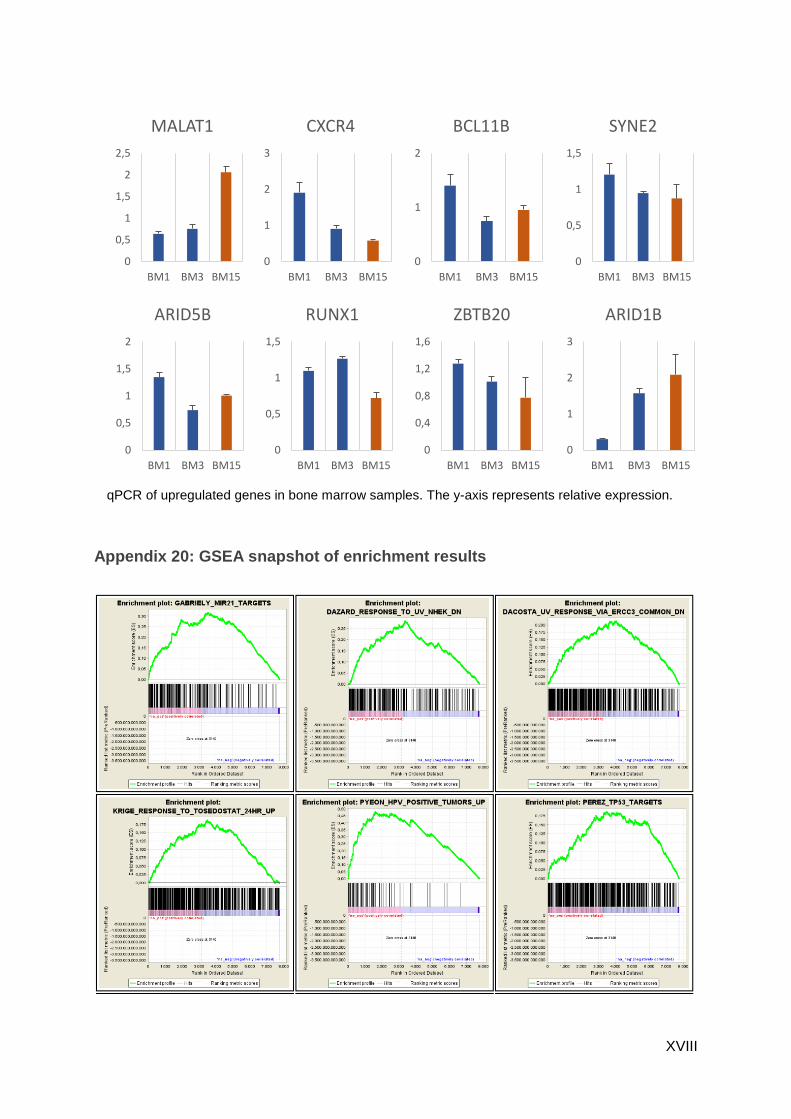
XVIII
Appendix 20: GSEA snapshot of enrichment results
0
1
2
BM1 BM3 BM15
BCL11B
0
1
2
3
BM1 BM3 BM15
CXCR4
0
0,5
1
1,5
2
2,5
BM1 BM3 BM15
MALAT1
0
0,5
1
1,5
BM1 BM3 BM15
SYNE2
0
0,5
1
1,5
2
BM1 BM3 BM15
ARID5B
0
0,5
1
1,5
BM1 BM3 BM15
RUNX1
0
1
2
3
BM1 BM3 BM15
ARID1B
0
0,4
0,8
1,2
1,6
BM1 BM3 BM15
ZBTB20
qPCR of upregulated genes in bone marrow samples. The y-axis represents relative expression.

XIX
Appendix 21: Monotherapy in HSB-2
Treatment of HS2 cell with different compounds in HSB-2 for 72h.
0%
50%
100%
150%
Rel
ativ
e vi
abili
ty
concentration (nM)
Dexamethasone
0%
50%
100%
150%
Rel
ativ
e vi
abili
ty
concentration (nM)
Prednisolone
0%
50%
100%
150%
Rel
ativ
e vi
abili
ty
concentration (nM)
Vincristine
0%
50%
100%
150%
Rel
ativ
e vi
abili
ty
concentration (nM)
TP3654