the role of structural reforms in raising economic … · the role of structural reforms in raising...
TRANSCRIPT
The Role of Structural Reforms in Raising Economic Growth in Central America
Andrew Swiston and Luis-Diego Barrot
WP/11/248
© 2011 International Monetary Fund WP/11/248
IMF Working Paper
Western Hemisphere
The Role of Structural Reforms in Raising Economic Growth in Central America
Prepared by Andrew Swiston and Luis-Diego Barrot
Authorized for distribution by Marco Piñón
October 2011
Abstract
Central America experienced moderate growth during the last decade, including in the years leading up to the global financial crisis, but the rate of convergence toward advanced country income levels has still been slow. Moreover, forecasts imply that these trends will continue. What can be done to spur higher growth in Central America? We bring new data to bear on this question—version 7.0 of the Penn World Table and a new IMF database on structural reforms. Our cross-country panel regression of economic growth using System GMM captures the importance to growth of conditional convergence, factor accumulation, and macro policies. In addition, structural efficiency is a significant factor in explaining growth performance. We construct a broad index of efficiency and find that increasing the degree of structural efficiency by one standard deviation raises growth by ½ percent. This implies that Central American countries could significantly increase their long-run growth rates by increasing the flexibility of markets and improving the quality of regulation.
JEL Classification Numbers: C33, C36, E02, O11, O16, O43, O47
Keywords: Economic growth, Central America, Structural Reform, Financial Reform, Human Capital, Factor Accumulation, System GMM
Authors’ E-Mail Addresses: [email protected], [email protected]
This Working Paper should not be reported as representing the views of the IMF. The views expressed in this Working Paper are those of the author(s) and do not necessarily represent those of the IMF or IMF policy. Working Papers describe research in progress by the author(s) and are published to elicit comments and to further debate.
Contents Page
I. Introduction and Summary ................................................................................................. 3 II. Central America’s Growth Performance Since 1960 .......................................................... 4 III. A Framework to Analyze the Determinants of Economic Growth ..................................... 6 IV. Cross-Country Determinants of Economic Growth ............................................................ 7 A. Structural Reforms Data ............................................................................................... 7 B. Regression Results ........................................................................................................ 9 C. Robustness Checks ...................................................................................................... 11 V. How Central America Could Boost Growth ..................................................................... 13 A. Raise Investment in Physical Capital .......................................................................... 14 B. Raise Investment in Human Capital ........................................................................... 15 C. Engage in Structural Reforms ..................................................................................... 15 VI. Conclusions ....................................................................................................................... 17 References ................................................................................................................................. 19 Figures 1. Economic Growth Around the World ................................................................................. 4 2. Relative Incomes Around the World .................................................................................. 4 3. Economic Growth in Central America ............................................................................... 5 4. Economic Growth in Central America ............................................................................... 5 5. Central America: Growth Forecasts .................................................................................... 5 6. Structural Efficiency: Broad Index ..................................................................................... 9 7. Central America and Comparators: Investment-to-GDP Ratios ....................................... 14 8. Central America: Effect on Growth from Raising Investment ......................................... 14 9. Central America and Comparators: Years of Advanced Education ................................. 15 10. Central America: Effect on Growth from Raising Advanced Education ......................... 15 11. Central America and Comparators: Broad Structural Index ............................................. 16 12. Central America and Comparators: Domestic Financial System Index ........................... 16 13. Central America and Comparators: External Index .......................................................... 16 14. Central America and Comparators: Product Markets Index ............................................. 16 15. Central America: Effect on Growth from Structural Reforms .......................................... 16 Tables 1. The Impact of Structural Reforms on Growth: Broad Indexes ......................................... 10 2. The Impact of Structural Reforms on Growth: Components ............................................ 12 Appendix Tables A.1. Countries Included in the Analysis ................................................................................... 21 A.2. Data Sources ..................................................................................................................... 21
3
I. INTRODUCTION AND SUMMARY
This paper investigates reforms that Central American countries could undertake to improve their medium- to long-run economic growth.1 The region has grown in recent decades, but at lower rates than in key comparator countries. Furthermore, at the growth rates expected in upcoming years, the region would make only modest strides towards narrowing the gap with more developed countries. Given these facts, an examination of the drivers of growth would be useful to identify possible policy measures to raise growth above historical performance.
The aim of this paper is to construct a model that captures the key factors that influence growth and identify the areas in which reforms in Central American countries could concentrate. This model takes advantage of two untapped data sources: the first is a broad database on structural efficiency put together within the IMF and the second is the latest revision of the Penn World Table (PWT), Version 7.0, which extends through 2009 and was released in April 2011 (Heston and others, 2011). The econometric technique employed, System GMM, is used frequently in empirical studies on growth, as it addresses some of the complexities raised in estimating growth models across a panel of countries.
Our cross-country growth model arrives at the standard result that the accumulation of the factors of production—physical and human capital—is fundamental for growth. Increasing the investment-to-GDP ratio by 5 percentage points (slightly less than one standard deviation) raises growth by 0.6 percent, while increasing advanced educational attainment by one year raises growth by 0.3 percent.
In addition to these results, a key finding is that sound structural policies play an important role in economic growth. A broad index of structural efficiency has a strong and statistically significant impact on economic growth. The equations estimated here imply that engaging in reforms that would raise this index by one standard deviation (7 points on a 100 point scale) would raise a country’s annual growth rate by ½ percent per year. The aggregate index has a stronger and more significant coefficient than its subcomponents, suggesting that the growth benefits of structural reforms are maximized by engaging in complementary reforms across several areas. Nevertheless, the effects appear to be particularly strong for reforms to the domestic financial system and for external transactions. Within the domestic financial system, sound bank supervision frameworks and well-developed securities markets are found to have the largest impact on raising growth. These results on the importance of structural efficiency could be followed up with more work to understand the channels by which reforms in these areas affect economic growth.
1 This note uses the term Central America to refer to the group of countries comprising Costa Rica, the Dominican Republic, El Salvador, Guatemala, Honduras, Nicaragua, and Panama.
4
The above results suggest that Central America could significantly boost growth by raising these growth determinants to the levels of comparator countries. A comparison to other countries in Latin America that have successful structural reform records—Chile, Mexico, and Peru—implies that, depending on their current degree of efficiency, the economies in the region could raise their growth rates by ½ to 2½ percent through structural reforms, especially by developing their financial systems. Several countries could also attain a significantly higher growth rate by increasing their investment in physical and human capital. Given the deep-seated nature of these reforms, they would all require sustained efforts over a prolonged period of time.
The rest of this paper describes Central America’s historical growth performance (Section II), lays out the model used to estimate the determinants of growth across countries (Section III), gives the empirical results (Section IV), and offers some indicative magnitudes for the potential boost to growth in Central America if the key growth determinants were raised to the levels of successful comparator countries (Section V). Section VI concludes.
II. CENTRAL AMERICA’S GROWTH PERFORMANCE SINCE 1960
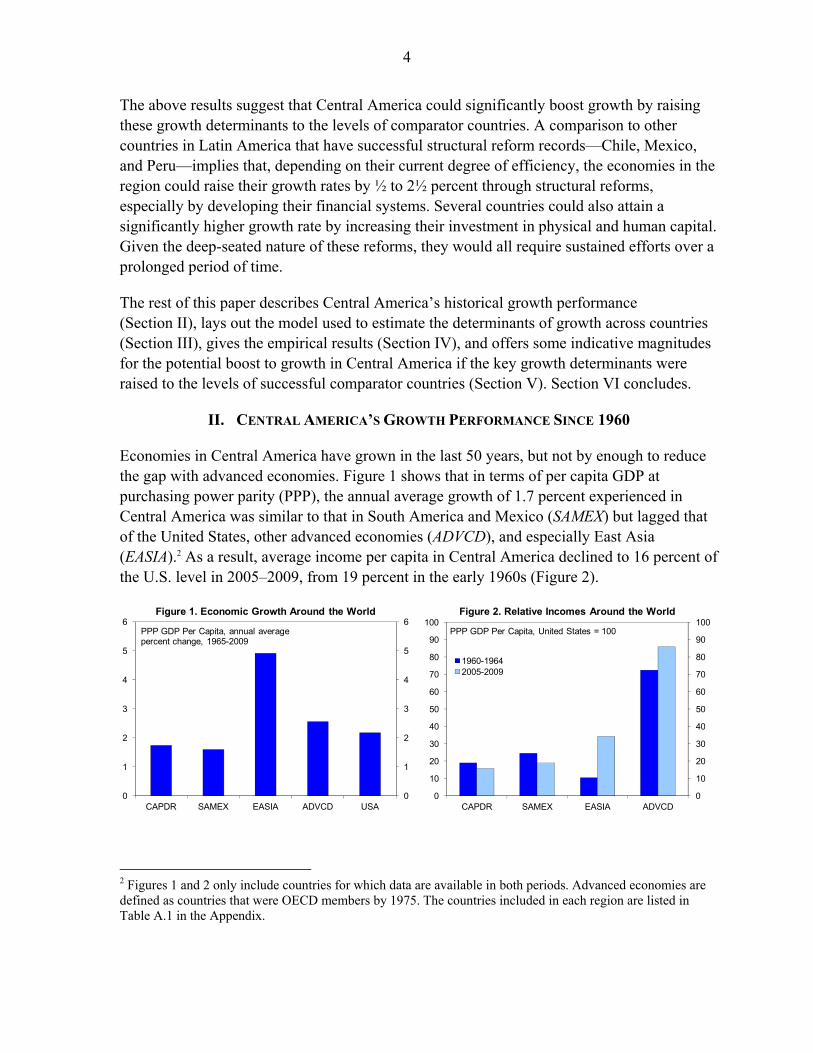
Economies in Central America have grown in the last 50 years, but not by enough to reduce the gap with advanced economies. Figure 1 shows that in terms of per capita GDP at purchasing power parity (PPP), the annual average growth of 1.7 percent experienced in Central America was similar to that in South America and Mexico (SAMEX) but lagged that of the United States, other advanced economies (ADVCD), and especially East Asia (EASIA).2 As a result, average income per capita in Central America declined to 16 percent of the U.S. level in 2005–2009, from 19 percent in the early 1960s (Figure 2).
2 Figures 1 and 2 only include countries for which data are available in both periods. Advanced economies are defined as countries that were OECD members by 1975. The countries included in each region are listed in Table A.1 in the Appendix.
0
1
2
3
4
5
6
0
1
2
3
4
5
6
CAPDR SAMEX EASIA ADVCD USA
Figure 1. Economic Growth Around the World
PPP GDP Per Capita, annual average percent change, 1965-2009
0
10
20
30
40
50
60
70
80
90
100
0
10
20
30
40
50
60
70
80
90
100
CAPDR SAMEX EASIA ADVCD
1960-19642005-2009
Figure 2. Relative Incomes Around the World
PPP GDP Per Capita, United States = 100
5
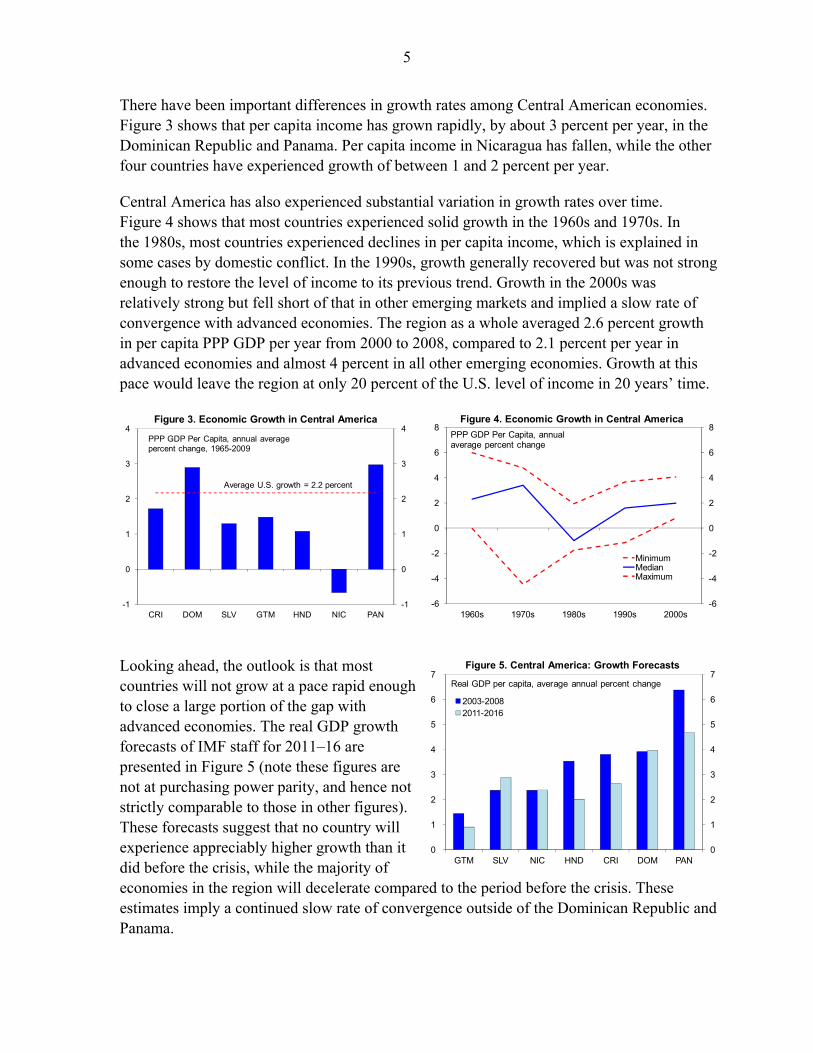
There have been important differences in growth rates among Central American economies. Figure 3 shows that per capita income has grown rapidly, by about 3 percent per year, in the Dominican Republic and Panama. Per capita income in Nicaragua has fallen, while the other four countries have experienced growth of between 1 and 2 percent per year.
Central America has also experienced substantial variation in growth rates over time. Figure 4 shows that most countries experienced solid growth in the 1960s and 1970s. In the 1980s, most countries experienced declines in per capita income, which is explained in some cases by domestic conflict. In the 1990s, growth generally recovered but was not strong enough to restore the level of income to its previous trend. Growth in the 2000s was relatively strong but fell short of that in other emerging markets and implied a slow rate of convergence with advanced economies. The region as a whole averaged 2.6 percent growth in per capita PPP GDP per year from 2000 to 2008, compared to 2.1 percent per year in advanced economies and almost 4 percent in all other emerging economies. Growth at this pace would leave the region at only 20 percent of the U.S. level of income in 20 years’ time.
Looking ahead, the outlook is that most countries will not grow at a pace rapid enough to close a large portion of the gap with advanced economies. The real GDP growth forecasts of IMF staff for 2011–16 are presented in Figure 5 (note these figures are not at purchasing power parity, and hence not strictly comparable to those in other figures). These forecasts suggest that no country will experience appreciably higher growth than it did before the crisis, while the majority of economies in the region will decelerate compared to the period before the crisis. These estimates imply a continued slow rate of convergence outside of the Dominican Republic and Panama.
-1
0
1
2
3
4
-1
0
1
2
3
4
CRI DOM SLV GTM HND NIC PAN
Figure 3. Economic Growth in Central America
PPP GDP Per Capita, annual average percent change, 1965-2009
Average U.S. growth = 2.2 percent
-6
-4
-2
0
2
4
6
8
-6
-4
-2
0
2
4
6
8
1960s 1970s 1980s 1990s 2000s
MinimumMedianMaximum
Figure 4. Economic Growth in Central America
PPP GDP Per Capita, annual average percent change
0
1
2
3
4
5
6
7
0
1
2
3
4
5
6
7
GTM SLV NIC HND CRI DOM PAN
2003-20082011-2016
Figure 5. Central America: Growth Forecasts
Real GDP per capita, average annual percent change
6
III. A FRAMEWORK TO ANALYZE THE DETERMINANTS OF ECONOMIC GROWTH
Understanding what drives economic growth across countries is vital in order to explain Central America’s relatively low growth rate and offer recommendations for policies to raise growth. Growth models need to take into account a number of econometric challenges (see Durlauf and others, 2005, for a comprehensive review), especially the simultaneous determination of both the level of income and other variables thought to influence growth, the long lags between changes in the determinants of growth and their full impact on income, and observed heterogeneity across countries.
To address these issues, this paper employs System GMM, a dynamic panel data technique that has been used widely in the empirical growth literature over the last decade. The model was developed by Arellano and Bond (1991), Arellano and Bover (1995), and Blundell and Bond (1998), in large part to address the econometric issues typical in the analysis of economic growth across countries. Roodman (2009a) discusses the strengths and weaknesses of System GMM. Empirical applications to cross-country growth include Aisen and Veiga (2011), Chang and others (2009), and Kumar and Woo (2010).
System GMM uses fixed effects—a dummy for each country—to capture idiosyncratic features of a country that do not vary over time. It addresses the endogeneity of the regressors by instrumenting them with their own lagged values. This is implemented with a system of two equations, one in differences with the lagged explanatory variables in levels as instruments, and the other in levels with the lagged explanatory variables in differences as instruments. The regressions in this paper use collapsed instruments with only the first acceptable lag as the instrument, in line with the findings in Roodman (2009a, 2009b) and Mehrhoff (2009) that these settings minimize bias and endogeneity concerns. Consider a model in which a country’s income yit in a given period is determined by its own lagged value and a vector of control variables x:
, (1)
Subtracting lagged income, yi,t-1, from both sides, the growth rate is simply modeled as:
∆ , 1 (2)
Recognizing that there may be factors not observed by the model that are heterogeneous across countries but not varying over time, the error term becomes:
(3)
where μi is the fixed effect and νit is the idiosyncratic disturbance that can differ across countries and periods. The vector of control variables includes time dummies for each period in order to control for factors that affect growth across countries, such as the global business cycle. To reduce the role of dynamics in the results, the regressions are run on data averaged across five-year periods, as is typical in the literature. The key diagnostic tests are for
7
second-order autocorrelation of the residuals in differences (which implies first-order autocorrelation of the residuals in levels) and the Hansen test for exogeneity of the instruments; rejection of the null would indicate a specification problem, while Roodman (2009a, 2009b) suggests that even a p-value on the Hansen test of 0.2 can indicate problems with endogeneity of the instrument set.
IV. CROSS-COUNTRY DETERMINANTS OF ECONOMIC GROWTH
We assembled a broad, cross-country dataset on income per capita and its determinants, spanning from 1960 (or earlier) to 2009. In considering the variables to be included in (2), we proceed from a specification of the Solow growth accounting framework assuming a Cobb-Douglas production function:
(4)
where Yit (aggregate income) is determined by the various factors of production—Ait (total factor productivity), Kit (the capital stock), and Hit (labor inputs) where Hit = hitLit, with hit representing human capital per worker and Lit the labor force.
The growth regressions attempt to capture the effects of changes in physical capital by including the ratio of investment to GDP as a proxy for the change in the capital stock. Inputs of human capital are measured by two variables: the share of the population that is of working age,3 and the average years of advanced schooling (schooling beyond the primary years) of the working-age population.4 None of these indicators capture the quality of physical or human capital, as no panel of data broad enough to be able to include in the analysis was found, and this remains an area for further research. The database also contains other variables typically thought to affect growth—including standard indicators of the soundness of macroeconomic policy, measures of political stability, and other institutional features. These variables could affect growth through enhancing total factor productivity or by facilitating the accumulation of the above factors of production, although in the latter case colinearity with the data on physical and human capital could hamper inference.
A. Structural Reforms Data
This study augments the analysis of the traditional determinants of growth by including in the database indexes quantifying various aspects of structural efficiency. This dataset—although not aggregated into the broad index used here—was constructed by the IMF and analyzed in a cross-country growth context (mostly using techniques other than System GMM) by
3 The level of employment would preferably be used instead of the working-age share of the population, but this would significantly restrict the sample of available data.
4 This variable, which is the sum of secondary and tertiary schooling, performed better in regressions than total or primary schooling.
8
Spilimbergo and others (2009), Christiansen and others (2009), and Prati and others (2010). The structural indexes used in this paper cover three broad areas: 5
Financial system: This index encompasses various factors, including the degree of controls on the allocation of credit; ceilings or other controls on interest rates; entry barriers and other restrictions on competition; the quality of bank supervision frameworks and prudential regulation; and policies that facilitate the development or efficient operation of domestic securities markets.6
External transactions: This index covers average tariffs on international trade and restrictions on current account and capital account transactions.
Product markets: This index captures the degree of flexibility of agriculture, electricity, and telecommunications industries.
This dataset represents a significant expansion of information on the quality of structural policies across countries, time, and sectors of the economy, which implies that it could potentially lead to a greater understanding of the role of structural reforms in economic growth. Naturally, the use of this dataset comes with some caveats. These series translate qualitative features of an economy into quantitative indexes suitable for regression analysis, which naturally involves an element of imprecision, but the creators of the dataset made substantial efforts to maintain cross-country comparability. In addition, while this handful of indicators does not fully represent all the complexities of an economy, they may capture important aspects that could have a bearing on growth.
All of the indexes and subcomponents are constructed on a scale from 0 to 100, with a higher value indicating greater structural efficiency and expected to have a positive relationship with growth. These three indexes are also averaged with equal weights into a broad index of structural efficiency. There are 79 countries—including all Central American countries except Panama—covered by the PWT since 1980 and for which all the structural efficiency data are available,7 and the regressions that follow focus on this group and subsets of it.8
5 The structural efficiency data has been described in detail in Spilimbergo and others (2009) and Abiad and others (2010). The structural indexes generally begin after 1960, so the series are extended back by setting values for periods where data do not exist equal to the value in the first period for which data is available. Similarly, the indexes generally end before 2009, so the value for the 2005–09 periods is an average over the years for which data is available.
6 Spilimbergo and others (2009) note that the indexes do not solely capture liberalization, in that components like banking supervision measure the degree to which phenomenon like market failures are addressed. The unifying theme is the efficient allocation of resources; hence, the use of the term efficiency in this paper.
7 Countries included in the analysis are shown with an asterisk in Table A.1 in the Appendix. Panama is not included because the structural reforms database covers its external transactions but not financial sector or product market reforms, and no close proxy for these was found.
9
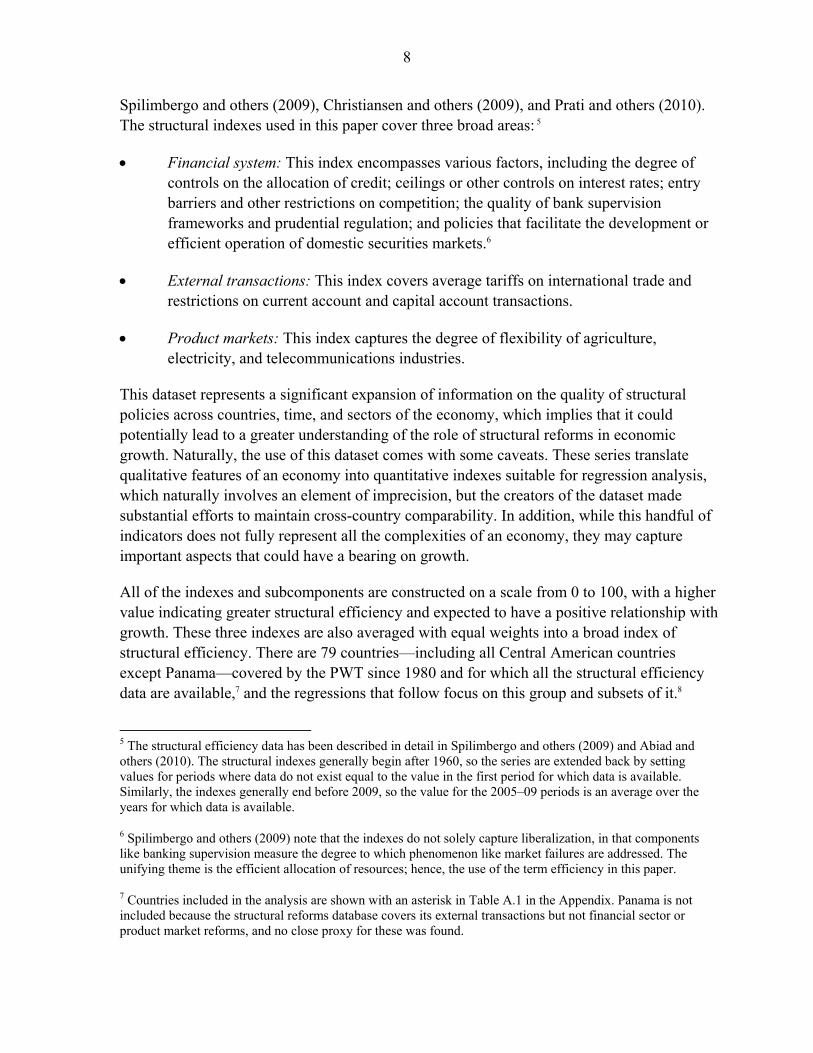
The broad cross-country trend is for greater efficiency in the areas covered by these indexes. Figure 6 shows a rising trend in all regions, although the timing and magnitude of reform has varied. Advanced economies reformed at a moderate pace from the late 1970s until about 2000, when the pace of reform slowed. Reform in Central America was slow until the late 1980s, when the pace accelerated significantly. This mirrored trends in South America and Mexico. It should be noted that while the gap has narrowed, the countries of Central America remain less flexible than the advanced economies and fast-growing countries like Hong Kong SAR, Korea, Singapore, and Taiwan P.o.C. (TIGERS).
B. Regression Results
Regression results confirm that factor accumulation—both in terms of physical and human capital—is important for growth. Armed with the data described above and employing System GMM, Table 1 shows the results of several regressions including both the structural indexes and the standard control variables described above. An increase in the investment-to-GDP ratio of 5 percentage points (slightly less than one standard deviation) is estimated to raise growth by 0.6 percent, while an increase of one year (close to the sample median change over 20 years) in the advanced educational attainment of the working population is estimated to raise growth by 0.3 percent.
This specification also controls for the effects of a country’s initial income as well as for its demographic and macroeconomic conditions. Conditional convergence holds—the fact that countries with lower income, holding everything else constant, are expected to grow faster—as the coefficient on the lagged level of income is negative and significant. Macroeconomic stability, as (negatively) proxied by the rate of inflation, and the ratio of the working-age population to the total population are also found to be significant.
8 The aggregate financial system indexes for Honduras and Trinidad and Tobago were constructed from indexes calculated by Lora (2001) and Escaith and Paunovic (2004). These indexes contain series that are similar to the subcomponents of the aggregate index used here, but differences in definition prevented the construction of the subcomponents in this index.
0
10
20
30
40
50
60
70
80
90
100
0
10
20
30
40
50
60
70
80
90
100
1960-64 1970-74 1980-84 1990-94 2000-04
CAPDRSAMEXADVCDTIGERS
Figure 6. Structural Efficiency: Broad Index
10
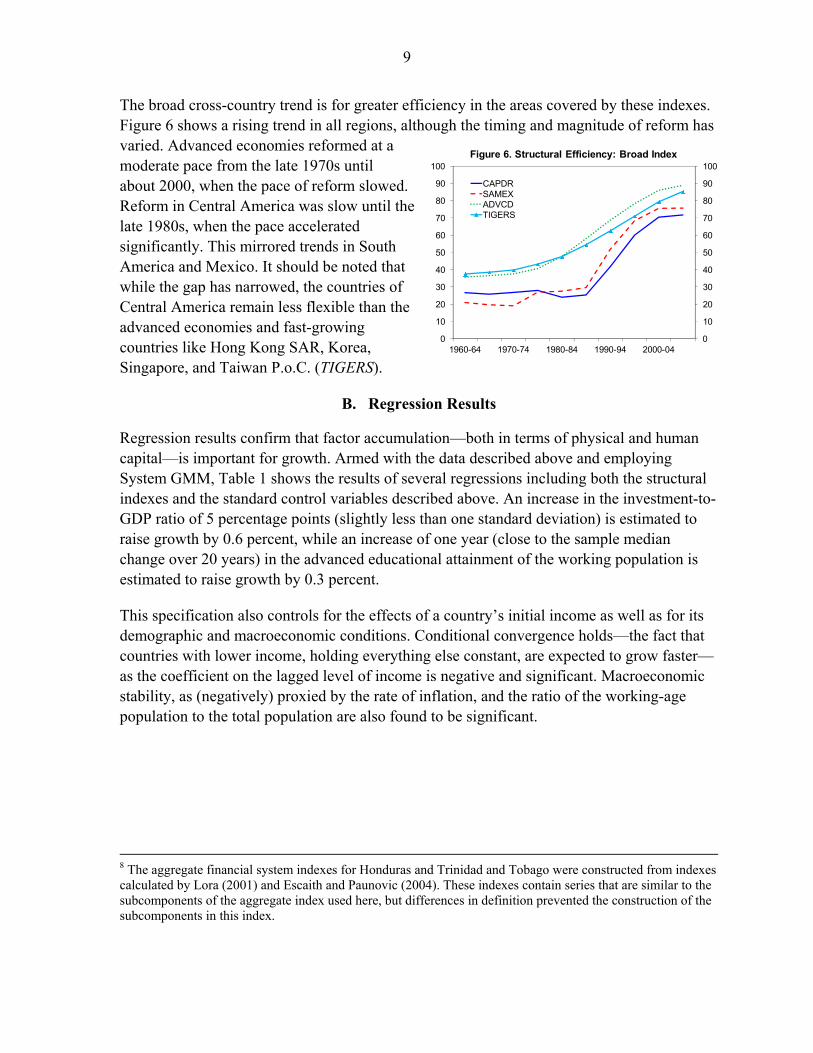
In addition to these results, the regressions indicate that structural efficiency has a positive impact on the rate of economic growth. The broad structural index is strongly significant—a one standard deviation increase (7 points on the 100 point scale) raises growth by ½ percent (Table 1, column 1). The financial, external, and product markets indexes are also statistically significant, and sometimes strongly so (columns 2–4). The coefficients on these sectoral indexes are lower than for the broad index, likely because reforms tend to be correlated across sectors. This is confirmed by the results of the regression in column 5, where each of the sectoral indexes enters positively and insignificantly, but an F-test shows that the three regressors are jointly significant at the one percent level. This could be
(1) (2) (3) (4) (5)
Broad structural index 6.199***[2.928]
Financial system index 3.542*** 2.228[2.751] [1.436]
External transactions index 4.195** 1.702[2.336] [1.455]
Product markets index 2.254* 2.817[1.955] [1.350]
Lagged income -1.537*** -1.139*** -1.355*** -1.140*** -1.504*** (log of PPP GDP per capita) [-3.258] [-2.783] [-2.994] [-2.751] [-3.184]Capital formation 3.270*** 3.061*** 3.289*** 3.169*** 3.214*** (log of investment to GDP) [4.137] [4.069] [4.288] [4.513] [3.896]Human capital 1.166** 0.928* 0.995* 1.203** 1.024** (log of advanced schooling) [2.227] [1.858] [1.990] [2.590] [2.011]Inflation -2.255* -2.737** -2.230* -2.124* -2.323** (log of 1 plus inflation rate) [-1.726] [-2.217] [-1.962] [-1.727] [-2.069]Labor force 0.724*** 0.682*** 0.682*** 0.618*** 0.750*** (as share of population, log) [5.746] [6.314] [5.685] [5.355] [6.255]Constant 1.139 -0.419 -0.636 -0.0374 0.536
[0.218] [-0.0866] [-0.122] [-0.00831] [0.102]
Observations 757 757 757 757 757Number of countries 79 79 79 79 79Number of instruments 22 22 22 22 26Hansen test p-value 0.197 0.294 0.529 0.414 0.385AR(2) test p-value 0.293 0.216 0.260 0.285 0.277F-test p-value (joint significance of reform indexes) 0.006***
Table 1. The Impact of Structural Reforms on Growth: Broad Indexes
Dependent variable: growth in PPP GDP per capita
Notes: The regressions are run on data from 1960-2009 in non-overlapping five-year periods. Timedummies for each period are included but not shown. T-statistics based on Windmeijer (2005) robust standard errors are in brackets. Variables significant at the 1 percent level are denoted by threeasterisks, those at the 5 percent level by two asterisks and those at the 10 percent level by one asterisk.
11
consistent with the hypothesis that reforms across a broad range of sectors are better-suited to raise growth than piecemeal reforms.
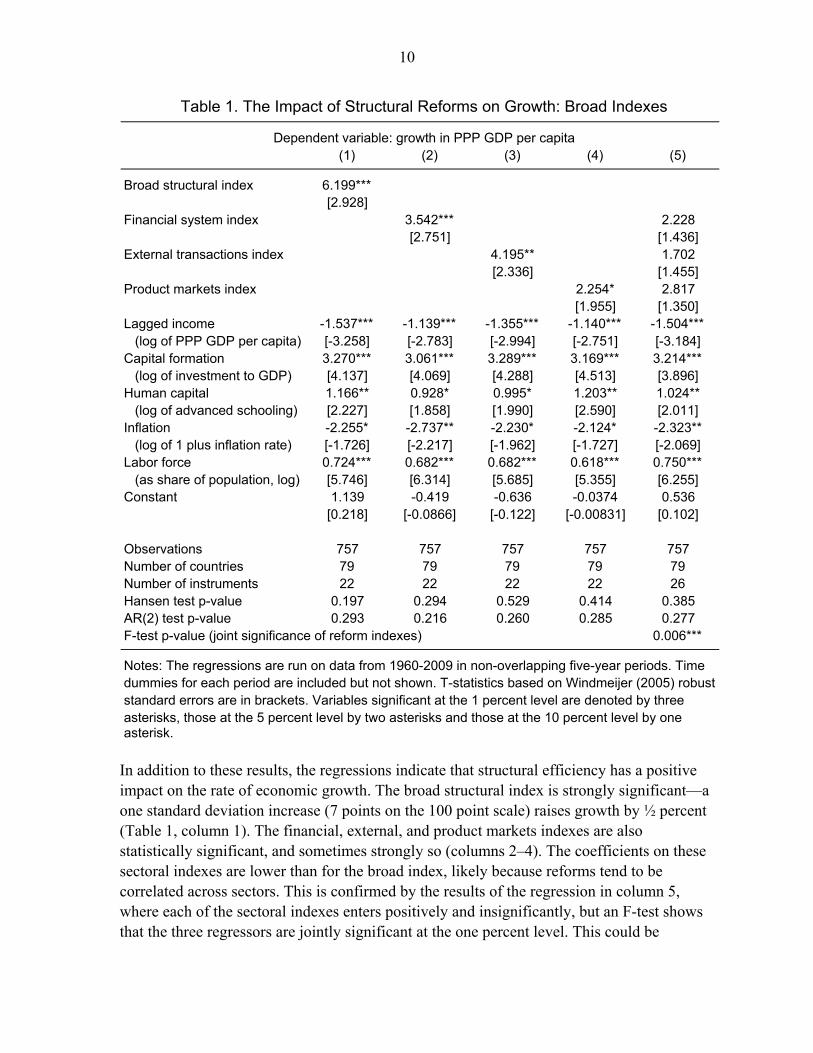
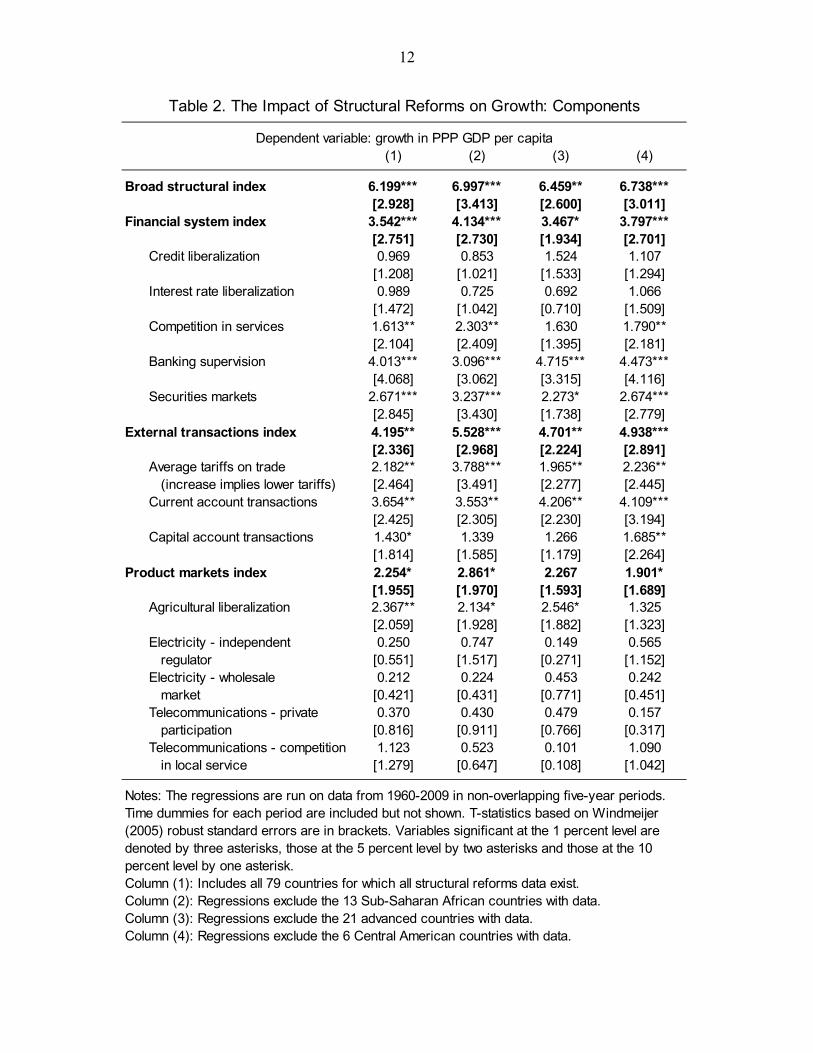
To examine the relative impact of specific reforms, the detailed subcomponents of the sectoral indexes were included in regressions one at a time. The coefficients and T-statistics for these regressions are displayed in the first column of Table 2, with results for the broad structural index and the sectoral indexes shown for sake of comparison. As in Table 1, the pattern is that regressions on narrower indexes are estimated to have smaller effects and are less precisely estimated than the broader indexes into which they were aggregated.
Both the financial system index and some subcomponents are significantly associated with growth. The most important subcomponent is banking supervision, consistent with the results in Reinhart and Rogoff (2009) and Laeven and Valencia (2008) on the negative effects of banking crises on growth. Policies to facilitate the operation of securities markets and the degree of competition in services are also strongly significant.
The external transactions index is also found to be important for growth. The external index and its subcomponents related to average tariffs and the liberalization of current account transactions are significant, while liberalization of capital account transactions is only marginally significant in the base specification. Reforms of product markets, in particular agriculture, are associated with marginally higher growth, while the model is unable to distinguish which reforms matter in the electricity and telecommunications industries.
C. Robustness Checks
Alternative estimates excluding various country groups suggest that the significant effects of structural efficiency on growth are independent of geographic or income-related factors. The first column in Table 2 is compared with the second through fourth columns, which exclude, in respective order, Sub-Saharan Africa, advanced countries (defined as countries that were OECD members by 1975), and Central American countries.9 The estimated coefficients are consistent across these subsamples, especially for the broad structural index, the financial system index, and the external transactions index, while the product markets index loses significance when the OECD members are excluded. Excluding both the OECD and Sub-Saharan African countries simultaneously (results not shown here) gives very similar results, suggesting that these findings are very applicable to the type of country in Central America’s income range. Overall, excluding half the countries in the sample at one time or another does not affect the results.
9 Running regressions including only one region at a time is not feasible given the degrees of freedom in the sample and the computational demands of System GMM, which requires a large cross-sectional dimension.
12
(1) (2) (3) (4)
Broad structural index 6.199*** 6.997*** 6.459** 6.738***[2.928] [3.413] [2.600] [3.011]
Financial system index 3.542*** 4.134*** 3.467* 3.797***[2.751] [2.730] [1.934] [2.701]
Credit liberalization 0.969 0.853 1.524 1.107[1.208] [1.021] [1.533] [1.294]
Interest rate liberalization 0.989 0.725 0.692 1.066[1.472] [1.042] [0.710] [1.509]
Competition in services 1.613** 2.303** 1.630 1.790**[2.104] [2.409] [1.395] [2.181]
Banking supervision 4.013*** 3.096*** 4.715*** 4.473***[4.068] [3.062] [3.315] [4.116]
Securities markets 2.671*** 3.237*** 2.273* 2.674***[2.845] [3.430] [1.738] [2.779]
External transactions index 4.195** 5.528*** 4.701** 4.938***[2.336] [2.968] [2.224] [2.891]
Average tariffs on trade 2.182** 3.788*** 1.965** 2.236**(increase implies lower tariffs) [2.464] [3.491] [2.277] [2.445]
Current account transactions 3.654** 3.553** 4.206** 4.109***[2.425] [2.305] [2.230] [3.194]
Capital account transactions 1.430* 1.339 1.266 1.685**[1.814] [1.585] [1.179] [2.264]
Product markets index 2.254* 2.861* 2.267 1.901*[1.955] [1.970] [1.593] [1.689]
Agricultural liberalization 2.367** 2.134* 2.546* 1.325[2.059] [1.928] [1.882] [1.323]
Electricity - independent 0.250 0.747 0.149 0.565regulator [0.551] [1.517] [0.271] [1.152]
Electricity - wholesale 0.212 0.224 0.453 0.242market [0.421] [0.431] [0.771] [0.451]
Telecommunications - private 0.370 0.430 0.479 0.157participation [0.816] [0.911] [0.766] [0.317]
Telecommunications - competition 1.123 0.523 0.101 1.090in local service [1.279] [0.647] [0.108] [1.042]
Column (4): Regressions exclude the 6 Central American countries with data.
Table 2. The Impact of Structural Reforms on Growth: Components
Dependent variable: growth in PPP GDP per capita
Notes: The regressions are run on data from 1960-2009 in non-overlapping five-year periods. Time dummies for each period are included but not shown. T-statistics based on Windmeijer (2005) robust standard errors are in brackets. Variables significant at the 1 percent level are denoted by three asterisks, those at the 5 percent level by two asterisks and those at the 10 percent level by one asterisk.Column (1): Includes all 79 countries for which all structural reforms data exist.Column (2): Regressions exclude the 13 Sub-Saharan African countries with data.Column (3): Regressions exclude the 21 advanced countries with data.
13
Further robustness checks whose results are not shown here confirm this model’s applicability to Central America.
Regional dummies, which in some studies have been found to be important drivers of long-term growth (for example, Sala-i-Martin and others, 2004) were not found to be significant or alter the significance of the structural indexes.
Interactions of the explanatory variables with dummies for Central America were also not significant. No interactions with the structural indexes are significant, suggesting that in Central America the impact of structural reforms on growth has been similar to the cross-country experience. Interactions of the Central America dummy with investment and human capital were also not significant. The significance of the structural indexes does not change in the specifications where other variables are interacted with the regional dummy, further confirming their robustness.
Summarizing the findings of this section, the model estimated here finds that reforms to make the economy more flexible and improve the quality of regulation can be an important factor to foster economic growth. In addition to the factors typically associated with higher growth—conditional convergence, factor accumulation, and macroeconomic stability—the model finds that indexes of structural flexibility have a positive impact. These findings hold across regions and income groups, and apply well to Central America in particular. Broader measures of structural efficiency perform better, suggesting that advancing on multiple fronts may help to maximize the growth impact of reforms. Reforms to promote domestic financial intermediation and bolster financial sector soundness, along with trade and current account liberalization, appear to be the most potent measures for boosting long-term growth.
V. HOW CENTRAL AMERICA COULD BOOST GROWTH
This section provides estimates of the potential increase to growth in Central America of catching up to comparator countries in key growth determinants. The results of the previous section are applied in a comparison of Central America with Chile, Mexico, and Peru (referred to hereafter as LA-3), three Latin American countries with a successful track record in structural reforms and solid historical growth performance.
For each determinant of growth, the gap between each Central American country and the LA-3 is calculated. This gap is then multiplied by the coefficient on that variable estimated in the previous section. This provides an indication of the potential increase in the long-run growth rate that could be attained in a given Central American economy if that determinant of growth were raised to the level of the LA-3. For country i the impulse to growth from variable j, gij, is expressed as:
(5)

14
where jl is the value for the LA-3 of the variable under analysis.10 This exercise abstracts from some key issues. For example, some of these changes represent profound reforms and could take years to implement. In addition, for some variables quality is crucial, such as investment in physical or human capital, but this is not taken into account here due to lack of available indicators. Nevertheless, the purpose is to provide an illustrative magnitude for potential outcomes that could be realized over time in order to highlight areas that could be reformed, and not to obtain a point estimate that would result from application of a specific policy package.
A. Raise Investment in Physical Capital
Given their current rates of investment, El Salvador, the Dominican Republic, and Guatemala would stand to gain the most by boosting levels to those of comparator countries. Figure 7 shows the average investment-to-GDP ratios for 2005–09 for each Central American country and the LA-3. Figure 8 displays the growth impact, calculated as in equation (5), assuming that Central American countries raise investment-to-GDP to the LA-3 average or maintain it at the current level if already higher than the LA-3. El Salvador had the lowest investment ratio, at 15 percent of GDP, and thus could hypothetically raise growth the most by raising investment—in this case, by between 1½ and 2 percent. The estimated potential effect on growth from raising investment in the Dominican Republic and Guatemala is over 1 percent, while it is lower in Costa Rica and Panama.11 Honduras and Nicaragua boast higher investment ratios than the LA-3, although in these countries there also may be issues of quality and valuation in the national accounts.
10 Natural logs of variables are taken in accordance with the regression specification (see Table 1).
11 The investment-to-GDP ratio in Panama has risen substantially since 2008, associated in large part with the expansion of the Panama Canal. Thus, the 2005–09 average may overstate the potential to raise growth through higher investment.
0
5
10
15
20
25
30
35
0
5
10
15
20
25
30
35
SLV DOM GTM PAN CRI LA-3 HND NIC
Figure 7. Central America and Comparators: Investment-to-GDP Ratios
Average, 2005-2009
0.0
0.5
1.0
1.5
2.0
0.0
0.5
1.0
1.5
2.0
SLV DOM GTM PAN CRI HND NIC
Figure 8. Central America: Effect on Growth from Raising Investment

15
B. Raise Investment in Human Capital
Guatemala has the most space to raise growth through human capital investment. The average working-age adult in Guatemala had less than one year of advanced schooling (schooling beyond the primary level) in 2005–09, 0.7 years behind El Salvador, the next closest country (Figure 9). By contrast, Panama’s average of 3.9 years of advanced schooling was ahead of the LA-3. This is due in part to an increase of 1.2 years since 1990, twice as much as the average increase over that period in the rest of Central America. Figure 10 shows that the estimated effect on growth in Guatemala of raising educational attainment to the level of its comparators is over 1½ percent, with El Salvador the next highest at nearly 1 percent. These are significant gains, but would require a widespread and sustained investment in human capital, given that the effects would only accumulate as better-educated new workers enter the labor force and eventually comprise an increasing share over time.
C. Engage in Structural Reforms
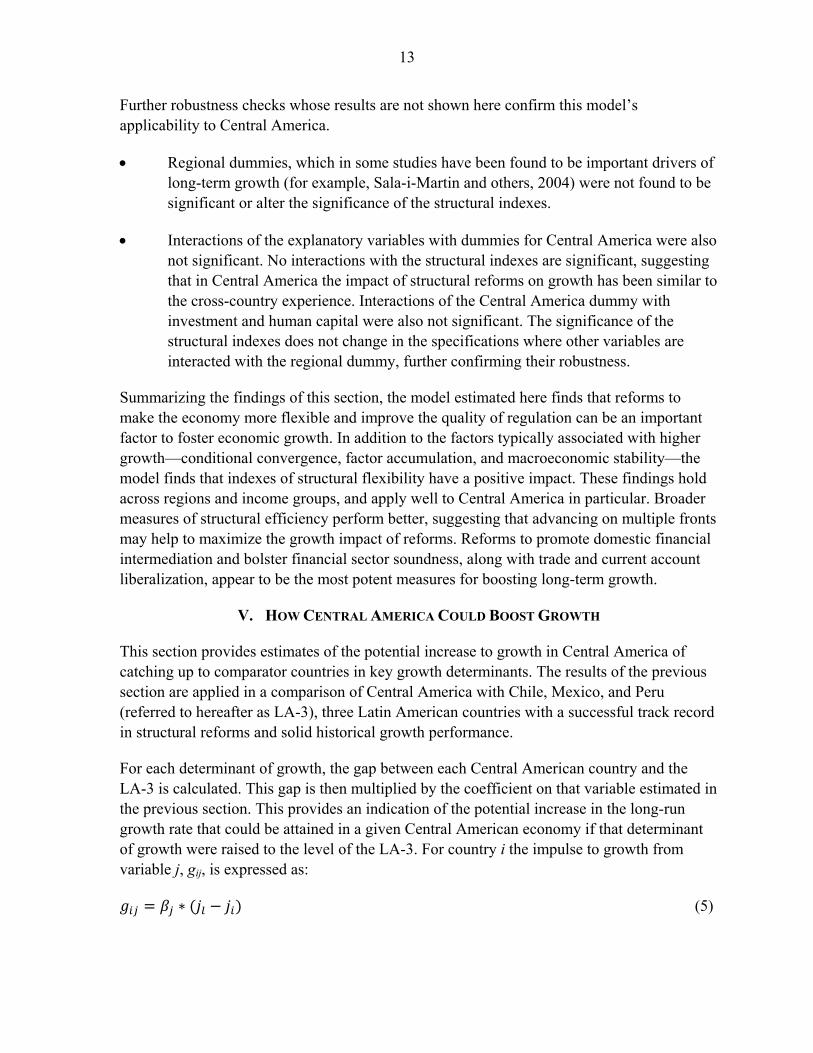
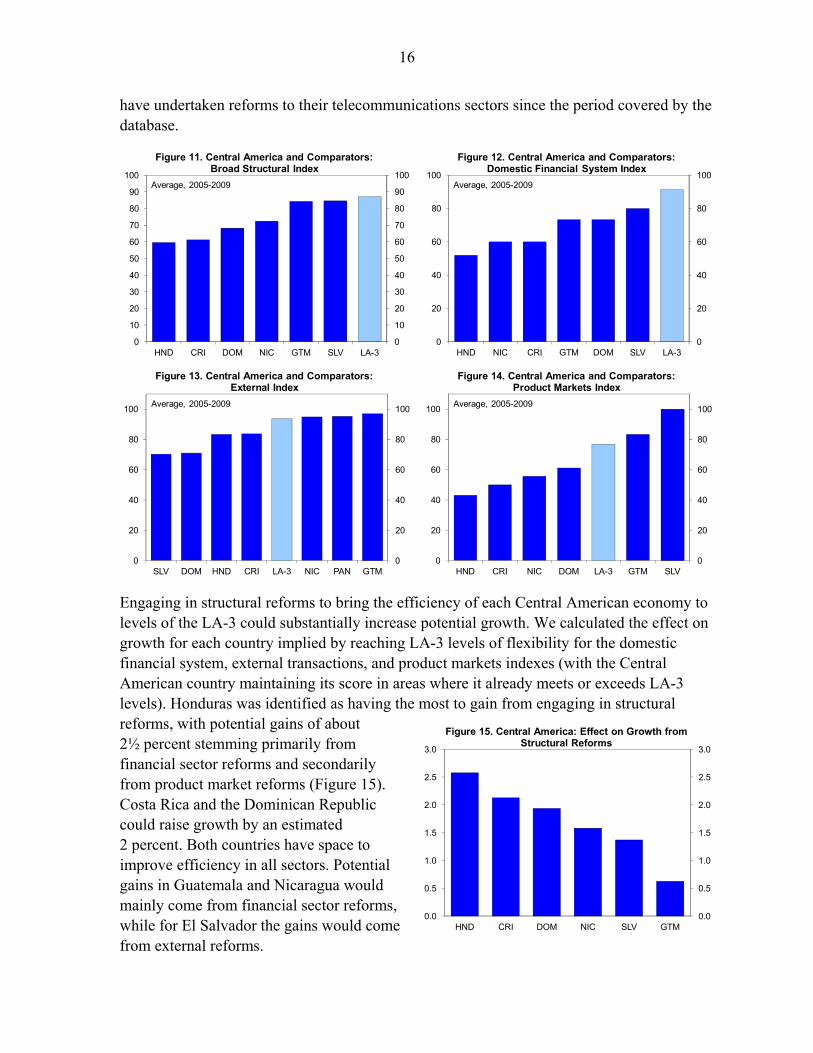
There is scope for improving growth through structural reforms in Central America. Despite significant heterogeneity in the flexibility of the economies of the region, every country in the region could reform in some area in relation to the LA-3. Figures 11–14 display the latest values of the broad structural index and the indexes for the domestic financial system, external transactions, and product markets.
All countries in the region have domestic financial systems that are less conducive to growth than the LA-3 (Figure 12). Among the subcomponents of this index, the region scores relatively low in bank supervision and the development of domestic securities markets, two points corroborated by Delgado and Meza (2011) and Shah and others (2008), respectively. Thus, reforms have lagged the most in some of the areas which have been identified as having the strongest impact on growth.
The region scores better in terms of openness to external transactions. El Salvador and the Dominican Republic are the countries with the largest gap compared to the LA-3 (Figure 13). El Salvador and Guatemala both score highly in terms of flexible product markets, and the room to improve is largest for Honduras and Costa Rica (Figure 14). Indeed, both countries
0
1
2
3
4
5
0
1
2
3
4
5
GTM SLV HND NIC DOM CRI LA-3 PAN
Figure 9. Central America and Comparators: Years of Advanced Education
Average, 2005-2009
0.0
0.5
1.0
1.5
2.0
0.0
0.5
1.0
1.5
2.0
GTM SLV HND NIC DOM CRI PAN
Figure 10. Central America: Effect on Growth from Raising Advanced Education
16
have undertaken reforms to their telecommunications sectors since the period covered by the database.
Engaging in structural reforms to bring the efficiency of each Central American economy to levels of the LA-3 could substantially increase potential growth. We calculated the effect on growth for each country implied by reaching LA-3 levels of flexibility for the domestic financial system, external transactions, and product markets indexes (with the Central American country maintaining its score in areas where it already meets or exceeds LA-3 levels). Honduras was identified as having the most to gain from engaging in structural reforms, with potential gains of about 2½ percent stemming primarily from financial sector reforms and secondarily from product market reforms (Figure 15). Costa Rica and the Dominican Republic could raise growth by an estimated 2 percent. Both countries have space to improve efficiency in all sectors. Potential gains in Guatemala and Nicaragua would mainly come from financial sector reforms, while for El Salvador the gains would come from external reforms.
0
10
20
30
40
50
60
70
80
90
100
0
10
20
30
40
50
60
70
80
90
100
HND CRI DOM NIC GTM SLV LA-3
Figure 11. Central America and Comparators:Broad Structural Index
Average, 2005-2009
0
20
40
60
80
100
0
20
40
60
80
100
HND NIC CRI GTM DOM SLV LA-3
Figure 12. Central America and Comparators:Domestic Financial System Index
Average, 2005-2009
0
20
40
60
80
100
0
20
40
60
80
100
SLV DOM HND CRI LA-3 NIC PAN GTM
Figure 13. Central America and Comparators:External Index
Average, 2005-2009
0
20
40
60
80
100
0
20
40
60
80
100
HND CRI NIC DOM LA-3 GTM SLV
Figure 14. Central America and Comparators:Product Markets Index
Average, 2005-2009
0.0
0.5
1.0
1.5
2.0
2.5
3.0
0.0
0.5
1.0
1.5
2.0
2.5
3.0
HND CRI DOM NIC SLV GTM
Figure 15. Central America: Effect on Growth from Structural Reforms
17
Summarizing this section, we find that structural reforms could play an important role in boosting Central America’s growth performance. Furthermore, policies to facilitate investment in physical and human capital would raise growth in most countries. For Costa Rica, the most promising avenues appear to be reforms of the domestic financial system and product markets; for the Dominican Republic, engaging in financial and external reforms and boosting investment; for Guatemala and El Salvador, investing in both physical and human capital; and for Honduras and Nicaragua, reforming the domestic financial system. For Panama, this study finds that the high investment rate, relatively well-educated labor force and its external openness appear to be key supports for its solid growth.
VI. CONCLUSIONS
This paper has constructed a growth model and finds that in addition to the factors typically associated with improved economic growth—investment, human capital, and macroeconomic stability—structural efficiency is an important determinant of an economy’s long-run growth rate. This is consistent with the idea that a substantial proportion of the cross-country variation in income levels derives from differences in total factor productivity (Easterly, 2005; Hall and Jones, 1999). The finding that structural policies affect growth helps shed light on what drives productivity and future research should attempt to gain a greater understanding of the channels through which this operates.
This paper has identified low levels of physical and human capital as important constraints on growth in several countries in Central America. Some countries could raise their growth rates by over 1 percent per year by increasing investment in physical capital; for others, similar gains could come by investing in education.
The results also indicate that undertaking structural reforms could be a key component in a strategy to improve economic growth. All countries in the region could make their economies more flexible in one or more sectors, and in some areas there is substantial room for improvement. Estimates based on cross-country growth regressions suggests that countries in the region could, in the long run, raise their annual growth by ½ to 2½ percent by making their economies as flexible and well-regulated as other economies in the hemisphere with successful track records. For most countries, this includes bolstering financial supervision and taking steps to develop domestic securities markets. For some countries, liberalization of important industries like agriculture, electricity, and telecommunications would make a significant contribution.
The potential gains are substantial, but can only be realized over the long term, and as the product of a concerted effort to raise growth, given that the policies required to reach the suggested benchmarks would imply significant structural transformation. Nevertheless, the experience of other countries has revealed important lessons on which to draw.
18
REFERENCES Abiad, A., E. Detragiache, and T. Tressel, 2010, “A New Database of Financial Reforms,”
IMF Staff Papers, Vol. 57, pp. 281–302 (Washington: International Monetary Fund).
Aisen, A., and F. Veiga, 2011, “How Does Political Instability Affect Economic Growth?” IMF Working Paper 11/12 (Washington: International Monetary Fund).
Arellano, M., and S. Bond, 1991, “Some Tests of Specification for Panel Data: Monte Carlo Evidence and an Application to Employment Equations,” Review of Economic Studies, Vol. 58, pp. 277–297.
__________, and O. Bover, 1995, “Another Look at the Instrumental Variable Estimation of Error-Components Models,” Journal of Econometrics, Vol. 68, pp. 29–51.
Barro, R., and J. Lee, 2010, “A New Dataset of Educational Attainment in the World, 1950–2010” NBER Working Paper 15902 (Cambridge, MA: National Bureau of Economic Research).
Blundell, R., and S. Bond, 1998, “Initial Conditions and Moment Restrictions in Dynamic Panel Data Models,” Journal of Econometrics, Vol. 87, pp. 115–143.
Chang, R., L. Kaltani, and N. Loayza, 2009, “Openness Can Be Good for Growth: The Role of Policy Complementarities,” Journal of Development Economics, Vol. 90, pp. 33–49.
Cohen, D., and M. Soto, 2007, “Growth and Human Capital: Good Data, Good Results,” Journal of Economic Growth, Vol. 12, pp. 51–76.
Delgado, F., and M. Meza, 2011, “Developments in Financial Supervision in Central America and the Use of Macroprudential Measures,” unpublished manuscript (Washington: International Monetary Fund).
Durlauf, S., P. Johnson, and J. Temple, 2005, “Growth Econometrics,” in Handbook of Economic Growth, ed. by P. Aghion and S. Durlauf (Amsterdam: North-Holland).
Easterly, W., 2005, “National Policies and Economic Growth: A Reappraisal,” in Handbook of Economic Growth, ed. by P. Aghion and S. Durlauf (Amsterdam: North-Holland).
Escaith, H. and I. Paunovic, 2004, “Reformas Estructurales en América Latina y el Caribe en el Período 1970–2000: Índices y Notas Metodológicas,” ECLAC Working Paper (Santiago, Chile: Economic Commission for Latin America and the Caribbean).
Hall, R., and C. Jones, 1999, “Why Do Some Countries Produce So Much More Output Per Worker Than Others?” Quarterly Journal of Economics, Vol. 114, pp. 83–116.
Heston, A., R. Summers, and B. Aten, 2011, “Penn World Table Version 7.0,” Center for International Comparisons of Production, Income, and Prices at the University of Pennsylvania.
Kumar, M., and J. Woo, 2010, “Public Debt and Growth,” IMF Working Paper 10/174 (Washington: International Monetary Fund).
Laeven, L., and F. Valencia, 2008, “Systemic Banking Crises: A New Database,” IMF Working Paper 08/224 (Washington: International Monetary Fund).
19
Lora, E., 2001, “Structural Reforms in Latin America: What Has Been Reformed and How to Measure It,” IADB Research Department Working Paper 466 (Washington: Inter-American Development Bank).
Mehrhoff, J., 2009, “A Solution to the Problem of Too Many Instruments in Dynamic Panel Data GMM,” Discussion Paper No. 31/2009 (Frankfurt: Deutsche Bundesbank).
Prati, A., M. Onorato, and C. Papageorgiou, 2010, “Which Reforms Work and Under What Institutional Environment: Evidence from a New Dataset on Structural Reforms,” unpublished manuscript.
Reinhart, C., and K. Rogoff, 2009, “The Aftermath of Financial Crises,” American Economic Review, Vol. 99, pp. 466–472.
Roodman, D., 2009a, “How to Do xtabond2: An Introduction to Difference and System GMM in Stata,” The Stata Journal, Vol. 9, pp. 86–136.
__________, 2009b, “A Note on the Theme of Too Many Instruments,” Oxford Bulletin of Economics and Statistics, Vol. 71, pp. 135–158.
Sala-i-Martin, X., G. Doppelhofer, and R. Miller, 2004, “Determinants of Long-Run Growth: A Bayesian Averaging of Classical Estimates (BACE) Approach,” American Economic Review, Vol. 94, pp. 813–835.
Shah, H., and others, 2008, “Financial Sector Development: Equity and Private Debt Markets.” In Central America: Economic Progress and Reforms, ed. by D. Desruelle and A. Schipke (Washington: International Monetary Fund).
Spilimbergo, A., J. Ostry, and A. Prati, 2009, “Structural Reforms and Economic Performance in Advanced and Developing Countries,” IMF Occasional Paper No. 268 (Washington: International Monetary Fund).
Windmeijer, F., 2005, “A Finite Sample Correction for the Variance of Liner Efficient Two-Step GMM Estimators,” Journal of Econometrics, Vol. 126, pp. 25–51.
20 APPENDIX
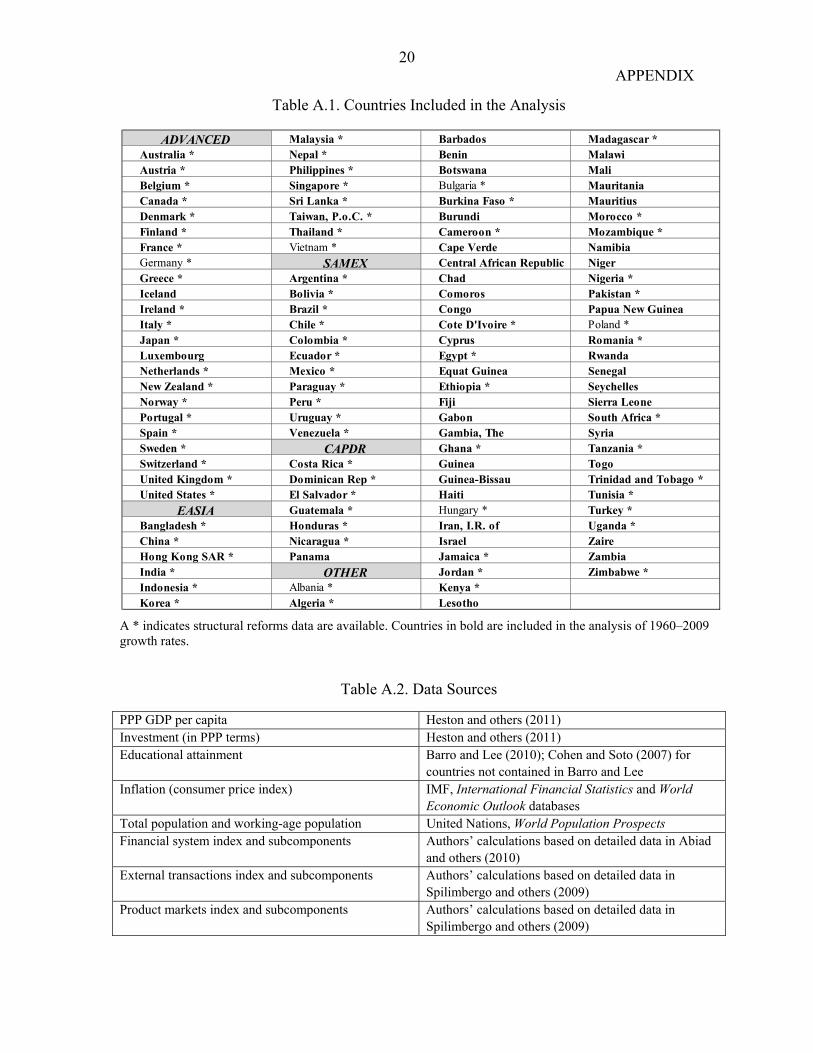
Table A.1. Countries Included in the Analysis
A * indicates structural reforms data are available. Countries in bold are included in the analysis of 1960–2009 growth rates.
Table A.2. Data Sources
PPP GDP per capita Heston and others (2011) Investment (in PPP terms) Heston and others (2011) Educational attainment Barro and Lee (2010); Cohen and Soto (2007) for
countries not contained in Barro and Lee Inflation (consumer price index) IMF, International Financial Statistics and World
Economic Outlook databases Total population and working-age population United Nations, World Population Prospects Financial system index and subcomponents Authors’ calculations based on detailed data in Abiad
and others (2010) External transactions index and subcomponents Authors’ calculations based on detailed data in
Spilimbergo and others (2009) Product markets index and subcomponents Authors’ calculations based on detailed data in
Spilimbergo and others (2009)
ADVANCED Malaysia * Barbados Madagascar *Australia * Nepal * Benin Malawi Austria * Philippines * Botswana Mali Belgium * Singapore * Bulgaria * Mauritania Canada * Sri Lanka * Burkina Faso * Mauritius Denmark * Taiwan, P.o.C. * Burundi Morocco *Finland * Thailand * Cameroon * Mozambique *France * Vietnam * Cape Verde Namibia Germany * SAMEX Central African Republic Niger Greece * Argentina * Chad Nigeria *Iceland Bolivia * Comoros Pakistan *Ireland * Brazil * Congo Papua New GuineaItaly * Chile * Cote D'Ivoire * Poland *Japan * Colombia * Cyprus Romania *Luxembourg Ecuador * Egypt * Rwanda Netherlands * Mexico * Equat Guinea Senegal New Zealand * Paraguay * Ethiopia * Seychelles Norway * Peru * Fiji Sierra Leone Portugal * Uruguay * Gabon South Africa *Spain * Venezuela * Gambia, The Syria Sweden * CAPDR Ghana * Tanzania *Switzerland * Costa Rica * Guinea Togo United Kingdom * Dominican Rep * Guinea-Bissau Trinidad and Tobago *United States * El Salvador * Haiti Tunisia *
EASIA Guatemala * Hungary * Turkey *Bangladesh * Honduras * Iran, I.R. of Uganda *China * Nicaragua * Israel Zaire Hong Kong SAR * Panama Jamaica * Zambia India * OTHER Jordan * Zimbabwe *Indonesia * Albania * Kenya *Korea * Algeria * Lesotho