the role of special education in school choice of special needs students may be a ... in cases in...
TRANSCRIPT

This PDF is a selection from a published volume from theNational Bureau of Economic Research
Volume Title: The Economics of School Choice
Volume Author/Editor: Caroline M. Hoxby, editor
Volume Publisher: University of Chicago Press
Volume ISBN: 0-226-35533-0
Volume URL: http://www.nber.org/books/hox03-1
Conference Date: February 22-24, 2001
Publication Date: January 2003
Title: The Role of Special Education in School Choice
Author: Julie Berry Cullen, Steven G. Rivkin
URL: http://www.nber.org/chapters/c10086

67
3.1 Introduction
There are differing views of the impact of school choice programs on thedistribution of student opportunity. Proponents claim that all students,both those who take advantage of choice and those who remain in theirneighborhood schools, will benefit as schools improve in response to com-petitive pressures. Others fear that only the more advantaged and informedstudents will opt out to better schools, leaving the more disadvantaged stu-dents isolated in the worst schools with declining resources.
Among the students who may be left behind are special needs students.Students with disabilities are more costly to educate and may therefore en-counter explicit or implicit barriers to attending choice schools. Also, highconcentrations of special needs students may be a deterrent to other stu-dents deciding on schooling options. These considerations may lead someschools to adopt policies that discourage students with special needs fromattending, thereby limiting the choices available to these students. Suchconcerns about the relative access and participation of students with dis-abilities overlap with concerns about low-income and minority students, al-though the degree of legal protection differs.
3The Role of Special Education in School Choice
Julie Berry Cullen and Steven G. Rivkin
Julie Berry Cullen is assistant professor of economics at the University of Michigan and afaculty research fellow of the National Bureau of Economic Research. Steven G. Rivkin is pro-fessor of economics at Amherst College and a research associate of the National Bureau ofEconomic Research.
The authors would like to thank Caroline Hoxby, David Monk, Richard Murnane, BenScafidi, and participants in the NBER Economics of School Choice Conference for helpfulcomments and suggestions. The authors would also like to thank John Easton of the Consor-tium on Chicago School Research and the Chicago School Board for providing access to theChicago Public Schools data and Brian Jacob for processing the data.

Since 1975, disabled students have been guaranteed a free and appropri-ate public education (FAPE) by the passage of the Education for all Hand-icapped Children Act (EHA) and its successor, the Individuals with Dis-abilities Education Act (IDEA). Prior to the passage of the legislation, acongressional investigation revealed that a majority of disabled students re-ceived inadequate educational services and at least one-third of severely dis-abled students were excluded altogether from public schools (Verstegen1994). Now, nearly one in every eight students is classified as disabled andone in every five new dollars of per-pupil spending is dedicated to specialeducation (Hanushek and Rivkin 1997). The costs associated with educat-ing the typical disabled student are approximately 2.3 times those fornondisabled students, and this ratio can be as high as 30 for the most se-verely disabled (Moore et al. 1988; Chambers 1998). In order to support lo-calities in providing the mandated services, the federal government andstates provide on average 8 percent and 56 percent of the funding, respec-tively.
This chapter considers the impact of expanded school choice on the qual-ity of special education services, on the size and composition of the specialeducation sector, and on the distribution of students with disabilitiesamong schools and districts. The crucial role played by the structure of spe-cial education funding in the determination of each of these outcomes ishighlighted throughout the chapter. The tensions inherent in the develop-ment of a finance system that encourages schools to provide special serviceswhere appropriate but not to classify students as disabled inappropriately inorder to procure additional resources will persist regardless. However, ex-panding schooling choices has the potential to mitigate these tensionsthrough competitive discipline or to exacerbate them through increasedsorting.
Recognizing that special education is essentially a social insurance pro-gram helps to clarify the source of the trade-offs between adequacy and in-centives. The economic justification for the entitlement to special educationis that it provides insurance for families who have a child who turns out tobe expensive to educate. Similarly, the justification for federal and statefunding to support special education programs is to insure local schoolsagainst the high costs of serving student populations that happen to have ahigh rate of disability.
Just as Medicare and Medicaid may distort the behavior of patients andhealth care providers, the insurance provided through special educationmay distort the behavior of parents and educators. The higher the qualityof special education relative to regular education, the more likely that par-ents will aggressively seek to gain admittance to special education, so thatprogram generosity and size will be positively correlated. From the per-spective of schools as agents, how well the amount of additional federal and
68 Julie Berry Cullen and Steven G. Rivkin

state revenue matches the marginal costs of serving disabled students willdetermine whether schools have incentives to under- or overclassify stu-dents as disabled and to offer too few or too many additional services.1
In addition to the potentially perverse incentives for both parents andschools, there may also be adverse selection. Parents with disabled childrenmay seek out schools that provide more generous services. If special educa-tion is not fully funded and these choices reduce resources dedicated toother instructional programs, regular education students may flee to otherschools that provide fewer services for disabled students. The danger of at-tracting high-cost students and repelling less expensive nondisabled stu-dents can discourage the provision of high-quality services. In an attemptto balance the potential for overclassification and adverse selection againstthe desire and legal mandate to provide appropriate services for childrenclassified as disabled, state school finance policies have oscillated betweencase mix systems that reimburse schools and districts based on the actualnumber and mix of students with disabilities and prospective payment sys-tems in which the amount of funding is decoupled from the actual numberand type of disabilities.
The ramifications of expanded school choice in this context will dependupon the structure of school finance and the interpretation of the legal man-date to provide special services. If special needs students are “priced” tocover the total costs of service provision, then increased choice can improvethe quality and perhaps the efficiency of special education programs asschools compete for special needs students. If instead they are underpriced,fewer schools may open or participate in any choice program, and schoolsthat do participate may attempt to discourage matriculation of high-coststudents, perhaps by providing low-quality programs. This would reducethe gains from competition for students with disabilities, particularly if notall schools are required to provide special education services. Becauseprivate schools are currently exempt from federal requirements for studentswith disabilities and the treatment of charter schools is evolving over time,legal interpretations will play an important role in determining how dis-abled students fare under nontraditional forms of choice.
The next section describes the issues related to financing the special edu-cation component of a school choice program, incorporating existing evi-dence from traditional public schooling. Section 3.3 then presents and in-terprets new evidence on the stratification of special needs students acrossand within public school districts in Texas. The subsequent three sectionsreview the relevant evidence and the unique considerations that arise for
The Role of Special Education in School Choice 69
1. Given the ambiguity in determining disability and needed services in many cases as wellas the potential for high costs, special education has become the most litigated area in educa-tion (Katsiyannis and Maag 1998).

special education under open enrollment, charter schools, and vouchers, re-spectively. In the section on open enrollment, we provide new evidence fromthe Chicago public schools. Sections 3.3 through 3.6 demonstrate that vari-ations in the impact of different forms of public- and private-sector choiceare likely to be heavily moderated by the generosity of the reimbursementsystem. The final section summarizes and discusses the most salient policyissues.
3.2 Financing Special Education under School Choice
There are two features of school choice programs that will most directlydetermine the impact on special education students and programs. Thefirst, and the focus of this section, is how closely the reimbursement for serv-ing disabled students reflects marginal costs. The second is whether or notchoice schools are required to serve applicants with special needs. The pay-ment structure will be particularly important for inducing competitionwhen institutions exist that have no legal responsibility to serve disabledstudents. We first consider these issues in a world in which disability statusis given and not affected by family or school behavior, and we then incor-porate the complexities introduced by the participation of families andschools in the special education classification process.
3.2.1 Exogenous Disability Status (Innate)
We begin by considering how special education affects the choices of par-ents and schools when a student’s disability status is innate. In this case, stu-dent disability is much like any other identifiable characteristic that is cor-related with higher educational costs, such as economic disadvantage, anda guiding principle for school finance is to provide enough revenue to insureadequate service provision and access to schooling opportunities. When weincorporate the fact that the classification of students is responsive to fiscalincentives, this imposes the additional requirement that the system be de-signed to discourage gaming.
Parents are assumed to recognize the multidimensional nature of schoolswhen making housing and schooling choices. For our purposes, the rele-vant dimensions of schools are regular and special education quality. Bothregular and special education quality will be a function of the level of re-sources, the quality of instruction, and peer characteristics. Parents of spe-cial needs children undoubtedly place much greater weight on the qualityof special services than do other parents, although most special educationchildren spend much of the day in regular classrooms. How parents and stu-dents perceive special education quality will depend on the types of settingsin which special needs students are served. More intensive resources maynot be highly valued if those resources are accompanied by more isolated
70 Julie Berry Cullen and Steven G. Rivkin

placements and reduced contact with nondisabled students.2 There is verylittle consensus about what types of interventions are effective for specialneeds students, so that parent preferences and beliefs about what is effectivewill play a particularly important role.
The quality of regular education programs is tied to special educationthrough two channels: the budget and classroom dynamics. Depending onthe reimbursement rate, the marginal cost of serving disabled students mighteither exceed, match, or fall short of the additional revenue generated. In thecase of traditional public schools, the net local financial burden will lead tosome combination of reduced spending on other educational programs andincreased taxes. Lankford and Wyckoff (1996) and Cullen (1997) find evi-dence of nearly one-for-one crowdout of spending on other programs by lo-cal excess special education costs in New York and Texas, respectively. Forschools that are financed purely based on student enrollment, such as char-ter schools, such one-for-one crowdout is mechanical. Special educationmay also enhance or detract from the regular education classroom by affect-ing the distribution of abilities and behaviors. In cases in which students aremainstreamed, there may be negative spillovers through peer effects or pos-itive spillovers through increased resource intensity in regular classes.3
For expanded school choice to improve school quality for disabled stu-dents, schools must compete to serve these students. To foster this kind ofcompetition, reimbursement rates should reflect the expected effective netresource and peer costs of serving students with differing disabilities. Thisform of case-mix reimbursement would ensure that all special needs stu-dents have access to a variety of schooling options, that regular educationstudents do not have an incentive to avoid special needs students, and thatschools have an incentive to control costs. Importantly, appropriate reim-bursement based solely on the more easily measured financial costs wouldleave peer group composition as the only factor discouraging the provisionof special education.
One complication that arises in determining the appropriate reimburse-ment rate in this setting is economies of scale in the provision of services toseverely disabled students. In order to minimize costs, the reimbursementrate could incorporate average fixed per capita costs at the efficient size.However, this would lead to the concentration of severely disabled students
The Role of Special Education in School Choice 71
2. IDEA explicitly includes the requirement that schools serve students in the most inte-grated environment possible. Although inclusion has been a long-standing goal of disabilityrights activists, there is little evidence about the relative benefits of serving disabled students inmore and less restrictive environments. Hanushek, Kain, and Rivkin (forthcoming) do not findsignificant differences in achievement gains by type of setting in Texas public schools.
3. Evidence on the effect of special education programs on regular education quality ismixed. Whereas Cullen (1997) finds that resource crowding-out harms the quality of regulareducation, Hanushek, Kain, and Rivkin (forthcoming) find that an increase in the share of stu-dents classified as disabled is positively related to the quality of regular education.

in a limited number of schools. There is, therefore, a conflict between unre-stricted choice and cost minimization.
3.2.2 Endogenous Disability Classification (Subjective)
The above discussion assumes that the presence and type of disability areexogenously determined. Although this is likely to be true for severely dis-abled students, Singer et al. (1989) find that there is substantial variation inthe functional status of students classified with mild disabilities across dis-tricts. Despite the procedural safeguards, the classification of students whoexhibit academic or behavioral difficulties is far from an objective process.Both family and school pressures and preferences will affect whether andhow students are classified and served.
There is evidence that where districts draw the line between able and dis-abled varies directly with the amount of state revenue generated by disabledstudents.4 The dominant mechanism that states use to distribute special ed-ucation aid to districts is essentially a case-mix system under which specialeducation students are weighted more heavily than general education stu-dents within the basic school finance formula.5 The weights are often spe-cific to the type of disability, the type of instructional setting, and/or thegrade level to account for heterogeneity in costs. Under this type of reim-bursement, districts have an incentive to shift students from regular to spe-cial education and to classify students in the most highly reimbursed cate-gories in order to maximize revenue. The dramatic growth over the pastdecades in the percentage of students classified as disabled has been widelyattributed to the direct link between disability rolls and revenues.
Under a case-mix reimbursement system that applies different weightsbased on student needs, any expansion of school choice may not only fos-ter active competition but may also affect the efforts of families and schoolsto seek inappropriate classifications. The greater ease with which familiesare able to switch schools may exacerbate the rates of inappropriate classi-fications and unnecessary provision of services because of the increasedlikelihood that parent and school interests are aligned in attempting to ac-quire greater resources. However, to the extent that overclassification re-sults from school incentives to misclassify children in a way that providesno or even a negative educational benefit, school choice can provide an-other means of disciplining schools in addition to legal action or the under-taking of a more costly residential move.
72 Julie Berry Cullen and Steven G. Rivkin
4. Using variation in state aid according to district wealth and year under such a formula inTexas, Cullen (forthcoming) finds that student disability rates rise 1.4 percent with every 10percent increase in the amount of additional revenue generated by disabled students. She findsthat the specific categories to which disabled students are assigned also respond to changes inrelative formula weights.
5. See Parrish et al. (1997) for a thorough discussion of the various mechanisms states use todistribute special education aid.

An alternative solution to overclassification is the adoption of a prospec-tive payment system that prices all students in the same way. In fact, manystates have responded to growing special education populations by switch-ing to systems that allocate special education aid based only on overall en-rollment and the expected rate of disability.6 While eliminating the over-classification incentives associated with case-mix systems, prospectivepayment provides strong incentives for schools to discourage attendance bystudents with disabilities and to provide low-cost, low-quality special edu-cation services. It is important to recognize that incentives to provide spe-cial education services were first implemented as a remedy to widespreadunderprovision. A strong accountability system could provide a partialcounterbalance to ensure that students receive adequate services. In prac-tice, the extent to which an active market develops for disabled students cansignal policymakers about the adequacy of any finance structure.
3.2.3 Interpreting Enrollment Patterns
In our empirical analyses of traditional choice in Texas and open enroll-ment in Chicago in the next sections, we explore patterns in the stratifica-tion of students by disability status across schools and districts. Evidencethat special education students exhibit different school attendance patternsmay reflect avoidance behavior on the part of nondisabled students or re-luctance of some schools or districts to provide adequate services. Thesefactors contribute to the involuntary segregation of disabled students. Al-ternatively, students with disabilities may concentrate in particular schoolsor districts because of preferences for specific programs known to providehigher quality services. This would be considered voluntary segregation. Inorder to determine whether the patterns are consistent with equal opportu-nities for disabled students, we attempt when possible to distinguish be-tween voluntary and involuntary segregation.
At first glance it is tempting to conclude that involuntary segregation isproblematic but voluntary segregation is desirable. However, involuntarysegregation caused by high fixed costs of serving some disabilities clearly re-flects the trade-off between the advantages of expanded choice and the re-ality of economies of scale. Moreover, a decision by some special educationstudents to avoid nondisabled students may conflict with integration goals.
3.3 Traditional Public School Choice: Evidence from Texas
The previous section covered what is currently known about the interplaybetween special and regular education programs under traditional publicschool choice. In this section, we rely on data from the Texas public schools
The Role of Special Education in School Choice 73
6. A case study of such a reform in Vermont (Kane and Johnson 1993) does in fact find thatdisability rates fell noticeably (by 17 percent) by three years after the change.

to provide new evidence on how the choices of special needs and regular ed-ucation students affect stratification by disability. It is important not to gen-eralize the Texas results to all traditional public school districts, becauseother school systems differ along a number of dimensions. Perhaps mostimportant, the state of Texas has a fairly generous case-mix reimbursementsystem that is unlikely to discourage districts from classifying students asdisabled or providing quality services in most cases.
The analysis follows one cohort of students from third to seventh grade.7
We first describe the distribution of special education students and other de-mographic groups into schools and districts in third grade and how the distri-bution evolves as students progress through school. Next we provide a de-tailed description of the interrelationship between transitions into and out ofspecial education and mobility that underlies changes in the overall distribu-tions. Finally, we examine whether special and general education studentstend to systematically move to schools with higher or lower proportions ofstudents classified as disabled. We do not attempt to identify the causal impactof either peer characteristics or other aspects of special education on schoolchoice. Rather, we use enrollment and mobility patterns to provide indirect ev-idence on the strength of “race to the bottom” pressures in the provision ofspecial education and of “push” factors for students without disabilities.
3.3.1 Data
This analysis is based on a unique matched panel data set of school op-erations constructed by the University of Texas at Dallas Texas SchoolsProject, directed by John Kain. Our cohort includes the universe of studentswho began the third grade in 1993. The data report race and ethnicity, eli-gibility for a subsidized lunch, and a unique identifier (ID) for each student.Students who switch public schools within the state of Texas can be fol-lowed just as students who remain in the same school or district. The cohortcontains over 200,000 students in over 3,000 public schools. The substantialnumbers of students who change schools and change special education sta-tus provide a detailed picture of the association between mobility and spe-cial education. The student IDs link the student records with a separate spe-cial education module. These data contain information on disability typeand instructional setting. A much more detailed discussion of the data canbe found in Hanushek, Kain, and Rivkin (forthcoming).
3.3.2 Distribution of Special Needs Studentsacross Schools and Districts
Figures 3.1 and 3.2 describe the distribution of students across schoolsand districts using analogues of Lorenz curves. Schools (figure 3.1) or dis-
74 Julie Berry Cullen and Steven G. Rivkin
7. It is important to note that third grade is not the first year in which students can receivespecial education, and active sorting by disability may have taken place before then. Unfortu-nately, we are unable to explore the trends for earlier grades.

tricts (figure 3.2) are ordered according to the proportion of students in aspecific category (e.g., special education). The cumulative proportion of allthird-grade special education students in Texas public schools is plottedagainst the cumulative proportion of all students. The diagonal line repre-sents complete integration, meaning that each school has the populationshare of special education students. The more unevenly that disabled stu-dents are distributed across schools, the farther the curve will fall below the
The Role of Special Education in School Choice 75
Fig. 3.1 Third-grade school segregation curves
Fig. 3.2 Third-grade district segregation curves

45 degree line, so that curves farther from the line indicate greater segrega-tion.8
The district segregation curves are derived from data aggregated to thedistrict level. Just as school segregation curves ignore the allocation of stu-dents among classrooms, these curves ignore the allocation of studentsacross schools within districts. Comparisons of the school and district seg-regation curves reveal how much of any existing concentration occurswithin versus across districts. We focus the discussion on the curves shownin the figures, but we also report the corresponding Gini coefficients in table3A.1.9
In order to gain a better sense of the degree of segregation of special ed-ucation students, the first two figures also present segregation curves forBlack, Hispanic, and free lunch–eligible students. Figure 3.1 shows that de-spite a substantial degree of sorting according to special education programparticipation at the school level, there is much more segregation by otherdemographic characteristics, particularly race. Whereas nearly one-third ofspecial needs students are educated in schools with below-median shares ofspecial needs students, less than one-tenth of Black students attend schoolswith below-median Black shares.10 Not only do the district segregationcurves in figure 3.2 preserve the same ordering by student characteristics asthe school curves, but they largely preserve the distances between them aswell. Although all of the district curves do lie closer to the 45 degree linethan the school curves, aggregation to the district level does not eliminatemuch of the variation on any dimension. Clearly the extent of segregationby income, ethnicity, and disability status is largely determined at the dis-trict level.
In the case of income and ethnicity, housing patterns determine districtenrollment, but differences in special education program participation can-not be attributed solely to the distribution of disabilities among communi-ties. Unlike the case of race, schools and districts must actively classify stu-dents as disabled, so the differences among districts also emanate fromdifferences in the ways districts implement state guidelines. Of course, fam-ilies may respond to district policies in their choice of districts, making it ex-tremely difficult to separate the contributions of residential location anddistrict policies.
76 Julie Berry Cullen and Steven G. Rivkin
8. When curves cross there is no simple segregation ranking because crossing implies thatdifferent parts of the distribution are more or less unequal. See Allison (1978) for a discussionof this issue.
9. These summary measures are equal to the ratio of the area between the 45 degree line andthe segregation curve to 1/2 (the area under the 45 degree line). The Gini coefficient varies from0 (no segregation) to 1 (complete segregation).
10. To simplify the discussion, percentiles of schools (and districts) are described where thepercentiles are determined by student enrollment or are from the student perspective. For ex-ample, what we describe as schools with below-median disability shares are schools that havedisability shares below that faced by the median student.

Figures 3.3, 3.4, and 3.5 begin to disentangle the contributions of theunderlying distribution of disabilities and district classification practices.Figures 3.3 and 3.4 are based on school- and district-level data, respectively.Figure 3.5 is based on school catchment area data, so that elementaryschools are grouped by the junior high school that students most often at-tend. Each figure consists of four graphs that show results first for students
The Role of Special Education in School Choice 77
A
B
Fig. 3.3 A, Special education school segregation curves; B, learning disabled schoolsegregation curves; C, emotionally disturbed school segregation curves; D, physicallydisabled school segregation curves

classified with any disability and then separately for students with specificlearning disabilities, emotional disturbances, and physical disabilities. Eachgraph presents four distribution curves. Two of the curves are based on con-current disability classification status, with one for students served in spe-cial education in third grade and one for students served in special educa-tion in seventh grade. The other two show the distribution of students in
78 Julie Berry Cullen and Steven G. Rivkin
C
D
Fig. 3.3 (cont.) A, Special education school segregation curves; B, learning dis-abled school segregation curves; C, emotionally disturbed school segregation curves;D, physically disabled school segregation curves

these two grades on the basis of whether they were ever classified as disabledbetween third and seventh grade, inclusive.
Focusing on the curves based on concurrent status, changes in the distri-bution of special needs students across grades provides a sense of whetherspecial needs program sizes are becoming more disparate as students pro-gress through school. Changes across grades will be driven by several fac-
The Role of Special Education in School Choice 79
A
B
Fig. 3.4 A, Special education district segregation curves; B, learning disabled dis-trict segregation curves; C, emotionally disturbed district segregation curves; D,physically disabled district segregation curves

tors. First, special education status may change without a school or districttransfer. Although some disabilities may be treated by effective interven-tions, others may develop over time. In addition, the aggressiveness andtiming of district and school labeling and interventions may also vary be-cause of the beliefs of school leaders, community pressures, or changes infinancial incentives. Second, a change in classification may occur following
80 Julie Berry Cullen and Steven G. Rivkin
C
D
Fig. 3.4 (cont.) A, Special education district segregation curves; B, learning dis-abled district segregation curves; C, emotionally disturbed district segregationcurves; D, physically disabled district segregation curves

a school or district transfer. There is likely to be variation in classificationprocedures across schools and districts. In addition, parents may switchschools either in order to obtain a label or to escape a previous classifica-tion and obtain a fresh start.
In contrast, classification of students based on their entire special educa-tion histories isolates changes in the distribution of special needs studentsbetween third and seventh grades that arise strictly due to school changes.
The Role of Special Education in School Choice 81
A
B
Fig. 3.5 A, Special education catchment area curves; B, learning disabled catch-ment area curves; C, emotionally disturbed catchment area curves; D, physically dis-abled catchment area curves

82 Julie Berry Cullen and Steven G. Rivkin
C
D
Fig. 3.5 (cont.) A, Special education catchment area curves; B, learning disabledcatchment area curves; C, emotionally disturbed catchment area curves; D, physi-cally disabled catchment area curves
Consequently, differences between the curves based on concurrent statusand those based on special education classification throughout the periodare driven by differences in classification rates for specific grades andschools.
Although the segregation curves in figures 3.3 and 3.4 reveal some het-erogeneity by disability type, there are strong similarities, particularly at thedistrict level. In fact, the four district curves lie virtually on top of one an-

other regardless of disability type, suggesting that specific districts are notmagnets to special education students (at least following third grade) andthat families do not tend to relocate en masse to avoid large special educa-tion programs. In addition, there is little evidence of much variation in clas-sification timing among districts, because the district distributions do notappear to become more equal as students age.
The school-level diagrams, on the other hand, display much more het-erogeneity across disabilities and greater changes in segregation over time.In particular, physically disabled students become significantly less concen-trated between grades three and seven. However, the school catchment arealevel diagram in figure 3.5 shows that this results almost entirely from theconsolidation of students into more heterogeneous junior high schoolsrather than because of active school or district transfers.
There is a trend toward less segregation as students age for emotionallydisturbed students as well, but the mechanism appears to be different in thiscase. Here the third-grade distribution of those ever classified is over two-thirds of the way toward both seventh-grade distributions, suggesting thatdifferences in school classification behavior in the third grade account for aportion of the variation in the fraction of students classified as emotionallydisturbed. An alternative explanation is that students differ systematicallyin the grade at which they manifest symptoms of the disability, and the twoexplanations cannot be distinguished from one another. The pattern for stu-dents with learning disabilities and all disabled students is similar to that forstudents with emotional disabilities, but the changes across grades aresmaller.
Overall these figures provide no evidence of increasing segregation as stu-dents age. Although families may segregate prior to the third grade, onewould still expect to find movements during these grades if responses tospecial education programs played an important role in the typical family’slocation decision. Note that the slight convergence occurs at the same timethat classification rates for lower-income students diverge from those of stu-dents not eligible for subsidized lunch (see table 3A.3). However, both in-come groups experience similar percent changes in classification rates, andthe reported segregation curves are invariant to equiproportional changesthroughout the initial distribution.
3.3.3 Student Mobility
We provide further evidence on how choices correlate with special edu-cation program size by analyzing movement in and out of special educationand across schools and districts. Table 3.1 reports annual special educationtransition rates by disability type and student mobility based on annualobservations of students in the 1993 cohort pooled across grades threethrough seven. Students are divided among four categories: not classified asdisabled in either year; classified in both years; not in special education in
The Role of Special Education in School Choice 83

the first year but classified in the following year; and in special education inthe first year but exiting from the program prior to or during the followingyear. Within each of these categories, students are divided further on the ba-sis of school transfer patterns: “Same school” refers to students who eitherremain at the same campus or transition from middle to junior high schoolalong with their class; “Within district” refers to students who switch to anew school in the same district; and “Between district” refers to studentswho change districts. A small number of students who either change dis-ability types or who move multiple times are excluded from consideration,as are students who exit the Texas public schools entirely.
84 Julie Berry Cullen and Steven G. Rivkin
Table 3.1 Annual Mobility Rates by Special Education Transition for Grades Three throughSeven, by Disability Type
Special Education Transition (%)
Not Classified Enters Exits NumberClassified in Both Special Special Classified
Either Year Years Education Education as Disabled
Learning disabled 89,915Same school 85.4 82.5 81.6 68.7Within district 7.9 9.6 10.7 8.5Between district 6.0 6.7 6.4 19.6Total 99.3 98.8 98.7 96.8Distribution of special
education transitions 90.2 8.5 0.8 0.4Emotionally disturbed 9,269
Same school 85.4 69.3 65.2 63.4Within district 7.9 17.8 20.7 15.4Between district 6.0 9.9 10.0 18.1Total 99.3 97.0 95.9 96.9Distribution of special
education transitions 98.9 0.9 0.1 0.1Physically disabled 3,027
Same school 85.4 82.9 73.4 72.3Within district 7.9 10.9 12.7 8.9Between district 6.0 5.6 12.7 15.8Total 99.3 99.4 98.8 97.0Distribution of special
education transitions 99.7 0.3 0.0 0.0All disabilities 172,919
Same school 85.4 79.6 77.2 77.0Within district 7.9 11.0 12.4 8.5Between district 6.0 7.8 8.6 12.6Total 99.3 98.4 98.2 98.1Distribution of special
education transitions 82.8 13.5 2.1 1.6
Note: Column totals do not total 100 percent because of rounding and a small number of students whochange schools more than once in a year.

A number of similarities appear across disabilities in the pattern of tran-sitions. First, students not classified as disabled are less likely to move thanstudents classified in one or both years; the gap is greatest for the emotion-ally disturbed. Second, a substantial proportion of students remaining inspecial education switch schools within districts. For the emotionally dis-turbed and physically disabled, roughly twice as many students transferwithin as transfer between districts, whereas for the learning disabled thedifferential is approximately 50 percent. With the exception of the physi-cally disabled, a similar pattern holds for those entering special education.On the other hand, those who exit special education exhibit by far the high-est mobility rates, and they are much more likely to move to new districtsthan to find a new school in the same district. Less than 70 percent of emo-tionally disturbed and learning disabled students who exit special educa-tion remain in the same school, and almost 20 percent switch districts. Asimilar although slightly muted pattern emerges for the physically disabled.Note that the lower mobility rate for all students who exit special educationreflects the lower mobility of those previously classified as speech impaired,a disability category that constitutes a large share of those who exit specialeducation between grades three and seven. These students are not verydifferent from their peers that do not have special needs because the im-pairment is short-lived and readily treated with proper therapy.
Overall, the table suggests that students with disabilities move aroundmore than others, and those who move do tend to change their classifica-tion status more often. The greater mobility of those classified as disabledmay result partly from income and other family factors that affect both mo-bility and disability rates. For example, mobility rates are much higher forlower-income students eligible for a subsidized lunch regardless of specialeducation status, and these students are also more likely to have specialneeds. However, table 3.2 shows that the same broad conclusions hold whensubsidized and nonsubsidized student populations are analyzed separately.It remains possible that the higher rates of change in special education sta-tus can be attributed to movers systematically experiencing greater changesin personal conditions. On the other hand, it seems more plausible that mo-bility facilitates the change, particularly for those exiting special education.This more detailed analysis of individual student mobility is consistent withmarginal students’ relocating to either obtain or shed the special educationlabel.
Tables 3.3 and 3.4 provide information on changes in peer disability ratesby the above transitions.11 There is no evidence that students who are in reg-ular education in consecutive years move to schools or districts with smaller
The Role of Special Education in School Choice 85
11. We also examine differences in the lagged growth in percentage special education bytransition type. Similar to the case for levels, there is little or no evidence that non–special ed-ucation students tend to switch schools following unusually large increases in the percentageclassified as disabled (see table 3A.4).

Table 3.2 Annual Mobility Rates by Special Education Transition for Grades Three throughSeven, by Family Income
Special Education Transition (%)
Not Classified Enters ExitsClassified in Both Special Special
Either Year Years Education Education
Eligible for subsidized lunchSame school 81.8 76.6 74.0 70.8Within district 9.9 12.6 14.3 11.1Between district 7.1 8.6 9.4 15.3Total 98.8 97.8 97.7 97.2Distribution of special
education transitions 79.7 16.2 2.5 1.5Not eligible
Same school 90.2 86.9 85.0 85.5Within district 5.2 7.0 7.8 5.0Between district 4.4 5.6 6.4 8.9Total 99.8 99.5 99.2 99.4Distribution of special
education transitions 87.4 1.6 1.5 9.5
Table 3.3 Change in Percent Classified as Disabled, by Special EducationTransition, Mobility, and Disability Type
Special Education Transition (%)
Not Classified Enters ExitsClassified in Both Special Special
Either Year Years Education Education
Learning disabledSame school 0.5 0.4 2.0 –0.4Within district 0.4 1.1 2.2 –1.2Between district 0.4 0.5 1.9 –1.8All 0.5 0.4 1.9 –0.6
Emotionally disturbedSame school 0.1 –0.3 0.6 –1.5Within district 0.0 1.5 4.3 –2.2Between district 0.1 –2.8 13.5 –1.8All 0.1 –0.1 2.9 –1.6
Physically disabledSame school 0.0 –0.4 0.2 –0.3Within district 0.0 0.4 3.4 –3.0Between district 0.0 1.0 0.2 –6.2All 0.0 –0.2 0.6 –1.5
All disabilitiesSame school 0.1 0.1 1.9 –0.8Within district 0.0 1.2 3.0 –1.9Between district –0.3 –0.8 2.7 –1.8All 0.1 0.0 2.0 –0.9

special education programs; nor is there a systematic pattern for studentswho remain in special education in both years. However, table 3.3 showsthat entrants to special education tend to experience increases in the pro-portion of schoolmates classified as disabled, and those exiting special edu-cation tend to experience declines. Entrants and exiters who move experi-ence significantly larger changes than those who remain in the same school,with the exception of entrants classified as learning disabled.12 Note that theestimates of changes in peer composition for emotionally disturbed andphysically disabled students are noisy and are greatly affected by the mi-nority of students who move to separate special education schools.
Table 3.4 reports differences in changes in peer disability rates by studentincome. Not surprisingly, the largest increases occur among those eligiblefor a subsidized lunch whose classification rates rise much more rapidly inabsolute terms. For both groups, movers tend to experience the largestchanges.
There are at least two hypotheses that are consistent with the results formovers who exit or enter special education: Families may be attempting tofind a more preferred classification system and special education program,or students who move to schools with larger special education populationsmay be more likely to be classified because the new schools utilize more lib-eral classification criteria. The pattern we observe confounds deliberate
The Role of Special Education in School Choice 87
Table 3.4 Change in Proportion Classified as Disabled, by Special EducationTransition, Mobility, and Family Income
Special Education Transition (%)
Not Classified Enters ExitsClassified in Both Special Special
Either Year Years Education Education
Eligible for subsidized lunchSame school 0.3 0.2 2.2 –0.9Within district 0.3 1.4 3.1 –2.1Between district –0.1 –0.8 2.9 –2.1
Not eligibleSame school 0.0 0.0 1.2 –0.7Within district –0.6 0.2 2.6 –1.3Between district –0.6 –0.8 1.9 –1.1
12. Tests of the hypothesis that the average change in proportion special education for en-trants who move is equal to the change for entrants who do not move show that this hypothe-sis is rejected for all of the disability types at the 0.01 level. A test for those who exit special ed-ucation leads to a rejection of the equality hypothesis for the learning disabled and allcategories combined at the 0.01 level, for the physically disabled at the 0.10 level, but not forthe emotionally disturbed at any conventional level. Note that the latter two disabilities hadonly a small number of students who exited.

family efforts and any incidental effects of school regime, although it is cer-tainly consistent with the notion that school classification procedures affectfamily choices.
3.3.4 Lessons
The results from both the segregation and mobility analyses suggest thatfears about regular education students self-segregating from disabled stu-dents are not confirmed by actual enrollment patterns in the state of Texas.Those who appear to be most responsive to special education when makingschooling decisions are marginal students who are on the border betweenclassification as disabled or nondisabled. We find that these students moveto schools with programs that are systematically larger or smaller than theirinitial schools.
There are several caveats restricting the generalizability of these results toother settings. First, we analyze changes in sorting between third and sev-enth grade rather than trying to explain initial sorting. The impact of anydecisions that are made based on special education programs is thereforeunderstated. Second, as we have emphasized, both student and school re-sponses are dependent on the pricing regime. In Texas, special educationstudents generate additional marginal revenue for their school district.Cullen (forthcoming) calculates that there is likely to be a net financial gainfrom serving mildly disabled students for most districts during the time pe-riod of our analysis. Third, because of the small size of many rural districtsin Texas, over 80 percent of districts participate in some type of cooperativearrangement for providing certain types of special education services. Fi-nally, the preponderance of neighborhood schools implies that familiesmust undertake costly residential moves in order to change public schools,and a system that expands choice at the current residence may lead togreater responsiveness to special education considerations. For these rea-sons, the incentives for regular education students to avoid special needsstudents and for special needs students to shop across programs may beweaker than in other states or under nontraditional choice systems.
3.4 Open Enrollment
The pressures that affect whether schools compete for special needs stu-dents under traditional public school choice are magnified under open en-rollment within or across school districts. Not only is financial responsibil-ity for excess costs more difficult to assign, but officials may also have morescope for counseling students either in or out of their schools. Moreover,with a greater number of schooling options, it may simply become morecostly to guarantee special needs students FAPE at any given school.
This section provides evidence on two quite different open enrollmentsystems, those of the state of Minnesota and the city of Chicago. Whereas
88 Julie Berry Cullen and Steven G. Rivkin

Minnesota permits movement across districts, the Chicago program limitsstudents to movement across schools within the district. In addition, re-ceiving districts receive ample reimbursements for special education ser-vices in Minnesota, whereas there appears to be only a weak link betweenthe size and composition of special education programs and revenue allo-cated from the district for Chicago schools. Not surprisingly, the manifes-tation of open enrollment in Minnesota appears to have led to more activeparticipation of and competition for special education students.
3.4.1 Evidence from Minnesota
Most of the existing evidence on open enrollment comes from Min-nesota, which was the first state to introduce this type of choice legislationin 1990. In Minnesota, students can apply to transfer to any other districtin the state. Districts can only refuse to accept transfer students on the ba-sis of capacity constraints. State per-pupil revenue follows all students whochoose to travel, and any excess costs for services provided to special needsstudents are billed back to the district of residence. This type of financialarrangement greatly reduces any potential resistance to accepting transferstudents with special needs. At the same time, it increases incentives to tryto keep special needs students, because home districts largely lose controlof costs if these students choose to travel. Parent and school responses areconditioned, therefore, by what should be a relatively competitive specialeducation environment.
It appears that special needs students are in fact taking advantage ofchoice at rates similar to other students. Over the first four years of the pro-gram, special education participation rates doubled, rising from 5 percentto 10 percent of transfers between 1990–91 and 1993–94 (Lange, Ysseldyke,and Delaney 1995). In making their transfer decisions, parents of disabledstudents are sensitive to special education program characteristics. Basedon interviews with parents, Ysseldyke, Lange, and Gorney (1994) find thatparents of children with disabilities most often report that they opted totransfer in order to better meet their children’s special needs.13 Moreover,they find that 4 percent of parents with disabled children report transferringto obtain special education labels, whereas 3 percent transfer to shed labels.Parents of children with behavioral disorders are often simply looking for anew start.
Despite the fact that disabled students actively participate in open en-
The Role of Special Education in School Choice 89
13. In their analysis of school districts with particularly high gains or losses of disabled stu-dents, Lange, Ysseldyke, and Delane (1995) provide insight into the program characteristicsvalued by families. Parents do not seem to perceive higher special education quality as syn-onymous with lower pupil-staff ratios. Disabled children are more likely to transfer to schoolswith larger special education caseloads per teacher. However, districts that gain special edu-cation students demonstrate better home-school communication practices and a higher com-mitment to spending on special services.

rollment, there is some evidence that the choices of schools for nondisabledstudents lead to increased involuntary segregation. Jimerson (1998) ana-lyzes trends in special education populations before and after open enroll-ment was introduced. She finds a steady decrease in the fraction classifiedas disabled in districts that are primarily receiving districts, compared to amuch more erratic pattern for sending districts.
The variation in school districts’ experiences with special education andopen enrollment highlights other potential hazards. Lange, Ysseldyke, andDelaney (1995) find that districts that gain special education studentslargely respond by absorbing students into existing programs and increas-ing class size, thereby bearing few additional costs. Districts that lose dis-abled students, however, are not able to proportionately cut back on specialeducation staff because of the requirement to maintain minimum servicesfor the remaining students.14 Further, these home districts face escalatingcosts when any additional services are provided to transfer students due tothe lack of incentives for the district of attendance to control costs under thebill-back policy. Finally, districts find it very difficult to plan for low inci-dence populations because of the uncertainty in enrollment.
3.4.2 Evidence from Chicago
We provide additional evidence on special education participation ratesand stratification from the open enrollment program within the Chicagopublic school (CPS) district. The origin of the policy dates back to court-ordered desegregation in 1980. Currently, each high school student is as-signed to a default school based on residence and attendance area zones.Students can then apply to any one of the more than sixty high schools,which include magnet schools and career academies as well as more tradi-tional high schools. Most schools that are oversubscribed use a lottery toadmit students, although the most selective magnet schools rely on testscores.
Our analysis is based on the cohort of students enrolled in eighth gradein a CPS school in the spring of 1995.15 Of the 31,485 students in this cohort,only 81.0 percent enter a CPS high school in the following year. Four-fifthsof this attrition can be attributed to students who leave the CPS after eighthgrade. The majority of these students either switch to the private sector ormove outside of Chicago. Special education students leave at similar over-all rates as nondisabled students, but they are somewhat less likely to leave
90 Julie Berry Cullen and Steven G. Rivkin
14. Jimerson (1997) finds that special education expenditures per special needs student in-creased in districts with high student loss rates compared to districts with high gain rates. Thismay be consistent with the tendency of the more severely disabled to remain behind or with in-creased costs because of the bill-back policy, as she notes, and would also be consistent withdecreased economies of scale.
15. See Cullen, Jacob, and Levitt (2000) for a more detailed description of the policy and ofthe data.

to attend a Chicago private school (28.7 percent vs. 35.9 percent). The re-maining attrition is due to student retention. Whereas only 2.0 percent ofregular education students repeat eighth grade, 17.4 percent of specialneeds students do. Due to the dramatic difference in rates at which specialneeds and other students are held back, the fraction served in special edu-cation in eighth grade falls from 14.9 percent in the full eighth-grade sampleto 13.0 percent in the subsample that enters a CPS high school the follow-ing year.
We identify sixty-one high schools that serve regular populations. Thereare a variety of other schools and institutions that serve special populationsof secondary students, such as juvenile delinquents and other troubledyouths. Although only 1.2 percent of nondisabled students in our cohortsentering ninth grade attend one of these alternative schools, a dispropor-tionate share (5.9 percent) of special needs students attend alternativeschools that serve only special needs students. The students placed in thesemore isolated settings tend to have relatively severe disabilities. For ex-ample, most physically disabled students (69.6 percent) are assigned to spe-cial schools, compared to a negligible share (1.8 percent) of learning dis-abled students. The specialized instruction appropriate to students withsevere disabilities places some limits on the range of integrated choices thatis available to these students.
For the more than 24,000 students who attend one of the regular CPSschools, we consider the impact that open enrollment has on the ninth-grade concentration of students who were served in special education ineighth grade. To do this, we compare the actual distribution to that whichwould prevail under the counterfactual where all students attend their as-signed high school. Figure 3.6 shows that stratification by disability basedon residential choices is relatively weak, but the degree of stratification is in-creased by choice. Very little of this increase can be explained by the threeselective magnet schools that use test scores in admissions.
Table 3.5 shows that different patterns of participation in open enrollmentunderlie this shift toward greater segregation of disabled students. Whereasnondisabled students opt out of their assigned schools 52 percent of the time,special education students opt out only 36 percent of the time.16 Only one inten special needs students who opt out attends a school that is ranked in thetop fifth in terms of average achievement, compared to one in three of othertravelers. Surprisingly, both the least severely and most severely disabled
The Role of Special Education in School Choice 91
16. Controlling for individual and family demographic characteristics as well as residentialtract fixed effects explains only 20 percent of the difference between the rates at which specialneeds students and other students participate. Interestingly, when we control for eighth-grademath and reading test scores (most special education students take the exams), the participa-tion patterns of special needs students and equally low-achieving students are not significantlydifferent from one another. Although difficult to interpret because there may be systematicdifferences in observable characteristics across the groups, this could be evidence that there arenot specific barriers to special needs students over and above those for other low achievers.

Fig. 3.6 Distribution of special needs students across high schools within theChicago public school districtNotes: The sample is the full sample of 24,404 students who attended a CPS school foreighth grade in the spring of 1995 and attended a (nonspecial) CPS high school in the fall ofthe following year, as described in the text. Special education status is based on classificationin eighth grade, and the distributions are based on ninth-grade school assignments and en-rollments. The counterfactual with no choice calculates special education fractions given theschools to which students are assigned (Gini � 0.112). The distribution labeled “withchoice” is based on actual attendance patterns (Gini � 0.269). We also show the distributiongiven actual attendance patterns but excluding the three selective magnet schools that useachievement tests to determine admissions (Gini � 0.237).
Table 3.5 Opting Out of the Assigned Chicago Public School by Disability Type
% Opting Out of Assigned School To:
Any Other High- Other% of High Career Achieving High
Students School Academy School School
Not in special education in eighth grade 88.0 51.5 14.5 16.5 20.5
In special education in eighth grade 12.0 35.8 8.2 4.0 23.6
Learning disabled 9.0 33.8 8.0 2.7 23.1Emotionally/behaviorally
disturbed 1.3 28.2 7.0 0.3 20.9Speech/language impaired 0.8 52.3 12.8 12.8 26.7All other disabilities 0.9 52.3 7.4 14.8 30.1
Notes: The results are based on the cohort of students who entered a Chicago public high school in thefall of 1995 and who attended eighth grade in the prior year. We exclude students who attended specialschools, such as centers for juvenile delinquents and schools that only serve disabled students, as de-scribed in the text. The total number of students in the sample is 24,404. High-achieving schools are theschools in the highest fifth in terms of average eighth-grade test scores among the entering ninth-gradeclass. “Other” schools are high schools that are neither career academies nor high-achieving.

students are more likely to opt out than moderately disabled students, al-though the severely disabled students in this sample are a select group. Stu-dents who opt out tend to choose schools with smaller disability caseloadsregardless of disability status. Both disabled and nondisabled travelers wereinitially assigned to schools with average disability rates of approximately16 percent.17 By traveling, disabled students attend programs with case-loads that are 2.3 percentage points lower, and nondisabled students lowertheir exposure to disabled students by 5.7 percentage points on average.
The evidence from Chicago presents a mixed picture for special educa-tion students. On one hand, disabled students are actively participating inopen enrollment, with more than one in three students with disabilities opt-ing to attend an alternative high school. On the other hand, these studentsare participating at significantly lower rates and attending schools withlower average achievement than students not classified as disabled.
The financial incentives schools face within CPS are difficult to identify.The district has a policy of distributing more funds to small schools andschools with more students who qualify for special programs, such as dis-abled students. However, observable student program participation ratesand other student and school characteristics explain relatively little of thevariation in per-pupil expenditures across schools.18 It appears that the tiebetween special education program size and funding is weak.
3.5 Charter Schools
Charter schools are becoming increasingly prevalent, with over 2,300schools in operation in thirty-four states and the District of Columbia in thebeginning of fiscal year 2002 (Center for Education Reform 2002). In orderto offer innovative alternatives to traditional public schools, charter schoolsare granted waivers from many state and local regulations. However, likeany other public school, they must be in compliance with federal civil rightslegislation (Heubert 1997).19 These federal regulations may have a profoundinfluence on instruction and operation, yet most states have not articulatedhow they are to be implemented in the charter school context (Fiore andCashman 1998). Not surprisingly, charter school applicants and operatorstend to have very little knowledge of what constitutes discrimination, of theprocedures involved in providing FAPE, and of how the services are funded(McKinney 1996; Powell et al. 1997; Urhan and Stewart 1994).
The Role of Special Education in School Choice 93
17. This disability share is higher than the average in the full sample because a school’s frac-tion of disabled is based on the status of students who actually attend, and no students are as-signed to certain magnet and vocational schools, so these schools are excluded.
18. A regression of per-pupil special education expenditures on the share of enrollmentwithin each detailed disability category has an adjusted R-squared of 0.32, suggesting that thereimbursement is not very strongly correlated with caseload characteristics.
19. Charter schools that are independent local education agencies (LEAs) have full proce-dural and financial responsibility for implementing special education programs, whereas thoseattached to LEAs negotiate with the sponsoring agency.

The regulations that accompany students with disabilities potentiallyconflict with the type of flexibility that characterizes charter schools.20
Rhim and McLaughlin (2000) quote one state charter school director assaying, “The biggest challenge is that special education law and ideology isbased on the thought that all schools need to be all things to all people, . . .but we have allowed charters to focus their program and not be all things toall people” (22). Legally, charter schools must ensure students with disabil-ities equal consideration for admission, although interpretation of the lawvaries by state. Some states require schools to accept all students who wishto attend and to use a lottery if a school is oversubscribed.21 Others permitschools to use selection criteria, such as test scores, that are consistent withthe school’s purpose. The possibility for charter schools to “cream-skim”the best students has fueled concerns about charter schools serving as eliteacademies (Szabo and Gerber 1996; Fuller and Elmore 1996).
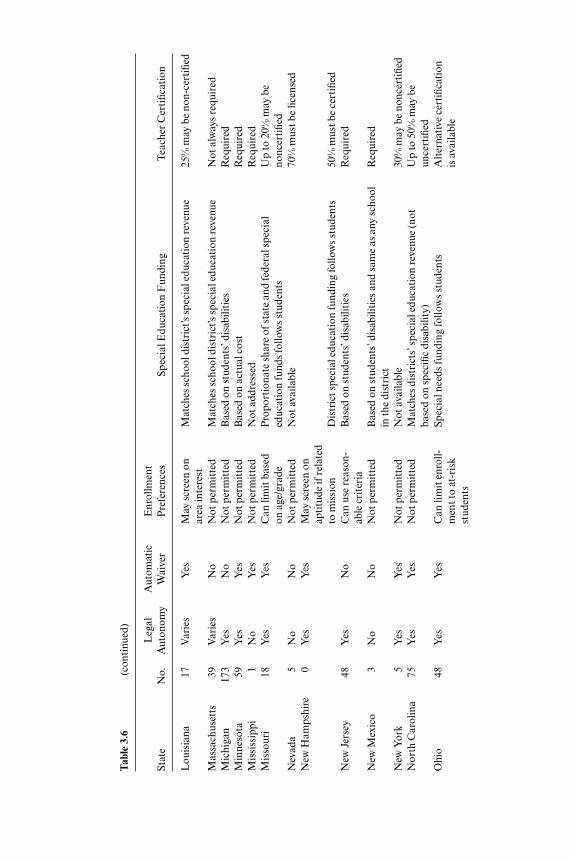
Once students are enrolled, charter schools must also abide by federallaws regarding special education provision, including the requirements toidentify students with special needs and to provide appropriate services. Al-though charter schools are often not required to hire certified regular teach-ers, they must provide special education services using certified teachers.Table 3.6 summarizes these and other current state charter school provi-sions that most affect the degree to which serving a disabled student is anencumbrance to a charter school relative to serving a nondisabled student.
There has also been widespread concern about the budgetary impact ofspecial education on charter schools. These schools tend to be small, andper-pupil funding is often below costs (Bierlein and Fulton 1996). AlthoughIDEA requires states to distribute funds to charter schools in the same wayas to other schools, local resources are typically negotiated. Compared totraditional schools and school districts, charter schools have a limited abil-ity to absorb unexpected costs associated with high disability rates or lowincidence disabilities, in part because they do not have the same access togeneral operating funds and cooperative arrangements that can help tosmooth costs (Buechler 1996). Independent charter schools are especiallyvulnerable because, by default, they bear the costs of severely disabled stu-dents who require expensive placements. To mitigate the potential destabi-lizing impact of special education, many states have implemented schemesthat transfer some or all of the expenditure risk to traditional local educa-tion agencies.22
94 Julie Berry Cullen and Steven G. Rivkin
20. Ahearn (1999) and Rhim and McLaughlin (2000) provide thorough discussions of thetension between the special education and charter school environments.
21. In order to receive federal funds, charter schools must use a lottery to determine admis-sion.
22. For example, Massachusetts requires districts of residence to cover the costs of any res-idential placements. Minnesota charters are independent LEAs, but they are able to bill backany excess special education costs to the district of residence. Also, some charter schools inColorado use prospective payment, whereby charter schools pay home districts a fixed fee per

Tab
le 3
.6S
tate
Cha
rter
Sch
ool P
rovi
sion
s R
elev
ant t
o S
peci
al E
duca
tion
Leg
alA
utom
atic
Enr
ollm
ent
Stat
eN
o.A
uton
omy
Wai
ver
Pre
fere
nces
Spec
ial E
duca
tion
Fun
ding
Tea
cher
Cer
tifi
cati
on
Ala
ska
17N
oN
oN
ot p
erm
itte
dM
atch
es d
istr
ict’s
spe
cial
edu
cati
on r
even
ue (c
onst
ant
Req
uire
dac
ross
dis
abili
ties
)A
rizo
na35
2Y
esY
esN
ot p
erm
itte
dN
o ad
diti
onal
fund
ing
for
low
-cos
t dis
abili
ties
/N
ot r
equi
red
wei
ghti
ng s
yste
m to
fund
hig
her-
cost
stu
dent
sA
rkan
sas
0N
oN
oN
ot a
ddre
ssed
Neg
otia
ted
wit
h sc
hool
dis
tric
tR
equi
red
Cal
iforn
ia23
9Y
esY
esN
ot p
erm
itte
dN
egot
iate
d w
ith
scho
ol d
istr
ict
Req
uire
dC
olor
ado
65N
oN
oN
ot p
erm
itte
dN
egot
iate
d w
ith
scho
ol d
istr
ict
Req
uire
d (b
ut o
ften
wai
ved)
Con
nect
icut
16N
oN
oN
ot p
erm
itte
dD
istr
ict o
f res
iden
ce p
ays
actu
al c
osts
if c
hart
er s
choo
l 50
% m
ust h
ave
regu
lar
prov
ides
ser
vice
/oth
erw
ise
nego
tiat
edce
rtifi
cati
onD
elaw
are
5Y
esY
esC
an s
cree
n on
B
ased
on
stud
ents
’ dis
abili
ties
Exc
epti
ons
may
be
mad
ein
tere
st o
r ab
ility
Dis
tric
t of
31V
arie
sY
esC
an s
cree
n on
B
ased
on
stud
ents
’ dis
abili
ties
Not
req
uire
dC
olum
bia
area
of f
ocus
Flo
rida
111
Yes
No
Not
per
mit
ted
Bas
ed o
n st
uden
ts’ d
isab
iliti
esN
ot r
equi
red
Geo
rgia
32N
oY
esN
ot p
erm
itte
dB
ased
on
stud
ents
’ dis
abili
ties
and
sam
e as
any
sch
ool
in th
e di
stri
ctSp
ecifi
ed in
cha
rter
Haw
aii
2N
oY
esN
ot a
pplic
able
Bas
ed o
n st
uden
ts’ d
isab
iliti
es a
nd s
ame
as a
ny s
choo
lR
equi
red
Idah
o8
No
Yes
Not
app
licab
leU
ses
Idah
o co
de to
cal
cula
te fu
ndin
g ba
sed
on
Req
uire
dsu
ppor
t uni
tsIl
linoi
s19
Yes
Yes
Not
per
mit
ted
Dis
tric
t of r
esid
ence
pay
s ac
tual
cos
ts if
cha
rter
sch
ool
Not
req
uire
dpr
ovid
es s
ervi
ce/o
ther
wis
e ne
goti
ated
Kan
sas
15N
oN
oSp
ecifi
ed in
B
ased
on
stud
ents
’ dis
abili
ties
and
sam
e as
any
May
gra
nt w
aive
rsch
arte
r in
the
dist
rict
(con
tinu
ed)
Tab
le 3
.6(c
onti
nued
)
Leg
alA
utom
atic
Enr
ollm
ent
Stat
eN
o.A
uton
omy
Wai
ver
Pre
fere
nces
Spec
ial E
duca
tion
Fun
ding
Tea
cher
Cer
tifi
cati
on
Lou
isia
na17
Var
ies
Yes
May
scr
een
on
Mat
ches
sch
ool d
istr
ict’s
spe
cial
edu
cati
on r
even
ue25
% m
ay b
e no
n-ce
rtifi
edar
ea in
tere
stM
assa
chus
etts
39V
arie
sN
oN
ot p
erm
itte
dM
atch
es s
choo
l dis
tric
t’s s
peci
al e
duca
tion
rev
enue
Not
alw
ays
requ
ired
Mic
higa
n17
3Y
esN
oN
ot p
erm
itte
dB
ased
on
stud
ents
’ dis
abili
ties
Req
uire
dM
inne
sota
59Y
esY
esN
ot p
erm
itte
dB
ased
on
actu
al c
ost
Req
uire
dM
issi
ssip
pi1
No
Yes
Not
per
mit
ted
Not
add
ress
edR
equi
red
Mis
sour
i18
Yes
Yes
Can
lim
it b
ased
P
ropo
rtio
nate
sha
re o
f sta
te a
nd fe
dera
l spe
cial
U
p to
20%
may
be
on a
ge/g
rade
educ
atio
n fu
nds
follo
ws
stud
ents
nonc
erti
fied
Nev
ada
5N
oN
oN
ot p
erm
itte
dN
ot a
vaila
ble
70%
mus
t be
licen
sed
New
Ham
pshi
re0
Yes
Yes
May
scr
een
on
apti
tude
if r
elat
ed
to m
issi
onD
istr
ict s
peci
al e
duca
tion
fund
ing
follo
ws
stud
ents
50%
mus
t be
cert
ified
New
Jer
sey
48Y
esN
oC
an u
se r
easo
n-B
ased
on
stud
ents
’ dis
abili
ties
Req
uire
dab
le c
rite
ria
New
Mex
ico
3N
oN
oN
ot p
erm
itte
dB
ased
on
stud
ents
’ dis
abili
ties
and
sam
e as
any
sch
ool
Req
uire
din
the
dist
rict
New
Yor
k5
Yes
Yes
Not
per
mit
ted
Not
ava
ilabl
e30
% m
ay b
e no
ncer
tifi
edN
orth
Car
olin
a75
Yes
Yes
Not
per
mit
ted
Mat
ches
dis
tric
ts’ s
peci
al e
duca
tion
rev
enue
(not
U
p to
50%
may
be
base
d on
spe
cifi
c di
sabi
lity)
unce
rtifi
edO
hio
48Y
esY
esC
an li
mit
enr
oll-
Spec
ial n
eeds
fund
ing
follo
ws
stud
ents
Alt
erna
tive
cer
tifi
cati
on
men
t to
at-r
isk
is a
vaila
ble
stud
ents

Okl
ahom
a0
No
No
Not
per
mit
ted
Not
ava
ilabl
eSp
ecifi
ed in
cha
rter
Ore
gon
4V
arie
sY
esN
ot p
erm
itte
dN
ot a
vaila
ble
50%
mus
t be
licen
sed
Pen
nsyl
vani
a47
Var
ies
Yes
Can
scr
een
base
d Sp
ecia
l nee
ds fu
ndin
g fo
llow
s st
uden
ts (n
ot b
ased
on
Up
to 2
5% m
ay b
e on
are
a of
focu
s sp
ecifi
c di
sabi
lity)
; can
app
ly fo
r tr
ansi
tion
al s
tate
un
cert
ified
or o
ther
rea
son-
gran
ts if
a s
tude
nt h
as a
bud
geta
ry im
pact
able
cri
teri
aR
hode
Isl
and
2N
oN
oM
ay u
se a
ca-
Mat
ches
dis
tric
t’s s
peci
al e
duca
tion
rev
enue
Req
uire
dde
mic
sta
ndar
dsa
Sout
h C
arol
ina
8V
arie
sY
esN
ot p
erm
itte
dB
ased
on
stud
ents
’ dis
abili
ties
Up
to 2
5% m
ay b
e un
cert
ified
Tex
as16
7V
arie
sY
esN
o en
rollm
ent
Bas
ed o
n st
uden
ts’ d
isab
iliti
esN
ot r
equi
red
pref
eren
ces
Uta
h3
No
No
Not
per
mit
ted
Not
ava
ilabl
eM
ay h
ave
alte
rnat
ive
cert
ifica
tion
Vir
gini
a0
No
No
Not
per
mit
ted
Tre
ated
as
publ
ic s
choo
l wit
h fe
es n
egot
iate
dR
equi
red
Wis
cons
in55
Yes
Yes
Can
use
at-
No
addi
tion
al fu
ndin
g fo
r lo
w-c
ost s
tude
nts/
wei
ghti
ngSp
ecia
l lic
ense
s av
aila
ble
risk
cri
teri
asy
stem
to p
rovi
de fu
nds
for
high
-cos
t dis
abili
ties
Wyo
min
g0
No
No
Can
not b
e ba
sed
Neg
otia
ted
wit
h sp
onso
r di
stri
ctR
equi
red
only
on
abili
ty
Not
es:T
he so
urce
for t
his i
nfor
mat
ion
is th
e C
ente
r for
Edu
cati
on R
efor
m’s
char
ter s
choo
l leg
isla
tion
pro
file
s [ht
tp:w
ww
.edr
efor
m.c
om/c
hart
er_s
choo
ls/la
ws]
. The
seco
nd c
olum
n sh
ows t
he n
umbe
r of c
hart
er sc
hool
s in
oper
atio
n as
of s
prin
g 20
00. T
he th
ird
colu
mn
indi
cate
s whe
ther
cha
rter
s are
lega
lly a
uton
omou
s. T
he fo
urth
colu
mn
indi
cate
s w
heth
er c
hart
ers
rece
ive
an a
utom
atic
wai
ver
from
mos
t sta
te e
duca
tion
law
s, r
egul
atio
ns, a
nd p
olic
ies.
The
rem
aini
ng c
olum
ns d
escr
ibe
polic
ies
rela
ted
to e
nrol
lmen
t dec
isio
ns, f
undi
ng, a
nd te
ache
r ce
rtifi
cati
on. T
he s
peci
al e
duca
tion
fund
ing
fact
s sh
own
com
bine
info
rmat
ion
from
the
Cen
ter
for
Edu
cati
onR
efor
m a
nd V
entu
reso
me
Cap
ital
: Sta
te C
hart
er S
choo
l Fin
ance
Sys
tem
s(U
.S. D
epar
tmen
t of E
duca
tion
200
0).
a The
com
bine
d fr
acti
on o
f spe
cial
nee
ds, L
EP,
and
free
lunc
h m
ust e
qual
the
frac
tion
in th
e di
stri
ct.

Despite the administrative and financial burdens of providing special ed-ucation, the evidence on whether special education students have equal ac-cess to charter schools in practice is encouraging.23 Whereas early studiesfound that disabled students were participating at rates far below other stu-dents (e.g., McKinney 1996), the most recent National Charter SchoolStudy (U.S. Department of Education 1999) reports that the gap has closedas more charter schools have opened. In the states studied, 8 percent ofcharter school enrollment is classified as disabled, compared to 11 percentin traditional public schools. There is substantial heterogeneity across char-ter schools, with start-ups being less likely to serve special needs studentsand some schools specifically targeting them. There is also heterogeneityacross disability type, with more severely disabled students choosing to re-main in traditional public schools.
Part of the remaining discrepancy between caseloads at charter and tra-ditional schools can be explained by differences in classification policies.Finn, Manno, and Bierlein (1996) and Vanourek et al. (1997) discover thata large proportion of students who would have been served in special edu-cation in their former school are not in the chosen charter school. Consis-tent with this, some parents report choosing charter schools to escape thestigma of labels and to take advantage of effective mainstreaming options(Vanourek et al. 1997).
Finally, there is no direct evidence of which we are aware that shows howspecial education programs affect the decisions of regular education stu-dents to attend a charter school. Indirect evidence through charter schoollocation decisions is mixed.24
3.6 Private Schools and Vouchers
Private schools have a dual relationship with special education. On theone hand, public school administrators regularly contract with privateschools to educate students with severe disabilities who cannot be ade-quately served in public schools. A number of private schools have beenestablished specifically to accommodate low-incidence, severely disabledpopulations. On the other hand, most other private schools have admis-
98 Julie Berry Cullen and Steven G. Rivkin
pupil or per disabled student to cover any excess special education costs (McLaughlin, Hen-derson, and Ullah 1996). Venturesome Capital: State Charter School Finance Systems (U.S. De-partment of Education 2000) provides an overview of how closely each state’s system matchesthe costs of providing special education in charter schools.
23. See Fiore, Warren, and Cashman (1999) for a recent review of the existing empirical ev-idence pertaining to special education and charter schools.
24. Glomm, Harris, and Lo (2001) uncover a positive correlation between the number ofcharter schools in an area and the level of per-pupil special education expenditure in Michi-gan school districts. For Texas, Grosskopf, Hayes, and Taylor (2000) find an insignificant re-lationship between the proportion of students in special education and the number of charterschools.

sions requirements, only half offer remedial reading and math, and very fewoffer special education services (McLaughlin and Broughman 1997).
Fox (1999) argues that the fact that a market has evolved to educate se-verely disabled students implies that special needs students will not be leftbehind in a voucher system. However, students served in private special ed-ucation settings are not representative of the typical student with specialneeds. Not only do these severely disabled students make up a negligibleshare of the disabled population, but the intensive equipment and servicesinvolved necessitate that students with similar disabilities be pooled in sep-arate instructional or residential settings.25 For other disabled students, thistype of pooling would be in direct conflict with the philosophy of IDEA thatrequires students to be served in the least restrictive environment possible.When a student with disabilities attends a private school that serves a gen-eral student population, it is unclear how market pressures and federal reg-ulations interact, because it is public and not private schools that areresponsible for guaranteeing FAPE.
The precise obligations of public schools for students with disabilitieswho voluntarily enroll in private schools have not been fully established.Whereas the full costs of educating disabled students assigned to privateschool settings are paid from federal, state, and local funds, those whochoose to opt out of the public sector are not protected to the same degree.IDEA (1990) requires public schools to ensure that these students have “eq-uitable” access to special education services, so public schools cannot cate-gorically deny private school students services (Linden 1995). However,schools have discretion in deciding which private students will be served,which services will be provided, and where those services will be provided(Osborne 1999).26 The 1997 amendments to IDEA offered a quantitativeminimum standard by requiring local school districts to expend at least aproportionate share of federal IDEA funds on services for private schoolstudents.
Given the stark contrast between public and private schools’ roles, onlycarefully designed voucher programs will lead to expanded choice optionsfor disabled students. If private schools are not required to serve studentswith disabilities, they are unlikely to admit special needs students unless theschools receive full compensation for all financial and external costs of pro-viding special education services. More generally, theoretical models pre-dict that vouchers will lead to increased segregation by ability if the vouch-
The Role of Special Education in School Choice 99
25. Students served in private settings make up 1.8 percent of the special education popula-tion, and average contracted tuitions for day and residential placements are $22,000 and$66,000, respectively (Fox 1999).
26. Although private school students are not entitled to any given services, the amendmentsrequire public school districts to identify and evaluate all resident students with disabilitieswho attend private schools. A recent legal debate has centered on whether public schools canprovide special education services on site at parochial schools without violating the Constitu-tion. See Katsiyannis and Maag (1998) for a detailed discussion.

ers do not vary to compensate for undesirable student characteristics(Epple and Romano 2000; Bearse, Glomm, and Ravikumar 2000). On theother hand, the requirement that all participating schools serve disabled stu-dents would likely limit the number of schools willing to accept vouchers ifcompensation is inadequate.
Existing evidence does suggest that there are barriers to the participationof special education students in voucher programs. Based on interviewswith 200 administrators in urban areas across the United States, Kapel,Faison, and Gallagher (1995) find that private schools would be likely to re-ject many special education students. Two-thirds of the schools in theirsample use testing for academic ability in admissions and most would ex-clude students who lack academic readiness or have emotional or behav-ioral problems. A few schools reported that they would categorically ex-clude disabled students. Results from early voucher experiments supportthese qualitative findings. Peterson, Myers, and Howell (1999) report thatonly 8 percent of the students enrolled in the Horizon Scholarship Programin Texas were learning disabled, compared to 16 percent in the public schooldistrict. Only 1.5 percent of participants were physically disabled, com-pared to 4.5 percent of nonparticipants. Peterson, Howell, and Greene(1999) find similar patterns of underenrollment in the Cleveland Scholar-ship program. Parents of disabled students who chose to remain in thepublic sector were more likely to report that programs were available to ad-dress their special needs, testimony that echoes parents’ sentiments fromnational public opinion polls comparing public and private schools (Scon-yers 1996).
Although the above programs do not specifically target disabled stu-dents, Florida introduced a plan that does in 2000.27 Through the Oppor-tunity Scholarships program, general education students are able to obtainvouchers to attend private schools as long as they are currently attending alocal school that is failing. In contrast, special needs students can accessMcKay Scholarships if their parents are dissatisfied with their public schoolfor any reason. The vouchers are funded at the minimum of the privateschool tuition or the sending district’s per-pupil special education revenueunder the state school finance formula. Participating private schools mustagree to accept the state scholarship funds as full tuition and fees. Nearly1,000 disabled students took advantage of this program in the first year, andthe number is expected to increase to more than 7,000 (about 1.6 percent ofdisabled students) once the program is fully phased in. At this time it is tooearly to judge the program’s impact.
Although the limited number of voucher programs has generally not
100 Julie Berry Cullen and Steven G. Rivkin
27. See [http:/www.opportunityschools.org] for more details on the Florida voucher pro-gram.
been providing opportunities that are equally attractive or accessible to spe-cial education students, this does not mean that private schools cannot pro-vide viable alternatives to public special education. Particularly if schoolparticipation in voucher programs were contingent on full compliance withIDEA, many private schools would probably participate if disabilities werepriced correctly. Legal responsibilities for private schools are likely to ex-pand for states that embrace public funding of private schooling.
3.7 Conclusion
The additional costs, real or perceived peer influences, concerns aboutoverclassification, and the potential for discrimination and segregation ofthe disabled combine to make special education the most litigious area andone of the most politicized areas of education in the United States. How-ever, amidst the concerns about costs and potential negative peer spillovers,it is important not to lose sight of the fact that government-financed specialeducation insures that disabled children receive appropriate interventionswithout imposing severe financial burdens on families. There is also strongevidence that the interventions significantly raise achievement for studentsclassified as disabled (Hanushek, Kain, and Rivkin forthcoming).
As with any type of insurance, there is tension between cost containmentand the provision of high-quality services, and expanded choice does notfundamentally alter the key issues. Whether more choice will lead to less in-voluntary segregation of students with disabilities, fewer inappropriateclassifications as disabled, and more efficient and higher-quality special ed-ucation programs depends in large part on the ability of policymakers tomatch actual costs of service provision with the funds provided. Any devi-ations from optimal pricing will be manifested in over- or underprovisionand other undesirable outcomes.
One potential nonfinancial solution is the designation of a central agencythat does not have a budgetary interest in how students are labeled to assessstudents and design individual education programs. However, such a solu-tion is probably not practical in the context of special education. Unless allstudents can be screened for mild disabilities, as they are for hearing im-pairments, someone has to start the referral process. The need for flexibilityin designing treatments and the lack of simple screening instruments neces-sitate that teachers and other personnel involved in the day-to-day school-ing operations play an active role in referring students for special services.Moreover, a great deal of uncertainty remains about the success of particu-lar types of interventions and the appropriateness of special services for arange of marginal students. Perhaps one of the greatest benefits of increas-ing schooling options for special education students will come throughlearning about the types of programs that make the most difference.
The Role of Special Education in School Choice 101

Appendix
Table 3A.1 Gini Coefficient Corresponding to Segregation Curves for Figures 3.1 and 3.2
Third-Grade Peer Characteristic
% %Special Low % %
Aggregation Level Education Income Hispanic Black
School 0.32 0.36 0.52 0.67Catchment area 0.27 0.33 0.50 0.64District 0.23 0.28 0.45 0.55
Table 3A.2 Gini Coefficients Corresponding to Segregation Curves for Figures 3.3,3.4, and 3.5
Third-Grade Peer Seventh-Grade PeerCharacteristic Characteristic
% % % %Disabled Ever Disabled Disabled Ever Disabled
Learning disabledSchool level 0.36 0.30 0.27 0.25Catchment area 0.30 0.26 0.27 0.25District level 0.25 0.22 0.23 0.22
Emotionally disturbedSchool level 0.80 0.67 0.55 0.57Catchment area 0.69 0.58 0.55 0.57District level 0.54 0.49 0.46 0.48
Physically disabledSchool level 0.87 0.86 0.71 0.71Catchment area 0.75 0.73 0.70 0.71District level 0.51 0.51 0.51 0.52
All disabilitiesSchool level 0.32 0.23 0.21 0.19Catchment area 0.27 0.19 0.21 0.19District level 0.23 0.16 0.16 0.16

Table 3A.3 Special Education Transition Rates by Grade, Disability, and Family Income
Entering Grade
Not Eligible for Subsidized Eligible for SubsidizedLunch (%) Lunch (%)
4 5 6 7 4 5 6 7
Learning disabledNot classified in either year 93.6 93.6 93.4 93.3 88.8 88.2 87.5 87.0Classified in both years 4.9 5.6 6.0 6.0 8.5 10.2 11.6 12.0Enters special education 1.2 0.5 0.3 0.3 2.3 1.2 0.5 0.4Exits special education 0.3 0.3 0.4 0.5 0.4 0.4 0.5 0.6
Emotionally disturbedNot classified in either year 99.4 99.4 99.3 99.2 98.8 98.7 98.5 98.2Classified in both years 0.4 0.5 0.6 0.7 0.9 1.1 1.3 1.4Enters special education 0.1 0.1 0.1 0.1 0.3 0.1 0.1 0.1Exits special education 0.0 0.0 0.0 0.1 0.0 0.0 0.1 0.2
Physically disabledNot classified in either year 99.0 98.9 98.9 98.7 99.1 99.1 99.0 98.8Classified in both years 0.8 0.9 1.0 1.1 0.7 0.8 0.9 1.0Enters special education 0.2 0.1 0.1 0.1 0.1 0.1 0.1 0.1Exits special education 0.0 0.0 0.0 0.1 0.0 0.0 0.0 0.1
All disabilitiesNot classified in either year 85.6 86.8 87.7 88.6 80.1 79.4 79.2 79.5Classified in both years 9.2 10.2 9.8 9.5 13.6 16.5 17.7 17.5Enters special education 2.8 1.4 1.1 0.8 4.6 2.8 1.8 1.3Exits special education 2.3 1.6 1.4 1.2 1.7 1.3 1.4 1.6
Table 3A.4 Change in School Percent Classified as Disabled in Prior Year, bySpecial Education Transition, Mobility, and Disability Type
Special Education Transition (%)
Not Classified Classified Enters ExitsEither in Both Special SpecialYear Years Education Education
Special educationSame school 0.3 0.2 0.6 –0.1Within district 0.2 0.0 0.3 –0.3Between district 0.3 0.1 0.5 0.0All 0.3 0.2 0.5 –0.1

References
Ahearn, E. 1999. Charter schools and special education: A report on state policies.Alexandria, Va.: National Association of State Directors of Special Education.
Allison, P. 1978. Measures of inequality. American Sociological Review 43 (6): 865–80.
Bearse, P., G. Glomm, and B. Ravikumar. 2000. On the political economy of means-tested education vouchers. European Economic Review 44:904–51.
Bierlein, L., and M. Fulton. 1996. Emerging issues in charter school financing. Den-ver, Colo.: Education Commission of the States.
Buechler, M. 1996. Charter schools: Legislation and results after four years. Bloom-ington, Ind.: Indiana Education Policy Center, School of Education, IndianaUniversity.
Center for Education Reform. 2002. Charter school highlights and statistics. Avail-able at [http://www.edreform.com/pubs/chglance.htm]. 1 June 2002.
Chambers, J. 1998. The patterns of expenditures on students with disabilities: Amethodological and empirical analysis. In Funding special education, ed. T. Par-rish, J. Chambers, and C. Guarino, 89–123. Thousand Oaks, Calif.: Corwin Press.
Cullen, J. 1997. The incidence and incentives of special education policies. Ph.D.diss., Massachusetts Institute of Technology.
———. Forthcoming. The impact of fiscal incentives on student disability rates.Journal of Public Economics.
Cullen, J., B. Jacob, and S. Levitt. 2000. The impact of school choice on student out-comes: An analysis of the Chicago public schools. NBER Working Paper no.7888. Cambridge, Mass.: National Bureau of Economic Research.
Epple, D., and R. Romano. 2000. Educational vouchers and cream-skimming.Carnegie-Mellon University, Department of Economics; University of Florida,Department of Economics. Unpublished manuscript.
Finn, C., B. Manno, and L. Bierlein. 1996. Charter schools in action: What have welearned? Washington, D.C.: Hudson Institute.
Fiore, T., and E. Cashman. 1998. Review of charter school legislation provisions re-lated to students with disabilities. Washington, D.C.: Department of Education.
Fiore, T., S. Warren, and E. Cashman. 1999. Charter schools and students with dis-abilities: Review of existing data. Research Triangle Park, N.C.: Research Tri-angle Institution.
Fox, J. 1999. Sending public school students to private schools. Policy Review 93:25–29.
Fuller, B., and R. Elmore. 1996. Who chooses? Who loses? Cultures, institutions, andthe unequal effects of school choice. New York: Teachers College Press.
Glomm, G., D. Harris, and T. Lo. 2001. Charter school location. Indiana Univer-sity, Department of Economics; Economic Policy Institute; e-progress, Inc. Un-published manuscript.
Grosskopf, S., K. Hayes, and L. Taylor. 2000. Competition and efficiency: The im-pact of charter schools on public school performance. Oregon State University,Department of Economics; Southern Methodist University, Department of Eco-nomics; Federal Reserve Bank of Dallas. Unpublished manuscript.
Hanushek, E., J. Kain, and S. Rivkin. Forthcoming. Does special education raiseacademic achievement for students with disabilities? Review of Economics andStatistics.
Hanushek, E., and S. Rivkin. 1997. Understanding the twentieth-century growth inU.S. school spending. Journal of Human Resources 32 (1): 35–68.
104 Julie Berry Cullen and Steven G. Rivkin

Heubert, J. 1997. School without rules? Charter schools, federal disability law, andthe paradoxes of deregulation. Harvard Civil Rights-Civil Liberties Law Review32:301–53.
Jimerson, L. 1997. Effects of school choice in rural districts: The Minnesota experi-ence. Ph.D. diss., University of Vermont, Burlington.
———. 1998. The students “left behind”: School choice and social stratification innon-urban districts. Paper presented at the American Educational Research As-sociation Annual Meeting. 13–17 April, San Diego, California.
Kane, D., and P. Johnson. 1993. Vermont’s Act 230: A new response to meeting thedemands of diversity. Montpelier, Vt.: Vermont Department of Education.
Kapel, D., C. Faison, and J. Gallagher. 1995. School choice: Education’s trickledown theory for urban students attending private schools? Rowan College of NewJersey, College of Education. Unpublished manuscript.
Katsiyannis, A., and J. Maag. 1998. Serving children with disabilities in private andparochial schools: Issues and recommendations. Remedial and Special Education19 (5): 285–90.
Lange, C., J. Ysseldyke, and T. Delaney. 1995. Open enrollment’s impact on school dis-tricts when students with disabilities transfer schools. Enrollment Options for Stu-dents with Disabilities Project Research Report no. 14. Minneapolis, Minn.: Uni-versity of Minnesota.
Lankford, H., and J. Wyckoff. 1996. The allocation of resources to special educationand regular instruction. Holding schools accountable: Performance-based reform ineducation, ed. Helen Ladd, 221–57. Washington, D.C.: Brookings Institution.
Linden, M. 1995. Special education services and parochial schools: Constitutionalconstraints and other policy considerations. Journal of Law and Education 24 (3):345–75.
McKinney, J. 1996. Charter schools: A new barrier for children with disabilities. Ed-ucation Leadership 54 (2): 22–25.
McLaughlin, D., and S. Broughman. 1997. Private schools in the United States: Astatistical profile, 1993–94. Washington, D.C.: National Center for EducationStatistics Survey Report.
McLaughlin, M., K. Henderson, and H. Ullah. 1996. Charter schools and studentswith disabilities. Alexandria, Va.: Center for Policy Research on the Impact ofGeneral and Special Education Reform.
Moore, M., E. Strang, M. Schwartz, and M. Braddock. 1988. Patterns in special ed-ucation service delivery and cost. Washington, D.C.: Decision Resources Group.
Osborne, A. 1999. IDEA ’97: Providing special education services to students vol-untarily enrolled in private schools. Journal of Special Education 33 (4): 224–31.
Parrish, T., F. O’Reilly, I. Duenas, and J. Wolman. 1997. State special education fi-nance systems, 1994–95. Palo Alto, Calif.: American Institutes for Research.
Peterson, P., W. Howell, and J. Greene. 1999. An evaluation of the Clevelandvoucher program after two years. Cambridge, Mass.: Program on Education Pol-icy and Governance.
Peterson, P., D. Myers, and W. Howell. 1999. An evaluation of the Horizon schol-arship program in the Edgewood independent school district, San Antonio,Texas: The first year. Cambridge, Mass.: The Program on Education Policy andGovernance.
Powell, J., J. Blackorby, J. Marsh, K. Finnegan, and L. Anderson. 1997. Evaluationof charter school effectiveness. Menlo Park, Calif.: SRI International.
Rhim, L., and M. McLaughlin. 2000. Charter schools and special education: Bal-ancing disparate visions. Washington, D.C.: U.S. Department of Education, Officeof Special Education Programs.
The Role of Special Education in School Choice 105

Sconyers, N. 1996. What parents want: A report on parents’ opinions about publicschools. Johns Hopkins University, Center on Families, Communities, Schools,and Children’s Learning.
Singer, J., J. Palfrey, J. Butler, and D. Walker. 1989. Variation in special educationclassification across school districts: How does where you live affect what you arelabeled? American Educational Research Journal 26:261–81.
Szabo, J., and M. Gerber. 1996. Special education and the charter school movement.Special Education Leadership Review 3:135–48.
Urhan, S., and D. Stewart. 1994. Minnesota charter schools: A research report. Min-neapolis, Minn.: House Research Department.
U.S. Department of Education (DOE). 1999. The state of charter schools: Third-yearreport. Washington, D.C.: Office of Educational Research and Improvement.
———. 2000. Venturesome capital: State charter school finance systems. Washing-ton, D.C.: Office of Educational Research and Improvement.
Vanourek, G., B. Manno, C. Finn, and L. Bierlein. 1997. The educational impact ofcharter schools, final report, part V. Washington, D.C.: Hudson Institute.
Verstegen, D. 1994. Fiscal provisions of the Individuals with Disabilities EducationAct: Historical overview. Center for Special Education Finance Policy Paper no.2. Palo Alto, Calif.: American Institutes for Research.
Ysseldyke, J., C. Lange, and D. Gorney. 1994. Parents of students with disabilitiesand open enrollment: Characteristics and reasons for transfer. Exceptional Chil-dren 60 (4): 359–72.
106 Julie Berry Cullen and Steven G. Rivkin