the role of natural gas in europe’s electricity sector
TRANSCRIPT
BY TIM BOERSMA, TATIANA MITROVA, JOHANA TYPOLTOVA, ANNA GALKINA, AND FEDOR VESELOV AUGUST 2018
THE ROLE OF NATURAL GAS IN EUROPE’S ELECTRICITY SECTOR THROUGH 2030

ABOUT THE CENTER ON GLOBAL ENERGY POLICY
The Center on Global Energy Policy provides independent, balanced, data-driven analysis to help policymakers navigate the complex world of energy. We approach energy as an economic, security, and environmental concern. And we draw on the resources of a world-class institution, faculty with real-world experience, and a location in the world’s finance and media capital. Visit us at www.energypolicy.columbia.edu
@ColumbiaUenergy
ABOUT THE SCHOOL OF INTERNATIONAL AND PUBLIC AFFAIRS
SIPA’s mission is to empower people to serve the global public interest. Our goal is to foster economic growth, sustainable development, social progress, and democratic governance by educating public policy professionals, producing policy-related research, and conveying the results to the world. Based in New York City, with a student body that is 50 percent international and educational partners in cities around the world, SIPA is the most global of
public policy schools.
For more information, please visit www.sipa.columbia.edu

1255 Amsterdam Ave New York NY 10027
www.energypolicy.columbia.edu
@ColumbiaUenergy
THE ROLE OF NATURAL GAS IN EUROPE’S ELECTRICITY SECTOR THROUGH 2030BY TIM BOERSMA, TATIANA MITROVA, JOHANA TYPOLTOVA, ANNA GALKINA, AND FEDOR VESELOV
AUGUST 2018

THE ROLE OF NATURAL GAS IN EUROPE’S ELECTRICITY SECTOR THROUGH 2030
3 | CENTER ON GLOBAL ENERGY POLICY | COLUMBIA SIPA
For comments on earlier drafts of this paper, insightful conversations, and editorial guidance, we thank Seb Henbest, Matthew Robinson, Megan Burak, all participants to the Clingendael International Energy Program European Gas Market Workshop 2018, and three anonymous reviewers. We are particularly grateful to Bloomberg New Energy Finance for allowing us to work with their data, and want to emphasize that this paper and its findings in no way represent the views of Bloomberg New Energy Finance. All errors remain our own.
The opinions expressed in this report should not be construed as reflecting the views of the Columbia SIPA Center on Global Energy Policy or any other entity.
This work was made possible by support from the Center on Global Energy Policy. More information is available at: https://energypolicy.columbia.edu/about/mission.
ACKNOWLEDGEMENTS

THE ROLE OF NATURAL GAS IN EUROPE’S ELECTRICITY SECTOR THROUGH 2030
ENERGYPOLICY.COLUMBIA.EDU | AUGUST 2018 | 4
Tim Boersma is a Senior Research Scholar at the Center on Global Energy Policy. He holds a PhD in International Relations from the University of Groningen. His research focuses on energy policy coordination, unconventional natural gas extraction, gas market integration, liquefied natural gas, and energy diplomacy.
Tatiana Mitrova is a Research Officer at the Center on Global Energy Policy, Scientific Advisor at Energy Research Institute of the Russian Academy of Sciences and Director at SKOLKOVO Business School. She holds a PhD in International Economics from the Gubkin Oil & Gas University based in Moscow. Her research focuses on energy policy, energy markets modelling, gas market transformation and inter-fuel competition.
Johana Typoltova is a European Gas Analyst at Bloomberg NEF. She holds MA in International Energy from Sciences Po, Paris. In her current role, she focuses on the short to mid-term gas markets and role of natural gas in the European power markets.
Anna Galkina works as a Research Fellow at the Energy Research Institute of Russian Academy of Sciences (ERI RAS). In 2011, she graduated from Higher School of Economics in Moscow with a Master’s Degree in Economics. She is engaged in developing the ERI RAS’ own economic modelling complex, her research interests include world natural gas markets development, factor analysis, demand forecasting.
Fedor Veselov is a deputy director of the Energy Research Institute of the Russian Academy of Sciences. He holds a PhD in Energy Economics. His research activity focuses on the strategic energy planing, inter-fuel competition in the power sector, technological transformation in electricity supply based on the low-carbon options and smart energy systems.
ABOUT THE AUTHORS

THE ROLE OF NATURAL GAS IN EUROPE’S ELECTRICITY SECTOR THROUGH 2030
5 | CENTER ON GLOBAL ENERGY POLICY | COLUMBIA SIPA
Executive Summary
Introduction
1. Methodology and Assumptions
Methodology of LCOE calculations
Cases for the screening analysis of RES and conventional thermal plants in the european power sector
Regional approach
Scenario assumptions for EU fuel-mix analyses from the economic effect viewpoint
2. Key Results of the LCOE Calculation
Results for current conditions (2015)
The impact of fuel and carbon prices’ uncertainties on the 2030 results
3. Main Findings from Analysis of the Alternative Cases of the European Power Generation Mix
4. Discussion and Conclusions
Appendix A: Regional Split
Appendix B: Assumptions for the LCOE Calculation
Appendix C: Results of LCOE Calculations
Appendix D: Tables for the Alternative Cases of the European Power Generation Mix
TABLE OF CONTENTS
6
8
10
10
11
13
13
17
17
20
22
30
32
33
36
42
TABLE OF CONTENTS

THE ROLE OF NATURAL GAS IN EUROPE’S ELECTRICITY SECTOR THROUGH 2030
ENERGYPOLICY.COLUMBIA.EDU | AUGUST 2018 | 6
The developments underway in Europe’s natural gas sector are some of the most influential and closely watched in the global gas market. In the past decade, Europe has seen significant demand swings, falling domestic production, growing concerns about dependence on Russian gas, and the advent of US liquefied natural gas exports to the world. Just as important has been the emerging competition from renewable fuels. Indeed, questions are now arising about whether Europe needs new investments in natural gas infrastructure or if those investments would become stranded assets. However, suggesting that the EU does not need new investments risks underestimating the role—or the potential role—natural gas plays in various sectors of Europe’s energy economy, including industry, transportation, and commercial and residential usage.
This paper analyzes the outlook for natural gas in Europe’s electricity generation, the most substantial market for gas in the continent, in the short and medium term (to 2030). The authors sought to create various scenarios that made increasingly bold assumptions about the costs of renewables going forward while at the same time addressing the absence of balancing costs of intermittent renewables in most recent analyses. The paper assumes a robust average carbon price over the forecast period in two of its scenarios, noting the highly complicated politics around more ambitious carbon pricing. Finally, the authors include all planned phaseouts of existing thermal generation capacity, per the reference case of the EU Energy, Transport and GHG Emissions Trends to 2050 as well as all recent national announcements concerning nuclear and coal phaseout.
In short, the paper finds the following:
● A renaissance of natural gas in the EU-28 electricity sector looks unlikely, with only modest room for fuel switching and growth—about 40 billion cubic meters (bcm) on a continental scale through 2030 (in 2017, European demand hovered around 483 bcm). Fuel prices, carbon prices, and interest rates will be critical factors in determining whether demand for natural gas increases or declines.
● In determining the impact of the price of carbon on European natural gas demand, the case of the United Kingdom offers some insight. Once the United Kingdom unilaterally installed its carbon price floor, natural gas did force coal out of power generation on an impressive scale. However, to allow for fuel switching, existing underutilized generation capacity must be available to use. If not, utilities face serious questions related to the cost of new generation capacity, anticipated fuel costs and cost curves, and time horizons. Importantly, recent data suggest that even though the carbon price floor did provide an incentive for incremental gas-fired power generation, soon thereafter, renewables, storage, and efficiency eroded some of the gains made by natural gas. This analysis suggests that there is moderate room for fuel switching similar to what happened in the United Kingdom.
● Increasing natural gas demand for electricity generation is most promising for southern Europe, chiefly because electricity demand in this part of the continent is still growing, although competition from renewables here is fierce. In a scenario with high carbon
EXECUTIVE SUMMARY

THE ROLE OF NATURAL GAS IN EUROPE’S ELECTRICITY SECTOR THROUGH 2030
7 | CENTER ON GLOBAL ENERGY POLICY | COLUMBIA SIPA
prices and high natural gas prices, by the end of the forecasting period, investments in renewables make more economic sense than natural gas in the southern part of the European Union. The costs of capital are likely going to be critically important in the coming years to determine whether investors turn to renewables or (in part) natural gas.
● Ultimately, the paper finds that new EU investments in gas infrastructure are probably necessary in parts of the European Union. New investments are less necessary in more mature parts of the continent relative to the less-developed parts of the continent, where gas demand has room for growth and/or single source dependency concerns trump basic economic considerations.

THE ROLE OF NATURAL GAS IN EUROPE’S ELECTRICITY SECTOR THROUGH 2030
ENERGYPOLICY.COLUMBIA.EDU | AUGUST 2018 | 8
In 2011 the International Energy Agency (IEA) described certain preconditions that could well lead to the golden age of gas. The precursor of this line of reasoning was the advent of shale gas extraction, predominantly in the United States, which proved to be the final nail in the coffin of peak-supply theorists.
Instead, academic and policy discussions have shifted, and today analysts talk about peak demand for fossil fuels, rather than their finiteness. Several things have contributed to this fundamental shift, but without doubt the most prominent is the scientific observation that we live in a carbon-constrained world. Arguably, many important questions remain unanswered, but what we know is that we have started with a fundamental reorganization of the global energy system. Transition pathways will likely differ in various places, depending on policy decisions, resource availability, technology distribution, and further investments in research and development.
In the United States, the advent of shale gas has created an energy system in which natural gas is playing a very prominent role. In Europe, domestic natural gas production is in decline, and it looks increasingly likely that shale gas will not play a major role on the continent, paving the way for increased imports of hydrocarbons. Consequently, natural gas in the electricity sector faces tough competition from other feedstocks, mostly coal and renewables. As the costs of renewable technologies like solar and wind continue to fall, it seems only a matter of time before these too can compete based solely on price.1
This in turn has led an increasing number of analysts and policy makers to suggest that new investments in natural gas infrastructure are not needed in the European Union, as they risk becoming stranded assets in the not-too-distant future.2 The authors believe that all too-generic statements along these lines risk missing the role that natural gas plays in various sectors of Europe’s energy economy, including industry (where it will be hard to replace), transportation (where it could gain market share at the expense of oil products), and commercial/residential usage (for heating and cooking). For this paper, however, the authors focus on the most substantial market for natural gas in Europe, which is electricity generation. The focus will briefly return to other parts of the European energy economy in the discussion of the results.
Natural gas in the electricity sector has come under significant pressure in recent years. As mentioned above, for the most part natural gas has struggled to win the competition with coal in the merit order, and European member states have, to various degrees, increased the share of renewable energy sources (RES). To be sure, with marginal costs being zero, renewable technologies naturally prevail in that merit order once installed. At the same time, it’s demonstrable that feedstocks like coal and natural gas are highly price responsive, such as illustrated in the case of the United Kingdom, where falling gas prices and rising coal prices, combined with a carbon price floor of little more than £18, natural gas in the summer of 2016 became the preferred option again, leaving coal marginalized by early 2018. In addition,
INTRODUCTION

THE ROLE OF NATURAL GAS IN EUROPE’S ELECTRICITY SECTOR THROUGH 2030
9 | CENTER ON GLOBAL ENERGY POLICY | COLUMBIA SIPA
some of the authors’ earlier work has suggested that more ambitious carbon pricing in the European Union could also be a boon for natural gas demand, likely at the expense of coal.3 However, it is important to note the limits to this line of reasoning, as the ability to switch fuels in the power sector differs on a country-by-country basis and depends on the availability of underutilized installed generation capacity.4 Honoré concluded that natural gas might see modest growth in the European power sector, with specifics depending on national market characteristics, available alternative fuels and prices, and policies, including those aimed to price carbon.5 Hafner and Tagliapietra suggested that renewable energy sources to date have followed a “fit and forget” logic, meaning that they are not integrated in electricity markets but have priority dispatch and access to networks.6 The authors suggest that solutions to address this fundamental problem may be found in better interconnectivity, demand side management, and electricity storage, but that these solutions all face substantial challenges that lead the authors to believe that a major contribution should not be expected in the medium term.
Hence, this study assesses whether in fact analysts and policy makers should anticipate a bigger role for natural gas in Europe’s electricity mix in the medium and long term (up to 2030). The authors test this in various scenarios by making increasingly bold assumptions about the costs of renewables going forward. This study also attempts to grapple with a critique about the absence of balancing costs of intermittent renewables, an issue that the authors believe deserves more attention than it has received to date. The discussion will consider various coal and natural gas price scenarios. Moreover, the approach will assume a robust average carbon price over the forecast period in two of the scenarios, even though the highly complicated politics within the European Union around more ambitious carbon pricing must be noted, as exemplified by the difficulties to reform its emissions trading scheme (EU-ETS). Finally, the authors include all planned phaseouts of existing thermal generation capacity, per the reference case of the EU Energy, Transport and GHG Emissions Trends to 20507 as well as all recent national announcements concerning nuclear and coal phaseout (for the latter, not including Germany and Poland, where the exact dates have not been determined).
In this paper, the methodological approach, its benefits, and its shortcomings will be discussed first. Subsequently, the assumptions for this study and the scenarios considered will be addressed. The authors then present the main findings before reaching conclusions and offering avenues for further research.

THE ROLE OF NATURAL GAS IN EUROPE’S ELECTRICITY SECTOR THROUGH 2030
ENERGYPOLICY.COLUMBIA.EDU | AUGUST 2018 | 10
Methodology of LCOE calculations
This analysis is based on the levelized cost of energy (LCOE) calculation according to the IEA methodology.8
PMWh: the constant lifetime remuneration to the supplier for electricityMWh: the amount of electricity produced in MWh, assumed constant(1+r)-t: the discount factor for year t (reflecting payments to capital)Capitalt: total capital construction costs in year tO&Mt: operation and maintenance costs in year tFuelt: fuel costs in year tCarbont: carbon costs in year tDt: decommissioning and waste management costs in year t
The authors made a two-stage analysis based on LCOE calculations. At the first stage, a classic analysis was performed based on the simple LCOE calculation using the formula above for 2015 and 2030. The purpose of the analysis was to evaluate how the changes in cost and performance parameters of generating technologies will influence their competitiveness in different regions of Europe. The following factors were considered:
● regional differences in fuel prices and capital costs,
● changes in fuel and carbon prices,
● decreases in capital costs and capacity factors because of technological improvements, and
● discount rates (WACC combining cost of equity of the project sponsor and the interest rate charged by any debt providers).
At this stage the gap between electricity generation costs of RES and gas/coal-fired plants was estimated without any additional costs related to the integration and operation of RES plants in the power system. If LCOE equals the payback price for the different types of plants, the authors would argue that their competitiveness was compared by accounting for the plants’ own capital and operation costs only.
At the second stage of the analysis, an extended assessment was performed, and the authors estimated the impacts of additional costs for the power system that will follow from the intensive development of RES plants (including storage capacity or backup capacity to balance the grid). These costs are related to the requirements on the supply of additional
1. METHODOLOGY AND ASSUMPTIONS

THE ROLE OF NATURAL GAS IN EUROPE’S ELECTRICITY SECTOR THROUGH 2030
11 | CENTER ON GLOBAL ENERGY POLICY | COLUMBIA SIPA
capacity and electricity resources. They compensate the intermittent generation from RES plants operating with low capacity factors (respective to the European power system’s load factors). This stage was added to the analysis to address one of the critiques that the LCOE approach receives at times, which is that it ignores additional costs to the power system.9 It is important to note that the authors account for only the additional costs that allow considering the intermittent RES plants as less intermittent and more as firm capacity, similar to conventional thermal plants. The authors tried to put RES and thermal plants into the more comparable operation conditions for the LCOE calculation.
At this stage, two types of cases were developed: (1) where costs of additional capacity to back up the intermittent RES plants are considered in the LCOE calculation and (2) where additional supply costs compensating the gap between the power system load factor and the low capacity factors of RES plants are considered in the LCOE calculation.
Cases for the screening analysis of RES and conventional thermal plants in the European power sector
A consideration of additional capacity reserves required to integrate RES
The availability of wind and solar generating capacity depends on weather conditions, and this capacity cannot be considered as always available in the capacity balance of the power system.10 The authors assumed (based on ENTSO-E) that all wind and solar capacity is unstable and must be backed up by existing or new capacities. As an alternative, the authors assumed that RES capacity output may be regulated through its combination with electricity storage facilities (the authors consider that 50 percent to 100 percent of electricity generated may be stored and supplied to the power system later). In this study, the authors did not consider power to gas technologies and their economics, though this is identified as a possible topic for further study. As a result, three cases were considered and quantified (table 1).
Table 1: Description of cases where capacity reserves are considered in the LCOE calculation for RES
Case Description Additional costs to the LCOE calcuation
(A1) RES plants are reserved by existing thermal generation
● 0&M costs to maintain the availability of existing gas/coal-fired plants
No additional fuel costs, because these will be used for reserve, not genertion, under normal conditions
(A2) RES plants are reserved by new open-cycle gas turbines/OCGT (1MW RES+IMW GT)
● Capital costs of OCGT
● O&M costs of OCGT
No additional fuel costs, because these will be used for reserve, not genertion, under normal conditions
(A3) RES plants are combined with storage capacity (from 50% to 100%)
● Capital costs of OCGT
● O&M costs of OCGT
● Additional losses due to storage inefficiency (90%)
A consideration of costs compensating the difference between RES capacity factors and load factor of the EU power system

THE ROLE OF NATURAL GAS IN EUROPE’S ELECTRICITY SECTOR THROUGH 2030
ENERGYPOLICY.COLUMBIA.EDU | AUGUST 2018 | 12
Due to the weather conditions, wind and solar plants in the European Union can produce electricity with low capacity factors (CFRES), according to 2016 BNEF data: 27 percent for onshore wind and 14 percent for solar utility scale plants, although these numbers are improving because of better turbines and management optimization. This means that electricity from RES plants is available for 1,200–2,500 hours per year only, and without large-scale storage, it is necessary to use other types of generation to supply electricity during the rest of year.
The idea of these cases is that the integration of RES plants must be supplemented by an ad-ditional system cost of electricity produced to meet the power system’s load profile. Industrial, commercial, and household consumers within the power system have individual load profiles with different variations of hourly loads. The system load factor (LF) is often used as the primal characteristic of the load profile of the whole power system. It is defined as the ratio of annual electricity consumption and peak load. If RES plants operate with a capacity factor lower than the system load factor (CFRES < LF), they can substitute only the part of electricity generated at the thermal plants. The rest of the electricity must still be generated using thermal plants. Their remaining capacity factor is CFTHERM = LF − CFRES. This means that thermal plants (existing or new) still must exist in the power system and provide not only capacity reserves for RES but also reserves for additional electricity supply due to the low CF of RES plants.
As an alternative, electricity from RES plants can be stored and supplied to the power system for a longer period equivalent to LF. But in this case, the required generating RES and storage capacity will be (LF/CFRES) times higher (and additionally adjusted to the 90 percent efficien-cy of the storage facilities). The authors considered three cases to estimate the impact of RES plants on the costs of electricity supply requirements in the power system operating with a certain LF (table 2).11
Table 2: Description of cases where capacity reserves and load factors of the EU power system are considered in LCOE calculation
Case Description Additional costs to the LCOE calcuation
(B1) new RES plants are combined with existing gas/coal fired plants
● O&M and fuel for thermal plants operating with (CFTHERM = LF − CFRES) load factor
Comparison with LCOE of existing gas plant
(B2) new RES plants are combined with new CCGT plants
● Capital costs of OCGT
● O&M and fuel costs of CCGT operating with (CFTHERM = LF − CFRES) load factor
Comparison with LCOE of new CCGT
(B3) RES plants are combined with the storage capacity (100%)
● Capital costs of (LF/(CFRES*0.9)) RES and storage capacities
● O&M costs of (LF/(CFRES*0.9)) RES and storage capacities
● Additional losses due to storage inefficiency (90%)
Comparison with LCOE of new CCGT
The first two cases (B1 and B2) allow an estimate of the effects of fuel saving due to the substitution of electricity produced by thermal plants with renewable sources. In case B1, the decrease of fuel costs of existing gas/coal-fired plants is compared with the costs for RES

THE ROLE OF NATURAL GAS IN EUROPE’S ELECTRICITY SECTOR THROUGH 2030
13 | CENTER ON GLOBAL ENERGY POLICY | COLUMBIA SIPA
plants’ development and operation. In case B2, fuel cost savings are estimated for new CCGT plants, meaning that additional capital costs for CCGT construction are considered. Thermal plants in both cases must serve as backups to RES plants when they generate electricity and serve as electricity producers during the rest of the time. Case B3 estimates additional costs for storage capacity to provide the regulated electricity output from wind or solar plants according to the system load factor that is much higher than RES capacity factors.
Regional approach
Another important feature of this study is the regional/country-level disaggregation in Europe—all calculations are made based on country-level data, and the results are differentiated for five regions from the EU28 aggregate. Most recent studies analyze power sector gas demand at the aggregate EU level. All country-level forecasts were aggregated into five regions—namely, western Europe, northern Europe, Mediterranean Europe, southeastern Europe, and central and eastern Europe—see figure 1 and appendix A for the regional division.
Figure 1: Geographical split
Scenario assumptions for EU fuel-mix analyses from the economic effect viewpoint
The energy transition in the EU could follow different trajectories: it could try to go for 100 percent RES, accompanied by different types of electricity storage, but this might prove to be too expensive. Another option is to combine RES with natural gas. The authors assumed that if political decisions are made based on economic rational, then the assessment of the total discounted cost of each option (based on full LCOE, including costs of system flexibility) for the whole economy would provide solid ground for an optimal choice.

THE ROLE OF NATURAL GAS IN EUROPE’S ELECTRICITY SECTOR THROUGH 2030
ENERGYPOLICY.COLUMBIA.EDU | AUGUST 2018 | 14
This study does not model EU electricity demand—instead, it uses reference case electricity consumption from “EU Energy, Transport and GHG Emissions Trends to 2050;” it is fixed for all scenarios. Note that with the ambition of EU policy makers to electrify substantial parts of Europe’s energy economy (heating, cooking, transport), there is reason to believe that electricity demand might grow in the future, contrary to conventional wisdom in policy debates.
This study’s focus is on the fuel mix required to satisfy this demand. As a base case for the fuel mix structure (major variables are generation by source, net generating capacity by fuel type, fuel consumption, and CO2 emissions), the authors used the reference scenario from the IEA’s 2016 EU Energy, Transport and GHG Emissions Trends to 2050. For the alternative cases, the assumption is that no new coal or nuclear generation will be built in EU, so all these alternative cases are different combinations of gas and RES, with higher or lower share of each.
In addition to the base case, the authors considered two alternative cases with lower and higher RES development (table 3):
● In the lowRES case, the authors assume a constant share of RES in the electricity generation structure starting from 2020, while the rest of the generation growth is covered by gas-fired generation
● In the highRES case, the authors assume that RES will further increase and provide 30 percent of electricity generation in 2030
For each of these cases, the authors estimated the changes (in comparison to the base case) in generating capacity and electricity production structure, fuel consumption and CO2 emissions, capital, fuel and OM costs, and integrated discounted costs. See below for the assumptions described.

THE ROLE OF NATURAL GAS IN EUROPE’S ELECTRICITY SECTOR THROUGH 2030
15 | CENTER ON GLOBAL ENERGY POLICY | COLUMBIA SIPA
Table 3: Description of the lowRES and highRES cases
Case LowRES Case HighRES Case
Share of RES in 2030 Fixed at level of 2020 30 %
Additional capacity reserve for RES Not required with the lower level of RES capacity (in comparison to the base case)
Required for 100% of additional RES capacity (in comparison to the base case)
Substitution of RES generation Additional generation from gas-fired plants compensates the lower level of RES electricity production
Additional RES generation substitutes the electricity from gas-fired plants
Gas-fired plants’ efficiency for RES/gas substitution
Average efficiency 50% used
CO2 emission rates for gas 2.61 t CO2/toe
Utility/residential RES capacity structure for CAPEX and OPEX calculations
Wind—90/10, solar—80/20
Accounting of fuel and OM costs in 2030 and to estimate the effects after the period of the forecast
10 years with CO2 prices at the 2030 level and gas price growth with 2025–2030 annual growth rates
Discount rate 5%, 10%
Fuel and CO2 prices Three scenarios used for the screening analysis of energy technologies (presented in part 1.2)
Cost and performance data of energy technologies, CAPEX decrease forecasts
The same as it was used for the screening analysis of energy technologies (presented in part 1.2)
Using these assumptions, the authors estimated the total discounted costs (TDC) for lowRES and highRES cases for each of three scenarios of fuel and carbon prices. This analysis demonstrated the efficiency of incremental gas demand changes in the European electric power sector.
The assumptions on dynamics of capital costs, O&M costs, and capacity factors of different power generation technologies by European regions for LCOE analyses are based on Bloomberg New Energy Finance database (for RES) and IEA 2015 data (for gas and coal generation). See appendix B for cost dynamics.
In addition to these two cases, the authors developed three scenarios of fuel prices and CO2 prices over the forecasting period (see table 4). EU average fuel prices are based on IEA scenarios. The first scenario assumes that political challenges continue to complicate meaningful carbon pricing and assumes relatively low prices for natural gas and coal. The second scenario assumes moderately successful reform of EU ETS, leading to a carbon price of 25 dollars per ton by the end of the forecasting period. In this scenario prices for natural gas and coal are also more robust. The third scenario assumes successful carbon pricing within the European Union by the end of the forecasting period and relatively high prices for fossil fuels. In all these scenarios, the assumption is that existing plans for interconnectivity are implemented.12 The analysis is also based on existing market models, even though the authors note that there is an ongoing debate about the design of capacity markets, and several EU member states in fact have capacity mechanisms in place. Their impact on natural gas demand is a topic that deserves more attention.

THE ROLE OF NATURAL GAS IN EUROPE’S ELECTRICITY SECTOR THROUGH 2030
ENERGYPOLICY.COLUMBIA.EDU | AUGUST 2018 | 16
Table 4: Assumed CO2, natural gas and coal prices in the EU by scenario
20152030
Scen1 Scen2 Scen3
CO2 price, $/t 8.5 5 25 45
EU gas, $/MMBTU (GCV) 7.08.0 CGEP’s asumptions
10.3IEA NP
11.1IEA CP
EU coal, $/t74 IEA NP
74 IEA NP
80 IEA NP

THE ROLE OF NATURAL GAS IN EUROPE’S ELECTRICITY SECTOR THROUGH 2030
17 | CENTER ON GLOBAL ENERGY POLICY | COLUMBIA SIPA
Results for current conditions (2015 level)
The analysis of LCOE for new gas-fired and renewable generation made while using a discount rate of 5 percent allows the following conclusions.
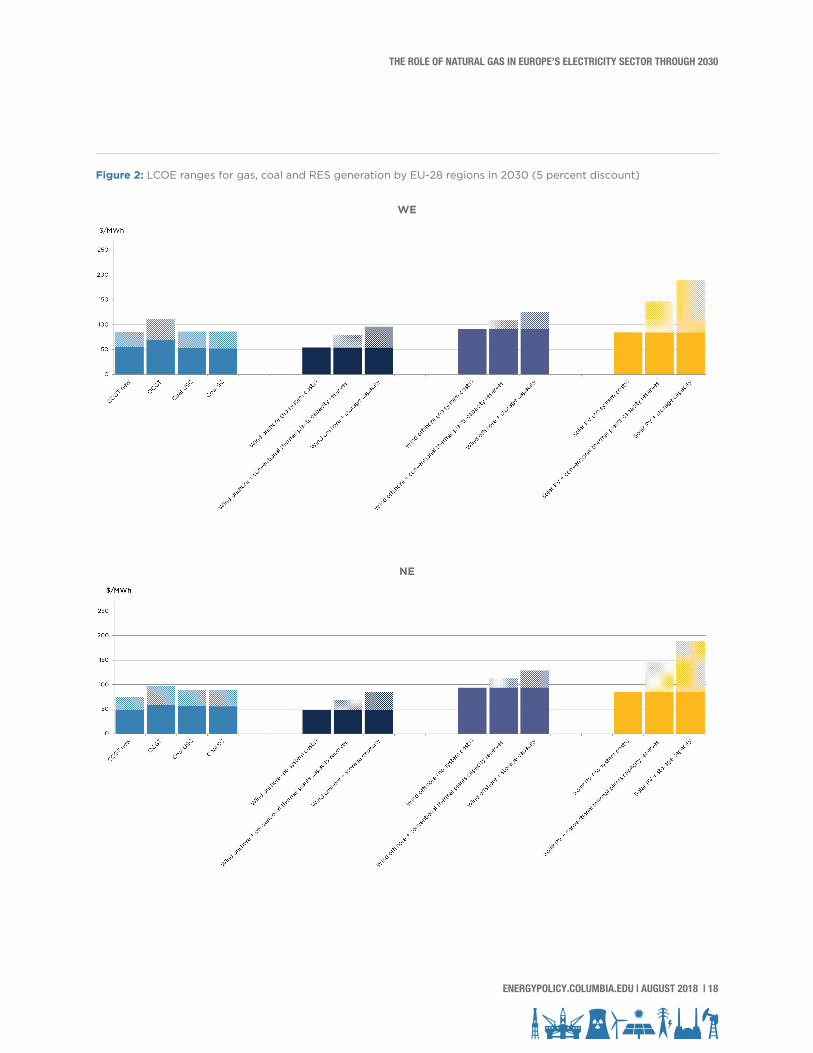
At the level of fuel prices and the costs of new renewable power plants of 2015, electricity produced at these plants overall in the EU remained more expensive than that generated by the new CCGT plants. Utility scale onshore wind technology demonstrated the smallest difference (15–27 percent) with LCOE of new CCGT in all European regions, while LCOE of solar PV and offshore wind were 2.3–2.7 times higher compared to new CCGT (depending on the EU region—see figure 2 and appendix C).
If one considers also reserve capacity costs (cases A1–A2), the gap between LCOE of renewable power plants and CCGT plants widens even further. For onshore renewable power plants, the difference in LCOE as compared to CCGT plants grows to 34–47 percent when RES capacity is reserved by the existing power plants and to 60–73 percent when reservation is provided by the new gas turbines. For solar power plants and offshore wind power plants, capacity reservation makes their electricity produced 2.8–3.5 times more expensive than electricity generated by a new CCGT.
Given the need for additional generation by thermal power plants due to the low capacity factor (CF) of renewable power plants, there is a significant increase in the cost of electricity supply from wind or solar plants (cases B1–B2). Combining the electricity from new RES plants and existing thermal capacities leads to a noticeable increase in the price of supplies compared to LCOE of the existing thermal power plants: by 17–22 percent for onshore wind power plants, 2.3–2.4 times for offshore wind power plants, and by 33–39 percent for solar power plants. Combining new RES and new CCGT generation also leads to an increase in electricity costs. Compared to LCOE of the new CCGT, the increase is by 17–22 percent for onshore wind, by 28–33 percent for solar, and twofold for offshore wind power.
Reserving both capacity and electricity using electricity storage (cases A3, B3) appears the least effective solution, given the current costs (see appendix C). It increases LCOE of onshore wind two- to threefold, offshore wind by 3.2–4 times, and solar power by 4.4–6.7 times.
2. KEY RESULTS OF THE LCOE CALCULATION
THE ROLE OF NATURAL GAS IN EUROPE’S ELECTRICITY SECTOR THROUGH 2030
ENERGYPOLICY.COLUMBIA.EDU | AUGUST 2018 | 18
Figure 2: LCOE ranges for gas, coal and RES generation by EU-28 regions in 2030 (5 percent discount)
WE
NE

THE ROLE OF NATURAL GAS IN EUROPE’S ELECTRICITY SECTOR THROUGH 2030
19 | CENTER ON GLOBAL ENERGY POLICY | COLUMBIA SIPA
CEE
ME

THE ROLE OF NATURAL GAS IN EUROPE’S ELECTRICITY SECTOR THROUGH 2030
ENERGYPOLICY.COLUMBIA.EDU | AUGUST 2018 | 20
SEE
The impact of fuel and carbon prices’ uncertainties on the 2030 results
A minimum increase in the prices of fuel and carbon by 2030 (scenario 1) reduces but does not eliminate the difference between LCOE of gas plants and RES. Only onshore wind power plants reach the effectiveness range equal to that of CCGT (within 10 percent)—and that is without factoring in additional costs of reserving capacity or power.
A substantial increase in fuel prices in 2030 (scenario 3), together with low prices of carbon (5 USD/ton CO2), makes onshore wind LCOE significantly lower than that of new CCGT without accounting for system effects (by 22–30 percent). When considering the cost of RES capacity reservation (cases A1–A2), one finds onshore wind LCOE just as efficient as new gas power plants.
An assessment of the effects of supplemental supplies from thermal plants because of low capacity factors of RES plants (cases B1–B2) finds that calculated LCOE of new onshore wind power plants in all European regions are comparable with conventional gas-powered alternatives. An additional increase in carbon prices up to 45 USD/ton CO2 will further increase the effects for onshore wind power plants as well as remove the price barrier for solar and offshore wind power.
LCOE of solar power plants net system effects, LCOE of CCGT, and the option of supplying electricity where solar power generation is partially combined with gas-powered generation will reach cost parity (within the range of 10 percent) in all regions of Europe, especially in ME. However, when the costs of capacity reservation are added (cases A1–A2), LCOE of solar power plants turns out to be 15–45 percent above that of CCGT.
The difference between the costs of CCGT and offshore wind power plants narrows substantially. They begin to be equally cost effective in terms of LCOE net of additional system

THE ROLE OF NATURAL GAS IN EUROPE’S ELECTRICITY SECTOR THROUGH 2030
21 | CENTER ON GLOBAL ENERGY POLICY | COLUMBIA SIPA
effects in the WE region. Nevertheless, it would take even higher carbon prices (or offshore wind power plants becoming even cheaper) to also compensate for the costs of reserving capacity (cases A1–A2) and ensure the effectiveness of their combination with conventional thermal plants to meet the electricity supply according to the system load factor (cases B1–B2).
Even given these price conditions and the costs of electricity storage halving, the use of power storage systems still remains the most expensive solution for reserving capacity of renewable power plants (case A3) and for managed dispatching of their capacity in the load schedule (case B3). Combined with accumulators, LCOE of renewable power plants remains around 15 percent higher for onshore wind power, 50–70 percent for offshore wind power, and 2.2–2.5 times higher for solar power in comparison with CCGT.
The analysis shows that a rather significant increase in fuel and carbon prices, coupled with the falling costs of renewable power plant construction used in the calculations, creates economically viable conditions for the effective development of onshore wind and solar power plants without additional financial support.
Similar calculations made with the discount rate of 10 percent significantly worsen the prospects for the economically efficient and competitive development of renewable power plants in the European electricity sector, so the cost of capital is critical for RES. If a discount rate of 10 percent is used, only a substantial increase in the costs of fuel and carbon (scenario 3) leads to lower LCOE of onshore wind power plants compared to CCGT (by 10–20 percent) without considering system effects.

THE ROLE OF NATURAL GAS IN EUROPE’S ELECTRICITY SECTOR THROUGH 2030
ENERGYPOLICY.COLUMBIA.EDU | AUGUST 2018 | 22
So far this paper has assessed the economic efficiency of each of the development cases for the electric power sector with different fuel mixes and RES share in 2030 (see section 1.4 for details). The economic efficiency of lowRES and highRES cases was measured in USD as a deviation of total (capital, fuel, O&M, and carbon) discounted costs (TDC) assessed to the base case. This was done for each of the identified regions and for the EU-28, considering costs in the 10-year period after 2030 as well as variations in fuel and CO2 prices (per the scenarios as described in the previous section) and discount rates (5 percent and 10 percent for all regions, as well as a “mixed” discount rate, in which the authors assumed a discount rate of 5 percent in WE and 10 percent in all other regions). Appendix D gives an overview of the power sector development in the EU-28, within the base case and two alternative cases (lowRES, highRES) and the deviation of the discounted costs by case and by fuel and carbon price scenarios.
The authors have analyzed the impact of the above-named factors on the effectiveness of the alternative cases, both for the EU-28 and for individual regions. Figure 3 shows the dependence of total discounted costs from gas prices and CO2 prices at various discount rates during the implementation of the two alternative RES development cases. This is done for the EU power sector overall. The x axis in figure 3 shows projected gas prices in 2030 within the price range adopted in scenarios 1–3.13 The y axis shows the deviation of total discounted costs relative to the base case. Negative values of this indicator characterize the positive effect of the RES development alternative cases compared to the base case. Positive values indicate the extent to which the base case is preferable to the alternatives.
All dependencies are presented in the form of ranges (given minimum and maximum values of the CO2 price, as well as given its specified value for three scenarios—the red lines). Figure 3 shows that across the EU-28, a reduction in renewable energy development in the lowRES case proves to be more efficient (less costly) than the base case at a discount rate of 10 percent, regardless of the level of gas and CO2 prices (although this effect is reduced sharply as gas prices increase). At a discount rate of 5 percent, a reduction in RES development in the lowRES case produces a positive effect (has a lower total discounted cost) only given low CO2 prices and relatively low gas prices. It is important to note that growing RES faster than happens in the base case appears less efficient (costlier) in all scenarios. This happens regardless of gas and CO2 prices, as well as discount rates, although here an increase in gas prices also reduces the gap in total discounted costs between the highRES and base cases.
3. MAIN FINDINGS FROM ANALYSIS OF THE ALTERNATIVE CASES OF THE EUROPEAN POWER GENERATION MIX

THE ROLE OF NATURAL GAS IN EUROPE’S ELECTRICITY SECTOR THROUGH 2030
23 | CENTER ON GLOBAL ENERGY POLICY | COLUMBIA SIPA
Figure 3: The cost effects of implementing alternative development cases (highRES, lowRES) compared to the base case across the European Union, given varying gas and CO2 prices as well as discount rates
These conclusions may differ somewhat in the individual regions of the EU-28 (figure 4). In NE, the option of further increasing the share of renewable energy appears significantly less efficient than the base case under any conditions—even at a discount rate of 5 percent. The option of holding back RES growth (lowRES), on the other hand, is preferable in terms of TDC under all circumstances (discount rates and gas and carbon prices).
In WE and CEE, the option of increasing the share of RES relative to the base case is also less efficient given any combination of discount, gas, and carbon prices. To be sure, it is worth noting that in several countries, like the Netherlands, the authorities are still focusing on significant increases of offshore wind, partly under parliamentary pressure. The option of holding back RES growth (lowRES) at a discount rate of 5 percent only produces a positive effect given moderate gas prices (scenarios 1–2). When considering the gas prices given in scenario 3, one finds the volume of RES development suggested in the base case is more effective. High carbon prices further weaken the case of holding back RES growth. At a

THE ROLE OF NATURAL GAS IN EUROPE’S ELECTRICITY SECTOR THROUGH 2030
ENERGYPOLICY.COLUMBIA.EDU | AUGUST 2018 | 24
discount rate of 10 percent, this lowRES option appears preferable to the base case given any combination of fuel and carbon prices.
In the SEE and ME regions, as in other regions, the option of increasing the share of RES relative to the base case also appears less efficient given any combination of discount, gas, and carbon prices. However, at a discount rate of 5 percent, another case (lowRES), which restrains renewable energy growth, proves to be more effective than the base case only at low gas prices (scenario 1). Gas price assumptions in scenario 2 lead to an increase of TDC compared to the base case. At the same time, the highest gas prices in scenario 3 produce an excess in TDC within lowRES, which is even greater than the one in the highRES case. At a discount of 10 percent (which is more in line with the economics of electricity projects in these regions), the lowRES case is preferable compared to the base case given any combination of fuel and carbon prices.
Figure 4: The effects of implementing alternative Cases of development (highRES, lowRES) compared to the base case in various regions of the European Union given varying gas and СС2 prices and discount rates

THE ROLE OF NATURAL GAS IN EUROPE’S ELECTRICITY SECTOR THROUGH 2030
25 | CENTER ON GLOBAL ENERGY POLICY | COLUMBIA SIPA
Table 5 gives overall characteristics of the positive and negative effects of the highRES and lowRES cases’ implementation compared to the base case. The zones of positive effectiveness of the scenarios compared to the base case are indicated in green, while the color red indicates negative effectiveness.

THE ROLE OF NATURAL GAS IN EUROPE’S ELECTRICITY SECTOR THROUGH 2030
ENERGYPOLICY.COLUMBIA.EDU | AUGUST 2018 | 26
Table 5: An analysis of the zones of effectiveness of different scales of RES development—implementation in Europe and its regions (indicating deviations in total discounted costs, bln USD)
Case LowRES HighRES
Discount Rate 5% 10% 5% 10%
Gas price min med max min med max min med max min med max
EU-28
CO2
price
Min
Med
Max
-37 -8 2 -42 -26 -21 100 71 61 92 76 71
-23 6 16 -34 -18 -13 86 57 48 84 68 63
-9 20 29 -26 -10 -5 73 44 34 76 60 54
WE
CO2
price
Min
Med
Max
-17 -8 -5 -16 -11 -10 35 26 23 30 26 24
-13 -4 -1 -14 -9 -7 31 22 19 28 23 22
-8 0 3 -11 -7 -5 27 18 15 26 21 19
NE
CO2
price
Min
Med
Max
-3 -2 -1 -3 -2 -2 5 4 3 4 4 3
-2 -1 -1 -2 -2 -1 4 3 3 4 3 3
-1 0 0 -2 -1 -1 3 2 2 3 3 3
CEE
CO2
price
Min
Med
Max
-5 -2 -1 -5 -4 -3 9 6 5 9 7 7
-3 -1 0 -5 -3 -3 7 5 4 8 6 6
-2 1 1 -4 -2 -2 6 3 2 7 6 5
SEE
CO2
price
Min
Med
Max
-2 0 1 -3 -2 -1 7 5 4 7 6 5
-1 1 2 -3 -1 -1 6 4 3 6 5 5
0 2 3 -2 -1 0 5 3 2 6 4 4
ME
CO2
price
Min
Med
Max
-11 4 9 -15 -7 -4 45 31 26 42 34 31
-4 10 15 -11 -3 0 38 24 19 38 30 27
3 17 22 -7 1 3 32 17 13 34 26 23
Results discussed above for the highRES case were obtained under the assumption of 100 percent capacity reserve for intermediate wind and solar capacity. Figure 5 shows the range of the total discounted costs change for the EU-28 in the highRES case (at different discount rates) with the variation in the share of this additional capacity reserve (in percent of new capacity, wind, and solar power plants), depending on the fuel and carbon price scenarios considered. An analysis of the impact of this factor shows that in the EU-28, total discounted costs within the highRES case remain higher than in the base case under nearly all conditions, even if the cost of reserving capacity is eliminated.

THE ROLE OF NATURAL GAS IN EUROPE’S ELECTRICITY SECTOR THROUGH 2030
27 | CENTER ON GLOBAL ENERGY POLICY | COLUMBIA SIPA
Figure 5: The impact of additional capacity reserves on the effects of highRES case implementation
Results obtained allow the authors to determine possible ranges and the cost effects of changes in gas demand in the EU-28 power sector, given different scales of renewable energy development in the lowRES and highRES cases. Tables 6 and 7 show the ranges of changes in gas demand across the EU-28 and in individual regions and related changes in the total discounted costs (calculated at different discount rates) within the range of gas and carbon prices’ scenarios (scenarios 1–3). According to the initial assumptions, the deviation in gas demand in the EU-28 power sector in 2030 will vary at 30 percent (or 40 bcm) above or below the base case. The smallest relative demand deviation is expected in the WE region (18 percent), and the greatest (80 percent) in the SEE region. The greatest absolute variation of the demand (almost 20 bcm) is expected in the ME region.

THE ROLE OF NATURAL GAS IN EUROPE’S ELECTRICITY SECTOR THROUGH 2030
ENERGYPOLICY.COLUMBIA.EDU | AUGUST 2018 | 28
Table 6: Change of gas consumption in 2030 and total discounted costs under the highRES case
Gas Consumption, bcm Change in TDC(5% Discount)
Change in TDC(10% Discount)
base case HighRES Change Sc1 Sc2 Sc3 Sc1 Sc2 Sc3
Total EU-28 133.0 92.7 -40.3 100 57 34 92 68 54
WE 70.8 58.0 -12.8 35 22 15 30 23 19
NE 4.6 3.0 -1.6 5 3 2 4 3 3
CEE 13.9 10.6 -3.3 9 5 2 9 6 5
SEE 3.7 0.6 -3.1 7 4 2 7 5 4
ME 40.0 20.3 -19.7 45 24 13 42 30 23
Table 7: Change of gas consumption in 2030 and total discounted costs under the lowRES case
Gas Consumption, bcm Change in TDC(5% Discount)
Change in TDC(10% Discount)
base case HighRES Change Sc1 Sc2 Sc3 Sc1 Sc2 Sc3
Total EU-28 133.0 173.2 40.3 -37 6 29 -42 -18 -5
WE 70.8 83.5 12.8 -17 -4 3 -16 -9 -5
NE 4.6 6.3 1.6 -3 -1 0 -3 -2 -1
CEE 13.9 17.2 3.3 -5 -1 1 -5 -3 -2
SEE 3.7 6.9 3.1 -2 1 3 -3 -1 0
ME 40.0 59.7 19.7 -11 10 22 -15 -3 3
Similar to table 5, the zones of positive effectiveness of the alternative scenarios compared to the base case are indicated in green, while the zones of negative effectiveness are marked as red. The analysis shows that across the EU-28, the increase in gas consumption in the European power sector due to the displacement of RES in the lowRES case appears economically viable within any price scenario, given a 10 percent discount rate. At a discount rate of 5 percent, it is only viable at low gas and CO2 prices. At the same time, a reduction in gas consumption due to further RES growth in the highRES case is ineffective (compared to the base case) given any price scenarios and discount rates—the same for the calculations made with mixed discount rates for the European regions.
Individual regional figures may differ from these results (see also tables 6 and 7). For WE, NE, and CEE, further gas consumption growth is effective at the 10 percent discount rate, under any fuel and carbon price scenarios. At the discount rate of 5 percent, the increase in gas demand to replace additional RES is also effective for all these regions, except for the highest gas and carbon prices given in scenario 3.

THE ROLE OF NATURAL GAS IN EUROPE’S ELECTRICITY SECTOR THROUGH 2030
29 | CENTER ON GLOBAL ENERGY POLICY | COLUMBIA SIPA
For the SEE and ME regions, gas demand growth (relative to the base case) is ineffective given high fuel and CO2 prices (scenario 3), even at the discount rate of 10 percent. It is also ineffective under scenario 2 at the discount rate of 5 percent. Thus, an analysis of the economic parameters of the alternative cases for the development of the EU-28 power sector and their comparison with the base case allows the authors to speak of the effectiveness of implementing the base case, as compared to the option of boosting the share of RES (highRES) in the EU-28 capacity and energy balance in the period between 2021–2030. This is true given any fuel and carbon price scenarios.
Given the scenarios of low and medium gas and carbon prices, the option of holding back RES growth (lowRES) where this generation is covered by gas instead of RES is even more effective. In this scenario, RES generation is replaced with gas generation, producing an additional corresponding increase in gas demand.
The considered alternative cases (relative to the base case) of the electric power sector development have the same total electricity generation output; however, the production structure is different. Therefore, a calculation of additional direct costs (or the saving of these) during the implementation of these alternative cases for each of their future five-year periods (2021–2025 and 2026–2030) allows us to assess the expected change (a decrease or an increase) in the average price of electricity for the end consumer, compared to the base case.
The calculations in table 8 show that a potential reduction in the price of electricity for the end user in the lowRES case would only be by 1.5–2 euro/MWh (or around 1 percent) less than in the base case. In the highRES case, this figure is 2.5–3.5 euro/MWh (approximately 1.5–2.5 percent higher than in the base case. This shows that even the alternative cases for the development of the EU electricity sector, which are significantly different in terms of their generation structure, make little difference for the end consumer in terms of the electricity price.
Table 8: Changes in average electricity prices for the end consumer within alternative scenarios for the development of the EU electricity sector (relative to the baseline scenario), 2013 euro/MWh
Firm 2010 2020 2030
Average price of electricity in the base case (including taxes), including the following: 133 150 158
Average cost of generation 87 106 102
Transmission costs 29 26 37
Taxes on the electricity 17 18 19
Changes compared to the base case: In lowRES
Scenario 1 -2.0 -1.4
Scenario 2 -1.9 -1.0
Scenario 3 -1.8 -0.7
Changes compared to the base case: In hiRES
Scenario 1 3.5 2.5
Scenario 2 3.3 2.1
Scenario 3 3.3 1.8

THE ROLE OF NATURAL GAS IN EUROPE’S ELECTRICITY SECTOR THROUGH 2030
ENERGYPOLICY.COLUMBIA.EDU | AUGUST 2018 | 30
Based on this analysis, the authors conclude the following. In all the scenarios discussed, a renaissance of natural gas in the EU-28 electricity sector looks unlikely. There is modest room for fuel switching and modest room for growth, but this is limited to 40 bcm on a continental scale. This helps nuance all too-generic statements that a carbon price would be good news for natural gas in the European Union, as has happened with reference to the case of the United Kingdom. Once the United Kingdom unilaterally installed its carbon price floor, natural gas did force out coal from power generation on an impressive scale. Yet it is worth keeping in mind that to allow for fuel switching, existing underutilized generation capacity must be in place. If not, utilities face a series of very different questions, which one typically faces when planning new generation capacity, regarding anticipated cost curves, possible fuel costs, and time horizons. In addition, more recent data from the United Kingdom also suggest that even though the carbon price floor did provide an incentive to incremental gas-fired power generation, soon thereafter renewables, storage, and efficiency took market share, including at the expense of natural gas. More empirical research is needed here. Admittedly, a large-scale phaseout of coal from electricity generation could make more room for gas-fired electricity generation in continental Europe, but the authors do not think this large-scale phaseout is likely, mostly for political reasons.
The data presented here suggest that natural gas for electricity generation has most promise in southern Europe, chiefly because electricity demand in this part of the continent is still growing. Remarkably, the fuel also faces the most severe headwinds from renewables in this part of the European Union. In the scenario with high carbon prices and high natural gas prices, by the end of the forecasting period, investments in renewables make more economic sense than in natural gas in this part of the European Union. Because these scenarios assume the absence of subsidies, the authors consider this outcome to be quite significant, also because, if one assumes high natural gas and carbon prices and low interest rates, the room for gas demand growth in the EU-28 will be substantially reduced. It is also worth noting that in this study the authors worked with 2015 data, and, with cost curves for RES not being static, the authors believe that this illustrates a trend in which the gap between RES and natural gas in the EU-28 will continue to narrow.
To return to one of the key questions incentivizing this research effort—namely, “Are new investments in gas infrastructure necessary in the EU?”—the answer is probably, though not overwhelmingly, yes. In the scenarios presented here, one might see room for limited growth but also for limited decline of natural gas demand in the period up to 2030, truly depending on fuel prices, carbon prices, and interest rates. As the EU gas market has developed at different speeds, this suggests that in the most mature parts of the continent, the necessity of new investments is probably lower than in the less developed parts. To give an example of the latter, in CEE, investments likely make sense to facilitate competition and, in some cases, to end single source dependence on one supplier. The authors also want to note that the development of renewable gas (e.g., biomethane and turning renewable electricity into hydrogen) is actively pushed and supported in parts of the European Union, in some
4. DISCUSSION AND CONCLUSIONS
THE ROLE OF NATURAL GAS IN EUROPE’S ELECTRICITY SECTOR THROUGH 2030
31 | CENTER ON GLOBAL ENERGY POLICY | COLUMBIA SIPA
cases being a more cost-effective solution than full electrification but extending the need for transmission and distribution networks. A broader question that applies is as follows: How does one attract capital investment in a market that does not really grow and where the success of future investments hinges on fuel and carbon prices and interest rates? More research is needed here.
The authors want to reiterate that this study has focused exclusively on the electricity sector. Though important, it constitutes roughly one-third of annual energy demand in the EU-28, and it is important to focus on other parts of the energy economy as well. Note that in the European Union, there is a major policy push underway, either supranationally and/or nationally orchestrated to decarbonize large parts of that energy economy—chiefly space heating, industry, and transportation. More work is required to better understand the consequences of such shifts, if successful, for future demand for natural gas and electricity.
Finally, in their methodology, the authors have attempted to include the costs of intermittent renewable energy sources, which too often are not part of research designs. The authors do not claim that their approach is perfect (indirect subsidies that still exist are not included, admittedly), but it must be reiterated how important it is that analyses try to capture all relevant costs of all relevant fuels and forms of energy (and equally important that policy makers get rid of subsidies for all fuel types). Otherwise, one will continue to compare apples and oranges, and these conclusions blur the nuanced complexities that policy makers and investors are trying to grapple with as the EU energy transition continues.

THE ROLE OF NATURAL GAS IN EUROPE’S ELECTRICITY SECTOR THROUGH 2030
ENERGYPOLICY.COLUMBIA.EDU | AUGUST 2018 | 32
All calculations were made for five European regions that cover 28 countries of the EU.
Table A-1: Division of EU countries into five regions
Region Countries
Western Europe (WE) Belgium, France, Germany, Ireland, Luxembourg, the Netherlands, the United Kingdom, Denmark
Northern Europe (NE) Finland, Sweden
Central and Eastern Europe (CEE) Austria, the Czech Republic, Estonia, Hungary, Latvia, Lithuania, Poland, the Slovak Republic
Mediterranean Europe (ME) Cyprus, Greece, Italy, Malta, Portugal, Spain
Southeastern Europe (SEE) Bulgaria, Croatia, Slovenia, Romania
APPENDIX A. REGIONAL SPLIT

THE ROLE OF NATURAL GAS IN EUROPE’S ELECTRICITY SECTOR THROUGH 2030
33 | CENTER ON GLOBAL ENERGY POLICY | COLUMBIA SIPA
The base year for capital, operational costs, fuel, and carbon prices is 2015. We prepared the capital costs for RES plants for five subregions (see appendix A) as an average from the Bloomberg New Energy Finance database for different RES technologies. We added IEA/NEA 2015 data where BNEF data were not provided. We used capital costs for fossil fuel plants from the IEA WEO 2015. Unfortunately, these data do not show regional cost differences.
Table B-1: Capital costs of power generation technologies by EU region in 2015, $2015/kW
Technology WE NE ME CEE SEEEU Average
RES technologies
Wind onshore, utility scale 1,860 1,860 1,730 1,890 1,780 1,820
Wind offshore, utility scale 4,650 4,650 4,650 4,650
Solar PV, utility scale 1,270 1,270 1,360 1,470 1,470 1,340
Solar PV, residential 1,630 1,630 1,750 1,890 1,890 1,720
Conventional fossil fuel technologies
CCGT (combined cycle gas) 1,000 1,000 1,000 1,000 1,000 1,000
OCGT (open gas turbine) 500 500 5,00 500 500 500
Coal ultra-supercritical 2,200 2,200 2,200 2,200 2,200 2,200
Coal supercritical 2,000 2,000 2,000 2,000 2,000 2,000
CCGT-CHP 1,300 1,300 1,300 1,300 1,300 1,300
The authors have also included the forecasted reduction in capital costs for renewable technologies based on BNEF expectations (the data for offshore wind come from the IEA’s WEO). Include here are projections into 2040, even though the analysis ends in 2030, in order to show expected trends in capital costs reductions in the long term.
Table B-2: Assumed dynamics of the RES capital costs decline in the European Union
Technology Size 2016 2020 2030 2040
Wind onshore, utility scale Utility scale 100% 99% 96% 94%
Wind offshore, utility scale Utility scale 100% 84% 70% 63%
Solar PV, utility scale Utility scale 100% 95% 67% 51%
Solar PV, residential Residential 100% 80% 53% 41%
APPENDIX B. ASSUMPTIONS FOR LCOE CALCULATIONS

THE ROLE OF NATURAL GAS IN EUROPE’S ELECTRICITY SECTOR THROUGH 2030
ENERGYPOLICY.COLUMBIA.EDU | AUGUST 2018 | 34
Operation and management (O&M) costs are estimated as averages from the BNEF country database for different RES technologies and expressed as percent of CAPEX (without regional cost differences). Further O&M cost evolutions are also reflected in the BNEF data, and these are noted in the table below. Because BNEF assumes that CAPEX reduction will be faster than O&M, the relative parameter (O&M as percent of CAPEX) increases (although $/MW value decreases). For offshore wind the 2016 value is estimated based on BNEF data; 2020–2030 values are indexed using 2016 WEIO rates of relative O&M costs changes.
Table B-3: share of O&M costs in capital costs by RES technology in the EU
Technology Size 2016 2020 2030 2040
Onshore wind Utility scale 1.3% 1.3% 1.1% 0.9%
Offshore wind Utility scale 2.7% 2.8% 3.0% 3.5%
Solar PV, no tracking Utility scale 2.3% 3.0% 3.0% 3.0%
Solar PV Residential 1.7% 1.0% 1.0% 1.0%
For RES technologies, the authors estimated capacity factors by five subregions as an average from the BNEF country database for different RES technologies. In the absence of BNEF data, IEA WEIO 2015 data were used (as EU average). For fossil fuel plants, data from EIA/NEA data were used as ranges.
Table B-4: Capacity factors of the power generation technologies in 2015 in the European Union, in percentages
Technology WE NE ME CEE SEEEU Average
RES technologies
Wind onshore, utility scale 28 32 28 27 26 27
Wind offshore, utility scale 42 41 39 41
Solar PV, utility scale 12 16 13 13 14
Solar PV, residential 20 20 20 20 20 20
Conventional fossil fuel technologies
CCGT (combined cycle gas) 50/85 50/85 50/85 50/85 50/85 50/85
OCGT (open gas turbine) 50/85 50/85 50/85 50/85 50/85 50/85
Coal ultra-supercritical 50/85 50/85 50/85 50/85 50/85 50/85
Coal supercritical 50/85 50/85 50/85 50/85 50/85 50/85
CCGT-CHP 50/85 50/85 50/85 50/85 50/85 50/85

THE ROLE OF NATURAL GAS IN EUROPE’S ELECTRICITY SECTOR THROUGH 2030
35 | CENTER ON GLOBAL ENERGY POLICY | COLUMBIA SIPA
The analysis also considered BNEF’s assumption that the capacity factor of onshore wind will increase over time.
Table B-5: Assumed dynamics of the capacity factor for the onshore wind generation in the European Union, in percentages
Technology Size 2016 2020 2030 2040
Onshore wind Utility scale 27 29 35 43
Regional fuel price differences were calculated based on ERI RAS modeling, using the Nexant World Gas Model. The regional gas and coal price differences are mainly the result of infrastructural bottlenecks in the European Union and lack of competition in some parts of the market, but they are also due to transportation costs.
Table B-6: Assumed natural gas and coal prices by EU region by scenario
WE
2030
Scen 1 Scen 2 Scen 3
Natural gas import price, $/MMBTU (GCV)
EU 7.0 8.0 10.3 11.1
Western Europe 6.8 7.9 10.1 10.9
Central and eastern Europe 7.7 8.4 10.8 11.7
Southeastern Europe 7.4 8.3 10.7 11.5
Northern Europe 6.7 6.1 7.9 8.5
Mediterranean Europe 7.1 8.1 10.4 11.2
Coal import price, $/t
EU 57 74 74 80
Western Europe 56 73 73 78
Central and eastern Europe 63 81 81 88
Southeastern Europe 62 80 80 86
Northern Europe 63 81 81 88
Mediterranean Europe 54 70 70 76
THE ROLE OF NATURAL GAS IN EUROPE’S ELECTRICITY SECTOR THROUGH 2030
ENERGYPOLICY.COLUMBIA.EDU | AUGUST 2018 | 36
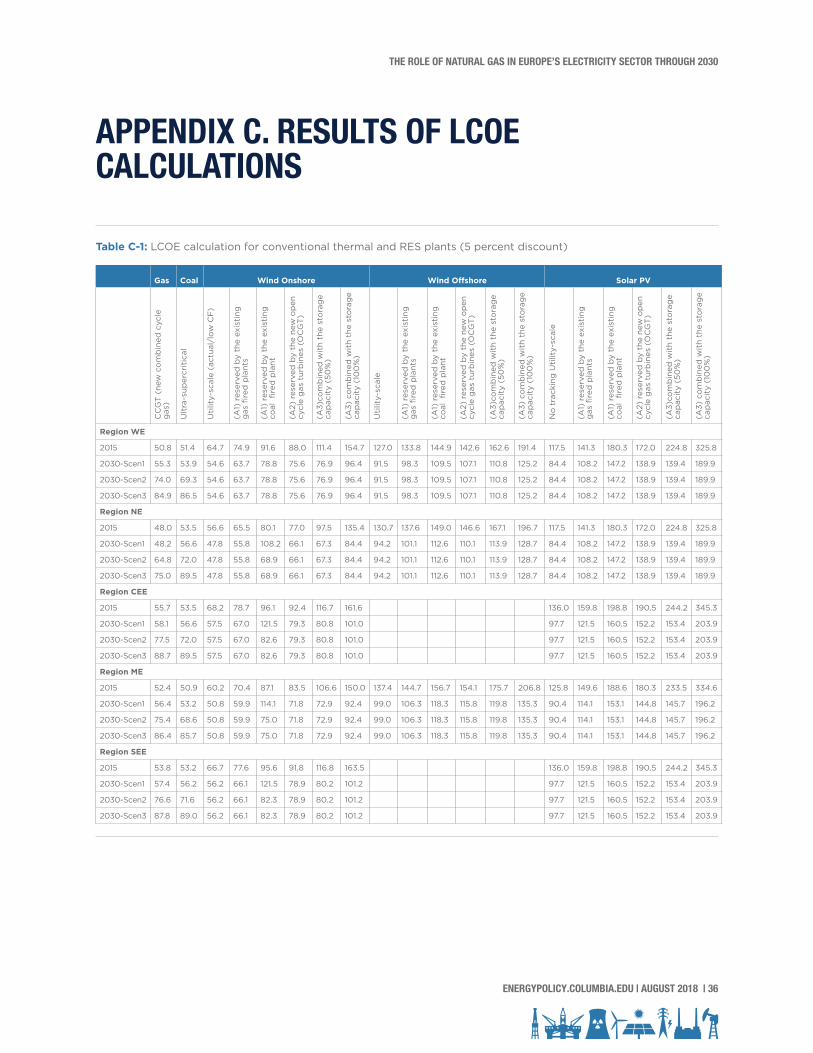
Table C-1: LCOE calculation for conventional thermal and RES plants (5 percent discount)
APPENDIX C. RESULTS OF LCOE CALCULATIONS
Gas Coal Wind Onshore Wind Offshore Solar PV
CC
GT
(ne
w c
om
bin
ed c
ycle
g
as)
Ult
ra-s
uper
crit
ical
Uti
lity-
scal
e (a
ctua
l/lo
w C
F)
(A1)
res
erve
d b
y th
e ex
isti
ng
gas
fire
d p
lant
s
(A1)
res
erve
d b
y th
e ex
isti
ng
coal
fire
d p
lant
(A2)
res
erve
d b
y th
e ne
w o
pen
cy
cle
gas
tur
bin
es (
OC
GT
)
(A3)
com
bin
ed w
ith
the
sto
rag
e ca
pac
ity
(50
%)
(A3)
co
mb
ined
wit
h th
e st
ora
ge
cap
acit
y (1
00
%)
Uti
lity-
scal
e
(A1)
res
erve
d b
y th
e ex
isti
ng
gas
fire
d p
lant
s
(A1)
res
erve
d b
y th
e ex
isti
ng
coal
fire
d p
lant
(A2)
res
erve
d b
y th
e ne
w o
pen
cy
cle
gas
tur
bin
es (
OC
GT
)
(A3)
com
bin
ed w
ith
the
sto
rag
e ca
pac
ity
(50
%)
(A3)
co
mb
ined
wit
h th
e st
ora
ge
cap
acit
y (1
00
%)
No
tra
ckin
g U
tilit
y-sc
ale
(A1)
res
erve
d b
y th
e ex
isti
ng
gas
fire
d p
lant
s
(A1)
res
erve
d b
y th
e ex
isti
ng
coal
fire
d p
lant
(A2)
res
erve
d b
y th
e ne
w o
pen
cy
cle
gas
tur
bin
es (
OC
GT
)
(A3)
com
bin
ed w
ith
the
sto
rag
e ca
pac
ity
(50
%)
(A3)
co
mb
ined
wit
h th
e st
ora
ge
cap
acit
y (1
00
%)
Region WE
2015 50.8 51.4 64.7 74.9 91.6 88.0 111.4 154.7 127.0 133.8 144.9 142.6 162.6 191.4 117.5 141.3 180.3 172.0 224.8 325.8
2030-Scen1 55.3 53.9 54.6 63.7 78.8 75.6 76.9 96.4 91.5 98.3 109.5 107.1 110.8 125.2 84.4 108.2 147.2 138.9 139.4 189.9
2030-Scen2 74.0 69.3 54.6 63.7 78.8 75.6 76.9 96.4 91.5 98.3 109.5 107.1 110.8 125.2 84.4 108.2 147.2 138.9 139.4 189.9
2030-Scen3 84.9 86.5 54.6 63.7 78.8 75.6 76.9 96.4 91.5 98.3 109.5 107.1 110.8 125.2 84.4 108.2 147.2 138.9 139.4 189.9
Region NE
2015 48.0 53.5 56.6 65.5 80.1 77.0 97.5 135.4 130.7 137.6 149.0 146.6 167.1 196.7 117.5 141.3 180.3 172.0 224.8 325.8
2030-Scen1 48.2 56.6 47.8 55.8 108.2 66.1 67.3 84.4 94.2 101.1 112.6 110.1 113.9 128.7 84.4 108.2 147.2 138.9 139.4 189.9
2030-Scen2 64.8 72.0 47.8 55.8 68.9 66.1 67.3 84.4 94.2 101.1 112.6 110.1 113.9 128.7 84.4 108.2 147.2 138.9 139.4 189.9
2030-Scen3 75.0 89.5 47.8 55.8 68.9 66.1 67.3 84.4 94.2 101.1 112.6 110.1 113.9 128.7 84.4 108.2 147.2 138.9 139.4 189.9
Region CEE
2015 55.7 53.5 68.2 78.7 96.1 92.4 116.7 161.6 136.0 159.8 198.8 190.5 244.2 345.3
2030-Scen1 58.1 56.6 57.5 67.0 121.5 79.3 80.8 101.0 97.7 121.5 160.5 152.2 153.4 203.9
2030-Scen2 77.5 72.0 57.5 67.0 82.6 79.3 80.8 101.0 97.7 121.5 160.5 152.2 153.4 203.9
2030-Scen3 88.7 89.5 57.5 67.0 82.6 79.3 80.8 101.0 97.7 121.5 160.5 152.2 153.4 203.9
Region ME
2015 52.4 50.9 60.2 70.4 87.1 83.5 106.6 150.0 137.4 144.7 156.7 154.1 175.7 206.8 125.8 149.6 188.6 180.3 233.5 334.6
2030-Scen1 56.4 53.2 50.8 59.9 114.1 71.8 72.9 92.4 99.0 106.3 118.3 115.8 119.8 135.3 90.4 114.1 153.1 144.8 145.7 196.2
2030-Scen2 75.4 68.6 50.8 59.9 75.0 71.8 72.9 92.4 99.0 106.3 118.3 115.8 119.8 135.3 90.4 114.1 153.1 144.8 145.7 196.2
2030-Scen3 86.4 85.7 50.8 59.9 75.0 71.8 72.9 92.4 99.0 106.3 118.3 115.8 119.8 135.3 90.4 114.1 153.1 144.8 145.7 196.2
Region SEE
2015 53.8 53.2 66.7 77.6 95.6 91.8 116.8 163.5 136.0 159.8 198.8 190.5 244.2 345.3
2030-Scen1 57.4 56.2 56.2 66.1 121.5 78.9 80.2 101.2 97.7 121.5 160.5 152.2 153.4 203.9
2030-Scen2 76.6 71.6 56.2 66.1 82.3 78.9 80.2 101.2 97.7 121.5 160.5 152.2 153.4 203.9
2030-Scen3 87.8 89.0 56.2 66.1 82.3 78.9 80.2 101.2 97.7 121.5 160.5 152.2 153.4 203.9

THE ROLE OF NATURAL GAS IN EUROPE’S ELECTRICITY SECTOR THROUGH 2030
37 | CENTER ON GLOBAL ENERGY POLICY | COLUMBIA SIPA
Table C-2: LCOE calculation for conventional thermal and RES plants (10 percent discount)
Gas Coal Wind Onshore Wind Offshore Solar PV
CC
GT
(ne
w c
om
bin
ed c
ycle
g
as)
Ult
ra-s
uper
crit
ical
Uti
lity-
scal
e (a
ctua
l/lo
w C
F)
(A1)
res
erve
d b
y th
e ex
isti
ng
gas
fire
d p
lant
s
(A1)
res
erve
d b
y th
e ex
isti
ng
coal
fire
d p
lant
(A2)
res
erve
d b
y th
e ne
w o
pen
cy
cle
gas
tur
bin
es (
OC
GT
)
(A3)
com
bin
ed w
ith
the
sto
rag
e ca
pac
ity
(50
%)
(A3)
co
mb
ined
wit
h th
e st
ora
ge
cap
acit
y (1
00
%)
Uti
lity-
scal
e
(A1)
res
erve
d b
y th
e ex
isti
ng
gas
fire
d p
lant
s
(A1)
res
erve
d b
y th
e ex
isti
ng
coal
fire
d p
lant
(A2)
res
erve
d b
y th
e ne
w o
pen
cy
cle
gas
tur
bin
es (
OC
GT
)
(A3)
com
bin
ed w
ith
the
sto
rag
e ca
pac
ity
(50
%)
(A3)
co
mb
ined
wit
h th
e st
ora
ge
cap
acit
y (1
00
%)
No
tra
ckin
g U
tilit
y-sc
ale
(A1)
res
erve
d b
y th
e ex
isti
ng
gas
fire
d p
lant
s
(A1)
res
erve
d b
y th
e ex
isti
ng
coal
fire
d p
lant
(A2)
res
erve
d b
y th
e ne
w o
pen
cy
cle
gas
tur
bin
es (
OC
GT
)
(A3)
com
bin
ed w
ith
the
sto
rag
e ca
pac
ity
(50
%)
(A3)
co
mb
ined
wit
h th
e st
ora
ge
cap
acit
y (1
00
%)
Region WE
2015 57.3 67.6 94.9 105.1 121.8 127.8 160.0 220.2 181.5 188.3 199.5 203.5 231.2 271.3 170.6 194.4 233.4 247.4 319.9 460.3
2030-Scen1 61.8 70.1 80.7 89.8 104.9 110.3 112.0 139.1 129.7 136.5 147.7 151.7 156.6 176.6 120.0 143.7 182.7 196.8 196.4 266.6
2030-Scen2 80.5 85.5 80.7 89.8 104.9 110.3 112.0 139.1 129.7 136.5 147.7 151.7 156.6 176.6 120.0 143.7 182.7 196.8 196.4 266.6
2030-Scen3 91.4 102.7 80.7 89.8 104.9 110.3 112.0 139.1 129.7 136.5 147.7 151.7 156.6 176.6 120.0 143.7 182.7 196.8 196.4 266.6
Region NE
2015 54.5 69.8 83.0 91.9 106.6 111.8 140.0 192.7 186.8 193.7 205.1 209.2 237.7 278.8 170.6 194.4 233.4 247.4 319.9 460.3
2030-Scen1 54.7 72.9 70.6 78.6 143.7 96.5 98.0 121.7 133.5 140.4 151.8 155.9 161.0 181.6 120.0 143.7 182.7 196.8 196.4 266.6
2030-Scen2 71.2 88.3 70.6 78.6 91.8 96.5 98.0 121.7 133.5 140.4 151.8 155.9 161.0 181.6 120.0 143.7 182.7 196.8 196.4 266.6
2030-Scen3 81.5 105.7 70.6 78.6 91.8 96.5 98.0 121.7 133.5 140.4 151.8 155.9 161.0 181.6 120.0 143.7 182.7 196.8 196.4 266.6
Region CEE
2015 62.2 69.8 100.0 110.6 127.9 134.1 167.6 230.0 197.4 221.2 260.2 274.2 348.2 488.6
2030-Scen1 64.5 72.9 85.0 94.5 162.6 115.7 117.6 145.6 138.8 162.6 201.6 215.6 216.3 286.5
2030-Scen2 84.0 88.3 85.0 94.5 110.1 115.7 117.6 145.6 138.8 162.6 201.6 215.6 216.3 286.5
2030-Scen3 95.2 105.7 85.0 94.5 110.1 115.7 117.6 145.6 138.8 162.6 201.6 215.6 216.3 286.5
Region ME
2015 58.8 67.1 88.3 98.5 115.2 121.2 153.1 213.2 196.3 203.7 215.7 220.0 249.9 293.1 182.7 206.5 245.5 259.5 332.6 473.0
2030-Scen1 62.9 69.4 75.0 84.2 152.2 104.7 106.1 133.1 140.3 147.6 159.6 163.9 169.3 190.9 128.5 152.2 191.2 205.3 205.4 275.6
2030-Scen2 81.9 84.8 75.0 84.2 99.3 104.7 106.1 133.1 140.3 147.6 159.6 163.9 169.3 190.9 128.5 152.2 191.2 205.3 205.4 275.6
2030-Scen3 92.9 102.0 75.0 84.2 99.3 104.7 106.1 133.1 140.3 147.6 159.6 163.9 169.3 190.9 128.5 152.2 191.2 205.3 205.4 275.6
Region SEE
2015 60.3 69.4 97.8 108.8 126.8 133.2 167.7 232.5 197.4 221.2 260.2 274.2 348.2 488.6
2030-Scen1 63.9 72.4 83.1 93.0 162.6 115.0 116.7 145.8 138.8 162.6 201.6 215.6 216.3 286.5
2030-Scen2 83.1 87.8 83.1 93.0 109.2 115.0 116.7 145.8 138.8 162.6 201.6 215.6 216.3 286.5
2030-Scen3 94.3 105.2 83.1 93.0 109.2 115.0 116.7 145.8 138.8 162.6 201.6 215.6 216.3 286.5

THE ROLE OF NATURAL GAS IN EUROPE’S ELECTRICITY SECTOR THROUGH 2030
ENERGYPOLICY.COLUMBIA.EDU | AUGUST 2018 | 38
Table C-3 (PART 1): Competitiveness of new coal and RES plants to GGCT by regions of EU-28 and fuel/carbon scenarios in 2015 and 2030
2015 5% discount rate 10% discount rate
5% discount rate WE NE CEE ME SEE WE NE CEE ME SEE
Coal ultra-supercritical 1% 11% -4% -3% -1% 18% 28% 12% 14% 15%
Wind onshore, utility scale
LCOE without effects high CF 27% 18% 22% 15% 24% 66% 52% 61% 50% 62%
LCOE without effects low CF 27% 18% 22% 15% 24% 66% 52% 61% 50% 62%
(A1) 47% 36% 41% 34% 44% 83% 69% 78% 67% 80%
(A2) 73% 60% 66% 60% 71% 123% 105% 116% 106% 121%
(A3), 100% 204% 182% 190% 186% 204% 284% 253% 270% 262% 286%
(B1) 26% 25% 19% 20% 22% 55% 57% 44% 47% 49%
(B2) 22% 21% 17% 17% 19% 39% 39% 33% 33% 35%
(B3) 202% 179% 196% 183% 200% 274% 243% 274% 250% 273%
Wind offshore, utility scale
LCOE without effects 150% 172% 162% 217% 243% 234%
(A1) 163% 187% 176% 229% 255% 246%
(A2) 180% 205% 194% 255% 284% 274%
(A3), 100% 277% 310% 295% 373% 411% 398%
(B1) 129% 145% 131% 209% 230% 210%
(B2) 103% 114% 105% 144% 155% 145%
(B3) 274% 306% 290% 361% 396% 381%
Solar PV, no tracking, utility scale
LCOE without effects 131% 145% 144% 140% 153% 198% 213% 218% 211% 228%
(A1) 178% 194% 187% 186% 197% 239% 257% 256% 251% 267%
(A2) 238% 258% 242% 244% 254% 332% 354% 341% 341% 355%
(A3), 100% 541% 578% 520% 539% 542% 703% 744% 686% 704% 711%
(B1) 33% 37% 33% 38% 39% 55% 60% 54% 63% 64%
(B2) 28% 30% 28% 33% 33% 39% 41% 41% 47% 46%
(B3) 537% 572% 533% 531% 535% 682% 720% 693% 676% 684%
Area of equal efficiency (LCOE difference is less than 10%)
More efficient than CCGT (LCOE lower than LCOE of CCGT by more than 10%)
Area of potential equal efficiency (LCOE higher than LCOE of CCGT by 10–25%)

THE ROLE OF NATURAL GAS IN EUROPE’S ELECTRICITY SECTOR THROUGH 2030
39 | CENTER ON GLOBAL ENERGY POLICY | COLUMBIA SIPA
Table C-3 (PART 2): Competitiveness of new coal and RES plants to GGCT by regions of EU-28 and fuel/carbon scenarios in 2015 and 2030
2030-Scen1 5% discount rate 10% discount rate
5% discount rate WE NE CEE ME SEE WE NE CEE ME SEE
Coal ultra-supercritical -3% 18% -2% -6% -2% 13% 33% 13% 10% 13%
Wind onshore, utility scale
LCOE without effects low CF -1% -1% -1% -10% -2% 31% 29% 32% 19% 30%
(A1) 15% 16% 15% 6% 15% 45% 44% 46% 34% 46%
(A2) 37% 37% 37% 27% 37% 78% 77% 79% 66% 80%
(A3), 100% 74% 75% 74% 64% 76% 125% 123% 126% 112% 128%
(B1) 12% 16% 10% 7% 10% 37% 46% 33% 31% 34%
(B2) 14% 19% 12% 10% 13% 32% 39% 29% 28% 30%
(B3) 74% 74% 78% 62% 75% 120% 116% 128% 105% 122%
Wind offshore, utility scale
LCOE without effects 65% 95% 75% 110% 144% 123%
(A1) 78% 110% 88% 121% 157% 135%
(A2) 94% 129% 105% 145% 185% 161%
(A3), 100% 126% 167% 140% 186% 232% 203%
(B1) 64% 89% 68% 115% 148% 118%
(B2) 53% 71% 56% 82% 101% 84%
(B3) 126% 165% 138% 180% 223% 195%
Solar PV, no tracking, utility scale
LCOE without effects 52% 75% 68% 60% 70% 94% 119% 115% 104% 117%
(A1) 95% 125% 109% 102% 112% 133% 163% 152% 142% 155%
(A2) 151% 188% 162% 157% 165% 218% 260% 234% 226% 238%
(A3), 100% 243% 294% 251% 248% 255% 331% 388% 344% 338% 349%
(B1) 16% 22% 18% 19% 20% 29% 37% 31% 35% 35%
(B2) 14% 19% 16% 18% 18% 22% 26% 24% 27% 27%
(B3) 243% 291% 259% 245% 253% 323% 374% 349% 325% 336%
Area of equal efficiency (LCOE difference is less than 10%)
More efficient than CCGT (LCOE lower than LCOE of CCGT by more than 10%)
Area of potential equal efficiency (LCOE higher than LCOE of CCGT by 10–25%)

THE ROLE OF NATURAL GAS IN EUROPE’S ELECTRICITY SECTOR THROUGH 2030
ENERGYPOLICY.COLUMBIA.EDU | AUGUST 2018 | 40
Table C-3 (PART 3): Competitiveness of new coal and RES plants to GGCT by regions of EU-28 and fuel/carbon scenarios in 2015 and 2030
2030-Scen2 5% discount rate 10% discount rate
5% discount rate WE NE CEE ME SEE WE NE CEE ME SEE
Coal ultra-supercritical -6% 11% -7% -9% -7% 6% 24% 5% 4% 6%
Wind onshore, utility scale
LCOE without effects low CF -26% -26% -26% -33% -27% 0% -1% 1% -8% 0%
(A1) -14% -14% -13% -21% -14% 12% 10% 13% 3% 12%
(A2) 2% 2% 2% -5% 3% 37% 35% 38% 28% 38%
(A3), 100% 30% 30% 30% 23% 32% 73% 71% 73% 63% 75%
(B1) -5% -4% -4% -8% -5% 13% 17% 12% 9% 12%
(B2) -1% 0% -2% -5% -2% 14% 18% 13% 11% 13%
(B3) 32% 31% 34% 23% 33% 72% 69% 77% 61% 74%
Wind offshore, utility scale
LCOE without effects 24% 45% 31% 61% 87% 71%
(A1) 33% 56% 41% 70% 97% 80%
(A2) 45% 70% 54% 89% 119% 100%
(A3), 100% 69% 99% 79% 120% 155% 133%
(B1) 28% 45% 32% 64% 87% 68%
(B2) 25% 39% 28% 50% 65% 53%
(B3) 71% 100% 81% 119% 152% 131%
Solar PV, no tracking, utility scale
LCOE without effects 14% 30% 26% 20% 27% 49% 68% 65% 57% 67%
(A1) 46% 67% 57% 51% 59% 79% 102% 94% 86% 96%
(A2) 88% 114% 96% 92% 99% 145% 176% 157% 151% 159%
(A3), 100% 157% 193% 163% 160% 166% 231% 274% 241% 237% 245%
(B1) 6% 10% 8% 8% 9% 16% 21% 18% 19% 20%
(B2) 6% 10% 8% 9% 9% 13% 17% 15% 17% 17%
(B3) 160% 195% 171% 162% 168% 230% 270% 248% 233% 241%
Area of equal efficiency (LCOE difference is less than 10%)
More efficient than CCGT (LCOE lower than LCOE of CCGT by more than 10%)
Area of potential equal efficiency (LCOE higher than LCOE of CCGT by 10–25%)
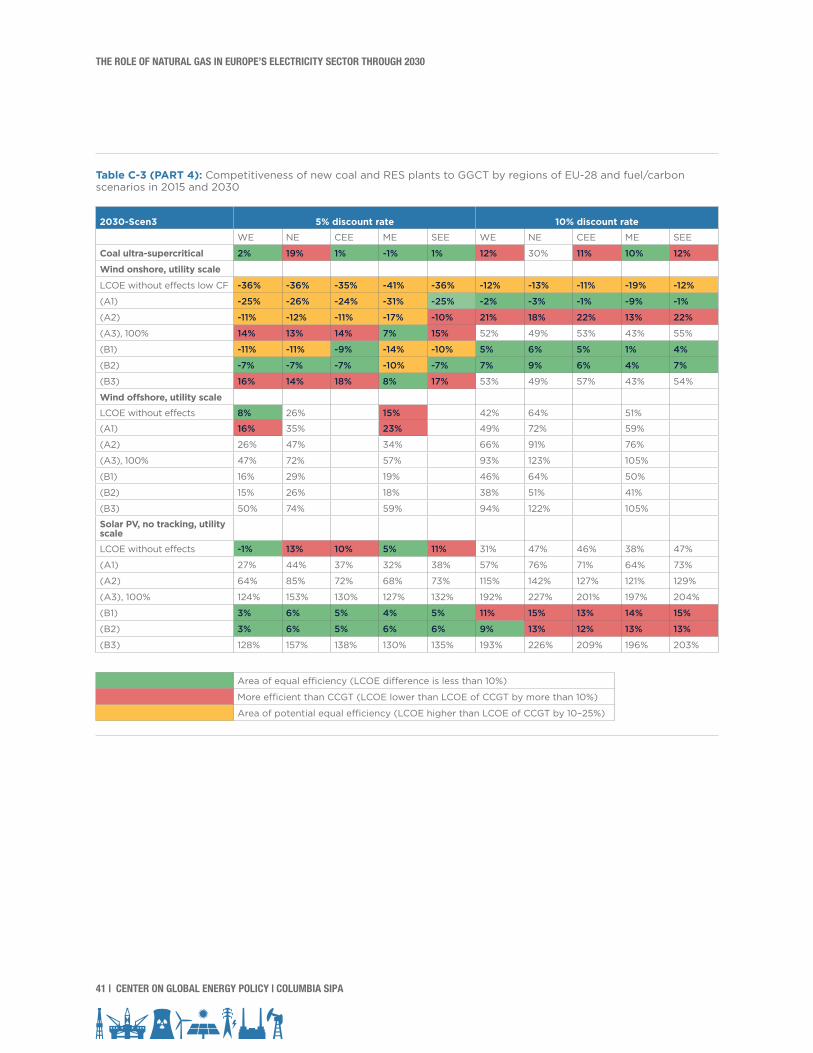
THE ROLE OF NATURAL GAS IN EUROPE’S ELECTRICITY SECTOR THROUGH 2030
41 | CENTER ON GLOBAL ENERGY POLICY | COLUMBIA SIPA
Table C-3 (PART 4): Competitiveness of new coal and RES plants to GGCT by regions of EU-28 and fuel/carbon scenarios in 2015 and 2030
2030-Scen3 5% discount rate 10% discount rate
5% discount rate WE NE CEE ME SEE WE NE CEE ME SEE
Coal ultra-supercritical 2% 19% 1% -1% 1% 12% 30% 11% 10% 12%
Wind onshore, utility scale
LCOE without effects low CF -36% -36% -35% -41% -36% -12% -13% -11% -19% -12%
(A1) -25% -26% -24% -31% -25% -2% -3% -1% -9% -1%
(A2) -11% -12% -11% -17% -10% 21% 18% 22% 13% 22%
(A3), 100% 14% 13% 14% 7% 15% 52% 49% 53% 43% 55%
(B1) -11% -11% -9% -14% -10% 5% 6% 5% 1% 4%
(B2) -7% -7% -7% -10% -7% 7% 9% 6% 4% 7%
(B3) 16% 14% 18% 8% 17% 53% 49% 57% 43% 54%
Wind offshore, utility scale
LCOE without effects 8% 26% 15% 42% 64% 51%
(A1) 16% 35% 23% 49% 72% 59%
(A2) 26% 47% 34% 66% 91% 76%
(A3), 100% 47% 72% 57% 93% 123% 105%
(B1) 16% 29% 19% 46% 64% 50%
(B2) 15% 26% 18% 38% 51% 41%
(B3) 50% 74% 59% 94% 122% 105%
Solar PV, no tracking, utility scale
LCOE without effects -1% 13% 10% 5% 11% 31% 47% 46% 38% 47%
(A1) 27% 44% 37% 32% 38% 57% 76% 71% 64% 73%
(A2) 64% 85% 72% 68% 73% 115% 142% 127% 121% 129%
(A3), 100% 124% 153% 130% 127% 132% 192% 227% 201% 197% 204%
(B1) 3% 6% 5% 4% 5% 11% 15% 13% 14% 15%
(B2) 3% 6% 5% 6% 6% 9% 13% 12% 13% 13%
(B3) 128% 157% 138% 130% 135% 193% 226% 209% 196% 203%
Area of equal efficiency (LCOE difference is less than 10%)
More efficient than CCGT (LCOE lower than LCOE of CCGT by more than 10%)
Area of potential equal efficiency (LCOE higher than LCOE of CCGT by 10–25%)

THE ROLE OF NATURAL GAS IN EUROPE’S ELECTRICITY SECTOR THROUGH 2030
ENERGYPOLICY.COLUMBIA.EDU | AUGUST 2018 | 42
Table D-1 (PART 1): Characteristics of the alternative development scenarios for the EU-28 electric power sector
2010
Base Case LowRES Case HighRES Case
2015 2020 2025 2030
CAA GR*), 2020–2030 2015 2020
CAA GR, 2020–2030 2015 2020
CAA GR, 2020–2030
Gross electricity generation by source (GWhe)
3332773 3251309 3357685 3430637 3527528 0.5% 3430637 3527528 0.5% 3430637 3527528 0.5%
Nuclear energy
916610 867402 772986 717746 777743 0.1% 717746 777743 0.1% 717746 777743 0.1%
Solids 830393 846834 767262 655378 562741 -3.1% 655378 562741 -3.1% 655378 562741 -3.1%
Oil (including refinery gas)
86899 34609 21835 21271 19341 -1.2% 21271 19341 -1.2% 21271 19341 -1.2%
Gas (including derived gases)
798645 566075 580999 682078 654930 1.2% 775979 853949 3.9% 588176 455912 -2.4%
Biomass and waste
145814 188813 213112 249701 283469 2.9% 249701 283469 2.9% 249701 283469 2.9%
Hydro (pumping excluded)
375785 362415 375589 375481 378979 0.1% 375481 378979 0.1% 375481 378979 0.1%
Wind 149278 274278 462720 527399 608460 2.8% 469886 481560 0.4% 584912 735360 4.7%
Solar 22502 103798 154722 192666 232129 4.1% 156278 160010 0.3% 229054 304247 7.0%
Geothermal and other renewables
6847 7086 8461 8916 9736 1.4% 8916 9736 1.4% 8916 9736 1.4%
Other fuels (hydrogen, methanol)
0 0 0 0 0 0.0% 0 0 0.0% 0 0 0.0%
*CAAGR—compound average annual growth rate
APPENDIX D. TABLES FOR THE ALTERNATIVE CASES OF THE EUROPEAN POWER GENERATION MIX

THE ROLE OF NATURAL GAS IN EUROPE’S ELECTRICITY SECTOR THROUGH 2030
43 | CENTER ON GLOBAL ENERGY POLICY | COLUMBIA SIPA
Table D-1 (PART 2): Characteristics of the alternative development scenarios for the EU-28 electric power sector
2010
Base Case LowRES Case HighRES Case
2015 2020 2025 2030
CAA GR*), 2020–2030 2015 2020
CAA GR, 2020–2030 2015 2020
CAA GR, 2020–2030
Net generation capacity (MWe)
857866 964728 1028650 1023924 1058200 0.3% 982727 969133 -0.6% 1120221 1255472 2.0%
Nuclear energy
132606 120798 114204 105051 109905 -0.4% 105051 109905 -0.4% 105051 109905 -0.4%
Solids 180110 176559 146098 117592 100874 -3.6% 117592 100874 -3.6% 117592 100874 -3.6%
Oil (including refinery gas)
69295 53085 31168 20532 15215 -6.9% 20532 15215 -6.9% 20532 15215 -6.9%
Gas (including derived gases)
215485 219628 210322 209734 208392 -0.1% 209734 208392 -0.1% 257882 307029 3.9%
Biomass and waste
21719 27908 51668 52240 53229 0.3% 52240 53229 0.3% 52240 53229 0.3%
Hydro (pumping excluded)
122922 127470 131473 132043 133190 0.1% 132043 133190 0.1% 132043 133190 0.1%
Wind 85701 141580 207219 228221 255388 2.1% 208086 209450 0.1% 251386 306362 4.0%
Solar 29774 97443 135999 157808 180956 2.9% 136747 137828 0.1% 182792 228619 5.3%
Geothermal and other renewables
241 244 486 690 1038 7.9% 690 1038 7.9% 690 1038 7.9%
Other fuels (hydrogen, methanol)
13 13 13 13 13 0.0% 13 13 0.0% 13 13 0.0%
*CAAGR—compound average annual growth rate

THE ROLE OF NATURAL GAS IN EUROPE’S ELECTRICITY SECTOR THROUGH 2030
ENERGYPOLICY.COLUMBIA.EDU | AUGUST 2018 | 44
Table D-1 (PART 3): Characteristics of the alternative development scenarios for the EU-28 electric power sector
2010
Base Case LowRES Case HighRES Case
2015 2020 2025 2030
CAA GR*), 2020–2030 2015 2020
CAA GR, 2020–2030 2015 2020
CAA GR, 2020–2030
Fuel inputs to thermal power generation (ktoe)
416477 351894 338506 336440 311420 -0.8% 352456 344696 0.2% 320425 278144 -1.9%
Solids 197694 200223 177079 151231 128800 -3.1% 151231 128800 -3.1% 151231 128800 -3.1%
Oil (including refinery gas)
20566 7340 5019 5161 4854 -0.3% 5161 4854 -0.3% 5161 4854 -0.3%
Gas (including derived gases)
151968 100069 98665 115545 109049 1.0% 131560 142325 3.7% 99530 75773 -2.6%
Biomass and waste
41420 43077 55812 62571 66786 1.8% 62571 66786 1.8% 62571 66786 1.8%
Wind 4828 1184 1932 1932 1932 0.0% 1932 1932 0.0% 1932 1932 0.0%
Geothermal heat
0 0 0 0 0 0.0% 0 0 0.0% 0 0 0.0%
Hydrogen, methanol
13 13 13 13 13 0.0% 13 13 0.0% 13 13 0.0%
*CAAGR—compound average annual growth rate
Table D-1 (PART 4): Characteristics of the alternative development scenarios for the EU-28 electric power sector
2010
Base Case LowRES Case HighRES Case
2015 2020 2025 2030
CAA GR*), 2020–2030 2015 2020
CAA GR, 2020–2030 2015 2020
CAA GR, 2020–2030
CO2 Emissions, Mt of CO2 eq.
1320 1155 1043 975 860 -1.9% 1017.1 946.6 -1.0% 933.5 772.9 -3.0%
*CAAGR—compound average annual growth rate

THE ROLE OF NATURAL GAS IN EUROPE’S ELECTRICITY SECTOR THROUGH 2030
45 | CENTER ON GLOBAL ENERGY POLICY | COLUMBIA SIPA
Table D-2 (PART 1): Deviation of total discounted costs (TDC) in the alternative cases of the EU power sector development (relative to the base case), given variations in fuel and CO2 prices and discount rates, mln. US dollars
LowRES, 5% discount rate HighRES, 5% discount rate
2021-2030 2031-2040 2021-2040 2021-2030 2031-2040 2021-2040
Scenario 1
Total costs variation -76070 39078 -36992 136932 -36721 100212
Capital costs: -103306 0 -103306 161134 0 161134
Wind -66734 0 -66734 74485 0 74485
Solar -36572 0 -36572 41082 0 41082
Conventional thermal 0 0 0 45567 0 45567
O&M costs: -9507 -11415 -20922 12542 13772 26314
Wind -4477 -5648 -10124 5068 6284 11352
Solar -5031 -5767 -10798 5788 6426 12214
Conventional thermal 0 0 0 1686 1063 2749
Fuel Costs 35066 48434 83500 -35066 -48434 -83500
CO2 payments 1678 2059 3736 -1678 -2059 -3736
Scenario 2
Total costs variation -63244 68982 5738 124107 -66624 57482
Capital costs: -103306 0 -103306 161134 0 161134
Wind -66734 0 -66734 74485 0 74485
Solar -36572 0 -36572 41082 0 41082
Conventional thermal 0 0 0 45567 0 45567
O&M costs: -9507 -11415 -20922 12542 13772 26314
Wind -4477 -5648 -10124 5068 6284 11352
Solar -5031 -5767 -10798 5788 6426 12214
Conventional thermal 0 0 0 1686 1063 2749
Fuel Costs 42298 70104 112402 -42298 -70104 -112402
CO2 payments 7271 10293 17564 -7271 -10293 -17564
Scenario 3
Total costs variation -54941 84371 29430 115804 -82013 33790
Capital costs: -103306 0 -103306 161134 0 161134
Wind -66734 0 -66734 74485 0 74485
Solar -36572 0 -36572 41082 0 41082
Conventional thermal 0 0 0 45567 0 45567
O&M costs: -9507 -11415 -20922 12542 13772 26314
Wind -4477 -5648 -10124 5068 6284 11352
Solar -5031 -5767 -10798 5788 6426 12214
Conventional thermal 0 0 0 1686 1063 2749
Fuel Costs 45059 77259 122318 -45059 -77259 -122318
CO2 payments 12813 18527 31340 -12813 -18527 -31340

THE ROLE OF NATURAL GAS IN EUROPE’S ELECTRICITY SECTOR THROUGH 2030
ENERGYPOLICY.COLUMBIA.EDU | AUGUST 2018 | 46
Table D-2 (PART 2): Deviation of total discounted costs (TDC) in the alternative cases of the EU power sector development (relative to the base case), given variations in fuel and CO2 prices and discount rates, mln. US dollars
LowRES, 5% discount rate HighRES, 5% discount rate
2021-2030 2031-2040 2021-2040 2021-2030 2031-2040 2021-2040
Scenario 1
Total costs variation -61815 19529 -42286 110507 -18351 92157
Capital costs: -81745 0 -81745 128087 0 128087
Wind -52317 0 -52317 58620 0 58620
Solar -29429 0 -29429 33304 0 33304
Conventional thermal 0 0 0 36163 0 36163
O&M costs: -7013 -5704 -12718 9364 6883 16247
Wind -3287 -2822 -6109 3728 3140 6868
Solar -3726 -2882 -6608 4299 3211 7510
Conventional thermal 0 0 0 1338 531 1869
Fuel Costs 25709 24204 49913 -25709 -24204 -49913
CO2 payments 1235 1029 2264 -1235 -1029 -2264
Scenario 2
Total costs variation -52677 34473 -18204 101369 -33295 68074
Capital costs: -81745 0 -81745 128087 0 128087
Wind -52317 0 -52317 58620 0 58620
Solar -29429 0 -29429 33304 0 33304
Conventional thermal 0 0 0 36163 0 36163
O&M costs: -7013 -5704 -12718 9364 6883 16247
Wind -3287 -2822 -6109 3728 3140 6868
Solar -3726 -2882 -6608 4299 3211 7510
Conventional thermal 0 0 0 1338 531 1869
Fuel Costs 30807 35034 65841 -30807 -35034 -65841
CO2 payments 5275 5144 10419 -5275 -5144 -10419
Scenario 3
Total costs variation -46712 42163 -4549 95405 -40985 54419
Capital costs: -81745 0 -81745 128087 0 128087
Wind -52317 0 -52317 58620 0 58620
Solar -29429 0 -29429 33304 0 33304
Conventional thermal 0 0 0 36163 0 36163
O&M costs: -7013 -5704 -12718 9364 6883 16247
Wind -3287 -2822 -6109 3728 3140 6868
Solar -3726 -2882 -6608 4299 3211 7510
Conventional thermal 0 0 0 1338 531 1869
Fuel Costs 32779 38609 71388 -32779 -38609 -71388
CO2 payments 9268 9259 18527 -9268 -9259 -18527

THE ROLE OF NATURAL GAS IN EUROPE’S ELECTRICITY SECTOR THROUGH 2030
47 | CENTER ON GLOBAL ENERGY POLICY | COLUMBIA SIPA
Table D-2 (PART 3): Deviation of total discounted costs (TDC) in the alternative cases of the EU power sector development (relative to the base case), given variations in fuel and CO2 prices and discount rates, mln. US dollars
LowRES, 5% discount rate HighRES, 5% discount rate
2021-2030 2031-2040 2021-2040 2021-2030 2031-2040 2021-2040
Scenario 1
Total costs variation -68025 25218 -42806 120478 -23739 96739
Capital costs: -90038 0 -90038 139955 0 139955
Wind -58226 0 -58226 64910 0 64910
Solar -31812 0 -31812 35617 0 35617
Conventional thermal 0 0 0 39428 0 39428
O&M costs: -7809 -7687 -15496 10345 9166 19511
Wind -3676 -3872 -7548 4151 4268 8419
Solar -4133 -3815 -7948 4736 4160 8896
Conventional thermal 0 0 0 1459 737 2196
Fuel Costs 28457 31553 60009 -28457 -31553 -60009
CO2 payments 1366 1353 2718 -1366 -1353 -2718
Scenario 2
Total costs variation -57791 44722 -13068 110244 -43243 67001
Capital costs: -90038 0 -90038 139955 0 139955
Wind -58226 0 -58226 64910 0 64910
Solar -31812 0 -31812 35617 0 35617
Conventional thermal 0 0 0 39428 0 39428
O&M costs: -7809 -7687 -15496 10345 9166 19511
Wind -3676 -3872 -7548 4151 4268 8419
Solar -4133 -3815 -7948 4736 4160 8896
Conventional thermal 0 0 0 1459 737 2196
Fuel Costs 34190 45647 79836 -34190 -45647 -79836
CO2 payments 5867 6763 12630 -5867 -6763 -12630
Scenario 3
Total costs variation -51132 54787 3655 103585 -53308 50277
Capital costs: -90038 0 -90038 139955 0 139955
Wind -58226 0 -58226 64910 0 64910
Solar -31812 0 -31812 35617 0 35617
Conventional thermal 0 0 0 39428 0 39428
O&M costs: -7809 -7687 -15496 10345 9166 19511
Wind -3676 -3872 -7548 4151 4268 8419
Solar -4133 -3815 -7948 4736 4160 8896
Conventional thermal 0 0 0 1459 737 2196
Fuel Costs 36395 50301 86696 -36395 -50301 -86696
CO2 payments 10321 12173 22493 -10321 -12173 -22493

THE ROLE OF NATURAL GAS IN EUROPE’S ELECTRICITY SECTOR THROUGH 2030
ENERGYPOLICY.COLUMBIA.EDU | AUGUST 2018 | 48
1. It is worth noting that all fuel sources are subsidized one way or the other (see IMF [2015]), and most debates about the competitiveness of various fuel sources are at risk of being a comparison between apples and oranges. This issue will be further discussed later in this paper.
2. “Low-carbon demand and high-carbon risks in EU Investment Plan,” Louisa Casson, E3G, 28 January 2015, https://www.e3g.org/library/low-carbon-demand-and-high-carbon-risks-in-eu-investment-plan.
3. Tim Boersma, Tatiana Mitrova, Geert Greving, Anna Galkina, “Business As Usual - European Gas Market Functioning in Times of Turmoil and Increasing Import Dependence,” Policy Brief 14-05, Brookings Institution, October 2014, https://www.brookings.edu/wp-content/uploads/2016/07/business_as_usual_final_3.pdf.
4. Stern, 2017, https://www.oxfordenergy.org/wpcms/wp-content/uploads/2017/01/The-Future-of-Gas-in-Decarbonising-European-Energy-Markets-the-need-for-a-new-approach-NG-116.pdf.
5. A. Honoré, in “What Outlook for European Gas Demand? An Overview of Possible Scenarios,” The European Gas Markets—Challenges and Opportunities, eds. Hafner and Tagliapietra (Cham: Palgrave MacMillan, 2017).
6. M. Hafner and S. Tagliapietra, in “The Role of Natural Gas in the EU Decarbonization Path,” The European Gas Markets—Challenges and Opportunities, eds. Hafner and Tagliapietra (Cham: Palgrave MacMillan, 2017).
7. https://ec.europa.eu/energy/sites/ener/files/documents/20160713%20draft_publication_REF2016_v13.pdf.
8. “Projected Costs of Generating Electricity,” OECD/IEA, 2015.
9. Of course, grid connection costs are associated with all types of power plants (and they are considered as part of a plant’s capital and operation costs in the LCOE calculation). These costs are highly dependent on the location of plant and the structure of the grid, and usually they are not explicitly considered at this level of analysis.
10. This excepts the small share that can be statistically estimated and guaranteed as available regardless of the weather conditions during peak hours (so-called capacity credit).
11. The authors estimated LF for each of EU subregions based on Eurostat and ENTSO-E data.
12. ENTSO-E Ten-Year Network Development Plan, http://tyndp.entsoe.eu/; ENTSO-E Mid-term Adequacy Forecast, https://www.entsoe.eu/outlooks/maf/Pages/default.aspx.
13. The element of fuel costs within TDC takes account of gas price changes in the period of 2020–2030.
NOTES

THE ROLE OF NATURAL GAS IN EUROPE’S ELECTRICITY SECTOR THROUGH 2030
49 | CENTER ON GLOBAL ENERGY POLICY | COLUMBIA SIPA