the role of financial advisors in the us retirement · pdf fileiii about this report there has...
TRANSCRIPT

The role of financial advisors in the US retirement market
JULY 10, 2015
ii
Contents
Contents ii
About this report iii
Executive summary 1
Key findings 5
I. Role of financial advisors in the defined contribution plan market 8
II. Role of financial advisors in helping individuals save for retirement 16
Appendix I. 41
Appendix II. 43
Report qualifications/assumptions and limiting conditions 45

iii
About this report
There has been substantial public debate recently about the value of financial advice and the importance of financial advisors. Many people continue to believe financial advisors perform a critical service helping individuals and small businesses successfully navigate complex financial challenges. Others have sought to portray financial advisors as self-interested salesmen and saleswomen, who provide conflicted advice to sell high cost products. Against this background, Oliver Wyman was engaged to perform a rigorous investigation of the role of financial advisors in the US retirement market, and quantify differences in investing behavior and outcomes between advised and non-advised individuals.
In this report, Oliver Wyman focuses on understanding the impact of financial advisors on individuals saving for retirement and small businesses setting up and maintaining a workplace sponsored retirement plan. Through a combination of proprietary research with individuals and small businesses and analysis of unparalleled datasets from IXI (a division of Equifax), we found that advised individuals and small businesses are better off in many of the ways that matter most for superior investing outcomes.
The benefits financial advisors provide are now at risk. On April 14, 2015, the Department of Labor issued its Conflict of Interest rule proposal, a replacement for the Definition of the Term “Fiduciary” rule proposal withdrawn in September 2011. The new Conflict of Interest Rule proposal, like its predecessor, would greatly expand the range of conditions under which an individual who provides investment services would be subject to ERISA fiduciary rules. The new proposal goes further in some respects. It explicitly defines promotional services provided to IRA account holders and small businesses as advice subject to ERISA fiduciary rules. While many stakeholders are analyzing the technical details and implications, this study considers the impact on individuals and small businesses that use financial advisors. We conclude that the newly proposed rule, while well intended, would have significant negative consequences for many retail investors if implemented with regard to the availability and cost of retirement savings help and support.
Further details on our research sources and methodology
1. Proprietary research, including two surveys of 4,393 retail investors and 1,216 small businesses;
2. Two datasets provided by IXI Services representing approximately 20% ($5.6 Trillion in 2013) of U.S. consumer invested assets on a household level and approximately 30% ($9.7 Trillion in 2013) of U.S. consumer invested assets on

iv
3. an account level, respectively. This data is broken into different types of investment holdings for specific age, income and wealth segments as well as between individuals with, and without, a financial advisor;
4. Widely available secondary data sources.
Analyses based on data from the Oliver Wyman Retail Investor Retirement Survey and IXI invested assets datasets have been controlled for factors such as income, age, and assets to ensure they are representative of particular segments of the US retail investor population. In addition, responses from the retail investor survey were further scaled based on the 2013 Federal Reserve Survey of Consumer Finances to produce a representative sample of US retail investors. Unless indicated otherwise, small businesses are defined as businesses with established payroll and up to 100 employees. For additional information regarding our approach and market research, please refer to the methodology section of this document contained in the appendices.

v
Table of Figures
Figure 1: US personal investable assets and retirement assets 8 Figure 2: Active retirement plan participants 9 Figure 3: Defined contribution assets by plan type (2013 YE) 10 Figure 4: Workplace retirement plan access and participation among private sector workers, W-2
adjusted rates, by firm size (2013) 11 Figure 5: Prevalence of different advisor types among small businesses 12 Figure 6: Value of advice attributed to advisors in choosing to set up a retirement plan 13 Figure 7: Plan formation rates by size of firm and advisor status 14 Figure 8: Frequency of referral to service provider(s), by advisor 15 Figure 9: Total asset levels across relationship status, age, and income 16 Figure 10: Ratio of average asset holdings for advised and non-advised investors 17 Figure 11: Households’ primary reasons for saving 18 Figure 12: Financial advisor services valued by investors 19 Figure 13: Availability and usage of in-plan support options (for respondents with a defined
contribution plan) 21 Figure 14: Primary reason for most recent rollover among those choosing to roll over assets 22 Figure 15: Retirement plan ownership among investors 23 Figure 16: IRA ownership and assets (2013) – Income: $0-100K, Wealth: $0-100K 24 Figure 17: Comparison of return by portfolio composition 25 Figure 18: Assets and IRA asset class mix for households with and without a financial advisor 27 Figure 19: Assets and IRA asset class mix – Age: 45-54, Income: $0-100K, Wealth: $0-100K 28 Figure 20: Assets and IRA product mix for households with and without a financial advisor 29 Figure 21: Assets and IRA product mix – Age: 45-54, Income: $0-100K, Wealth: $0-100K 30 Figure 22: Percent of assets held in cash or cash equivalents outside of workplace retirement
plans 31 Figure 23: Cash holdings as a percent of account assets for advised and non-advised investors 32 Figure 24: Cash holdings as a percent of total account assets for investors with and without a
financial advisor – Segment with <$100K in wealth and income 33 Figure 25: Percentage of individuals taking cash distributions by age and plan type 35 Figure 26: Worked example comparing a cash distribution with an IRA rollover- Illustrative 35 Figure 27: Rebalancing frequency outside of DC plans 37 Figure 28: Example retirement assets by year at median income, 3% contribution rate, and 6%
growth 44

1
Executive summary
Oliver Wyman’s study of the role of financial advisors in the US retirement system draws upon proprietary surveys of more than 4,300 retail investors and 1,200 small businesses, datasets from IXI Services (a division of Equifax), representing approximately 20% of U.S. consumer invested assets on a household level and approximately 30% of U.S. consumer invested assets on an account level, to provide a unique window into the value financial advisors provide to small businesses and retail investors for their retirement savings and investments needs.
With fewer individuals covered by corporate pension plans and the future of social security uncertain1, individuals are increasingly responsible for providing for their own retirement. Workplace-sponsored defined contribution (DC) plans offer significant tax and other advantages to foster increased retirement savings. Indeed, 84% of individuals began saving for retirement via a workplace retirement plan.2 When available, they are often the primary vehicle for personal retirement savings. However, over 19 million people who work for businesses with fewer than 50 employees do not currently have access to a workplace retirement plan.
We found that financial advisors are often a key advisor to small businesses, helping business owners through the process of setting up a defined contribution plan for their employees. When a financial advisor is involved, small businesses with 10-49 employees are 50% more likely to set up a workplace retirement plan. In addition, micro businesses (1–9 employees) that work with a financial advisor are nearly twice as likely to set up a plan.
Recognizing the growing importance of workplace DC plans, there have recently been a number of innovations that have doubtlessly improved the retirement outcomes for millions of people, including automatic enrollment and rebalancing features, better default investment options and in-plan advice. Yet, in spite of these improvements, many individuals continue to under-save (the average default contribution rate for plans with automatic enrollment is 3.4%3 vs. the 6-10% recommended by many experts).
Many people are uncomfortable tackling retirement savings on their own. By one measure, 58% of households with under $100,000 in investable assets, and 75% of households with over $100,000 in investable assets solicit professional financial advice4.
1 Social Security Administration, (http://www.ssa.gov/policy/docs/ssb/v70n3/v70n3p111.html): “Benefits are now expected to be payable in full on a timely basis until 2037, when the trust fund reserves are projected to become exhausted…[at that point] continuing taxes are expected to be enough to pay 76 percent of scheduled benefits.”
2 Oliver Wyman Retail Investor Retirement Survey 2014 3 Center for Retirement Research at Boston College, ‘How Does 401(K) Auto-Enrollment Relate To The Employer
Match And Total Compensation?’, (http://crr.bc.edu/wp-content/uploads/2013/10/IB_13-14.pdf), October 2013 4 2013 Survey of Consumer Finances

2
Advised individuals place the largest value on financial advisors’ support for financial planning, monitoring and providing trusted advice for their holistic financial needs.
In this regard, we found that many investors prefer to seek help from financial advisors outside their workplace in part to receive holistic advice on their assets. When changing jobs, individuals often choose to roll over assets into an IRA, primarily to consolidate assets and avoid leaving assets with a former employer. Just 29% of individuals own 401(k) plans exclusively, while nearly two-thirds hold assets outside their workplace in combination with an IRA or alone in one or more IRAs.
How well are financial advisors doing their job? On average, we found that individuals with a financial advisor have more wealth than non-advised individuals across all age and income levels studied. For example, we found that advised individuals aged 35-54 years making less than $100K per year had 51% more assets than similar non-advised investors. These are typical middle-class households in the middle of their accumulation years. Moreover, advised individuals are better investors across many key dimensions commonly associated with long term investing success. Specifically, we found that compared with individuals without a financial advisor, advised individuals
Own more diversified investment portfolios
Stay invested in the market by holding less cash and cash equivalents
Take fewer premature cash distributions; and
Re-balance their portfolios with greater frequency to stay in line with their investment objectives and risk tolerance.
The benefits financial advisors provide to their clients are now at risk. On April 14, 2015, the Department of Labor issued its Conflict of Interest rule proposal, a replacement for the Definition of the Term “Fiduciary” rule proposal withdrawn in September 2011. In our 20115 study reviewing the impact of the previously proposed rule, we concluded that the Department of Labor’s proposed rule change was motivated by a laudable objective: to ensure a high standard of care for retirement plan participants and account holders with regard to the receipt of services and investment guidance, amid an increasingly complex financial marketplace. However, we found the proposed rule proposal was likely to have serious negative and unintended effects on the very individuals the change was supposed to help.
Many stakeholders are now analyzing the technical details of the newly proposed rule, and there is growing concern that the proposal would again result in unintended
5 Oliver Wyman, ‘Assessment of the Impact of the Department of Labor’s Proposed “Fiduciary” Definition Rule on IRA Consumers’, 2011

3
consequences, including limiting the ability of financial services firms and individual financial advisors to offer services to individual IRA holders and small businesses, as well as increasing investor costs due to new expenses associated with implementing the rule and transitioning many clients to a higher cost advisory model.
With regard to the impact on individuals, regrettably we reach the same overall conclusion as in the prior study. The proposed rule change is likely to have significant consequences that will adversely impact individual investors saving for retirement. For example, because the rule as proposed will take away the assistance small businesses most value, fewer new plans will be established and more plans will likely close6. This would directly impact the 19 MM individuals who work for small businesses with fewer than 50 employees, who do not currently have access to a workplace retirement plan and reduce the likelihood of their gaining access to a retirement plan in the future.
In the case of IRAs, if the rule is implemented as proposed7
Millions of existing small balance IRA owners are likely to lose access to the financial advisor of their choice or any financial advisor at all
The majority of others will face higher costs when providers shift brokerage accounts to advisory accounts
Individuals without the help and support of financial advisors are less likely to open an IRA, leading to increased cash-outs when changing jobs and lower savings rates compared with advised individuals8
Unadvised individuals are likely to carry excess portfolio risk due to less diversification and less frequent re-balancing.
* * *
6 The new rule proposal explicitly excludes small businesses with fewer than 100 employees with employee-directed plans from the prohibited transaction exemption, otherwise made available to larger plans. This will force financial advisors to limit the services they currently provide to such small businesses in connection with establishing and maintaining retirement plans.
7 See Oliver Wyman, ‘Assessment of the Impact of the Department of Labor’s Proposed “Fiduciary” Definition Rule on IRA Consumers’, 2011
8 Prior guidance from the DOL “held that recommendations to a plan participant to take an otherwise permissible distribution, even combined with a recommendation as to how to invest distributed funds, is not fiduciary investment advice.” K&L Gates, DOL Re-Proposes Rule to make Brokers, Others, ERISA Fiduciaries (Apr. 27, 2015), http://www.klgates.com/dol-re-proposes-rule-to-make-brokers-others-erisa-fiduciaries-04-27-2015.

4
Retirement is too important to get wrong. We encourage key stakeholders from the financial services industry and regulators to join together to find workable solutions that preserve individuals’ access to help and support from a financial advisor of their choice as well as the business model and fee structure that best meet their needs.
5
Key findings
Workplace sponsored defined contribution plans are critical retirement savings vehicles
84% of individuals began saving for retirement via a workplace retirement plan9
Workplace sponsored defined contribution plans represent the primary or only retirement vehicle for 67% of individuals who save for retirement with a tax-advantaged retirement plan10
Financial advisors help individuals that work for small businesses gain access to workplace retirement plans
19 million individuals who work for small businesses with fewer than 50 employees do not currently have access to a workplace sponsored retirement plan
Small businesses that work with a financial advisor are 50% more likely to set up a retirement plan (and micro business with 1-9 employees are almost twice as likely)
The majority of retail investors seek financial advice – many want personalized services from a professional financial advisor outside their workplace for financial planning and holistic advice and support on all their investment holdings
58% of households with under $100,000 in investable assets, and 75% of those with over $100,000 in investable assets solicit professional financial advice
Individuals most value financial advisors for support with financial planning, monitoring and trusted advice for their holistic financial needs
Many individuals currently have access to help and advice on their plan assets through workplace retirement plans; those that use it save 43% more on average. However, fewer than half of workplace retirement plan participants currently use in-plan advice features
9 Oliver Wyman Retail Investor Retirement Survey 2014 10 Oliver Wyman Retail Investor Retirement Survey 2014
6
Two-thirds of investors have retirement savings outside of employer-sponsored retirement plans, and many seek advice and support from a professional advisor outside their workplace for all of their investment holdings
Advised investors have more assets than those without a financial advisor
We found that advised individuals have a minimum of 25% more assets than non-advised individuals
In the case of individuals aged 35-54 years with $100,000 or less in annual income, advised individuals have an average of 51% more assets than non-advised individuals
Individuals with a financial advisor are better long term investors
Advised investors have more diversified portfolios -- own twice as many asset classes, have more balanced portfolio asset allocations and use more packaged products for equity exposure compared with non-advised investors
Advised investors stay more invested in the market – Advised individuals hold less cash in their investment accounts (36%-57% less than non-advised individuals for similar age and wealth cohorts)
Advised investors re-balance more frequently, and are 42% more likely to re-balance their portfolios at least every two years
The Department of Labor’s proposed Conflict of Interest rule would likely reduce retirement savings
As proposed, financial advisors would be forced to stop providing workplace retirement plan set-up and support services to small businesses, due to the lack of an exception that would allow providers to market to self-directed plans with fewer than 100 participants, which will likely result in many small businesses closing existing plans or not establishing new plans due to the additional administrative burden
Individuals with small balance accounts that are below standard advisory account minimums are likely to lose access to retirement help and support with selecting appropriate products as a result of providers shifting accounts from brokerage to fee-based advisory accounts. In our prior study, we estimated that 7 MM current IRAs would not qualify for an advisory account due to low balances11
11 Oliver Wyman, ‘Assessment of the Impact of the Department of Labor’s Proposed “Fiduciary” Definition Rule on IRA Consumers’, 2011

7
Almost all retail investors face increased costs (73% to 196% on average) from providers shifting clients to a fee-based advisory model. In our 2011 study, we found nearly 90% of the 23 MM IRAs analyzed were held in brokerage accounts 12
When changing jobs, individuals will be less likely to open an IRA to manage their plan savings, leading to lower savings rates and increased cash-outs13. In our 2011 study, we found that as many as 360,000 fewer IRAs would be opened every year
Unadvised individuals will likely carry excess portfolio risk due to less diversification and less frequent re-balancing compared with advised individuals
12 Oliver Wyman, ‘Assessment of the Impact of the Department of Labor’s Proposed “Fiduciary” Definition Rule on IRA Consumers’, 2011
13 Prior guidance from the DOL “held that recommendations to a plan participant to take an otherwise permissible distribution, even combined with a recommendation as to how to invest distributed funds, is not fiduciary investment advice.” K&L Gates, DOL Re-Proposes Rule to make Brokers, Others, ERISA Fiduciaries (Apr. 27, 2015), http://www.klgates.com/dol-re-proposes-rule-to-make-brokers-others-erisa-fiduciaries-04-27-2015.

8
I. Role of financial advisors in the defined contribution plan market
Two-thirds of retirement assets are held in workplace retirement plans
At an estimated $26.9 TN, US retirement savings represent over half of total personal investable assets. Of this amount, workplace sponsored retirement plans such as defined benefit (DB) and defined contribution (DC) plans constitute approximately two-thirds of retirement assets, while the remaining one-third is held in IRAs and annuities (Figure 1).
Figure 1: US personal investable assets and retirement assets14
Individuals are increasingly responsible for saving for their own retirement
Nearly five times as many individuals are active participants in DC plans as compared to DB plans as of 2012 (75.4 million vs. 15.7 million). 15,16 Moreover, as Figure 2 shows,
14 Federal Flow of Funds L.116, B.100: Includes financial assets and defined benefit assets; excludes agency and GSE backed securities, other loans and advances, mortgages, consumer credit (student loans), pension entitlements and equity in non-corporate business Federal Flow of Funds L.116: Retirement assets include household retirement assets
15 Private Pension Plan Bulletin Historical Tables and Graphs, U.S. Department of Labor, Employee Benefits Security Administration, December 2014
16 Note: Aggregation methodologies were changed in 2004 and 2009, generating anomalies for those years
U.S. retirement assets by plan type2014 Q2, US$ TN
U.S. personal investable assets2014 Q2, US$ TN
13.4
3.5
7.7
3.1
0
5
10
15
20
25
30
35
40
45
50
$ (
TN
)
Defined benefit plans
Corporate equities
Deposits
Credit market instruments
Mutual fund shares
Other
2014 Q2
48.7
11.1
9.9
7.2
DB plans
DC plans
IRAs
Annuities
2014 Q2
26.9
11.1
6.2
2.4
Approximately 55% of $48.7 TN
9
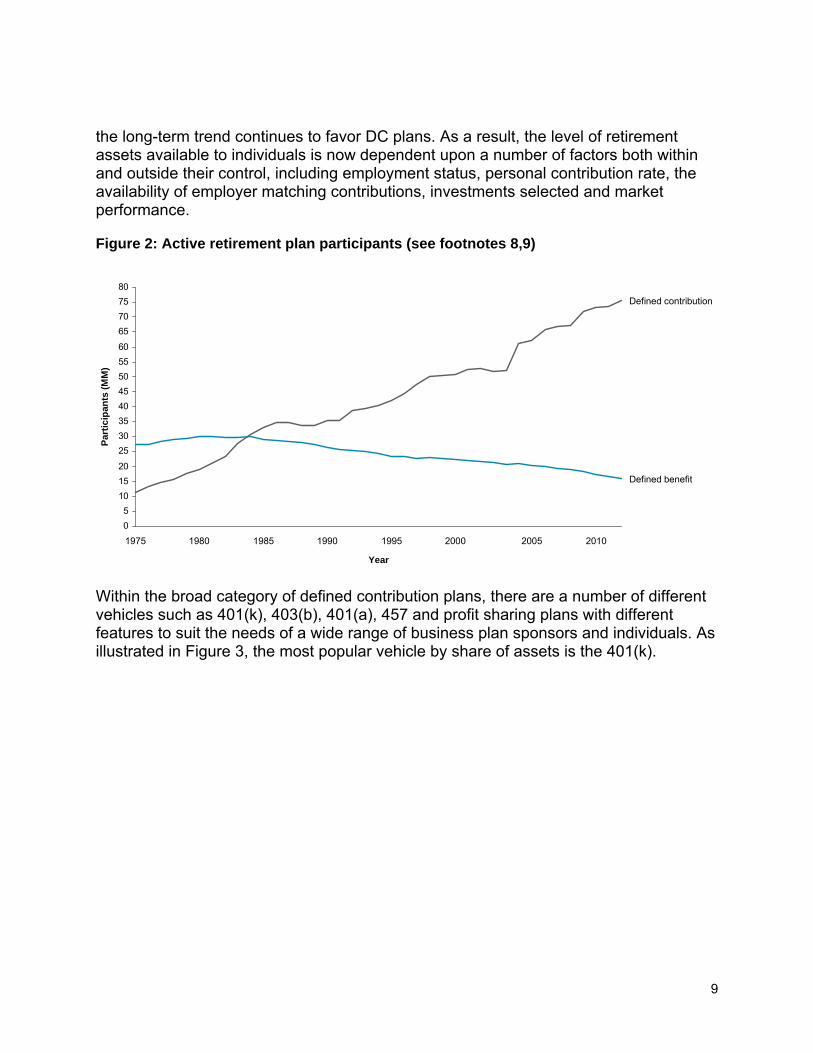
the long-term trend continues to favor DC plans. As a result, the level of retirement assets available to individuals is now dependent upon a number of factors both within and outside their control, including employment status, personal contribution rate, the availability of employer matching contributions, investments selected and market performance.
Figure 2: Active retirement plan participants (see footnotes 8,9)
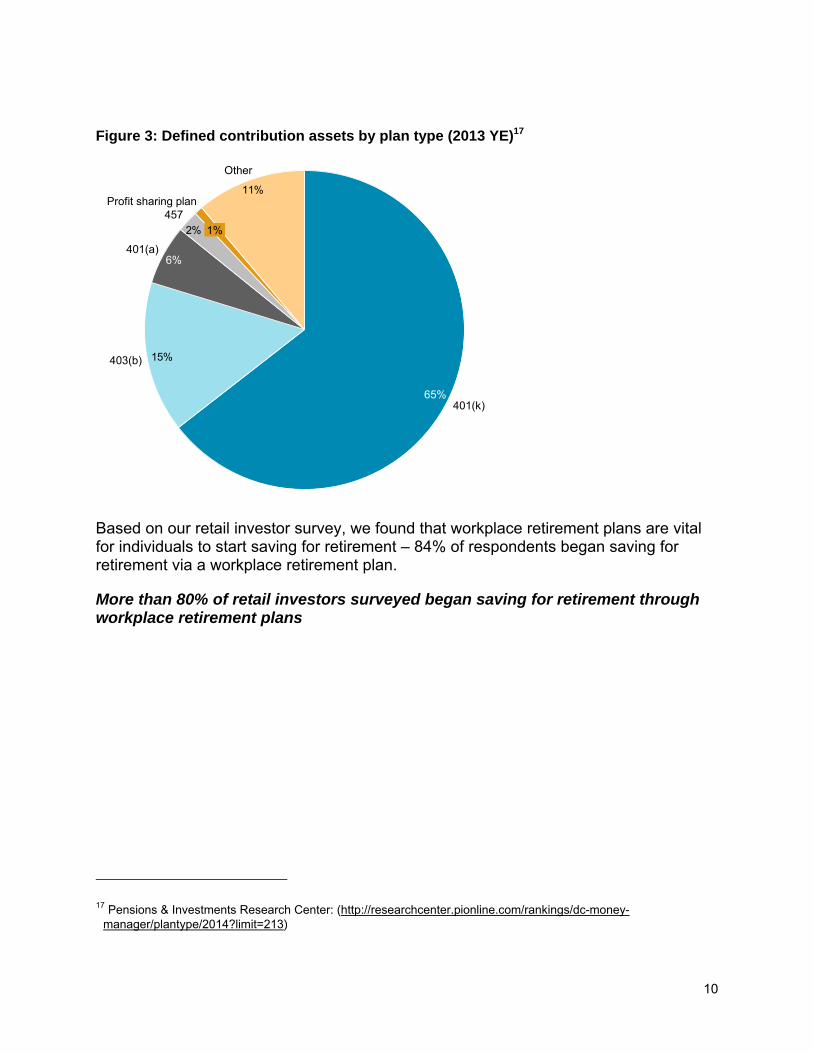
Within the broad category of defined contribution plans, there are a number of different vehicles such as 401(k), 403(b), 401(a), 457 and profit sharing plans with different features to suit the needs of a wide range of business plan sponsors and individuals. As illustrated in Figure 3, the most popular vehicle by share of assets is the 401(k).
0
5
10
15
20
25
30
35
40
45
50
55
60
65
70
75
80
Defined contribution
Defined benefit
2010
Year
Par
tic
ipan
ts (
MM
)
2005200019951990198519801975
10
Figure 3: Defined contribution assets by plan type (2013 YE)17
Based on our retail investor survey, we found that workplace retirement plans are vital for individuals to start saving for retirement – 84% of respondents began saving for retirement via a workplace retirement plan.
More than 80% of retail investors surveyed began saving for retirement through workplace retirement plans
17 Pensions & Investments Research Center: (http://researchcenter.pionline.com/rankings/dc-money-manager/plantype/2014?limit=213)
11%
2%
15%
401(k)
1%
Profit sharing plan
403(b)
65%
457
6%
Other
401(a)
11
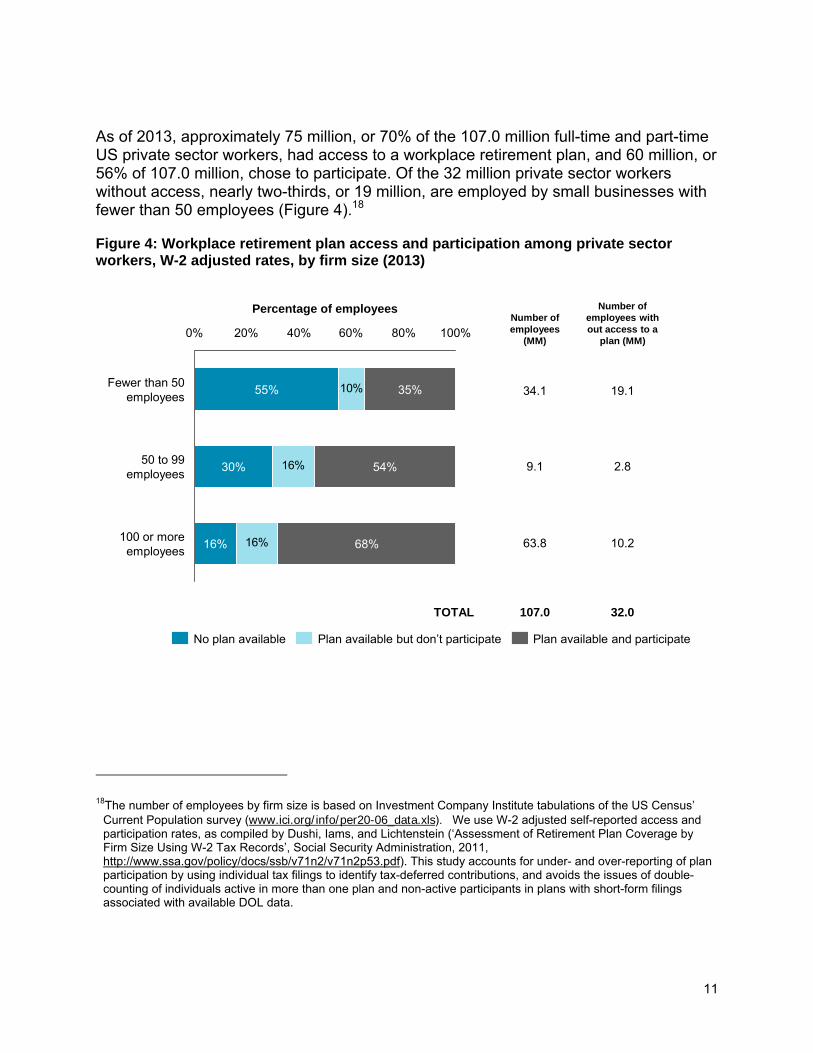
As of 2013, approximately 75 million, or 70% of the 107.0 million full-time and part-time US private sector workers, had access to a workplace retirement plan, and 60 million, or 56% of 107.0 million, chose to participate. Of the 32 million private sector workers without access, nearly two-thirds, or 19 million, are employed by small businesses with fewer than 50 employees (Figure 4).18
Figure 4: Workplace retirement plan access and participation among private sector workers, W-2 adjusted rates, by firm size (2013)
18The number of employees by firm size is based on Investment Company Institute tabulations of the US Census’ Current Population survey (www.ici.org/info/per20-06_data.xls). We use W-2 adjusted self-reported access and participation rates, as compiled by Dushi, Iams, and Lichtenstein (‘Assessment of Retirement Plan Coverage by Firm Size Using W-2 Tax Records’, Social Security Administration, 2011, http://www.ssa.gov/policy/docs/ssb/v71n2/v71n2p53.pdf). This study accounts for under- and over-reporting of plan participation by using individual tax filings to identify tax-deferred contributions, and avoids the issues of double-counting of individuals active in more than one plan and non-active participants in plans with short-form filings associated with available DOL data.
10%
16%
16%
0% 40% 60% 100%80%20%
55%
100 or moreemployees
16%
35%
Percentage of employees
30%
Fewer than 50employees
54%50 to 99
employees
68%
No plan available Plan available but don’t participate Plan available and participate
Number of employees
(MM)
Number of employees with out access to a
plan (MM)
34.1 19.1
9.1 2.8
63.8 10.2
TOTAL 107.0 32.0
12
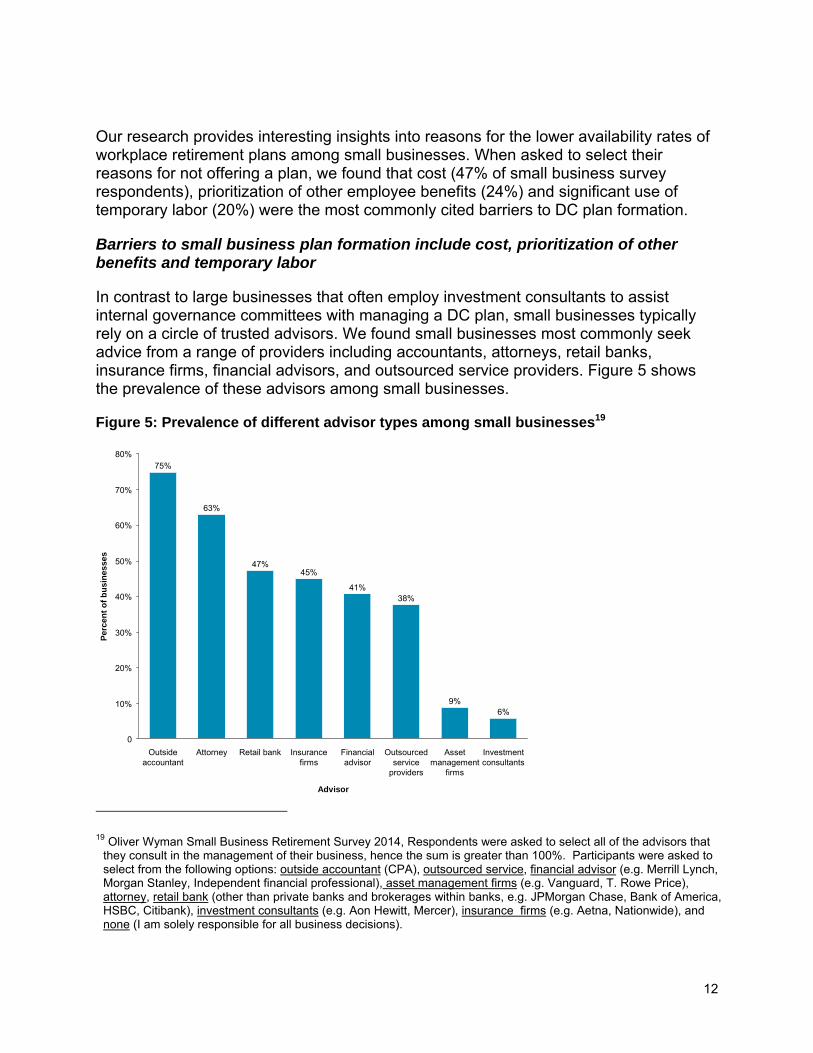
Our research provides interesting insights into reasons for the lower availability rates of workplace retirement plans among small businesses. When asked to select their reasons for not offering a plan, we found that cost (47% of small business survey respondents), prioritization of other employee benefits (24%) and significant use of temporary labor (20%) were the most commonly cited barriers to DC plan formation.
Barriers to small business plan formation include cost, prioritization of other benefits and temporary labor
In contrast to large businesses that often employ investment consultants to assist internal governance committees with managing a DC plan, small businesses typically rely on a circle of trusted advisors. We found small businesses most commonly seek advice from a range of providers including accountants, attorneys, retail banks, insurance firms, financial advisors, and outsourced service providers. Figure 5 shows the prevalence of these advisors among small businesses.
Figure 5: Prevalence of different advisor types among small businesses19
19 Oliver Wyman Small Business Retirement Survey 2014, Respondents were asked to select all of the advisors that they consult in the management of their business, hence the sum is greater than 100%. Participants were asked to select from the following options: outside accountant (CPA), outsourced service, financial advisor (e.g. Merrill Lynch, Morgan Stanley, Independent financial professional), asset management firms (e.g. Vanguard, T. Rowe Price), attorney, retail bank (other than private banks and brokerages within banks, e.g. JPMorgan Chase, Bank of America, HSBC, Citibank), investment consultants (e.g. Aon Hewitt, Mercer), insurance firms (e.g. Aetna, Nationwide), and none (I am solely responsible for all business decisions).
0
10%
70%
60%
50%
40%
30%
20%
80%75%
63%
47%
Insurance firms
Retail bankAttorneyOutside accountant
Advisor
41%
Per
cen
t o
f b
us
ines
ses
Investment consultants
45%
Asset management
firms
Outsourced service
providers
Financial advisor
6%9%
38%

13
Financial advisors help small businesses set up workplace retirement plans
Small businesses use advisors for a range of services for their DC plans, which vary from plan to plan and from advisor to advisor. Examples of typical services include:
Development of an investment policy statement covering aspects such as plan objectives, investment philosophy and risk appetite
Plan design consulting (e.g. choice of funds, use of auto-enrollment, QDIA, auto-escalation, and employer matching program), and selection of a record-keeper
Participant education and support (e.g. general help and support around plan participation, contribution rates and investment options, investment planning and IRA rollovers).
Small businesses perceive financial advisors to be most helpful with respect to guidance on retirement plan setup and administration. We asked survey respondents to allocate 100 points among their different advisors based upon the value they assigned to their help and support in choosing to set up a workplace retirement plan. As shown in Figure 6, this statement holds true across all types of advisors and business sizes with small businesses allocating between 30% and 36% of value to financial advisors.
Figure 6: Value of advice attributed to advisors in choosing to set up a retirement plan20
20 Oliver Wyman Small Business Retirement Survey 2014, Respondents were asked to allocate 100 points across all their advisors in terms of their contribution to the business setting up a workplace retirement plan; presented values are calculated as the average score per advisor type.
5%
6%
7%
8%
21%
12%
36%
6% 12%
5%
7%
8%
15%
4%
16%
33%
13%
5%
10%
8% 14%
5%
15%
30%
Asset management firms
Investment consultantsOutside accountant
Financial advisor Insurance firms
Retail bank
Outsourced service providers
Attorney
1–9 employees 10–49 employees 50–100 employees
14
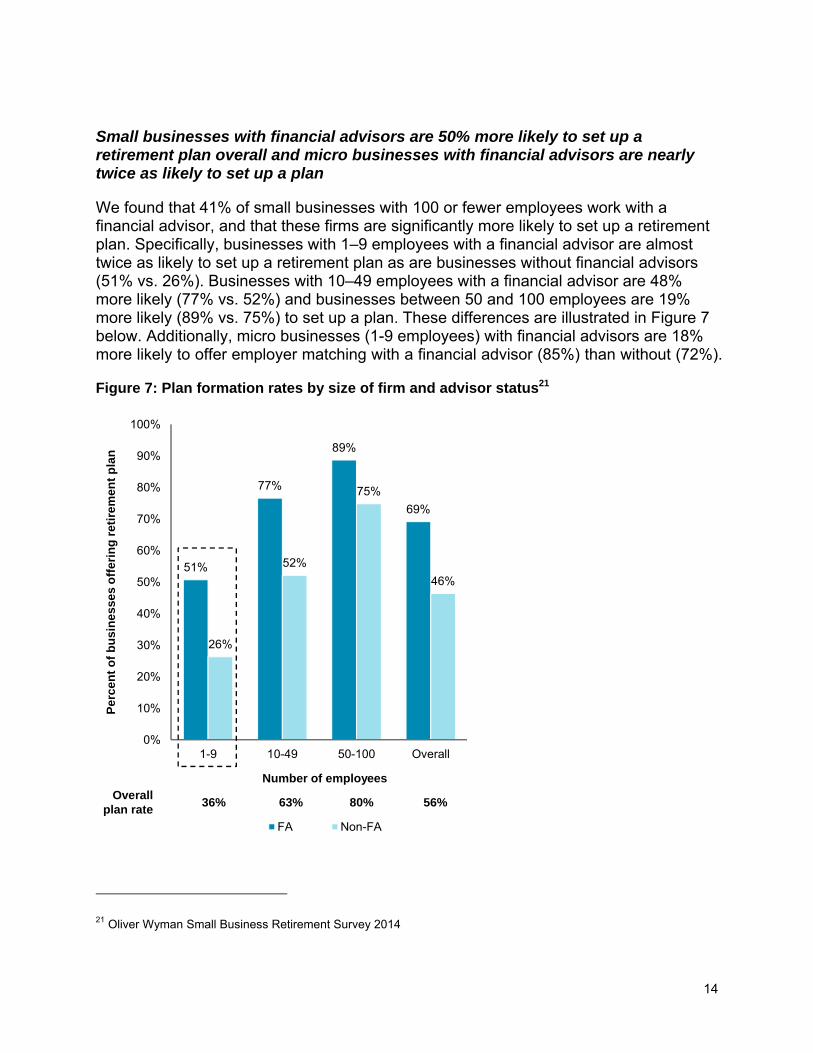
Small businesses with financial advisors are 50% more likely to set up a retirement plan overall and micro businesses with financial advisors are nearly twice as likely to set up a plan
We found that 41% of small businesses with 100 or fewer employees work with a financial advisor, and that these firms are significantly more likely to set up a retirement plan. Specifically, businesses with 1–9 employees with a financial advisor are almost twice as likely to set up a retirement plan as are businesses without financial advisors (51% vs. 26%). Businesses with 10–49 employees with a financial advisor are 48% more likely (77% vs. 52%) and businesses between 50 and 100 employees are 19% more likely (89% vs. 75%) to set up a plan. These differences are illustrated in Figure 7 below. Additionally, micro businesses (1-9 employees) with financial advisors are 18% more likely to offer employer matching with a financial advisor (85%) than without (72%).
Figure 7: Plan formation rates by size of firm and advisor status21
21 Oliver Wyman Small Business Retirement Survey 2014
51%
77%
89%
69%
26%
52%
75%
46%
0%
10%
20%
30%
40%
50%
60%
70%
80%
90%
100%
1-9 10-49 50-100 Overall
Per
cen
t o
f b
usi
nes
ses
off
erin
g r
eti
rem
ent
pla
n
Number of employees
FA Non-FA
36% 63% 80% 56%Overall
plan rate
15
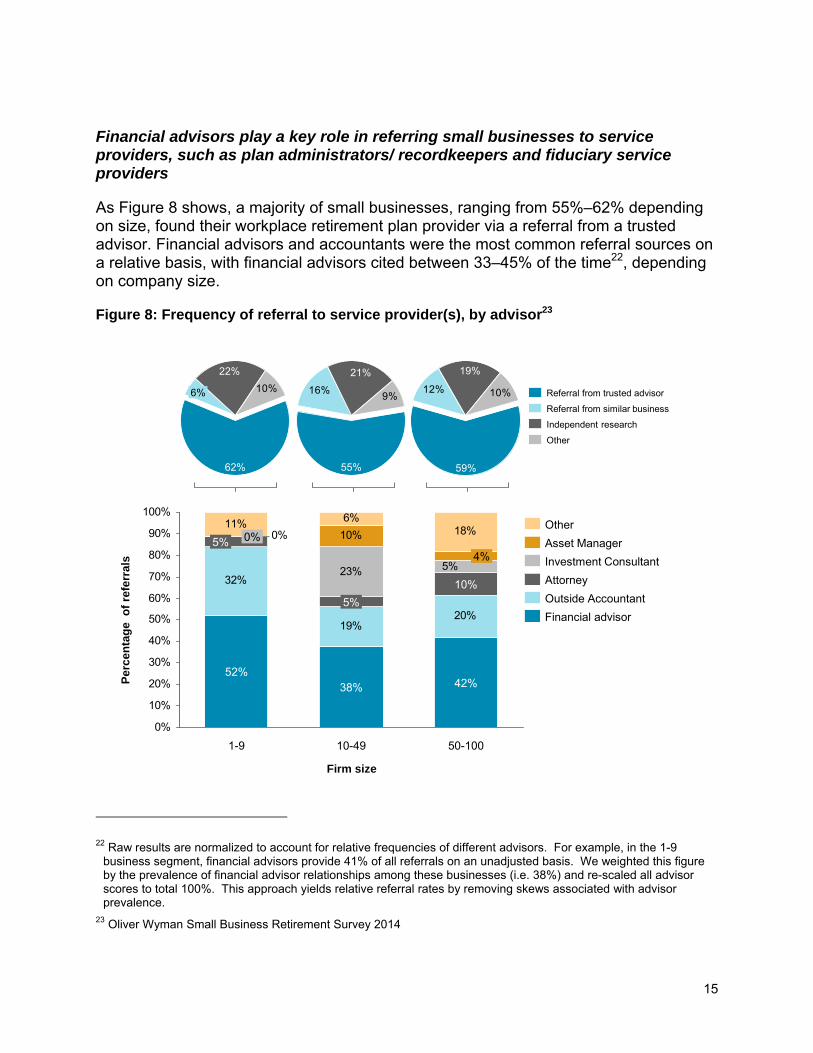
Financial advisors play a key role in referring small businesses to service providers, such as plan administrators/ recordkeepers and fiduciary service providers
As Figure 8 shows, a majority of small businesses, ranging from 55%–62% depending on size, found their workplace retirement plan provider via a referral from a trusted advisor. Financial advisors and accountants were the most common referral sources on a relative basis, with financial advisors cited between 33–45% of the time22, depending on company size.
Figure 8: Frequency of referral to service provider(s), by advisor23
22 Raw results are normalized to account for relative frequencies of different advisors. For example, in the 1-9 business segment, financial advisors provide 41% of all referrals on an unadjusted basis. We weighted this figure by the prevalence of financial advisor relationships among these businesses (i.e. 38%) and re-scaled all advisor scores to total 100%. This approach yields relative referral rates by removing skews associated with advisor prevalence.
23 Oliver Wyman Small Business Retirement Survey 2014
10%
22%
6%
62%
9%16%
21%
55%
10%12%
19%
59%
Other
Independent research
Referral from similar business
Referral from trusted advisor
32%
19%20%
23%
11% 6%18%
5%
0% 10%
0%
10%
20%
30%
40%
50%
60%
70%
80%
90%
100%
50-100
42%
10%
4%
10-49
38%
Per
cen
tag
e o
f re
ferr
als
Firm size
5%
1-9
52%
5% 0%
Investment Consultant
Asset Manager
Other
Financial advisor
Outside Accountant
Attorney

16
II. Role of financial advisors in helping individuals save for retirement
In our Retail Investor Retirement Survey, advised investors had a minimum of 25% more assets than non-advised individuals, depending on age and income levels
A key finding of our research is that individuals with a financial advisor have more assets than non-advised individuals across age, income, and wealth segments, as shown in Figure 9.
Figure 9: Total asset levels across relationship status, age, and income24
This finding holds true even when excluding survey respondents who anticipate receiving retirement income from either an inheritance or trust fund.
24 Oliver Wyman Retail Investor Retirement Survey 2014
517
297
204
81
243
196
148
43
0
50
100
150
200
250
300
350
400
450
500
550
Age Group
55-6418-34 65+35-54
Av
erag
e h
ou
seh
old
ass
ets
($K
)
With FA Without FA
<=$100K in annual income
1,345
820
486
203
892
577
388
115
0
100
200
300
400
500
600
700
800
900
1,000
1,100
1,200
1,300
1,400
Age Group
55-6418-34 65+35-54
Av
erag
e h
ou
seh
old
ass
ets
($K
)
With FA Without FA
>$100K and <=$250K in annual income
+51%+42%+25%+76%+113%+51%+38%+86%
% Increased assets of advised households
A B C D A B C D
% Increased assets of advised households
A
B
C
D
A
B
C
D

17
Our analysis of the IXI data, representing ~20% of U.S consumer invested assets, further substantiates and expands on this finding. We found that individuals with a financial advisor have larger account balances (including IRA assets) across age, income and wealth levels. Specifically, in 2013, 98% of accounts examined for advised individuals reflected ≥10% more investment assets compared to those of non-advised individuals controlling for age, wealth, and income. Moreover, 90% of accounts reflected ≥25% more investment assets among advised accounts.
This finding holds true across multiple time periods for specific wealth and income cohorts. Figure 10 illustrates this point for all segments as well as the segment with annual income and wealth below $100,000.
Figure 10: Ratio of average asset holdings for advised and non-advised investors25
As described in detail below, our research finds that individuals with a financial advisor are better investors across many dimensions commonly associated with long term investing success.
Advised individuals are better long term investors
Key elements of a robust long-term investing program typically include:
A. Developing and maintaining a personalized financial plan
25 IXI account-level time series dataset of U.S. Consumer Invested Assets; Oliver Wyman Analysis
Recession and
immediate aftermath
Recession and
immediate aftermath
Total AUM measured in 2013:
$9.7 TR
0%
50%
100%
150%
200%
250%
2006 2007 2008 2009 2010 2011 2012 2013
Ad
vis
ed /
no
n-a
dv
ised
acc
ou
nt
asse
ts
Year
Segment: <$100K wealth, income Overall
Total IRA holdings measured in 2013:
$3.1 TR
0%
50%
100%
150%
200%
250%
2006 2007 2008 2009 2010 2011 2012 2013
Ad
vis
ed /
no
n-a
dv
ised
IRA
ass
ets
Year
Segment: <$100K wealth, income Overall
Total assets IRA assets
18
B. Commitment to regular saving and investment
C. Constructing and maintaining a well-diversified portfolio of appropriate investment products
D. Staying invested in the market
E. Periodically re-balancing investment holdings to restore desired asset allocation and risk levels
We found that financial advisors play an important role in helping individuals adopt each of these investing practices commonly associated with better investing outcomes.
A. Developing and maintaining a personalized financial plan
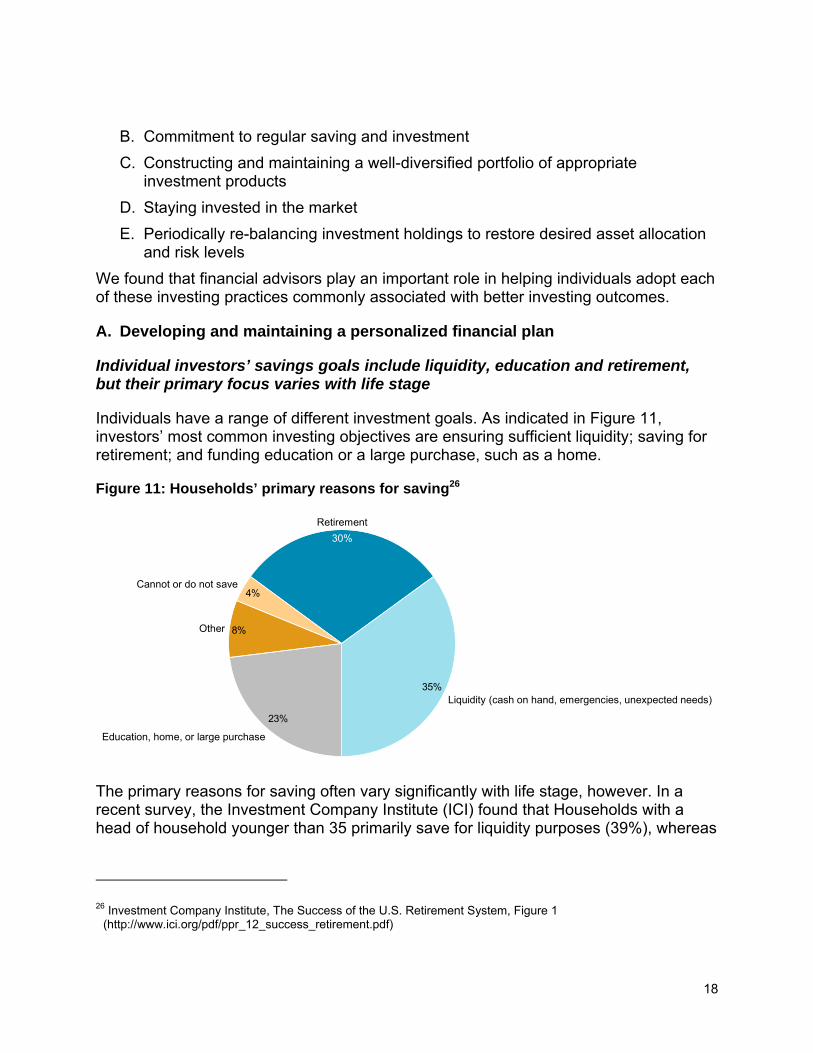
Individual investors’ savings goals include liquidity, education and retirement, but their primary focus varies with life stage
Individuals have a range of different investment goals. As indicated in Figure 11, investors’ most common investing objectives are ensuring sufficient liquidity; saving for retirement; and funding education or a large purchase, such as a home.
Figure 11: Households’ primary reasons for saving26
The primary reasons for saving often vary significantly with life stage, however. In a recent survey, the Investment Company Institute (ICI) found that Households with a head of household younger than 35 primarily save for liquidity purposes (39%), whereas
26 Investment Company Institute, The Success of the U.S. Retirement System, Figure 1 (http://www.ici.org/pdf/ppr_12_success_retirement.pdf)
4%
8%
23%
35%
Other
Cannot or do not save
Education, home, or large purchase
Liquidity (cash on hand, emergencies, unexpected needs)
Retirement
30%

19
those in which the head of household is between 50 and 64 years old, are focused on retirement savings (48%).
58-75% of non-retired households seek professional financial advice, depending on wealth, and most value personalized financial planning, investment monitoring and holistic advice
Many Americans are uncomfortable with investing on their own, and consult with a financial advisor to assist with achieving their goals. By one measure, 58% of households with under $100,000 in investable assets, and 75% of non-retired households with over $100,000 in investable assets, solicit professional financial advice27.
In our research, individuals most value the following services from their financial advisor: personalized financial planning, ongoing monitoring of investments and trusted advice for all their personal financial affairs (Figure 12).
Figure 12: Financial advisor services valued by investors28
27 2013 Survey of Consumer Finances 28 Oliver Wyman Retail Investor Retirement Survey 2014
27
22
21
14
12
3
0 10 20 30
Average score out of 100
Individuals mostly value personalized and holistic financial advice
Financial planning to achieve your personal
financial goals
Ongoing monitoring of your personal investments
Trusted advice for all of your personal financial affairs
Investment expertise for making individual purchases
or sales of securities
Access to high-quality financial products
Trusted advice for helping manage your small business
Se
rvic
e

20
Against investor demand for holistic advice, we observe different help and support models available within workplace retirement plans and outside plans. In-plan help and advice is often well suited for individuals whose workplace plan represents their primary investment savings, while outside plan advice is a better fit for individuals with multiple investment accounts seeking advice and guidance on all investment holdings.
The majority of DC plans now offer a variety of educational materials, tools and advice options to enable individuals to make informed investment decisions. Educational materials and automated financial tools are the most widely available as well as the most used features as shown in Figure 13. In our research, in-plan advice had a positive impact on participant behavior for those who used it. We found participants who made use of at least one type of support contributed an average of 2.0 percentage points29 more of their salary to a DC plan (6.7% vs. 4.7%) – an increase of 43%. When done in younger working years, this difference could mean a substantial difference in asset accumulation at retirement.
Participants who use in-plan advice features save 43% more, on average
We also found that fewer than half of plan participants currently use in-plan advice features. While 82% of individuals have access to an investment advisor on the phone and 64% have the ability to meet with a financial advisor in-person, utilization of these services is low. Of the individuals that participated in our survey, just 25% consulted with an advisor on the phone and 25% met with a financial advisor in-person.
29 Oliver Wyman Retail Investor Retirement Survey 2014

21
Figure 13: Availability and usage of in-plan support options (for respondents with a defined contribution plan)
In-plan advice models are often more limited in scope compared with external advisory offerings
A number of financial firms operating in a brokerage model have forged partnerships with in-plan advice providers such as Financial Engines, Morningstar and Wilshire Associates, instead of establishing a relationship with their financial advisory businesses, to provide basic help and advice to plan participants on current plan holdings and investment options.30,31,32 Due to legal constraints, this form of advice is generally limited to plan assets, which does not meet the full needs of individuals that hold assets in multiple DC plans and other brokerage and/or advisory accounts.
30 Financial Engines, 2012 Annual Report (http://phx.corporate-ir.net/External.File?item=UGFyZW50SUQ9MTc3OTk4fENoaWxkSUQ9LTF8VHlwZT0z&t=1)
31 Morningstar, 2012 Annual Report, (http://corporate.morningstar.com/us/documents/PR/2012-Morningstar-Annual-Report.pdf)
32 Wilshire Associates, Retirement Managed Accounts, (http://www.wilshire.com/funds-management/our-solutions/retirement-managed-accounts)
91%
82%
64%
93%
59%
25% 25%
61%
0%
10%
20%
30%
40%
50%
60%
70%
80%
90%
100%
Automated financial tools,available online
Investment advisor,available on the phone
Investment advisor,available in-person
Educational materials
Ava
ilab
ility
of
op
tio
n
Support Option
Available Used

22
Individuals elect IRA rollovers for many reasons including asset consolidation, increased investment options and access to a different financial services provider
Many individuals prefer to access financial help and support outside of their DC plans and choose to rollover their DC plan assets to an IRA when changing employers. According to a 2014 ICI report, “The Role of IRAs in US Household Saving for Retirement”, more than 41 million US households hold an IRA of some type. In addition, as shown in Figure 14, ICI further found that nearly half of all rollover decisions were motivated by a desire to consolidate assets and avoid leaving assets with the former employer.
Figure 14: Primary reason for most recent rollover among those choosing to roll over assets33
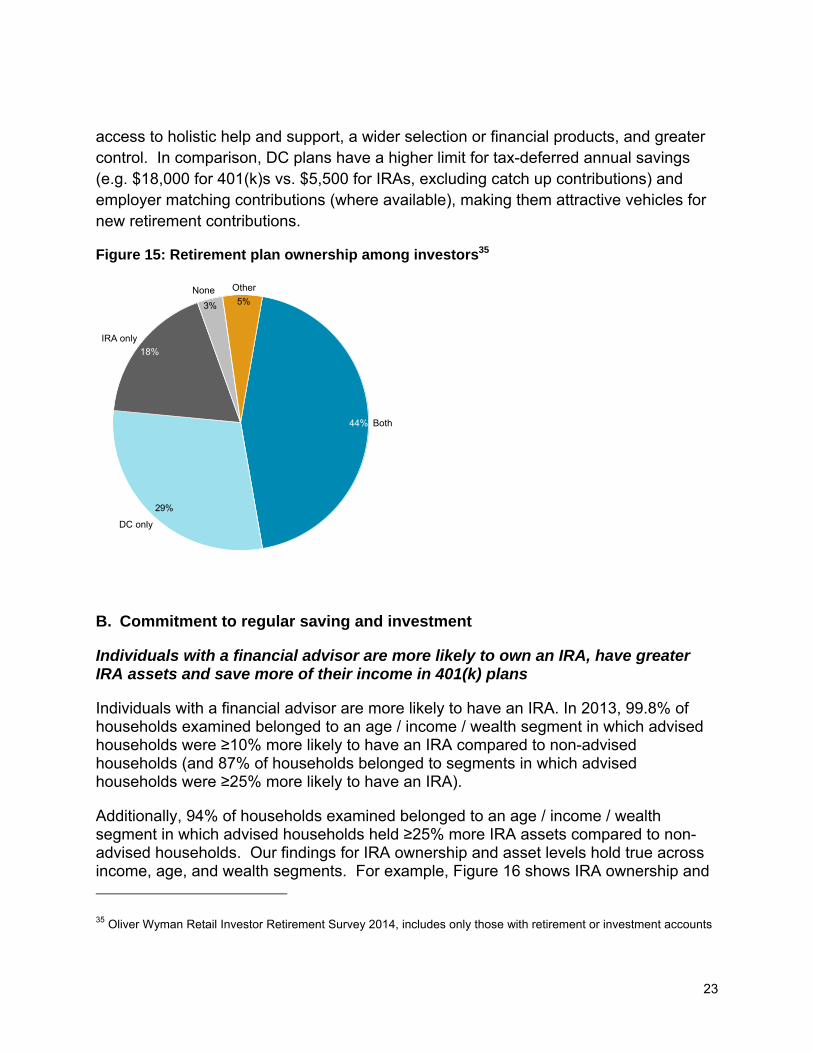
Only 29% of workplace plan participants use DC plans exclusively for retirement savings; nearly two-thirds use a combination of DC plans and IRAs or IRAs only34
As demonstrated by the distribution of retirement plans within our sample of investors (Figure 15), 44% of individuals utilize both DC plans and IRAs in order to take advantage of the benefits of each type of account. As noted previously, IRAs offer
33 Investment Company Institute, The Role of IRAs in U.S. Households’ Saving for Retirement, 2014 (http://www.ici.org/pdf/per21-01.pdf) Other includes ‘Were told by a financial advisor to roll over assets’, ‘Wanted to keep assets with the same provider’, ‘Thought it was easier to roll over assets to an IRA’, and ‘Wanted the same investments as former employer’s plan’.
34 Oliver Wyman Retail Investor Retirement Survey 2014
19%
7%
9%
24%
Other
Wanted to use a different financial services provider
17%
Wanted to preserve tax treatment of the savings
Wanted more investment options
24%
Did not want to leave assets with the former employer
Wanted to consolidate assets
23
access to holistic help and support, a wider selection or financial products, and greater control. In comparison, DC plans have a higher limit for tax-deferred annual savings (e.g. $18,000 for 401(k)s vs. $5,500 for IRAs, excluding catch up contributions) and employer matching contributions (where available), making them attractive vehicles for new retirement contributions.
Figure 15: Retirement plan ownership among investors35
B. Commitment to regular saving and investment
Individuals with a financial advisor are more likely to own an IRA, have greater IRA assets and save more of their income in 401(k) plans
Individuals with a financial advisor are more likely to have an IRA. In 2013, 99.8% of households examined belonged to an age / income / wealth segment in which advised households were ≥10% more likely to have an IRA compared to non-advised households (and 87% of households belonged to segments in which advised households were ≥25% more likely to have an IRA).
Additionally, 94% of households examined belonged to an age / income / wealth segment in which advised households held ≥25% more IRA assets compared to non-advised households. Our findings for IRA ownership and asset levels hold true across income, age, and wealth segments. For example, Figure 16 shows IRA ownership and
35 Oliver Wyman Retail Investor Retirement Survey 2014, includes only those with retirement or investment accounts
5%3%
29%
44%
None
IRA only
18%
DC only
Both
Other

24
assets for advised and non-advised households within different age groups for the cohort with $0-100K in annual income and wealth, respectively. In this cohort, increased IRA ownership ranges from 41% higher for households with accounts registered to individuals 65 and older to 68% higher for those in the 35-44 age group. IRA asset levels for the $0-100K annual income and wealth cohort ranges from 39% higher for households with accounts registered to individuals aged 18-34 to 87% more for those aged 55-64.
Figure 16: IRA ownership and assets (2013) – Income: $0-100K, Wealth: $0-100K 36
These results are consistent with a recent Natixis survey, where individuals with a financial advisor were found to hold more assets in their 401(k) across age and income segments, compared with non-advised investors. The Natixis survey also found that individuals with a financial advisor contributed an average of 1-2% more of their pre-tax salary to their 401(k) across age and income segments.37
36 IXI household-level dataset of U.S. Consumer Invested Assets; Oliver Wyman Analysis 37 Saving is Not Enough: Liabilities, shortfalls and the need for active participation in 401(k) plans; Natixis Global
Asset Management, August 2014 – online survey of 899 participants (427 with FA, 472 without FA) across age and groups
$50
$40
$30
$20
$10
$0
Av
erag
e H
ou
seh
old
IRA
Ho
ldin
gs
($K
)
Age Group
65+
27
49
55-64
24
44
45-54
20
33
35-44
15
24
18-34
9
13
Without FAWith FA
47%
59%56%
51%
41%
33%
38%34%
31%
25%
60%
50%
40%
30%
20%
10%
0%
% o
f h
ou
seh
old
s w
ith
IRA
Age Group
65+55-6445-5435-4418-34
+41%+56%+65%+68%+64%+83%+87%+66%+55%+39%
% Increased assets of advised households % Increased IRA ownership of advised households
A
B
C
D
E
A B C D E
A
B
CD
E
A B C D E

25
C. Constructing and maintaining a well-diversified portfolio of appropriate investment products
The benefits of portfolio diversification are well documented. Figure 17 shows how a diversified balanced index outperformed the S&P 500 by an average of 1.7 percentage points annually (11.2% vs. 9.5%) over a long time period (1965-2012) spanning multiple business cycles.
Figure 17: Comparison of return by portfolio composition38
Individuals with a financial advisor exhibit more diversified investment portfolios compared to non-advised individuals across a number of dimensions
Portfolio diversification refers to the practice of mitigating investment risk by investing in a variety of un-correlated products. There are a number of ways to assess portfolio diversification. We have attempted to assess relative portfolio diversification between advised and non-advised individuals with respect to several basic measures.
1. The number of asset classes within the portfolio – The correlation between investments in different asset classes is typically lower than that between investments in the same asset class. Thus, the more distinct asset classes in an investor’s portfolio the more diversified the portfolio, on average.
2. The ratio of equities to fixed income – This is a basic measure of portfolio risk with a higher concentration in equities typically signaling a riskier portfolio. A “60/40” portfolio consisting of 60% equity and 40% fixed income is widely recognized as a balanced portfolio that provides capital appreciation and income while limiting volatility and potential loss of capital. A substantial overweighting of
38 DFA Returns 2.0
Portfolio Mix 1965-1981 1982-1999 2000-9/2012 Total Period
S&P 500 Index +6.3% +18.5% +1.7% +9.5%
Cash +6.7% +6.2% +2.2% +5.3%
Diversified Balanced Index
+9.9% +15.1% +7.4% +11.2%

26
equities or fixed income could indicate a misalignment between intended and actual risk-taking.
3. The use of packaged products vs. individual securities – Packaged products like mutual funds are typically composed of many securities, and have lower non-systematic risk (i.e. individual company risk exposure) than an equivalent investment in a smaller number of individual securities. As a result, investment strategies employing packaged products tend to be more diversified than strategies that rely only on individual securities.
Based on each of these three measures of diversification, we found individuals with a financial advisor have more diversified portfolios than individuals without a financial advisor.
1. Number of asset classes within the portfolio – Individuals with a financial advisor own twice as many asset classes as non-advised individuals
In a 2010 study, Charles Schwab found that financial advisors help clients achieve greater investment diversification, and that the average investor receiving professional advice invests in over four more asset classes than an investor who does not (e.g. more than 8 versus 3.7)39.
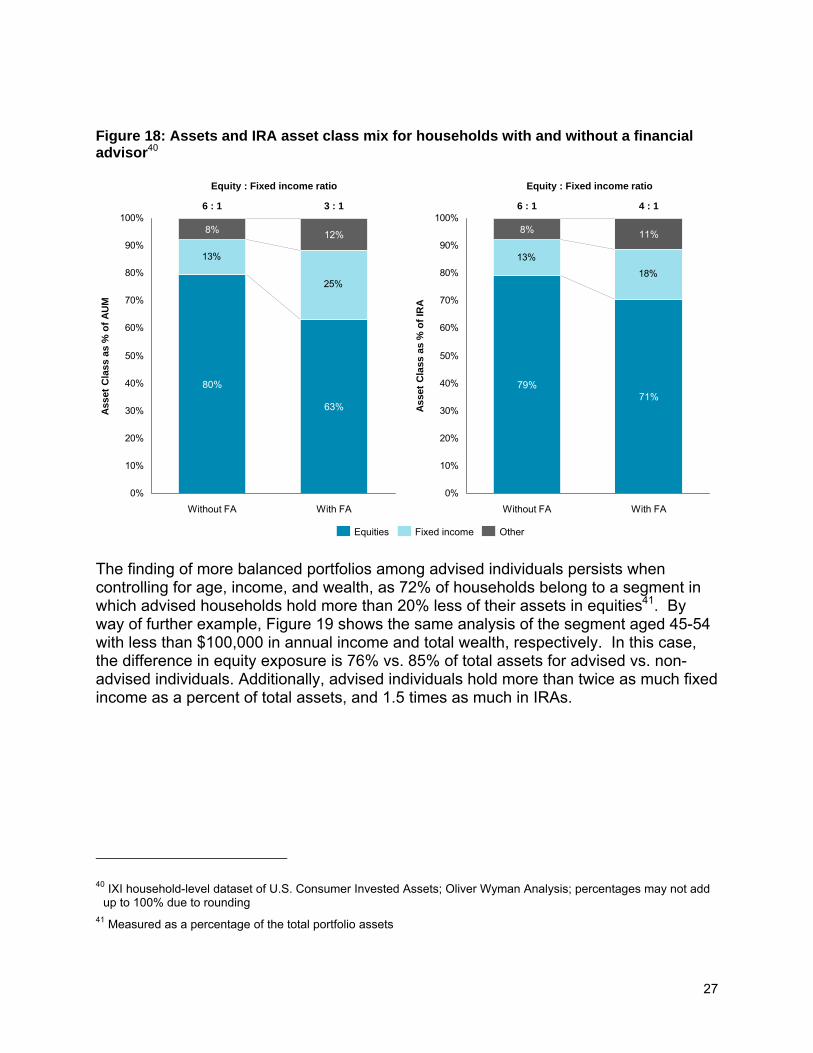
2. Ratio of equities to fixed income -- Advised individuals have more balanced portfolios than non-advised investors, and hold, on average, more than 20% less equities and nearly twice as much fixed income
Individuals with a financial advisor have more balanced portfolios with less equity exposure and higher fixed income allocations than non-advised individuals. As shown in Figure 18, advised individuals held 17 percentage points (more than 20%) less equity than non-advised individuals, as well as nearly twice as much fixed income exposure (25% vs. 13% as a percent of the total portfolio). IRA holdings show a similar, finding where the difference in equity exposure is 8 percentage points (or 10%) less of an allocation for advised individuals vs. those without a financial advisor. By contrast, fixed income exposure is 38% higher for advised vs. non-advised individuals.
39 Charles Schwab, ‘Advice Matters: New Charles Schwab Study Demonstrates Positive Impact of Professional Advice on 401(k) Investor Behavior’, (http://pressroom.aboutschwab.com/press-release/schwab-corporate-retirement-services-news/advice-matters-new-charles-schwab-study-demo)
27
Figure 18: Assets and IRA asset class mix for households with and without a financial advisor40
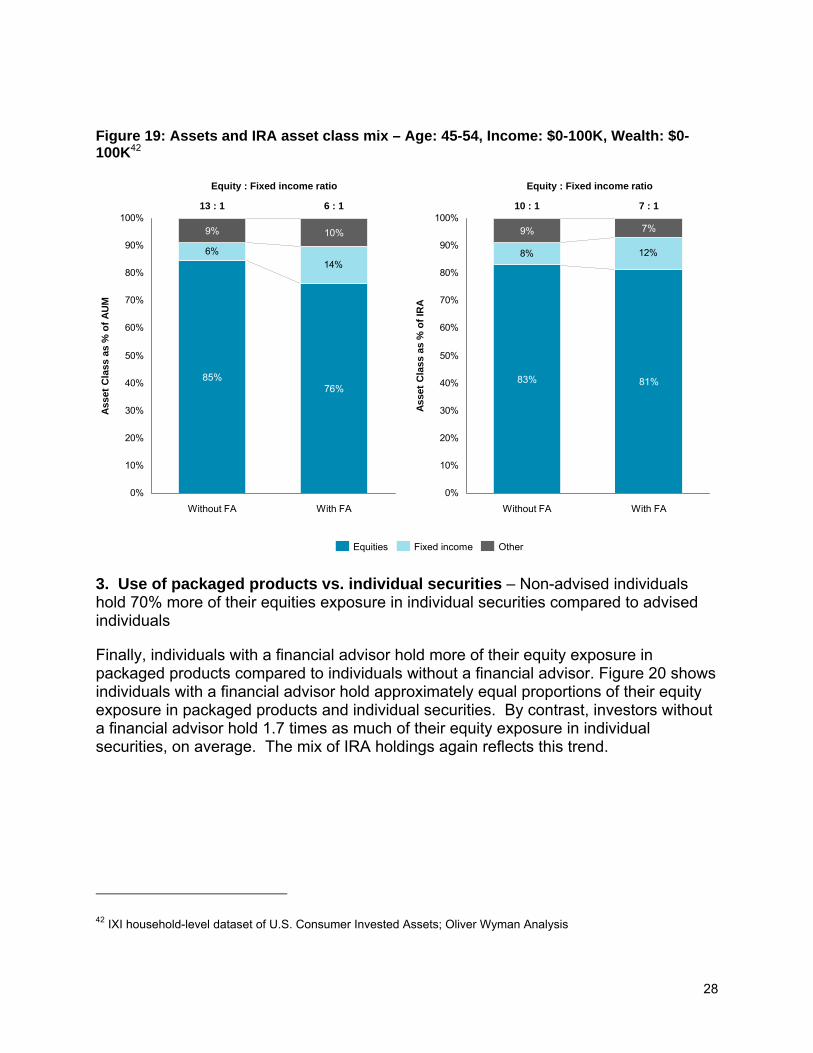
The finding of more balanced portfolios among advised individuals persists when controlling for age, income, and wealth, as 72% of households belong to a segment in which advised households hold more than 20% less of their assets in equities41. By way of further example, Figure 19 shows the same analysis of the segment aged 45-54 with less than $100,000 in annual income and total wealth, respectively. In this case, the difference in equity exposure is 76% vs. 85% of total assets for advised vs. non-advised individuals. Additionally, advised individuals hold more than twice as much fixed income as a percent of total assets, and 1.5 times as much in IRAs.
40 IXI household-level dataset of U.S. Consumer Invested Assets; Oliver Wyman Analysis; percentages may not add up to 100% due to rounding
41 Measured as a percentage of the total portfolio assets
13%
25%
0%
10%
20%
30%
40%
50%
60%
70%
80%
90%
100%
Without FA
12%
63%Ass
et C
las
s a
s %
of
AU
M
With FA
8%
80%
OtherFixed incomeEquities
13%
18%
0%
10%
20%
30%
40%
50%
60%
70%
80%
90%
100%
As
set
Cla
ss a
s %
of
IRA
71%
Without FA
8%
79%
With FA
11%
6 : 1 3 : 1 6 : 1 4 : 1
Equity : Fixed income ratio Equity : Fixed income ratio
28
Figure 19: Assets and IRA asset class mix – Age: 45-54, Income: $0-100K, Wealth: $0-100K42
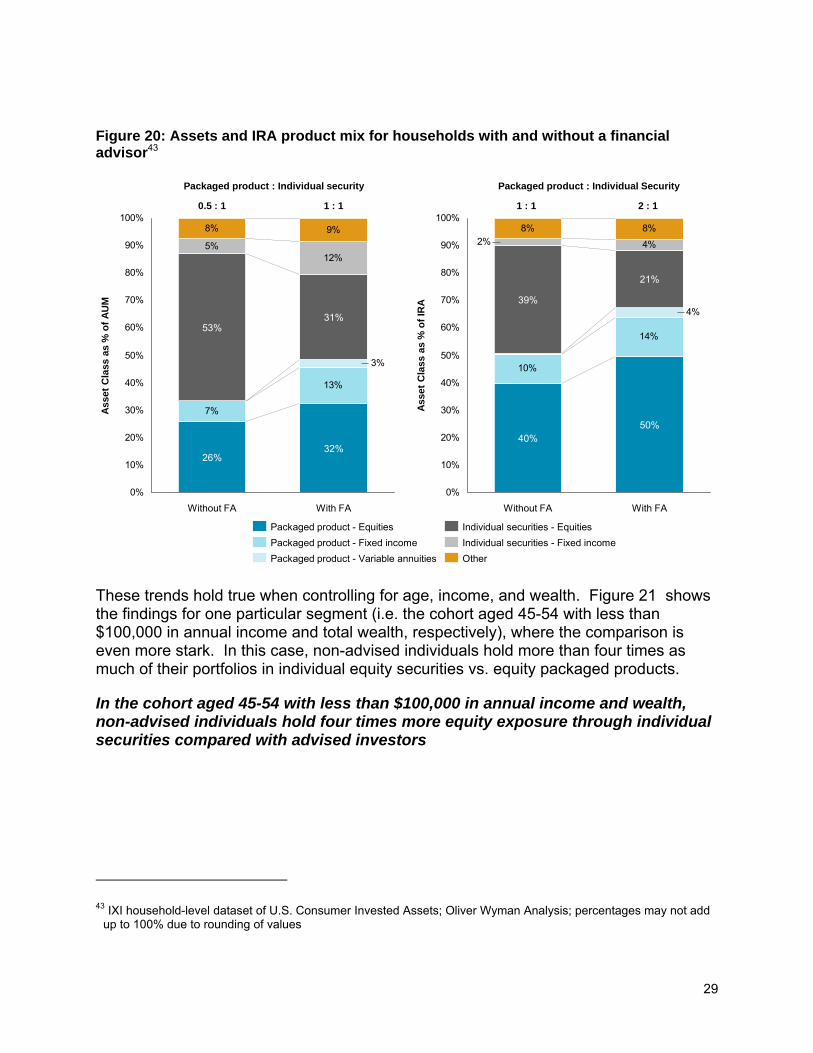
3. Use of packaged products vs. individual securities – Non-advised individuals hold 70% more of their equities exposure in individual securities compared to advised individuals
Finally, individuals with a financial advisor hold more of their equity exposure in packaged products compared to individuals without a financial advisor. Figure 20 shows individuals with a financial advisor hold approximately equal proportions of their equity exposure in packaged products and individual securities. By contrast, investors without a financial advisor hold 1.7 times as much of their equity exposure in individual securities, on average. The mix of IRA holdings again reflects this trend.
42 IXI household-level dataset of U.S. Consumer Invested Assets; Oliver Wyman Analysis
6%14%
0%
10%
20%
30%
40%
50%
60%
70%
80%
90%
100%
With FA
85%
9%
76%
Without FA
Ass
et C
lass
as
% o
f A
UM
10%
8% 12%
0%
10%
20%
30%
40%
50%
60%
70%
80%
90%
100%
As
set
Cla
ss
as %
of
IRA
With FAWithout FA
83%
9%
81%
7%
13 : 1 6 : 1 10 : 1 7 : 1
Equity : Fixed income ratio Equity : Fixed income ratio
OtherEquities Fixed income
29
Figure 20: Assets and IRA product mix for households with and without a financial advisor43
These trends hold true when controlling for age, income, and wealth. Figure 21 shows the findings for one particular segment (i.e. the cohort aged 45-54 with less than $100,000 in annual income and total wealth, respectively), where the comparison is even more stark. In this case, non-advised individuals hold more than four times as much of their portfolios in individual equity securities vs. equity packaged products.
In the cohort aged 45-54 with less than $100,000 in annual income and wealth, non-advised individuals hold four times more equity exposure through individual securities compared with advised investors
43 IXI household-level dataset of U.S. Consumer Invested Assets; Oliver Wyman Analysis; percentages may not add up to 100% due to rounding of values
7%
13%
5%12%
8% 9%
3%
0%
10%
20%
30%
40%
50%
60%
70%
80%
90%
100%
With FA
Ass
et
Cla
ss a
s %
of
AU
M
31%
32%
Without FA
53%
26%
0.5 : 1 1 : 1 1 : 1 2 : 1
Packaged product : Individual security Packaged product : Individual Security
Other
Individual securities - Fixed income
Individual securities - Equities
Packaged product - Variable annuities
Packaged product - Fixed income
Packaged product - Equities
10%
14%
4%
8% 8%
4%
2%
0%
10%
20%
30%
40%
50%
60%
70%
80%
90%
100%
39%
40%
Ass
et
Cla
ss a
s %
of
IRA
With FA
21%
50%
Without FA

30
Figure 21: Assets and IRA product mix – Age: 45-54, Income: $0-100K, Wealth: $0-100K44
D. Staying invested in the market
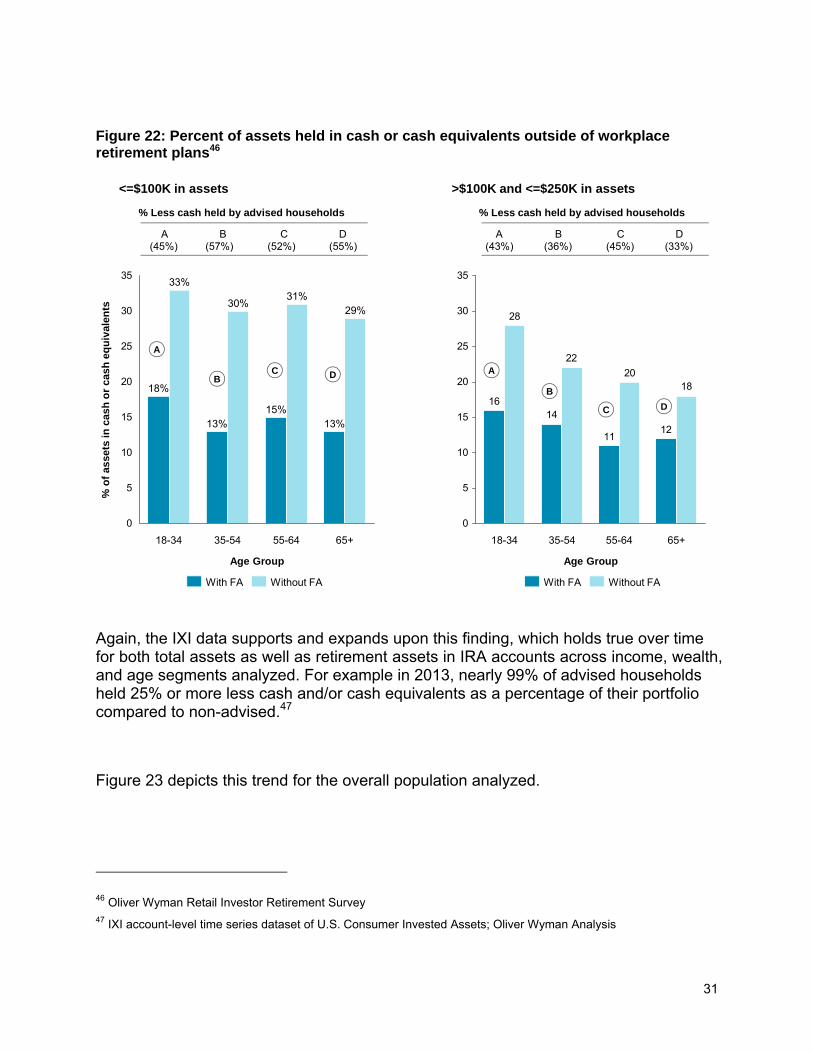
Individuals with a financial advisor hold smaller cash balances – ranging from 36%-57% less than non-advised individuals for similar age and wealth cohorts
In our Retail Investor Retirement Survey, we found that individuals with financial advisors hold a smaller percentage of their non-retirement assets in cash equivalents. As shown below in Figure 22, this finding holds true across all asset and age stratums45. As cash equivalent holdings have lower real returns, individuals may potentially achieve higher long-term returns by limiting their allocation to cash.
44 IXI household-level dataset of U.S. Consumer Invested Assets; Oliver Wyman Analysis; percentages may not add up to 100% due to rounding of values
45 The differences observed in cash holdings between advised and non-advised households was significant at a 95% confidence level for all segments except the group aged 65 or older with $250K-$ 1MM in assets
12%
9% 7%
6%
3%
1%1%
0%
10%
20%
30%
40%
50%
60%
70%
80%
90%
100%
Ass
et C
lass
as
% o
f A
UM
With FA
12%
64%
Without FA
52%
33%
8%
11%
9% 5%
2%
1%
0%
10%
20%
30%
40%
50%
60%
70%
80%
90%
100%
With FA
8%
73%
Without FA
34%
49%A
sset
Cla
ss a
s %
of
IRA
1 : 1 4 : 1 1 : 1 6 : 1
Packaged product : Individual security Packaged product : Individual Security
Other
Individual securities - Fixed income
Individual securities - Equities
Packaged product - Variable annuities
Packaged product - Fixed income
Packaged product - Equities
31
Figure 22: Percent of assets held in cash or cash equivalents outside of workplace retirement plans46
Again, the IXI data supports and expands upon this finding, which holds true over time for both total assets as well as retirement assets in IRA accounts across income, wealth, and age segments analyzed. For example in 2013, nearly 99% of advised households held 25% or more less cash and/or cash equivalents as a percentage of their portfolio compared to non-advised.47
Figure 23 depicts this trend for the overall population analyzed.
46 Oliver Wyman Retail Investor Retirement Survey 47 IXI account-level time series dataset of U.S. Consumer Invested Assets; Oliver Wyman Analysis
0
5
10
15
20
25
30
35
% o
f as
sets
in c
ash
or
cash
eq
uiv
alen
ts
Age Group
65+
29%
13%
55-64
31%
15%
35-54
30%
13%
18-34
33%
18%
Without FAWith FA
<=$100K in assets
1211
1416
1820
22
28
0
5
10
15
20
25
30
35
Age Group
65+55-6435-5418-34
Without FAWith FA
>$100K and <=$250K in assets
(55%)(52%)(57%)(45%)
% Less cash held by advised households
A B C D A B C D
% Less cash held by advised households
A
BC D A
B
C D
(33%)(45%)(36%)(43%)
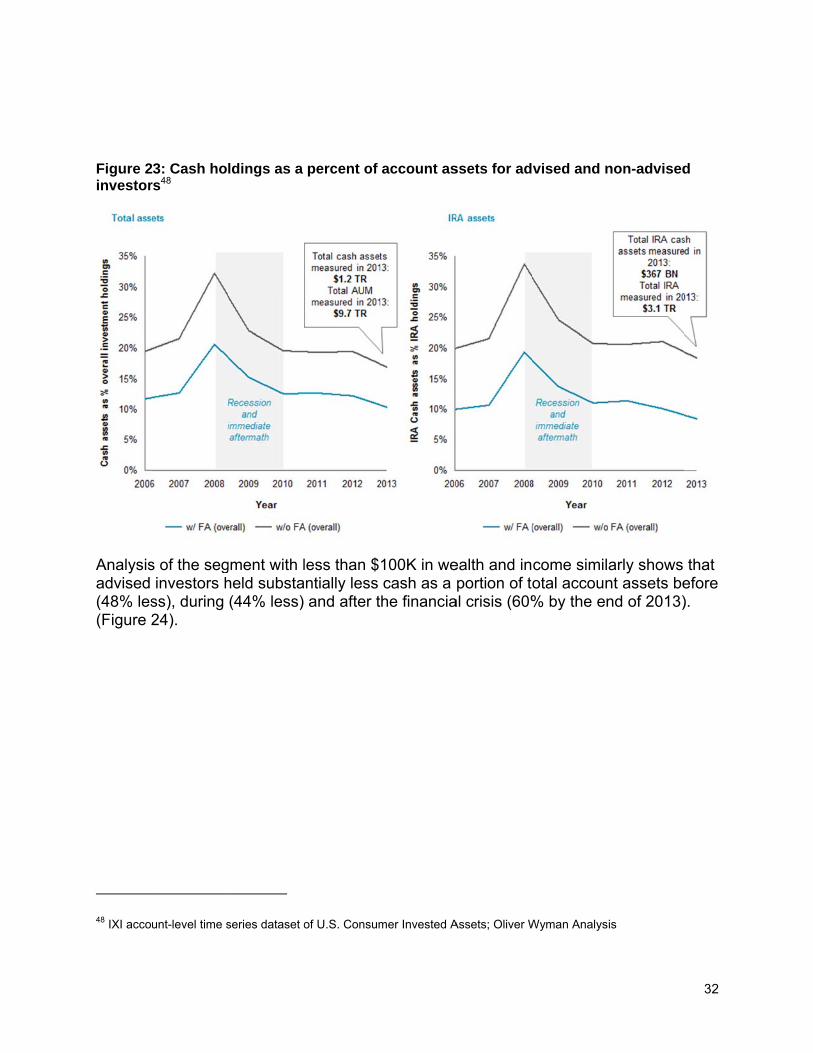
Figure 2investor
Analysisadvised (48% les(Figure 2
48 IXI acco
3: Cash hors48
s of the seginvestors h
ss), during 24).
unt-level time s
ldings as a
gment with lheld substa(44% less)
series dataset o
percent of
less than $antially less
and after t
of U.S. Consum
account as
100K in wecash as a he financia
mer Invested A
ssets for ad
ealth and inportion of to
al crisis (60%
Assets; Oliver W
vised and n
come similotal accoun% by the en
Wyman Analys
non-advised
arly shows nt assets bend of 2013)
is
32
d
that efore ).

33
Figure 24: Cash holdings as a percent of total account assets for investors with and without a financial advisor – Segment with <$100K in wealth and income49
The finding of persistently lower cash allocations for advised investors provides strong evidence that financial advisors help individuals enter and stay invested in the market across market cycles leading, on average and over time, to better investing outcomes.
Excess cash holdings represent a drag on investment performance. However, pre-mature withdrawal of retirement account assets is an even costlier investing behavior that reduces principal and the potential benefit of compounded returns.
49 IXI account-level time series dataset of U.S; Morningstar, Oliver Wyman Analysis
0%
30%
60%
90%
120%
150%
2006 2007 2008 2009 2010 2011 2012 2013
w/o FA w/ FA
Average cash holdings (% of account assets))
Precrisis
Peak crisis
Post crisis+2
Post crisis+5
w/o FA 23% 34% 23% 23%
w/ FA 12% 19% 12% 9%
Relative change in cash holdings(indexed, 2006 = 100%)
Pre-financial crisis investors without a financial advisor held nearly 2X as much cash as advised investors
A
By 2010, cash allocations for both types of investors had returned to pre-crisis levels
However, investors with a financial advisor held nearly 50% less cash as a percent of total investable assets
C
Both types of investors increased cash holdings during the crisis
Even after accounting for a sharp drop in equity market values, investors increased cash holdings1
B
At the end of 2013, advised investors held 25% less cash vs. pre-crisis levels, while allocations investors without an FA remained constant
At year-end 2013, non-advised investors held more than 2.5 times as much of their portfolios in cash
D
A
B
CD
1 Cash allocations could have increased without any change in investor behavior due to the large decline in equity markets. We analyzed the magnitude of the this potential effect in the following manner. Average advised investor pre-crisis (2007) allocation to equities was 60% while cash holdings represented 12% of investable assets. Assuming (1) no change in portfolio holdings, (2) only equity values changed, and (3) the equities allocation performed similarly to the S&P (as measured by SPY) during the financial crisis, the 38% drop in SPY share price in 2008 could have represented at most 3.5% of the 7% point increase cash holdings, i.e. .12/(1-(0.38*0.6))-.12. The equivalent figure for non-advised is 8%, i.e. 0.24/(1-(0.38*0.66))-0.24 of the 10% point increase in cash holdings. Since actual equity allocations dropped by only 40-45% of that predicted in (3) above, the equity market decline is estimated to account for an even smaller portion of increased account cash allocations..

34
Financial advisors help individuals avoid premature IRA distributions - 76% of heads of households that made traditional IRA withdrawals in 2013 were retired
Tax-advantaged workplace retirement plans provide the greatest benefit when individuals start saving early and continue to save and invest throughout their working years until retirement age. According to a GAO study, “Cashouts [have] the greatest ultimate impact on participants’ retirement preparedness […] Cashouts of 401(k) accounts at job separation can result in the largest amounts of leakage and the greatest proportional loss in retirement savings.”50
Approximately 9 out of 10 (88%) IRA accounts are held in a brokerage model, where an individual has access to a range of different types of advice and support from a financial advisor.51 According to ICI, IRA holders tend to keep assets in their accounts until retirement. In 2013, 76% of households that made traditional IRA withdrawals were retired. This stands in contrast with DC plan behavior, where there is a natural triggering event when individuals terminate employment. According to a Vanguard study, 38% of individuals in their twenties took cash distributions upon leaving their employer52. Moreover, individuals aged 25-34 were more than three times as likely to take a cash distribution from a 401(k) compared to an IRA when leaving a job. Different distribution rates by age cohort and account type are illustrated in Figure 25.
50 Government Accountability Office, ‘401(k) Plans: Policy Changes Could Reduce the Long-term Effects of Leakage on Workers' Retirement Savings’, August 2009
51 Oliver Wyman, ‘Assessment of the Impact of the Department of Labor’s Proposed “Fiduciary” Definition Rule on IRA Consumers’, 2011
52 Vanguard, ‘How America Saves 2013: A report on Vanguard 2012 defined contribution plan data’, June 2013

35
Figure 25: Percentage of individuals taking cash distributions by age and plan type53
The value of remaining invested is illustrated in a worked example, shown in Figure 26, where we contrast the potential outcomes of two scenarios. In the first scenario, an individual with a $10,000 account balance takes a cash distribution 30 years prior to retirement. Assuming an early withdrawal penalty of 10%, a federal tax rate of 15% and a state tax rate of 3%, they would have $7,200 after penalties and taxes. In the second scenario, the individual rolls the same amount of money into an IRA, achieves an average annual return of 6% and is subject to the same combined state and federal 18% tax rate at retirement. In this situation, they would have $44,280 after taxes, or approximately $24,500 in current period equivalent dollars, assuming 2% annual inflation – an amount 3.4 times greater.
Figure 26: Worked example comparing a cash distribution with an IRA rollover- Illustrative
53 Butrica, Zedlewski, Issa, ‘Understanding Early Withdrawals from Retirement Accounts’, 2010
2%
10%
8%
6%
4%
0
4.0%
Per
cen
t o
f p
eop
le t
akin
g a
cas
h d
istr
ibu
tio
n
3.4%
3.1%
6.6%
55-58
4.5%4.8%
45-54
4.3%
7.5%
35-44
7.4%
25-34
9.7%
3.2%
0.3%
Age
IRA
401(k)
Penalty or Tax Amount
Early Withdrawal Penalty (10% of withdrawal amount)
$1,000
Required Federal tax withholding
$2,000
Federal tax withholding refund you should receive
$500
State tax you will owe $300
Paid$2,800
Receieved$7,200
36
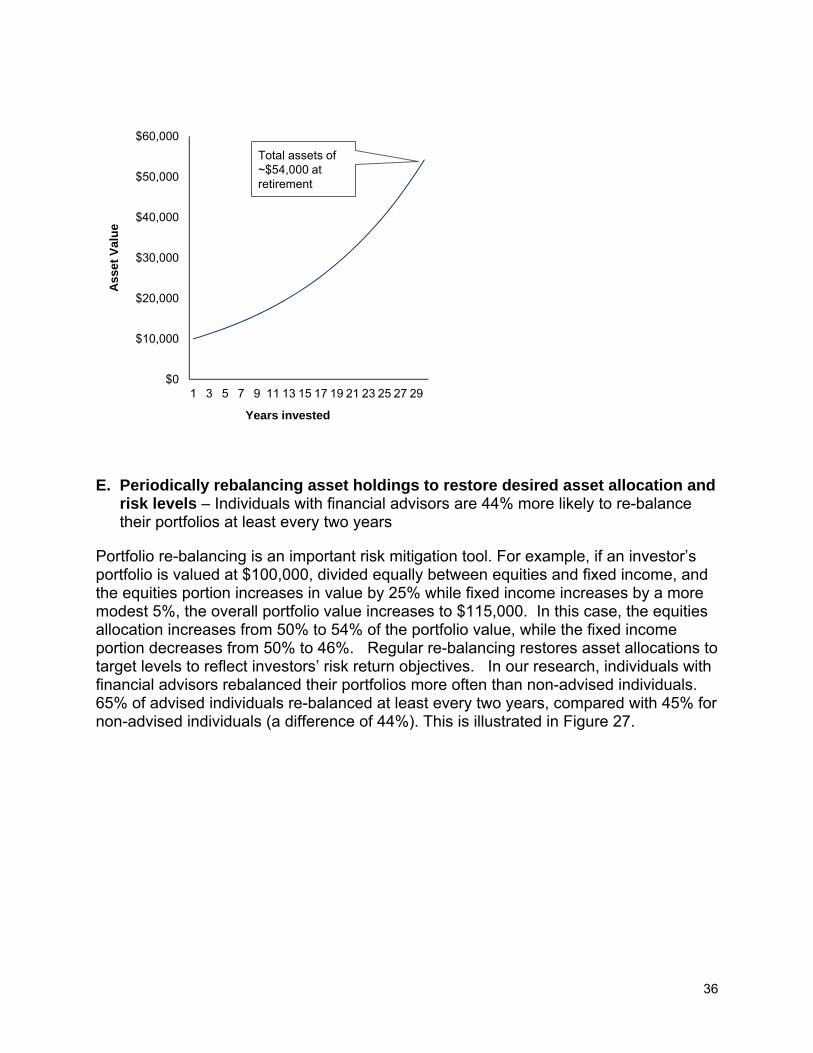
E. Periodically rebalancing asset holdings to restore desired asset allocation and risk levels – Individuals with financial advisors are 44% more likely to re-balance their portfolios at least every two years
Portfolio re-balancing is an important risk mitigation tool. For example, if an investor’s portfolio is valued at $100,000, divided equally between equities and fixed income, and the equities portion increases in value by 25% while fixed income increases by a more modest 5%, the overall portfolio value increases to $115,000. In this case, the equities allocation increases from 50% to 54% of the portfolio value, while the fixed income portion decreases from 50% to 46%. Regular re-balancing restores asset allocations to target levels to reflect investors’ risk return objectives. In our research, individuals with financial advisors rebalanced their portfolios more often than non-advised individuals. 65% of advised individuals re-balanced at least every two years, compared with 45% for non-advised individuals (a difference of 44%). This is illustrated in Figure 27.
$0
$10,000
$20,000
$30,000
$40,000
$50,000
$60,000
1 3 5 7 9 11 13 15 17 19 21 23 25 27 29
Ass
et V
alu
e
Years invested
Total assets of ~$54,000 at retirement

37
Figure 27: Rebalancing frequency outside of DC plans54
* * *
Returning to the original question of the value of a financial advisor, the majority of individuals across wealth and age segments, as well as many small businesses, seek professional financial advice, and value their FA as a trusted advisor. We found substantial evidence that advised individuals are more sophisticated and diligent long term investors who achieve better investing outcomes.
The benefits financial advisors provide are now at risk. On April 14, 2015, the Department of Labor issued its Conflict of Interest rule proposal, a replacement for the
54 Oliver Wyman Retail Investor Retirement Survey 2014: A KS test is significant at a 95% confidence level
9%
13%
14%
19%
31%
26%34%
5%
3%
2%
0%
10%
20%
30%
40%
50%
60%
70%
80%
90%
100%
Per
cen
t o
f re
spo
nd
ents
Relationship Status
With FA
14%
Without FA
31%
Less frequently than every 10 years
Annually or more frequently
Every 3-5 years
Every 1-2 years
Every 6-10 years
Never
38
Definition of the term “fiduciary” rule proposal withdrawn in September 2011. 55 In our 2011 study reviewing the impact of the previously proposed rule, we concluded that the Department of Labor’s proposed rule change was motivated by a laudable objective: to ensure a high standard of care toward retirement plan participants and account holders with regard to the receipt of services and investment guidance, amid an increasingly complex financial marketplace. However, we found the proposed rule was likely to have serious negative and unintended effects on the very individuals the change was supposed to help.
Many stakeholders are now analyzing the technical details of the newly proposed rule, and there is growing consensus on the implications for financial services providers with regard to the prohibited transaction exemptions newly proposed, modified or absent from the proposed rule. However, with regard to the impact on individuals, regrettably we reach the same overall conclusion as in the prior study. The proposed rule change will likely have significant consequences that will adversely impact individual investors’ ability to save for retirement.
As proposed, financial advisors would be forced to withdraw workplace retirement plan set-up and support services from small businesses, due to the lack of an exception allowing providers to market to plans with fewer than 100 participants that are self-directed –many small businesses are likely to close or not open plans due to the additional administrative burden as a result. This would directly impact the 19 MM individuals who work for small businesses with fewer than 50 employees, who do not currently have access to a workplace retirement plan by reducing the likelihood these individuals will gain access to a plan in the future
Individuals with small balance accounts are likely to lose access to retirement help and support with selecting appropriate products. We previously estimated that 7 MM current IRAs would not qualify for an advisory account due to low balances56
Almost all retail investors would face increased costs (73% to 196% on average) from providers shifting clients to a fee-based advisory model. In our 2011 study, we found nearly 90% of the 23 MM IRAs analyzed were held in brokerage accounts 57
55 Definition of the Term “Fiduciary”; Conflict of Interest Rule – Retirement Investment Advice, 80 Fed. Reg. 21928, pp. 21927-21960 (proposed Apr. 20, 2015)
56 Oliver Wyman, ‘Assessment of the Impact of the Department of Labor’s Proposed “Fiduciary” Definition Rule on IRA Consumers’, 2011
57 Oliver Wyman, ‘Assessment of the Impact of the Department of Labor’s Proposed “Fiduciary” Definition Rule on IRA Consumers’, 2011

39
Individuals are less likely to open an IRA, leading to lower savings rates and increased cash-outs when changing jobs58
Unadvised individuals are likely to carry excess portfolio risk due to less diversification and less frequent re-balancing compared with advised individuals
* * *
Retirement is too important to get wrong 59. We encourage key stakeholders from the financial services industry and regulators to join together to find workable solutions that preserve individuals’ access to help and support from a financial advisor of their choosing as well as the business model and fees that best meet their needs.
58 Prior guidance from the DOL “held that recommendations to a plan participant to take an otherwise permissible distribution, even combined with a recommendation as to how to invest distributed funds, is not fiduciary investment advice.” K&L Gates, DOL Re-Proposes Rule to make Brokers, Others, ERISA Fiduciaries (Apr. 27, 2015), http://www.klgates.com/dol-re-proposes-rule-to-make-brokers-others-erisa-fiduciaries-04-27-2015.
59 [C]onstraints on the availability of investment services that could result from the DOL’s reproposal, particularly for smaller plans or individual retirement investors, can undermine the retirement system in various ways.” Sutherland, Legal Alert: DOL Reproposes Expanded ERISA Fiduciary Definition and Revised Complex of Exemptions (Apr. 21, 2015), http://www.sutherland.com/NewsCommentary/Legal-Alerts/172823/Legal-Alert-DOL-Reproposes-Expanded-ERISA-Fiduciary-Definition-and-Revised-Complex-of-Exemptions.

40
Survey methodology
Our small business survey had 1,216 valid complete responses by owners and HR decision makers of payroll-based businesses with between 1 and 100 employees. We employed a stratified sampling approach designed to control for the size of the business and ensure that a sufficient number of businesses were recorded that did and did not consult with financial advisors. Furthermore, we selected three company size cohorts for analysis, namely 1–9, 10–49, and 50–100 employees, based the alignment of these segments with data available on employee retirement plan access for comparison purposes. This design allowed us to isolate the impact that financial advisors have upon small businesses. Where appropriate, we report conclusions that are statistically significant at a 95% confidence level using standard methods of statistical inference.
Our retail investor survey had 4,393 valid complete responses by non-retired individuals with investments or retirement accounts. Responses were excluded from respondents who, at the time of the survey, were: under age 18; retired; not at least partially responsible for financial decision making; and non-investors, meaning they did not have at least one investment or retirement account. In addition, we excluded incomplete responses and those completed in less than 1/3 of the median time to ensure a robust data set. Any figures that we report describe this specific sub-population.
Our stratified sampling approach in this case controlled for age and income as well as the presence of a financial advisor. In designing the sample this way, we strove to control for the effects that age and income have upon investment decisions and retirement planning. However, as our sample does not match the composition of the overall population, we utilize scale factors in our analysis to correct for respondent bias, by underweighting sample responses that are overrepresented relative to the population and vice-versa. Although we sampled based upon age, income and the presence of a financial advisor, we scale our sample to the population using age, assets, and the presence of a financial advisor, as the distribution of household assets is better documented in secondary sources than the distribution of personal income. We obtained the population distribution of household age and assets for FA advised and non-FA advised households from the survey of Consumer Finances, a triennial cross-sectional survey of US families conducted by the Federal Reserve. We utilized the 2013 survey data. We report conclusions that are statistically significant at a 95% confidence level.
41
Appendix I.
Methodology for analysis of U.S. retail investor assets
Our analysis leveraged IXI Services data containing segment-level detail on U.S. consumer invested assets. Segments were defined by specific age tiers (five), income tiers (eleven), wealth tiers (seven), advisor relationship type (Full Service Brokerage vs. Discount Brokerage) and year. For the purposes of this report, we refer to the Full Service Brokerage relationship as “with financial advisor” and the Discount Brokerage relationship as “without financial advisor.”
IXI data contained information on total segment:
Assets and IRA holdings
Asset class distribution
Number of households / accounts
We used two datasets from IXI, which were distinct in the following ways:
Dataset name 1. Household Point-In-Time 2. Account Time Series Time period 2012-2013 2006-2013 Count type Households60 Accounts 2013 Assets $5.6 TR $9.7 TR 2013 Population 21 MM households 71 MM accounts Segment criteria Only households with recorded
age, income and wealth segment Includes accounts with no recorded age
While the age segment criterion was analyzed in the Account Time Series dataset, it was ultimately eliminated to capture a broader representation of US invested assets. This is due to a data limitation whereby only 60% of accounts were associated with a specific age. All findings in this study were confirmed across all age, wealth, income, and time segments in both the Household Point-In-Time and Account Time Series datasets unless indicated otherwise.
Findings were generated by comparing the segment-level averages of the various metrics listed above between the Full Service and Discount Brokerage populations. In drawing conclusions from this granular segment-level comparison, we disregarded segments with fewer than 500 households (Household Point-In-Time) or 500 accounts
60 IXI could only aggregate account holdings from a single household within a given institution and could not aggregate households’ holdings across institutions

42
(Account Time Series) to eliminate segments with insufficient data points. This resulted in the exclusion of 0.01%-0.04% of the population.

43
Appendix II.
Automated solutions to address inertia in retirement plans do not guarantee optimal retirement outcomes
It has been well-documented that retirement outcomes are significantly impacted by the status quo bias that leads DC plan participants to prefer their current state both in terms of non-participation and nature of participation61. This not only affects contribution rates but also asset allocations, both with respect to rebalancing and following a risk allocation glide path to match investor risk profiles at various ages.
Standard default contribution rates do not appear to generate sufficient asset levels for retirement.
Automatic features can impact participant behavior, a notable example being auto-enrollment features which have been shown to increase plan participation by 45%.65 However, while encouraging participation is certainly a step in the right direction, according to EBRI, the most common default contribution rate within a workplace retirement plan was just 3% in 201262. This falls well short of an ideal default path to encourage sufficient retirement savings, which is suggested by Prudential as, “A 5–6% default deferral rate with a 2% annual acceleration up to a cap of at least 10–12%”65. Unfortunately, only 21% of plans had an automatic escalation feature in 201363, leading us to conclude that inertia leads many participants continue to save at sub-optimal default contribution rates.
The illustrated example shown below in Figure 28 confirms that for the average individual, a 3% savings rate results in sub-optimal retirement savings. The example utilizes the median income by age according to the US Census, which assumes that an income of approximately $36,000 at age 25 grows to an income of $58,000 at age 65. In addition, we utilize a constant 3% contribution rate consistent with the most common default rate, and 6% annual returns. These assumptions lead to a total asset value of approximately ~$220,000 at age 65, which at approximately 3.8 times the illustrative ending salary falls short of industry recommendations that suggest that individuals save 8 times their ending salary64, or approximately $460,000 in this case. In order to retire
61 Overcoming Participant Inertia: Prudential Research: (http://research.prudential.com/documents/rp/Automated_Solutions_Paper-RSWP008.pdf)
62 EBRI September 2012 notes: (http://www.ebri.org/pdf/notespdf/EBRI_Notes_09_Sept-12.HCS-AE.pdf) 63 JP Morgan Asset Management, 2013 defined contribution Plan Sponsor survey Findings: Evolving Toward Greater
Retirement Security 64 Fidelity Investments, ‘Fidelity Outlines Age-Based Savings Guidelines to Help Workers Stay on Track for
Retirement’, September 2012, (http://www.fidelity.com/inside-fidelity/employer-services/age-based-savings-guidelines)
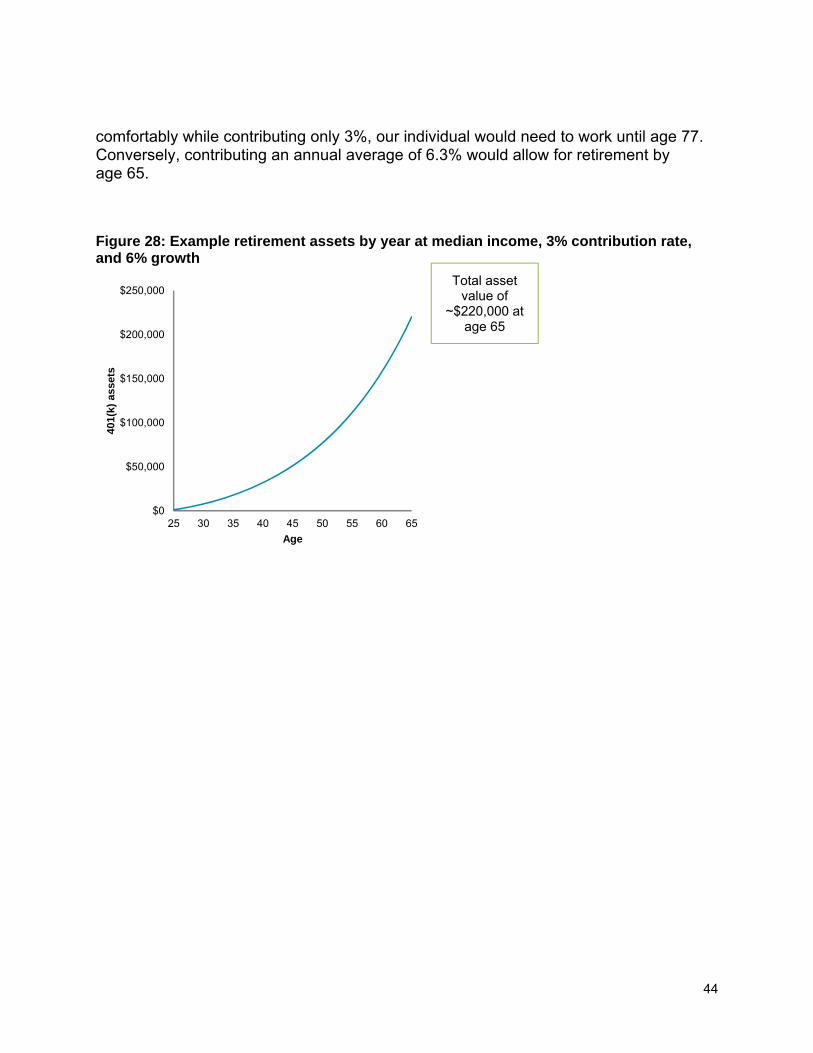
44
comfortably while contributing only 3%, our individual would need to work until age 77. Conversely, contributing an annual average of 6.3% would allow for retirement by age 65.
Figure 28: Example retirement assets by year at median income, 3% contribution rate, and 6% growth
$0
$50,000
$100,000
$150,000
$200,000
$250,000
25 30 35 40 45 50 55 60 65
401(
k) a
sset
s
Age
Total asset value of
~$220,000 at age 65

45
Report qualifications/assumptions and limiting conditions
Oliver Wyman shall not have any liability to any third party in respect of this report or any actions taken or decisions made as a consequence of the results, advice or recommendations set forth herein.
This report does not represent investment advice or provide an opinion regarding the fairness of any transaction to any and all parties. This report does not represent legal advice, which can only be provided by legal counsel and for which you should seek advice of counsel. The opinions expressed herein are valid only for the purpose stated herein and as of the date hereof. Information furnished by others, upon which all or portions of this report are based, is believed to be reliable but has not been verified. No warranty is given as to the accuracy of such information. Public information and industry and statistical data are from sources Oliver Wyman deems to be reliable; however, Oliver Wyman makes no representation as to the accuracy or completeness of such information and has accepted the information without further verification. No responsibility is taken for changes in market conditions or laws or regulations and no obligation is assumed to revise this report to reflect changes, events or conditions, which occur subsequent to the date hereof.

Oliver Wyman, Inc.
Oliver Wyman 1166 Avenue of the Americas, 29th floor New York, NY 10036 Tel: 1 (212) 541-8100 Fax: 1 (212) 541-8957 www.oliverwyman.com