the role of equatorial waves in the onset of the south
TRANSCRIPT

Dynamics of Atmospheres and Oceans42 (2006) 216–238
The role of equatorial waves in the onset of the SouthChina Sea summer monsoon and the demise of
El Nino during 1998
Katherine H. Straub a,∗, George N. Kiladis b, Paul E. Ciesielski c
a Department of Earth and Environmental Sciences, Susquehanna University, 514 University Avenue,Selinsgrove, PA 17870, United States
b NOAA Earth System Research Laboratory, Boulder, CO, United Statesc Department of Atmospheric Science, Colorado State University, Fort Collins, CO, United States
Available online 1 September 2006
Abstract
The observed sequence of events leading to the onset of the summer monsoon in the South China Sea(SCS) is described, with a particular focus on conditions during the South China Sea monsoon experiment(SCSMEX) in May–June 1998. During SCSMEX, SCS monsoon onset occurred within the context of a mul-titude of scale interactions within the ocean-atmosphere system on intraseasonal time scales. Results from the1998 SCSMEX case study illustrate that SCS monsoon onset is preceded by the development of an eastward-propagating Madden-Julian Oscillation (MJO) in the Indian Ocean, as suggested by previous authors, andthe subsequent emanation of a convectively coupled Kelvin wave into the Pacific. Remarkably similar resultsare obtained in an independent composite of 25 years of data. Since both the MJO and Kelvin waves generatewesterly surface winds in their wake, it is suggested that these waves may accelerate or trigger the monsoononset process in the southern SCS. A detailed analysis of the Kelvin wave that propagated through the SCSduring SCSMEX shows that it was responsible for a large portion of the surface wind shift leading to monsoononset in 1998. Finally, easterly wind anomalies in the eastern Pacific associated with the Indian Ocean MJOevent during the SCSMEX period are shown to result in the sudden demise of the 1997–1998 El Nino event.© 2006 Elsevier B.V. All rights reserved.
Keywords: Tropical meteorology; Monsoons; Kelvin waves; El Nino phenomena; Oscillations
1. Introduction
The onset of the Asian summer monsoon (ASM) has long been thought to progress northwardand westward across southeast Asia, beginning in the South China Sea (SCS) in mid-May and
∗ Corresponding author.E-mail address: [email protected] (K.H. Straub).
0377-0265/$ – see front matter © 2006 Elsevier B.V. All rights reserved.doi:10.1016/j.dynatmoce.2006.02.005

K.H. Straub et al. / Dynamics of Atmospheres and Oceans 42 (2006) 216–238 217
reaching the Indian subcontinent and mainland China by early June (Tao and Chen, 1987; seeHsu, 2005 for a review). Monsoon onset is usually defined as the commencement of sustainedlow-level westerlies and enhanced precipitation over a given area (e.g., Ding and Liu, 2001; Wanget al., 2004 and references therein). In the SCS, monsoon onset is marked not only by a reversalof surface winds from easterly to westerly and the onset of deep convection, but also the eastwardretreat of the western Pacific subtropical high, the establishment of a cyclonic circulation over thenorthern SCS, and the intrusion of strong midlatitude frontal activity (e.g., Lau et al., 1998; Chanet al., 2000; Ding and Liu, 2001; Johnson and Ciesielski, 2002).
The South China Sea monsoon experiment (SCSMEX), a multi-national field campaign duringMay–June 1998, was designed to investigate the origins of the ASM within the SCS. Resultsfrom SCSMEX have illuminated many aspects of the monsoon onset process, ranging frommesoscale to planetary scale in breadth (e.g., Ciesielski and Johnson, 2006 and references therein).A particularly interesting result, suggested prior to SCSMEX but investigated in great detail inthe post-SCSMEX period, is that the first onset of the ASM occurs not in the SCS, but in the Bayof Bengal (Lau et al., 1998, 2000; Wu and Zhang, 1998; Ding and Liu, 2001; Xu and Chan, 2001;Liu et al., 2002). A typical onset sequence begins with the establishment of deep convection in theIndian Ocean and the subsequent development of one or more tropical disturbances or cyclones(i.e., an “onset vortex” in the Northern Hemisphere (Krishnamurti et al., 1981) or “twin cyclones”straddling the equator (e.g., Lau et al., 1998)). The Northern Hemisphere cyclone progressesnorthward into the Bay of Bengal, resulting in copious rainfall and the onset of surface westerliesto its south. The rainfall and westerly winds then progress eastward at tropical latitudes, into theSCS, and subsequently spread northward and westward toward India and southeastern China inthe following weeks (Lau et al., 1998, 2000; Chan et al., 2000; Xu and Chan, 2001; Liu et al.,2002).
Case studies of SCS monsoon onset in 1997 (pre-SCSMEX) and 1998 (during SCSMEX)by Lau et al. (1998, 2000) illustrate the eastward progression of convection from the Bay ofBengal to the SCS and the subsequent onset of the SCS monsoon. In both cases, the eastward-propagating convective complex is identified as the active phase of a Madden-Julian Oscillation(MJO), a convectively coupled tropical disturbance with a period of 30–60 days (Madden andJulian, 1994 and references therein). In addition, Lau et al. (1998, 2000) note the existence ofmultiple eastward-propagating supercloud clusters (Nakazawa, 1988) during the onset process.Most eastward-propagating supercloud clusters can also be classified as convectively coupledKelvin waves (Wheeler and Kiladis, 1999; Straub and Kiladis, 2002, hereafter SK02).
The idea that the first onset of the ASM is linked to the MJO and other equatorial waves, suchas Kelvin waves, is intriguing, particularly since the MJO is a low-frequency oscillation that maybe predictable to some extent (Wheeler and Hendon, 2004). The objective of the present study isto further analyze the 1998 SCS monsoon onset in the context of these waves and compare theresults to composites generated from multiple years of data, to assess the role of equatorial wavesin SCS monsoon onset. In addition, the 1998 SCSMEX case study provides a spectacular exampleof the multiple scale interactions between equatorial waves, monsoon onset, and the terminationof the 1997–1998 El Nino.
2. Data and methodology
The results in this study are divided into two types: first, a case study of the May 1998 SCSmonsoon onset, and second, long-term composites and statistical regressions using multiple yearsof data. Datasets utilized in this study include:

218 K.H. Straub et al. / Dynamics of Atmospheres and Oceans 42 (2006) 216–238
• Cloud Archive User Service (CLAUS) window (11–12 �m) brightness temperature (Tb) data(Yang and Slingo, 2001), from 15 April–15 June 1998, at 0.5◦ horizontal resolution and three-hourly temporal resolution;
• National Oceanic and Atmospheric Administration (NOAA) outgoing longwave radiation(OLR) data (Liebmann and Smith, 1996), from 1979–2004, at 2.5◦ horizontal resolution andtwice-daily temporal resolution (0600 and 1800 UTC);
• National Centers for Environmental Prediction–National Center for Atmospheric Research(NCEP–NCAR) reanalysis data, for (1) April–June 1998, at 2.5◦ horizontal resolution and four-times-daily temporal resolution, for 16 pressure levels from 1000 to 10 hPa, and (2) 1979–2004,at 2.5◦ horizontal resolution and daily temporal resolution, at 850 and 200 hPa;
• European Centre for Medium-Range Weather Forecasts (ECMWF) reanalysis data, for1979–1993, at 2.5◦ horizontal resolution and daily temporal resolution, for 16 pressure levelsfrom 1000 to 10 hPa;
• SCSMEX gridded analyses of basic and derived fields, for 1 May–30 June 1998, at 1◦ horizontalresolution, 25 hPa vertical resolution, and four-times-daily temporal resolution (Johnson andCiesielski, 2002; Ciesielski and Johnson, 2006), averaged over the Coastal Borneo Array (CBA;see Fig. 7 for location); and
• Tropical Atmosphere Ocean (TAO) buoy data from the central and eastern tropical Pacific(5◦S–5◦N, 155◦E-95◦W; see Kessler and McPhaden, 1995 for buoy locations) for 15 April–15June 1998, at hourly temporal resolution.
The equatorial waves discussed in this study (the MJO and convectively coupled Kelvin waves)are identified in the OLR data using the spectral methods outlined in Wheeler and Kiladis (1999)and Wheeler et al. (2000, hereafter WKW). Briefly, regions of significantly enhanced spectralpower are identified in a wavenumber-frequency power spectrum of tropical OLR that corre-spond to the MJO and eastward-propagating Kelvin waves. These waves are extracted from thetotal OLR field using the filtering technique described in WKW and SK02, where the MJOincludes periods of 30–96 days and eastward-propagating wavenumbers 0–9, and Kelvin waveshave periods from 2.5 to 17 days, eastward-propagating wavenumbers 1–14, and equivalentdepths of 8–50 m, corresponding to eastward phase speeds of 8–30 m s−1 (see Fig. 1 in SK02for an illustration of the power spectrum and filtering region). Both the symmetric and anti-symmetric components of the OLR data are utilized in constructing each wave, as discussed inSK02.
A linear regression technique is utilized to determine the statistical relationships betweenconvection and circulation, as in many previous works (e.g., WKW; SK02; Kiladis et al., 2005).OLR and reanalysis data are linearly regressed at lag against the Kelvin- and/or MJO-filtered OLRextracted at specific points or regions of interest. The resulting regressed fields are then scaled toa −40 W m−2 anomaly in filtered OLR, which represents a strong MJO or Kelvin event.
3. Results and discussion
3.1. Large scale background of the 1998 SCS monsoon onset
The large-scale cloudiness field during the 1998 Asian summer monsoon onset is shown inFig. 1, a longitude-time diagram of CLAUS Tb averaged over the equatorial band, 5◦S–5◦N, from15 April to 15 June 1998. Prior to early May, the most intense convection (as represented bylow Tb values) is located over the eastern Pacific Ocean and South America, between 120 ◦W

K.H. Straub et al. / Dynamics of Atmospheres and Oceans 42 (2006) 216–238 219
Fig. 1. Longitude–time diagram of CLAUS Tb data, averaged from 5◦S to 5◦N, from 15 April to 15 June 1998. Straightlines represent the paths of observed convectively coupled Kelvin waves, with a phase speed of 15 (17) m s−1 for the first(second) wave; the oval encircles an MJO event. The vertical line marks the central longitude of the SCS.
and 40 ◦W. Convection is less active in the Indian Ocean and western Pacific (40 ◦E–180◦). Thispattern had been persistent since the onset of the 1997–1998 El Nino event in April 1997. The seasurface temperature (SST) anomalies associated with this El Nino event are illustrated in Fig. 2, alongitude-time diagram of daily NCEP reanalysis SST anomalies (or skin temperature over land)from 1 January 1997 to 31 December 1998, averaged from 3◦S to 3◦N. The onset and demise ofthe 1997–1998 El Nino event are visible in late April 1997 and late May 1998, respectively. Thetime period represented in the Tb plot in Fig. 1 is boxed in Fig. 2. Note the rapid cooling of SSTcentered at approximately 120◦W that occurs during this period.
The straight lines in Fig. 1 trace the paths of two convectively coupled Kelvin waves in theTb field. These Kelvin waves are initially identified in filtered OLR data (at coarser resolutionthan the CLAUS data) through the WKW filtering method described in Section 2, and are clearlyvisible in the Tb data. The first Kelvin wave begins over South America at approximately 60◦Won 26 April, and moves eastward at 15 m s−1, propagating across the Atlantic and Africa andreaching the Indian Ocean on 5 May. Kelvin waves typically propagate eastward at a speed of15–20 m s−1 (Wheeler and Kiladis, 1999; SK02). The second Kelvin wave begins in the IndianOcean within a larger region of cloudiness on 11 May, and again moves eastward at 15 m s−1,crossing the Pacific and returning to the east coast of South America on 30 May. Between thetwo Kelvin waves lies an MJO [or intraseasonal oscillation (ISO)] in the Indian Ocean, as shownby the oval-shaped contour. This more slowly-moving disturbance is also objectively identifiedin OLR data through the WKW filtering procedure described in Section 2.

220 K.H. Straub et al. / Dynamics of Atmospheres and Oceans 42 (2006) 216–238
Fig. 2. Longitude–time diagram of NCEP-NCAR reanalysis daily SST (or skin temperature over land) anomaly, averagedfrom 3◦S to 3◦N, from 1 January 1997 to 31 December 1998. Image provided by the NOAA-CIRES Physical SciencesDivision, ESRL, Boulder, CO, from their website at http://www.cdc.noaa.gov/.
Previous studies have examined the details of monsoon onset in the SCS (105◦–120◦E; notevertical line in Fig. 1 marking central SCS longitude) in 1998. Depending on the exact definitionand location considered, most studies place the date sometime between 15 and 25 May (Chan etal., 2000; Lau et al., 2000; Ding and Liu, 2001; Xu and Chan, 2001; Johnson and Ciesielski, 2002;Wang et al., 2004). Note that this is the period immediately following the MJO and the initiationof the second Kelvin wave in Fig. 1. The 850-hPa zonal wind anomalies for the same latitudeband and period as Fig. 1 are illustrated in Fig. 3a. Both the MJO and the second Kelvin waveare preceded by easterly wind anomalies and followed by westerly wind anomalies, particularly

K.H. Straub et al. / Dynamics of Atmospheres and Oceans 42 (2006) 216–238 221
Fig. 3. (a) Longitude–time diagram of NCEP-NCAR zonal wind anomaly at 850 hPa, from 15 April to 15 June 1998,averaged from 5◦S to 5◦N. (b) As in (a), but total zonal wind averaged from 5◦N to 15◦N. Paths of Kelvin waves (straightlines) and MJO (oval) are identical to those in Fig. 1. The dashed line in panel (a) has a phase speed of 30 m s−1.
in the longitude band 60◦E–180◦. A transition from easterly to westerly wind anomalies in thelower troposphere during the passage of both the MJO and Kelvin waves has been illustrated innumerous previous studies (e.g., SK02; Straub and Kiladis, 2003b, hereafter SK03b; Kiladis etal., 2005 and references therein). The development of westerly anomalies during the MJO–Kelvinwave passage and the ensuing SCS monsoon onset in 1998 suggests a possible causal relationship,such that the passage of an MJO and/or Kelvin wave may excite a burst of lower troposphericwesterlies that helps to initiate or accelerate the monsoon onset process near the equator. Ofcourse, the background circulation, as governed by the seasonal cycle, must be primed for thistransition as well.
Monsoon onset during this period can be observed in the total 850-hPa zonal wind field offthe equator in the Northern Hemisphere, in the 5◦–15◦N band, as shown in Fig. 3b. A rapidtransition from easterly to westerly winds can be seen around 15 May, extending from 40◦E intothe western SCS. This transition appears to be associated with the later stages of the MJO eventand the initiation of the second Kelvin wave. In the following section, we argue that this combinedMJO–Kelvin wave event is an integral component of SCS monsoon onset not only during 1998,but in a majority of other years as well.
After the development of the MJO in the Indian Ocean between 1 and 15 May, the tropicalTb pattern (see Fig. 1) begins to transition back to a more “normal” state, with more intenseconvection in the Indian Ocean and western Pacific and less activity in the eastern Pacific andSouth American regions. As shown in Fig. 2, this shift is concurrent with a rapid cooling of SSTin the eastern Pacific, signaling the end of the 1997–1998 El Nino event. The transition fromanomalously dry to wet conditions during May–June over the Maritime continent and SCSMEXdomain is consistent with the statistical relationship between ENSO and rainfall during this timeof year (Lau and Wu, 2001; Ciesielski and Johnson, 2006). Note also the existence of 850-hPaequatorial easterly anomalies near 120◦W between 10 and 20 May in Fig. 3a, at the longitudewhere the initial, rapid decrease in SST takes place in Fig. 2. It will be shown in Section 3.5

222 K.H. Straub et al. / Dynamics of Atmospheres and Oceans 42 (2006) 216–238
Table 1SCS monsoon onset dates for the years 1979–2004
13 May 1979 20 May 1988 17 May 199713 May 1980 17 May 1989 20 May 199831 May 1981 17 May 1990 24 May 199931 May 1982 7 June 1991 7 May 20007 June 1983 13 June 1992 7 May 200130 May 1984 5 June 1993 14 May 200227 May 1985 2 May 1994 14 May 200311 May 1986 12 May 1995 9 May 20047 June 1987 6 May 1996
Methodology for onset date calculation is described in Section 3.2.
that these easterly anomalies are attributable to the MJO event in the Indian Ocean, as previouslysuggested by Takayabu et al. (1999, hereafter T99), and that the rapid cooling of SST that followscan be explained by wind-induced upwelling. As will be discussed in the following sections, wesuggest that the May 1998 MJO–Kelvin event plays a vital role in both the onset of the SCSmonsoon, as previously suggested by Lau et al. (1998, 2000), and the demise of the 1997–1998El Nino event.
3.2. The role of the MJO and Kelvin waves in SCS monsoon onset
As shown in Fig. 1, the precursor sequence to the 1998 SCS monsoon onset appears to beginwith a Kelvin wave propagating eastward from South America into the Indian Ocean, followedby the development of an MJO in the Indian Ocean, and finally the propagation of another Kelvinwave eastward across the Pacific. In this section, it will be shown that enhanced Kelvin waveactivity often both precedes and follows the development of an MJO and monsoon onset duringthe boreal spring season.
To determine the average fields surrounding SCS monsoon onset, a compositing procedure isused. Onset dates for the years 1979–2004 are calculated based on the method outlined in Wanget al. (2004), modified for use with daily data. This procedure is similar to that used in previouscomposite studies of monsoon onset (e.g., Hsu et al., 1999; Ding and Liu, 2001), except here weuse daily instead of pentad averages and a wind-based definition of onset. The index used for SCSmonsoon onset is the daily NCEP-NCAR reanalysis 850-hPa zonal wind averaged over the region110◦–120◦E, 5◦–15◦N, denoted as USCS. The following criteria define the date of monsoon onset:(1) USCS > 0 in the pentad centered on the onset date; (2) USCS > 0 in at least three of the fourpentads during and after onset; and (3) USCS averaged over the four pentads during and after onset>1 m s−1. The dates generated by this modified method are listed in Table 1, and are identical toor within a few days of the central pentad dates listed in Table 2 of Wang et al. (2004), with theexception of 1984 and1992.1 The average SCS monsoon onset date calculated using this methodfor this 26-year period is 21 May. Daily fields are averaged around these onset dates from Day−35 to Day +35 to calculate the composite monsoon onset fields. Data from 1998 have been
1 In Wang et al. (2004), the onset date for 1984 is given as pentad 29, or a central date of 23 May, and the onset date for1992 is given as pentad 28, or a central date of 18 May. The current method generates onset dates of 30 May 1984 and13 June 1992. Both 1984 and 1992 are noted as having “ambiguous” onsets in the Wang et al. (2004) study, and we notethat in their Table 2, criterion (3) is not met for a pentad 28 onset date in 1992.

K.H. Straub et al. / Dynamics of Atmospheres and Oceans 42 (2006) 216–238 223
Fig. 4. Longitude–lag plot of composite (a) OLR and (b) 850-hPa zonal wind anomalies for the period 1979–2004(excluding 1998), averaged from 5◦S to 10◦N. Day 0 represents monsoon onset in the SCS, as discussed in the text, andis represented by an “X” in the figure. Straight lines represent the paths of Kelvin waves, with phase speeds of 20 m s−1;the oval encircles an MJO event.
removed from the composites to ensure that the 1998 event does not influence the results. Thefinal composites thus include 25 years of data.
Fig. 4a is a longitude-lag diagram of OLR anomalies, averaged from 5◦S to 10◦N, for thecomposite SCS monsoon onset.2 Note the similarities between Fig. 4a (the composite) and Fig. 1(the 1998 data). In the composite, a fast eastward-propagating band of negative OLR anomaliesbegins near the dateline (180◦) in the Pacific, then crosses South America, the Atlantic, and Africabefore entering the Indian Ocean (40◦E) on Day −16. The speed of this composite eastward mov-ing OLR anomaly is approximately 20 m s−1, which falls within the range of typical convectivelycoupled Kelvin wave phase speeds of 15–20 m s−1. This Kelvin wave intersects a more slowlyeastward moving OLR anomaly in the Indian Ocean, which begins on approximately Day −19and ends near 160◦E on Day +8. As in Fig. 1, this slower-moving OLR anomaly is representativeof the MJO, with an eastward speed of approximately 5 m s−1. Note also the existence of slowpositive eastward-moving OLR anomalies, representing suppressed conditions, both precedingand following the MJO. Finally, beginning on approximately Day −5, another Kelvin wave exitsthe MJO and crosses the Pacific at 20 m s−1.
Monsoon onset in the SCS occurs on Day 0 in this composite (denoted by the “X” in Fig. 4a),after the MJO-associated cloudiness has dissipated and as the second Kelvin wave crosses thePacific. The 850-hPa zonal wind signal associated with these OLR anomalies is illustrated inFig. 4b. The MJO OLR signal spans a transition from easterly to westerly anomalies, a well-known property of the MJO (e.g., Hendon and Salby, 1994; Kiladis et al., 2005). As the Kelvinwave OLR signal propagates away from the MJO convective envelope and crosses the Pacific,850-hPa zonal wind anomalies continue to transition from easterly to westerly, but at a faster
2 Composite OLR plots similar to Fig. 4a were also created based on the USCS index calculated from ECMWF reanalysisdata for the 15-year period from 1979 to 1993. Results are very similar to those shown in Fig. 4a.

224 K.H. Straub et al. / Dynamics of Atmospheres and Oceans 42 (2006) 216–238
rate of 20 m s−1, following the faster Kelvin wave. Note that after the Kelvin wave OLR signaldissipates, the westerly zonal wind anomalies remain, and in fact oscillate on an intraseasonaltimescale, rather than the much shorter timescale of an individual Kelvin wave. Similar resultswere obtained in an observational MJO study by Sperber (2003), in which zonal wind stress,divergence, and specific humidity anomalies accelerate from MJO phase speeds (5 m s−1) tomoist Kelvin wave phase speeds (20 m s−1) as they cross the Dateline (see his Fig. 10d, g, andh), while still retaining their intraseasonal timescale. These results suggest that the emanation ofconvectively coupled Kelvin waves from the active MJO envelope, as illustrated in Figs. 1 and 4a,may help to explain the faster (20 m s−1) eastward propagation of MJO convection and dynamicalsignals across the Pacific, without calling upon purely dry Kelvin wave dynamics, which canexplain signals that propagate eastward twice as fast, at 40 m s−1 (Hendon and Salby, 1994;Milliff and Madden, 1996; Matthews, 2000).
Returning to Fig. 3a, it is apparent that the Pacific Kelvin wave in the 1998 case study is pre-ceded by equatorial easterly anomalies and followed by westerly anomalies in a similar mannerto the composite in Fig. 4b, with the transition from easterly to westerly anomalies propagat-ing eastward at 20 m s−1 to the west of the Dateline, and increasing in speed to 30 m s−1 tothe east of the Dateline (as shown by the dashed line in Fig. 3a), reflecting perhaps a com-bination of moist and dry Kelvin waves in the eastern Pacific, where the convective signal isweaker.
The total zonal wind diagram in Fig. 3b for the Northern Hemisphere tropics (5◦–15◦N)illustrates a reversal of zonal wind from easterly to westerly as the equatorial Kelvin wave movesthrough the SCS on 15 May. This transition appears to be linked to the onset of the larger scalemonsoon, as evidenced by the abrupt shift from easterly to westerly winds from the westernIndian Ocean (40◦E) to the SCS (115◦E) on 15 May. From these 1998 case study results as wellas the composite results illustrated in Fig. 4b, which show a similar transition prior to monsoononset, we hypothesize that the initial trigger for monsoon onset in the southern SCS is often anMJO–Kelvin wave complex originating in the Indian Ocean. As discussed in the next section, ananalysis of monsoon onset in individual years shows that a majority of cases in this 26-year perioddo in fact include evidence of an MJO in the Indian Ocean and/or a Kelvin wave emanating intothe Pacific.
3.3. The evolution of monsoonal westerlies within the MJO
The previous sections have established the Kelvin wave–MJO–Kelvin wave sequence thattypically precedes SCS monsoon onset. In this section, we look more closely at the smaller-scaleconditions comprising the MJO to examine their role in the onset of westerlies in the Indian Oceanand SCS at monsoon onset.
Previous studies have documented the fact that the large-scale MJO convective envelope con-sists of numerous smaller-scale cloud clusters (Yasunari, 1979; Nakazawa, 1988; Mapes andHouze, 1993; Hendon and Liebmann, 1994; Dunkerton and Crum, 1995; SK02; Straub andKiladis, 2003a, hereafter SK03a). Note in Fig. 1 the predominance of westward-moving cloudclusters within the eastward-moving MJO and Kelvin wave envelopes during the May 1998 casestudy. Many of the westward-moving clusters within a typical MJO envelope are tropical distur-bance (TD)-type waves, some of which intensify into tropical cyclones (Sobel and Bretherton,1999 and references therein; SK03a). The equatorial westerly wind anomalies generated withina packet of these higher-frequency TD-type disturbances may project onto the lower-frequencyMJO, as suggested by SK03a. In addition, the MJO convective envelope typically includes an

K.H. Straub et al. / Dynamics of Atmospheres and Oceans 42 (2006) 216–238 225
Fig. 5. Total OLR (shading) and 850-hPa streamfunction (contours, solid positive, by 15 × 105 m2 s−1, zero contouromitted) and wind vector (longest vectors 10 m s−1) anomalies for (a) 6 May 1998, 1200 UTC; (b) 12 May 1998, 1200UTC; (c) 15 May 1998, 1200 UTC; and (d) 18 May 1998, 1800 UTC. The letter C marks the center of cyclonic circulationanomalies; KW represents the location of a Kelvin wave.
enhancement of eastward-propagating Kelvin waves, which also generate lower troposphericequatorial westerlies in their wake (WKW; SK02; SK03b). The fact that these two disturbancetypes both generate westerly wind anomalies suggests that they may play a role in the evolutionof monsoon onset in the Indian Ocean and subsequently, the SCS.
The development of westerlies associated with the MJO during May 1998 is illustrated inFig. 5. By 6 May (Fig. 5a), the Kelvin wave OLR anomaly has entered the Indian Ocean, and850-hPa westerlies extend through the region of low OLR. As the slower-moving MJO developsand moves eastward across the Indian Ocean, westerly anomalies follow it, such that by 12 May,two large off-equatorial cyclonic gyres have developed and westerlies extend to 100◦E (Fig. 5b).Lower tropospheric cyclonic gyres straddling equatorial westerlies and convection are well-knownfeatures of the MJO (e.g., Hendon and Salby, 1994). Ferreira et al. (1996) show in a simple modelthat symmetric off-equatorial cyclones can develop from an eastward-moving equatorial masssink (e.g., MJO convection) in a matter of days. Once these cyclonic gyres are established, theymay be self-sustaining, as surface convergence promotes increased upward motion and convectionin the region, which in turn strengthens the gyres. In the 1998 case study, these cyclones amplifyuntil the Northern Hemisphere gyre generates a tropical depression on 13 May.3 This depression
3 On 13 May 1998 at 0000 UTC, a tropical depression is located at 4◦N, 85.5◦E (Joint Typhoon Warning Center besttrack data).

226 K.H. Straub et al. / Dynamics of Atmospheres and Oceans 42 (2006) 216–238
intensifies and begins to move northward toward the Bay of Bengal, such that the westerlies toits south also expand northward (Fig. 5c).
As shown in Fig. 3a, equatorial westerly anomalies follow the low-frequency MJO convectiveenvelope across the Indian Ocean until 14 May, when the second Kelvin wave emerges fromthe MJO envelope and accelerates the progression of the westerlies toward the east. At the sametime, the tropical depression in the northern Indian Ocean and its associated westerly windscontinue to move northward. As shown in Fig. 3b, westerlies suddenly emerge across the IndianOcean and into the SCS in the 5◦–15◦N band on 15 May, associated with both the strengtheningtropical cyclone and the emerging Kelvin wave. By 18 May (Fig. 5d) the cyclone has reachedthe northern Bay of Bengal, and its cloudiness field merges with a southeastward-propagatingfrontal cloud band stretching toward Japan, which marks the boundary between relatively cooland dry continental air and moist tropical air over the SCS. Previous studies have shown thatmonsoon onset over the SCS is often associated with a cyclone over the Bay of Bengal, low levelsouthwesterly flow over Indochina and the SCS, and a frontal boundary over southern China (Lauet al., 1998, 2000; Wu and Zhang, 1998; Chan et al., 2000; Ding and Liu, 2001; Xu and Chan,2001; Liu et al., 2002).
Results for the independent 25-year SCS monsoon onset composite show a remarkably similarevolution to the 1998 onset. As the composite Kelvin wave enters the Indian Ocean on Day-14(Fig. 6a), the equatorial Indian Ocean and west Pacific are characterized by 850-hPa easterlyanomalies, as also illustrated in Fig. 5a for the 1998 case study. On Day −7 (Fig. 6b), MJOconvection is well-established over the Indian Ocean, and 850-hPa twin cyclonic gyres begin toform, similar to 12 May 1998 (Fig. 5b). By Day −2 (Fig. 6c), the twin cyclones have begun tomove poleward, with the stronger Northern Hemisphere cyclone linked to more intense convection,also similar to the evolution seen in the 1998 case study in Fig. 5. The association of a cycloniccirculation and deep convection over the Bay of Bengal with the onset of the SCS monsoonhas also been noted in many previous studies (Lau et al., 1998, 2000; Wu and Zhang, 1998;Chan et al., 2000; Ding and Liu, 2001; Xu and Chan, 2001; Liu et al., 2003). Simultaneouswith the northward movement of the cyclonic circulation in the Northern Hemisphere, eastward-moving convection exits the OLR envelope in the SCS (Fig. 6c). This convective envelope canbe clearly identified as a Kelvin wave as it propagates across the Pacific (Fig. 4a). On Day−2, equatorial westerlies extend eastward to approximately 110◦E, in the western SCS, and areprimarily associated with the strong cyclonic circulation anomaly in the Northern Hemisphere.By Day 0 (Fig. 6d), however, it is apparent that equatorial westerlies continue to move eastward(see also Fig. 4b), through the SCS and into the western Pacific, but are no longer linked tothe Northern Hemisphere cyclone. Instead, we postulate that near-equatorial eastward-movingconvective disturbances (Kelvin waves and the MJO) are responsible for the eastward progressionof monsoonal westerlies in this region, and therefore the onset of the SCS monsoon on Day 0.An examination of the individual sequences of SCS monsoon onset comprising the 26-year studyperiod reveals that the majority (16 cases, or 62%) unambiguously involve an MJO, of which12 include a Kelvin wave propagating into the Indian Ocean from the Atlantic prior to MJOdevelopment; 20 cases (77%) involve a Bay of Bengal cyclone; 18 cases (69%) include evidenceof a midlatitude frontal boundary; and 13 (50%) contain a Kelvin wave that emanates from theMJO and propagates across the Pacific.
From Day −14 (Fig. 6a) to Day −2 (Fig. 6c), an anticyclonic circulation anomaly ispresent along the east coast of China, representing a strong and anomalously westward-locatedPacific subtropical high. By Day 0 (Fig. 6d), a cyclonic anomaly has begun to form, sug-gesting the intrusion of a midlatitude trough and a weakening of the subtropical high. Note,

K.H. Straub et al. / Dynamics of Atmospheres and Oceans 42 (2006) 216–238 227
Fig. 6. Anomalous OLR (shading) and 850-hPa streamunction (contours, solid positive, by 7.5 × 10⁵ m2 s−1, zero contouromitted) and wind vectors (longest vectors 5 m s−1) on (a) Day −14; (b) Day −7; (c) Day −2; (d) Day 0; and (e) Day+3 for the composite SCS monsoon onset. The letters C and A mark the centers of cyclonic and anticyclonic circulationanomalies, respectively.
however, that the westerly anomalies representing monsoon onset in the SCS on Day 0 arenot linked to this extratropical feature. By Day +3 (Fig. 6e), the extratropical cyclone hasstrengthened and westerlies are present in the northern SCS as well, such that westerliesare present over the entire SCS and full onset of the SCS monsoon has occurred. A south-west to northeast-oriented frontal boundary is visible in the composite OLR at this stageas well, stretching northeastward from the northern Philippines. This evolution suggests thatthe MJO–Kelvin wave complex as well as the intrusion of a midlatitude trough may playan important role in the full SCS monsoon onset. An examination of the potential causalrelationships between tropical waves and the extratropics over eastern Asia during monsoononset are beyond the scope of this study, but would appear to be a fruitful area for furtherresearch.

228 K.H. Straub et al. / Dynamics of Atmospheres and Oceans 42 (2006) 216–238
Fig. 7. Sounding sites during the SCSMEX 47-day IOP. Frequency of observations during this period is indicated byfilling in of circles, where a completely filled circle denotes 188 sonde observations (i.e., 4 sondes/day for 47 days). The (*)symbol indicates where JMA/GAME reanalysis values are used to supplement the sounding data. The triangle representsthe array of sites referred to in the text as the Coastal Borneo Array (CBA).
3.4. Detailed observational structure of the 1998 SCS Kelvin wave
The results presented thus far suggest that equatorial waves play an important role in the SCSmonsoon onset process. In particular, the Kelvin wave emanating from the MJO envelope appearsto be a potential trigger for monsoon onset in the southern SCS, as revealed in Figs. 1 and 3afor the 1998 case study, as well as Fig. 4a and b for the composite analysis. In this section,we present an analysis of the dynamical and thermodynamical fields associated with the Kelvinwave that passed through the SCSMEX domain on 15 May 1998, to assess its structure withinthe context of the 1998 SCS monsoon onset. The data utilized in this section are extracted fromthe Colorado State University SCSMEX gridded analyses (see Section 2 for additional details),which are based primarily on rawinsonde data collected at the locations illustrated in Fig. 7. Forthe analysis presented in this section, data are averaged over the Coastal Borneo Array (CBA; seeFig. 7). The vertices of the CBA array represent sounding sites at Kuching, Brunei, Borneo, andR/V Kexue #1, each of which contains six-hourly data throughout the period of interest.4 TheCBA average was chosen to optimize the use of rawinsonde sites with good data coverage close
4 Data from sites outside the CBA and along its perimeter also contributed to the CBA averages, including two gridpointsextracted from JMA reanalysis data (see (*) symbols in Fig. 7). The results presented in this section are nearly identicalif the JMA data are removed from the dataset.
K.H. Straub et al. / Dynamics of Atmospheres and Oceans 42 (2006) 216–238 229
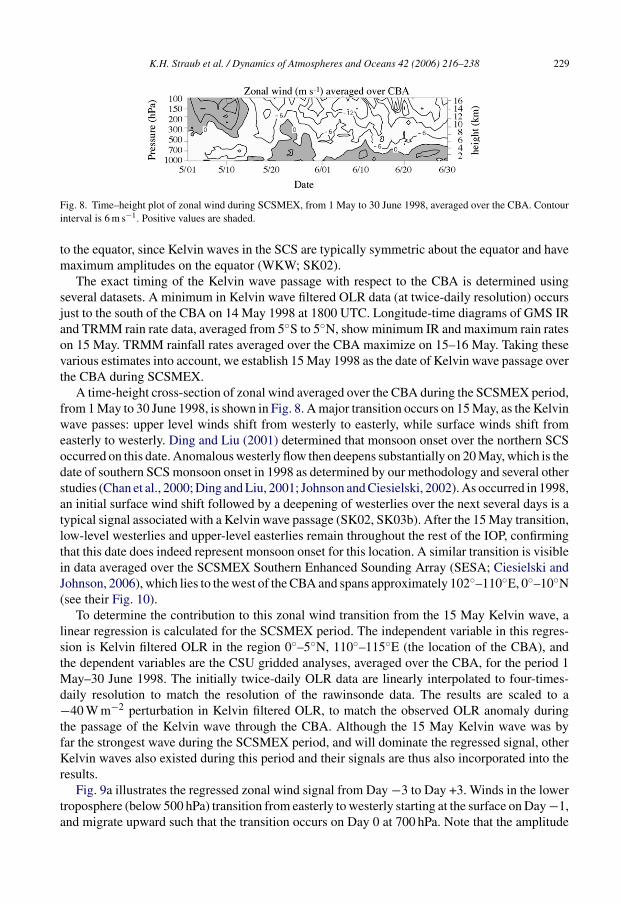
Fig. 8. Time–height plot of zonal wind during SCSMEX, from 1 May to 30 June 1998, averaged over the CBA. Contourinterval is 6 m s−1. Positive values are shaded.
to the equator, since Kelvin waves in the SCS are typically symmetric about the equator and havemaximum amplitudes on the equator (WKW; SK02).
The exact timing of the Kelvin wave passage with respect to the CBA is determined usingseveral datasets. A minimum in Kelvin wave filtered OLR data (at twice-daily resolution) occursjust to the south of the CBA on 14 May 1998 at 1800 UTC. Longitude-time diagrams of GMS IRand TRMM rain rate data, averaged from 5◦S to 5◦N, show minimum IR and maximum rain rateson 15 May. TRMM rainfall rates averaged over the CBA maximize on 15–16 May. Taking thesevarious estimates into account, we establish 15 May 1998 as the date of Kelvin wave passage overthe CBA during SCSMEX.
A time-height cross-section of zonal wind averaged over the CBA during the SCSMEX period,from 1 May to 30 June 1998, is shown in Fig. 8. A major transition occurs on 15 May, as the Kelvinwave passes: upper level winds shift from westerly to easterly, while surface winds shift fromeasterly to westerly. Ding and Liu (2001) determined that monsoon onset over the northern SCSoccurred on this date. Anomalous westerly flow then deepens substantially on 20 May, which is thedate of southern SCS monsoon onset in 1998 as determined by our methodology and several otherstudies (Chan et al., 2000; Ding and Liu, 2001; Johnson and Ciesielski, 2002). As occurred in 1998,an initial surface wind shift followed by a deepening of westerlies over the next several days is atypical signal associated with a Kelvin wave passage (SK02, SK03b). After the 15 May transition,low-level westerlies and upper-level easterlies remain throughout the rest of the IOP, confirmingthat this date does indeed represent monsoon onset for this location. A similar transition is visiblein data averaged over the SCSMEX Southern Enhanced Sounding Array (SESA; Ciesielski andJohnson, 2006), which lies to the west of the CBA and spans approximately 102◦–110◦E, 0◦–10◦N(see their Fig. 10).
To determine the contribution to this zonal wind transition from the 15 May Kelvin wave, alinear regression is calculated for the SCSMEX period. The independent variable in this regres-sion is Kelvin filtered OLR in the region 0◦–5◦N, 110◦–115◦E (the location of the CBA), andthe dependent variables are the CSU gridded analyses, averaged over the CBA, for the period 1May–30 June 1998. The initially twice-daily OLR data are linearly interpolated to four-times-daily resolution to match the resolution of the rawinsonde data. The results are scaled to a−40 W m−2 perturbation in Kelvin filtered OLR, to match the observed OLR anomaly duringthe passage of the Kelvin wave through the CBA. Although the 15 May Kelvin wave was byfar the strongest wave during the SCSMEX period, and will dominate the regressed signal, otherKelvin waves also existed during this period and their signals are thus also incorporated into theresults.
Fig. 9a illustrates the regressed zonal wind signal from Day −3 to Day +3. Winds in the lowertroposphere (below 500 hPa) transition from easterly to westerly starting at the surface on Day −1,and migrate upward such that the transition occurs on Day 0 at 700 hPa. Note that the amplitude

230 K.H. Straub et al. / Dynamics of Atmospheres and Oceans 42 (2006) 216–238
Fig. 9. Lag–pressure plots of regressed (a) zonal wind (contour interval 1.0 m s−1), (b) specific humidity (interval0.25 g kg−1), (c) vertical motion (interval 0.5 mb hr−1), (d) temperature (interval 0.25 K), (e) Q1 (interval 0.5 K day−1),(f) Q2 (interval 0.5 K day−1). Solid (dashed) contours and dark (light) shading represent positive (negative) values; zerocontour is omitted. Specific humidity and Q1 are smoothed three times in time and pressure with a 1-2-1 filter; Q2 issmoothed six times. Note that pressure scale varies between panels.
of the regressed wind shift is 4 m s−1 below 500 hPa (from −2 to +2 m s−1), while the amplitudeof the wind shift in the CBA time series in Fig. 8 is approximately 6 m s−1 in the lowest levels.This close comparison suggests that a large portion of the wind shift on 15 May 1998 can beattributed to the passage of the Kelvin wave.
Above 500 hPa, the zonal wind transition is opposite in sign, such that westerlies give way toeasterlies. The largest amplitude anomalies occur at 100 hPa, the level of the tropopause. Down-ward moving easterly wind anomalies are visible in the stratosphere, which are interpreted asthe free (uncoupled to convection, or dry) Kelvin wave response to an eastward-moving tropo-

K.H. Straub et al. / Dynamics of Atmospheres and Oceans 42 (2006) 216–238 231
spheric heat source, as discussed by WKW. Both the tropospheric and stratospheric zonal windsignals illustrated in Fig. 9a are very similar to those presented in previous studies (WKW; SK02;SK03b).
The cloudiness signal in an equatorial Kelvin wave has been shown to evolve in an east towest direction from primarily shallow convection to deep convection to a stratiform-dominatedregime (SK02; Kiladis et al., 2005). The specific humidity field for the SCSMEX Kelvin wave(Fig. 9b) is consistent with this and with the evolution of moisture in previous studies of Kelvinwaves (SK02). Anomalously moist air appears first at the surface on Day −3, and expands slowlyupward until Day −1, suggesting the presence of slowly deepening shallow convection. Themoisture anomaly expands upward more rapidly beginning on Day −1, such that on Day 0, whenthe OLR anomaly is a minimum, the entire troposphere is moist, as expected with the presence ofdeep convection. Shortly thereafter, between Day 0 and Day +1, a dry anomaly develops near thesurface. This signature is consistent with the presence of stratiform-dominated systems followingthe deep convective maximum (Zipser, 1977).
The vertical motion field (Fig. 9c) is also consistent with this interpretation, as upward motionfirst appears on Day −1.5 at the surface, and expands upward rapidly within the next 24 h. Themaximum upward vertical motion occurs in the upper troposphere, just below 300 hPa, on Day0, a signal consistent with deep convection. After Day 0, upward motion remains in the uppertroposphere, while downward motion appears in the lower troposphere, again suggesting thepresence of stratiform-dominated systems.
The temperature field (Fig. 9d) also shows results consistent with previous Kelvin wave studies(WKW; SK02; SK03b), with a warm lower troposphere prior to deep convection and a cold lowertroposphere during and afterward. Thus, the lowest levels of the atmosphere are both warm andmoist prior to the convective signal, suggesting an increase in CAPE. Warm anomalies in theupper troposphere maximize prior to and during the deepest convection, at 250 hPa. Between Day−1 and Day 0, upward motion is positively correlated with positive temperature anomalies inthe upper troposphere, implying a conversion from available potential energy into kinetic energy,as also seen previous studies of Kelvin and other equatorial waves (e.g., SK03b). Temperatureand zonal wind anomalies in the stratosphere are in quadrature, as expected for a theoretical dryKelvin wave (e.g., Emanuel et al., 1994).
The apparent heat source, or Q1 (see Ciesielski and Johnson, 2006) field (Fig. 9e) shows thatconvective heating reflects some of the vertical tilting seen in the vertical motion field (Fig. 9c), asexpected. A vertical mode decomposition as in Fulton and Schubert (1985) shows that the secondmode Q1 field associated with stratiform precipitation (heating over cooling) maximizes 6 h afterthe first mode heating associated with deep convection on Day 0 (not shown). This is consistentwith results obtained for 2-day inertio-gravity waves by Haertel and Kiladis (2004), which movewestward at about the same phase speed (16 m s−1) but are somewhat smaller in spatial scale.Thus, the progression from first mode (deep convection) to second mode (stratiform) heatingobserved in the SCSMEX Kelvin wave is consistent with previous studies where deep convectiveheating typically leads stratiform heating by several hours to days, depending on the scale of thedisturbance (e.g., Haertel and Kiladis, 2004; Kiladis et al., 2005). This is manifested in Fig. 9e byan upward tilting over time in the Q1 field, with heating over cooling dominant in the latter partof Day 0.
The apparent moisture sink, or Q2, field (Fig. 9f) shows low-level drying from Day −1 toDay +2.5, coincident with the decrease in lower tropospheric specific humidity (Fig. 9b). Dryingoccurs in the upper troposphere from Day −0.5 to Day +1, when deep convection and stratiformprecipitation are most active.

232 K.H. Straub et al. / Dynamics of Atmospheres and Oceans 42 (2006) 216–238
3.5. The influence of the May 1998 MJO–Kelvin wave complex on the demise of the1997–1998 El Nino event
As shown in Fig. 2, the El Nino event of 1997–1998 ended abruptly during May 1998. SSTin the central and eastern equatorial Pacific plummeted by more than 8 ◦C in some locations(McPhaden, 1999; T99; Kiladis and Straub, 2003). In several previous studies, the conditionsleading to the demise of the 1997–1998 El Nino have been attributed to the effects of oceanicwaves within the Pacific (e.g., McPhaden, 1999; Picaut et al., 2002; Boulanger et al., 2004;Vecchi and Harrison, 2003, 2006). For example, McPhaden and Yu (1999) cite evidence thatupwelling Rossby waves are responsible for the shoaling of the east Pacific thermocline at theend of the 1997–1998 warm event. Harrison and Vecchi (1999), An and Wang (2001), and Vecchiand Harrison (2003, 2006) provide observational and modeling evidence that the shoaling of theeast Pacific thermocline during early 1998 and 2003 can be explained by a shift in equatorialsurface westerly wind anomalies from the equator to around 5◦S during the beginning of theyear following an El Nino event, which creates the necessary background state for the return ofcold SSTs once the trade winds become reestablished over that region. While these mechanismsprovide plausible explanations for the slow evolution of the equatorial thermocline late in warmevents, they do not specifically address the sudden return of the trade winds frequently observedat the end of these episodes, as was observed during May 1998.
An explanation for the abrupt termination of the 1997–1998 El Nino is offered in a provocativestudy by T99, which examines the evolution of the zonal wind stress across the Pacific during May1998 and specifically addresses the very rapid cooling of SST. T99 hypothesize that the increasein surface easterly flow associated with the May 1998 MJO event led to the abrupt surfacing ofthe already very shallow thermocline. Alternatively, Vecchi (2006) argues that the strengtheningof convection north of the equator in response to the seasonal cycle is responsible for the return ofstrong trade winds and the sudden shoaling of the equatorial Pacific thermocline in 1998. In thissection, we revisit Pacific oceanic evolution in the context of the 1998 Kelvin wave–MJO–Kelvinwave sequence presented in this paper.
During early May 1998, the thermal structure in the equatorial Pacific Ocean featured a lens ofanomalously cold subsurface water trending downward to the west from depths of less than 100 mnear 110◦W to greater than 200 m near 160◦E (Kutsuwada and McPhaden, 2002). Returning toFig. 3a, note that equatorial easterly anomalies are observed near 110◦W beginning on 10 May.Fig. 10a, a longitude-time diagram of TAO SST anomalies averaged from 5◦S to 5◦N, illustratesthe rapid cooling of surface ocean temperatures at 110◦W that follows. At the same time, MJOconvection in the Indian Ocean has reached its maximum longitudinal extent, stretching from 60◦to 120◦E (Fig. 1).
A strong link between MJO convection in the Indian Ocean and the onset of easterly anomaliesin the Pacific has been discussed in detail by Madden (1988) and many others (see references inKiladis et al., 2005). This signal can be generally interpreted as a forced Rossby-Kelvin responseto convective heating (e.g., Hendon and Salby, 1994; T99; Matthews et al., 2004). The statis-tical relationship between MJO convection and zonal wind anomalies can be assessed using alinear regression analysis based on MJO-filtered OLR anomalies. The regression methodologyis described in Section 2. The independent variable in the regression is OLR filtered to MJOwavenumbers and frequencies, averaged over the 10◦ × 10◦ box from 5◦S to 5◦N, 75◦ to 85◦E.The dependent variables are OLR and ECMWF winds for the years 1979–1993. The locationof the box was chosen to correspond to the region of minimum MJO-filtered OLR anomalies inthe 1998 case study. The regression is calculated for the months of April, May, and June (AMJ),

K.H. Straub et al. / Dynamics of Atmospheres and Oceans 42 (2006) 216–238 233
Fig. 10. Longitude–time diagram of anomalous TAO (a) SST (K) and (b) surface zonal wind (m s−1), averaged from 5◦Sto 5◦N, from 170◦W to 90◦W, for 15 April–9 June 1998. Anomalies are calculated by removing the period average aswell as the average daily cycle. Solid line represents path of Pacific Kelvin wave in Fig. 1.
during the period when SCS monsoon onset typically occurs. Day 0 is defined as the day when theOLR anomaly in the 10◦ × 10◦ box is a minimum; regressed values are scaled to a −40 W m−2
anomaly in filtered OLR on Day 0. Results are not sensitive to the exact choice of box location,since the MJO is a large scale, low frequency oscillation whose signal dominates subseasonalvariability in planetary-scale circulation and OLR.
Fig. 11 illustrates a longitude-lag diagram of regressed OLR and 850-hPa zonal winds, averagedfrom 5◦S to 5◦N, based on the MJO-filtered OLR described above. On approximately Day −20,easterly anomalies begin to strengthen to the east of MJO convection (as represented by negativeOLR anomalies) in the Indian Ocean, maximizing near 80◦E. These easterly anomalies sustaintheir eastward propagation into the western and central Pacific even after the OLR anomaly haslargely dissipated. A local maximum in anomalous easterly winds appears near 160◦E aroundDay 0, and the envelope of easterly anomalies continues to move eastward such that it maximizesat 120◦W around Day +5, with a phase speed of approximately 20 m s−1, similar to that seen inthe composite zonal wind anomalies in Fig. 4b. Returning to the 1998 case study in Fig. 3a, notethat strong easterly anomalies are also seen near 160◦E while MJO convection is active in theIndian Ocean (approximately 7–18 May), and weaker easterly anomalies appear near 120◦E afew days later (approximately 10–23 May). We suggest here, as in T99, that these MJO-forcedeasterly zonal wind anomalies are responsible for the rapid cooling of SST along the equator.An observational study by Maloney and Kiehl (2002) also shows that SST in the eastern Pacifictypically cools when MJO easterlies are present (their MJO phases 2–4). They conclude thatoff-equatorial oceanic cooling is primarily due to latent heat fluxes, but on the equator, oceandynamics (i.e., upwelling) are responsible.
Interestingly, the impact of the Kelvin wave that moves eastward across the Pacific is also visiblein the TAO data. The solid lines in Fig. 10a and b represent the Kelvin wave OLR signal identifiedin Fig. 1. Note the rapid eastward propagation of a relatively cold region of SST immediatelyfollowing the Kelvin wave cloudiness signal. It is unlikely that this cooling can be explained

234 K.H. Straub et al. / Dynamics of Atmospheres and Oceans 42 (2006) 216–238
Fig. 11. Longitude–lag diagram of regressed OLR (contours, solid positive, by 15 W m−2; zero contour omitted) and850-hPa ECMWF zonal wind (shading, in m s−1), averaged from 5◦S to 5◦N, based on MJO-filtered OLR in the box5◦S–5◦N, 75◦–85◦E. Values are scaled to a −40 W m−2 anomaly in filtered OLR on Day 0.
by evaporation, upwelling, or mixing, since the surface wind anomalies (Fig. 10b) change fromeasterly to westerly with the passage of the wave, resulting in a decrease in the total wind speed(not shown). It seems more likely that a decrease in incoming shortwave radiation due to thecloudiness associated with the wave is responsible, as in the Tropical Eastern Pacific ProcessStudy (TEPPS) Kelvin wave case studied by SK02 (see their Fig. 9). The westerly anomaliesvisible in the TAO data coincident with and following the Kelvin wave OLR signal (Fig. 10b)are consistent with those seen in the SCSMEX data in Section 3.4, as well as previous studies(WKW; SK02; SK03b).
The evidence presented here supports the notion that the short-term behavior of SST overthe Pacific in May 1998 may have ultimately been due to the occurrence of an atmosphericKelvin wave initiated over South America, leading to an MJO in the Indian Ocean, whichin turn forced the trade wind field and led to the sudden demise of the 1997–1998 El Nino.While the ocean was certainly in a state conducive to the termination of this event at somepoint, our results indicate that the specific timing of SST behavior was closely tied to intrasea-sonal atmospheric events, which may have also been favored by the seasonal cycle (Vecchi,2006). This evolution provides a rather graphic example of the potential impact of stochasticforcing on the determination of the timing of an ENSO transition (Lau, 2005; Vecchi, 2006).Once the SST decreased to levels unable to support convection over the central and easternequatorial Pacific, the convective field was reestablished farther west in its more usual posi-tion, likely aided by the onset of the SCS monsoon, an event also timed closely to the seasonalcycle.
K.H. Straub et al. / Dynamics of Atmospheres and Oceans 42 (2006) 216–238 235
4. Summary and conclusions
The scenario described here provides a rather spectacular example of a multitude of scaleinteractions within the ocean-atmosphere system on intraseasonal time scales. Although the basicstate was certainly primed for these transitions, it appears that a chain of events during April–May1998 ultimately determined the timing of monsoon onset over the SCS, along with the suddendemise of the 1997–1998 El Nino. This chain of events began with a Kelvin wave, initiated as amesoscale convective complex over eastern Brazil, which then propagated across the Atlantic andAfrica into the western Indian Ocean. Once in the Indian Ocean, this disturbance appears to havehelped trigger a larger convective flare-up that resulted in an MJO, which then generated a lowertropospheric equatorial cyclone pair and accompanying westerly wind burst along the equator.Eventually, the northern cyclone moved northward into the Bay of Bengal, generating a tropicaldepression and spreading westerly anomalies across Indochina and the SCS. This occurred whileanother Kelvin wave emanated from the MJO convective envelope and propagated eastward intothe western Pacific, bringing along low latitude westerly flow in its wake. These combined flowanomalies set the stage for a large-scale transition resulting in monsoon onset over the SCS. Atthe same time, a trade surge over the central and eastern Pacific that is directly attributable to theMJO caused a rapid shoaling of cold subsurface water already in place and brought an abruptend to unusually strong El Nino conditions. Once the SST decreased to levels unable to supportconvection over the central and eastern equatorial Pacific, convection was reestablished fartherwest in its more usual position over the warm pool, likely aided by the onset of the SCS monsoon.Once again we emphasize that the basic state, in terms of ENSO phase and the seasonal cycle,were favorably configured for these abrupt transitions, and that the role of intraseasonal convectivedisturbances was to determine their precise timing.
There is ample evidence that intraseasonal disturbances are closely tied to Asian monsoon onsetin other years as well. The MJO is known to influence the timing of the Indian monsoon onset (e.g.,Webster, 1986; Chen et al., 1988; Flatau et al., 2001) and onset over the SCS (e.g., Lau et al., 1998,2000) in some years. More recently, Kelvin waves have been implicated in the timing of both “falseonsets” and real onsets over India (Flatau et al., 2001, 2003). In many of these cases it appears thatequatorial Kelvin waves are responsible for triggering the MJO-like disturbance near the equatorthat propagates northward to initiate the monsoon (Kiladis et al., 2004). The precise dynamicaland thermodynamical mechanisms through which the MJO interacts with Kelvin waves and otherconvectively coupled equatorial disturbances is still an open question (e.g., SK03a; Kiladis et al.,2005), although recent theoretical advances are beginning to address this problem (Majda andKlein, 2003; Moncrieff, 2004; Biello and Majda, 2006). In the present case, such interactions ledto further upscale changes to the oceanic basic state, evidently feeding back to alter the convectivefield of atmosphere through changes in surface fluxes due to SST anomalies.
The scenario described here is dramatic, although the 1998 case provides an unusually largeamplitude example. Such scale interactions between convectively coupled waves, the monsoonsystem, and the ocean are often more subtle in terms of observable parameters. Yet predictability ofthe ocean–atmosphere system is obviously heavily dependent on the ability of models to representsuch interactions. The case described here illustrates how intraseasonal equatorial disturbancescan affect the evolution of planetary-scale circulation changes in both the atmosphere and ocean,which may then ultimately project onto interannual and longer time scales. As another example,the MJO is known to force oceanic Kelvin wave activity that appears linked to the onset of El Nino(e.g., Lau and Chan, 1988; Kessler and McPhaden, 1995; McPhaden, 1999). One implication isthat coupled ocean–atmosphere forecast models must be able to simulate at least the MJO, and

236 K.H. Straub et al. / Dynamics of Atmospheres and Oceans 42 (2006) 216–238
most likely higher frequency disturbances, in order to produce the correct timing for the initiationand termination of large scale transitions such as the ASM and ENSO. To extend this idea further,it seems likely that coupled climate models must simulate a reasonable spectrum of intraseasonaltropical variability in both the atmosphere and ocean in order to generate reasonable variabilityon longer time scales. While the ability of atmospheric climate models to simulate the MJO andother convectively coupled waves has improved greatly over the past few years (e.g., Lin et al.,2006), cloud-resolving resolution may eventually be required to capture the true nature of thescale interactions between the MJO and the smaller scale disturbances making up its envelope.
Acknowledgments
We thank Patrick Haertel for valuable feedback concerning the vertical structure of the Kelvinwave over the Coastal Borneo Array, Feng Zhe for calculating the vertical mode decompositionof the heating field, and Paul Roundy for providing dynamic height plots. We also thank RichardJohnson, Brian Mapes, and two anonymous reviewers for insightful comments that greatly helpedimprove the arguments presented in this paper. The TAO project office of the Pacific MarineEnvironmental Laboratory of NOAA provided the TAO mooring data used in this study. PEC waspartially supported by NASA Grant #NNG04GA22G to Colorado State University.
References
An, S.-I., Wang, B., 2001. Mechanisms of locking of the El Nino and La Nina mature phases to boreal winter. J. Climate14, 2164–2176.
Biello, J.A., Majda, A.J., 2006. Modulating synoptic scale convective activity and boundary layer dissipation in the IPESDmodels of the Madden-Julian Oscillation. Dyn. Atmos. Oceans, this volume.
Boulanger, J.-P., Menkes, C., Lengaigne, M., 2004. Role of high- and low-frequency winds and wave reflection in theonset, growth and termination of the 1997–1998 El Nino. Climate Dyn. 22, 267–280.
Chan, J.C.L., Wang, Y., Xu, J., 2000. Dynamic and thermodynamic characteristics associated with the onset of the 1998South China Sea summer monsoon. J. Meteor. Soc. Jpn. 78, 367–380.
Chen, T.-C., Tzeng, R.-W., Yen, M., 1988. Development and life cycle of the Indian monsoon: effect of the 30–50 dayoscillation. Mon. Wea. Rev. 116, 2183–2199.
Ciesielski, P.E., Johnson, R.H., 2006. Contrasting characteristics of convection over the northern and southern SouthChina Sea during SCSMEX. Mon. Wea. Rev. 134, 1041–1062.
Ding, Y., Liu, Y., 2001. Onset and evolution of the summer monsoon over the South China Sea during SCSMEX fieldexperiment in 1998. J. Meteor. Soc. Jpn. 79, 255–276.
Dunkerton, T.J., Crum, F.X., 1995. Eastward propagating ∼2- to 15-day equatorial convection and its relation to thetropical intraseasonal oscillation. J. Geophys. Res. 100, 790, 25, 781–25.
Emanuel, K.A., Neelin, J.D., Bretherton, C.S., 1994. On large-scale circulations in convecting atmospheres. Q. J. R.Meteor. Soc. 120, 1111–1143.
Ferreira, R.N., Schubert, W.H., Hack, J.J., 1996. Dynamical aspects of twin tropical cyclones associated with the Madden-Julian Oscillation. J. Atmos. Sci. 53, 929–945.
Flatau, M.K., Flatau, P.J., Rudnick, D., 2001. The dynamics of double monsoon onsets. J. Climate 14, 4130–4146.Flatau, M.K., Flatau, P.J., Schmidt, J., Kiladis, G.N., 2003. Delayed onset of the 2002 Indian monsoon. Geophys. Res.
Lett. 30, 1768, doi:10.1029/2003GL017434.Fulton, S.R., Schubert, W.H., 1985. Vertical normal mode transforms: theory and application. Mon. Wea. Rev. 113,
647–658.Haertel, P.T., Kiladis, G.N., 2004. Dynamics of 2-day equatorial waves. J. Atmos. Sci. 61, 2707–2721.Harrison, D.E., Vecchi, G.A., 1999. On the termination of El Nino. Geophys. Res. Lett. 26, 1593–1596.Hendon, H.H., Liebmann, B., 1994. Organization of convection within the Madden-Julian Oscillation. J. Geophys. Res.
99, 8073–8083.Hendon, H.H., Salby, M.L., 1994. The life cycle of the Madden-Julian Oscillation. J. Atmos. Sci. 51, 2225–2237.

K.H. Straub et al. / Dynamics of Atmospheres and Oceans 42 (2006) 216–238 237
Hsu, H.-H., 2005. East Asian monsoon. In: Lau, W.K.-M., Waliser, D.E. (Eds.), Intraseasonal Variability in theAtmosphere-Ocean Climate System. Praxis Publishing, Chichester, UK, pp. 63–94.
Hsu, H.-H., Teng, C.-T., Chen, C.-T., 1999. Evolution of large-scale circulation and heating during the first transition ofAsian summer monsoon. J. Climate 12, 793–810.
Johnson, R.H., Ciesielski, P.E., 2002. Characteristics of the 1998 summer monsoon onset over the northern South ChinaSea. J. Meteor. Soc. Jpn. 80, 561–578.
Kessler, W.S., McPhaden, M.J., 1995. Oceanic equatorial waves and the 1991–93 El Nino. J. Climate 8, 1757–1774.
Kiladis, G.N., Flatau, M.K., Flatau, P.J., 2004. The role of intraseasonal wave activity in the onset and active-break phasesof the Indian monsoon. In: Proceedings of the 26th Conference on Hurricanes and Tropical Meteorology, AmericanMeteorological Society, Boston, MA, pp. 286–287.
Kiladis, G.N., Straub, K.H., 2003. Ocean-atmosphere interaction within equatorially trapped atmospheric waves. In:Proceedings of the 12th Conference on the Interaction of the Sea and Atmosphere, American Meteorological Society,Boston, MA.
Kiladis, G.N., Straub, K.H., Haertel, P.T., 2005. Zonal and vertical structure of the Madden-Julian Oscillation. J. Atmos.Sci. 62, 2790–2809.
Krishnamurti, T.N., Ardanuy, P., Ramanathan, Y., Pasch, R., 1981. On the onset vortex of the summer monsoon. Mon.Wea. Rev. 109, 344–363.
Kutsuwada, K., McPhaden, M., 2002. Intraseasonal variations in the upper equatorial Pacific Ocean prior to and duringthe 1997–98 El Nino. J. Phys. Oceanogr. 32, 1133–1149.
Lau, K.-M., 2005. El Nino southern oscillation connection. In: Lau, W.K.-M., Waliser, D.E. (Eds.), Intraseasonal Variabilityin the Atmosphere-Ocean Climate System. Praxis Publishing, Chichester, UK, pp. 271–306.
Lau, K.-M., Chan, P.H., 1988. Intraseasonal and interannual variations if tropical convection: a possible link between the40–50 day oscillation and ENSO? J. Atmos. Sci. 45, 506–521.
Lau, K.-M., Ding, Y., Wang, J.-T., Johnson, R., Keenan, T., Cifelli, R., Gerlach, J., Thiele, O., Rickenbach, T., Tsay,S.-C., Lin, P.-H., 2000. A report of the field operations and early results of the South China Sea Monsoon Experiment(SCSMEX). Bull. Am. Meteor. Soc. 81, 1261–1270.
Lau, K.-M., Wu, H.-T., 2001. Principal modes of rainfall-SST variability of the Asian summer monsoon: a reassessmentof the monsoon-ENSO relationship. J. Climate 14, 2880–2895.
Lau, K.-M., Wu, H.-T., Yang, S., 1998. Hydrologic processes associated with the first transition of the Asian summermonsoon: a pilot satellite study. Bull. Am. Meteor. Soc. 79, 1871–1882.
Liebmann, B., Smith, C.A., 1996. Description of a complete (interpolated) outgoing longwave radiation dataset. Bull.Am. Meteor. Soc. 77, 1275–1277.
Lin, J.-L., et al., 2006. Tropical intraseasonal variability in 14 IPCC AR4 climate models. Part I: Convective signals. J.Climate. 19, 2665–2690.
Liu, Y., Chan, J.C.L., Mao, J., Wu, G., 2002. The role of Bay of Bengal convection in the onset of the 1998 South ChinaSea summer monsoon. Mon. Wea. Rev. 130, 2731–2744.
Madden, R.A., 1988. Large intraseasonal variations in wind stress over the tropical Pacific. J. Geophys. Res. 93, 5333–5340.Madden, R.A., Julian, P.R., 1994. Observations of the 40–50-day tropical oscillation—a review. Mon. Wea. Rev. 122,
814–837.Majda, A.J., Klein, R., 2003. Systematic multi-scale models for the tropics. J. Atmos. Sci. 60, 393–408.Maloney, E.D., Kiehl, J.T., 2002. MJO-related SST variations over the tropical eastern Pacific during Northern Hemisphere
summer. J. Climate 15, 675–689.Mapes, B.E., Houze, R.A., 1993. Cloud clusters and superclusters over the oceanic warm pool. Mon. Wea. Rev. 121,
1398–1415.Matthews, A.J., 2000. Propagation mechanisms for the Madden-Julian Oscillation. Q. J. R. Meteor. Soc. 126, 2637–2652.Matthews, A.J., Hoskins, B.J., Masutani, M., 2004. The global response to tropical heating in the Madden-Julian Oscillation
during northern winter. Q. J. R. Meteor. Soc. 130, 1991–2012.McPhaden, M.J., 1999. Genesis and evolution of the 1997–98 El Nino. Science 283, 950–954.McPhaden, M.J., Yu, X., 1999. Equatorial waves and the 1997–98 El Nino. Geophys. Res. Lett. 26, 2961–2964.Milliff, R.F., Madden, R.A., 1996. The existence and vertical structure of fast, eastward-moving disturbances in the
equatorial troposphere. J. Atmos. Sci. 53, 586–597.Moncrieff, M., 2004. Analytic representation of the large-scale organization of tropical convection. J. Atmos. Sci. 61,
1521–1538.Nakazawa, T., 1988. Tropical super clusters within intraseasonal variations over the western Pacific. J. Meteor. Soc. Jpn.
66, 823–839.

238 K.H. Straub et al. / Dynamics of Atmospheres and Oceans 42 (2006) 216–238
Picaut, J., Hackert, E., Busalacchi, A.J., Murtugudde, R., Lagerloef, G.S.E., 2002. Mechanisms of the 1997–1998 ElNino-La Nina, as inferred from space-based observations. J. Geophys. Res. 107, doi:10.1029/2001JC000850.
Sobel, A.H., Bretherton, C.S., 1999. Development of synoptic-scale disturbances over the summertime tropical northwestPacific. J. Atmos. Sci. 56, 3106–3127.
Sperber, K.R., 2003. Propagation and the vertical structure of the Madden-Julian oscillation. Mon. Wea. Rev. 131,3018–3037.
Straub, K.H., Kiladis, G.N., 2002. Observations of a convectively coupled Kelvin wave in the eastern Pacific ITCZ. J.Atmos. Sci. 59, 30–53.
Straub, K.H., Kiladis, G.N., 2003a. Interactions between the boreal summer intraseasonal oscillation and higher-frequencytropical wave activity. Mon. Wea. Rev. 131, 945–960.
Straub, K.H., Kiladis, G.N., 2003b. The observed structure of convectively coupled Kelvin waves: Comparison withsimple models of coupled wave instability. J. Atmos. Sci. 60, 1655–1668.
Takayabu, Y.N., Iguchi, T., Kachi, M., Shibata, A., Kanzawa, H., 1999. Abrupt termination of the 1997–98 El Nino inresponse to a Madden-Julian oscillation. Nature 402, 279–282.
Tao, S.Y., Chen, L.X., 1987. A review of recent research on the east Asian summer monsoon in China. In: Chang, C.P.,Krishnamurti, T.N. (Eds.), Monsoon Meteorology. Oxford University Press, pp. 60–92.
Vecchi, G.A., Harrison, D.E., 2003. On the termination of the 2002–03 El Nino event. Geophys. Res. Lett. 30, 1964–1967,doi:10.1029/2003GL017564.
Vecchi, G.A., Harrison, D.E., 2006. The termination of the 1997–98 El Nino. Part I: Mechanisms of oceanic change. J.Climate. 19, 2633–2646.
Vecchi, G.A., 2006. The termination of the 1997–98 El Nino. Part II: Mechanisms of atmospheric change. J. Climate. 19,2647–2664.
Wang, B., Ho, Lin, Zhang, Y., Lu, M.-M., 2004. Definition of South China Sea monsoon onset and commencement of theEast Asia summer monsoon. J. Climate 17, 699–710.
Webster, P.J., 1986. The variable and interactive monsoon. In: Fein, J.S., Stephens, P.L. (Eds.), Monsoons. John Wileyand Sons, pp. 269–330.
Wheeler, M.C., Hendon, H.H., 2004. An all-season real-time multivariate MJO index: development of an index formonitoring and prediction. Mon. Wea. Rev. 132, 1917–1932.
Wheeler, M., Kiladis, G.N., 1999. Convectively coupled equatorial waves: analysis of clouds and temperature in thewavenumber-frequency domain. J. Atmos. Sci. 56, 374–399.
Wheeler, M., Kiladis, G.N., Webster, P.J., 2000. Large-scale dynamical fields associated with convectively coupledequatorial waves. J. Atmos. Sci. 57, 613–640.
Wu, G., Zhang, Y., 1998. Tibetan Plateau forcing and the timing of the monsoon onset over South Asia and the SouthChina Sea. Mon. Wea. Rev. 136, 913–927.
Xu, J., Chan, J.C.L., 2001. First transition of the Asian summer monsoon in 1998 and the effect of the Tibet-tropicalIndian Ocean thermal contrast. J. Meteor. Soc. Jpn. 79, 241–253.
Yang, G.-Y., Slingo, J., 2001. The diurnal cycle in the tropics. Mon. Wea. Rev. 129, 784–801.Yasunari, T., 1979. Cloudiness fluctuations associated with the Northern Hemisphere summer monsoon. J. Meteor. Soc.
Jpn. 57, 227–242.Zipser, E.J., 1977. Mesoscale and convective-scale downdrafts as distinct components of squall-line structure. Mon. Wea.
Rev. 105, 1568–1589.