the role of complexity and symbolization method in ...€¦ · the role of complexity and...
TRANSCRIPT
The Role of Complexity and Symbolization Method in Thematic Map Effectiveness
Alan M. MacEachren
Department of Geography, Virginia Polytechnic Institute and State University, Blacksburg, VA 24061
Abstract. Thematic map effectiveness can be defined only in terms of specific user require- ments. Consideration of common requirements results in four criteria by which map effective- ness is evaluated: effectiveness for direct acquisition of both specific and general information and for memory of both specific and general information. The influence of visual map complexity and two methods of symbolization (choropleth and shaded isopleth maps) on each aspect of complexity is evaluated. Though isopleth maps prove to be consistently less complex than choropleth maps, the only significant difference in effectiveness between the methods is for memory of general patterns, in which case isopleth maps are more effective. Map complexity is found to have two components that influence effectiveness in quite different ways. Complexity of a mapped distribution is inversely related to effectiveness of maps in communicating general patterns but has little relation to communication of specific details. The second aspect of com- plexity, the number of classes, is inversely related to communication of specific details but exhibits little relationship to communication of general patterns.
Key Words: thematic map effectiveness, visual complexity, choropleth, isopleth, direct acquisi- tion, memory.
HE effectiveness with which thematic T maps communicate spatial information has received considerable attention in the cartographic literature. Determination of map effectiveness has relevance for anyone using thematic maps to instruct students or illus- trate research results. For example, the choice of whether or not a map should be produced, and if so, what kind of map, is most appropriately made in relation to the map’s potential for effective communication of the necessary spatial concepts.
A variety of factors are likely to influence map effectiveness, including technical skills of the person constructing the map, materials and reproduction methods, amount of infor- mation presented, visual map complexity, methods of symbolization, the map percipi- ent’s understanding and perception of that symbolization, and physical and mental abilities of the percipient.’ Of these factors, two are of special interest here: complexity
and method of symbolization. Complexity is of interest because of its possible negative impact on effectiveness. Many researchers have argued for less complex maps to avoid confusing the map reader (Monmonier 1974). Though it is unlikely that the relationship between complexity and effectiveness is a simple linear one, it seems reasonable to hypothesize that some relationship does exist.
Symbolization is of interest because it can be most easily controlled by the map maker and is likely to produce the greatest change in the representation of data. Cartographic re- search directed toward symbolization has fo- cused on individual symbolization methods and attempts to refine them to improve map effectiveness. Such research has resulted in guidelines for the use of specific kinds of symbolization. When faced with the task of producing a graduated-circle map, for exam- ple, a map maker has an objective basis from
Annals of the Association of American Geographers, 72(4), 1982, pp. 495-513 0 Copyright 1982 by Association of American Geographers
495

496 MacEach ren
which to compare the relative merits of square-root scaling and perceptually ad- justed scaling. Little attention, however, has been given to comparing different kinds of symbolization. No objective criteria, there- fore, are available for evaluating the relative merits of alternative symbolization methods that may be appropriate for representing spe- cific data (e.g., a graduated-circle map versus a dot map for population data).
The goal of the present study is to examine the relationship between complexity and ef- fectiveness of two forms of symbolization, choropleth and shaded isopleth maps. These two forms of symbolization are selected be- cause a given set of data can often be repre- sented appropriately with either method, and previous research has demonstrated that isopleth maps are consistently less complex than choropleth maps (MacEachren 1982). This suggests that isopleth maps may prove to be more "effective," i f indeed there is an inverse relationship between complexity and effectiveness.
But just what is meant by the term effec- tiveness? Even cursory consideration reveals that effectiveness can be defined only in rela- tion to a given need. If a map is to be used for selecting or following routes, for example, effectiveness will be related to the success with which a map reader is able to distinguish between major and minor highways or the ease with which place names can be read. On the other hand, for the introductory geogra- phy student faced with the task of describing the relationship between temperature and vegetation, effectiveness may be defined as the ease with which patterns can be distin- guished and compared. How we define effec- tiveness, then, depends on the use of the map. A map judged effective in one case may prove of limited usefulness in another.
Maps can provide specific and general in- formation. These are not discrete categories but are two ends of a continuum along which all information contained in a map will fall. Map effectiveness, then, can be judged at various levels of generalization, and the effec- tiveness of any given map is likely to vary as the level of generalization required varies.
Beyond categorizing the kind of informa- tion that might be obtained from a map, we should also consider the subsequent use of information. Two categories are again evi-
dent: direct acquisition of information for immediate use, and storage in and retrieval from memory for some later use. Direct ac- quisition of information for immediate use is dependent upon interpretation and under- standing of the information presented. Stor- age and retrieval from memory also require interpretation and understanding of the in- formation. In addition, however, storage and retrieval are dependent upon organization of information and compatibility of that infor- mation with previously acquired knowledge.
These two categories of information use, combined with the categories of information, result in four criteria by which map effective- ness can be evaluated: effectiveness in direct acquisition of both specific and general in- formation and memory for both specific and general information. Although there is likely to be much variation among specific tasks or for different forms of symbolization, it should be possible to form some generalizations that will hold for each of these four categories of effectiveness.
Previous Study of Map Effectiveness
Previous research dealing with map effec- tiveness has concentrated almost exclusively on direct acquisition of information. Topics considered include value estimation (Flan- nery 1971; Crawford 1973; Kimerling 1975), pattern comparison (i.e., estimation of simi- larity) (McCarty and Salisbury 1961; Olson 1970; Muehrcke 1973; Lloyd and Steinke 1976), and pattern identification (i.e., identifi- cation of regions) (Jenks 1973; Dobson 1977; McCleary 1975). Various methods have been developed for evaluating the ability of per- cipients to perform these tasks. The choice of method is related to the nature of the sym- bolization and to whether specific or general information is of interest.
Those studies dealing with acquisition of specific information have concentrated on value estimation. Methodologies for evaluat- ing the accuracy with which values can be estimated can be divided into those using di- rect and those using indirect scaling. The latter involves having subjects perform some task such as partitioning, as used by Kimer- ling (1975) for gray tones. Direct scaling, as its name implies, is a simpler and more direct
Thematic Map Effectiveness 497
method for evaluating acquisition of specific details. In this method subjects are simply asked to estimate the magnitude of a partic- ular stimulus. Gray tones (Stevens and Gal- anter 1957) and graduated circles (Flannery 1971) are among the symbols evaluated using this approach.
Greater variation exists among methods for examining direct acquisition of general pat- terns than among methods dealing with spe- cific details. Most studies, however, have employed either pattern comparison or pat- tern identification as the measure of effec- tiveness.
McCarty and Salisbury (1961), in an early attempt to evaluate thematic map effective- ness, examined subjects’ abilities to compare the pattern of isopleth map pairs by asking them to estimate the coefficient of correla- tion, r, between distributions. Olson (1970) questioned the usefulness of asking subjects to estimate r, because this approach assumes that the maps have been designed to reflect it. She demonstrated the advantages, over this procedure, of a forced-choice test in which subjects were asked to determine which one of a pair of maps was more like a third.
Muehrcke (1973) extended the use of map comparison tasks to the evaluation of alter- native methods of symbolization. He com- pared the effectiveness of dot, choropleth, isarithmic, shaded isarithmic, and profile maps in communicating the degree of simi- larity between mapped distributions.
Pattern identification is the focus of the second approach to measuring the effective- ness of maps in communicating general pat- tern information. The extent to which patterns can be identified has been evaluated on the basis of subjects’ abilities to outline regions. This method has been applied to both choropleth and dot maps (Jenks 1973; McCleary 1975; Muller 1979). Owing to the great diversity in size and shape of regions visualized, however, it has proved difficult to interpret results of such regionalization tasks (Jenks 1973).
In spite of the volume of work concerned with direct acquisition of map information, the matter of incorporating the conceptual image of the map into memory has been largely ignored. Steinke (1979), in one of the few studies of this aspect of map effective- ness, examined the effectiveness of gradu-
ated-circle maps in facilitating the stor- age and retrieval from memory of the pattern of the distribution.
Two approaches exist by which effective- ness for storage and retrieval of map infor- mation can be measured. Subjects can be presented with a task requiring the use of in- formation that appeared on the map (with the map no longer present) or they can simply be asked to reconstruct the map from memory. Steinke (1979) chose the latter approach and examined the relationship between visual- search patterns and the ability of respondents to reconstruct graduated-circle maps from memory. Results indicate that communica- tion was most effective when fixation times on map locations were short and when a large proportion of the fixations were on the body of the map. It was also shown that a reduction in peripheral information (i.e., title, legend, scale, north arrow, and neat line) resulted in better reproduction of the original map pat- tern, apparently because the proportion of the total fixation time spent on’the map body was increased.
Research Framework
In previous research all but one study (Muehrcke 1969) has been restricted to the analysis of a single form of symbolization. The attempt to improve the communication effectiveness of various forms of map sym- bolization is a worthwhile endeavor, but it seems that a determination of the relative ef- fectiveness of the various forms of symboli- zation currently used should also be given attention. After all, one of the first decisions that must be made by the map maker (after the decision that a map is needed) is the form of symbolization to employ. Before we can effectively use the knowledge that removing the scale and neat line from a graduated- circle map improved its effectiveness in communicating general patterns (Steinke 1979), we need to know under what cir- cumstances, if any, a graduated-circle map is more effective than a dot map. Intuitively it seems that a difference in effectiveness is more likely to exist between two maps using different forms of symbolization than two maps differing only in characteristics such as the form of legend or the data classification procedure used.

498 MacEachren
The purpose of the present study, there- fore, is to examine the relative effectiveness of choropleth and isopleth maps and how this effectiveness is influenced by visual com- plexity. The four aspects of effectiveness identified (i.e., direct acquisition and memory of both specific and general information) will be considered. Before specific hypotheses are presented, the concepts of complexity and memory as they apply to cartography and to this study must be delineated.
Map complexity has been defined in a number of ways (Brophy 1980; MacEachren 1982). In this project, complexity is consid- ered to be related to the structure and organi- zation of map elements as judged by percipi- ents, rather than to the ease of understanding map content. As such, it is a visual attribute of each map, specifically defined here as the degree to which the combination of map ele- ments results in a pattern that appears com- plicated or involved.
Memory is recognized by psychologists as being composed of two broad categories: recognition and recall. Recognition memory is simply the ability of a subject to recognize a stimulus previously encountered, whereas recall involves retrieving information from memory about a stimulus when it is no longer present. Because the latter kind of memory is probably more important in thematic map use, a recall test will be used as the measure of effectiveness in the present study.2
I
COMPLEXITY
Figure 1. Hypothesized communication effec- tiveness-complexity relationship.
accuracy with which predetermined map in- formation is communicated to a percipient.
(2) lsopleth maps are a more effective means of communicating conceptions of spatial distribution than are choro- pleth maps.
Below a critical level of complexity, there should be no difference in effectiveness be- tween choropleth and isopleth maps. Beyond this level, however, choropleth maps, being more complex than corresponding isopleth maps, should be less effective until a maximum level of visual complexity is reached (Figure 2).
Hypotheses
Two related hypotheses are examined. One concerns the relationship between map com- plexity and communication effectiveness and the other the relationship between choropleth and isopleth map effectiveness. They are:
(1) Communication effectiveness remains constant with increasing complexity to a critical level at which complexity be- gins to interfere with effectiveness. Be- yond this level, effectiveness decreases as complexity increases (Figure 1).
The level at which complexity begins to interfere with effectiveness should vary with the level of generalization represented by the information to be communicated (e.g., den- sity in a specific county versus regional pat- terns). Effectiveness will be measured as the
I
COMPLEXITY
Figure 2. Hypothesized relationship of choropleth to isopleth map effectiveness.
Thematic Map Effectiveness 499
Selection of Test Maps
Examination of the first hypothesis requires that maps tested represent a sufficient range of complexity, and testing of the second hy- pothesis requires pairs of choropleth and shaded isopleth maps of the same distribu- tion. Two factors that have been shown to be components of visual map complexity (MacEachren 1982) were taken into account in selecting map pairs: the distribution mapped and the number of classes into which data are divided. Two sets of map pairs represent- ing a range for each of these aspects of complexity were created, one in which the number of classes was held constant while the distribution varied and the other in which the number of classes for a single distribution was varied.
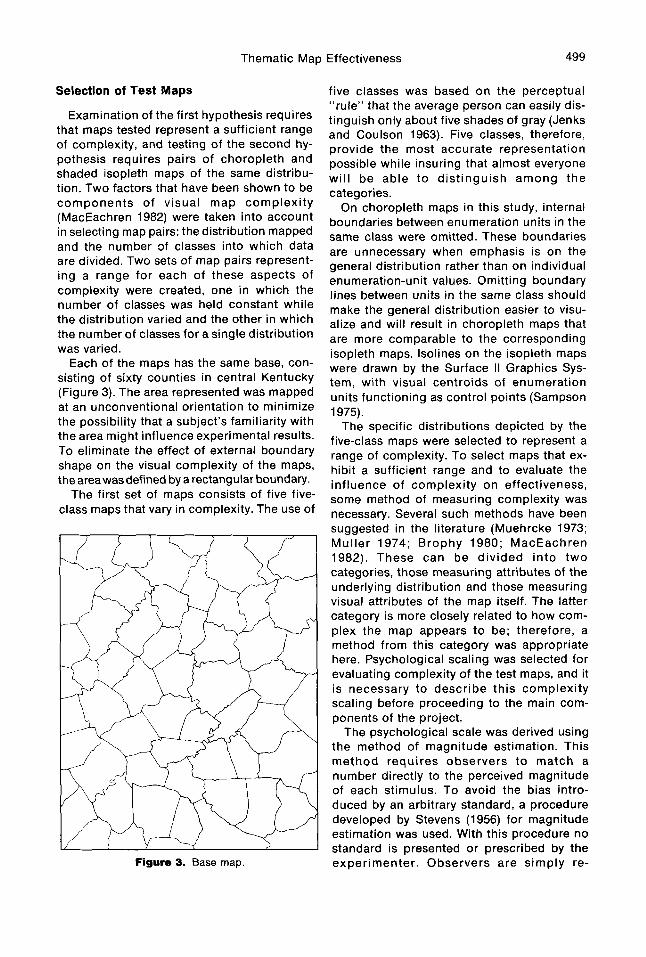
Each of the maps has the same base, con- sisting of sixty counties in central Kentucky (Figure 3). The area represented was mapped at an unconventional orientation to minimize the possibility that a subject’s familiarity with the area might influence experimental results. To eliminate the effect of external boundary shape on the visual complexity of the maps, the areawas defined by a rectangular boundary.
The first set of maps consists of five five- class maps that vary in complexity. The use of
Figure 3. Base map.
five classes was based on the perceptual “rule” that the average person can easily dis- tinguish only about five shades of gray (Jenks and Coulson 1963). Five classes, therefore, provide the most accurate representation possible while insuring that almost everyone wil l be able to distinguish among the categories.
On choropleth maps in this study, internal boundaries between enumeration units in the same class were omitted. These boundaries are unnecessary when emphasis is on the general distribution rather than on individual enumeration-unit values. Omitting boundary lines between units in the same class should make the general distribution easier to visu- alize and will result in choropleth maps that are more comparable to the corresponding isopleth maps. lsolines on the isopleth maps were drawn by the Surface II Graphics Sys- tem, with visual centroids of enumeration units functioning as control points (Sampson 1975).
The specific distributions depicted by the five-class maps were selected to represent a range of complexity. To select maps that ex- hibit a sufficient range and to evaluate the influence of complexity on effectiveness, some method of measuring complexity was necessary. Several such methods have been suggested in the literature (Muehrcke 1973; Muller 1974; Brophy 1980; MacEachren 1982). These can be divided into two categories, those measuring attributes of the underlying distribution and those measuring visual attributes of the map itself. The latter category is more closely related to how com- plex the map appears to be; therefore, a method from this category was appropriate here. Psychological scaling was selected for evaluating complexity of the test maps, and it i s necessary to describe this complexity scaling before proceeding to the main com- ponents of the project.
The psychological scale was derived using the method of magnitude estimation. This method requires observers to match a number directly to the perceived magnitude of each stimulus. To avoid the bias intro- duced by an arbitrary standard, a procedure developed by Stevens (1956) for magnitude estimation was used. With this procedure no standard is presented or prescribed by the experimenter. Observers are simply re-
500 MacEachren
quested to select the number that they find appropriate for the first and every subsequent st i m u I us.
In order to develop an accurate psycho- logical scale, a range of stimuli must be presented to the subjects. Fifteen pairs of choropleth and isopleth maps were used to establish the scale. Stevens (1956) recom- mends that each stimulus be presented twice and suggests that ten observers usually yield stable results. Twenty-one subjects were pre- sented with a packet of maps containing two copies of the 30 test maps arranged in ran- dom order. Subjects were asked to assign values to represent the visual complexity of each map, complexity being defined as how intricate or involved the pattern appeared to be.3
The subjective complexity scale was created by standardizing the raw data and calculating the central tendency of the values for each map. Because the method of value estimation can result in extreme values, either the geometric mean or the median should be used as a measure of central tendency. Ac- cording to both Engen (1972) and Stevens (1975), distributions of subjective judgments are usually log-normal (i.e., the logarithms of the values form a normal distribution), with the geometric mean the most appropriate measure of central tendency; hence this mea- sure was used here.
Owing to the nature of the method of ob-
taining complexity estimates, a somewhat ar- tificial source of variance resulted: the varia- tion in the range of numbers that might be used by different individuals. This source of variance was eliminated and the geometric means calculated through the application of a procedure outlined by Engen (1972).
The standardized geometric means of com- plexity judgments range from 4.30 to 9.48. For each map pair the choropleth map repre- senting the distribution was judged to be more complex than the corresponding iso- pleth map.
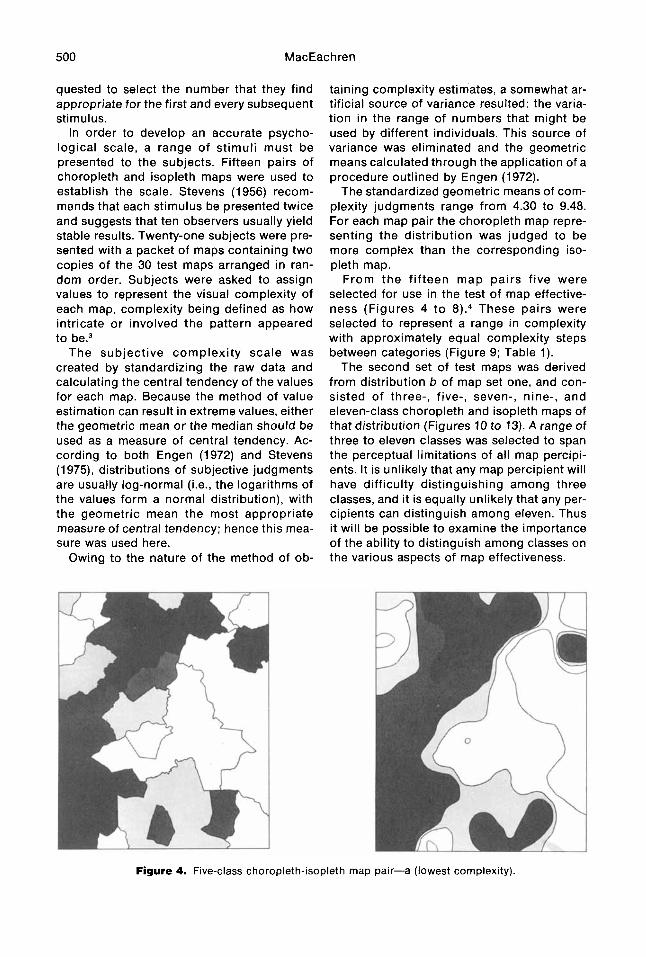
From the fifteen map pairs five were selected for use in the test of map effective- ness (Figures 4 to 8).4 These pairs were selected to represent a range in complexity with approximately equal complexity steps between categories (Figure 9; Table 1).
The second set of test maps was derived from distribution b of map set one, and con- sisted of three-, five-, seven-, nine-, and eleven-class choropleth and isopleth maps of that distribution (Figures 10 to 13). A range of three to eleven classes was selected to span the perceptual limitations of all map percipi- ents. It is unlikely that any map percipient will have difficulty distinguishing among three classes, and it is equally unlikely that any per- cipients can distinguish among eleven. Thus it will be possible to examine the importance of the ability to distinguish among classes on the various aspects of map effectiveness.
Figure 4. Five-class choropleth-isopleth map pair-a (lowest complexity).

Thematic Map Effectiveness 501
Figure 5. Five-class choropleth-isopleth map pair-b.
Measurement of Effectiveness
A three-step process was used to evaluate various aspects of map effectiveness. The process involved a set of map-learning tasks and two groups of effectiveness tasks: recall of general and specific information followed by direct acquisition of the same information (Figure 14). The process began with learning tasks designed to familiarize the respondent with the characteristics of the map. When the learning tasks had been completed, the map
was removed from view. The second step con- sisted of two tasks in which respondents were required to recall from memory both specific details and general characteristics of the map. In step three a map that was identical to the one used in the learning tasks was pre- sented to each respondent. The tasks related to specific details and general patterns were then repeated while the map was present.
The learning tasks were designed to direct the respondent's attention to the general characteristics of the map pattern so that in-
Figure 6. Five-class choropleth-isopleth map pair-c.
502 MacEachren
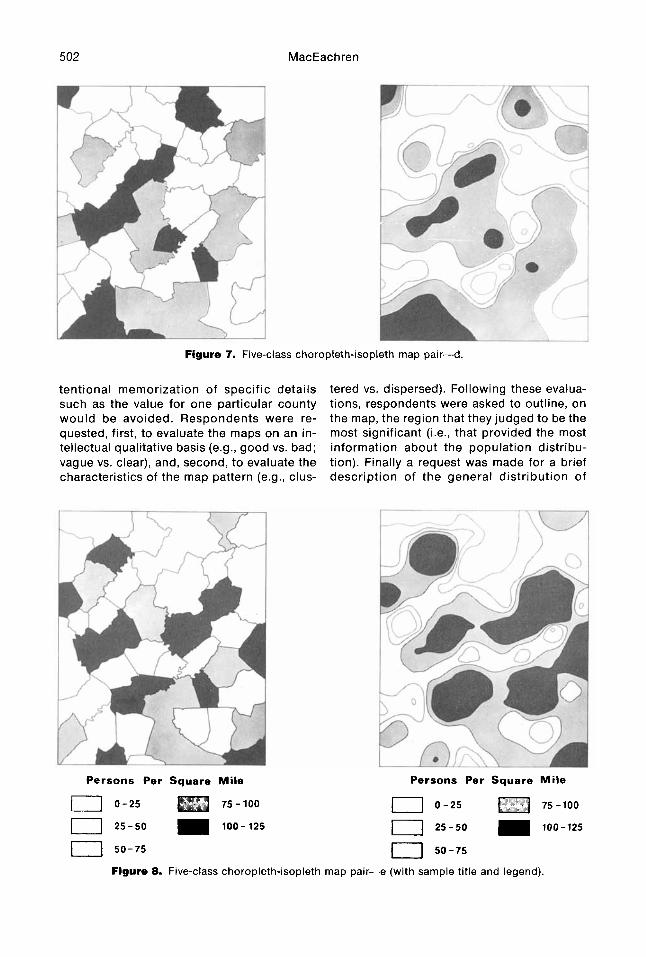
Figure 7. Five-class choropleth-isopleth map pair-d.
tentional memorization of specific details tered vs. dispersed). Following these evalua- such as the value for one particular county tions, respondents were asked to outline, on would be avoided. Respondents were re- the map, the region that they judged to be the quested, first, to evaluate the maps on an in- most significant (i.e., that provided the most tellectual qualitative basis (e.g., good vs. bad; information about the population distribu- vague vs. clear), and, second, to evaluate the tion). Finally a request was made for a brief characteristics of the map pattern (e.g., clus- description of the general distribution of
Persons Per Square Mile Persons Per Square Mile
0 0-25 75 - 100 0 0 - 2 5 75 -100
0 2 5 - 5 0 100-125 25-50 100-125
0 50-75 0 5 0 - 7 5
Figure 8. Five-class choropleth-isopleth map pair-e (with sample title and legend).
Thematic Map Effectiveness 503
10
9 > X k
n I 0 u 7
n
a 6
w -I
0 0
5
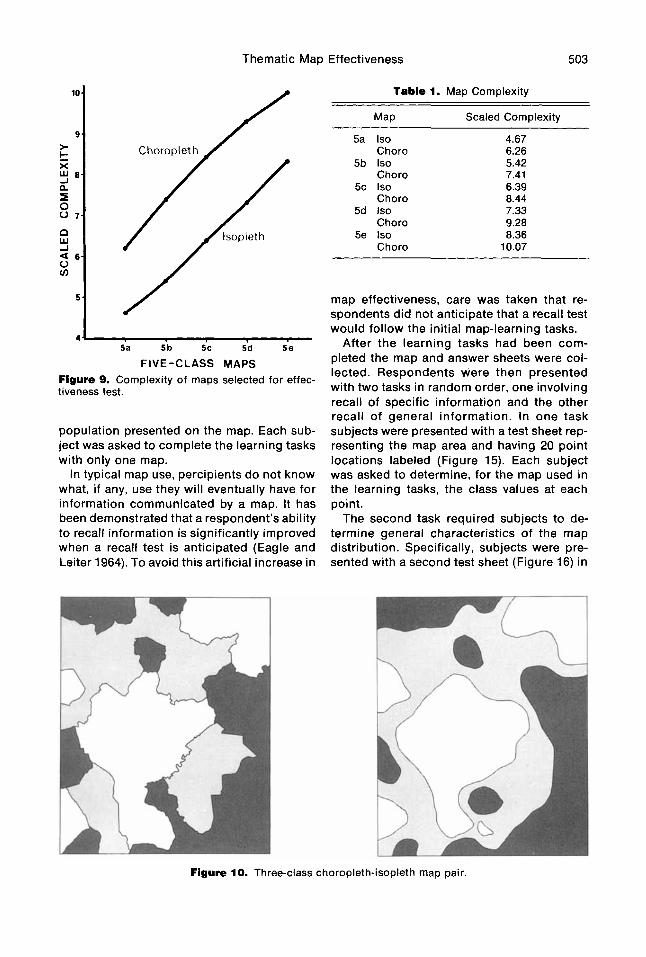
4 Sa 5b 5c 56 5k
FIVE-CLASS MAPS Figure 9. Complexity of maps selected for effec- tiveness test.
population presented on the map. Each sub- ject was asked to complete the learning tasks with only one map.
In typical map use, percipients do not know what, if any, use they will eventually have for information communicated by a map. It has been demonstrated that a respondent’s ability to recall information is significantly improved when a recall test is anticipated (Eagle and Leiter 1964). To avoid this artificial increase in
Table 1. Map Complexity
Map Scaled Complexity
5a Is0 4.67 Choro 6.26
5b Is0 5.42 Choro 7.41
5c Is0 6.39 Choro 8.44
5d Is0 7.33 Choro 9.28
5e Is0 8.36 Choro 10.07
map effectiveness, care was taken that re- spondents did not anticipate that a recall test would follow the initial map-learning tasks.
After the learning tasks had been com- pleted the map and answer sheets were col- lected. Respondents were then presented with two tasks in random order, one involving recall of specific information and the other recall of general information. In one task subjects were presented with a test sheet rep- resenting the map area and having 20 point locations labeled (Figure 15). Each subject was asked to determine, for the map used in the learning tasks, the class values at each point.
The second task required subjects to de- termine general characteristics of the map distribution. Specifically, subjects were pre- sented with a second test sheet (Figure 16) in
Figure 10. Three-class choropleth-isopleth map pair.
504 MacEachren
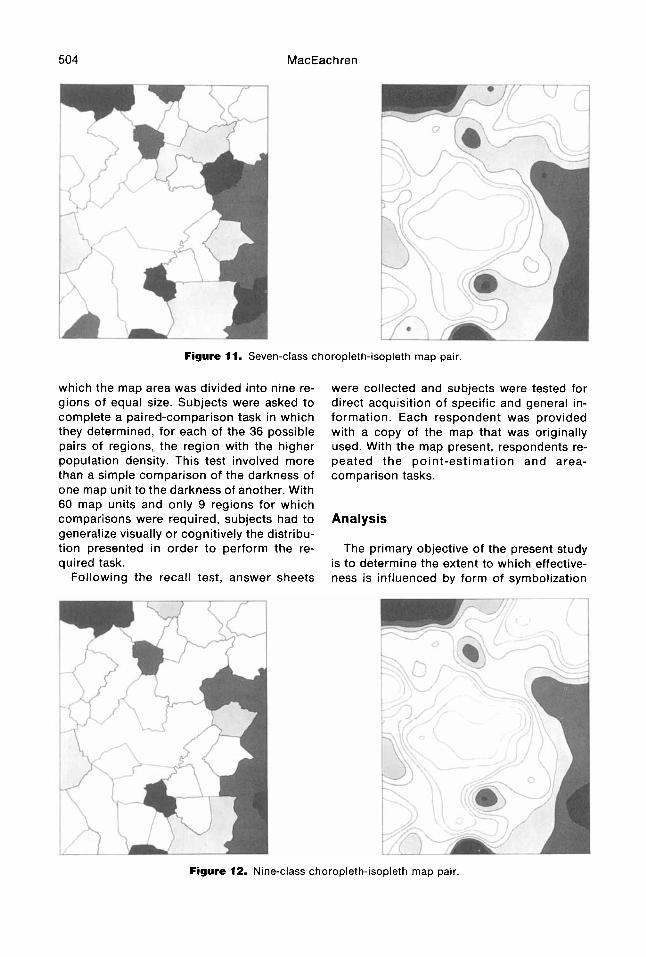
Figure 11. Seven-class choropleth-isopleth map pair.
which the map area was divided into nine re- gions of equal size. Subjects were asked to complete a paired-comparison task in which they determined, for each of the 36 possible pairs of regions, the region with the higher population density. This test involved more than a simple comparison of the darkness of one map unit to the darkness of another. With 60 map units and only 9 regions for which comparisons were required, subjects had to generalize visually or cognitively the distribu- tion presented in order to perform the re- quired task.
Following the recall test, answer sheets
were collected and subjects were tested for direct acquisition of specific and general in- formation. Each respondent was provided with a copy of the map that was originally used. With the map present, respondents re- peated the point-estimation and area- comparison tasks.
Analysis
The primary objective of the present study is to determine the extent to which effective- ness is influenced by form of symbolization
Figure 12. Nine-class choropleth-isopleth map pair.
Thematic Map Effectiveness 505
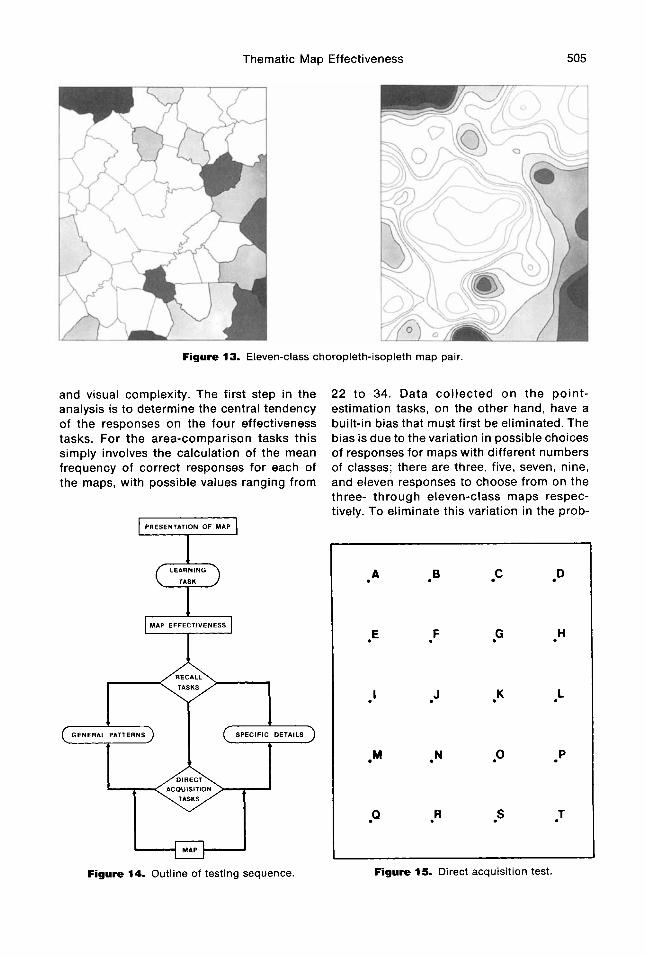
Figure 13. Eleven-class choropleth-isopleth map pair.
and visual complexity. The first step in the analysis is to determine the central tendency of the responses on the four effectiveness tasks. For the area-comparison tasks this simply involves the calculation of the mean frequency of correct responses for each of the maps, with possible values ranging from
PRESENTATION OF M A P
Figure 14. Outline of testing sequence.
22 to 34. Data collected on the point- estimation tasks, on the other hand, have a built-in bias that must first be eliminated. The bias is due to the variation in possible choices of responses for maps with different numbers of classes; there are three, five, seven, nine, and eleven responses to choose from on the three- through eleven-class maps respec- tively. To eliminate this variation in the prob-
A B C D
E F G H
I J K L
M .N p P
p R *s T
~~
Figure 15. Direct acquisition test.

506
B
E
H
MacEachren
C
F
I
sponse (Table 2). Adjusted values range from a minimum of four to a maximum of ten.
Analysis of variance of results on the four effectiveness tasks is calculated for each map set (i.e., five-class maps and three- through eleven-class maps). Calculations are made for all maps in each set and for choropleth and isopleth maps separately (Table 3). For those parts of the test in which variation in effec- tiveness is observed, analysis of the influence of complexity and form of symbolization on this variation is conducted.
The analysis of variance indicates a signifi- cant variation in effectiveness among the maps, with one major exception. This excep- tion occurs with recall of general information from the three- through eleven-class map set. Although some of these maps have more categories than can be distinguished by most people, there appears to be no significant difference in effectiveness either for the com- plete map set or for the choropleth or isopleth
Figure 16. Recall test.
ability of a correct response by chance alone, values obtained are adjusted by subtracting from each score the product of the score and the chance probability of a correct re-
maps separately. Communication effectiveness is hypothe-
sized to reach a peak at lower levels of visual complexity, and decrease from this point as complexity increases. One method of determining the existence of such a relation-
Table 2. Map Effectiveness
Direct Acquisition Recall
General Specific General Specific Patterns Details Patterns Details
Mean Mean Mean Mean Number of number number number number Number of
Classes correct cr correct u correct u correct u Subjects
5a
5b
5c
5d
5e
3
5b
7
9
11
-
Is0 Choro Is0 Choro Is0 Choro Is0 Choro Is0 Choro Is0 Choro Is0 Choro Is0 Choro Is0 Choro Is0 Choro
33.04 31.05 32.59 32.70 30.35 30.15 28.1 1 26.76 28.80 28.33 32.17 32.70 32.59 32.70 31.52 32.48 30.55 32.30 30.68 31.43
1.89 2.40 1.52 2.12 3.53 1.69 2.92 3.77 3.14 2.15 1.35 1.85 1.52 2.12 2.33 1.86 3.03 2.23 2.51 1.99
9.64 1.69 30.00 3.14 5.50 1.91 24 9.86 2.39 28.21 3.53 5.06 1.64 22 6.71 1.73 29.27 2.75 5.09 1.34 28 6.84 1.92 27.33 3.12 5.50 1.25 31 7.84 1.98 27.40 2.68 4.16 1.19 28 7.80 2.14 25.65 3.34 4.40 1.07 21 6.26 1.68 25.29 3.80 4.14 1.73 20 6.67 1.92 23.86 3.20 4.19 1.33 20 8.28 2.06 24.55 4.63 4.80 1.73 20 6.59 2.09 22.24 3.59 4.31 0.97 21 9.16 1.28 29.52 2.93 6.78 1.24 23 8.90 1.62 28.10 4.15 6.80 1.15 20 6.71 1.73 29.27 2.75 5.09 1.61 28 6.84 1.92 27.33 3.12 5.50 1.24 31 6.33 2.11 28.13 2.18 3.91 1.49 23 6.69 2.10 27.62 4.83 3.96 1.72 21 4.85 1.76 29.10 3.80 3.42 1.30 20 6.62 1.71 28.75 3.77 4.27 1.21 20 4.05 1.89 28.22 2.78 3.02 1.11 22 4.59 1.94 26.33 3.79 2.68 1.24 21
Thematic Map Effectiveness 507
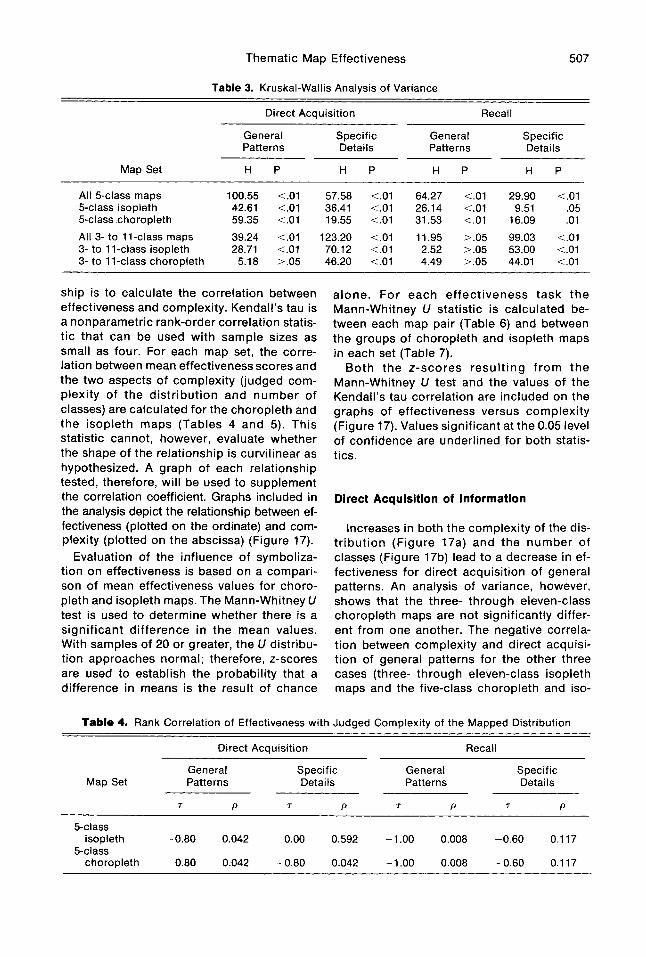
Table 3. Kruskal-Wallis Analysis of Variance
Direct Acquisition Recall
General Specific General Specific Patterns Details Patterns Details
Map Set H P H P H P H P
All 5-class maps 100.55 <.01 57.58 <.01 64.27 c.01 29.90 <.Ol 5-class isopleth 42.61 <.01 36.41 <.01 26.14 <.01 9.51 .05 5-class choropleth 59.35 <.01 19.55 c.01 31.53 c.01 16.09 .01 All 3- to 11-class maps 39.24 c.01 123.20 c.01 11.95 >.05 99.03 c.01 3- to 11-class isopleth 28.71 <.01 70.12 c.01 2.52 >.05 53.00 c.01 3- to 11-class choropleth 5.18 >.05 46.20 <.01 4.49 >.05 44.01 <.01
ship is to calculate the correlation between effectiveness and complexity. Kendall’s tau is a nonparametric rank-order correlation statis- tic that can be used with sample sizes as small as four. For each map set, the corre- lation between mean effectiveness scores and the two aspects of complexity (judged com- plexity of the distribution and number of classes) are calculated for the choropleth and the isopleth maps (Tables 4 and 5). This statistic cannot, however, evaluate whether the shape of the relationship is curvilinear as hypothesized. A graph of each relationship tested, therefore, will be used to supplement the correlation coefficient. Graphs included in the analysis depict the relationship between ef- fectiveness (plotted on the ordinate) and com- plexity (plotted on the abscissa) (Figure 17).
Evaluation of the influence of symboliza- tion on effectiveness is based on a compari- son of mean effectiveness values for choro- pleth and isopleth maps. The Mann-Whitney U test is used to determine whether there is a significant difference in the mean values. With samples of 20 or greater, the U distribu- tion approaches normal: therefore, z-scores are used to establish the probability that a difference in means is the result of chance
alone. For each effectiveness task the Mann-Whitney U statistic is calculated be- tween each map pair (Table 6) and between the groups of choropleth and isopleth maps in each set (Table 7).
Both the z-scores resulting from the Mann-Whitney U test and the values of the Kendall’s tau correlation are included on the graphs of effectiveness versus complexity (Figure 17). Values significant at the 0.05 level of confidence are underlined for both statis- tics.
Direct Acquisition of Information
Increases in both the complexity of the dis- tribution (Figure 17a) and the number of classes (Figure 17b) lead to a decrease in ef- fectiveness for direct acquisition of general patterns. An analysis of variance, however, shows that the three- through eleven-class choropleth maps are not significantly differ- ent from one another. The negative correla- tion between complexity and direct acquisi- tion of general patterns for the other three cases (three- through eleven-class isopleth maps and the five-class choropleth and iso-
Table 4. Rank Correlation of Effectiveness with Judged Complexity of the Mapped Distribution
Direct Acquisition Recall
General Specific General Specific Map Set Patterns Details Patterns Details
7 7 7 7 P P P P
5-class
5-class isopleth -0.80 0.042 0.00 0.592 -1.00 0.008 -0.60 0.117
choropleth -0.80 0.042 -0.80 0.042 -1.00 0.008 -0.60 0.117

508 MacEachren
e n':: - 0 PI 6-
Table 5. Rank Correlation of Effectiveness with Number of Classes
Direct Acquisition Recall
General Patterns Specific Details General Patterns Specific Details
Mao Set 7 P r P 7 P 7 P
$ai 7,=0.0
3- to 11-class
3- to 11-class isopleth -0.80 0.042 -1.00
choropleth -0.90 0.042 -1.00
14-
12-
10,
pleth maps) is significant at the 0.05 level of confidence. No significant variation between choropleth and isopleth effectiveness is found in either case (z = -0.56 and -1 53 for the five-class maps and the three- through eleven-class maps respectively).
Changes in the complexity of the distribu- tion appear to have a greater impact on effec- tiveness than do changes in the number of
Id1
34
32
30 Y) (Y C
.$ 28 - 0 PI - c
26
24
22
10- 2
: 8- - 0
la1
7,:l.O P I -
7,.0.8 -
7,=0.8
7,. 0.8
- - Z =-0.56
A & & & & 5-class maps
order of complexity
Y) (Y
: 28- 0
+ - 26-
141 Icl
T,.O.8 -
41:; & 2=-0.63
2
5-class maps order of complexity
Direct Acquisition of General Patterns
Z E?. z -1.53
22- 3 5 7 9 1 1
number of classes
Direct Acquisition of Specific Details
3 5 7 9 1 1 number of classes
0.008 -0.40 0.242 -1.00 0.008
0.008 -0.40 0.242 -0.80 0.042
classes (Figures 17a and 17b). Even the eleven-class choropleth and isopleth maps, for which it is unlikely that anyone could dis- tinguish among all categories, are more ef- fective in direct communication of general patterns, as measured here, than are any of the three pairs of five-class maps based on more complex distributions (i.e., maps 5c, 5d, and 5e).
34
32
30
Y) (u C
$ 28 - 0 0 - -
26
24
22
lel
5-class maps order of complexity
Recall of General Patterns
If1
321
22 3 5 7 9 1 1
number of classes
14
5-class maps order of complexity
Recall of Specific Details
Ihl
2h-T-T-E number of classes
Figure 17. Plots of effectiveness versus complexity for each test.
Thematic Map Effectiveness 509
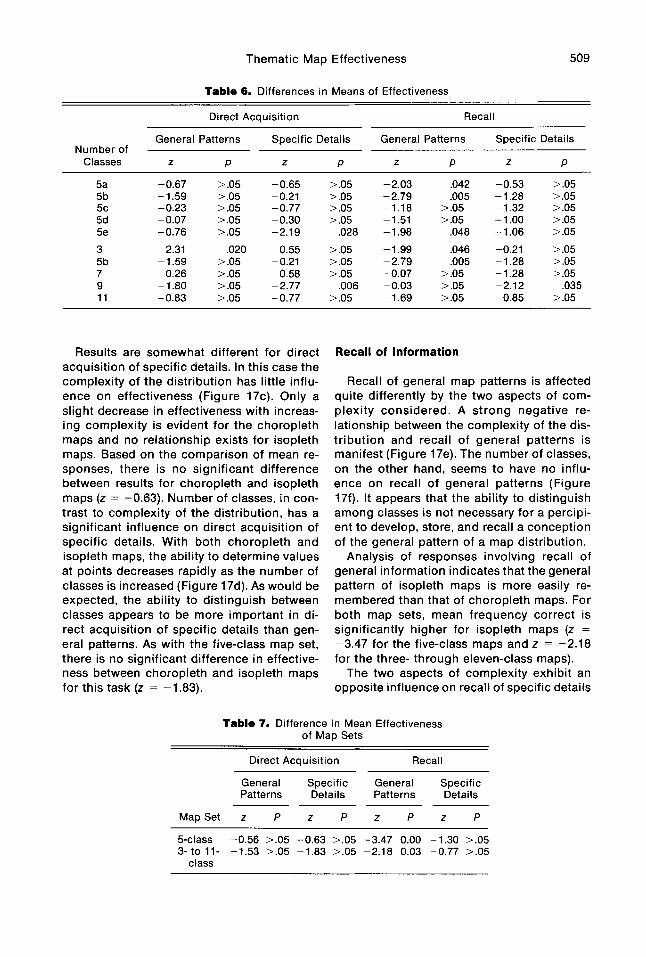
Table 6. Differences in Means of Effectiveness
Direct Acquisition Recall
General Patterns Specific Details General Patterns Specific Details Number of
Classes Z P Z P Z P Z P
5a 5b 5c 5d 5e
3 5b 7 9 11
-0.67 -1.59 -0.23 -0.07 -0.76
-2.31 -1.59 -0.26 -1.80 -0.83
> .05 > .05 > .05 > .05 > .05
> .05 > .05 > .05 > .05
,020
-0.65 -0.21 -0.77 -0.30 -2.19
-0.55 -0.21 -0.58 -2.77 -0.77
> .05 > .05 > .05 > .05
> .05 > .05 > .05
> .05
,028
,006
-2.03 -2.79 -1.18 - 1.51 - 1.98
- 1.99 -2.79 -0.07 -0.03 -1.69
,042 .005
> .05 > .05
,048
,046 ,005
> .05 > .05 > .05
-0.53 - 1.28 -1.32 - 1 .oo - 1.06
-0.21 - 1.28 -1.28 -2.12 -0.85
> .05 > .05 > .05 > .05 > .05
> .05 > .05 > .05
> .05 ,035
Results are somewhat different for direct acquisition of specific details. In this case the complexity of the distribution has little influ- ence on effectiveness (Figure 17c). Only a slight decrease in effectiveness with increas- ing complexity is evident for the choropleth maps and no relationship exists for isopleth maps. Based on the comparison of mean re- sponses, there is no significant difference between results for choropleth and isopleth maps (z = -0.63). Number of classes, in con- trast to complexity of the distribution, has a significant influence on direct acquisition of specific details. With both choropleth and isopleth maps, the ability to determine values at points decreases rapidly as the number of classes is increased (Figure 17d). As would be expected, the ability to distinguish between classes appears to be more important in di- rect acquisition of specific details than gen- eral patterns. As with the five-class map set, there is no significant difference in effective- ness between choropleth and isopleth maps for this task (z = -1.83).
Recall of Information
Recall of general map patterns is affected quite differently by the two aspects of com- plexity considered. A strong negative re- lationship between the complexity of the dis- tribution and recall of general patterns is manifest (Figure 17e). The number of classes, on the other hand, seems to have no influ- ence on recall of general patterns (Figure 17f). It appears that the ability to distinguish among classes is not necessary for a percipi- ent to develop, store, and recall a conception of the general pattern of a map distribution.
Analysis of responses involving recall of general information indicates that the general pattern of isopleth maps is more easily re- membered than that of choropleth maps. For both map sets, mean frequency correct is significantly higher for isopleth maps (z =
-3.47 for the five-class maps and z = -2.18 for the three- through eleven-class maps).
The two aspects of complexity exhibit an opposite influence on recall of specific details
Table 7. Difference in Mean Effectiveness of Map Sets
Direct Acquisition Recall
General Specific General Specific Patterns Details Patterns Details
MapSet z P z P z P z P
5-class -0.56 1.05 -0.63 1.05 -3.47 0.00 -1.30 >.05 3- to 11- -1.53 >.05 -1.83 1.05 -2.18 0.03 -0.77 >.05
class
51 0 MacEachren
from that found for recall of general patterns. The complexity of the distribution has no sig- nificant effect on recall of specific details (Figure 179). In addition, no difference is ap- parent between choropleth and isopleth maps (z = -1.30). Recall of specific details is, however, affected by an increase in the number of classes (Figure 17h). This is true for both choropleth and isopleth maps. Al- though the relationship for isopleth maps analyzed is somewhat more consistent, there is no significant difference between choro- pleth and isopleth maps in the recall of specific details (z = -0.77).
Summary
In summary, then, there is a significant de- crease in accuracy of direct acquisition of general patterns as complexity of the dis- tribution is increased. The decrease is evident for both choropleth and isopleth maps. Only for isopleth maps, however, does increasing the number of classes result in a decrease in effectiveness for direct acquisition of general patterns. Direct acquisition of specific details, on the other hand exhibited no consistent relationship with complexity of the distribu- tion for either choropleth or isopleth maps. An increase in the number of classes results in a decrease in effectiveness for direct ac- quisition of specific details with both sym- bolization methods. No significant difference between choropleth and isopleth maps is ap- parent for any of the direct acquisition tasks.
The recall tests yield somewhat different findings. As with direct acquisition, for both choropleth and isopleth maps, recall of gen- eral patterns decreases with increasing com- plexity of the distribution. The number of classes, however, seems to have no effect on recall of general patterns for either symboli- zation method. In contrast to results for direct acquisition, with recall of general patterns, isopleth maps are found to be significantly more effective than choropleth maps for both map sets. For specific details, effectiveness of recall is not affected by increases in the com- plexity of the distribution but exhibits a de- crease with increases in the number of classes. No difference in recall of specific details is apparent between choropleth and isopleth maps for either map set.
Conclusions
The original hypotheses of a decrease in effectiveness with increasing complexity and greater effectiveness of isopleth maps in comparison with choropleth maps can be ac- cepted only to a l imited degree. The hypothesized “critical” level of complexity, up to which effectiveness would be constant and beyond which effectiveness would de- crease, was not found. It is possible, however, that no maps in the study had a low enough level of visual complexity for this “critical” level to be manifest.
An underlying assumption of this study has been that effectiveness of a thematic map will vary with the use to which the map is put. Results presented support this contention. The complexity-effectiveness relationship and the influence of symbolization method on effectiveness have been shown to differ sub- stantially for the four basic categories of map use delineated.
The demonstration of variability in map ef- fectiveness for different purposes has imme- diate applicability to problems of map sym- bolization and design. In general, it em- phasizes the need to take the potential ap- plication of a map into consideration in the design process. More specifically, it raises questions concerning the extent to which we have generalized results of cartographic re- search from one application to another. The most obvious example involves the gradu- ated-circle map. Extensive research into one aspect of graduated-circle map ef- fectiveness (direct acquisition of specific de- tails) has resulted in a recommendation to scale circle size psychologically (Robinson, Sale, and Morrison 1978). For the map maker interested in communicating specific values, this procedure seems reasonable. If, however, the intent is communication of an overall im- pression of the distribution, psychological scaling may not be the appropriate choice.
Although questions remain, the specific re- sults of this study concerning the effect of complexity and symbolization method on various categories of map effectiveness are also relevant to problems of map design and use. Results indicate that the four aspects of communication effectiveness considered (di- rect acquisition and recall of both specific and general information) exhibit some gen-

Thematic Map Effectiveness 51 1
era1 similarities. Though, as would be ex- pected, recall of specific information is not as accurate as visual estimation of that informa- tion with the map present, the nature of the complexity-symbolization-effectiveness re- lationship is similar.
There are similarities between direct acqui- sition and recall of general pattern informa- tion as well. The importance of the two as- pects of complexity in the communication of general patterns is the reverse of what is demonstrated for specific details. Complexity of the distribution is directly related to an ability both to obtain an understanding of and to remember a general map pattern. Knowing the complexity of the distribution, then, could allow a map maker to determine whether or not a proposed map would result in a consis- tently identifiable pattern and whether this pattern was likely to be remembered. The number of classes into which data are divided has less effect than does the complexity of the distribution, and in the case of recall there is no apparent effect.
Though similarities exist between the im- portance of symbolization to recall and to di- rect acquisition of general information, a major difference occurs as well. For recall of general patterns, the isopleth maps included in the present study are consistently more effective than the corresponding choropleth maps. No such difference exists for direct ac- quisition of general patterns. This variation may be due to the organization requirement of recall memory. lsopleth maps have been found to be consistently less complex than corresponding choropleth maps. This differ- ence in complexity, however, is not the result of the characteristics of the distribution or the number of classes, but of the basic nature of the symbolization. This aspect of complexity may lead to a difference in the ease with which a percipient can organize information presented. Possibly, the smoother bound- aries and the continuous nature of the iso- pleth representation make it easier to organ- ize, and therefore to store and recall, informa- tion about the general map pattern.
One decision faced by any map designer is the choice of a method of symbolization to represent the data. Present findings suggest that for an application such as a population density map in a geography text (when spe- cific enumeration unit values are not relevant,
the assumption of continuity of the distribu- tion is reasonable, and retention of the gen- eral map pattern is desired) isopleth maps are more appropriate than choropleth maps.
With the current rapid development of geo- graphic information systems and the con- comitant development of software allowing the user to create maps interactively at a computer terminal, there is a new opportunity to tailor maps to specific needs. The results described here are a step toward providing these users with a set of guidelines for creat- ing such maps.
In addition to providing a basis for selection among symbolization methods, these results also apply to data classification. They suggest that if interest is on general patterns the user need not limit the number of categories on the map produced. On the other hand, be- cause of perceptual limitations, when specific information for particular locations is needed, error in interpretation will increase in direct proportion to increases in the number of categories.
These findings relate directly to the ques- tion of whether N-class choropleth maps (i.e., maps using virtually continuous shading to represent individual values rather than a lim- ited number of shades representing classed values) are effective. Muller (1979) has dem- onstrated the ability of “average map read- ers” to regionalize N-class maps, and Peter- son (1979) has presented evidence that percipients can both compare patterns and estimate values on these maps.
For choropleth maps in the present study, no overall relationship was evident between the number of map classes and the ability of respondents to compare the average density of selected areas either visually or from mem- ory. Considering that seven-, nine-, and eleven-class maps (each presumably ex- ceeding the ability of some or all subjects to perceive the difference between patterns) were included, it is probable that an N-class map would yield similar results.
The results complement the findings of both Muller (1979) and Peterson (1979). Each study uses a very different set of maps as well as a different methodology. However, for re- gionalization in Muller’s case, map compari- son in Peterson’s case, and region compari- son here, results are very similar. When direct acquisition of the general map pattern is re-
51 2 MacEachren
quired, the ability to distinguish among spe- cific units has little or no effect on the ability to perform the task. The recall test in the pre- sent study indicates that similar conclusions may apply to memory of general patterns.
Peterson’s (1979) finding that value estima- tion is as accurate on N-class maps as on classed maps is not supported by the present study. In this case a decrease in ability to de- termine or recall specific information as the number of classes increases is apparent. The ability of Peterson’s subjects to perform as well on N-class maps as on classed maps is probably the result of the patterns used on the map. In his study Peterson used crossed-line patterns rather than the fine textured dot screens used here. Subjects were therefore actually judging texture rather than gray-tone value, an apparently easier task.
The present study does, however, provide further evidence that N-class maps are effec- tive for certain purposes. Their uses may be limited for other reasons, such as aesthetics or reproducibility, so the appropriateness of using an N-class map must be evaluated in the context of each particular application.
Though the present study has compared communication of general and specific in- formation, this distinction may be somewhat artificial. These categories have been defined, respectively, as values at specific points and relative density in nine areas covering the map surface. They might just as logically have been defined as average values in 100 grid cells covering the map (representing specific information) and the relative density of 16 or 20 areas covering the map surface (repre- senting general information). It may therefore be appropriate to consider map information to be on a continuum from very specific to very general. Communication of specific and general information results in a quite different complexity-effectiveness relationship, em- phasizing the number of classes in the first case and the distributional complexity in the second. This indicates a possible continuum from communication of general to specific information, along which the importance of distributional complexity decreases as that of number of classes increases.
Specific results of this study are applicable only to the two symbolization methods tested, choropleth and shaded isopleth. However, the basic categories of effectiveness de-
lineated, based on the level of detail required from the map and the extent of cognitive pro- cessing necessary, can be expected to have application for other kinds of symbolization as well. The variation in effectiveness demon- strated among these categories suggests that the use to which a map will be put should be a major consideration in attempts to evaluate effectiveness of any symbolization method.
Acknowledgement
I would like to express my appreciation to Pa- tricia P. Gilmartin and James 6. Campbell for their comments and suggestions on an earlier draft of this paper. Special thanks are extended to George McCleary and George Jenks. Without their advice and support, this research would not have been possible.
Notes
Map percipient has been defined as “one who obtains information about the milieu by look- ing at a map” (Robinson and Petchenik 1976, p. 20). In contrast to “map reader” or “map user,” which refer to specific actions taken, map percipient is intended to imply the addi- tion of spatial knowledge. A comparison of the results of recall and rec- ognition tests for memory of map information is presented by Cole (1981). Complete instructions were: (a) You have each been presented with a set of
maps arranged in random order. You will be asked to give me some information about how complex the maps appear to be. Before I explain more specifically what you are to do, I would like you to sort through the maps to get an idea of the range in complexity that exists in the set. By com- plexity I mean how intricate or involved the maps appear to be. (pause)
(b) What you are to do is to indicate how com- plex, or how complicated or involved, each map appears to be by assigning a number to it. Assign any number that seems appro- priate to the first map. Then, one at a time, assign numbers to each additional map that reflect your impression of the map’s complexity. There is no limit to the range of numbers that you may use. You may use whole numbers, decimals, or fractions. Try to make each number match the intensity as you perceive it. Keeping in mind that there are no limits to the range of numbers you may use, if a map appears more or less complex than any of those before it, assign a number that indicates this. Do not go back to look at maps you have already rated. Please write the numbers in the upper right-hand corner of each map.
Thematic Map Effectiveness 51 3
4. The arrangement of title and legend is the same on all maps. As an example of the form in which maps were presented to subjects, the title and legend are included on Figure 8.
References
Brophy, David M. 1980. Some reflections on the complexity of maps. Technical Papers of the American Congress on Surveying and Map- ping, 40th Annual Meeting, St. Louis, Mo., pp.
Cole, Daniel G. 1981. Recall vs. recognition and task specificity in cartographic psychophysical testing. The American Cartographer 855-66.
Crawford, P. V. 1973. The perception of graduated squares as cartographic symbols. The Carto- graphic Journal 10:85-88.
Dobson, M. W. 1977. Eye movement parameters and map reading. The American Cartographer
Eagle, M., and Leiter, E. 1964. Recall and recogni- tion in intentional and incidental learning. Journal of Experimental Psychology 6858-63.
Engen, T. 1972. Psychophysics II. Scaling methods. Experimental psychology, vol. I: Sensation and perception, 3rd ed., eds. J. W. Kling and L. A. Riggs, pp. 47-86. New York: Holt, Rinehart and Winston, Inc.
Flannery, J. J. 1971. The relative effectiveness of some common point symbols in the presenta- tion of quantitative data. The Canadian Cartog- rapher 8:96-109.
Jenks, G. F. 1973. Visual integration in thematic mapping: fact or fiction? International Year- book of Cartography 13:27-35.
Jenks, G., and Coulson, R. 1963. Class intervals for statistical maps. International Yearbook of Cartography 3:119-34.
Kirnerling, A. J. 1975. A cartographic study of equal value gray scales for use with screened gray areas. The American Cartographer 2:119-27.
Lloyd, R. E., and Steinke, T. R. 1976. The de- cisionmaking process for judging the similarity of choropleth maps. The American Cartog- rapher 3:177-84.
MacEachren, Alan M. 1982. Map complexity: com- parison and measurement. The American Car- tographer 9:31-46.
McCarty, H. H., and Salisbury, N. E. 1961. Visual Comparison of isopleth maps as a means of determining correlations between spatially distributed phenomena. State University of
343-52.
4~39-58.
Iowa Studies in Geography, No. 3, Iowa City: State University of Iowa.
McCleary, G. F. 1975. In pursuit of the map user. Proceedings of the International Symposium on Computer-Assisted Cartography, Auto- Carto 11, Washington, September 21 -25, US. Bureau of the Census and the American Con- gress on Surveying and Mapping, pp. 238-50.
Monrnonier, M. S. 1974. Measures of pattern com- plexity for choropleth maps. The American Cartographer 1 :159-69.
Muehrcke, Phillip C. 1969. Visual pattern analysis: a look at maps. Ph.D. dissertation, Department of Geography, University of Michigan, Ann Arbor, Mich.
-. 1973. Visual pattern comparison in map reading. Proceedings of the Association of American Geographers, 190-94.
Muller, J. C. 1974. Mathematical and statistical comparisons in choropleth mapping. Ph.D. dissertation, Department of Geography, Uni- versity of Kansas, Lawrence, Kans. . 1979. Perception of continuously shaded maps. Annals of the Association of American Geographers 69:240-49.
Olson, J. M. 1970. The effects of class interval sys- tems on the visual correlation of choropleth maps. Ph.D. dissertation, Department of Geog- raphy, University of Wisconsin, Madison, Wisc.
Peterson, Michael P. 1979. An evaluation of un- classed cross-line choropleth mapping. The American Cartographer 6:21-37.
Robinson, Arthur H., and Petchenik, Barbara Bartz. 1976. The nature of maps. Chicago: The University of Chicago Press.
Robinson, Arthur H., Sale, Randall D., and Morri- son, Joel L. 1978. Elements of cartography. New York: John Wiley and Sons.
Sampson, Robert J. 1975. Surface I1 graphics sys- tem. Lawrence Kans.: Kansas Geological Survey.
Steinke, Theodore R. 1979. An evaluation of map design and map reading using eye movement recordings. Ph.D. dissertation, Department of Geography, University of Kansas, Lawrence, Kans.
Stevens, S. S. 1956. The direct estimation of sen- sory magnitudes-loudness. American Journal
-. 1975. Psychophysics, ed. G. Stevens. New York: John Wiley and Sons.
Stevens, S. S., and Galanter, E. H. 1957. Ratio scales and category scales for a dozen per- ceptual continua. Journal of Experimental Psy-
of Psychology 69:l-25.
chology 54:377-411.