the role of buckling in the estimation of compressive
TRANSCRIPT

materials
Article
The Role of Buckling in the Estimation ofCompressive Strength of Corrugated Cardboard Boxes
Tomasz Garbowski 1 , Tomasz Gajewski 1 and Jakub Krzysztof Grabski 2,*1 Institute of Structural Analysis, Poznan University of Technology, Piotrowo Street 5, 60-965 Poznan, Poland;
[email protected] (T.G.); [email protected] (T.G.)2 Institute of Applied Mechanics, Poznan University of Technology, Jana Pawła II Street 24,
60-965 Poznan, Poland* Correspondence: [email protected]
Received: 21 September 2020; Accepted: 12 October 2020; Published: 14 October 2020�����������������
Abstract: This paper presents analytical methods for estimating the static top-to-bottom compressivestrength of simple corrugated packaging, in which the torsional and shear stiffness of corrugatedcardboard as well as the panel depth-to-width ratio are included. The methods are compared hereinwith a basic and more detailed buckling description with the successful McKee formula, which isover fifty years old but still widely used among packaging designers and quality control departments.Additionally, the assumptions and applied simplifications used in the literature are analyzed, and thelimits of applicability of different versions of the selected methods are checked. Finally, all approachesare verified with the experiment results of various packaging designs made of corrugated cardboard.The results show that, for certain proportions of dimensions of simple flap boxes, simplified methodsgive an even two times larger estimation error than the analytical approach proposed in the paper.Furthermore, it is evidenced that including all flexural, torsional and shear stiffnesses in the bucklingforce estimation gives a very precise prediction of the box compressive strength for the full range ofpackage dimensions.
Keywords: corrugated board; McKee formula; buckling; orthotropic panels; laboratory tests;box strength
1. Introduction
Corrugated cardboard has been gaining popularity in recent years and is becoming one of theleading materials in the packaging industry. However, this was not always the case; only a dozenyears ago, cardboard packaging was associated mainly with disposal. Internet sales were at a muchlower level compared to what we observe today. In addition, most companies and consumers didnot attach much importance to environmental protection, and existing regulations did not requirethe monitoring of the packaging industry, which led to the expansion of another material—plastic.Fortunately, companies quickly realized that plastic not only harms the environment but also impairstheir brands’ reputations. Additionally, consumers around the world have increased their demands forenvironmental responsibility, which has forced many companies to change. One of the best alternativesbecame recyclable corrugated cardboard, mainly due to its biodegradable nature.
Today’s corrugated cardboard packaging no longer consists of boring, gray-brown transportboxes. Packaging may be produced with multicolored prints and in various shapes. This makes itvery attractive for e-commerce companies and their customers. It often happens that packaging mustmeet both aesthetic and strength criteria. The best example is the so-called shelf-ready packaging(SRP) or retail-ready packaging (RRP)—branded boxes that are ready for retail display. To optimallychoose the quality of corrugated cardboard for this type of packaging, numerical models [1–4] based
Materials 2020, 13, 4578; doi:10.3390/ma13204578 www.mdpi.com/journal/materials

Materials 2020, 13, 4578 2 of 15
on homogenization methods [5–11] are necessary. Models based on analytical equations or empiricalformulas are sufficient only for simple flap constructions (see [12–15]).
One of the most popular methods of estimating the strength of cuboid-shaped packaging isthe approach proposed in the 1960s by McKee et al. [12]. This method uses the basic parameters ofcorrugated cardboard and empirically determined correction factors that increase the accuracy ofthe results obtained. Unfortunately, the introduction of correction factors reduces the universalityof the method, mainly because their values have to be determined individually for practically everycardboard quality and every packaging design. To better understand the limitations of this method,commonly known as the McKee formula, it is necessary to study the performance of simplified methodsfor a box strength estimation, comparing them to other, more sophisticated approaches, and to confrontall methods with real experimental data, which will be shown later in this work.
The prediction of corrugated cardboard boxes’ strength based on relatively simple formulas hasbeen of interest to numerous groups of scientists for many years. In their research, they used variousapproaches and considered different phenomena and properties of paper, cardboard and boxes. In 1952,Kellicutt and Landt [16] proposed a formula for the compressive strength of corrugated boxes based onthe box compression test (BCT). In this formula, they took into account the overall ring crush strengthof linerboards, box perimeter, flute and box constants. A relationship between the critical force in theBCT and the dimensions of the box has been established by Maltenfort and described in the paper [17]from 1956. His formula is based on the Concora liner test (CLT), an empirical constant related to theboard and dimensions of the box. The widely used formula of McKee, Gander and Wachuta [12]related the compression strength to the edge crush test (ECT), flexural stiffness of the board and boxdimensions. In the formula proposed by Whitsitt et al. [18], a time to failure was estimated basedon the ECT, flexural stiffness of the board, perimeter of the box, buckling ratio, stacking time andapplied load ratio. Modified McKee formulas for C-flute corrugated fiberboards were proposed byAllerby et al. [19], who changed the constants and exponents of the McKee formula. Similarly, in 1987,Schrampfer et al. proposed a modified McKee relationship for a wide range of cutting methods andequipment [20]. In 1989, Kawanishi in [21] proposed a formula for the compression strength of boxes,based on some parameters relevant from a practical point of view. The formula included the weight oflinerboards and corrugated fiberboards, take-up factor, average corrugation count, thickness of thefiberboard, box perimeter, box type, printed ratio and sidewall moisture content. Batelka et al. [22]expanded the applicability of the McKee formula to a wider range of containers. They also consideredthe influence of the width and depth of the box. In the work of Urbanik et al. [23], the formula for thecompression strength of boxes was based inter alia on Poisson’s ratio. The finite element method (FEM)was used to calculate the compression strength. A similar approach to the analysis of box strengthusing FEM computations has been seen in the literature for many years. Nordstrand and Carlssoncompared the effective transverse shear moduli of corrugated boards obtained from FEM simulationswith experimental results and analytical predictions [24,25]. Urbanik and Saliklis applied FEM toobserve the buckling phenomena in the corrugated boxes [26]. A valuable review of the analyticalapproach and numerical prediction of box strength can be found in [27].
All the above-mentioned analytical and numerical methods for estimating the compressivestrength of corrugated cardboard packaging require the determination of a specific set of materialparameters. Even if the key to choosing a method for further analysis is the ease of calibrating thecomputational models, we cannot avoid laboratory work to obtain the necessary parameters. In thesimplest models, it is enough to estimate the edge-loaded compressive strength of the corrugatedcardboard and its thickness; for more demanding models, the bending stiffness of the corrugatedcardboard in the machine and cross direction is also required. Unfortunately, laboratory testing ofthe torsional and shear stiffness of corrugated cardboard is seldom performed. Therefore, even thesedays, equations similar to those proposed by McKee et al. are still seen as the simplest and also themost accurate predictors of the load capacity of regular flap boxes. The success of these methodsis based on the use of those cardboard parameters that are easily obtained in the laboratory and on
Materials 2020, 13, 4578 3 of 15
empirical coefficients that make it possible to accurately match the results to the experimental data.However, if the transverse and bending stiffnesses are included in the model, first, more accurateresults can be obtained for variable geometries of the boxes, and second, problematic correction factorscan be ignored. Fortunately, more and more industrial laboratories have been recently equippedwith advanced devices for measuring all the material parameters of corrugated cardboard. Therefore,the use of tools that use advanced mechanical methods to estimate the load capacity of corrugatedcardboard packaging is gaining popularity.
2. Materials and Methods
2.1. Ultimate Compressive Strength of a Plate
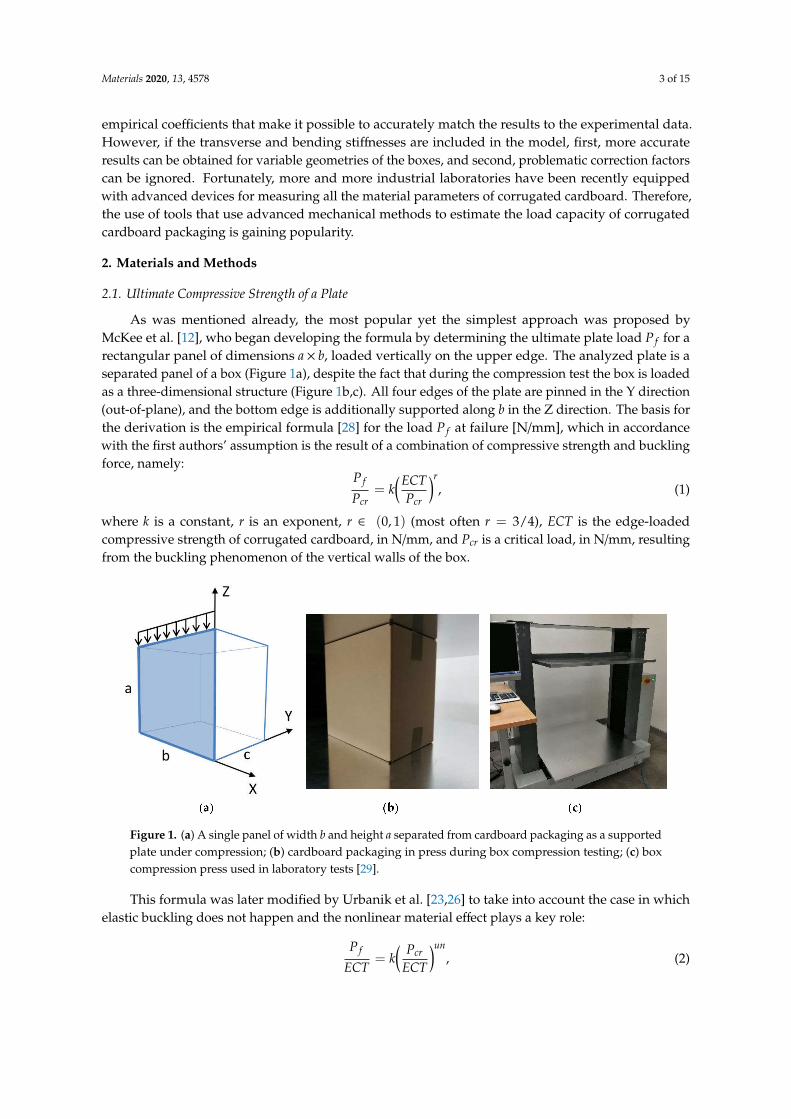
As was mentioned already, the most popular yet the simplest approach was proposed byMcKee et al. [12], who began developing the formula by determining the ultimate plate load P f for arectangular panel of dimensions a× b, loaded vertically on the upper edge. The analyzed plate is aseparated panel of a box (Figure 1a), despite the fact that during the compression test the box is loadedas a three-dimensional structure (Figure 1b,c). All four edges of the plate are pinned in the Y direction(out-of-plane), and the bottom edge is additionally supported along b in the Z direction. The basis forthe derivation is the empirical formula [28] for the load P f at failure [N/mm], which in accordancewith the first authors’ assumption is the result of a combination of compressive strength and bucklingforce, namely:
P f
Pcr= k
(ECTPcr
)r, (1)
where k is a constant, r is an exponent, r ∈ (0, 1) (most often r = 3/4), ECT is the edge-loadedcompressive strength of corrugated cardboard, in N/mm, and Pcr is a critical load, in N/mm, resultingfrom the buckling phenomenon of the vertical walls of the box.
Figure 1. (a) A single panel of width b and height a separated from cardboard packaging as a supportedplate under compression; (b) cardboard packaging in press during box compression testing; (c) boxcompression press used in laboratory tests [29].
This formula was later modified by Urbanik et al. [23,26] to take into account the case in whichelastic buckling does not happen and the nonlinear material effect plays a key role:
P f
ECT= k
( Pcr
ECT
)un, (2)
Materials 2020, 13, 4578 4 of 15
where n = 1− r. Input u = 1 corresponds to elastic buckling when ECT > Pcr, and u = 0 correspondsto inelastic buckling when the ultimate load P f depends only on ECT, namely:
P f = k ECT. (3)
In both cases, the critical load for a rectangular orthotropic plate (a selected panel of a corrugatedcardboard box, see Figure 1a) has the following form [30–32]:
Pbcr =
π2 √D11D22
b2 kcr, (4)
where Pbcr is the critical load of the panel of dimensions a× b (a—panel height, b—panel width), D11 is
the bending stiffness in the machine direction (MD), in Nmm, D22 is the bending stiffness in thetransverse direction (CD), in Nmm, b is the plate width [mm], and kcr is a dimensionless bucklingcoefficient that depends, among others, on the ratio a/b, boundary conditions applied to the plateedges, the buckling mode and a material characteristic.
2.2. Buckling of Rectangular Orthotropic Panel
Corrugated cardboard, like other fibrous materials, is characterized by orthotropy—its mechanicalproperties change depending on the direction (CD/MD). The buckling coefficient in such a case hasthe form:
kcr =
√D11
D22
(mba
)2
+ 2(D12 + 2D66)√
D11D22+
√D22
D11
( amb
)2. (5)
By substituting Equation (5) into Equation (4), we get the critical load of an orthotropic plate ofany dimensions a and b, which now has the following definition:
Pbcr =
1α2
(D11α
4 + 2(D12 + 2D66)α2β2 + D22β
4), (6)
where:α =
mπa
, β =πb
, (7)
D11 =1w
E11I, D22 =1w
E22I, (8)
D12 =ν21
wE11I =
ν12
wE22I, D66 = G12I, (9)
I =h3
12, w =
(1− ν12ν21
), (10)
where h is the effective cardboard thickness, E11 is the effective modulus of elasticity in the MD, E22 isthe effective modulus of elasticity in the CD, G12 is the effective in-plane shear modulus, and ν12 andν21 are effective Poisson’s coefficients in the plane. In the context of the modulus of elasticity, effectivemeans homogenized or substituted; more details on this topic can be found in [5–11,33].
2.3. Buckling Including Transverse Shear Stiffness
If we also want to consider the transverse shear stiffness [34,35], G13 and G23, in order to obtain amore precise prediction, the formula for the critical load should take the following form [32]:
Pbcr =
1α2
MN
, (11)
Materials 2020, 13, 4578 5 of 15
where:
M = D11α4 + 2(D12 + 2D66)α
2β2 + D22β4 +
(α2
A44+
β2
A55
)c1, (12)
N = 1 +c1
A44A55+
c2
A55+
c3
A44, (13)
A44 =56
G13h, A55 =56
G23h, (14)
c1 = c2c3 − c24 > 0, (15)
c2 = D11α2 + D66β
2 (16)
c3 = D66α2 + D22β
2 (17)
c4 = (D12 + D66)αβ (18)
This approach is crucial in cases where the corrugated cardboard is thicker (especially with aflute composition of B, C, BC or EB) and its transverse shear modulus is relatively low (e.g., due tounintentional crushing during printing).
2.4. Buckling in McKee’s Formula
The goal of the authors of the McKee formula was to maximally simplify the complicated equationsdescribing the critical load of compressed orthotropic plates so that the use of these equations couldbe common and practical. The next step taken by the authors of the McKee formula was to simplifyEquation (5) describing the constant kcr through the formula:
kcr =
(mbθa
)2
+(θamb
)2+ 2K, (19)
where: θ =√
D−111 D22 and K is a plate parameter assumed to be equal to 0.5, which means that
D12 + 2D33 = 0.5√
D11D22. It was also assumed that the plate has equal sides, i.e., b = c and thereforeb = Z/4 (where Z is the box perimeter), which leads to further simplification of Equation (4) tothe form:
Pbcr =
(4π)2√D11D22
Z2 kcr. (20)
2.5. Buckling of Square Isotropic Panel
In this section, for comparison we present the simpler formulas, in which the torsional and shearstiffnesses and/or panel depth-to-width ratios are neglected. For the isotropic material definition,we obtain:
D12 + 2D33√
D11D22� 1. (21)
As a result, the buckling coefficient defined in Equation (5) is reduced to:
kcr =
(mba
+a
mb
)2
. (22)
Thus, the critical force can be described by the following equation:
Pbcr =
π2√D11D22
b2
(mba
+a
mb
)2
. (23)

Materials 2020, 13, 4578 6 of 15
If we additionally assume (similarly as McKee) that the plate is a square (a = b, so m = 1),the buckling coefficient simplifies to:
kcr = 4, (24)
and the buckling force reads:
Pbcr =
4π2√D11D22
b2 . (25)
In the case of square orthotropic panels, Equation (5) simplifies to:
kcr =D11 + 2(D12 + 2D66) + D22
√D11D22
, (26)
and the critical force reads:
Pbcr =
π2
b2[D11 + 2(D12 + 2D66) + D22]. (27)
2.6. Determination of Box Compression Strength
In order to calculate the ultimate load capacity of a single panel of a box (Figure 1a), we need tomultiply the value of force P f described by formula (1) by the i-th panel width b or c. To obtain thefailure load for a whole box, we need to make a summation over all panels. Thus, in a general case,we get the following:
BCT = 2k ECTr[γb
(Pb
cr
)1−rb + γc(Pc
cr)1−rc
], (28)
where Pbcr and Pc
cr are the critical forces of panels of width b and c, respectively (see Figure 1a); γb andγc are the reduction coefficients, defined as:
γb =
√bc
, γc = 1 i f b ≤ c, γc =
√cb
, γb = 1 i f b > c. (29)
2.7. Box Compression Strength—Simplification in McKee’s Formula
Substituting the buckling force derived from Equation (20) into Equation (1), we obtain:
P f = k ECTr(√
D11D22)1−r
Z−2(1−r)(4π)2(1−r)k1−rcr , (30)
which simplifies to:
P f = k ECTr(√
D11D22)1−r
Z−2(1−r), (31)
where k (under the first authors’ assumption that k1−rcr is constant if a/Z > 1/7 and equals approximately
1.33, while r = 0.746 and k = 0.4215) is equal to:
k = 1.33 k (4π)2(1−r) � 2.028. (32)
To obtain the failure load for the whole box, it is sufficient to multiply Equation (31) by boxperimeter Z. This is because the original assumption was that the width and length of a box are equal(i.e., b = c) so that there is no need to distinguish between different panels’ widths in the box. Thus,the ultimate compressive strength, also known as the long McKee formula, reads:
BCTMK1 = k ECTr(√
D11D22)1−r
Z2r−1. (33)

Materials 2020, 13, 4578 7 of 15
A further simplification, due to the authors’ empirical observations that√
D11D22 � 66.1 ECT h2,leads to the most known short form of McKee’s equation:
BCTMK2 = k ECT h2(1−r)Z2r−1, (34)
where k, for a previously assumed r = 0.746, equals:
k = k (66.1)1−r � 5.874, (35)
So, finally, Equation (35) takes the form:
BCTMK2 = 5.874 ECT h0.508Z0.492. (36)
2.8. Practical Considerations
To compare the accuracy of Equation (28), which uses different definitions of the critical force(i.e., Equations (6), (11), (23), (25) and (27)) and both of the McKee formulas (Equations (33) and (35)),we have to have constant values of k and r in Equation (28), as suggested by other authors [12–15].Consequently, let k = 0.5 and r = 0.75. The adoption of such values has some empirical basis,but unfortunately there is no mathematical or physical basis; in practice, any values can be adopted.This means that the value of ECT in Equation (28) tends to a higher exponent value, which may havesome justification for short and rigid packaging, where the buckling of individual panels actually hasless effect on the load capacity of the packaging. However, for tall packaging or packaging made oflow-profile cardboard (E or F flutes), the tendency should be exactly the opposite.
The compressive strength of rectangular packages (with base dimensions b × c, as shown inFigure 1a) with the assumed typical values of k and r in Equation (28) reads:
BCT = ECT0.75[γb
(Pb
cr
)0.25b + γc(Pc
cr)0.25c
], (37)
where Pbcr and Pc
cr are defined in:
(a) Equation (6)—for orthotropic rectangular plates,(b) Equation (11)—for orthotropic rectangular plates including transversal shearing,(c) Equation (23)—for quasi-isotropic rectangular plates (neglecting the torsional and shear stiffness
of corrugated board),(d) Equation (25)—for quasi-isotropic square plates (neglecting both the torsional and shear stiffness,
and depth-to-width ratio of the corrugated board panel),(e) Equation (27)—for orthotropic square plates (neglecting the panel depth-to-width ratio).
In all of the above equations describing the critical force Pccr, all definitions of width b should be
replaced by c, e.g., Equation (23) should read:
Pccr =
π2√D11D22
c2
(mca
+a
mc
)2. (38)
2.9. Box Strength—Summary
In determining box strength using the analytical approach presented in Section 2, the buckling forceis a crucial factor. The approaches discussed in Section 2 are summarized in Table 1. The table showswhich factors are taken into account in each approach. The most detailed modelling is represented bycase B, while the simplest is represented by case D and case G (short McKee formula).
Materials 2020, 13, 4578 8 of 15
Table 1. Analytical approaches for the determination of the box compressive strength.
Case Box Compressive Strength [N] Buckling Force a,b Orthotropy Transverse Shear
A
BCT = 2kECTr[γb
(Pb
cr
)1−rb + γc(Pc
cr)1−rc
] Equation (6) + + −
B Equation (11) + + +C Equation (23) + ± +D Equation (25) − − −
E Equation (27) − ± −
F BCT = k ECTr(√
D11D22)1−r
Z2r−1 − − ± −
G BCT = k ECT h2(r−1)Z2r−1 − − − −
3. Results
3.1. Box Compression Strength—Experiment vs. Estimation
In the following section, experimental and computational examples regarding boxes are presentedin order to show the applicability of selected analytical approaches. In the paper, the analyzed casesrepresent the simplest flap boxes, where McKee’s formula should have its lowest error.
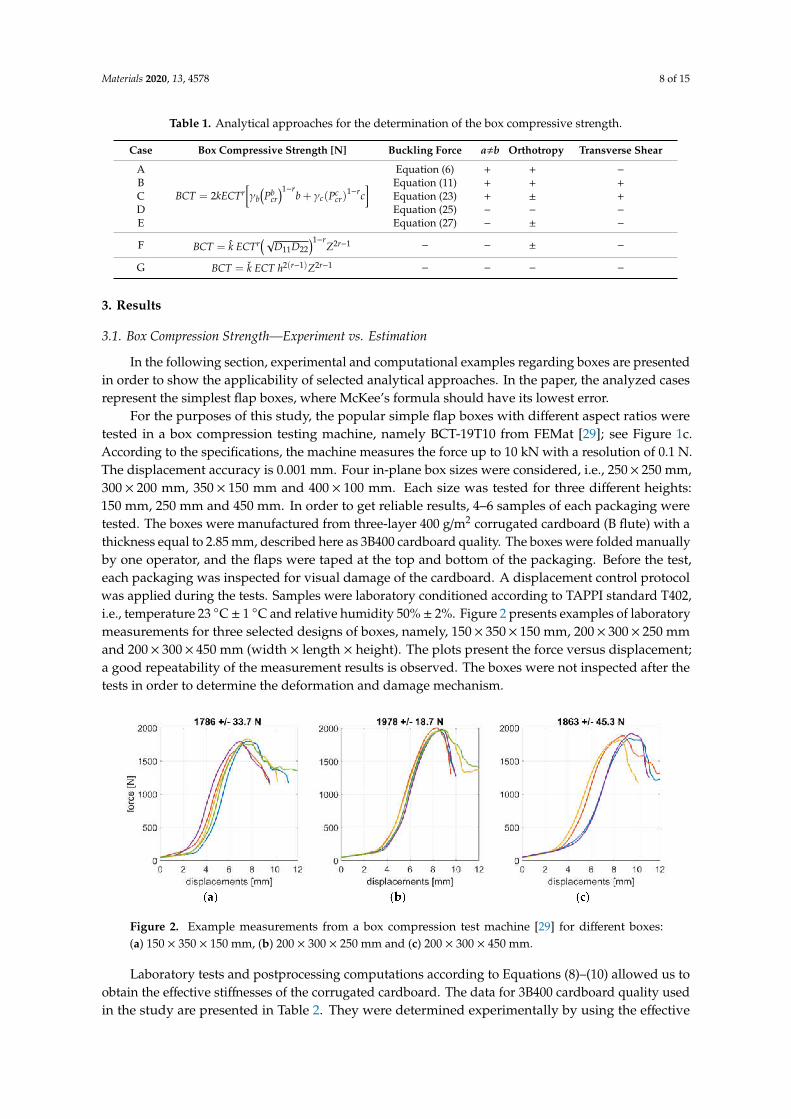
For the purposes of this study, the popular simple flap boxes with different aspect ratios weretested in a box compression testing machine, namely BCT-19T10 from FEMat [29]; see Figure 1c.According to the specifications, the machine measures the force up to 10 kN with a resolution of 0.1 N.The displacement accuracy is 0.001 mm. Four in-plane box sizes were considered, i.e., 250× 250 mm,300 × 200 mm, 350 × 150 mm and 400 × 100 mm. Each size was tested for three different heights:150 mm, 250 mm and 450 mm. In order to get reliable results, 4–6 samples of each packaging weretested. The boxes were manufactured from three-layer 400 g/m2 corrugated cardboard (B flute) with athickness equal to 2.85 mm, described here as 3B400 cardboard quality. The boxes were folded manuallyby one operator, and the flaps were taped at the top and bottom of the packaging. Before the test,each packaging was inspected for visual damage of the cardboard. A displacement control protocolwas applied during the tests. Samples were laboratory conditioned according to TAPPI standard T402,i.e., temperature 23 ◦C ± 1 ◦C and relative humidity 50% ± 2%. Figure 2 presents examples of laboratorymeasurements for three selected designs of boxes, namely, 150× 350× 150 mm, 200× 300× 250 mmand 200× 300× 450 mm (width × length × height). The plots present the force versus displacement;a good repeatability of the measurement results is observed. The boxes were not inspected after thetests in order to determine the deformation and damage mechanism.
Figure 2. Example measurements from a box compression test machine [29] for different boxes:(a) 150 × 350 × 150 mm, (b) 200 × 300 × 250 mm and (c) 200 × 300 × 450 mm.
Laboratory tests and postprocessing computations according to Equations (8)–(10) allowed us toobtain the effective stiffnesses of the corrugated cardboard. The data for 3B400 cardboard quality usedin the study are presented in Table 2. They were determined experimentally by using the effective

Materials 2020, 13, 4578 9 of 15
homogenized approach embedded in the FEM in the laboratory system. In this system, a full setof corrugated cardboard tests is performed, i.e., an edge crush test, board torsion/shear tests andfour-point bending in both directions. The output from the testing protocol includes the deterioratedproperties of cardboard due to crushing, which is an intrinsic side effect that appears in cardboardwhile converting.
Table 2. Mechanical properties (stiffnesses, thickness and ECT value) of 3B400 cardboard quality.
D11[Nmm]
D22[Nmm]
D12[Nmm]
D66[Nmm]
A44[N/mm]
A55[N/mm]
h[mm]
ECT[N/mm]
3269.0 1785.0 717.5 602.2 16.81 54.77 2.85 5.72
D11, D22, D12, and D22—flexural stiffnesses, see Equations (8)–(9), A44 and A55—transverse shear stiffnesses,see Equation (14), h—cardboard thickness and ECT—measured value from edge crush test.
Figure 3 and Table 3 show the mean values of the ultimate load measured at the box failure (BCT)together with ±1σ (one standard deviation) compared with the computed estimation of BCT obtainedby various analytical methods (cases A–G, see Table 1).The used values of k and r are the typicalliterature values, namely k = 0.5 and r = 0.75. In Table 3, in columns A–G, the error is computedaccording to the following expression:
error =
∣∣∣∣∣∣∣BCTexp − BCTest
BCTexp·100%
∣∣∣∣∣∣∣ (39)
where BCTexp is an experimental average value of the box compression strength for a particular boxand BCTest is its counterpart estimated by approaches A–G. Asterix (*) is used to mark the best solutionin a row (lowest error); approach B has the largest number of best solutions (four out of 12 box designs).The mean errors obtained for cases A–C are lower than 8%, while for cases D–G the errors are about11% and more.
Materials 2020, 13, x FOR PEER REVIEW 9 of 15
Figure 3 and Table 3 show the mean values of the ultimate load measured at the box failure
(BCT) together with ±1𝜎 (one standard deviation) compared with the computed estimation of BCT
obtained by various analytical methods (cases A–G, see Table 1).The used values of 𝑘 and 𝑟 are the
typical literature values, namely 𝑘 = 0.5 and 𝑟 = 0.75. In Table 3, in columns A–G, the error is
computed according to the following expression:
𝑒𝑟𝑟𝑜𝑟 = |𝐵𝐶𝑇𝑒𝑥𝑝 − 𝐵𝐶𝑇𝑒𝑠𝑡
𝐵𝐶𝑇𝑒𝑥𝑝 ∙ 100%| (39)
where 𝐵𝐶𝑇𝑒𝑥𝑝 is an experimental average value of the box compression strength for a particular box
and 𝐵𝐶𝑇𝑒𝑠𝑡 is its counterpart estimated by approaches A–G. Asterix (*) is used to mark the best
solution in a row (lowest error); approach B has the largest number of best solutions (four out of 12
box designs). The mean errors obtained for cases A–C are lower than 8%, while for cases D–G the
errors are about 11% and more.
Figure 3. Box compression strength of simple flap boxes with different heights: 150 mm, 250 mm and
450 mm (for cases A–E 𝑘 = 0.5 and 𝑟 = 0.75; for case F �� = 2.028 and 𝑟 = 0.746; for case G �� = 5.874 and
𝑟 = 0.746).
Table 3. Experimental data (dimensions and box compression strength) and computational errors
according to different analytical approaches (see Table 1) for 3B400 cardboard quality; for cases A–E
𝑘 = 0.5 and r = 0.75; for case F �� = 2.028 and r = 0.746; for case G �� = 5.874 and 𝑟 = 0.746.
No. b
[mm]
c
[mm]
a
[mm]
BCT ± 𝝈
[N]
A
[%]
B
[%]
C
[%]
D
[%]
E
[%]
F
[%]
G
[%]
1. 250 250 150 1893 ± 10.9 9.5 8.4 15.6 8.6 6.4 * 14.8 9.5
2. 200 300 150 1905 ± 13.2 0.7 0.3 * 6.3 7.9 5.7 15.4 10.1
3. 150 350 150 1786 ± 33.7 3.5 2.4 * 9.2 15.1 12.7 9.7 4.1
4. 100 400 150 1533 ± 9.80 18.1 16.6 25.9 33.7 31.0 4.9 * 11.4
5. 250 250 250 2078 ± 17.2 3.1 3.9 1.1 * 1.1 * 3.1 22.4 17.6
6. 200 300 250 1978 ± 18.7 6.6 7.5 4.2 3.9 1.8 * 18.5 13.4
7. 150 350 250 1859 ± 9.90 8.4 9.3 4.5 * 10.6 8.3 13.3 7.9
8. 100 400 250 1537 ± 29.5 5.2 4.0 * 10.5 33.7 31.0 4.9 11.4
9. 250 250 450 1996 ± 76.7 0.3 * 0.5 3.3 3.0 0.9 19.2 14.2
10. 200 300 450 1863 ± 45.3 1.5 * 2.3 2.1 10.3 8.1 13.5 8.1
11. 150 350 450 1869 ± 48.6 7.9 8.8 6.0 * 10.0 7.7 13.7 8.4
12. 100 400 450 1520 ± 41.0 5.7 4.5 * 7.3 35.2 32.5 6.1 12.7
mean [%]: 5.87 5.71 * 7.99 14.4 12.4 13.0 10.7
* Denotes the lowest value in the row. a, b, and c—box dimensions, i.e., height, width, and length,
respectively, BCT ± 𝜎—measured values from box compression test with standard deviation, and A–
G—see Table 1.
Figure 3. Box compression strength of simple flap boxes with different heights: 150 mm, 250 mm and450 mm (for cases A–E k = 0.5 and r = 0.75; for case F k = 2.028 and r = 0.746; for case G k = 5.874 andr = 0.746).
The following observations can be made based on the laboratory tests of boxes of different sizes.For boxes with a height of 150 mm, the change in strength was about 19% (1893 N for 250× 250 mm vs.1533 N for 400× 100 mm). For boxes with a height of 250 mm, the change increased to 26% (2078 N for250× 250 mm vs. 1537 N for 400× 100 mm). The change was 24% for boxes with a height of 450 mm(1996 N for 250× 250 mm vs. 1520 N for 400× 100 mm).

Materials 2020, 13, 4578 10 of 15
Table 3. Experimental data (dimensions and box compression strength) and computational errorsaccording to different analytical approaches (see Table 1) for 3B400 cardboard quality; for cases A–Ek = 0.5 and r = 0.75; for case F k = 2.028 and r = 0.746; for case G k = 5.874 and r = 0.746.
No. b[mm]
c[mm]
a[mm] BCT ± σ [N] A
[%]B
[%]C
[%]D
[%]E
[%]F
[%]G
[%]
1. 250 250 150 1893 ± 10.9 9.5 8.4 15.6 8.6 6.4 * 14.8 9.52. 200 300 150 1905 ± 13.2 0.7 0.3 * 6.3 7.9 5.7 15.4 10.13. 150 350 150 1786 ± 33.7 3.5 2.4 * 9.2 15.1 12.7 9.7 4.14. 100 400 150 1533 ± 9.80 18.1 16.6 25.9 33.7 31.0 4.9 * 11.45. 250 250 250 2078 ± 17.2 3.1 3.9 1.1 * 1.1 * 3.1 22.4 17.66. 200 300 250 1978 ± 18.7 6.6 7.5 4.2 3.9 1.8 * 18.5 13.47. 150 350 250 1859 ± 9.90 8.4 9.3 4.5 * 10.6 8.3 13.3 7.98. 100 400 250 1537 ± 29.5 5.2 4.0 * 10.5 33.7 31.0 4.9 11.49. 250 250 450 1996 ± 76.7 0.3 * 0.5 3.3 3.0 0.9 19.2 14.210. 200 300 450 1863 ± 45.3 1.5 * 2.3 2.1 10.3 8.1 13.5 8.111. 150 350 450 1869 ± 48.6 7.9 8.8 6.0 * 10.0 7.7 13.7 8.412. 100 400 450 1520 ± 41.0 5.7 4.5 * 7.3 35.2 32.5 6.1 12.7
mean [%]: 5.87 5.71 * 7.99 14.4 12.4 13.0 10.7
* Denotes the lowest value in the row. a, b, and c—box dimensions, i.e., height, width, and length, respectively,BCT ± σ—measured values from box compression test with standard deviation, and A–G—see Table 1.
3.2. Reduction of the Estimation Error—Optimal Parameters
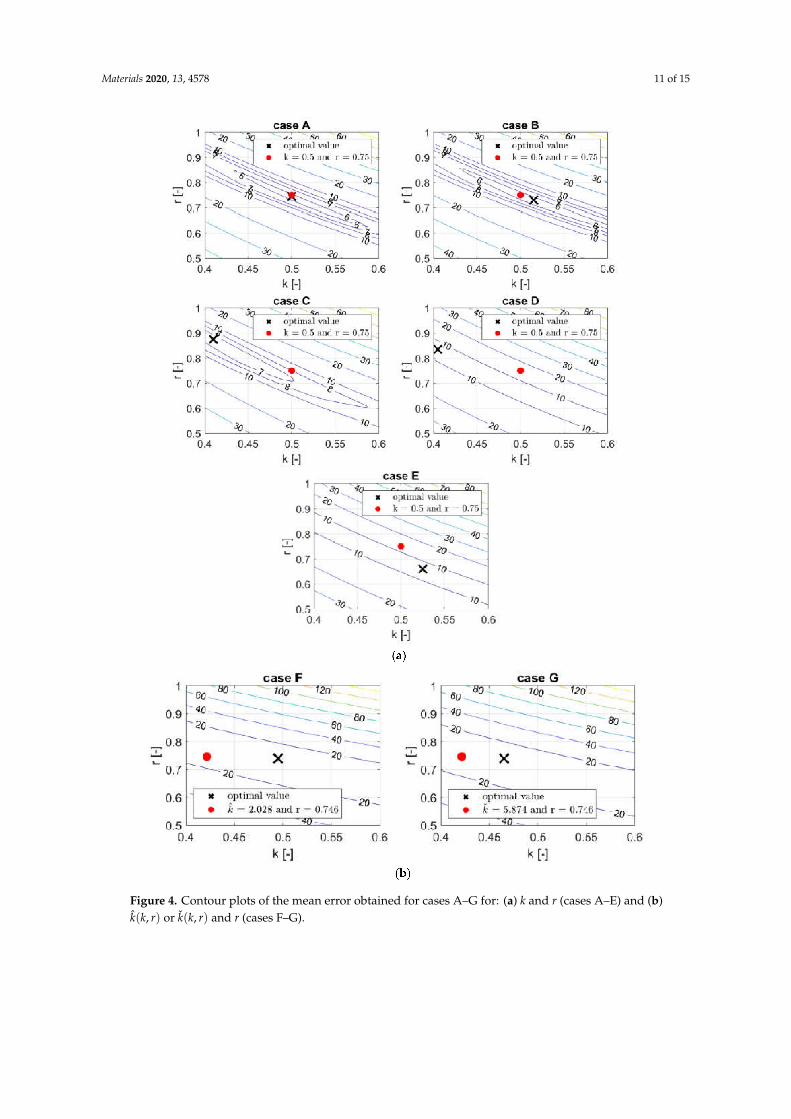
In order to verify how much the estimation error depends on the constants (k, r) assumed inthe analytical approaches (see Table 1), computations for different sets of constants were performed.For approaches A–E, the values of k and r (see Equation (28)) were modified, and for approaches F–G,the values of r and k(k, r) or k(k, r) (see Equations (32)–(35)) were modified. It should be noted thattypical literature values of k and r are 0.50 and 0.75, respectively (see Equation (38)). Consequently,the typical literature values of k and r in case F are 2.028 and 0.746, respectively, and in case G, k and rare 5.874 and 0.746, respectively. The mean errors obtained by systematic computations are presentedby contour plots in Figure 4a for cases A–E and in Figure 4b for cases F–G. The values were computedby averaging the magnitudes from Equation (39) for 12 box designs. The interval of k was assumed tobe from 0.4 to 0.6, and for r it was assumed to be from 0.5 to 1.0.
Table 4 presents the lowest computed errors of cases A–G and the corresponding optimalparameters. The values of k, r, k(k, r) and k(k, r) (see Equations (32) and (36)) are optimal solutionsobtained by the systematic search in the k− r space (see Figure 4). The lowest errors are obtained byapproaches A and B, with errors lower than 6%. Furthermore, it may be observed that the optimalvalues of constants for approaches D–G reach the limit of 8.04%. Note that in Figure 4 all surfaces havea characteristic valley, in which optimal values could be obtained for different pairs of parameters kand r. In cases A–C, the valley is limited to a smaller area, while for D–F optimal areas exist for thewhole range of analyzed parameters. For comparison, Table 5 presents the errors obtained while usingtypical values of constants, taken from the literature.
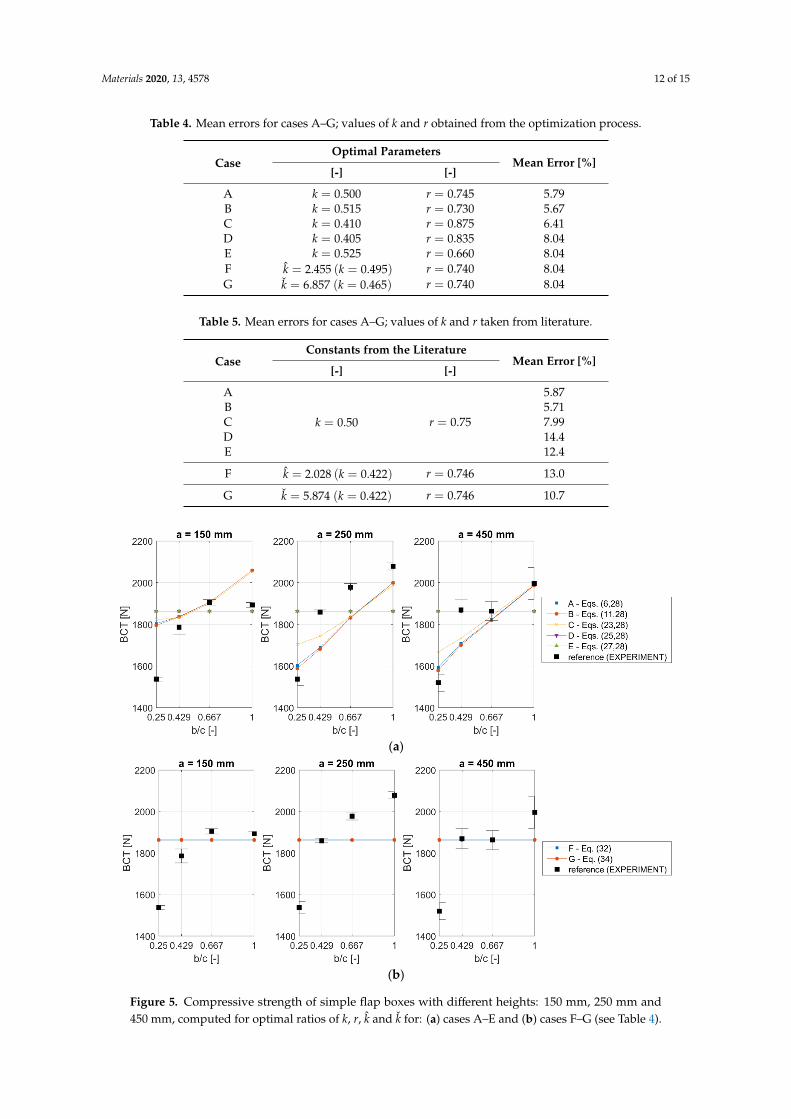
Having the typical literature and optimal values of the parameters (k, r, k and k) (see Tables 4 and 5),the analytical solutions for particular analytical approaches may be revalidated for the considered12 box designs. The results are presented in Figure 5a for cases A–E and in Figure 5b for cases F–G.As expected, in cases D–G, the same value was obtained for each design, while cases A–C reproducedthe experimental trends. Cases A and B are close to each other, while case C differs from them for boxdesigns with low b/c values (0.25 and 0.429).
Materials 2020, 13, 4578 11 of 15
Figure 4. Contour plots of the mean error obtained for cases A–G for: (a) k and r (cases A–E) and (b)k(k, r) or k(k, r) and r (cases F–G).
Materials 2020, 13, 4578 12 of 15
Table 4. Mean errors for cases A–G; values of k and r obtained from the optimization process.
CaseOptimal Parameters
Mean Error [%][-] [-]
A k = 0.500 r = 0.745 5.79B k = 0.515 r = 0.730 5.67C k = 0.410 r = 0.875 6.41D k = 0.405 r = 0.835 8.04E k = 0.525 r = 0.660 8.04F k = 2.455 (k = 0.495) r = 0.740 8.04G k = 6.857 (k = 0.465) r = 0.740 8.04
Table 5. Mean errors for cases A–G; values of k and r taken from literature.
CaseConstants from the Literature
Mean Error [%][-] [-]
A
k = 0.50 r = 0.75
5.87B 5.71C 7.99D 14.4E 12.4
F k = 2.028 (k = 0.422) r = 0.746 13.0
G k = 5.874 (k = 0.422) r = 0.746 10.7
Materials 2020, 13, x FOR PEER REVIEW 12 of 15
reproduced the experimental trends. Cases A and B are close to each other, while case C differs from
them for box designs with low 𝑏/𝑐 values (0.25 and 0.429).
(a)
(b)
Figure 5. Compressive strength of simple flap boxes with different heights: 150 mm, 250 mm and 450
mm, computed for optimal ratios of 𝑘, 𝑟, �� and �� for: (a) cases A–E and (b) cases F–G (see Table 4).
4. Discussion
In this research study, all boxes had the same in-plane circumferences, i.e., 1000 mm (see Table
3 (𝑎, 𝑏 and 𝑐 columns)). This feature gives exactly the same value for the BCT estimate according to
McKee’s formula (approaches F–G) and in cases with simplified buckling (D–E), where the buckling
panel is assumed to be square (see Figures 3 and 5). On the contrary, the test results presented in
Figures 2 and 3 (black squares) clearly show that the BCT values obtained experimentally differed
across various boxes. These differences are essential, and in selected cases, as described above, they
vary from 19% to 26%. In Figure 3, as expected, the results for cases D–G have the same values; those
analytical solutions are not sensitive to the 𝑏 𝑐⁄ change. Those solutions are sensitive both to different
in-plane shapes and to the height of the box, if the circumference is constant (𝑍 = 𝑐𝑜𝑛𝑠𝑡). Notice that
cases A–C present a correct result in line with the experimental results, namely, the computational
results are sensitive to 𝑏 𝑐⁄ change, as compared with the black squares in Figure 3.
The correction factors discussed in Section 2 may be optimally selected, or typical (literature)
values may be used. As shown in Section 3, their values influence the error, as can be seen in Tables
4 and 5. While comparing Figures 3 and 5 and inspecting Tables 4 and 5, it may be noted that the
typical constants of 𝑘 and 𝑟 for approaches A–B give a very good accuracy (compared to the optimal
values). On the other hand, as shown, the typical constants used in the McKee formulas (F–G
approaches) may be modified to get a higher accuracy for the boxes made of 3B400 cardboard quality.
However, the improvement does not give a lower error than the A–B approach (~5.8% vs. ~8%, see
Tables 4 and 5). Note that, in Figure 5, only approaches A–C tend to follow the trend of the
Figure 5. Compressive strength of simple flap boxes with different heights: 150 mm, 250 mm and450 mm, computed for optimal ratios of k, r, k and k for: (a) cases A–E and (b) cases F–G (see Table 4).

Materials 2020, 13, 4578 13 of 15
4. Discussion
In this research study, all boxes had the same in-plane circumferences, i.e., 1000 mm (see Table 3 (a,b and c columns)). This feature gives exactly the same value for the BCT estimate according to McKee’sformula (approaches F–G) and in cases with simplified buckling (D–E), where the buckling panel isassumed to be square (see Figures 3 and 5). On the contrary, the test results presented in Figures 2and 3 (black squares) clearly show that the BCT values obtained experimentally differed across variousboxes. These differences are essential, and in selected cases, as described above, they vary from 19% to26%. In Figure 3, as expected, the results for cases D–G have the same values; those analytical solutionsare not sensitive to the b/c change. Those solutions are sensitive both to different in-plane shapes andto the height of the box, if the circumference is constant (Z = const). Notice that cases A–C present acorrect result in line with the experimental results, namely, the computational results are sensitive tob/c change, as compared with the black squares in Figure 3.
The correction factors discussed in Section 2 may be optimally selected, or typical (literature)values may be used. As shown in Section 3, their values influence the error, as can be seen in Tables 4and 5. While comparing Figures 3 and 5 and inspecting Tables 4 and 5, it may be noted that the typicalconstants of k and r for approaches A–B give a very good accuracy (compared to the optimal values).On the other hand, as shown, the typical constants used in the McKee formulas (F–G approaches)may be modified to get a higher accuracy for the boxes made of 3B400 cardboard quality. However,the improvement does not give a lower error than the A–B approach (~5.8% vs. ~8%, see Tables 4and 5). Note that, in Figure 5, only approaches A–C tend to follow the trend of the experimental results(black squares) and that in other cases the values of the predicted compressive strength are equal toeach other (see D–E in Figure 5a and F–G in Figure 5b).
In this study, the difference between the calculated critical load without (case A) and withtransversal shear effects (case B) is not very apparent (see Table 2 and Figure 3 or Figure 5). This isbecause, in our specific case, the corrugated cardboard (wave B, grammage 400 g/m2) is not printed,so the impact of crushing on the material parameters is negligible. In the case of printed, and thuscrushed, corrugated cardboard, both the transverse stiffness and the effective thickness are smaller,so the differences are also greater.
Given these results, the conclusion can be drawn that the most detailed buckling approach (seeEquation (11)—case B) has the highest accuracy compared to other approaches, including McKee’slong and short formula. Unfortunately, the potential for using detailed buckling in packaging designremains unexplored.
Future studies will be devoted to selected aspects of more advanced approaches to modeling thetop-to-bottom strength of the corrugated cardboard boxes considered here, among others a strengthdecrease of boxes due to an unintentional crushing during material converting.
5. Conclusions
This paper presented a detailed analysis of both simplified and advanced methods used forestimating the compressive strength of flap boxes made of corrugated cardboard. The purpose of thework was to evaluate the applicability of these methods and to determine the value of the estimationerror resulting from the use of various simplifications. This study focused on the description of thecritical buckling load, which is one of the two main components determining the load capacity ofcorrugated cardboard packaging. The paper also compared the McKee estimation method, proposedin the 60s, with modern ways of predicting the compressive strength of boxes (see Table 3).
The results showed that, for certain packaging dimension proportions, the simplified descriptionof the critical load used in the selected formulas gave estimation errors at a level of 8–15%, as seenin Table 5. On the contrary, the estimation errors for the most precise approach, when orthotropy,aspect ratio and transverse shearing stiffness were included, gave a mean estimation error of about6%, as seen in Tables 4 and 5. The use of more precise formulas requires more laboratory tests oncorrugated cardboard but in return provides more accurate results than the McKee-type formulas do.

Materials 2020, 13, 4578 14 of 15
Author Contributions: T.G. (Tomasz Garbowski): conceptualization, methodology, software, writing—originaldraft, writing—review & editing, supervision, project administration, Funding acquisition; T.G. (TomaszGajewski): software, validation, formal analysis, investigation, writing—original draft, writing—review &editing, visualization; J.K.G.: writing—original Draft, writing—review & editing, data curation, supervision,funding acquisition. All authors have read and agreed to the published version of the manuscript.
Funding: The APC was funded by the Ministry of Science and Higher Education, Poland, grant at PoznanUniversity of Technology, grant number 0411/SBAD/0001.
Acknowledgments: Special thanks to the FEMAT company (www.fematsystems.pl) for the financial supportof this research project. The authors also thank AQUILA VPK Wrzesnia for providing samples of corrugatedcardboard for the study.
Conflicts of Interest: The authors declare no conflict of interest.
References
1. Biancolini, M.E.; Brutti, C.; Porziani, S. Corrugated board containers design methods. In Proceedings of theAssociazione Italiana per l’Analisi delle Sollecitazioni (AIAS) XXXVI Convegno Nazionale 2007, Naples,Italy, 4–8 September 2007.
2. Han, J.; Park, J.M. Finite element analysis of vent/hand hole designs for corrugated fibreboard boxes.Packag. Technol. Sci. 2007, 20, 39–47. [CrossRef]
3. Garbowski, T.; Jarmuszczak, M. Numerical strength estimate of corrugated board packages. Part 1.Theoretical assumptions in numerical modeling of paperboard packages. Pol. Pap. Rev. 2014, 70, 219–222.(In Polish)
4. Garbowski, T.; Jarmuszczak, M. Numerical strength estimate of corrugated board packages. Part 2.Experimental tests and numerical analysis of paperboard packages. Pol. Pap. Rev. 2014, 70, 277–281.(In Polish)
5. Hohe, J. A direct homogenization approach for determination of the stiffness matrix for microheterogeneousplates with application to sandwich panels. Compos. Part B 2003, 34, 615–626. [CrossRef]
6. Buannic, N.; Cartraud, P.; Quesnel, T. Homogenization of corrugated core sandwich panels. Comp. Struct.2003, 59, 299–312. [CrossRef]
7. Biancolini, M.E. Evaluation of equivalent stiffness properties of corrugated board. Compos. Struct. 2005, 69,322–328. [CrossRef]
8. Abbès, B.; Guo, Y.Q. Analytic homogenization for torsion of orthotropic sandwich plates: Application.Compos. Struct. 2010, 92, 699–706. [CrossRef]
9. Marek, A.; Garbowski, T. Homogenization of sandwich panels. Comput. Assist. Methods Eng. Sci. 2015, 22,39–50.
10. Garbowski, T.; Jarmuszczak, M. Homogenization of corrugated paperboard. Part 1. Analyticalhomogenization. Pol. Pap. Rev. 2014, 70, 345–349. (In Polish)
11. Garbowski, T.; Jarmuszczak, M. Homogenization of corrugated paperboard. Part 2. Numericalhomogenization. Pol. Pap. Rev. 2014, 70, 390–394. (In Polish)
12. McKee, R.C.; Gander, J.W.; Wachuta, J.R. Compression strength formula for corrugated boxes. PaperboardPackag. 1963, 48, 149–159.
13. Buchanan, J.S.; Draper, J.; Teague, G.W. Combined board characteristics that determine box performance.Paperboard Packag. 1964, 49, 74–85.
14. Shick, P.E.; Chari, N.C.S. Top-to-bottom compression for double wall corrugated boxes. Tappi J. 1965, 48,423–430.
15. Wolf, M. New equation helps pin down box specifications. Package Eng. 1972, 17, 66–67.16. Kellicutt, K.; Landt, E. Development of design data for corrugated fiberboard shipping containers. Tappi J.
1952, 35, 398–402.17. Maltenfort, G. Compression strength of corrugated containers. Fibre Contain. 1956, 41, 106–121.18. Whitsitt, W.J.; Gander, J.W.; McKee, R.C. Effect of Box Dimensions and Combined Board Creep Life on Box Creep
Life; Institute of Paper Chemistry: Appleton, WI, USA, 1968.19. Allerby, I.M.; Laing, G.N.; Cardwell, R.D. Compressive strength—From components to corrugated containers.
Appita Conf. Notes 1985, 1–11, Unpublished work.
Materials 2020, 13, 4578 15 of 15
20. Schrampfer, K.E.; Whitsitt, W.J.; Baum, G.A. Combined Board Edge Crush (ECT) Technology; Institute of PaperChemistry: Appleton, WI, USA, 1987.
21. Kawanishi, K. Estimation of the compression strength of corrugated fibreboard boxes and its application tobox design using a personal computer. Packag. Technol. Sci. 1989, 2, 29–39. [CrossRef]
22. Batelka, J.J.; Smith, C.N. Package Compression Model; Institute of Paper Science and Technology: Atlanta, GA,USA, 1993.
23. Urbanik, T.J.; Frank, B. Box compression analysis of world-wide data spanning 46 years. Wood Fiber Sci. 2006,38, 399–416.
24. Nordstrand, T. Basic Testing and Strength Design of Corrugated Board and Containers. Ph.D. Thesis,Lund University, Lund, Sweden, 2003.
25. Nordstrand, T.; Carlsson, L. Evaluation of transverse shear stiffness of structural core sandwich plates.Compos. Struct. 1997, 37, 145–153. [CrossRef]
26. Urbanik, T.J.; Saliklis, E.P. Finite element corroboration of buckling phenomena observed in corrugatedboxes. Wood Fiber Sci. 2003, 35, 322–333.
27. Sohrabpour, V.; Hellström, D. Models and software for corrugated board and box design. In Proceedings of the18th International Conference on Engineering Design (ICED 11), Copenhagen, Denmark, 15–18 October 2011.
28. Heimerl, G.J. Determination of plate compressive strengths. In National Advisory Committee for Aeronautics;Technical Note Number 1480; National Advisory Committee for Aeronautics (NACA): Kitty Hawk, NC,USA, 1947.
29. FEMat Systems. Available online: http://www.fematsystems.pl/en/systems/bct/ (accessed on 26 March 2020).30. Ventsel, E.; Krauthammer, T. Thin Plates and Shells. Theory, Analysis, and Applications; Marcel Dekker, Inc.:
New York, NY, USA; Basel, Switzerland, 2001.31. Norstrand, T. On buckling loads for edge-loaded orthotropic plates including transverse shear. Compos.
Struct. 2004, 65, 1–6. [CrossRef]32. Wang, C.M.; Wang, C.Y.; Reddy, J.N. Exact Solutions for Buckling of Structural Members; CRC Press: Boca Ratton,
FL, USA, 2005.33. Carlsson, L.A.; Nordstrand, T.; Westerlind, B. On the elastic stiffnesses of corrugated core sandwich. J. Sandw.
Struct. Mater. 2001, 3, 253–267. [CrossRef]34. Garbowski, T.; Gajewski, T.; Grabski, J.K. Role of transverse shear modulus in the performance of corrugated
materials. Materials 2020, 13, 3791. [CrossRef] [PubMed]35. Nguyen, H.N.; Hong, T.T.; Vinh, P.V.; Quang, N.D.; Thom, D.V. A refined simple first-order shear deformation
theory for static bending and free vibration analysis of advanced composite plates. Materials 2019, 12, 25.[CrossRef]
Publisher’s Note: MDPI stays neutral with regard to jurisdictional claims in published maps and institutionalaffiliations.
© 2020 by the authors. Licensee MDPI, Basel, Switzerland. This article is an open accessarticle distributed under the terms and conditions of the Creative Commons Attribution(CC BY) license (http://creativecommons.org/licenses/by/4.0/).