the rochester institute of technology department of communication
TRANSCRIPT

THE ROCHESTER INSTITUTE OF TECHNOLOGY
DEPARTMENT OF COMMUNICATION
2003-2009 TRAVEL & LEISURE ADVERTISEMENTS: A CONTENT ANALYSIS OF
TRAVEL GROUPS AND GENDER
By
SHERRY HOAG
A Paper submitted
In partial fulfillment of the
Bachelor of Science degree
In Advertising & Public Relations
Degree Awarded:
Summer Quarter, 2010

Content Analysis of Travel Groups and Gender 2
The members of the Committee approve the thesis of Sherry Hoag presented on February 12,
2010.
Bruce Austin
Professor Directing Thesis
Ki-Young Lee
Thesis Advisor
Bruce Austin
Department Chair

Content Analysis of Travel Groups and Gender 3
Table of Contents
Page
Introduction 5
Research Question 7
Rationale 8
Review of Literature 10
Methods 15
Results 17
Discussion 22
Appendix A 29
Appendix B 33
Appendix C 35

Content Analysis of Travel Groups and Gender 4
2003-2009 TRAVEL & LEISURE ADVERTISEMENTS: A CONTENT ANALYSIS OF
TRAVEL GROUPS AND GENDER
Name: Sherry L. Hoag
Department: Communications
Professor: Dr. Bruce A. Austin
Degree: Advertising & Public Relations
Term Degree Awarded: Summer 20093
Travel is an industry that forecasts earnings in the billions of dollars. The media that
support this lucrative industry is in business to sell travel to very specific consumer markets that
can be grouped together in subcategories. Niche marketing caters to groups that have developed
in recent years that never before were considered a group of its own. One of these groups is
women who are interested in traveling for leisure and tourism alone. A content analysis of 2003-
2009 Travel & Leisure magazine advertisements was utilized in this study to lend focus and
support to future communication studies. These studies may center on cultivation theory and uses
and gratification theories to determine effect and effectiveness of communication messages
aimed at this unique, narrow and ―fascinating‖ market.
Content Analysis of Travel Groups and Gender 5
The online publication of AOL News reported on February 9, 2009, that a young
American woman was killed while jogging alone in San Juan, Puerto Rico. The woman was a
chef onboard a yacht cruising for months at a time in the Caribbean. For recreation while off the
yacht, the woman was in the habit of taking jogs alone. It was pointed out in the report that she
regularly went into undesirable neighborhoods. The killer, someone she did not know, saw her,
grabbed her and packed her into the trunk of his car later killing her. Obviously, societal and
cultural norms tell us that running alone in foreign countries, especially bad neighborhoods, is
unwise.
Leisure travel alone is regarded a trend in the travel industry as seen by January 2010
industry promotional material sent out to travel agents in Rochester, New York, by Norwegian
Cruise Line. They advised travel agents that the latest ship in their fleet, the Norwegian Epic, has
a ―completely new concept‖ which is specifically designed for independent travelers who like to
travel on their own. ―Freestyle Cruising gives solo travelers more freedom of choice than ever
before,‖ is a line from the body copy. The indication is the new concept will sell based on
receptiveness of a target market of single travelers.
Women traveling as tourists alone is a social phenomena which has been called
―fascinating‖ (Salamone, 2009), and could signal a change in social attitudes toward traveling
alone. I suggest that media messages crafted in support of these changes and ―innovations‖ in
response give consideration understanding the possibilities of encouraging women to travel alone
based on perceived social acceptability—acceptability that is learned through media
consumption.

Content Analysis of Travel Groups and Gender 6
Traditionally in American culture women highly regard safety as a decision making issue
and often do not practice leisure travel alone. There is a negative connotation attached. To travel
alone, if not necessary, seems like an act of defiance or desperation. In other cultures risk is not
the biggest concern. Women in China, for instance, consider traveling alone an empowering act
that leads to self-actualization (as in Maslow‘s Hierarchy of Needs) and are admiringly called
―bold‖ (Kit-wai, 2008). That is not to say they are careless, this is merely a different perspective
on traveling alone.
Despite this cultural difference, secondary media sources quoting a 2001 US Census
Bureau Report say that 28 million U.S. women age 35 and older do not have a husband and 40%
of this number will travel alone. Additionally, there were 19.5 million U.S. travelers who in 1999
visited foreign places. Out of this number nine million were women, 35% traveled alone, and
were of the average age of 43 (Asberry, 2009). In March, of 2009, the Boston Globe ran an
article online saying that more than half of leisure travelers are women and that 22% took a solo
travel trip. The article gives advice on how to travel alone with a heading entitled the ―world can
be your oyster, too‖ (Bodnarchuk, 2009). Another article, found April, 2009 on enduring
Wanderlust Web site, explicitly encourages women to travel alone for leisure (Salamone, 2009).
A study of how gender is reflected in media may provide additional data for cultivation
analysis theory. It also may provide an additional source of relevant information regarding a
narrow and specifically targeted group (women who travel alone). Research could provide
support to media use studies that are looking for patterns. Based on uses and gratifications theory
questions may be answered about how effective the messages are and just as importantly what

Content Analysis of Travel Groups and Gender 7
effect they are having. What gratifications are sought in media and what gratifications are
obtained is a basis of empirical study that requires measurements (McQuail, 1987). Research
may also suggest whether media are cultivating a trend or if they are reflecting a trend. How this
niche market of travelers can best be represented would certainly be a worthwhile outcome.
Research Question
The initial response is to ask how the representation of gender found in travel magazine
advertisements relates to statistical data representing the real numbers of people who travel
alone, or otherwise. Do travel and tourism advertisements reflect the social trend? After not
finding any studies focused on cultivation analysis with the topic being females who travel alone
for leisure. I decided to investigate Travel & Leisure magazine advertisements for specific
content data.
The first question posed concerns how advertisements in Travel & Leisure magazine
group tourist/travelers most often. Is there a difference between the number of times females are
shown traveling alone and times males are shown traveling alone in Travel & Leisure
advertisements? Do these depictions differ from the statistics that can be found on persons who
travel? These questions lead to the following hypotheses:
H1: The true proportion of males and females depicted in 2003-2009 Travel & Leisure
magazine advertisements and statistics reported by the Office of Travel & Tourism
Industries/International Trade Administration are not the same.
H2: The true proportion of travel groups found in 2003 – 2009 Travel & Leisure
magazine advertisements and the Office of Travel & Tourism Industries/International Trade
Administration are not the same.
Content Analysis of Travel Groups and Gender 8
Rationale
Even though, historically, it was considered taboo and socially unacceptable for females
to travel alone, things have obviously changed. A distinct niche market that consists of women
only travelers has emerged. With this trend certain companies and media have become dedicated
solely to catering and advising women on travel and tourism. That‘s not all; niche travel
companies for singles have seen women traveling singly as the largest majority of their
consumers (Singles Women Only, 2006).
It was stated in an investigative report entitled Singles and Travel ‒US ‒March 2006
(Mintel Oxygen online database) that the trend in women only travel has been ―propelled by
organizations, agencies, books, and Web sites focused on female only travel.‖ The report also
says that cable Travel Channel programs, magazines and Web sites have significantly changed
the travel industry adding niche sectors. Further, they found that ―34% of singles turned to travel
magazines for destination ideas at least some of the time‖ (Singles and Travel, 2006, Travel TV
network section, para. 1). This suggests that media may be influential in the dissemination of
information leading to an increase in niche travel media markets like solo women.
Media in the forms of travel related broadcast television programming such as Samantha
Brown and Anthony Bourdain, No Reservations and leading travel magazines Conde Nast and
Travel & Leisure are major sources of information that meet the specific needs of travel
consumers. Further, influences such as transportation add to the effects of these media.
Transportation especially relates to television viewing and creates an effect on the viewer of
―being there and the reality of the program seems even more real than the ―actual world‖
(Bilandzic, 2006, p. 337). Glossy magazines full of travel pictures could have this effect as well.

Content Analysis of Travel Groups and Gender 9
Kenneth Burke stated that ―persuasion [is] really the artful use of the resources of
ambiguity‖ (cited in Larson, 2007, p. 13). Based on the premise of identification, used by
advertisers in creating messages for target audiences, a persuader and a persuadee will share
similarities. The travel industry offers experiences that embody adventure, spiritualism and
emotional gratification especially to niche markets looking for excitement.
Through media women are very well aware of the opportunities, amenities and
experiences to be had (Jauneaud, 2008). Young women travel alone as freely, and are as invested
in seeking adventure, as their male counterparts always have been. A recently written article by a
woman found in Australia‘s Sunday Telegraph entitled, Take Care When Going it Alone, gives
specific advice to women on traveling alone. The author states she has ―long been aware of the
pros and cons of travel alone.‖ She further tells readers ―70% of backpackers travel alone,
around 50% are females and it‘s predicted that the strongest growth sector for travel will be
single women…‖ (Macmillan, 2008, p. 2).
On a personal note interest in the study began after preparing for and taking a solo travel
trip to the Galapagos Islands in 2007. As I researched information before traveling I found some
helpful advice on being female and traveling alone in foreign countries. After the trip, I observed
a substantial increase in images of women traveling alone on broadcast media and found many
print articles with specific travel advice to women traveling alone. I believe the travel industry
needs to know how to address the emerging market of solo travelers, truly whether male or
female, with clear understanding, and in an ethical manner, considering that risk is a part of the
sales pitch.

Content Analysis of Travel Groups and Gender 10
Review of Literature
―Tourism involves processes that are ‗complex and varied,‘ and are also, ‗often hierarchal
and usually unequal‘ (Kinnaird & Hall, 1996, p. 95).‖ It is pointed out in the reviewed literature
that women become the target for travel industry advertising and travel-related media. As they
become central figures in various travel contexts this creates a need for gender-awareness in the
construction of implicating messages (Kinnaird & Hall, 1996).
Scholars believe, based on the cultivation analysis studies of George Gerbner, that media
and advertisements not only reflect society but also influence it (Gerbner, 1998, Bowen, 1996).
Communication researchers would therefore agree that consumers of travel-related print media,
as well as viewers of broadcast advertising and travel-related programming messages, will form
perceptions of travel as a result of their media use. The construction of media programming and
advertisements is done with intention and knowledge of the audience and encoded messages are
directed at specific target audiences.
While travel media may represent travel in a prescribed manner, the representations
found in media may reflect reality, or not. The social reality is women, who take travel trips
alone and plan to visit local culture, must judiciously prepare for the inherent risks they face as
solo female travelers. The Department of State is often recommended as a comprehensive and
reliable source of information for travel information offering safety and other precaution advice.
Studies found involving the topic of communication in tourism were concerned with issues of
risk messaging. How tourism media represent reality, and if they are able to prepare travelers for
meaningful cultural exchange, is a question posed and researched. One study showed that the
reliability of media sources to prepare for trips involving cultural exchange is questionable

Content Analysis of Travel Groups and Gender 11
because editorializing limits the effectiveness of the media sources. Researchers concluded that
the gatekeeper will impose limitations based on a bias for what is relevant to travelers, and what
is not. The media source variable in this research was guidebooks. They were found to be limited
and not true purveyors of real cultural experience. Guidebooks carry a level of expectancy, of
relevant information to be used in travel. This is what users think they will get from them, when
in fact they may only get a symbolic representation of travel to throw in their suitcase (Thurlow
& Jaworski, 2007).
News sources also are suspect for true preparation and may act as a source of promotion.
The enterprising aspect of broadcast news creates a tendency to over and/or under report world
events making it difficult to know whether it actually portrays what is ―real.‖ These issues,
media agenda say in related studies, make the reliability of these sources to provide reality
questionable (Severin & Tankard, 1992).
There are consequences for misinterpretation of the real world. One study determined
how lack of knowledge of the real world situation, and/or fear of engaging the culturally
unknown, leads women to less than satisfying travel experiences. They may behave in a manner
which both stifles a natural curiosity and the desire to have a cultural experience in the travel
destination place, or lead to risky behavior (Sobre, 2007). Individuals have different perspectives
of what is risk or risky; what they deem acceptable and not acceptable in cultural exchange; and
what they find to be gratifying experiences. Some perceive financial risk as relevant while others
are concerned about physical dangers when thinking of risk. Whatever the source of the
perceived risk, images are formed as a result of information gathering resulting in behavior.

Content Analysis of Travel Groups and Gender 12
In another study researchers questioned what effect individual perceptions of risks and
safety have on a travel decision (Sonmez & Graefe, 1998). They examined psychophysical
judgments and value judgments as part of the decision making process of tourists. The
information integration theory and protection motivation theory provided a framework for this
study. N. H. Anderson, (1981, 1982) (as cited in Sonmez & Graefe, 1998) proposed ―that
individuals form psychophysical and value judgments according to complex decision-making
steps (i.e., need awareness, information search, choice) (Sonmez & Graefe, 1998, p. 172).‖
Psychophysical and value judgments are components of information integration where
psychophysical judgments refer to decisions that tourists reach based on personal knowledge
such as might be gained through physical images portrayed in media.
Value judgments are an overall assessment that is based on personal experience or
knowledge. Primary sources such as friends, family or colleagues, in addition to secondary
source information gleaned from perhaps State Department, newspapers or other media coverage
on crime reported, natural disaster, terrorist activity, or political upheaval provide the judgment
value. The source of perceived risk is examined by Sonmez and Graefe, (1998), who state that
―travel experience and risk perceptions influence future travel behavior (p. 175).‖ These
researchers conclude that travelers‘ own perceptions are most relevant and that further
investigation is needed to determine how these perceptions develop (Sonmez & Graefe, 1998).
Another argument made by Kinnaird and Hall, (1996) in a study on tourism development
and tourism-related activity states that tourism can, and should be, analyzed through a gender-
aware framework. They believe gender plays an informing role in the construction of tourism.
They say that ―tourism involves processes which are constructed out of complex and varied

Content Analysis of Travel Groups and Gender 13
social realities and relations that are often hierarchal and usually unequal. Gender relations are
one element of this complex (Kinnaird & Hall, 1996, p. 95).‖
The trend for women to travel alone creates a social construct where, as Kinnaird and
Hall, (1996) argue: ―tourism‘s identification as an industry based on the economic, political or
social power relations between nations or groups of people represents an extension of the politics
of gender relations.‖ Therefore, they believe it is prudent for research to focus on ―the dynamics
of gender relations in both host and guest societies (Kinnaird & Hall, 1996, p. 95). In conclusion
to their review of existing tourism research literature, they suggest discussion is necessary
regarding gender effects because it has specific impact on touristic practices and politics
beginning with the development processes. They focus particularly on gender effects on host and
origination culture. This study points out that when journalistic media report on gender tourism,
with results of experimental studies from social scientists, and government statistics, the article
carries the weight of ethics.
―‗The most important textual feature of journalism is the fact it counts as true.
The most important component of its system is the creation of readers as publics,
and the connection of these readerships to other systems, such as those of politics,
economics, and social control. (as cited in Hartley, 1996, p. 35),‘‖ (Kinnaird &
Hall, 1996, p. 95).
Print journalism and newspapers articles provide knowledge about destinations and they
play a role of third party endorsers. Magazine articles and viewing televised broadcast messages
have an effect on what tourists expect when they participate in travel. Mass media, as Marshall

Content Analysis of Travel Groups and Gender 14
McLuhan and other media theorists see it, pervasively, determinedly and thoroughly transfers
knowledge about places that individuals otherwise would not know (West & Turner, 2007).
George Gerbner (1998) believes that the pervasive presence of television in the daily
lives of individuals shapes the expectations, beliefs, attitudes and values of all society. Applying
Gerbner‘s thinking leads to the thought process that especially heavy viewers, like women who
watch travel-related television programs for inspiration on a regular basis would perceive that it
is perfectly acceptable and natural to travel alone simply because it is on television. The
assumptions of mass media theories including media ecology theory, cultivation analysis and
uses and gratifications theory all address this issue in some form (West & Turner, 2007).
Perhaps as stories and images are viewed over and over again through media, the themes
of these stories and images become a shared reality. Gerbner believes reality becomes consistent
with what is persistently viewed, watched or read and socializes on a mass scale.
Are the ―assumptions and values‖ of women being reflected in mainstream television
programming via the Travel Channel and travel programming where the host is female and
shown traveling alone? Do travel magazines, newspapers, guidebooks and the Internet reflect the
trend, or is the trend cultivated by the media? What is the reality of women traveling and is there
an association between the relationship of media use and consumer gratification? These
questions will not be answered in one undergraduate thesis project. The scope is too broad and
the researcher does not have the skills or ability to perform such research. Therefore, I have
attempted to analyze Travel & Leisure advertisements from 2003 to 2009 to examine what is
depicted in this time frame, make some comparison to a past content analysis of 1969-1999

Content Analysis of Travel Groups and Gender 15
Travel & Leisure, and compare the relatively scarce statistics that could be found on women who
travel alone.
Methods
An empirical study based on content analysis of Travel & Leisure magazine 2003 to 2009
was conducted to discover differences between aspects in the advertisements and reported data
statistics. The coding elements were adapted from Bowen‘s, 2002 doctoral thesis on gender in
1969 to 1999 Travel & Leisure advertisements.
Advertisements were selected from a population consisting of a complete set of Travel &
Leisure magazine dated 2003 to 2009 that was available to researcher. A simple random sample
was selected from a random table using a dollar bill number and coin toss. Eight issues,
representing 10% of the available 84 issues, were matched with the random numbers. These were
February 2004, May 2004, May 2003, January 2004, April 2009, November 2007, December
2005 and April 2005. Every 10th
advertisement consisting of 1/6th
of a page or more was
numbered for a total of 80 advertisements.
The unit of analysis coded was the advertisement. In the absence of a model(s) researcher
proceeded to next ad. If a model or models were depicted then the ad was coded according to the
categories contained in the code book (Appendix A). The total number of ads with people
numbered 52.
Each unit was analyzed for ten variables that had subcategories assigned to them. Coding
units were the variables of number of persons in the ad, group composition, age group,
ethnicity/race, role within the ad, category of advertised product, setting of the ad, place of
physical ad, visual locale, and type of activity.

Content Analysis of Travel Groups and Gender 16
Ads were looked at according to what an everyday person would see when looking at the
advertisement. No qualitative or semiotic analysis was attempted.
The category of group composition of ads with people was analyzed and assigned a
number for that subcategory. They were 1) female only; 2) male only; 3) heterosexual couple; 4)
2 females; 5) 2 males; 6) a mixed sex group of 3 or more; 7) a same sex group of 3 or more; and
8) cannot determine. Each ad was given one number that corresponded to the numbered
subcategory.
Age was looked at for what the general grouping of the ad depicted. If it was a single
person then one single subcategory of either 1) baby; 2) young child; 3) teenager; 4) young adult;
5) adult or 6) older adult was coded for the ad. If there were more than one model then a
subcategory number was given to identify the combined group age of either 7) Adults of 2 or
more; 8) Adult(s), Child(ren), Teen(s) Mixed; 9) Young Adult(s), Adult(s), Older Adult(s)
Mixed; 10) Young Adults, 2 or more; 11) Children, 2 or more; 12) Teenagers, 2 or more; 13)
Older Adults, 2 or more; 14) unable to determine; or 15) Mixed age group of Baby to Adult.
Ethnicity/race subcategories were coded similarly, either as a single person or the group.
Subcategories were: 1) Black; 2) Asian/Asian American; 3) Mixed Race Group of any
combination; 4) Hispanic/Latin American/Caribbean/South American; 5) White/European; 6)
Cannot determine an ethnic or racial group for ad; 7) Indigenous/Native.
Role within the ad was coded with either 1) Audience member; 2) Co-worker(s); 3)
Performer(s); 4) Pickpocket(s); 5) Romantic Partner(s); 6) No Additional Role(s); 7) Art or Non-
Living Representation(s); 8) Craftsman(men) & Professional(s); 9) Family Member(s); 10)

Content Analysis of Travel Groups and Gender 17
Person(s) with Notoriety; 11) Service Role(s); 12) Travel or Recreation Partner(s) or Friend(s);
13) Host(s) & Guest(s); or 14) Multiple roles shown within the ad.
The categories under the headings of Where are they pictured and What are they doing
were similarly coded by the most prominent aspect of the category seen in the ad (Appendix A).
Coding was done by researcher with a test for inter-coder reliability performed using one other
coder and 6 randomly selected ads from the September 2004 issue of Travel & Leisure. Coders
agreed 70% to 95% on all variables except for only 50% agreement on type of activity variable.
Data was collected from the Office of Travel & Tourism Industries Web site located at
tinet.ita.doc.gov in the 2006 Profile of U.S. Resident Travelers Visiting Overseas Destinations –
Outbound. Source: U.S. Department of Commerce, ITA, Office of Travel & Tourism Industries,
―In-Flight Survey,‖ July 2007.
Results
Data was put in a spreadsheet and tallied for counts and percentages. 2003-2009 data
were compiled for gender and group composition in order to make a comparison with 1969-1999
data found in Bowen, (2002), and Office of Travel & Tourism/International Trade
Administration 2006 data on gender and group compositions with their percentages. Because of
the presence of independent samples for two of the categories a data analysis was performed
using a chi-square test for homogeneity (Peck, Olsen & Devore, 2009). This was used to
determine if there was sufficient evidence at the .05 level of significance to say that there is a
difference in the proportions between the data gathered from these three sources as follows:

Content Analysis of Travel Groups and Gender 18
Male Female Other
T&L 2003-2009 28% 41% 31%
T&L 1969-1999 52% 43% 5%
OTTI /ITA 2006* 44% 56% 0%
*Percentage based on 30,148,000 U.S. travelers
H1: The true proportion of males and females are not the same for all three
groups.
Chi-square = 56.235; DF = 4; P-value = 0.00.
The null hypothesis was rejected. There is sufficient evidence at the .05 level of
significance that the true proportion of males and females depicted in 2003-2009 Travel &
Leisure advertisements and OTTI/ITA data statistics is not the same.
Group categories reported by the Office of Travel and Tourism Industries were put in a
table with data found in Travel & Leisure 2003 to 2009 ads. The same chi-square test of
homogeneity was done on the following data:
Travel Alone Spouse Friends Tour Group Undetermined
OTTI/ITA 06 40% 32% 35% 2% 7%
T&L 03-09 39% 17% 14% 27% 31%
H2: The true proportion of travel groups found in 2003 – 2009 Travel &
Leisure advertisements and Office of Travel & Tourism Industries
statistics on travel groups are not the same.
Chi-square = 49.845; DF = 4 and P-value = 0.00.

Content Analysis of Travel Groups and Gender 19
The null hypothesis was rejected. There is sufficient evidence at the .05 level of
significance to say that the true proportion of groups found in Travel & Leisure 03-09 and
statistics of OTTI/ITA are not equal.
Comparison was made on the number of reported adult group and adults with children
groups as found and reported with the following results:
Travel Party Size OTTI/ITA 2008* 2003-2009 T&L
Adults Only 92% 48%
Adults and Children 8% 17%
Average Party Size 1.5 3.7
Median Party Size 1.0 2.0
*Data from Profile of U.S. Travelers Visiting Overseas Destinations: 2008 - Based on
30,789,000 total U.S. travelers.
H3: The true proportion of adults and adults only are not be the same for 2003 – 2009
Travel & Leisure and Office of Travel & Tourism Industries/International Trade
Administration reported statistics.
Chi-Sq = 10.099, DF = 1, P-Value = 0.001
The null hypothesis is rejected. There is sufficient evidence at the .05 level of
significance that there is a difference in the true proportions of adults and adults with children
who are seen in 2003-2009 Travel & Leisure advertisements and OTTI/ITA statistics.
All variables were tested with the goodness of fit procedure. The fact that the sample size
is greater than 30 and sample is a random sample met the required assumptions for goodness of
fit procedure. Therefore, it was performed on all the variables individually. Those variables that

Content Analysis of Travel Groups and Gender 20
did not meet the assumptions of expected values of more than five were not included in the
following results.
Expected and observed values are compared in the graphs providing insight into which
subcategory contributed most to the chi-square statistic. Each category number corresponds to
the subcategories in the codebook (Appendix A).
V2 Group Composition:
N = 52; DF = 6; Chi-Sq = 20.4231; P-value = 0.002
Category 8654321
14
12
10
8
6
4
2
0
Co
mp
osit
ion
Expected
Observed
Chart of Observed and Expected Values Group Comp
V3 Age Group:
N = 52; DF = 8; Chi-Sq = 25.5385; P-Value = 0.001
Category 14109875432
14
12
10
8
6
4
2
0
Ag
e G
rou
p
Expected
Observed
Chart of Observed and Expected Values of Age Group

Content Analysis of Travel Groups and Gender 21
V4 Ethnicity/Race:
N = 52; DF = 5; Chi-Sq = 65.2308; P-value = 0.00
Category 765432
30
25
20
15
10
5
0
Eth
nic
ity
/R
ace
Expected
Observed
Chart of Observed and Expected Values Ethnicity/Race
V5 Category of Product:
N = 52; DF = 7; Chi-Sq = 60.6154; P-value = 0.000
Category 1413121110965
25
20
15
10
5
0
Pro
du
ct
Ca
teg
ory
Expected
Observed
Chart of Observed and Expected Values of Product Category

Content Analysis of Travel Groups and Gender 22
V6 Place of Physical Ad:
N = 52; DF = 6; Chi-Sq = 89.6154; P-value = 0.000
Category 1413121110965
25
20
15
10
5
0
Pla
ce
of
Ad
Expected
Observed
Chart of Observed and Expected Values for Place of Physical Ad
Discussion
Data gathered suggest that the proportion of males and females as found in both the
2003-2009 and 1969-1999 Travel & Leisure magazine advertisements and travel industry
statistics is significantly different.
The average party size found in the ads is significantly different to the proportions found
in industry reports. The median party size reported by OTTI/ITA was 1.0 compared to 2.0 in
2003-2009 Travel & Leisure. The average party size was quite a bit larger in 2003-2009 Travel
& Leisure – 3.7 compared to 1.5 reported in the industry‘s statistics.
Travel groups as analyzed by the code book were compiled in order to compare with the
industry statistics. Categories of travel alone, spouse, friends, tour group and undetermined were
developed and compared. The chi-square was large implicating good indication of difference
among the groups. Significant to this study is the difference shown between numbers of spouses

Content Analysis of Travel Groups and Gender 23
shown (17%) and number of spouses reported (39%). This suggests that another group is the
focus of the ads that is not related to who is really traveling. These data support the suggestion
that advertisements do not reflect the reality of those who travel.
Further, in consideration of whether 2003-2009 Travel & Leisure advertisements are
cultivating the trend in women to travel alone, the percentage of males (28%) as compared to
females (41%) depicted in 2003-2009 Travel & Leisure ads might be construed as evidence.
Results of the chi-square lead to a conclusion that there is a measurable difference between
males, females and other who are reported and shown.
There is substantial evidence that 2003-2009 Travel & Leisure advertisements do not
mirror the true picture of U.S. travel abroad during the year 2006. The OTTI/ITA 2006 data do
show a substantially higher number of females than males traveling. Because Travel & Leisure
magazine is a known source of information for women who travel these women would want
increased coverage of females traveling based on this information.
Weaknesses of this content analysis can be found in the discernment of groups. This
creates difficulty in making valid comparisons with the gathered statistical data. The variables of
the codebook are valid but difficult to match to existing data. The categories of groups should be
re-examined and revised. Perhaps analysis of a unit of individuals would make better sense of
what is portrayed in the advertisements. This content analysis could be taken, therefore, and
continued for better and more valid results.
This study has assumed leisure travel, but business and other travel are also part of the
reality. Other was used as a group for those images that researcher was not able to discern or for

Content Analysis of Travel Groups and Gender 24
groupings that were ambiguous. All of these constitute weaknesses of the 2003-2009 data and
are recognized.
This was a worthwhile attempt at gathering data researcher believes. The codebook was
revised a couple of times during the study seeking validity. For example, the initial adaptation of
the coding sheets from Bowen, 2002 study was revised to exclude the categories and
subcategories intended for qualitative analysis. It was also realized during initial coding attempts
that too many subcategories had been included to manage with available resources. Therefore,
categories initially used from Bowen, 2002 were further reduced and simplified.
Researcher suggests a need to more narrowly focus analysis and use the individual person
as a coding unit for future studies. For these reasons researcher does not claim conclusive results
about the cultivating effect of 2003-2009 Travel & Leisure advertisements from this content
analysis. It may provide a starting point for future study where content analysis could provide
data that could be triangulated with in-depth interviews or survey methods. It could also be used
for analyzing cultivation with regards to Travel Channel broadcast programming to see what
messages are found and if there is a relationship between viewing and decisions to travel alone.
Qualitative studies could attempt to discover whether women are influenced by media to take
more risk by traveling alone simply because they see it being done in the media.
This study concludes that it is relevant to discern if women are influenced to travel alone,
and thereby take more risk, as a result of media consumption of programs, Internet and print
media. Uses and gratification theories could also be tested to determine how effective the media
is in meeting the needs of the industry to reach its target markets. It would be helpful in serving
needs of the women who are influenced by media.

Content Analysis of Travel Groups and Gender 25
References
Asberry, D. (2009). Statistics on women traveling alone. Retrieved April 20, 2009 from
http://www.women-traveling.com/.
Bilandzic, H. (2006). The perception of distance in cultivation process: A theoretical
consideration of the relationship between television content, processing experience, and
perceived distance. Communication Theory 16 (3), 333-355. Retrieved April 25, 2009
from Communication & Mass Media Complete database.
Bodnarchuk, K. (2009). A woman traveling alone? The world can be your oyster, too. Retrieved
fromhttp://www.boston.com/travel/articles/2009/03/15/a_woman_traveling_alone_the_w
orld_can_be_your_oyster_too/?page=full.
Bowen, H. E. (2002). Images of women in tourism magazine advertising: A content analysis of
advertising in ―Travel & Leisure‖ magazine from 1969 to 1999. Ph.D. dissertation, Texas
A&M University, United States -- Texas. Retrieved January 4, 2010, from ABI/INFORM
Global. (Publication No. AAT 3060773).
Chiang, C. & Jogaratnam, G. (2006). Why do women travel solo for the purposes of leisure?
Journal of Vacation Marketing,12(1), 59. Retrieved February 2, 2009 from sagepub.com.
Dodd, C. (1998). Dynamics of intercultural communications (5th
ed.). Boston, Burr Ridge,
Illinois, Dubuque, Iowa, Madison, Wisconsin, New York, San Francisco, St. Louis:
McGraw Hill.
Gerbner, G. (1998). Cultivation analysis: An overview. Mass Communication & Society, 1 (3/4)
175-194. Retrieved March 29, 2009 from Communication & Mass Media Complete
database.

Content Analysis of Travel Groups and Gender 26
Hyde, K. & Lawson, R. (2003). The nature of independent travel. Journal of Travel Research
2003, 42, 13-23. Retrieved February 14 2009, from Communication & Mass Media
Complete database.
Jack, G. & Phipps, A. (2003). On the uses of travel guides in the text of German tourism to
Scotland. Tourist Studies 2003, 3(3), 281-300. Retrieved February 1, 2009 from Sage
Journals Online.
Jauneaud, S. (2008). The travel channels. Communication World, 25(1), 28-31. Retrieved April
20, 2009, from Communication & Mass Media Complete database.
Kinnaird, V. & Hall, D., 1996. Understanding tourism processes: a gender-aware framework.
Tourism Management, 17(2), 95-102. Retrieved January 6, 2010 from Science Direct
database.
Kit-wai, L. (2008, August 7). It‘s a woman‘s world. South China Morning Post [online].
Features, p. 5. Retrieved January 6, 2010, from Lexis Nexis database.
Larson, C. U. (2007). Persuasion reception and responsibility (11th
ed). Australia, Brazil,
Canada, Mexico, Singapore, Spain, United Kingdom, United States: Thomas Wadsworth.
Macmillan, S., 2008. Take care when going it alone. Sunday Telegraph Australia. April 20, 2008
Sunday t-Escape Edition. Retrieved January 6, 2010 from Lexis Nexis database.
McQuail, D. (1987). Mass communication theory: an introduction, (2nd
ed.). London: Sage
Publications.
Pan, S., Ryan, C. (2007). Gender, framing, and travelogues. Journal of Travel Research 45, 464.
Retrieved from sagepublishing.com.

Content Analysis of Travel Groups and Gender 27
Passport to Adventure Web site. (2009). Retrieved April 20, 2009 from
http://www.passporttoadventure.com/index.shtml.
Peck, R., Olsen, C. & Devore, J. (2009). Introduction to statistics & data analysis: Rochester
Institute of Technology. Mason, Ohio: Cengage Learning.
Reinard, J. C. (2008). Introduction to communication research, (4th
ed.). Avenue of the
Americas, New York: McGraw Hill.
Salamone, G., (2009). More women traveling solo. Retrieved May 9, 2009 from
http://www.enduringwanderlust.com/more-women-traveling-solo/.
Severin, W. J. & Tankard, J. W. (1992). Communication theories: Origins, methods, and uses in
the mass media (3rd
ed.). White Plains, New York: Longman.
Singles and Travel US, March 2006, (2006). Women only travel. Retrieved February 8, 2010
from Mintel Oxygen database.
Singles and Travel US, March 2006, (2006). Market size and trends. Travel tv networks.
Retrieved February 8, 2010 from Mintel Oxygen database.
Sobre, M., (2007, 2007 Conference). Building a better risk message: A guide for solo female
travelers. Conference Papers—International Communication Association. Retrieved
January 12, 2009 from Communication & Mass Media Complete database.
Sonmez, S., & Graefe, A. (1998). Determining future travel behavior from past travel experience
and perceptions of risk and safety. Journal of Travel Research, 37(2), 171-7. Retrieved
January 11, 2010, from OmniFile Full Text Mega database.
Thurlow, C. & Jaworski , A. (2007). Scripting Global Discourse: The commodification of local
linguacultures in tourist guidebooks. Conference Papers -International Communication

Content Analysis of Travel Groups and Gender 28
Association, 2007 Annual Meeting. Retrieved January 20, 2009 from Communication &
Mass Media Complete.
West & Turner, (2007). Introducing communication theory analysis and application (3rd
ed.).
Avenue of the Americas, New York: McGraw Hill.
Women Traveling Together Web site. (2009). Retrieved April 21, 2009, from
http://www.women-traveling.com/.
―World tourism exceeds expectations in 2007—Arrivals grow from 800 million to 900 million
in two years.‖ (2007, January 29). Retrieved February 14, 2009, from
www.unwto.org/media/news/en/press_det.php?id=1665.
http://www.census.gov/compendia/statab/cats/arts_recreation_travel.html
http://tinet.ita.doc.gov/view/m-2009-O-001/index.html
http://tinet.ita.doc.gov/cat/f-2006-101-009.html Male Female Stats
http://tinet.ita.doc.gov/outreachpages/download_data_table/2008_Outbound_Profile.pdf
http://www.ustravel.org/news

Content Analysis of Travel Groups and Gender 29
APPENDIX A
Coding Sheet
Travel & Leisure Magazine
Month and Date ________________________
Ad ID number (Every 10th
Ad) _____________Page Number __________________________
Ad Size: (No ad smaller than 1/6 of a page will be considered)
2 pages . Full page. ½ page. 1/3 page 2/3 page. ¼ page. 1/6 page. Other _________
v1. Number of people depicted in ad _______ If NO Models, then go to next ad)
WHO IS PICTURED?
V2. Group Composition
1 Female only
2 Male only
3 Heterosexual Couple2 Females
4 2 Males
5 Mixed Sex Group (3 and over)
6 Same Sex Group (3 and over)
7 Cannot be determined
V3. Age Group
1 Baby
2 Young Child
3 Teenager
4 Young Adult
5 Adult
6 Older Adult
7 Adults only (2 or more)
8 Adult(s) and Child(ren) or Teen(s) Mixed Group
9 Mixed Aged Adults (any combination of Young Adult, Adult, Older Adult)
10 Young Adults (2 or more)
11 Children (2 or more)
12 Teenagers (2 or more)
13 Older Adults (2 or more)
14 M Unable to Determine
15 Mixed age – Baby to Adult
V4. Ethnicity/Race
1 Black
2 Asian/Asian American
3 Mixed Race – Multiple Images with Different Race combinations

Content Analysis of Travel Groups and Gender 30
4 Hispanic/Hispanic American/Caribbean/South American/Latin American
5 White Caucasian/European
6 Cannot Determine
7 Indigenous/Native
V5. Role Within the Ad
1 Audience member
2 Co-worker
3 Performer
4 Pickpocket
5 Romantic Partner
6 No Additional Role
7 Art or Non-living Representation
8 Craftsmen & Professionals
9 Family Members
10 Persons with Notoriety
11 Service Roles
12 Travel or Recreation Partner, Friend
13 Hosts & Guests together
14 Multiple Roles with Multiple Scenes
WHERE ARE THEY PICTURED?
V6. Category of Advertised Product
1 Accommodations (Hotel, Motel, Resort)
2 Cruises
3 Health
4 Media
5 Telecommunications
6 Real Estate
7 Attractions& Events
8 Business Services & Accessories
9 Camera & Gear
10 Consumables
11 Consumer Goods (non-travel specific)
12 Destinations
13 Fashion & Accessories
14 Luggage & Travel Accessories
15 Money
16 Restaurants
17 Social Organizations
18 Tobacco & Alcohol Products
19 Transportation
20 Travel & Vacation Packages & Facilitators
21 Other
Content Analysis of Travel Groups and Gender 31
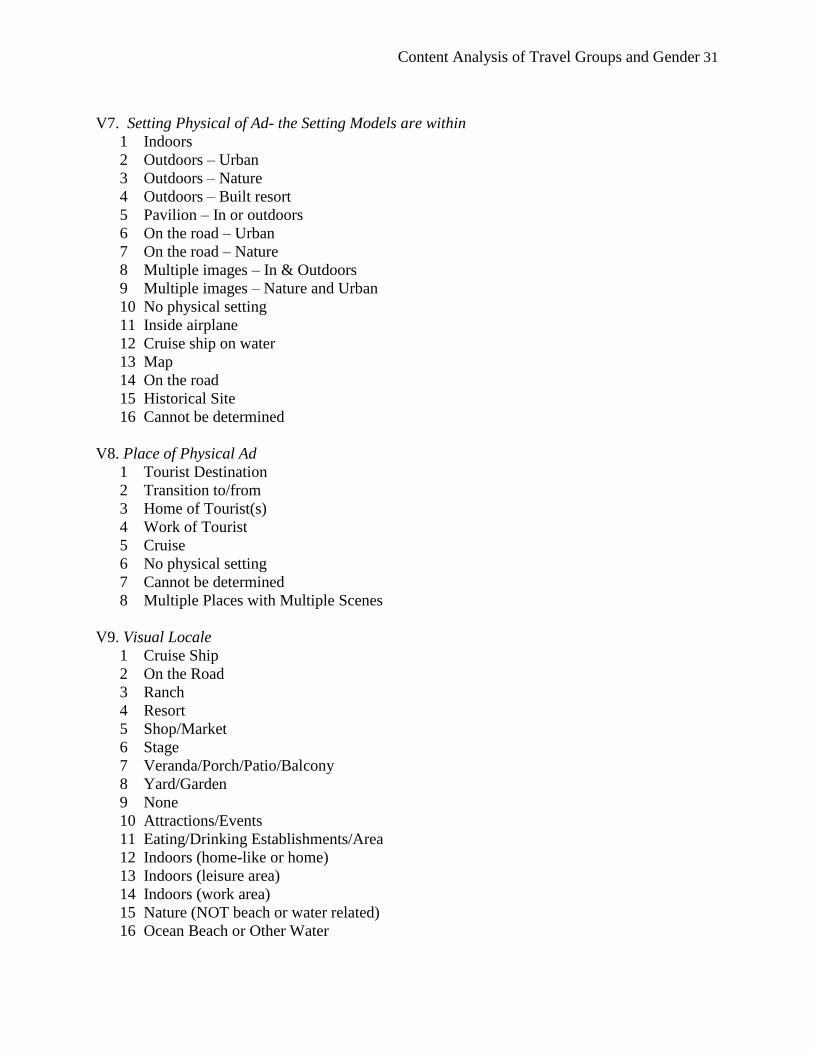
V7. Setting Physical of Ad- the Setting Models are within
1 Indoors
2 Outdoors – Urban
3 Outdoors – Nature
4 Outdoors – Built resort
5 Pavilion – In or outdoors
6 On the road – Urban
7 On the road – Nature
8 Multiple images – In & Outdoors
9 Multiple images – Nature and Urban
10 No physical setting
11 Inside airplane
12 Cruise ship on water
13 Map
14 On the road
15 Historical Site
16 Cannot be determined
V8. Place of Physical Ad
1 Tourist Destination
2 Transition to/from
3 Home of Tourist(s)
4 Work of Tourist
5 Cruise
6 No physical setting
7 Cannot be determined
8 Multiple Places with Multiple Scenes
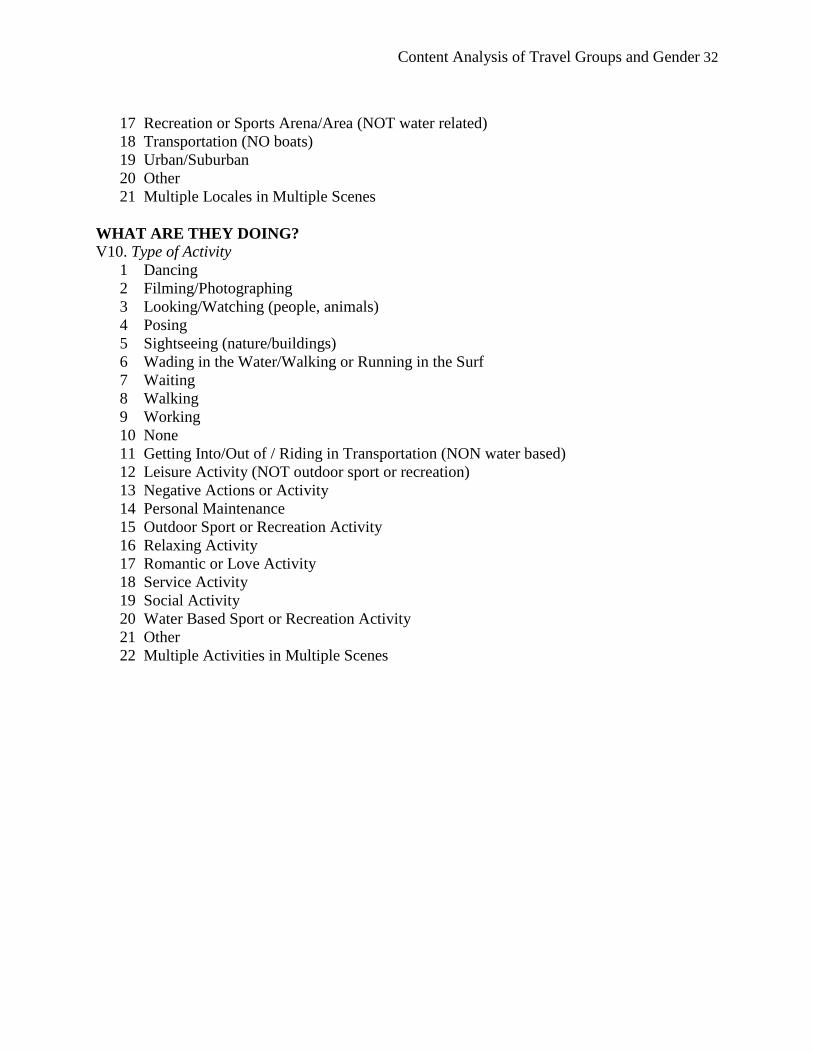
V9. Visual Locale
1 Cruise Ship
2 On the Road
3 Ranch
4 Resort
5 Shop/Market
6 Stage
7 Veranda/Porch/Patio/Balcony
8 Yard/Garden
9 None
10 Attractions/Events
11 Eating/Drinking Establishments/Area
12 Indoors (home-like or home)
13 Indoors (leisure area)
14 Indoors (work area)
15 Nature (NOT beach or water related)
16 Ocean Beach or Other Water
Content Analysis of Travel Groups and Gender 32
17 Recreation or Sports Arena/Area (NOT water related)
18 Transportation (NO boats)
19 Urban/Suburban
20 Other
21 Multiple Locales in Multiple Scenes
WHAT ARE THEY DOING?
V10. Type of Activity
1 Dancing
2 Filming/Photographing
3 Looking/Watching (people, animals)
4 Posing
5 Sightseeing (nature/buildings)
6 Wading in the Water/Walking or Running in the Surf
7 Waiting
8 Walking
9 Working
10 None
11 Getting Into/Out of / Riding in Transportation (NON water based)
12 Leisure Activity (NOT outdoor sport or recreation)
13 Negative Actions or Activity
14 Personal Maintenance
15 Outdoor Sport or Recreation Activity
16 Relaxing Activity
17 Romantic or Love Activity
18 Service Activity
19 Social Activity
20 Water Based Sport or Recreation Activity
21 Other
22 Multiple Activities in Multiple Scenes

Content Analysis of Travel Groups and Gender 33
APPENDIX B
Tables
V1: Table of Most Frequent Number of People in Ads:
Number of People in Ad N=80
Frequency Percent
0 people 28 35
1 person 23 28.75
2 people 13 16.25
4 people 4 5.00
2 people 2 2.50
V2: Most Frequent Groups Depicted in T&L 2003-2009:
Group Composition N = 52
Frequency Percent
Female Only 14 26.92
Mixed Sex Group of 3 or more 14 26.92
Heterosexual Couple 9 17.31
Male Only 6 11.54
Two Males 4 7.69
Two Females 3 5.77
Cannot determine 2 3.85
Table of Adult Groups and Group Size Comparisons:
Travel Party Size OTTI/ITA 2008* 2003-2009 T&L
Adults Only 92% 48%
Adults and Children 8% 17%
Average Party Size 1.5 3.7
Median Party Size 1.0 2.0
*Data from Profile of U.S. Travelers Visiting Overseas Destinations: 2008
V3: Table of Most Frequent Age Grouping:
Age Group Composition N = 52
Frequency Percent
Young Adults Only 14 17.50
Adult(s), Child(ren) or Teen(s)
in mixed grouping (family) 9 11.25

Content Analysis of Travel Groups and Gender 34
Adults, Young Adults, Older
Adults in Mixed Grouping 8 10.00
Unable to determine age
group 7 8.75
Young Adults of 2 or more 6 7.50
V4: Table of Most Frequent Ethnic/Racial Groupings:
Ethnic/Racial Composition N = 52
Frequency Percent
White 29 55.77
Mixed Race Group 10 19.23
Hispanic/Latin American 3 5.77
V5: Table of Most Frequent Depicted Role Within Ad:
Role Within Ad N = 52
Frequency Percent
No Additional Role 23 44.23
Hosts & Service 10 19.23
Romantic Partner 9 17.31
Family Members 2 3.85
Service Roles 2 3.85
V10: Table of Most Frequent Activity Types:
Type of Activity N = 52
Frequency Percent
Multiple Activity Scenes 11 21.15
Posing 7 13.46
Leisure Activity (NOT Sport
or Recreation)
6 11.54
Romantic or Love 5 9.62
Service 5 9.62
Other 3 5.77
Group by Gender 03-09 Percent
1 Females 17
2 Males 10
3 Heterosexual Couple 9
6 Mixed sex group, 3 or more 14
8 Cannot determine 2
Content Analysis of Travel Groups and Gender 35
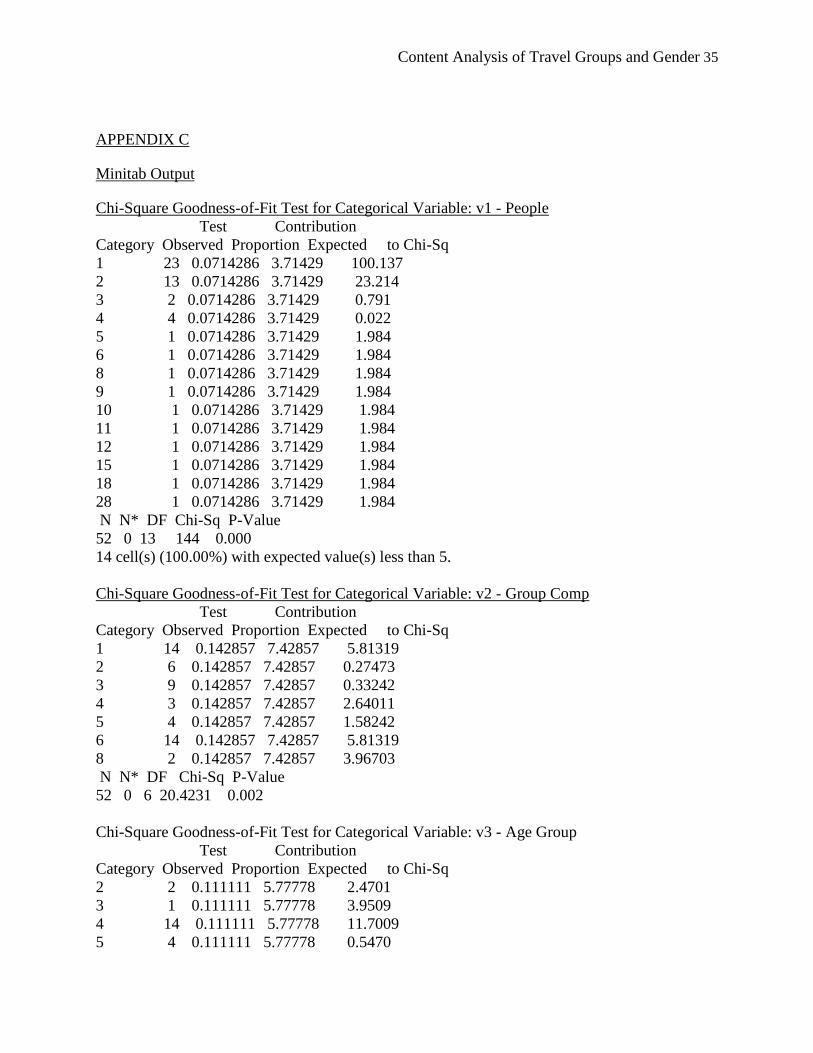
APPENDIX C
Minitab Output
Chi-Square Goodness-of-Fit Test for Categorical Variable: v1 - People
Test Contribution
Category Observed Proportion Expected to Chi-Sq
1 23 0.0714286 3.71429 100.137
2 13 0.0714286 3.71429 23.214
3 2 0.0714286 3.71429 0.791
4 4 0.0714286 3.71429 0.022
5 1 0.0714286 3.71429 1.984
6 1 0.0714286 3.71429 1.984
8 1 0.0714286 3.71429 1.984
9 1 0.0714286 3.71429 1.984
10 1 0.0714286 3.71429 1.984
11 1 0.0714286 3.71429 1.984
12 1 0.0714286 3.71429 1.984
15 1 0.0714286 3.71429 1.984
18 1 0.0714286 3.71429 1.984
28 1 0.0714286 3.71429 1.984
N N* DF Chi-Sq P-Value
52 0 13 144 0.000
14 cell(s) (100.00%) with expected value(s) less than 5.
Chi-Square Goodness-of-Fit Test for Categorical Variable: v2 - Group Comp
Test Contribution
Category Observed Proportion Expected to Chi-Sq
1 14 0.142857 7.42857 5.81319
2 6 0.142857 7.42857 0.27473
3 9 0.142857 7.42857 0.33242
4 3 0.142857 7.42857 2.64011
5 4 0.142857 7.42857 1.58242
6 14 0.142857 7.42857 5.81319
8 2 0.142857 7.42857 3.96703
N N* DF Chi-Sq P-Value
52 0 6 20.4231 0.002
Chi-Square Goodness-of-Fit Test for Categorical Variable: v3 - Age Group
Test Contribution
Category Observed Proportion Expected to Chi-Sq
2 2 0.111111 5.77778 2.4701
3 1 0.111111 5.77778 3.9509
4 14 0.111111 5.77778 11.7009
5 4 0.111111 5.77778 0.5470

Content Analysis of Travel Groups and Gender 36
7 1 0.111111 5.77778 3.9509
8 9 0.111111 5.77778 1.7970
9 8 0.111111 5.77778 0.8547
10 6 0.111111 5.77778 0.0085
14 7 0.111111 5.77778 0.2585
N N* DF Chi-Sq P-Value
52 0 8 25.5385 0.001
Chi-Square Goodness-of-Fit Test for Categorical Variable: v4 - Ethnicity
Test Contribution
Category Observed Proportion Expected to Chi-Sq
2 1 0.166667 8.66667 6.7821
3 10 0.166667 8.66667 0.2051
4 3 0.166667 8.66667 3.7051
5 29 0.166667 8.66667 47.7051
6 8 0.166667 8.66667 0.0513
7 1 0.166667 8.66667 6.7821
N N* DF Chi-Sq P-Value
52 0 5 65.2308 0.000
Chi-Square Goodness-of-Fit Test for Categorical Variable: v5 – Role Within the Ad
Test Contribution
Category Observed Proportion Expected to Chi-Sq
5 9 0.125 6.5 0.9615
6 23 0.125 6.5 41.8846
9 2 0.125 6.5 3.1154
10 1 0.125 6.5 4.6538
11 2 0.125 6.5 3.1154
12 3 0.125 6.5 1.8846
13 10 0.125 6.5 1.8846
14 2 0.125 6.5 3.1154
N N* DF Chi-Sq P-Value
52 0 7 60.6154 0.000
Chi-Square Goodness-of-Fit Test for Categorical Variable: v6 - Category of Product
Test Contribution
Category Observed Proportion Expected to Chi-Sq
1 18 0.0909091 4.72727 37.2657
2 3 0.0909091 4.72727 0.6311
4 1 0.0909091 4.72727 2.9388
7 2 0.0909091 4.72727 1.5734
10 1 0.0909091 4.72727 2.9388
11 4 0.0909091 4.72727 0.1119
12 13 0.0909091 4.72727 14.4773
13 4 0.0909091 4.72727 0.1119
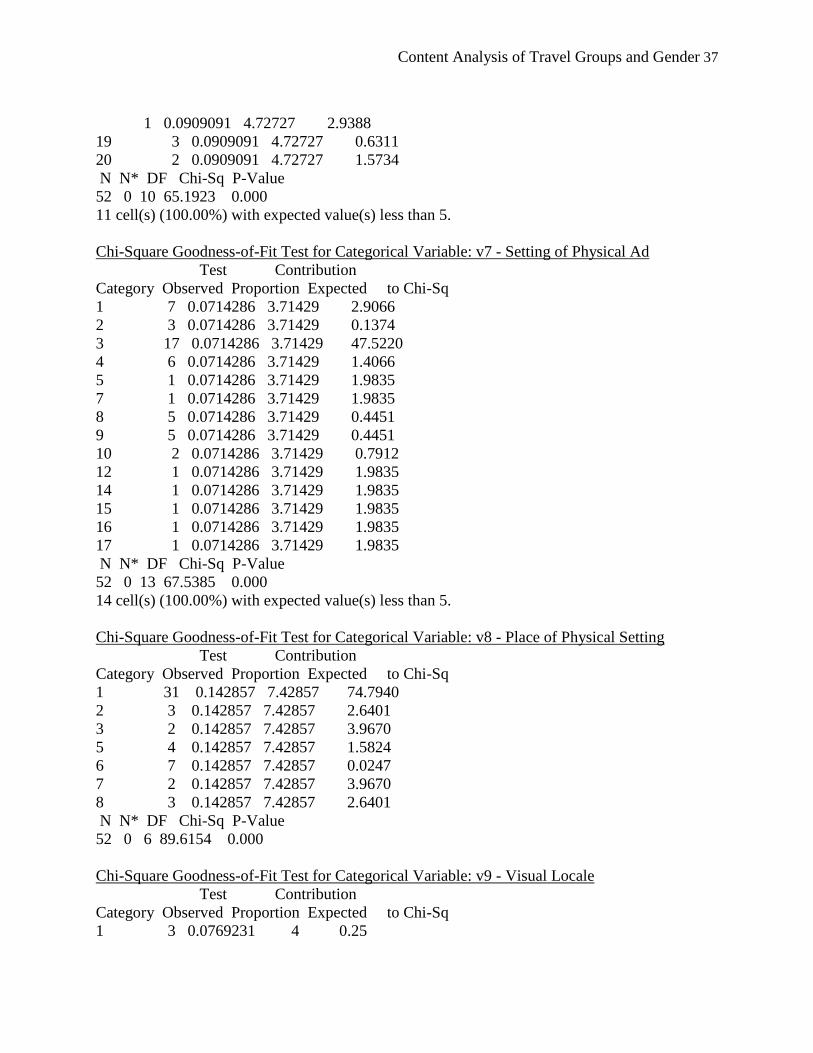
Content Analysis of Travel Groups and Gender 37
1 0.0909091 4.72727 2.9388
19 3 0.0909091 4.72727 0.6311
20 2 0.0909091 4.72727 1.5734
N N* DF Chi-Sq P-Value
52 0 10 65.1923 0.000
11 cell(s) (100.00%) with expected value(s) less than 5.
Chi-Square Goodness-of-Fit Test for Categorical Variable: v7 - Setting of Physical Ad
Test Contribution
Category Observed Proportion Expected to Chi-Sq
1 7 0.0714286 3.71429 2.9066
2 3 0.0714286 3.71429 0.1374
3 17 0.0714286 3.71429 47.5220
4 6 0.0714286 3.71429 1.4066
5 1 0.0714286 3.71429 1.9835
7 1 0.0714286 3.71429 1.9835
8 5 0.0714286 3.71429 0.4451
9 5 0.0714286 3.71429 0.4451
10 2 0.0714286 3.71429 0.7912
12 1 0.0714286 3.71429 1.9835
14 1 0.0714286 3.71429 1.9835
15 1 0.0714286 3.71429 1.9835
16 1 0.0714286 3.71429 1.9835
17 1 0.0714286 3.71429 1.9835
N N* DF Chi-Sq P-Value
52 0 13 67.5385 0.000
14 cell(s) (100.00%) with expected value(s) less than 5.
Chi-Square Goodness-of-Fit Test for Categorical Variable: v8 - Place of Physical Setting
Test Contribution
Category Observed Proportion Expected to Chi-Sq
1 31 0.142857 7.42857 74.7940
2 3 0.142857 7.42857 2.6401
3 2 0.142857 7.42857 3.9670
5 4 0.142857 7.42857 1.5824
6 7 0.142857 7.42857 0.0247
7 2 0.142857 7.42857 3.9670
8 3 0.142857 7.42857 2.6401
N N* DF Chi-Sq P-Value
52 0 6 89.6154 0.000
Chi-Square Goodness-of-Fit Test for Categorical Variable: v9 - Visual Locale
Test Contribution
Category Observed Proportion Expected to Chi-Sq
1 3 0.0769231 4 0.25

Content Analysis of Travel Groups and Gender 38
2 1 0.0769231 4 2.25
4 2 0.0769231 4 1.00
7 2 0.0769231 4 1.00
9 5 0.0769231 4 0.25
11 1 0.0769231 4 2.25
12 3 0.0769231 4 0.25
13 2 0.0769231 4 1.00
15 3 0.0769231 4 0.25
16 14 0.0769231 4 25.00
18 3 0.0769231 4 0.25
19 2 0.0769231 4 1.00
21 11 0.0769231 4 12.25
N N* DF Chi-Sq P-Value
52 0 12 47 0.000
13 cell(s) (100.00%) with expected value(s) less than 5.
Chi-Square Goodness-of-Fit Test for Categorical Variable: v10 - Type of Activity
Test Contribution
Category Observed Proportion Expected to Chi-Sq
3 1 0.0625 3.25 1.5577
4 7 0.0625 3.25 4.3269
5 1 0.0625 3.25 1.5577
6 3 0.0625 3.25 0.0192
7 2 0.0625 3.25 0.4808
8 1 0.0625 3.25 1.5577
9 1 0.0625 3.25 1.5577
11 1 0.0625 3.25 1.5577
12 6 0.0625 3.25 2.3269
16 1 0.0625 3.25 1.5577
17 5 0.0625 3.25 0.9423
18 5 0.0625 3.25 0.9423
19 2 0.0625 3.25 0.4808
20 2 0.0625 3.25 0.4808
21 3 0.0625 3.25 0.0192
22 11 0.0625 3.25 18.4808
N N* DF Chi-Sq P-Value
52 0 15 37.8462 0.001
16 cell(s) (100.00%) with expected value(s) less than 5.

Content Analysis of Travel Groups and Gender 39