the rise of pass-throughs and the decline of the labor share
TRANSCRIPT

The Rise of Pass-Throughs and the Decline of the LaborShare
Matthew Smith, Danny Yagan, Owen Zidar, and Eric Zwick∗
October 13, 2021
Abstract
We study the coevolution of the fall in the U.S. corporate-sector labor share andthe rise of business activity in tax-preferred pass-throughs. We find that reallocatingactivity to the form it would have taken prior to the Tax Reform Act of 1986 accountsfor one third of the decline in the corporate-sector labor share between 1978 and 2017.Our adjustments are concentrated among mid-market firms in services, magnifying therole of the manufacturing sector and superstar firms in driving the remaining decline inthe labor share. Our findings highlight the importance of tax policy when measuringfactor shares.
In the past forty years in the United States, the share of corporate-sector value added
accruing to labor in national accounts fell from 62.9% to 57.9% (Figure 1A). This period
coincided with a striking rise in the share of business activity organized in “pass-through”
form (Figure 1B). This paper shows that these trends are related.
Why would growth of the pass-through sector, which now accounts for the majority of
business income, matter for the corporate-sector labor share? The simple answer is taxes.
First, entrepreneurs have flexibility to characterize their income as labor payments or as
∗Smith: US Treasury Department (email: [email protected]); Yagan, UC Berkeley and NBER(email: [email protected]); Zidar, Princeton and NBER (email: [email protected]); Zwick, ChicagoBooth and NBER (email: [email protected]). This work does not necessarily reflect the viewsof the US Treasury Department. We thank David Autor, Nick Bloom, Jediphi Cabal, Curtis Carlson,Michael Cooper, Bob Hall, Pete Klenow, Adam Looney, Jay MacKie, John McClelland, Brent Neiman,James Pearce, Jim Poterba, Rich Prisinzano, David Romer, and seminar and conference participants forhelpful conversations on this draft. We thank Stephanie Kestelman, Dustin Swonder, Samuel Wallach-Hanson, and Caleb Wroblewski for excellent research assistance. Zidar and Zwick gratefully acknowledgefinancial support from Chicago Booth’s Initiative on Global Markets (IGM), the Kauffman Foundation, andthe University of Chicago Booth School of Business. Zidar also gratefully acknowledges support from theKathryn and Grant Swick Faculty Research Fund at the University of Chicago Booth School of Business andNational Science Foundation under Grant Number 1752431, and Zwick gratefully acknowledges financialsupport from the Neubauer Family Foundation, the Polsky Center, and the Hultquist Faculty ResearchEndowment at the University of Chicago Booth School of Business.
1

profits. They typically choose the label that minimizes taxes subject to the law. In recent
years, that label has been profit for a growing number of firms. Second, the composition of
corporate-sector firms has changed: many labor-intensive firms are now organized outside the
corporate sector as tax-preferred partnerships. The joint quantitative importance of these
factors for falling labor shares and rising capital shares is an open question with implications
for the analysis of technological change, inequality, and tax policy.
The historical turning point for the rise of pass-throughs is the Tax Reform Act of 1986
(TRA86). TRA86 lowered personal income tax rates substantially and raised the tax burden
on (non-pass-through) C-corporations. As a result, by organizing in pass-through form, en-
trepreneurs avoid C-corporation taxes and benefit from lower effective tax rates. Subsequent
changes in payroll taxation and in the legal treatment of pass-throughs raised the benefits
and feasibility of adopting pass-through form, accelerating the pace of this sector’s growth.
We take two steps to quantify the contribution of the pass-through sector to the decline of
the labor share. First, we reclassify a portion of S-corporation value added as labor income.
Using data on 183,000 firms that switch from C-corporation to S-corporation form between
2000 and 2012, we estimate that reported labor payments fall sharply in the switching
year by 2.29% of sales, which are offset by a corresponding increase in reported profits.
Estimates that account for heterogeneous effects by firm size imply that 1.22% of aggregate
S-corporation sales can be thought of as recharacterized labor payments.
This behavior implies the decline in labor payments captures a reporting response, as
owner-managers compensate themselves in the tax-preferred form of S-corporation profits.
Had these firms remained C-corporations, owner-managers would have likely continued to
pay themselves via labor income to avoid payout and corporate tax. Reclassifying 1.22% of
aggregate S-corporation sales increases the corporate-sector labor share by 0.89 percentage
points in 2017.
Our second adjustment is to “reincorporate” partnership activity into the corporate sec-
tor. Since 1980, partnership net income has grown from 13% to 35% of total business profits.
This rise occurred as the corporate sector in the national accounts shrank from 60% to 57%
of GDP and the noncorporate business sector—which includes partnership activity—grew
from 14% to 17% of GDP (Figure 1C). Partnership activity comprises mainly capital-light
activity in the form of financial, legal, and consulting services. These businesses have higher
labor shares than the businesses that have remained in corporate form. Treating these part-
nerships as C-corporations both reverses the recent decline of corporate-sector value added
relative to GDP and increases the corporate-sector labor share by 0.79 percentage points in
2017.
Together, these two adjustments imply the 5.0-percentage-point decline in the labor share
2

is overstated by 32%. The extent of understated labor income has grown over time in line
with the pass-through sector’s expansion. In the 1990s, the growth of S-corporations accounts
for most of this effect, whereas partnerships play a larger role in more recent years. All of
the decline in our adjusted series occurred since the early 2000s.
More than half of the adjustment comes from skilled service firms in capital-light indus-
tries. Firms in these industries include law firms, consultancies, doctors’ and dentists’ offices,
and financial service firms such as hedge funds and private equity funds. Such medium-sized
firms account for a disproportionate share of pass-through value added, while large, capital-
intensive manufacturers are more prominent as C-corporations (Figure 1D). By correcting
for downward bias among mid-market service firms, our adjusted series implies a larger role
for superstar firms and the manufacturing sector to drive the remaining decline in the labor
share.
I Institutional Background and Data
A Institutional Background
The way entrepreneurs report their income depends on tax rules. This section describes
U.S. business taxes as of 2017. We focus on the three formal business types: C-corporations,
S-corporations, and partnerships. C- and S-corporations are both in the corporate sector,
whereas partnerships and sole proprietorships are not. We focus on formal business because
sole proprietorships have not exhibited clear growth over the past forty years, and their role
in labor-share measurement is studied elsewhere (Gollin, 2002; Elsby, Hobijn and Sahin,
2013).
C-corporations pay the corporate income tax; their taxable shareholders pay dividend
taxes on distributed profits. C-corporations can retain earnings to delay the owner-level tax.
In contrast, S-corporations do not pay corporate tax, and they cannot defer the distribution
of profits, which are deemed distributed and taxable at the owner level when earned. The
tax rate that applies to S-corporation profits is the individual income tax rate for each owner
based on their share of firm profits.
Owner-managers have leeway in whether they report their income as wages or profits.
TRA86 made S-corporation form tax superior to C-corporation form for eligible firms. Ever
since, the S-corporation share of business activity has risen while the C-corporation share
has fallen.
C-corporation owner-managers face tax incentives to report their income as wages while
S-corporation owner-managers face tax incentives to report it as profits. Since wages are
3

deductible, owner-managers of C-corporations can avoid the corporate tax plus dividend tax
when they report their share of profits as wages. Their wage income faces personal income
tax plus payroll and social insurance taxes. In contrast, S-corporation owner-managers do
not pay payroll and social insurance taxes when they report their share of profits as business
income.
In 2017, the tax rate for C-corporation profits was 35% at the entity level and 15%
to 23.8% (including the 3.8% surtax on net investment income) for taxable dividends de-
pending on a taxpayer’s income bracket. The top marginal income tax rate for wages was
39.6%. The payroll tax rate was 12.4% for the first $118.5K of wages. The more relevant
marginal incentives for top earners were the uncapped social insurance taxes of 2.9% for
Medicare and 0.9% for the Affordable Care Act. Thus, a high-income C-corporation owner-
manager saved 7.1%—(35 + .238 × (100 − 35)) − (39.6 + 3.8)—on the margin by paying
herself as wages; a high-income S-corporation owner-manager saved 3.8% in payroll and
social insurance taxes by paying herself in profits. Comparing corporate forms, the lowest
rate for a C-corporation owner-manager was 43.4%, which exceeded the 39.6% rate for an
S-corporation owner-manager. This wedge encouraged firms to organize as S-corporations
and label owner-manager income as profits.1
A related change in the organization of business activity is the growth of partnerships.
Following TRA86 and state law changes permitting partnerships to receive limited liability
protection, many firms that might have otherwise chosen C-corporation form instead orga-
nized as partnerships. This option appeals especially to firms, such as large law firms and
consultancies with too many owners to receive pass-through tax treatment as S-corporations,
and financial firms that have non-individual investors as limited partners. Unlike the case
of S-corporations, owner-managers of partnerships receive little pay as wages. Instead, their
compensation is ordinary business income (i.e., profits) and guaranteed payments, both of
which enter the national accounts as proprietors’ income in the noncorporate business sec-
tor. The tax treatment of this compensation can allow partners to avoid payroll and social
insurance taxes just like in S-corporations (OTA, 2016).
B Data
Administrative tax data. Our event studies use de-identified administrative tax data
from 1996 to 2016 for the population of C-corporations and S-corporations. We use a sample
of firms that switch from C-corporation to S-corporation form between 2000 and 2012, which
1S-corporation owner-manager compensation is required to be “reasonable” and reflect the value of marketservices. In practice, the IRS rarely adjusts S-corporation owner tax liabilities (Auten, Splinter and Nelson,2016; Nelson, 2016).
4
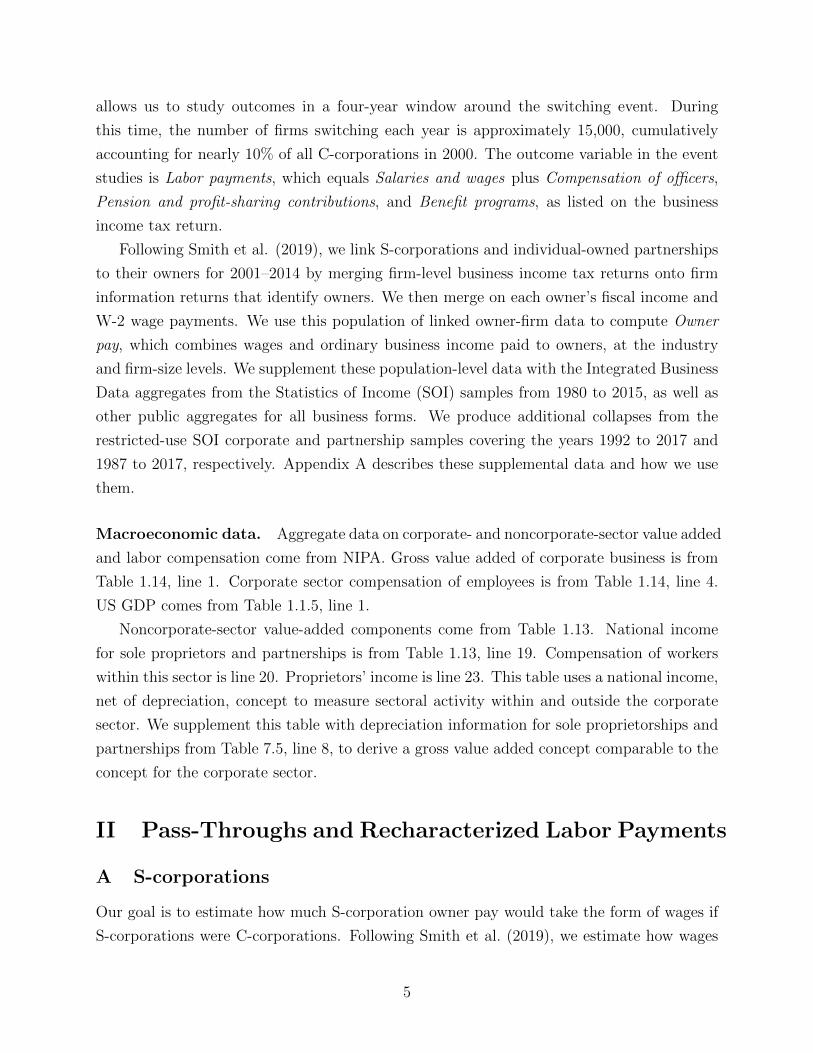
allows us to study outcomes in a four-year window around the switching event. During
this time, the number of firms switching each year is approximately 15,000, cumulatively
accounting for nearly 10% of all C-corporations in 2000. The outcome variable in the event
studies is Labor payments, which equals Salaries and wages plus Compensation of officers,
Pension and profit-sharing contributions, and Benefit programs, as listed on the business
income tax return.
Following Smith et al. (2019), we link S-corporations and individual-owned partnerships
to their owners for 2001–2014 by merging firm-level business income tax returns onto firm
information returns that identify owners. We then merge on each owner’s fiscal income and
W-2 wage payments. We use this population of linked owner-firm data to compute Owner
pay, which combines wages and ordinary business income paid to owners, at the industry
and firm-size levels. We supplement these population-level data with the Integrated Business
Data aggregates from the Statistics of Income (SOI) samples from 1980 to 2015, as well as
other public aggregates for all business forms. We produce additional collapses from the
restricted-use SOI corporate and partnership samples covering the years 1992 to 2017 and
1987 to 2017, respectively. Appendix A describes these supplemental data and how we use
them.
Macroeconomic data. Aggregate data on corporate- and noncorporate-sector value added
and labor compensation come from NIPA. Gross value added of corporate business is from
Table 1.14, line 1. Corporate sector compensation of employees is from Table 1.14, line 4.
US GDP comes from Table 1.1.5, line 1.
Noncorporate-sector value-added components come from Table 1.13. National income
for sole proprietors and partnerships is from Table 1.13, line 19. Compensation of workers
within this sector is line 20. Proprietors’ income is line 23. This table uses a national income,
net of depreciation, concept to measure sectoral activity within and outside the corporate
sector. We supplement this table with depreciation information for sole proprietorships and
partnerships from Table 7.5, line 8, to derive a gross value added concept comparable to the
concept for the corporate sector.
II Pass-Throughs and Recharacterized Labor Payments
A S-corporations
Our goal is to estimate how much S-corporation owner pay would take the form of wages if
S-corporations were C-corporations. Following Smith et al. (2019), we estimate how wages
5

and profits evolve after a firm’s choice to reorganize from C-corporation to S-corporation
form with an event study:
Yit =∑
k∈{−5+,−4,−3,−2,0,1,2,3,4,5+}
γk1(t = k) + αi + δt + εit, (1)
where Yit is total wage payments or profits divided by contemporaneous firm sales, γk are
the coefficients of interest on event time indicators, αi are firm fixed effects, and δt are
calendar-year fixed effects. The analysis sample includes 183K firms that switch corporate
form between 2000 and 2012, that have maximum sales greater than $100,000 in 2014 dollars,
and that exist for at least 4 years before and after the switch event. Appendix B provides
summary statistics.
As in Smith et al. (2019), a nontrivial share of S-corporation profits would have been
reported as labor payments if the firms organized as C-corporations. For all firms in our
sample, over 2% of sales are suddenly paid as profits instead of wages upon switching. We
interpret the immediate divergence in both profits and labor payments to reflect recharac-
terized wages rather than technological changes around the switch.2
To map micro estimates to aggregate quantities, we depart from Smith et al. (2019)
and estimate heterogeneous impacts by firm size. Figure 2A estimates the effects on labor
payments for firms divided into groups based on mean firm sales. We partition firms based
on mean sales with boundaries at $100K, $500K, $1M, $10M, and $100M in 2014 dollars.
Scope for relabeled labor income is greater among smaller firms, as effect sizes monotonically
decrease with firm size. Effect sizes exceed 2% of sales even among firms with $1M to $10M
in sales and are meaningful (1.1% of sales) for firms in the $10M to $100M size group.
Only the largest firms show no relabeling response upon switching.3 Other variables do not
experience major declines following switching events (Appendix B).
Among S-corporations, mid-market firms account for a substantial share of aggregate
activity. Firms with less than $10M and firms with $10M to $100M in average sales respec-
tively account for 51% and 30% of total S-corporation value added, 38% and 34% of total
sales, and 65% and 25% of total owner pay in the most recent available years (Figure 2B).
2Appendix Figure A.1A presents a plot showing the immediate divergence between profits and wagesin the switching year. Appendix Table A.4 presents regression estimates and alternative specifications.We estimate effects relative to firm sales rather than measures of value added to minimize the impact ofaccounting changes on the scaling variable and to permit loss firms to enter the sample. Our homogeneousestimates differ slightly from Smith et al. (2019) because we use a longer sample and broaden the definitionof wage payments using new data.
3Appendix Figure A.1B plots effects for the five largest industries in terms of S-corporation profits in2017. Each industry shows a large decline in labor payments after switching, though firms in white-collarservices show larger effects.
6

To transform these event studies into a post-switch estimate of recharacterized wages,
define γ to be the average of γk for the post period k ∈ 0, 1, 2, 3, 4 where the outcome is total
wage payments relative to firm sales. We report two averages: γE and γS for equal and size
weights, respectively. We estimate γE to be 2.44% of sales. To account for heterogeneity by
firm size, we estimate a variant of (1) that permits γk to differ by firm size. Specifically, we
estimate
Yit =∑
k∈{−5+,−4,−3,−2,0,1,2,3,4,5+}
∑b
γb,k1(t = k, i ∈ b) + ai + dt + eit, (2)
where b corresponds to a sales bin (defined as in Figure 2A), ai are firm fixed effects, and
dt are calendar-year fixed effects. If we estimate the average post-period effect γb at the
size-bin level and compute the weighted average using size-group level, S-corporation sales
in 2017 as weights, the estimate for γS is 1.22% of sales.
The lower size-weighted estimate follows from larger firms having smaller declines in labor
compensation as a share of their sales. This empirical feature is important for applying these
estimates to study aggregate quantities. Accordingly, we use the size-bin-specific estimates to
ask how much S-corporation activity would be recorded as labor income within the corporate
sector if all S-corporations were instead C-corporations. We use the estimates 3.25%, 2.61%,
2.12%, and 1.09% for the respective size groups in Figure 2 (excluding the top group).
Because S-corporation profits cannot be more than 100% capital income and because the
largest bin’s confidence intervals are positive but include zero, we set the coefficient for the
largest bin γ100M+ equal to zero. Thus, in our adjustment, S-corporation profits among firms
with sales greater than $100M are entirely capital. We make the same assumption for firms
with less than $100K in sales, which can be financial conduits and account for a minimal
share of aggregate revenues and profits.
We draw on linked owner-firm data for S-corporations from 2001 to 2014 and use the
size-bin-specific γb’s to construct an implied labor share for S-corporation owners ωSb,t:
ωSb,t =
Owner WagesSb,t + γb × SalesSb,t
Owner PaySb,t
. (3)
Here, γb × SalesSb,t represents the contribution of recharacterized wages for owners to the
labor share. In 2014, applying (3) delivers ωSb,2014 equal to 62.5%, 63.4%, 58.9%, 47.5%, and
15.2% for the respective size groups in Figure 2B.
7
B Recharacterized Wages in Partnerships
Unlike S-corporations, partnerships do not face reasonable compensation rules and instead
compensate owner-managers via profit distributions. To construct a concept of labor share
for partnership owners, we develop an estimate in a consistent fashion to the estimate from
S-corporations. The goal is to estimate how much owner pay would take the form of wages
if partnerships were C-corporations.
We assume the share of owner pay (i.e., wages plus profits) that partnerships would report
as wages equals the share for similarly-sized S-corporations, i.e., we assume ωPb,t = ωS
b,t. We
then use linked owner-firm data for partnerships to construct size-bin shares of owner pay
from the partnership sector each year. These size-bin shares serve as weights for computing
an aggregate labor share ωPt for partnership owners in year t.
In 2014, we estimate a labor share of owner pay ωPt equal to 41.9%. Large firms account
for a larger share of owner pay among partnerships (Figures 2B and 2C), so this figure is
lower than the analog for S-corporations. During the period when our linked owner-firm
data are available, ωPt falls from 55.9% in 2001 to 41.9% in 2014, which reflects the entry of
larger firms into the partnership sector over time.4
III Labor Shares after Pass-Through Adjustments
A S-corporations
How much would the corporate-sector labor share have declined if all S-corporations were
C-corporations? To answer this question, we recompute the corporate-sector labor share
after adding S-corporation recharacterized wages to the numerator, leaving the denominator
unchanged. For each firm-size bin and year, S-corporation recharacterized wages equal the
size-bin-specific γb from Section A multiplied by sales in that bin. In 2017, we estimate that
$99B of aggregate S-corporation profits are recharacterized wages. Table 1 provides a simple
way to understand the $99B estimate. In 2017, aggregate S-corporation sales equal $8.12T
and the 2017-sales-bin-weighted mean of γb equals 1.22%. Their product equals $99B.
Accounting for S-corporation recharacterized wages, the aggregate labor share in 2017
is understated by 0.89 percentage points. How important is this adjustment for the decline
in the labor share? The labor share fell from 62.9% in 1978 to 57.9% in 2017, equal to 5.0
percentage points. Hence, our adjustment implies that 17.7% of the decline in the corporate
labor share is due to tax-motivated growth of S-corporations.
4We use 55.9% for years prior to 2001 and 41.9% for years after 2014.
8

Figure 3A displays the results for the full time series. The S-corporation adjustment opens
up immediately after TRA86, consistent with research documenting immediate adjustments
for many firms (Feenberg and Poterba, 1993; Gordon and Slemrod, 2000). The adjustment
widens modestly over time. Two factors explain why this widening is less pronounced than
the overall growth of pass-through firms. First, as ownership rules for S-corporations relaxed,
larger and more capital-intensive S-corporations account for a growing share of activity.
Thus, in later years, more activity falls into size bins where we estimate lower recharacterized-
wage shares. Second, as partnership form became more flexible and legally substitutable for
corporate form in the 1990s, growth in the pass-through sector shifted from S-corporations
to partnerships.
B Partnerships
We now estimate a counterfactual labor share in the case where tax-motivated growth of
partnerships would have instead occurred in C-corporation form. Reincorporating part-
nerships requires a few considerations that complicate the calculation relative to the case of
S-corporations. First, because the national accounts do not separate sole proprietorships and
partnerships, we need to remove sole proprietors from aggregate series. Second, there existed
a baseline level of partnership activity prior to TRA86. We want to exclude these partner-
ships from our exercise to focus on partnership growth that is likely to be tax-motivated.
Table 1C walks through our computation in steps for 2017. The first step is to isolate
partnerships in the sole-proprietorships-and-partnership value added series from the BEA.
This series relies on partnership and sole proprietor tax filings plus adjustments to align
definitions with national income concepts.5
In 2017, gross value added for sole proprietorships and partnerships is $3.29T. Gross
value added equals the sum of three components: (1) labor compensation is $1.13T; (2)
proprietors’ income (i.e., non-W2 payments to sole proprietors and partners) accounts for
$1.50T; and (3) rental income, net interest, and depreciation account for $0.66T. To estimate
each component of gross value added for partnerships, we use the partnership share of the
analogous component from SOI aggregates for sole proprietorships and partnerships. For
example, in 2017 partnerships generated 82.2%, 72.30%, and 81.5% of combined partner-
ship and sole proprietorship employee compensation, proprietors’ income, and other capital
income, respectively.6
5The largest adjustments in the BEA series include misreporting, reducing payments to corporate partnersthat appear in the corporate sector’s account, and reducing partnership payments for payments made to otherpartnerships that would otherwise be double-counted. Pearce (2015) and Cooper et al. (2016) discuss howtiered partnerships complicate measurement of aggregate partnership income.
6For proprietors’ income, we use aggregate sole proprietorship and partnership proprietors’ income from
9

For 2017, we therefore allocate these respective shares of each component of sole-proprietorship-
and-partnership gross value added to partnerships. We compute this allocation share each
year to account for different growth rates between the partnership and sole proprietorship
sectors and among components.
The second step is to compute a baseline level of partnership value added that we assume
would have remained outside the corporate sector. We set this baseline to be the 1986 level of
partnership value added as a share of GDP. By construction, this assumption ensures there
is no difference between the adjusted and unadjusted corporate sector amounts in 1986 and
before. Subsequently, as the noncorporate sector grows relative to GDP and the partnership
sector grows relative to the sole proprietorship sector, the amount of partnership activity
to be reincorporated increases. We compute baseline 1986 shares of GDP component-by-
component because labor compensation and proprietors’ income have grown faster than other
capital income within gross value added.
The third step is to compute excess partnership value added by subtracting the 1986
baseline from actual partnership value added. In 2017, the amount of employee compen-
sation attributed to partnerships is $925B (= 82.2% × $1.13T ). Baseline 1986 employee
compensation in partnerships as a share of GDP is 2.0%, which yields a baseline level of
$396B. Hence, we estimate the excess employee compensation is $529B (= $925B− $396B).
The analogous excess amounts for proprietors’ income and other capital income are $469B
and $73B.
The fourth step is to decompose the components of excess value added into labor and
capital. Employee compensation and other capital income are 100% labor and 100% capital,
respectively. For proprietors’ income, we use the labor share of owner pay ωPt from Section
B. In 2017, ωPt equals 41.9%.7
In the final step, we estimate the corporate-sector labor share after reincorporating part-
nership activity that exceeds its 1986 level. In particular, we add excess employee compensa-
tion and the labor share of proprietors’ income to the numerator of the corporate-sector labor
share. We add all three excess partnership components, which sum to excess partnership
value added, to the denominator.
The last lines of Table 1C report the results for 2017. The sum of excess partnership
profits and W2 wages paid to partners is $485B (≈ $469B+ 17B). Multiplying this amount
by 41.9% yields $204B of labor compensation to partners. We then subtract the $17B in
NIPA to avoid double-counting profits in the partnership sector. See Appendix C for details.7Before applying ωP
t , we add wages paid to partners from our linked data, which is small relative toowner pay for partnerships ($17B in 2017). Our baseline ωP
t might be conservative. For example, Piketty,Saez and Zucman (2018) assume the labor share of proprietors’ income is 70%. We consider less conservativeassumptions in Table 2.
10

W2 wages paid to partners, which are included in the employee compensation category, to
obtain our estimate of $187B for partnership recharacterized wages.
In 2017, our adjustment adds $716B (≈ $529B+$187B) of partnership labor income and
$1.07T (≈ $529B+ $469B+ $73B) of partnership value added to the corporate sector. As a
result, we estimate that the aggregate corporate labor share is understated by 0.79 percentage
points due to tax-motivated migration of relatively labor-intensive business activity from C-
corporation form into the noncorporate sector. Relative to the 5.0 percentage-point decline
of the raw series, our 0.79-percentage-point partnership adjustment explains 15.8% of the
corporate-sector labor share decline.
Figure 3B displays the full time series of results for our partnership adjustment. The
graph shows that the partnership adjustment makes little difference until the late 1990s. In
recent years, the labor share in the partnership sector exceeds the labor share in the corporate
sector by more than ten percentage points. For example, in 2017 the implied labor share for
reincorporated activity is 66.9% (= $715B/$1.07T ).
This fact reflects compositional differences across corporate form. Partnerships are now
predominantly service-sector firms, such as law firms, consultancies, and financial services,
whereas the corporate sector includes more capital-intensive activity in manufacturing and
trade, especially among C-corporations. This evolution can be seen in the surge of pro-
prietors’ income relative to interest, taxes, and depreciation, which matches the rise in
partnership profits since the 1990s. The time series closely follows state-level legal reforms
that extended limited liability to partnerships and the 2001 tax cuts that increased the tax
advantage of pass-throughs.
C Overall Effect of Pass-Through Growth on the Labor Share
Figure 3C and Table 1A-B combine the S-corporation and partnership adjustments. Over the
1978–2017 period, our corporate labor share series after both adjustments shows a decline
of 3.4 percentage points, 31.9% (1.6pp) smaller than the 5.0 percentage point decline in
the raw BEA data. Instead of the corporate labor share declining from 62.9% in 1978 to
57.9% in 2017, our adjusted labor share declined from 62.9% to 59.5% in 2017.8 Because our
S-corporation adjustment primarily affects the pre-2000 series, our partnership adjustment
contributes more to flattening the recent downward trend.
By increasing the share of economic activity in the corporate sector, our adjustment
8Appendix Table A.5 shows this result is robust to different start and end points by comparing thefive-year average of 1978–1982 versus 2013–2017. Note the overall effect (1.6pp) differs from the sum ofthe individual efffects (0.9pp and 0.8pp) because the partnership adjustment increases the denominator.Appendix Figure A.4 applies these adjustments to the overall labor share.
11

also alters the trend in corporate gross value added relative to GDP. Instead of flattening
and declining since the 1980s, the series continues the trend extending back to the 1950s
of increasing corporate activity. In 2017, adjusted corporate sector value added is 62.3% of
GDP, instead of 56.8% in the unadjusted series (Appendix Figure A.3).
Appendix Table A.1 decomposes the adjustment into contributions by three-digit indus-
try for 2017. The three most important are Professional, Scientific, and Technical Services;
Outpatient Healthcare; and Other Financial Services, which respectively contribute 27%,
14%, and 11% of the labor share adjustment. Thus, more than half of the adjustment comes
from skilled-service firms in capital-light industries.
Table 2 explores the robustness of our adjusted corporate labor share (see Appendix C
for details). One concern is that our analysis relies on estimates from the population of
non-random corporate form switchers.9 To address this concern, we consider alternative
recharacterized-wages estimates and changes to the event study specification. We also con-
sider a version of the partnership adjustment that allows the largest partnerships—which in-
clude consultancies, law firms, accountancies, and financial service firms that clearly provide
human-capital services compenstated via nonwage income—to have nonzero recharacterized
wages. Across sensitivity analyses, we find that the tax-motivated growth in pass-throughs
explains between 26.8% and 40.4% of the decline in the corporate labor share.
To be clear, our empirical argument is (a) an increasing share of corporate activity is
occurring in pass-through form rather than C-corporation form; and (b) pass-through owner-
managers pay themselves less in wages and more in profits for tax purposes. The legal services
industry (NAICS 5411) offers a striking example of these dynamics (Appendix Figure A.5).
Between 1994 and 2016, the total number of law firms increased steadily. Nearly all of this
growth came via S-corporations, which rose from 25K to 113K. In contrast, the number of
C-corporations declined. In terms of activity shares, C-corporations initially accounted for
75.9% of corporate receipts, which steadily declined to 33.0%. Even in the early 1990s, when
C-corporations accounted for the majority of corporate receipts, these firms accounted for
less than 20% of law firm profits. Instead, firm surplus was distributed as wages to avoid
payout tax for owners. The evolution of law firms toward pass-through form implies that
income once characterized as corporate-sector wages now appears as S-corporation profits or
noncorporate partnership income.10
9We may overstate recharacterized wages if these firms are most likely to benefit from switching. However,auditing firms with prior tax returns as C-corporations for aggressive recharacterization would be relativelyeasy compared to auditing new firms. We may therefore understate the extent of recharacterized wages ifthese firms tend to be conservative tax planners.
10While there are relatively few law firm partnerships, these firms are large within the industry. Includingpartnership receipts, C-corporations account for less than 20% of total receipts in 2014.
12

The recharacterized-wage share of pass-through income is lower than the estimate of
the human-capital share of pass-through income implied by the owner-death and owner-
retirement estimates of Smith et al. (2019). This broader concept of human capital includes,
for example, returns to sweat equity (Bhandari and McGrattan, 2021) or spillovers due to
firm-level productivity effects of owner-managers (Jager and Heining, 2019; Choi et al., 2021).
Regarding recharacterized wages, in firms with active and passive owners, agency frictions
that encourage incentive pay structures likely prevent some C-corporations from distributing
all profits as wages. IRS rules may also discourage this behavior. Indeed, Smith et al. (2019)
find that wage and profit responses to corporate-form switches are smaller when firms do
not have a majority owner. Such frictions would not affect estimates of the human-capital
share of a pass-through firm’s income, despite reducing the share of pass-through income
that would appear as wages if the firm were a C-corporation. The latter is key to answering
this paper’s central question: how much would the BEA’s measured labor share change if
pass-through firms were instead C-corporations?
IV Conclusion
Our key finding is that adjusting for pass-through growth raises the 2017 corporate-sector
labor share by 1.6 percentage points and implies the 1978–2017 decline is overstated by
31.9%. While our emphasis on pass-throughs does not preclude the importance of other
mechanisms, it does provide new evidence that can help guide future investigation.
We draw five lessons from our analysis. First, all of the decline in our adjusted series oc-
curred since the early 2000s. Many studies do not focus on mechanisms that strengthened in
the 2000s, but there are prominent exceptions. Autor et al. (2020) (henceforth ADKPV) find
that, in manufacturing, transportation, and wholesale trade, concentration rose especially
strongly since 2000, and they connect rising concentration to falling labor shares. Barkai
(2020) finds evidence of rising markups in the 2000s. Autor and Salomons (2018) emphasize
a rise in labor-substituting technology since the 1980s, note the acceleration in the labor
share’s decline since 2000, but do not argue technology can account for the acceleration.
Second, ADKPV emphasize the role of superstar firms. Our findings adjust mid-market
firms more than large firms, yielding a larger contribution of the biggest firms to the labor
share’s decline. Thus, in terms of timing and the firm size distribution, our results reinforce
the role played by superstar firms in the labor share decline.
Third, our results reflect the rise of the skilled service sector (Buera and Kaboski, 2012)
and the tendency of service-sector firms to elect pass-through form and optimize payments to
owners in response to taxes. In contrast, trends in manufacturing drive most of the overall
13

decline in the economy-wide labor share.11 Labor share growth in the services sector is
higher with our adjustment, further underscoring the role of manufacturing for the overall
decline. Elsby, Hobijn and Sahin (2013); Karabarbounis and Neiman (2014); Acemoglu and
Restrepo (2020); Kehrig and Vincent (2018); and Charles, Hurst and Schwartz (2019) stress
mechanisms affecting manufacturing: offshoring, investment prices, robots, hyperproductive
establishments, and skill mismatch, respectively.
Fourth, our analysis concerns tax factors that may be unique to the U.S. A natural
question concerns whether we can draw lessons for international patterns. Capital taxes have
fallen more than labor income taxes across many economies (Auerbach, 2006), so the general
idea could apply elsewhere. In other countries, one commonly sees deferral of compensation
among private businesses, either as retained earnings or generous life insurance and pensions
(Kopczuk and Zwick, 2020). These forces could affect the labor share in Europe.
While Karabarbounis and Neiman (2014) document declines in several countries, the ev-
idence on the global decline reveals significant heterogeneity and large outliers.12 Separately,
Gutierrez and Piton (2020) argue that the decline outside the U.S. is not robust. They focus
on the inclusion of self-employed income and real estate in the corporate sector in other
countries and how these components bias the labor share toward a downward trend.13 Thus,
cross-country heterogeneity leaves room for a U.S.-specific story for a sharp decline in the
U.S. corporate-sector labor share.
Last, our work complements recent studies on the effect of taxes on macroeconomic mea-
surement. These forces operate mainly within large public and manufacturing companies
that prevail as C-corporations. Guvenen et al. (2017) find that transfer pricing arrange-
ments distort the balance of payments, as profits are shifted overseas to avoid U.S. corporate
taxation. Tørsløv, Wier and Zucman (2020) find that U.S. multinationals shift profits to
tax havens and avoid repatriating them, and this shifting has grown over time. Both trans-
fer pricing and profit shifting may lead the corporate-sector labor share to be overstated.
Koh, Santaeulalia-Llopis and Zheng (2020) find that the change in treatment of intellectual
property products in the national accounts flattens the pre-2000 decline in the labor share,
11Following Elsby, Hobijn and Sahin (2013), we decompose the official series into broad industries (Ap-pendix Figure A.6). The contribution from manufacturing to the decline is 7.5 percentage points, which wasoffset by the rise in services. Without the manufacturing decline, the aggregate labor share would have risen3.8 points.
12In EUKLEMS data from 1987 to 2011, three of the largest European economies—the U.K., France, andItaly—do not show declines (Appendix Figure A.7). The U.S. shows a larger decline than all Europeancountries except Norway, an economy 3% the size of the U.S. From 1995 to 2011, Scandinavian countriesexperience declines, as do most former Soviet Socialist Republics (perhaps including East Germany’s contri-bution to the German trend). Drawing strong conclusions from these smaller economies and those undergoingtransition from communism to capitalism is hard.
13Rognlie (2016) also cites increasing housing costs, but does not focus on the corporate sector.
14

leaving a substantial decline that our revised series also shows.
Following the 2017 tax reform, firms face new incentives to select the tax-minimizing cor-
porate form and owner-manager compensation due to, for example, the lower C-corporation
tax rate and the qualified business income deduction for pass-through firms. As these in-
centives are understood, investigating future trends in the labor share will require grappling
with the nuances of the tax code.
15
References
Acemoglu, Daron, and Pascual Restrepo. 2020. “Robots and Jobs: Evidence from USlabor markets.” Journal of Political Economy, 128(6): 2188–2244.
Auerbach, Alan J. 2006. “The Future of Capital Income Taxation.” Fiscal Studies,27(4): 399–420.
Auten, Gerald, David Splinter, and Susan Nelson. 2016. “Reactions of High-IncomeTaxpayers to Major Tax Legislation.” National Tax Journal, 69(4): 935–964.
Autor, David, and Anna Salomons. 2018. “Is Automation Labor Share-Displacing?Productivity Growth, Employment, and the Labor Share.” Brookings Papers on EconomicActivity, 2018(1): 1–87.
Autor, David, David Dorn, Lawrence F. Katz, Christina Patterson, and JohnVan Reenen. 2020. “The Fall of the Labor Share and the Rise of Superstar Firms.”Quarterly Journal of Economics, 135(2): 645–709.
Azmat, Ghazala, and Rosa Ferrer. 2017. “Gender Gaps in Performance: Evidence fromYoung Lawyers.” Journal of Political Economy, 125(5): 1306–1355.
Barkai, Simcha. 2020. “Declining Labor and Capital Shares.” Journal of Finance,75(5): 2421–2463.
Bhandari, Anmol, and Ellen McGrattan. 2021. “Sweat Equity in US Private Business.”Quarterly Journal of Economics, 136(2): 727–781.
Buera, Francisco J., and Joseph P. Kaboski. 2012. “The Rise of the Service Economy.”American Economic Review, 102(6): 2540–2569.
Charles, Kerwin Kofi, Erik Hurst, and Mariel Schwartz. 2019. “The Transformationof Manufacturing and the Decline in US Employment.” NBER Macroeconomics Annual,33(1): 307–372.
Choi, Joonkyu, Nathan Goldschlag, John C. Haltiwanger, and J. Daniel Kim.2021. “Founding Teams and Startup Performance.” NBER Working Paper No. 28417.
Cooper, Michael, John McClelland, James Pearce, Richard Prisinzano, JosephSullivan, Danny Yagan, Owen Zidar, and Eric Zwick. 2016. “Business in the UnitedStates: Who Owns It, and How Much Tax Do They Pay?” Tax Policy and the Economy,30(1): 91–128.
Elsby, Michael W.L., Bart Hobijn, and Aysegul Sahin. 2013. “The Decline of theU.S. Labor Share.” Brookings Papers on Economic Activity, 2013(2): 1–63.
Feenberg, Daniel, and James Poterba. 1993. “Income Inequality and the Incomes ofVery High-Income Taxpayers: Evidence from Tax Returns.” Tax Policy and the Economy,7: 145–177.
16

Fleck, Susan, Steven Rosenthal, Matthew Russell, Erich H. Strassner, andLisa Usher. 2014. “A Prototype BEA/BLS Industry-Level Production Account for theUnited States.” In Measuring Economic Sustainability and Progress. 323–372. Universityof Chicago Press.
Gollin, Douglas. 2002. “Getting Income Shares Right.” Journal of Political Economy,110(2): 458–474.
Gordon, Roger, and Joel Slemrod. 2000. “Are ‘Real’ Responses to Taxes Simply In-come Shifting between Corporate and Personal Tax Bases?” In Does Atlas Shrug? TheEconomic Consequences of Taxing the Rich. , ed. Joel Slemrod, Chapter 8, 240–288. Cam-bridge, MA:Russell Sage Foundation Books at Harvard University Press.
Gutierrez, German, and Sophie Piton. 2020. “Revisiting the Global Decline of the(Non-Housing) Labor Share.” American Economic Review: Insights, 2(3): 321–338.
Guvenen, Fatih, Raymond J. Mataloni Jr, Dylan G. Rassier, and Kim J. Ruhl.2017. “Offshore Profit Shifting and Domestic Productivity Measurement.” NBER WorkingPaper No. 23324.
Jager, Simon, and Jorg Heining. 2019. “How Substitutable are Workers? Evidence fromWorker Deaths.” MIT Working Paper.
Kaplan, Steven N., and Joshua Rauh. 2010. “Wall Street and Main Street: Whatcontributes to the rise in the highest incomes?” Review of Financial Studies, 23(3): 1004–1050.
Karabarbounis, Loukas, and Brent Neiman. 2014. “The Global Decline of the LaborShare.” Quarterly Journal of Economics, 129(1): 61–103.
Kehrig, Matthias, and Nicolas Vincent. 2018. “Growing Productivity without GrowingWages: The Micro-Level Anatomy of the Aggregate Labor Share Decline.” ERID WorkingPaper No. 244.
Koh, Dongya, Raul Santaeulalia-Llopis, and Yu Zheng. 2020. “Labor Share Declineand Intellectual Property Products Capital.” Econometrica, 88(6): 2609–2628.
Kopczuk, Wojciech, and Eric Zwick. 2020. “Business Incomes at the Top.” Journal ofEconomic Perspectives, 34(4): 27–51.
Nelson, Susan C. 2016. “Paying Themselves: S Corporation Owners and Trends in SCorporation Income, 1980–2013.” OTA Working Paper 107.
OTA. 2016. “Gaps betewen the Net Investment Income Tax Base and the Employment TaxBase.” Office of Tax Analysis, U.S. Department of the Treasury, Washington, DC.
Pearce, James. 2015. “Measuring Aggregate Business Income with Tax Data.” NationalTax Journal, 68(4): 1025–1046.
17

Piketty, Thomas, Emmanuel Saez, and Gabriel Zucman. 2018. “Distributional Na-tional Accounts: Methods and Estimates for the United States.” Quarterly Journal ofEconomics, 133(2): 553–609.
Rognlie, Matthew. 2016. “Deciphering the Fall and Rise in the Net Capital Share: Accu-mulation or Scarcity?” Brookings Papers on Economic Activity, 2016(1): 1–69.
Smith, Matthew, Danny Yagan, Owen M. Zidar, and Eric Zwick. 2019. “Capitalistsin the Twenty-first Century.” The Quarterly Journal of Economics, 134(4): 1675–1745.
Tørsløv, Thomas R., Ludvig S. Wier, and Gabriel Zucman. 2020. “The MissingProfits of Nations.” National Bureau of Economic Research. NBER Working Paper No.24701.
18

Figure 1: The Evolution of Pass-Through and Corporate Activity in the United States
A. Corporate-Sector Labor Share B. Corporate vs. Non-Corporate Gross Value(1978–2017, BEA) Added (1978–2017, BEA)
5658
6062
64La
bor S
hare
of C
orpo
rate
Val
ue A
dded
(%)
1977 1982 1987 1992 1997 2002 2007 2012 2017
1214
1618
20So
le P
rop
+ Ps
hip
Gro
ss V
alue
Add
ed o
ver G
DP
(%)
5254
5658
60C
orpo
rate
Gro
ss V
alue
Add
ed o
ver G
DP
(%)
1977 1982 1987 1992 1997 2002 2007 2012 2017
Corporate Gross Value Added Sole Proprietor + Partnership Gross Value Added
C. Business Activity in Pass-Through Form D. Value Added Across Selected Industry(1980–2016, SOI) Groups by Organizatonal Form (SOI, 2017)
010
2030
40Pr
ofits
Rel
ativ
e to
Tot
al B
usin
ess
Profi
ts (%
)
1980 1985 1990 1995 2000 2005 2010 2015
S-corporations Partnerships
040
080
012
00Va
lue
Adde
d, B
illion
s
C-corporations S-corporations Partnerships
Manufacturing Law firms, doctors' offices, and related firms
Notes: Panel A plots the labor share in the corporate sector defined as “Corporate Sector Compensationof Employees over Corporate Sector Gross Value Added” from the National Income and Product Accounts(NIPA) constructed by the Bureau of Economic Analysis. Panel B plots the share of business value addedby organizational form. Aggregate corporate sector and sole proprietorship and partnership value added issourced from NIPA Tables 1.14 and 7.5. Panel C shows profits of S-corporations and partnerships from IRSStatistics of Income (SOI) Income Tables. Panel D plots value added in key industry groups by organizationalform, computed using SOI data. Manufacturing is NAICS 31-33, and law firms, doctors’ offices, and relatedfirms are NAICS 54 and 62.
19

Figure 2: Estimating Recharacterized Wages of Pass-through Business
A. Organizational Form Switches Reveal Recharacterized Wages
-6-4
-20
2La
bor C
ompe
nsat
ion
as a
Sha
re o
f Sal
es (%
)
-4 -3 -2 -1 0 1 2 3 4Years Since Firm Switched from C-corporation to S-corporation
100K to 500K 500K to 1M 1M to 10M 10M to 100M More than 100M
B. S-corporation Activity by Firm-Size Bin C. Partnership Activity by Firm-Size Bin
010
2030
40Sh
are
of S
-cor
pora
tion
tota
l (%
)
100K to 500K 500K to 1M 1M to 10M 10M to 100M 100M+
Sales Value added Owner pay
020
4060
Shar
e of
par
tner
ship
tota
l (%
)
100K to 500K 500K to 1M 1M to 10M 10M to 100M 100M+
Sales Value added Owner pay
Notes: This figure shows inputs we use to compute recharacterized wages of S-corporations and partner-ships. Panel A shows event-study estimates for equation (2), which describe the effect of organizationalform switching on labor compensation as a share of sales, accounting for heterogeneity by business size (asmeasured by sales in constant 2014 dollars). Panels B and C show the distribution of sales and owner payacross the same size bins for S-corporations and partnerships, respectively. S-corporations with sales ofless than $100K account for 0.7% of aggregate owner pay and 0.64% of aggregate sales; partnerships withsales less than $100K account for -6.3% of aggregate owner pay and 0.34% of aggregate sales. AppendixFigure A.8 shows how the relative size of these groups has evolved over time. We weight according to thesales distribution when averaging panel A’s event-study estimates to yield an aggregate recharacterized wageshare of S-corporation receipts. Bin-specific sales are from SOI samples and owner pay is from our linkedfirm-owner data. We show sales for 2017 and owner pay for the last available year, 2014.
20

Figure 3: Adjusted Corporate-Sector Labor Shares (1978-2017)
A. Adjusting for Recharacterized S-corporation Wages56
5860
6264
66La
bor S
hare
of C
orpo
rate
Val
ue A
dded
(%)
1977 1982 1987 1992 1997 2002 2007 2012 2017
BEA Labor Share Adjusted for Recharacterized S-Corporation Wages
0.75
0.89
B. Adjusting for Partnership Growth in Noncorporate Sector
5658
6062
6466
Labo
r Sha
re o
f Cor
pora
te V
alue
Add
ed (%
)
1977 1982 1987 1992 1997 2002 2007 2012 2017
BEA Labor Share Adjusted for Inorganic Growth in Noncorporate Sector
0.07
0.79
C. Combining Both Adjustments
5658
6062
6466
Labo
r Sha
re o
f Cor
pora
te V
alue
Add
ed (%
)
1977 1982 1987 1992 1997 2002 2007 2012 2017
BEA Labor Share Adjusted Labor Share
0.65
1.60
Notes: This figure plots adjusted corporate sectors against the headline labor share computed using NIPAtable 1.14 aggregates (the “BEA labor share”). Panel A computes the labor share after adding our estimateof recharacterized wages of S-corporations to corporate-sector compensation. Specifically, we apply estimatesfrom equation (2) for each firm-size bin and year. Panel B computes the labor share after adding excesspartnership compensation growth and recharacterized wages of partnerships to corporate-sector compensa-tion, and excess partnership gross value added growth to corporate-sector gross value added. We estimaterecharacterized wages of partnerships by applying estimates from equation (3) for each firm-size bin andyear. Panel C, our preferred series, combines these adjustments.
21

Table 1: Calculation of Labor Share Adjustment (2017)
Component 2017A. BEA Corporate Labor Share
Corporate-sector employee compensation [BEA] $6.42TDivided by: Corporate-sector gross value added [BEA] $11.09TEquals: Corporate-sector labor share 57.9%
B. Pass-through-adjusted Corporate Labor ShareCorporate-sector employee compensation [BEA] $6.42TPlus: S-corporation recharacterized wages $99BPlus: Excess partnership employee compensation $529BPlus: Partnership recharacterized wages $187B
Divided by:Corporate-sector gross value added [BEA] $11.09TPlus: Excess partnership employee compensation $529BPlus: Excess partnership profits $469BPlus: Excess partnership other capital income $73B
Equals: Pass-through adjusted Corporate Labor Share 59.5%
C. Adjustment componentsS-corporation sales [SOI] $8.12TTimes: Recharacterized wages as a share of S-corporation sales 1.22%
Equals: S-corporation recharacterized wages $99B
Noncorporate employee compensation [BEA] $1.13TTimes: Partnership share of noncorporate employee compensation [SOI] 82.2%
Less: 1986 noncorporate employee compensation GDP-deflated to current year [BEA] $396BEquals: Excess partnership employee compensation $529B
Noncorporate profits (proprietors’ income) [BEA] $1.50TTimes: Partnership share of profits [SOI/BEA] 72.3%
Less: 1986 noncorporate proprietors’ income GDP-deflated to current year [BEA] $619BEquals: Excess partnership profits $469B
Noncorporate other capital income [BEA] $657BTimes: Partnership share of noncorporate other capital income [SOI] 81.5%
Less: 1986 noncorporate other capital income GDP-deflated to current year [BEA] $463BEquals: Excess partnership other capital income $73B
Excess partnership profits [above] + W-2 wages paid to partners [SOI] $485BTimes: Wages as a share of profits 41.9%
Less: W-2 wages paid to partners [SOI] $17BEquals: Partnership recharacterized wages $187B
Notes: This table summarizes our adjustments to the corporate-sector labor share. Panel A uses aggregatesfrom NIPA table 1.14 to compute the baseline labor share of corporate-sector gross value added. Panel B givesan overview of our adjustments, namely adding recharacterized wages of S-corporations and partnershipsto labor compensation and adding excess partnership gross value added to corporate sector GVA. Panel Cshows how we calculate each of the aggregates we use in Panel B to adjust the Panel A labor share.
22

Table 2: Adjusting the Labor Share under Different Specifications
1978 labor 2017 labor Decline Share decline explainedshare (%) share (%) 1978-2017 (pp) by tax reporting (%)
A. Official estimate and main specificationOfficial BEA 62.9 57.9 5.0Baseline adjustment 62.9 59.5 3.4 31.9
B. Sensitivity analysis of recharacterized wage shareUse lower bound on switchers’ confidence intervals 62.9 59.6 3.3 34.4Use upper bound on switchers’ confidence intervals 62.9 59.4 3.5 30.6Use sales minus COGS denominator for switchers event study 62.9 59.5 3.3 33.6Treat large partnerships like mid-sized S-corporations 62.9 59.9 3.0 40.4
C. Sensitivity analysis of GDP inflation correctionKeep corporate share of total VA constant at 1986 levels 62.9 59.2 3.7 26.8
D. Joint sensitivity analysis with GDP inflation correction alternativeUse confidence interval lower bounds + Keep corp. share constant 62.9 59.3 3.6 29.4Use confidence interval upper bounds + Keep corp. share constant 62.9 59.1 3.7 25.5Treat large Pships like mid-sized S + Keep corp. share constant 62.9 59.5 3.4 32.7
Notes: This table shows sensitivity analysis of our main result. Our baseline adjustment is presented inTable 1.
23

For Online Publication
A Appendix
This appendix contains supplemental analysis.
24
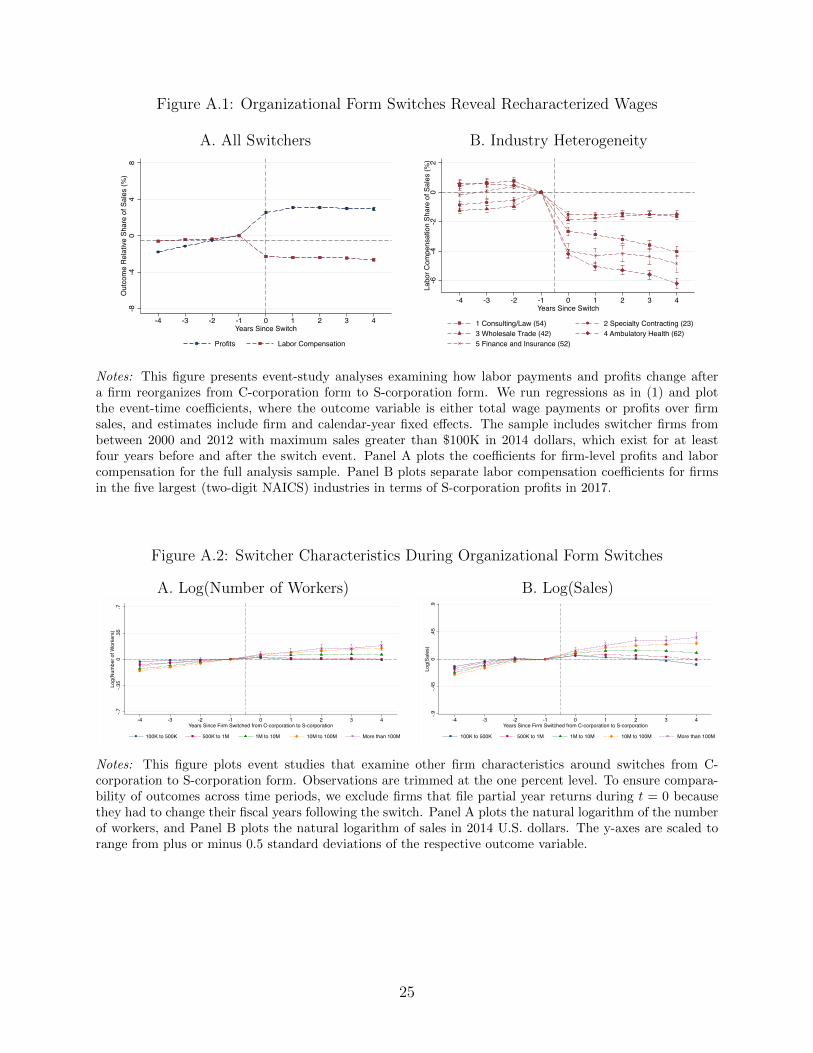
Figure A.1: Organizational Form Switches Reveal Recharacterized Wages
A. All Switchers B. Industry Heterogeneity-8
-40
48
Out
com
e Re
lativ
e Sh
are
of S
ales
(%)
-4 -3 -2 -1 0 1 2 3 4Years Since Switch
Profits Labor Compensation
-6-4
-20
2La
bor C
ompe
nsat
ion
Shar
e of
Sal
es (%
)
-4 -3 -2 -1 0 1 2 3 4Years Since Switch
1 Consulting/Law (54) 2 Specialty Contracting (23)3 Wholesale Trade (42) 4 Ambulatory Health (62)5 Finance and Insurance (52)
Notes: This figure presents event-study analyses examining how labor payments and profits change aftera firm reorganizes from C-corporation form to S-corporation form. We run regressions as in (1) and plotthe event-time coefficients, where the outcome variable is either total wage payments or profits over firmsales, and estimates include firm and calendar-year fixed effects. The sample includes switcher firms frombetween 2000 and 2012 with maximum sales greater than $100K in 2014 dollars, which exist for at leastfour years before and after the switch event. Panel A plots the coefficients for firm-level profits and laborcompensation for the full analysis sample. Panel B plots separate labor compensation coefficients for firmsin the five largest (two-digit NAICS) industries in terms of S-corporation profits in 2017.
Figure A.2: Switcher Characteristics During Organizational Form Switches
A. Log(Number of Workers) B. Log(Sales)
-.7-.3
50
.35
.7Lo
g(N
umbe
r of W
orke
rs)
-4 -3 -2 -1 0 1 2 3 4Years Since Firm Switched from C-corporation to S-corporation
100K to 500K 500K to 1M 1M to 10M 10M to 100M More than 100M
-.9-.4
50
.45
.9Lo
g(Sa
les)
-4 -3 -2 -1 0 1 2 3 4Years Since Firm Switched from C-corporation to S-corporation
100K to 500K 500K to 1M 1M to 10M 10M to 100M More than 100M
Notes: This figure plots event studies that examine other firm characteristics around switches from C-corporation to S-corporation form. Observations are trimmed at the one percent level. To ensure compara-bility of outcomes across time periods, we exclude firms that file partial year returns during t = 0 becausethey had to change their fiscal years following the switch. Panel A plots the natural logarithm of the numberof workers, and Panel B plots the natural logarithm of sales in 2014 U.S. dollars. The y-axes are scaled torange from plus or minus 0.5 standard deviations of the respective outcome variable.
25

Figure A.3: Adjusted Corporate Sector Value Added
4550
5560
65C
orpo
rate
sec
tor G
VA s
hare
of G
DP
(%)
1925 1930 1935 1940 1945 1950 1955 1960 1965 1970 1975 1980 1985 1990 1995 2000 2005 2010 2015 2020
BEA (pre-adjustment) Preferred Constant 1986 share total GVA
Notes: This figure plots gross value added (GVA) in the corporate sector relative to GDP. The BEA seriestakes total corporate sector GVA directly from line 1 of NIPA Table 1.14. The Preferred series adds grossvalue added from the partnership sector which, under our counterfactual adjustments shown in Figure 3,would have remained in the corporate sector. The “Constant 1986 share total GVA” series, which relates toTable 2C, shows corporate sector GVA as it would have been if it had remained the same share of corporate,sole proprietorship, and partnership GVA as in 1986.
26

Figure A.4: Adjusted Overall Labor Shares (1978-2017)50
5254
5658
60La
bor S
hare
of G
ross
Val
ue A
dded
(%)
1977 1982 1987 1992 1997 2002 2007 2012 2017
BEA Labor Share Adjusted Labor Share
2.07
1.99
Notes: This figure plots the effect of applying our S-corporation and partnership adjustments to the overalllabor share. This adjustment adds S-corporation recharacterized wages and the wage share of excess part-nership profits to the numerator of the overall labor share and includes the entire noncorporate businesssector in the denominator. Since both corporate and noncorporate activity are both represented in thedenominator, we make no changes to the raw BEA gross value added series. Over the 1978–2017 period,our overall labor share series after both adjustments shows a decline of 1.3 percentage points, 60.8% (2.0pp)smaller than the 3.3 percentage point decline in the raw BEA data. Relative to Figure 3C, our adjustmentsincrease the overall labor share more in earlier years because of the relationship between the unadjustedlabor share and the post-adjustment partnership labor share. Specifically, partnerships in the early 2000shave a similar labor share to the corporate sector, so adding them does not move the corporate sector share.However, they have a higher labor share than the overall series due to lower labor shares in the noncorporatesector. Accordingly, adding recharacterized partnership wages increases the noncorporate labor share andthereby the overall labor share substantially.
Figure A.5: The Evolution of Organizational Form Choice for Lawyers
A. Number of Law Firms B. Share of Activity
020
4060
8010
012
0N
umbe
r of L
aw F
irms
(thou
sand
s)
1995 2000 2005 2010 2015
C-corporations S-corporations Partnerships
020
4060
8010
0C
-cor
pora
tion
Law
Firm
Sha
re (%
)
1995 2000 2005 2010 2015
Share of Corporations Share of Corporate ReceiptsShare of Corporate Profits Share of Corporate Labor CompShare of Corps + Pships Share of Corp + Pship Receipts
Notes: For tax years from 1998 onward, we use NAICS code 5411. For tax years prior to 1998, we use SOIPrincipal Business Activity code 8111.
27

Figure A.6: The Manufacturing Sector Drives the Labor Share Decline (1987–2017)
A. Shift-Share Decomposition
-8-6
-4-2
02
4Co
mbi
ned
Com
pone
nt: 1
987-
2017
Manufa
cturin
gReta
il
Wholes
ale
Trans
porta
tion
Constr
uctio
n
Utilities
Mining
Inform
ation
Agricu
lture
Other S
vc.
Arts & Acco
mmodati
on
Financ
e
Educa
tion &
Health
Prof. &
Bus. S
vc.
B. Cumulative Labor Share Decline with and without Manufacturing
-8-7
-6-5
-4-3
-2-1
01
23
45
Cum
ulat
ive L
abor
Sha
re C
hang
e (%
)
1987 1992 1997 2002 2007 2012 2017
All Gross Value Added Excluding Manufacturing Contribution Manufacturing Contribution Only
Notes: This figure presents evidence highlighting the role of the manufacturing sector in the decline of thelabor share. Data come from the BEA industry accounts, as in Elsby, Hobijn and Sahin (2013). Panel Apresents the contribution of different industries to the decline in the labor share from 1987 to 2017. Thebars in blue show the contributions in the raw data and the red bars show the contributions after adjustingboth for the recharacterized wages of S-corporations and for businesses organized as partnerships. Panel Bpresents the cumulative change in the labor share from 1987 to 2017, excluding our adjustments for the pass-through sector. The blue line shows the cumulative decline in the labor share of all gross value added, thered line shows the cumulative change in the labor share after excluding any change due to the manufacturingsector, and the green line shows the cumulative contribution from the manufacturing sector.
28

Figure A.7: Corporate-Sector Labor Share Decline in the OECD
A. Balanced Sample (1987–2011) B. Balanced Sample (1995–2011)
-15
-10
-50
5P.
P. C
hang
e in
Lab
or S
hare
(198
7 to
201
1)
Norway
United
States
German
y
Denmark
Sweden
Finland
Netherl
ands
Belgium
France Ita
ly
United
Kingdo
m-1
5-1
0-5
05
P.P.
Cha
nge
in L
abor
Sha
re (1
995
to 2
011)
Hunga
ry
Poland
Estonia
Sloven
ia
Mexico
Norway
German
y
United
States
Austria
Spain
Belgium
Netherl
ands
Czech
Repub
lic
Sweden
Slovak
ia
Denmark
Portug
al
France
United
Kingdo
m Italy
Finland
C. Combining Small Countries (1995–2011) D. Combining Small Countries (1995–2017)
-10
-50
5P.
P. C
hang
e in
Lab
or S
hare
(199
5 to
201
1)
Mexico
Former
SSR
German
y
United
States
Benelu
x + Aus
tria
Scand
inavia
Spain
+ Port
ugal
France
United
Kingdo
m Italy
-15
-10
-50
5P.
P. C
hang
e in
Lab
or S
hare
(199
5 to
201
7)
Former
SSR
German
y
United
States
Portug
al
Benelu
x, AUT,
CHE
Greece
Scand
inavia
France
United
Kingdo
m Italy
Notes: This figure shows the decline in the corporate-sector labor share in OECD countries. In panels A-C,we use the exact series from Karabarbounis and Neiman (2014), which end in 2011, to aid comparison totheir results. Panel D uses data from the UN National Accounts Official Country Data database. Eachgraph plots the percentage point change between a beginning year and an end year. Panel A includes theOECD countries for which data are available from 1987 through 2011. Panel B plots the change from 1995to 2011 for a broader set of OECD countries with available data. Panels C and D aggregate smaller countriesby region and compute a weighted average labor share change, where the weights are corporate-sector grossvalue added in 2011 and 2017, respectively.
29

Figure A.8: Pass-through Value Added by Firm-Size Bin
A. S-corporations
010
2030
40
1990 1995 2000 2005 2010 2015
Under 1M 1M to 10M 10M to 100M 100M+
Size bin (sales in 2014 dollars) shares of S-corporation value added (%)
B. Partnerships
020
4060
1985 1990 1995 2000 2005 2010 2015
Under 1M 1M to 10M 10M to 100M 100M+
Size bin (sales in 2014 dollars) shares of partnership value added (%)
Notes: This figure extends the value added series from panels B and C of Figure 2 to show shares from 1987(partnerships) or 1991 (S-corporations) to 2017. Bottom bins are condensed into a single “under 1M” bin.
30
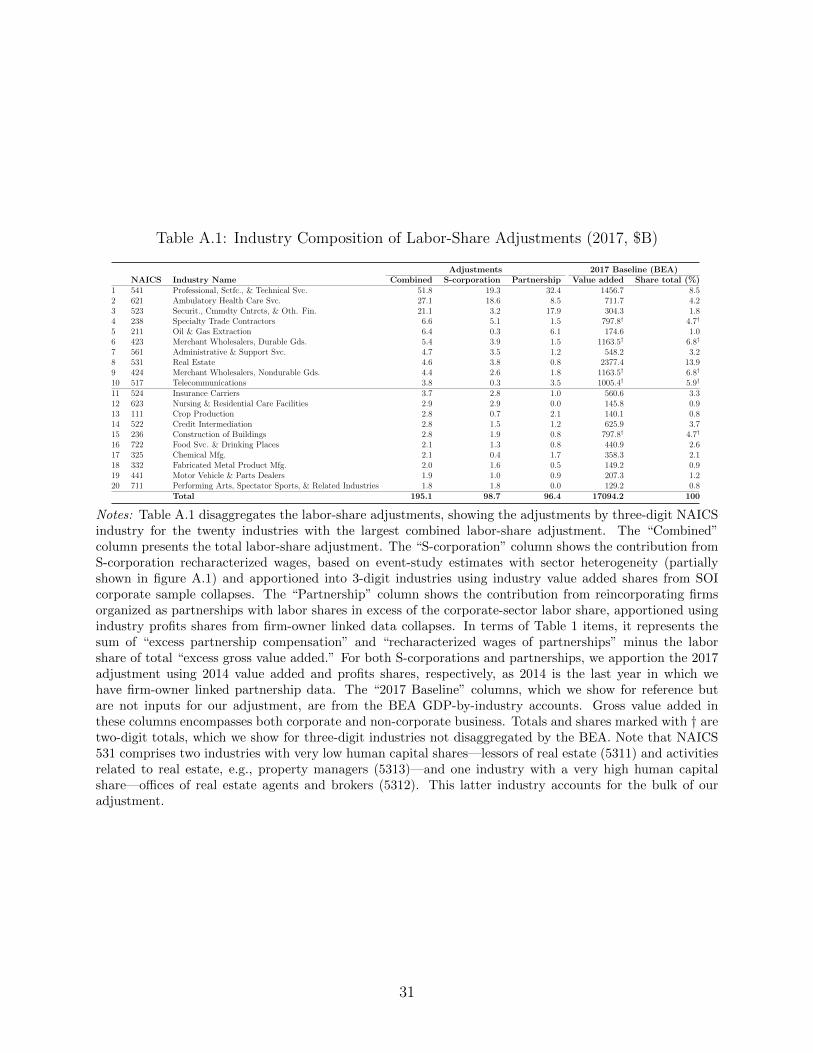
Table A.1: Industry Composition of Labor-Share Adjustments (2017, $B)
Adjustments 2017 Baseline (BEA)NAICS Industry Name Combined S-corporation Partnership Value added Share total (%)
1 541 Professional, Sctfc., & Technical Svc. 51.8 19.3 32.4 1456.7 8.52 621 Ambulatory Health Care Svc. 27.1 18.6 8.5 711.7 4.23 523 Securit., Cmmdty Cntrcts, & Oth. Fin. 21.1 3.2 17.9 304.3 1.84 238 Specialty Trade Contractors 6.6 5.1 1.5 797.8† 4.7†
5 211 Oil & Gas Extraction 6.4 0.3 6.1 174.6 1.06 423 Merchant Wholesalers, Durable Gds. 5.4 3.9 1.5 1163.5† 6.8†
7 561 Administrative & Support Svc. 4.7 3.5 1.2 548.2 3.28 531 Real Estate 4.6 3.8 0.8 2377.4 13.99 424 Merchant Wholesalers, Nondurable Gds. 4.4 2.6 1.8 1163.5† 6.8†
10 517 Telecommunications 3.8 0.3 3.5 1005.4† 5.9†
11 524 Insurance Carriers 3.7 2.8 1.0 560.6 3.312 623 Nursing & Residential Care Facilities 2.9 2.9 0.0 145.8 0.913 111 Crop Production 2.8 0.7 2.1 140.1 0.814 522 Credit Intermediation 2.8 1.5 1.2 625.9 3.715 236 Construction of Buildings 2.8 1.9 0.8 797.8† 4.7†
16 722 Food Svc. & Drinking Places 2.1 1.3 0.8 440.9 2.617 325 Chemical Mfg. 2.1 0.4 1.7 358.3 2.118 332 Fabricated Metal Product Mfg. 2.0 1.6 0.5 149.2 0.919 441 Motor Vehicle & Parts Dealers 1.9 1.0 0.9 207.3 1.220 711 Performing Arts, Spectator Sports, & Related Industries 1.8 1.8 0.0 129.2 0.8
Total 195.1 98.7 96.4 17094.2 100
Notes: Table A.1 disaggregates the labor-share adjustments, showing the adjustments by three-digit NAICSindustry for the twenty industries with the largest combined labor-share adjustment. The “Combined”column presents the total labor-share adjustment. The “S-corporation” column shows the contribution fromS-corporation recharacterized wages, based on event-study estimates with sector heterogeneity (partiallyshown in figure A.1) and apportioned into 3-digit industries using industry value added shares from SOIcorporate sample collapses. The “Partnership” column shows the contribution from reincorporating firmsorganized as partnerships with labor shares in excess of the corporate-sector labor share, apportioned usingindustry profits shares from firm-owner linked data collapses. In terms of Table 1 items, it represents thesum of “excess partnership compensation” and “recharacterized wages of partnerships” minus the laborshare of total “excess gross value added.” For both S-corporations and partnerships, we apportion the 2017adjustment using 2014 value added and profits shares, respectively, as 2014 is the last year in which wehave firm-owner linked partnership data. The “2017 Baseline” columns, which we show for reference butare not inputs for our adjustment, are from the BEA GDP-by-industry accounts. Gross value added inthese columns encompasses both corporate and non-corporate business. Totals and shares marked with † aretwo-digit totals, which we show for three-digit industries not disaggregated by the BEA. Note that NAICS531 comprises two industries with very low human capital shares—lessors of real estate (5311) and activitiesrelated to real estate, e.g., property managers (5313)—and one industry with a very high human capitalshare—offices of real estate agents and brokers (5312). This latter industry accounts for the bulk of ouradjustment.
31
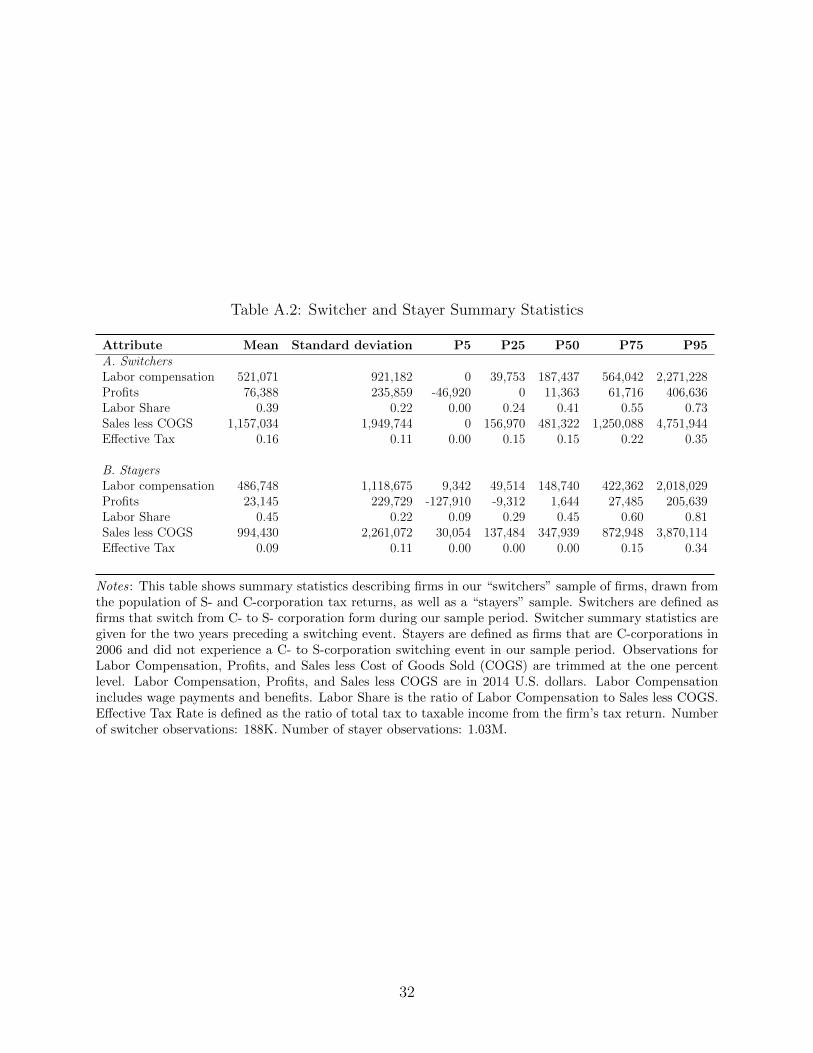
Table A.2: Switcher and Stayer Summary Statistics
Attribute Mean Standard deviation P5 P25 P50 P75 P95A. SwitchersLabor compensation 521,071 921,182 0 39,753 187,437 564,042 2,271,228Profits 76,388 235,859 -46,920 0 11,363 61,716 406,636Labor Share 0.39 0.22 0.00 0.24 0.41 0.55 0.73Sales less COGS 1,157,034 1,949,744 0 156,970 481,322 1,250,088 4,751,944Effective Tax 0.16 0.11 0.00 0.15 0.15 0.22 0.35
B. StayersLabor compensation 486,748 1,118,675 9,342 49,514 148,740 422,362 2,018,029Profits 23,145 229,729 -127,910 -9,312 1,644 27,485 205,639Labor Share 0.45 0.22 0.09 0.29 0.45 0.60 0.81Sales less COGS 994,430 2,261,072 30,054 137,484 347,939 872,948 3,870,114Effective Tax 0.09 0.11 0.00 0.00 0.00 0.15 0.34
Notes: This table shows summary statistics describing firms in our “switchers” sample of firms, drawn fromthe population of S- and C-corporation tax returns, as well as a “stayers” sample. Switchers are defined asfirms that switch from C- to S- corporation form during our sample period. Switcher summary statistics aregiven for the two years preceding a switching event. Stayers are defined as firms that are C-corporations in2006 and did not experience a C- to S-corporation switching event in our sample period. Observations forLabor Compensation, Profits, and Sales less Cost of Goods Sold (COGS) are trimmed at the one percentlevel. Labor Compensation, Profits, and Sales less COGS are in 2014 U.S. dollars. Labor Compensationincludes wage payments and benefits. Labor Share is the ratio of Labor Compensation to Sales less COGS.Effective Tax Rate is defined as the ratio of total tax to taxable income from the firm’s tax return. Numberof switcher observations: 188K. Number of stayer observations: 1.03M.
32
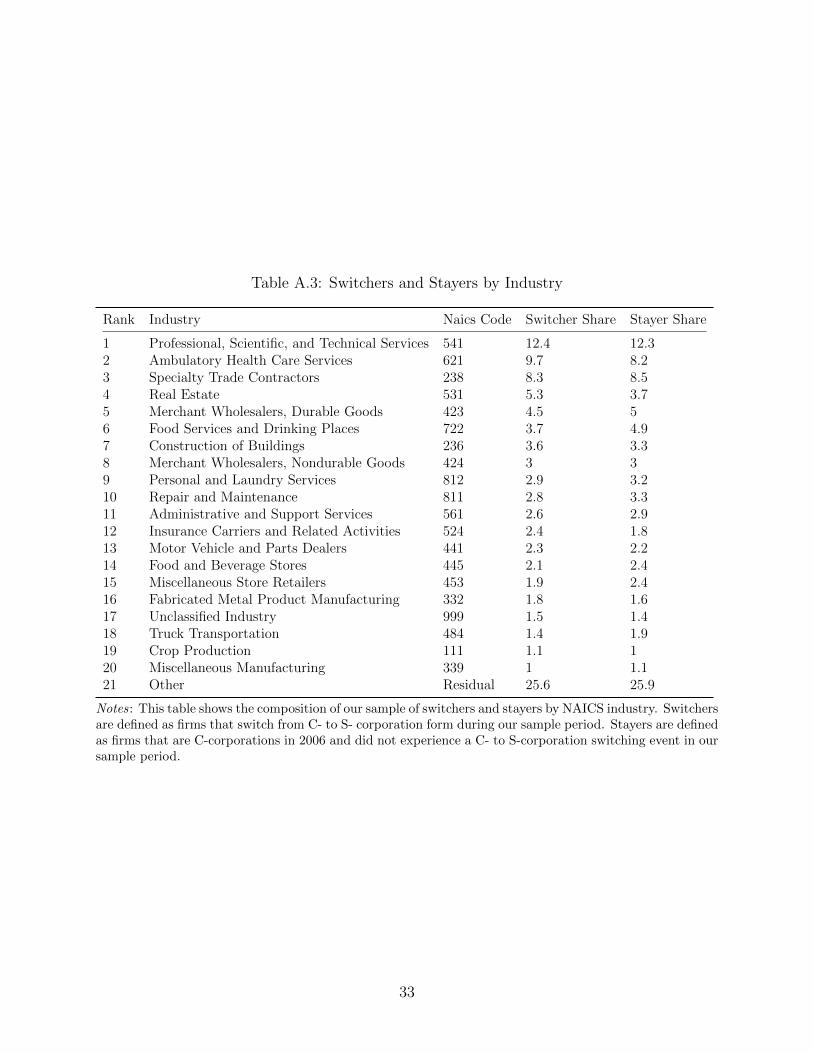
Table A.3: Switchers and Stayers by Industry
Rank Industry Naics Code Switcher Share Stayer Share
1 Professional, Scientific, and Technical Services 541 12.4 12.32 Ambulatory Health Care Services 621 9.7 8.23 Specialty Trade Contractors 238 8.3 8.54 Real Estate 531 5.3 3.75 Merchant Wholesalers, Durable Goods 423 4.5 56 Food Services and Drinking Places 722 3.7 4.97 Construction of Buildings 236 3.6 3.38 Merchant Wholesalers, Nondurable Goods 424 3 39 Personal and Laundry Services 812 2.9 3.210 Repair and Maintenance 811 2.8 3.311 Administrative and Support Services 561 2.6 2.912 Insurance Carriers and Related Activities 524 2.4 1.813 Motor Vehicle and Parts Dealers 441 2.3 2.214 Food and Beverage Stores 445 2.1 2.415 Miscellaneous Store Retailers 453 1.9 2.416 Fabricated Metal Product Manufacturing 332 1.8 1.617 Unclassified Industry 999 1.5 1.418 Truck Transportation 484 1.4 1.919 Crop Production 111 1.1 120 Miscellaneous Manufacturing 339 1 1.121 Other Residual 25.6 25.9
Notes: This table shows the composition of our sample of switchers and stayers by NAICS industry. Switchersare defined as firms that switch from C- to S- corporation form during our sample period. Stayers are definedas firms that are C-corporations in 2006 and did not experience a C- to S-corporation switching event in oursample period.
33

Table A.4: Event-study results across specifications
Pooled Omit t-2 Early Late Services Growth Ctrl(1) (2) (3) (4) (5) (6)
t = 0 -2.29 -1.93 -2.52 -1.97 -2.68 -2.41(0.04) (0.04) (0.05) (0.07) (0.32) (0.04)
t = 1 -2.40 -2.04 -2.70 -2.03 -2.73 -2.61(0.04) (0.05) (0.06) (0.09) (0.32) (0.04)
t = 2 -2.40 -2.04 -2.73 -2.07 -2.75 -2.65(0.05) (0.05) (0.07) (0.12) (0.33) (0.05)
t = 3 -2.45 -2.09 -2.84 -2.16 -2.86 -2.74(0.05) (0.06) (0.09) (0.14) (0.34) (0.06)
t = 4 -2.66 -2.30 -3.08 -2.44 -3.30 -2.98(0.06) (0.06) (0.10) (0.17) (0.35) (0.06)
Mean impact -2.44 -2.08 -2.78 -2.13 -2.86 -2.68Events 183,297 183,297 111,301 71,996 60,089 183,297Observations 2,982,439 2,982,439 1,850,256 1,132,156 2,760,333 2,892,816
100-500K 500K-1M 1-10M 10-100M >100M(7) (8) (9) (10) (11)
t = 0 -3.02 -2.50 -2.05 -1.10 -0.16(0.09) (0.08) (0.04) (0.06) (0.22)
t = 1 -3.07 -2.63 -2.19 -1.13 0.10(0.09) (0.09) (0.05) (0.07) (0.24)
t = 2 -3.12 -2.58 -2.11 -1.14 0.07(0.10) (0.10) (0.05) (0.08) (0.23)
t = 3 -3.33 -2.53 -2.12 -1.08 0.44(0.10) (0.10) (0.06) (0.08) (0.28)
t = 4 -3.68 -2.83 -2.15 -1.02 0.31(0.11) (0.11) (0.07) (0.09) (0.25)
Mean impact -3.25 -2.61 -2.12 -1.09 0.15Events 50,347 31,726 72,528 15,335 987
Notes: This table shows estimates of the change in labor compensation as a share of sales (%) within ourC- to S-corporation switchers sample across different specifications. Pooled specification results are eventstudy coefficients from figure A.1. “Omit t-2” omits event year t = −2 rather than event year t = −1 toaddress the concern that t = −1 data may reflect partial-year tax returns. Early and Late columns showresults from years 2000–2006 and 2007–2012, respectively. Services shows average results across service-sectorfirms (2-digit NAICS industries 51, 52, 54, 56, 61, 62) from a pooled regression that interacts event-timeindicators with industry indicators. Growth Ctrl shows results from a regression that includes the meanof firm-level sales growth prior to the switch interacted with event-time indicators as an additional set ofcontrols. Columns (7)–(11) present our main event-study results (as shown in Figure 2A) across firm-sizebins. Standard errors in parentheses.
34

Table A.5: Adjusting the Labor Share under Different Specifications: Five-Year Averages
1978-1982 average 2013-2017 average Decline 1978-1982 Share decline explainedlabor share (%) labor share (%) to 2013-2017 (pp) by tax reporting (%)
A. Official estimate and main specificationOfficial BEA 63.6 56.9 6.7Baseline adjustment 63.6 58.7 4.9 26.3
B. Sensitivity analysis of recharacterized wage shareUse lower bound on switchers’ confidence intervals 63.6 58.8 4.8 28.1Use upper bound on switchers’ confidence intervals 63.6 58.6 5.0 25.3Use sales minus COGS denominator for switchers event study 63.6 58.7 4.9 27.3Treat large partnerships like mid-sized S-corporations 63.6 59.1 4.5 33.2
C. Sensitivity analysis of GDP inflation correctionKeep corporate share of total VA constant at 1986 levels 63.6 58.3 5.3 21.6
D. Joint sensitivity analysis with GDP inflation correction alternativeUse confidence interval lower bounds + Keep corp. share constant 63.6 58.5 5.1 23.5Use confidence interval upper bounds + Keep corp. share constant 63.6 58.3 5.3 20.6Treat large Pships like mid-sized S + Keep corp. share constant 63.6 58.7 4.9 26.3
Notes: This table conducts the same robustness exercises as in Table 2 except that it compares average laborshares over 1978–1982 and 2013–2017 rather than 1978 and 2017.
35

B Switcher Robustness
Appendix Tables A.2 and A.3 provide sample summary statistics for the switchers analysis.
We report statistics and the industry composition for both switchers and “stayers,” defined
as the population of C-corporations in 2016, which therefore excludes S- to C-corporation
switches during our sample. Switchers are quite similar relative to stayers in terms of size
and industry composition. Switchers are smaller on average though larger at the median,
which reflects the fact that very large C-corporations elect to not to switch. Switchers face
higher effective tax rates than stayers prior to switching, which supports our interpretation
that the decision to switch reflects tax motives.
Appendix Figure A.2 plots event studies for the level of firm characteristics during switch-
ing events. The switching event appears to coincide with constant, modest growth, implying
that firms that switch are likely to be firms that would benefit from lower taxes on total
surplus in the future. Despite the firm growing in terms of revenues and the number of
workers, switching coincides with a sharp decrease in labor payments. Tax rules appear to
be the primary force that can explain the sharp and persistent decline in labor compensa-
tion and offsetting increase in tax-preferred profits. Note that identification of the effect we
are studying does not rely on an assumption that switching events are randomly assigned.
Instead, we assume that changes in labor compensation relative to contemporaneous firm
sales around the switching event reflect the different tax incentives for S-corporations ver-
sus C-corporations. Appendix Table A.4 shows that including a control for pre-switch sales
growth interacted with event-time indicators slightly strengthens our estimates.
C Robustness Details
Table 2 explores the robustness of our adjusted corporate labor share. Panel A reports
headline numbers: the official corporate labor share declined 5.0 percentage points from
1978 to 2017, while our adjusted corporate labor share declined only 3.4 percentage points,
31.9% smaller than in the official series.
Panels B and C report results from single deviations from our baseline adjustment. First,
there is statistical imprecision in the recharacterized wages estimates γb from Figure 2A that
underlie our aggregate estimates. The first two rows use the 95% confidence interval lower
bounds and the upper bounds on the bin-specific recharacterized wages estimates. The third
row uses sales minus cost of goods sold rather than sales as the denominator in the event-
study regressions and the recharacterized-wages calculation. Across these three analyses, we
find that the tax-motivated growth in pass-throughs explains between 30.6% and 34.4% of
36

the decline in the raw BEA corporate labor share.
Our partnership adjustment assumes that 0% of large partnership proprietors’ income
would be recharacterized wages, despite the fact that the partners of many large consul-
tancies, law firms, accountancies, and financial services firms clearly provide human-capital
services and are compensated by law via (nonwage) proprietor’s income. The last row of
Panel B sets the coefficient for the largest bin γ100M+ equal to the coefficient for the second
largest bin γ10M to 100M rather than equal to zero, when computing S-corporation recharac-
terized wages. In this case, tax-motivated growth in pass-throughs explains 40.4% of the
decline in the raw series, highlighting the importance of mid-market and large firms in these
adjustments.
Section B assumes that, in the absence of TRA86, all partnership activity would have
grown at the same rate as GDP, so any excess partnership activity should be reallocated
to C-corporations. Panel C makes a more conservative assumption: in the counterfactual,
partnership activity would have grown fast enough to keep the corporate share of total
value added constant at 1986 levels, rather than declining as it has in the official data.
Specifically, we scale our measures of excess partnership activity such that corporate-plus-
excess-partnership gross value added make up the same share of corporate-plus-noncorporate
gross value added as the corporate sector did in 1986. This alternative assumption reallocates
less partnership activity to the C-corporate sector, reducing the impact of the partnership
adjustment. Under this assumption, tax-motivated growth in pass-throughs explains 26.8%
of the decline in the corporate labor share.
Panel D conducts three double deviations from our baseline adjustment: the Panel C
alternative plus one Panel B alternative. These analyses find that the tax-motivated growth
in pass-throughs explains 25.5%–32.7% of the decline in the raw series.
We also conduct a perturbation analysis that illustrate the impact of the partnership
owner-pay parameter on the results.14 We incrementally increase this parameter from 41.9%
to 50%, 62.%, and 75%. For each alternative value, the share of the decline explained by tax
reporting is 38.4%, 48.3%, and 58.2%, respectively. The latter value is aggressive, because the
recharacterized-wage share of pass-through income is likely below the human-capital share
of 75% estimated in Smith et al. (2019). Thus, the implied estimate can be interpreted as
14An alternative approach would impute wages to partners using observationally similar workers (Flecket al., 2014). However, there is evidence that partners earn substantially more than observationally similarworkers (see, e.g., Kaplan and Rauh (2010) or Azmat and Ferrer (2017) on the pay of law firm partners).Thus, such an approach would tend to understate recharacterized wages for the partnership sector; forexample, BEA data imply the wage imputed for professional service workers would be less than $50 in 2017.Ideally, one could also consider imputing partnership wages using owner pay for similar C-corporations.Unfortunately, we do not have complete data on the wage compensation of C-corporation owners, becausefirm-owner links are not available in the tax data for these firms.
37
suggesting our approach can account for at most 58.2% of the decline in the raw series.
D Data Appendix
This section describes the data sources for this paper, where we use the different data sources,
and variable definitions. Section A outlines the series we use by data source. Section B
reviews the data used in each exhibit, noting extrapolations.
A Data by source
• National Income and Product Accounts (NIPA)
– Table 1.1.5 “Gross Domestic Product: Annual” (line 1), retrieved 2021-03-06 via
FRED using series code GDPA.
– Table 1.13: “National Income: Sole proprietors and partnerships” (line 19);
“Consumption of Fixed Capital: Sole Proprietor and partnerships;” “Sole pro-
prietors and partnerships: Compensation of employees” (line 20); and “Sole
proprietors and partnerships: Proprietors’ income with IVA and CCadj” (line
23). Retrieved 2021-03-06 via FRED using series codes A1641C1A027NBEA,
A1615C1Q027SBEA, A1642C1A027NBEA, and A1645C1A027NBEA respectively.
– Table 1.14: “Gross value added of corporate business” (line 1); “Compensation of
employees” (line 4). Retrieved 2020-09-04 via BEA graphic user interface (GUI).
– Table 7.14: “Posttabulation amendments and revisions” (line 3). Retrieved 2020-
12-14 via BEA GUI.
• BEA GDP-by-Industry Accounts “Components of Value Added by Industry” ta-
ble. Retrieved 2021-03-13 via BEA GUI.
• Statistics of Income (SOI) public data:
– Integrated Business Data (1980-2015). Retrieved on 2020-09-04 via https://
www.irs.gov/pub/irs-soi/15otidb1.xls.
– Table 1 “All Partnerships: Total Assets, Trade or Business Income and Deduc-
tions, Portfolio Income, Rental Income, and Total Net Income (Loss), by In-
dustrial Group” 1993-2018. Retrieved on 2021-03-06 via https://www.irs.gov/
statistics/soi-tax-stats-partnership-statistics-by-sector-or-industry.
38

– Table 2 “Sole-proprietorship Non-farm Income Statements” 1996-2018. Retrieved
on 2021-03-06 via IRS webpage.
– Table 2.3 “Returns of Active Corporations, Other than Forms 1120S, 1120-REIT,
and 1120-RIC” 2016 and 2017. Retrieved on 2021-03-06 via https://www.irs.
gov/pub/irs-soi/16co23ccr.xlsx and https://www.irs.gov/pub/irs-soi/
16co23ccr.xlsx.
– Table 6.1 “Returns of Active Corporations, Form 1120S” 2016 and 2017. Re-
trieved on 2021-03-06 from https://www.irs.gov/pub/irs-soi/16co61ccr.xlsx
and https://www.irs.gov/pub/irs-soi/17co61ccr.xlsx.
• United Nations System of National Accounts Table 4.8. Retrieved on 2020-06-
24 via the UN SNA GUI at http://data.un.org/Data.aspx?d=SNA&f=group_code%
3a408.
• Restricted-use SOI corporate and partnerships samples, which we collapse to
yield aggregates by industry (NAICS 2-, 3-, and 4-digit) and sales bin (in constant
2014 dollars).
• Other administrative data See subsection B for detailed descriptions
– Population of C- and S-corporation returns, 1996-2014
– Linked firm-owner tax returns for partnerships and S-corporations, 2001-2014, as
in Smith et al. (2019), which we collapse to yield aggregates by industry and sales
bin (in constant 2014 dollars).
• Replication data from Karabarbounis and Neiman (2014) (labor share by country)
and Elsby, Hobijn and Sahin (2013) (supplement to BEA GDP-by-industry accounts).
B Data by exhibit
1. Figure 1
(a) Panel A uses “Gross value added of corporate business” (line 1) and “Compen-
sation of employees” (line 4) from NIPA table 1.14, retrieved via BEA GUI.
(b) Panel B uses “National Income: Sole proprietorships and partnerships;” “Con-
sumption of Fixed Capital: Sole Proprietorships and partnerships;” and GDP
retrieved via FRED using series codes A1641C1A027NBEA,
A1615C1Q027SBEA, and GDPA, respectively. It also uses “Gross value added of
corporate business” (line 1) from NIPA table 1.14, as in panel A.
39

(c) Panel C uses Net income of S-corporations, C-corporations, and partnerships
from SOI Integrated Business Data.
(d) Panel D uses restricted-use data from the SOI corporate and partnerships sam-
ples. We calculate value added as the sum of W-2 wages, non-wage compensation,
interest paid, net depreciation, depletion, Domestic Prpoduction Activities De-
duction, other deductions, and gross profits minus total deductions.
2. Figure 2
(a) Panel A uses the population of S- and C-corporation returns covering 1996-2016.
For estimating event-study specifications, we narrow the sample to firms that
switch from C- to S-corporation form from 2000 to 2012.
(b) Panels B and C use latest-year data from two sources. We take 2014 owner pay,
defined as the sum of wages paid by firm and ordinary income, from our firm-
owner linked sample of S-corporations and partnerships. Sales (gross receipts)
and value added, both from 2017, are from the SOI corporate and partnerships
samples; value added is defined as in Figure 1D.
3. Figure 3, Table 1, and Table 2
(a) BEA Labor Share (Figure 3A and Table 1A) is the ratio of “Gross value added of
corporate business” and “Compensation of employees” as in Figure 1A.
(b) S-corporation recharacterized wages are the product of total S-corporation receipts
with average bin-specific recharacterized wage shares of receipts, weighted by each
size bins’ share of sales.
• Total S-corporation receipts From 1980 to 2015, we take S-corporation re-
ceipts from Integrated Business Data as in Figure 1C. For 2016 and 2017, we
supplement the IBD aggregates with receipts from SOI table 6.1 “Returns of
Active Corporations, Form 1120S.”
• Size bin-specific S-corporation receipts are from collapses of the SOI corporate
sample, as in Figure 2B and 2C, covering 1992-2017.
• Recharacterized wage shares of receipts are shown in Figure 2A.
We extrapolate S-corporation receipts backwards as a constant share of “Gross
value added of corporate business” from NIPA table 1.14. We extrapolate the
aggregate series (IBD and table 6.1) backwards from 1980 and the size bin-specific
series backwards from 1992.
40
(c) Non-corporate employee compensation, profits, and other capital income Compen-
sation and profits are “National income: Sole proprietorships and partnerships:
Compensation of employees” and “National Income: Sole proprietorships and
partnerships: Proprietors’ income with IVA and CCadj” retrieved via FRED us-
ing series codes A1642C1A027NBEA and A1645C1A027NBEA, respectively, on
2021-03-06. Other capital income is the difference between Non-corporate gross
value added as in Figure 1B and the sum of non-corporate employee compensation
and profits.
(d) Partnership and sole proprietorship components of gross value added including
employee compensation; proprietors’ income; and other capital income are from
sole proprietorship and partnership SOI income statements. Specifically, sole pro-
prietorships data are from (non-farm) table 2 “Income Statements” retrieved on
2021-03-06. Partnerships data are from “Table 1: All Partnerships: Total As-
sets, Trade or Business Income and Deductions, Portfolio Income, Rental Income,
and Total Net Income (Loss), by Industrial Group” retrieved on 2021-03-06. We
construct components of GVA as described in section C. SOI proprietors’ income
is available from 1980 to 2017, and other SOI components of gross value added
are available from 1996 to 2017. For years in which data are not available, we
extrapolate backwards using shares from the earliest available year.
(e) W-2 wages paid to partners is from the firm-owner linked sample covering 2001-
2014. We extrapolate backwards from 2001 and forwards from 2014 as a constant
share of SOI partnership profits.
4. Appendix Figure A.1 uses event-study coefficients estimated within a subset of the
population of C- and S-corporation tax returns as in Figure 2. It also uses restricted-use
SOI corporate sampele data to rank 2-digit industries by profits.
5. Appendix Figure A.3 plots NIPA corporate sector GVA from table 1.14; GDP
retrieved via FRED (series code GDPA); and “Inorganic partnership GVA” as shown
in Table 1.
6. Appendix Figure A.5 uses linked firm-owner data from Smith et al. (2019) for
partnerships and from the SOI corporate sample for C- and S-corporations.
7. Appendix Figure A.6 uses data from the BEA GDP-by-industry accounts covering
1997-present, retrieved via the BEA GUI. We supplement these data with replication
data from Elsby, Hobijn and Sahin (2013) which provides the BEA GDP-by-industry
value added items from 1987-1997.
41

8. Appendix Figure A.7 uses data from Karabarbounis and Neiman (2014), as well as
from the UN System of National Accounts table 4.8, retrieved via the UN SNA GUI
at http://data.un.org/Data.aspx?d=SNA&f=group_code%3a408.
9. Appendix Figure A.8 uses the data underlying Figure 2B and 2C.
10. Appendix Table A.1 uses BEA GDP-by-industry data as in Figure A.6; collapses
of the SOI corporate sample and firm-owner linked data as in Figure A.5; adjusted
underlying series from table 1; and sector-specific event-study estimates partially shown
in Figure A.1.
11. Appendix Tables A.2 and A.4 use the population of C- and S-corporate tax returns
as in Figure 2A.
12. Appendix Table A.5 uses the same data as Table 2.
C Concept definitions in SOI data
Components of gross value added
To calculate the partnership share of each component of gross value added (GVA), we con-
struct GVA component analogs for both organizational forms in the SOI data as follows:
ProfitsSole prop, SOI ≡ Net income
CompensationSole prop, SOI ≡ Cost of labor + Contract labor+
Employee benefit programs+
Pension and profit-sharing plans+
Salaries and wages
Other capital incomeSole prop, SOI ≡ Rent paid on machinery and equipment+
Rent paid on other business property + Taxes paid
Mortgage indebtedness + Depreciation+
Other interest paid on business indebtedness
42

ProfitsPships, SOI ≡ Net income
CompensationPships, SOI ≡ Cost of labor + Salaries and wages+
Guaranteed payments to partners+
Pension and profit-sharing plans + Employee benefit plans
Other capital incomePships, SOI ≡ Rent paid + Interest paid + Depreciation + Taxes paid
Partnership share of gross value added components
For each component of gross value added, we compute the partnership share of each compo-
nent as one minus the sole proprietorship component. Specifically, for
c ∈ {Compensation,Other capital income}, we take:
Partnership share c = 1− cSole prop, SOI
cSole prop, SOI + cPship, SOI
.
For profits, we use a slightly different formula:
Partnership share profits = 1− ProfitsSole prop, SOI
Sole prop and pship profitsNIPA 1.13
.
where Sole prop and pship profitsNIPA 1.13 is “National Income: Sole proprietorships and
partnerships: Proprietors’ income with IVA and CCadj” (retrieved via FRED using series
code A1645C1A027NBEA). We choose this definition for the denominator to avoid double-
counting profits accruing to partnerships holding other partnerships (see, e.g., Pearce (2015)
and Cooper et al. (2016)), though our results are not sensitive to this choice.
43