the right recipe on european equities
TRANSCRIPT

The Right Recipe on European Equities
Conservative Equity strategies
Alexandre Drabowicz, CAIA
Head of Investment Specialists - Equities
March 2016 – Investment Summit 2016
Bruxelles
This material is solely for the attention of "professional” investors
(see more details and definitions at the back).

Amundi Funds Equity Europe Conservative
TABLE OF CONTENTS
1. Investors dilemma with equities
2. Our conservative approach
3. Our track record
2

“I love equities”
Amundi Funds Equity Europe Conservative Source: https://app.hedgeye.com/insights , 20/10/2015
Given for Illustrative purposes only
3
In a world of ultra low interest rates, equities remain the ultimate source
of performance in global portfolios

“I hate equities”
Amundi Funds Equity Europe Conservative Source: https://app.hedgeye.com/insights , 21/01/2016
Given for Illustrative purposes only
4
Yet, when volatility resurfaces, drawdowns and risks become central in
managing portfolios

Amundi Funds Equity Europe Conservative
TABLE OF CONTENTS
1. Investors dilemma with equities
2. Our conservative approach
3. Our track record
5
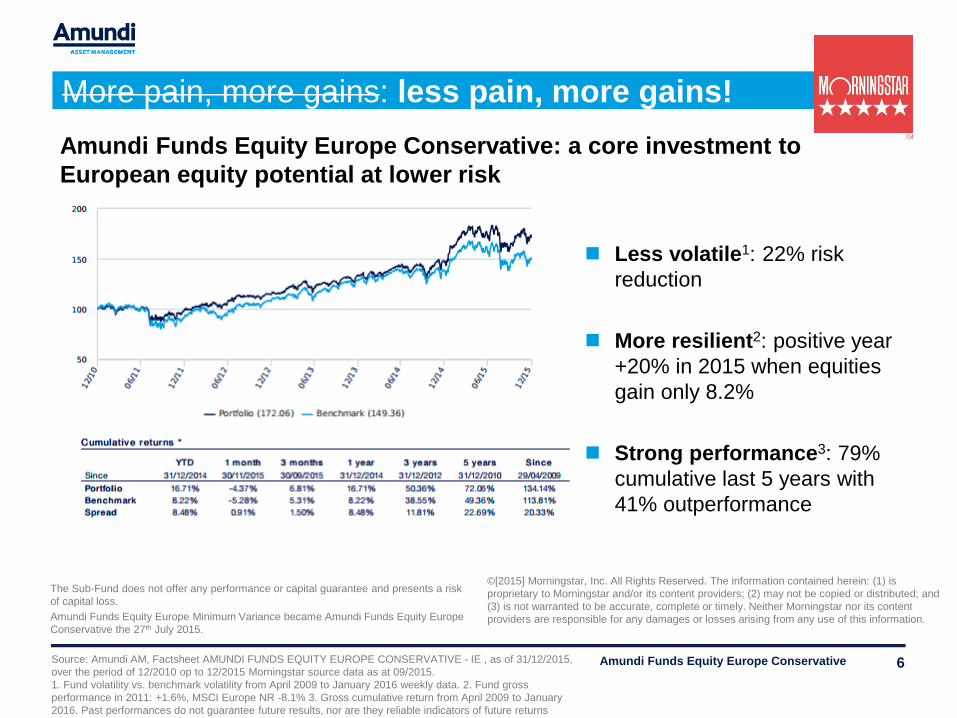
More pain, more gains: less pain, more gains!
Amundi Funds Equity Europe Conservative
The Sub-Fund does not offer any performance or capital guarantee and presents a risk
of capital loss.
Amundi Funds Equity Europe Minimum Variance became Amundi Funds Equity Europe
Conservative the 27th July 2015.
Source: Amundi AM, Factsheet AMUNDI FUNDS EQUITY EUROPE CONSERVATIVE - IE , as of 31/12/2015,
over the period of 12/2010 op to 12/2015 Morningstar source data as at 09/2015.
1. Fund volatility vs. benchmark volatility from April 2009 to January 2016 weekly data. 2. Fund gross
performance in 2011: +1.6%, MSCI Europe NR -8.1% 3. Gross cumulative return from April 2009 to January
2016. Past performances do not guarantee future results, nor are they reliable indicators of future returns
Less volatile1: 22% risk
reduction
More resilient2: positive year
+20% in 2015 when equities
gain only 8.2%
Strong performance3: 79%
cumulative last 5 years with
41% outperformance
Amundi Funds Equity Europe Conservative: a core investment to
European equity potential at lower risk
6
©[2015] Morningstar, Inc. All Rights Reserved. The information contained herein: (1) is
proprietary to Morningstar and/or its content providers; (2) may not be copied or distributed; and
(3) is not warranted to be accurate, complete or timely. Neither Morningstar nor its content
providers are responsible for any damages or losses arising from any use of this information.

Circa 80 investments
PORTFOLIO OPTIMISATION
200 potentials
HI-LO SCREENING
How? A focus on quality investing and risk reduction
Amundi Funds Equity Europe Conservative The Sub-Fund does not offer any performance or capital guarantee and presents a risk
of capital loss.
Given for illustrative purposes only, may change without prior notice.
European Equity Market
7

‘Hi-Lo’ screening for quality selection
Amundi Funds Equity Europe Conservative The Sub-Fund does not offer any performance or capital guarantee and presents a risk
of capital loss. Given for illustrative purposes only, may change without prior notice.
1. Key numbers on Amundi Funds Equity Europe Conservative as of 29/01/2016.
8
Identify companies in the Stoxx 600 that may benefit from market growth whilst mitigating
losses in declining markets and which demonstrate:
High operating efficiency Increasing gross margins
Growing asset turnover ratio
Low or no debt Low long term debt to equity ratio
High current ratio
No new shares issued in the last year
High profitability Positive return on assets
Positive operating cash flow
Increasing Return on Assets
Cash flow from operations greater than ROA
KEY PTF NUMBERS1
# of stocks: 89
Active share: 70%
Dividend Yield: 3.9%

Quality selection: steady wins the race!
Amundi Funds Equity Europe Conservative Source: Amundi, Bloomberg, data as of 28/10/2015.
Past performance do not guarantee future results, nor are they reliable indicators of
future returns. All trademarks and logos used for illustrative purposes in this document
are the property of their respective owners.
9
We selected Sky But not Altice
Group has steadily delivered strong
results over the last quarters
Revenue growth at +6%
Operating profit +10%
Huge leverage at 8x following
acquisition of Cable TV for $18bn
$8.6b of new debt & $1.8bn of new
shares issued
Earnings revised sharply lower
Altice: boom & bust!
Sky: steady but +26% YTD

Portfolio diversification to ensure resilience
Lower risk & lower drawdowns: our key strengths
A robust portfolio construction ensures a good level of diversification
The result is less risk and more resilience in the past 5 years of trackrecord
Amundi Funds Equity Europe Conservative Source: Amundi, gross performance as of 31/12/2015. Past performance do not
guarantee future results, nor are they reliable indicators of future returns
1. Risk reduction calculated as: (Fund volatility/MSCI Europe volatility) -1
Year & Event Europe Conservative
Max Drawdown
MSCI Europe
Max Drawdown
Risk reduction1
2010 – Greece worries -8.5% -13.7% -26%
2011 - Sovereign debt crisis -14.2% -24.3% -24%
2012 – Renewed debt worries -5.2% -12.8% -32%
2013 - FED tapering worries -9.1% -11.0% -12%
2014 - Greece referendum -9.6% -11.1% -11%
2015 - China growth scare -13.9% -17.6% -5%
10

What ? The fund invests in blue chip companies
Amundi Funds Equity Europe Conservative Source: Amundi data as of 29/01/2016
All trademarks and logos used for illustrative purposes in this document are the property
of their respective owners
Top 10 positions Europe
Conservative
MSCI
Europe
Over/Under
-weight
RECKITT BENCKISER GROUP PLC 2.5% 0.7% 1.7%
BT GROUP PLC 2.4% 0.7% 1.7%
WPP PLC 2.3% 0.4% 1.9%
UNILEVER NV 2.3% 0.9% 1.4%
MUNICH REINSURANCE COMPANY 2.3% 0.4% 1.9%
HENKEL AG AND CO KGAA 2.3% 0.4% 1.9%
ROCHE HOLDING AG 2.2% 2.4% -0.2%
BRITISH AMERICAN TOBACCO PLC 2.2% 1.3% 0.9%
SAP SE 2.2% 1.0% 1.2%
NOVO NORDISK A/S 2.1% 1.4% 0.7%
TOTAL 22.7% 9.7% 13.1%
Number of holdings 89
Dividend yield 3.90%
11
Active Share 66%

Amundi Funds Equity Europe Conservative Source: Amundi data as of 29/01/2016
Given for Illustrative purposes only
Underweight Financials & Energy,
overweight IT & consumer
Country exposure results from selection
and diversification benefits
Where? A conservative positioning, UW financials/energy
12
0% 5% 10% 15% 20% 25%
Energy
Utilities
Materials
Financials
Telecom Services
IT
Cons. discretionary
Health Care
Industrials
Cons. staples
Europe Conservative MSCI Europe
0% 10% 20% 30% 40%
PORTUGAL
AUSTRIA
NORWAY
BELGIUM
IRELAND
FINLAND
ITALY
SPAIN
DENMARK
SWEDEN
SWITZERLAND
NETHERLANDS
GERMANY
FRANCE
UK
Europe Conservative MSCI Europe

What ? Style exposure
Amundi Funds Equity Europe Conservative Source: FactSet, Amundi, data as of 30/01/2016.
Given for Illustrative purposes only
13
Bias toward Mid caps, Low Risk, High Momentum, High Quality, High Growth

Amundi Funds Equity Europe Conservative
TABLE OF CONTENTS
1. Investors dilemma with equities
2. Our conservative approach
3. Our track record
14

A core & long term exposure to European equities
Amundi Funds Equity Europe Conservative Source: Amundi, Pams, 30/10/2015, gross performance. Past performance do not guarantee future results,
nor are they reliable indicators of future returns.3 & 5yr performance are cumulative, since inception is annualised. Given for Illustrative purposes only.
©[2015] Morningstar, Inc. All Rights Reserved. The information contained herein: (1) is proprietary to Morningstar and/or its content providers; (2) may not be copied or
distributed; and (3) is not warranted to be accurate, complete or timely. Neither Morningstar nor its content providers are responsible for any damages or losses arising
from any use of this information.
15
A powerful trackrecord that speaks for itself
Gross performance YTD 1 year 3 years 5 years Since Inception
AFE Europe Conservative 19.6% 25.5% 61.3% 93.2% 15.7%
MSCI Europe NR 11.3% 13.2% 47.7% 59.4% 12.9%
Excess return 8.4% 12.3% 13.6% 33.8% 2.8%
-20
-10
0
10
20
30
40
50
80
130
180
230
280
330
Apr-09 Apr-10 Apr-11 Apr-12 Apr-13 Apr-14 Apr-15
Cumulative Excess Return Gross performance Benchmark
15,3%
1,6%
16,9% 18,0%
11,5%
19,6%
11,1%
-8,1%
17,3%
19,8%
6,8%
11,3%
2010 2011 2012 2013 2014 YTD
Amundi Fds Eq Europe Conservative - IE (C) MSCI Europe

Top distribution ranking
Amundi Funds Equity Europe Conservative Source: Morningstar category: Europe Large-Cap Blend Equity, data as of 31/10/2015, net performance.
Past performance do not guarantee future results, nor are they reliable indicators of future returns. Given for Illustrative purposes
only.©[2015] Morningstar, Inc. All Rights Reserved. The information contained herein: (1) is proprietary to Morningstar and/or its
content providers; (2) may not be copied or distributed; and (3) is not warranted to be accurate, complete or timely. Neither
Morningstar nor its content providers are responsible for any damages or losses arising from any use of this information.
16
94% of competitors beaten over 5 years
Peer Group - 5 year for Amundi Funds
Equity Europe Conservative IE C
Europe Large-Cap Blend Equity Universe – in
EUR – net of fees
Amundi Fds Eq Europe
Conservative
MSCI Europe
Average Universe
0
5
10
15
8 10 12 14 16 18
Performance
% beaten
competitors # funds
YTD 95% 612
1 year 95% 609
3 years 86% 555
5 years 94% 507
First decile YTD, 1YR & 5YR
A very attractive risk/return profile:
lower risk for higher return
MORE RISK
MO
RE
PE
RF
OR
MA
NC
E
Annualized
returns in %
Annualized
volatility in %

Top institutional ranking
Amundi Funds Equity Europe Conservative Source: Mercer. Mercer Performance Analysis. All rates of return are before tax and before
management fees in EUR. Rates of return are annualized for periods exceeding one year.
Past investment performance is not an adequate test of comparative performance, nor a
reliable indicator of the expected absolute level of returns in the future.
Given for Illustrative purposes only
17
Top performer, lowest volatility, high Sharpe Ratio, lowest drawdown over 5yr

Conclusion : the right vehicle for European equities
Amundi Funds Equity Europe Conservative 1. Source: Amundi AM data as of 29/01/2016 2. The Sub-Fund does not offer any performance or
capital guarantee and presents a risk of capital loss
©[2015] Morningstar, Inc. All Rights Reserved. The information contained herein: (1) is proprietary to Morningstar and/or its content
providers; (2) may not be copied or distributed; and (3) is not warranted to be accurate, complete or timely. Neither Morningstar nor
its content providers are responsible for any damages or losses arising from any use of this information.
A core exposure to European equity potential at lower risk
A strong track record with significant outperformance and proven ability to offer resilience during market downturn2
A core investment for clients looking for regular returns with the opportunity for growth
Conservative investments in established profitable European companies
Proprietary investment process
€445M AUM and Six year track record 1
18

Amundi Funds Equity Europe Conservative:
Main characteristics
*A detailed summary of the performance fees can be found in the prospectus..
**Or, in the case of, at an earlier time as fixed by the distributor.
Not all share classes, and, if applicable categories of Shares are listed for sale in all countries. Investors may
contact Amundi Luxembourgd S.A. for more information.
Amundi Funds Equity Europe Conservative
Investment Manager Amundi
Custodian CACEIS Bank Luxembourg S.A
Reference currency of the sub-fund EUR
All Investors Institutional Investors Distributors
share class AE-C AE-D IE-C IE-D SE-C
Reference currency of the class EUR EUR EUR EUR EUR
ISIN Code LU0755949848 LU0755949921 LU0755949418 LU0755949509 LU0755950002
share category Accumulation / Distribution Accumulation
Bloomberg Ticker AMMVAEC LX CMMVIEC LX AMMVSEC LX
Minimum initial subscription None Equivalent in EUR of USD 500,000 None
Frequency of NAV calculation Daily
Cut off for dealing times Luxembourg Dealing days before 2pm (Luxemburg time)*
Maximum subscription fee 4.50% 2.50% 3.00%
Maximum annual management fee 1.30% 0.50% 1.70%
Maximum annual administration fee 0.35% 0.25% 0.35%
Performance fee** 20% of the cumulative performance above the performance objective
Maximum conversion fee 1.00%
Maximum redemption fee None
Countries of registration Austria, Belgium, Finland, France, Germany, Greece, Ireland, Italy, Luxembourg, Netherlands, Norway, Spain, Sweden, Switzerland,
United Kingdom
19

Disclaimer
Amundi Funds Equity Europe Conservative
This material is provided for information purposes only and does not constitute a recommendation, a solicitation, an offer, an advice or an invitation to purchase or sell any fund, SICAV, sub-fund, (“the Funds”) described herein and should in no case be interpreted as such.
This material, which is not a contract, is based on sources that Amundi considers to be reliable. Data, opinions and estimates may be changed without notice.
Amundi accepts no liability whatsoever, whether direct or indirect, that may arise from the use of information contained in this material. Amundi can in no way be held responsible for any decision or investment made on the basis of information contained in this material.
The information contained in this document is disclosed to you on a confidential basis and shall not be copied, reproduced, modified, translated or distributed without the prior written approval of Amundi, to any third person or entity in any country or jurisdiction which would subject Amundi or any of “the Funds”, to any registration requirements within these jurisdictions or where it might be considered as unlawful. Accordingly, this material is for distribution solely in jurisdictions where permitted and to persons who may receive it without breaching applicable legal or regulatory requirements.
Not all funds, or sub-funds will be necessarily registered or authorized in all jurisdictions or be available to all investors.
Investment involves risk. Past performance and simulations based on these, do not guarantee future results, nor are they reliable indicators of future performance. The value of an investment in the Funds, in any security or financial product may fluctuate according to market conditions and cause the value of an investment to go up or down. As a result, you may lose, as the case may be, the amount originally invested. All investors should seek the advice of their legal and/or tax counsel or their financial advisor prior to any investment decision in order to determine its suitability. It is your responsibility to read the legal documents in force in particular the current French prospectus for each fund, as approved by the AMF, and each investment should be made on the basis of such prospectus, a copy of which can be obtained upon request free of charge at the registered office of the management company.
This document contains information about Amundi Funds Equity Europe Conservative (the “Sub-Fund”), sub-fund of Amundi Funds (the “SICAV”), an undertaking for collective investment in transferable securities existing under Part I of the Luxembourg law of 17 December 2010, organised as a société d’investissement à capital variable and registered with the Luxembourg Trade and Companies Register under number B68.806. The SICAV has its registered office at 5, allée Scheffer, L-2520 Luxembourg.
Amundi Funds has been authorised for public sale by the Commission de Surveillance du Secteur Financier in Luxembourg.
Not all sub-funds of the SICAV (the "Sub-Funds") will necessarily be registered or authorized for sale in all jurisdictions or be available to all investors. Subscriptions in the Sub-Funds will only be accepted on the basis of the SICAV’s latest prospectus and/or the Key Investor Information Document (KIID) of the Sub-Fund, its latest annual and semi-annual reports and its articles of incorporation that may be obtained, free of charge, at the registered office of the SICAV or respectively at that of the representative agent duly authorized and agreed by the relevant authority of each relevant concerned jurisdiction.
Consideration should be given to whether the risks attached to an investment in the Sub-Funds are suitable for prospective investors who should ensure that they fully understand the contents of this document. A professional advisor should be consulted to determine whether an investment in the Sub-Funds is suitable.
The value of, and any income from, an investment in the Sub-Funds can decrease as well as increase. The Sub- Funds have no guaranteed performance. Further, past performance is not a guarantee or a reliable indicator for current or future performance and returns. The performance data do not take account of the commissions and costs incurred on the issue and redemption of units.
This document does not constitute an offer to buy nor a solicitation to sell in any country where it might be considered as unlawful, nor does it constitute public advertising or investment advice.
The information contained in this document is deemed accurate as at January 2016.
Amundi Asset Management, French joint stock company (“Société Anonyme”) with a registered capital of € 596 262 615 and approved by the French Securities Regulator (Autorité des Marchés Financiers - AMF) under number GP 04000036 as a portfolio management company - 90 boulevard Pasteur -75015 Paris - France - 437 574 452 RCS Paris. - www.amundi.com – www.amundi-funds.com
20