the retirement savings paradigm
TRANSCRIPT

The Retirement Savings Paradigm Factors Influencing Saving

Executive Summary
Several studies1 indicate that close to half of all Americans simply won’t have enough money saved for a secure retirement. Despite the attractive tax advantages offered by defined contribution plans, workers are either not making contributions to such plans or they are saving too little too late.
1) Studies include: The Retirement Savings Crisis: Is It Worse than We Think?, June 2013, National Institute on Retirement Security; 2014 Retirement Confidence Survey Fact Sheet #6 — Preparing for Retirement in America; Are Households Saving Enough for a Secure Retirement, October 2013, Federal Reserve Bank of Cleveland.
ContentsExecutive Summary 2
Introduction 4
Why Study Retirement Savings 6
Data and Methodology 7
Key Findings 8
Conclusion 18
About ADP® 19
In the last 30 years, the U.S. retirement system has transformed from a system dominated by a reliance upon defined benefit plans and Social Security to one where defined contribution plans are the norm. This transformation shifted investment responsibility and risk from investment professionals to the American workforce, but did not necessarily shift along with it the know-how needed by employees to manage and maximize their retirement savings.

3
The ADP Research Institute® studied retirement savings behaviors of approximately 9 million U.S. employees in 2013 using anonymous, aggregated payroll data, differentiated by age, gender, compensation level and industry. Key findings include:
• The study revealed that 60.2 percent of employees were saving for retirement at an average salary deferral rate of 6.7 percent.2
• As employees aged and drew closer to retirement age, a higher proportion of them elected to make contributions to their retirement plan, with participation increasing from 48.4 percent for employees aged 20-29 years to 64.4 percent for employees aged 61-69 years. Salary deferral rates similarly increased with age, with employees aged 20-29 years deferring on average 4.9 percent of salary and employees aged 61-69 years deferring on average 9.2 percent of salary. The pattern of older workers saving more than younger workers was true for both genders.
• The proportion of employees saving and their savings rates varied widely by industry sectors. For example, only 37 percent of Leisure and Hospitality sector employees were saving, compared to 76 percent of Information sector employees.
• Regardless of industry, in larger companies, a higher percentage of employees were participating in a defined contribution plan. However, employees in smaller companies who participated were saving more; in every industry, those in companies with 1-19 employees saved on average more than 7 percent.
• Overall, more of those in higher compensation groups were saving, and they saved at higher rates. Among those earning $20,000 to $29,999, 36.8 percent of employees were saving and they saved on average 4.7 percent. Among those earning $110,000 to $199,999, those percentages rose to 81.8 percent and 7.9 percent, respectively.
• When considering compensation groups individually, the research showed that more females were saving for retirement than males and they saved at a higher rate than males in most compensation categories.
An employee benefit package that includes a retirement savings vehicle is a key tool with which employers attract and retain talented employees. According to Society for Human Resource Management's job satisfaction and engagement research, employees consistently ranked benefits among the top contributors to their job satisfaction.3
The intent of this study is to better understand the factors that influence retirement savings and to highlight gaps in savings behavior. The research reveals opportunities to improve retirement savings rates for a more secure financial future. By comparing their workforces’ savings rates to the benchmarks in this study, employers can evaluate their current benefit strategies and target areas for improvement.
2) Reflects percentage of current compensation for which employee elected to defer current receipt. Does not reflect matching or other contributions made by employer.
3) Society for Human Resource Management. (2012, November). 2012 Employee Job Satisfaction and Engagement: A research report by SHRM. Alexandria, VA: Society for Human Resource Management.

4
Introduction
4) Boston College Center for Retirement Research, “The National Retirement Risk Index in a Nutshell”: http://crr.bc.edu/wp-content/uploads/2011/09/NRRI-in-a-Nutshell-Final-508.pdf 5) Retirement Confidence Survey: http://www.ebri.org/publications/ib/index.cfm?fa=ibDisp&content_id=5175
saving or planning for retirement as the most pressing financial issue facing most Americans today.4
For working Americans, retirement represents the crowning achievement of a lifetime of hard work – a period marked by financial security and the pursuit of personal interests. Yet, for many workers, a financially secure retirement may be an elusive dream. Numerous research studies have concluded that too few U.S. workers are saving for retirement, and many of those who are saving start too late and are not saving enough. One study showed that almost 45 percent of American households were in jeopardy of having inadequate retirement savings, with younger households the most at risk.4
Despite a brightening outlook within the domestic economy, saving for retirement appears to remain a low priority relative to workers’ more immediate financial concerns. In a 2013 survey by the Employee Benefit Research Institute, just 2 percent of workers identified saving or planning for retirement as the most pressing financial issue facing most Americans today. They were instead more likely to identify job uncertainty (30 percent) and making ends meet (12 percent) as the most pressing issues.5
Yet, retirement savings – particularly in light of changing employer pension practices and rising life expectancies – is a critical issue for individuals, employers and society. Until now, there has been limited data available to reveal the characteristics and savings behaviors of the various segments of the American workforce. This report delves deeply into payroll data to understand the U.S. retirement savings paradigm in order to highlight savings insights and opportunities for employers, retirement advisors, financial planners, policy-makers and others with a stake in this issue.
ONly
2% of workers identified

5
The hisTory of reTiremenT PlAnningThe American system of retirement savings has experienced dramatic changes in its nearly 140 years of existence. Railroad companies and related businesses were the first to offer retirement benefits to U.S. workers with the American Express Company, originally founded as an express mail business, established the nation’s first private pension plan in 1875.6 The establishment of the federal income tax in 1913 and later rules allowing tax deductions for pensions paid to retired employees aided the growth of the nascent retirement system, with more employers adding pension plans as a key component of their compensation packages.
Following the onset of the Great Depression, Congress in 1935 passed the Social Security Act as a “floor of protection” for old age security, designed to complement private savings and pensions. Accordingly, as the U.S. economy recovered and flourished in subsequent years, the percentage of private-sector workers covered by pension plans continued to grow, eventually reaching more than 46 percent by 1980 as employers used pensions to attract workers, and help reduce turnover.
However, defined benefit plans proved to be unsustainable over the long-term for many employers and the larger economy. While the burdens upon employers of financially supporting defined benefit plans increased, a shift in the tax code in the late 1970s led to the unintended birth of the defined contribution 401(k) plan. Employers swiftly adopted the new vehicle, thus setting into motion a fundamental change in the nature of the American retirement system – a shift away from defined benefit pension plans and toward defined contribution plans. Social Security and defined benefit pension plans promise a specific monthly benefit at retirement and are managed by investment professionals. In contrast, defined contribution plans are focused on the value of contributions made to the plan and place the onus of funding level and investment management decisions on the individual employee. The number of private-sector workers covered by defined benefit plans fell from 46 percent in 1980 to 20 percent in 2006. In the same year, 43 percent of all private-sector workers were covered by defined contribution plans.
This fundamental change to the nation’s retirement system enabled companies to structurally transfer investment risk (and opportunity) to employees, but did not explicitly account for the necessary transfer of investment education. Although defined contribution plans offer employees greater independence, choice, portability and the potential for accelerated investment returns, they also require participants to possess the knowledge to effectively capitalize on these opportunities, along with the self-discipline to commit to saving for retirement across their working years.
6) http://www.aging.senate.gov/imo/media/doc/reports/rpt884.pdf U.S. Senate 98th Congress, 2d Session. S. Prt. 98-221, The Employee Retirement Income Security Act of 1974: The First Decade. Washington: Government Printing Office, 1984.

6
Along with wages and salaries, an employee benefit package is a key tool with which employers can attract and retain talented employees. In medium and large companies, this package typically includes a retirement plan, which is intended to provide employees with security regarding their futures after their working years. Research has shown that having confidence in a secure retirement improves employee satisfaction, and that employee satisfaction leads to reduced turnover and increased productivity.7 More companies are moving to a defined contribution plan in order to gain tax benefits, help reduce their risk and control costs. Yet, if workers do not elect to contribute to the plan or contribute too little too late, the plan does not provide the security that the employer sought to offer as a benefit.
In addition to employment factors, there are numerous social reasons for studying retirement savings. The percentage of those 65 or older living below the poverty line decreased dramatically in the second half of the 20th century, largely due to Social Security, Medicare and the widespread reliance upon the retirement income provided by defined benefit pensions.8 However, this trend may not continue. Many employers are transitioning away from defined benefit pensions, and workers are expected to save in an individualistic way for a retirement that may last much longer than their savings. When Social Security was established in 1935, the life expectancy was approximately age 60. Those who reached age 65 in 1940 could expect to live about another 12 years.9 In 2011, life expectancy was age 76 for men and age 81 for women.10 A man reaching age 65 today can expect to live, on average, to age 84 and a woman, on average, to age 86.11
While many previous studies, reports and articles have documented the low retirement savings rates among U.S. workers, this research took a closer look to discover the attributes of those who were saving compared to those who were not and at what rate they were saving. It also further explored if this retirement savings behavior were subject to gender, income or industry influences.
This data is intended to help employers create a strategy for improving their defined contribution system. By comparing their workforces’ savings rates to the benchmarks in this study, employers can evaluate their current benefit strategies and target areas for improvement. The defined contribution plan is an effective retirement savings vehicle only if participants are engaged and informed about the steps necessary to use it effectively. Employers may find that employees require a greater understanding of the funding levels needed for a secure retirement and guidance in making investment management decisions.
7) http://www.ncbi.nlm.nih.gov/pubmed/14559421, http://www.nytimes.com/2011/09/04/opinion/sunday/do-happier-people-work-harder.html?_r=0, https://helda.helsinki.fi/bitstream/handle/10138/17378/thejobsa.pdf?sequence=1
8) http://www.aarp.org/work/retirement-planning/info-2014/boomer-retirement-little-savings-means-working.html9) Social Security Administration; http://www.ssa.gov/history/lifeexpect.html10) Huffington Post; U.S. life Expectancy Ranks 26th In The World, OECD Report Shows; http://www.huffingtonpost.com/2013/11/21/us-life-expectancy-oecd_n_4317367.html11) Social Security Administration; http://www.ssa.gov/planners/lifeexpectancy.htm
Why Study Retirement Savings

7
The ADP Research Institute used aggregated, anonymous payroll data from 2013. The dataset comprised approximately 9 million employees between the ages of 20 and 69 with total compensation of $20,000 and up. This research evaluated the dataset along several dimensions, including demographic profile (age and gender), compensation level and the industry of employment.
The retirement savings included contributions made with before- and after-tax dollars (not including matching contributions from employers) to the following types of deferred compensation plans: 403(b) and Roth 403(b), 401(k) and Roth 401(k), 457 and Roth 457, SIMPLE IRA, and 408(k). Although 65 is the accepted norm for retirement age by the U.S. Bureau of Labor Statistics, the consensus among several retirement studies12 is that the average retirement age of the U.S. workforce is less than 65. It varies between 61 and 64. To be conservative, this report assumes the average age of retirement to be 61.
12) http://www.gallup.com/poll/162560/average-retirement-age.aspx, http://crr.bc.edu/wp-content/uploads/2011/08/IB_11-11-508.pdf
Data and Methodology

8
emPloyees APPeAred To “wAke uP” As reTiremenT neAredOverall, employees who were saving for retirement saved an average of 6.7 percent of their income, which reinforces other studies that report an average of 7 percent retirement savings.13 Table I also confirms the widespread assumption that, as employees age, a higher proportion of them save and they save at a higher rate.
Key Findings
13) Retirement Confidence Survey: http://www.ebri.org/publications/ib/index.cfm?fa=ibDisp&content_id=5175; http://www.aging.senate.gov/imo/media/doc/reports/rpt884.pdf
Table I. Retirement Savings by Age Group
Age group % of employees who saved savings rate
20-29 48.4% 4.9%
30-39 57.9% 5.7%
40-49 62.4% 6.3%
50-60 65.6% 7.7%
61-69 64.4% 9.2%
ToTAl 60.2% 6.7%
Employees
AGES 61-69 saved 9.2%
Employees
AGES 20-29 saved 4.9%

9
Assuming a retirement age of 61, the analysis estimates approximately 18 percent of the total workforce from 2013 might retire in the next five years. Table II shows that, of those not nearing retirement in the next five years, 59.1 percent saved at a rate of about 6.2 percent. In contrast, of those reaching the average retirement age in the next five years, about 65.5 percent saved at a rate averaging nearly 8.7 percent. The possible retirement percentage for each year shown is cumulative up to that point. The highest savings rate of 9.1 percent was among those planning to retire in 2014. Employees who were saving for retirement had one-and-a-half times the compensation of employees who did not save.
The data highlights an understandable trend – as retirement neared and became more of a reality to an employee, saving for it became a higher financial priority. Yet, by the time they attempted to “catch up,” their greatest investing advantage had already passed them by – the ability to take advantage of compounding earnings over the entirety of their working career.
Table II. Comparative Savings within Five Years of Retirement Age
reaching retirement Age
% of employees who saved savings rate Average Compensation
of saver vs. non-saver
By 2014 64.7% 9.1% 1.46
By 2015 65.0% 9.0% 1.46
By 2016 65.2% 8.9% 1.46
By 2017 65.4% 8.8% 1.47
By 2018 65.5% 8.7% 1.47
not retiring 59.1% 6.2% 1.50
All employees 60.2% 6.7% 1.49

10
sAvings BehAvior vAried widely By indusTry The proportion of workers saving and their saving rates varied widely across industries as shown in Table III. The Leisure and Hospitality sector had the lowest percentage of workers saving with 37 percent and one of the lowest savings rates at 6.3 percent. In contrast, 70 percent or more of workers in the Financial and Information industries were saving for retirement, and their savings rates were among the highest.
The variation in savings may reflect the variation of compensation levels across industries. A large proportion of those working in leisure and hospitality earn lower wages than in the finance sector, for example.
Table III. Retirement Savings by Industry
industry group % of employees who saved savings rate
Professional & Business services 61% 7.2%
information 76% 7.0%
manufacturing 70% 6.9%
Transportation & utilities 54% 6.8%
financial Activities 70% 6.7%
education & health services 51% 6.7%
Construction 45% 6.6%
wholesale & retail Trade 60% 6.4%
leisure & hospitality 37% 6.3%
Public Administration 46% 5.8%
savings behavior by industry:
lEISURE AND HOSPITAlITy SECTOR
37%
INFORMATION SECTOR
76%

11
The lArger The ComPAny, The more workers who sAved Table IV shows that, in general, the proportion of workers who were saving for retirement increased as the company size increased, up to 4,999 employees. For companies with 5,000 or more employees, the percentage decreased slightly.
Table IV. Retirement Savings by Company Size
Company size % of employees who saved savings rate
1-19 employees 32.5% 7.5%
20-49 employees 48.6% 7.2%
50-499 employees 59.2% 6.9%
500-999 employees 63.6% 6.8%
1,000-4,999 employees 65.5% 6.9%
≥5,000 employees 65.7% 6.7%

12
industry group/size
% of employees saving
1-19 employees
20-49 employees
50-499 employees
500-999 employees
1000-4999 employees
≥5000 employees
information 37.0% 52.5% 64.1% 72.0% 80.9% 84.2%
manufacturing 34.1% 50.6% 63.2% 71.9% 75.7% 80.3%
financial Activities 37.8% 61.5% 70.2% 72.3% 70.6% 71.4%
Professional & Business services 40.0% 55.6% 61.9% 65.2% 64.8% 52.5%
wholesale & retail Trade 29.8% 46.6% 58.0% 63.3% 62.6% 65.2%
Transportation & utilities 26.5% 40.6% 52.2% 54.7% 61.7% 50.1%
Construction 23.3% 37.5% 43.7% 55.8% 60.5% 53.9%
education & health services 31.8% 45.7% 53.0% 52.0% 50.6% 51.3%
Public Administration 44.6% 46.1% 46.0% 43.7% 45.7% 49.4%
leisure & hospitality 12.6% 15.3% 36.0% 40.6% 37.6% 44.8%
The apparent relationship between company size and the proportion of employees saving held in most industries, as shown in Table V. In some industries, the differences between large and small companies was dramatic. For example, in the financial activities sector, the percentage of employees saving for retirement was 37.8 percent in companies with fewer than 20 employees, but in companies with 1,000 or more employees, the percentage topped 70.6 percent.
This discrepancy may reflect the greater prevalence of automatic plan solutions like auto-enrollment along with retirement education, advice programs and online resources that are more commonly offered by larger companies and may be impacting participation. In smaller companies, employees often must initiate and independently monitor their own retirement savings.
Table V. Proportion of Employees Saving by Industry Group and Company Size

13
however, workers in smAller ComPAnies sAved more Although more employees saved in larger companies, they were saving at a lower rate than those who saved in smaller companies, as shown in Table IV. As shown in Table VI, in companies with fewer than 20 employees, the savings rate was higher than 7 percent in every industry. In contrast, in those companies with 5,000 employees or more, only two of the 10 industry groups had a savings rate higher than 7 percent.
Table VI. Retirement Savings by Industry Group and Company Size
industry group/size
savings rate
1-19 employees
20-49 employees
50-499 employees
500-999 employees
1000-4999 employees
≥5000 employees
Professional & Business services 7.6% 7.5% 7.3% 7.2% 7.1% 7.1%
Transportation & utilities 7.2% 6.9% 6.6% 7.1% 7.1% 6.5%
information 7.5% 7.3% 7.2% 6.8% 7.2% 6.6%
manufacturing 7.3% 7.0% 6.8% 6.8% 7.0% 7.3%
financial Activities 7.4% 7.2% 6.8% 6.6% 6.8% 6.6%
education & health services 7.7% 7.0% 6.8% 6.5% 6.8% 6.1%
leisure & hospitality 7.3% 7.2% 6.6% 6.5% 5.7% 5.9%
wholesale & retail Trade 7.2% 6.9% 6.5% 6.4% 6.5% 6.1%
Construction 7.3% 6.8% 6.6% 6.1% 6.6% 6.0%
Public Administration 7.6% 6.8% 5.8% 5.5% 5.8% 5.7%

14
ComPensATion level mATTered more ThAn emPloyer sizeTable VII shows that, irrespective of their company’s size, a higher proportion of workers who earned at a higher compensation rate saved at a higher rate.
Table VII. Retirement Savings by Company Size and Compensation Group
Compensation/size 1-19 employees
20-49 employees
50-499 employees
500-999 employees
1000-4999 employees
≥5000 employees
% o
f em
ploy
ees
who
sav
ed
$20k-$30k 16.7% 29.3% 39.6% 48.0% 47.2% 50.8%
$30k-$45k 26.9% 42.0% 52.8% 58.0% 59.0% 61.0%
$45k-$60k 36.9% 52.9% 62.7% 67.0% 67.6% 67.4%
$60k-$80k 43.6% 59.4% 68.8% 73.1% 74.0% 71.3%
$80k-$110k 49.9% 65.3% 74.0% 79.0% 80.2% 81.9%
$110k-$200k 56.1% 71.9% 78.9% 83.0% 84.9% 87.9%
$200k+ 63.9% 77.3% 82.5% 83.5% 87.0% 90.7%
savi
ngs
rat
e
$20k-$30k 8.0% 6.2% 5.1% 5.4% 5.4% 5.5%
$30k-$45k 6.7% 5.9% 5.3% 5.6% 5.5% 5.4%
$45k-$60k 7.0% 6.5% 6.0% 6.2% 6.1% 5.9%
$60k-$80k 7.6% 7.3% 6.9% 7.0% 6.9% 6.8%
$80k-$110k 8.4% 8.1% 7.9% 7.8% 7.8% 7.6%
$110k-$200k 8.0% 8.1% 8.1% 7.8% 8.0% 7.7%
$200k+ 6.4% 6.5% 6.5% 6.1% 6.2% 6.0%
15
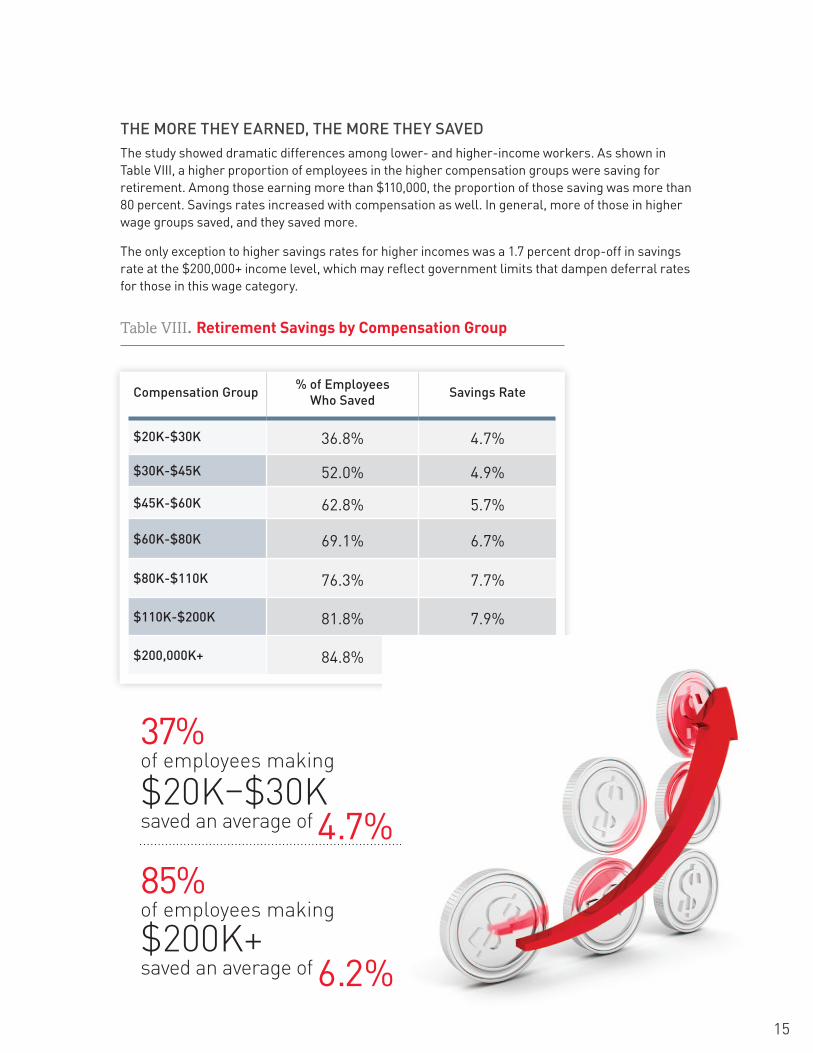
The more They eArned, The more They sAvedThe study showed dramatic differences among lower- and higher-income workers. As shown in Table VIII, a higher proportion of employees in the higher compensation groups were saving for retirement. Among those earning more than $110,000, the proportion of those saving was more than 80 percent. Savings rates increased with compensation as well. In general, more of those in higher wage groups saved, and they saved more.
The only exception to higher savings rates for higher incomes was a 1.7 percent drop-off in savings rate at the $200,000+ income level, which may reflect government limits that dampen deferral rates for those in this wage category.
Table VIII. Retirement Savings by Compensation Group
Compensation group % of employees who saved savings rate
$20k-$30k 36.8% 4.7%
$30k-$45k 52.0% 4.9%
$45k-$60k 62.8% 5.7%
$60k-$80k 69.1% 6.7%
$80k-$110k 76.3% 7.7%
$110k-$200k 81.8% 7.9%
$200,000k+ 84.8% 6.2%
37% of employees making
$20K–$30K saved an average of 4.7%85% of employees making
$200K+ saved an average of 6.2%

16
The apparent relationship between compensation levels and savings rate seemed to hold in all age groups as shown in Table IX. However, more of the older workers were saving and they saved at a higher rate in every wage category.
Table IX. Retirement Savings by Age Group and Compensation Group
The pattern of younger workers saving less than older workers was true for both genders as shown in Table X.
Table X. Retirement Savings by Gender and Age Group
Compensation/ Age group
% of employees who saved savings rate
20-29 30-39 40-49 50-60 61-69 20-29 30-39 40-49 50-60 61-69
$20k-$30k 31.7% 34.7% 37.5% 42.6% 41.9% 3.2% 4.0% 4.7% 5.8% 7.2%
$30k-$45k 48.2% 49.7% 51.7% 56.4% 56.2% 3.9% 4.1% 4.7% 5.9% 7.5%
$45k-$60k 61.3% 60.8% 62.0% 65.7% 65.4% 4.8% 4.8% 5.3% 6.7% 8.6%
$60k-$80k 64.7% 66.1% 69.2% 72.8% 71.9% 5.6% 5.6% 6.1% 7.7% 9.8%
$80k-$110k 71.4% 74.0% 76.2% 78.7% 78.5% 6.2% 6.5% 7.0% 8.8% 10.8%
$110k-$200k 72.8% 79.5% 82.1% 83.9% 82.3% 6.5% 6.9% 7.3% 8.9% 10.1%
$200k+ 74.3% 82.7% 85.2% 86.2% 84.0% 5.2% 5.6% 5.5% 6.8% 7.4%
Age group/ gender
% of employees % of employees who saved savings rate
female male female male female male
20-29 44.3% 55.7% 48.9% 48.0% 4.6% 5.0%
30-39 42.0% 58.0% 59.7% 56.6% 5.7% 5.7%
40-49 41.7% 58.3% 62.6% 62.2% 6.4% 6.2%
50-60 42.9% 57.1% 66.0% 65.3% 7.9% 7.6%
61-69 42.7% 57.3% 65.2% 63.9% 9.5% 9.0%

17
A higher PerCenTAge of femAles sAved, And They sAved more When gender was considered along with compensation, the aggregate results showed a higher percentage of females than males were saving for retirement, 61 percent and 60 percent respectively.
However, when wage groups were considered individually, as in Table XI, the research showed that, in every wage category, more females than males were saving for retirement. In addition, females saved at a higher rate in most wage categories.
In recent years, more attention has been paid to the fact that women are at greater risk than men of not achieving a secure retirement, due to lower incomes, time spent out of the workforce to be a parent or caregiver, and longer life expectancies. Many financial advisors and agencies have attempted to raise awareness of these retirement risks and emphasize the importance of retirement savings in messages targeted to women. The data seem to indicate these messages have had an impact. However, savings rates still are not at a level that predicts financial security in retirement for women.
Table XI. Retirement Savings by Gender and Compensation Group
Compensation/ gender
% of employees % of employees who saved savings rate
female male female male female male
$20k-$30k 54.8% 45.2% 39.2% 33.8% 4.6% 4.8%
$30k-$45k 49.5% 50.5% 56.1% 48.0% 5.0% 4.8%
$45k-$60k 42.2% 57.8% 67.6% 59.3% 6.0% 5.5%
$60k-$80k 37.5% 62.5% 74.1% 66.1% 7.0% 6.4%
$80k-$110k 33.3% 66.7% 80.6% 74.1% 8.2% 7.5%
$110k-$200k 26.5% 73.5% 85.7% 80.4% 8.3% 7.8%
$200k+ 21.5% 78.5% 88.2% 83.8% 6.3% 6.1%
In most wage levels, more women than men saved for retirement – for example, in the $60,000 to $80,000 compensation level, the percentage of women who saved was 74%, compared to 66% for men.
WOMEN
74%MEN
66%

18
A comfortable retirement is far from certain for most U.S. workers today. Many factors contribute to this uncertainty, including the lingering effects of the recent economic recession; continuing increases in healthcare costs; longer life expectancies for men and women; and the fragile financial state of Social Security. Another key factor contributing to retirement uncertainty is the behavior of workers themselves within a drastically changed retirement-savings system. Even among those workers with access to an employer-sponsored retirement plan, many fail to join, join too late or save too little.
The U.S. retirement system has undergone a fundamental transformation in the past 30 years, evolving from a system dominated by defined benefit plans and Social Security to one where defined contribution plans are the norm. This transition has shifted responsibility and risk from investment professionals to the American workforce, which does not necessarily have the knowledge needed to prioritize, manage and maximize retirement savings. Many may need to work much longer than they wished or face a stark financial reality. Social Security alone is often not sufficient to avoid poverty in old age.
This study highlighted gaps in savings behaviors among U.S. workers according to demographic profile (age and gender), compensation level and industry type. Most importantly, the study revealed opportunities for improvement.
The study found that employees within five years of retirement attempted to “catch up” by beginning or increasing savings – too late to save enough or take advantage of compounding earnings. More employees nearing retirement age in the next five years saved and they saved compared to younger workers at a rate nearly 3 percent higher than those not nearing retirement. The highest savings rate of 9 percent was among those reaching retirement age in 2014.
The proportion of employees saving, and their saving rates, varied widely by industry. However, in every industry, as the company size increased, so did the proportion of employees saving. In some cases, the difference in participation between small and large companies was as much as 47 percentage points. This discrepancy may be attributable to programs that are more common in larger companies such as automatic enrollment, the greater prevalence of matching contributions; and the greater availability of online retirement tools and resources.
In what may be a bright spot, more women than men in every age group saved and in most groups they saved at a higher rate. In light of the industry’s concerted effort to educate women about their retirement risks and savings needs, it appears women are listening.
As one might expect, those who earned more, saved more. Employees who saved for retirement had wages that were one-and-a-half times those of employees who did not save. Savings increased with compensation – regardless of industry, company size, age or gender.
Behavioral adaption originates from the presentation or understanding of new knowledge. The trends and disparities in retirement savings behaviors identified in this study ultimately reveal opportunities for employers, advisors, policy-makers and others to invest in the improvement of the defined contribution retirement system and the financial health and security of the American people.
Conclusion

19
This material is subject to change and is provided for informational purposes only and nothing contained herein should be taken as legal opinion, legal advice, or a comprehensive compliance review.
About ADP®
With more than $11 billion in revenues and more than 60 years of experience, ADP® (NASDAQ:ADP) serves approximately 620,000 clients in more than 125 countries. As one of the world’s largest providers of business outsourcing and human capital management solutions, ADP offers a wide range of human resource, payroll, talent management, tax and benefits administration solutions from a single source, and helps clients comply with regulatory and legislative changes, such as the Affordable Care Act (ACA). ADP’s easy-to-use solutions for employers provide superior value to organizations of all types and sizes. ADP is also a leading provider of integrated computing solutions to auto, truck, motorcycle, marine, recreational vehicle, and heavy equipment dealers throughout the world. For more information about ADP or to contact a local ADP sales office, visit the company’s website at www.adp.com.
About the ADP Research Institute®
The ADP Research Institute provides insights to leaders in both the private and public sectors regarding issues in human capital management, employment trends and workforce strategy.
ADP.com

The ADP logo, ADP, ADP Research Institute and In the Business of Your Success are registered trademarks of ADP, Inc. All other trademarks and service marks are the property of their respective owners. 99-3500-0514 Copyright ©2014 ADP, Inc.