retirement savings 2.0: updating savings policy for the modern economy
DESCRIPTION
Andrew G. Biggs statement before the US Senate Committee on FinanceTRANSCRIPT
1 | P a g e
Statement before the United States Senate
Committee on Finance
“Retirement Savings 2.0: Updating Savings
Policy for the Modern Economy”
Andrew G. Biggs, Ph.D.
Resident Scholar
American Enterprise Institute
September 16, 2014
The views expressed in this testimony are those of the author alone and do not necessarily represent those of the American Enterprise Institute.

2 | P a g e
Chairman Wyden, Ranking Member Hatch and Members of the Committee:
Thank you for the opportunity to testify with regard to the challenges facing Americans
as they prepare for retirement.
Americans do not face a “retirement crisis”: while we may read in the newspapers that
vast majorities of Americans are underprepared for retirement, the best research – including
sophisticated modeling undertaken by the Social Security Administration – shows a more
optimistic picture. Many retirees today face income challenges and many will in the future. But
the picture today is not of a crisis and the best forecasts do not show retirement security
declining significantly as the Baby Boom and Gen-X generations retire. I discuss this research
below.
But that does not mean we have nothing to worry about. Even if only one-quarter of
Americans are undersaving, and by relatively modest amounts, in a country of three hundred
million people that means millions will not be able to maintain their standard of living as they
shift from work into retirement. I will discuss who may be falling short in preparing for
retirement and what policymakers might do to help.
Finally, I include a brief discussion of a recent controversy over how to measure
“replacement rates” for Social Security benefits.
Introduction
There is a widespread perception that our country faces a “retirement crisis.” For
instance, the National Retirement Risk Index published by the Center for Retirement Research at
Boston College states that at least 53% of Americans are “at risk” of an insufficient retirement
income, with higher numbers once we account for retiree health costs.1 The National Institute on
Retirement Security goes further, claiming that up to 84% of Americans are underprepared and
that the total “retirement savings gap” approaches $14 trillion.2 A recent study from the New
America Foundation claims that Americans receive little retirement income from IRA and 401(k)
plans, and proposes to do away with tax preferences for private retirement saving and to expand
Social Security benefits by 50%.3
These claims, I believe, are mistaken.4 The studies cited above tend to underestimate the
incomes that Americans will have in retirement while overestimating how much Americans will
need to maintain their pre-retirement standards of living. Other research, including research from
the Social Security Administration, shows a different picture. Yes, there are some future
Americans who will fall short in retirement, just as there are some retirees who are falling short
today. But this research does not support the claim that retirement security is rapidly eroding and
does not, to my mind, justify turning our retirement system upside down.
Do we have a retirement crisis today?
It is worth starting by evaluating the status of retirees in America today. According to the
Census Bureau, the poverty rate for people aged 65 and older was 9.1%, versus 13.7% for those
aged 18 to 64 and 21.8% for children under age 18.5 Moreover, the poverty rate among retirees is
almost certainly overstated, because the Census Bureau does not count most withdrawals from
IRA and 401(k) retirement accounts as “income.”6
3 | P a g e
But an adequate retirement income isn’t merely one that keeps you out of poverty. A
more important measure of retirement income adequacy, which applies to rich and poor alike, is
whether your retirement income allows you to maintain your pre-retirement standard of living.
This approach is consistent with the “life cycle model” in economics, in which individuals prefer
to smooth their consumption from year to year rather than having a pattern of feast-and-famine.
One way to measure retirement security is via “replacement rates.” A replacement rate as
commonly understood in the U.S. measures an individual’s retirement income as a percentage of
that individual’s pre-retirement earnings. Financial advisors generally measure replacement rates
relative to earnings immediately prior to retirement; policy analysts often favor career-average
earnings adjusted for inflation, as this measure better reflects the total purchasing power – and
thus the standard of living – a person enjoyed in their pre-retirement years.
The Social Security Administration’s Office of Retirement and Disability uses a
sophisticated computer model known as “MINT” (Modeling Income in the Near Term) to
estimate incomes for current and future groups of retirees. MINT was developed beginning in the
late 1990s in cooperation with the Urban Institute, the RAND Corporation, and the Brookings
Institution. MINT combines Social Security earnings records, Census survey results and other
data to simulate thousands individuals over their full lives: person-by-person, year-by-year,
program-by-program. Each year the model simulates individuals’ earnings, education, health
status, work, marriage, disability, and retirement saving. MINT calculates not just Social
Security benefits, but also earnings, asset income, pensions and government benefits such as SSI,
Food Stamps, WIC, TANF and even heating and rental assistance. MINT is currently in Version
7 and the model is regularly peer-reviewed by experts both inside and outside the SSA.
According to SSA’s MINT model, the so-called “Depression Babies” (born 1926-1935)
had a median income at age 67 equal to 109% of the household’s career-average earnings
adjusted for inflation. SSA estimates that the “War Babies” (born 1936-1945) had a median
replacement rate of 119% of average pre-retirement earnings. The “Leading Boomers” (born
1946-1955), who are retiring today, have an estimated replacement rate of 116% of average pre-
retirement earnings.7
The question is, are these replacement rates sufficient to allow retirees to match their pre-
retirement standard of living? A 2009 research paper commissioned by the SSA and authored by
economists John Karl Scholz and Ananth Seshadri of the University of Wisconsin estimated that
a typical household could maintain its standard of living from work into retirement if it had a
retirement income equal to 68% of its inflation-averaged pre-retirement earnings.8 By this
standard, the MINT figures indicate that the typical retiree today is faring quite well. Moreover,
the MINT model indicates that only around 26% of current retirees have retirement incomes
below 75% of their average pre-retirement earnings and only 8% had replacement rates below
50%. From these figures, it is difficult to conclude that current retirees face a “crisis.”
An alternate way to judge the income security of current retirees is simply to ask them:
according to Gallup, 75% of current retirees report having enough money to live comfortably.9
Ohio State economist Jason Seligman finds, using data from the federally-sponsored Health and
Retirement Study, that 68% of current retirees deem themselves “very satisfied” in retirement,
with another 23% calling themselves “moderately satisfied.” Just 14% report that their retirement
years are “not as good” as the years immediately preceding retirement.10
RAND Corporation
economists Michael Hurd and Suzanne Rohwedder find that most current retirees “seem to be
4 | P a g e
pleasantly surprised by their level of resources.”11
So retirees’ perceptions seem to match up with
the data: there doesn’t seem to be a retirement crisis today.
Will there be a retirement crisis in the future?
If there isn’t a retirement crisis today, it does not seem likely there will be one in the
future, as the best retirement models do not project that future retirees will have significantly
lower replacement rates than current retirees.
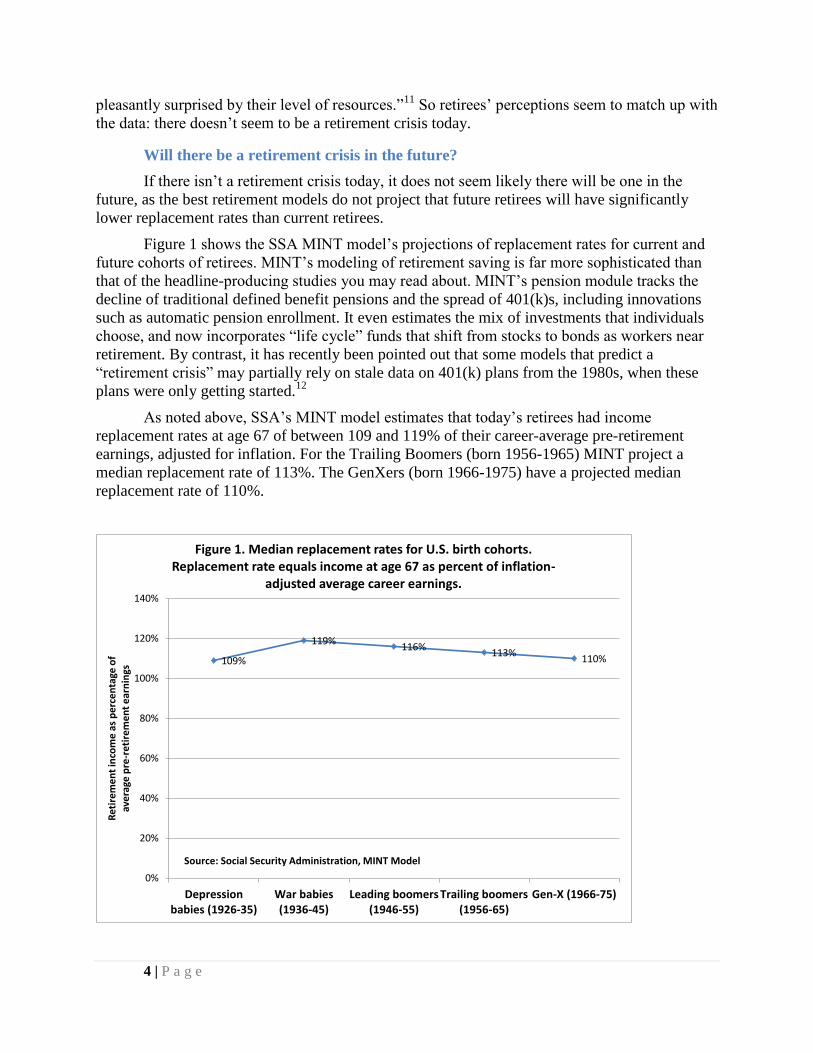
Figure 1 shows the SSA MINT model’s projections of replacement rates for current and
future cohorts of retirees. MINT’s modeling of retirement saving is far more sophisticated than
that of the headline-producing studies you may read about. MINT’s pension module tracks the
decline of traditional defined benefit pensions and the spread of 401(k)s, including innovations
such as automatic pension enrollment. It even estimates the mix of investments that individuals
choose, and now incorporates “life cycle” funds that shift from stocks to bonds as workers near
retirement. By contrast, it has recently been pointed out that some models that predict a
“retirement crisis” may partially rely on stale data on 401(k) plans from the 1980s, when these
plans were only getting started.12
As noted above, SSA’s MINT model estimates that today’s retirees had income
replacement rates at age 67 of between 109 and 119% of their career-average pre-retirement
earnings, adjusted for inflation. For the Trailing Boomers (born 1956-1965) MINT project a
median replacement rate of 113%. The GenXers (born 1966-1975) have a projected median
replacement rate of 110%.
109%
119%116%
113%110%
0%
20%
40%
60%
80%
100%
120%
140%
Depressionbabies (1926-35)
War babies(1936-45)
Leading boomers(1946-55)
Trailing boomers(1956-65)
Gen-X (1966-75)
Ret
ire
me
nt
inco
me
as
pe
rce
nta
ge o
f av
era
ge p
re-r
etir
em
en
t e
arn
ings
Figure 1. Median replacement rates for U.S. birth cohorts.Replacement rate equals income at age 67 as percent of inflation-
adjusted average career earnings.
Source: Social Security Administration, MINT Model
5 | P a g e
These simply aren’t big differences. In fact, SSA projects that the GenXers will have the
same replacement rates as the Depression birth cohorts, who enjoyed the “Golden Age” of
retirement where traditional defined benefit pensions were more common widespread and Social
Security benefits more generous. The reality is that the “Golden Age” wasn’t so golden: most
workers didn’t have traditional pensions, and many who did participate in such plans failed to
vest in their benefits. Likewise, today’s retirement situation isn’t nearly as bad as many critics
like to claim.
Nor do the MINT model’s projections show an emerging retirement underclass that lives
in poverty even as others do well. As noted above, MINT estimates that only 26% of Depression
Babies had replacement rates below 75% and only 8% had replacement rates below 50%. For the
GenXers, who it is claimed face a retirement crisis, MINT projects that 25% will have
replacement rates below 75% and 8% will have replacement rates below 50%. These are hardly
figures to inspire apocalyptic reactions.
The Employee Benefit Research Institute developed its own Retirement Security
Projection Model which comes to broadly similar conclusions: “the overall retirement income
adequacy prospects for GenXers [are] approximately the same as Early Boomers and Late
Boomers,” EBRI says.13
The face of retirement income is changing dramatically: for instance, MINT projects that
half as many future retirees will receive income from traditional DB pensions while twice as
many will retire with IRAs and 401(k) accounts. But SSA’s MINT model, which is the most
sophisticated in the business, does not project large changes in the overall level of income
adequacy for future generations of retirees.
What does this mean for retirement policy?
Just because we don’t face a retirement crisis does not mean that every retiree will be
financially secure. Nevertheless, the solutions to a smaller, more targeted problem are different
than when the retirement system seems to be failing for the vast majority of people.
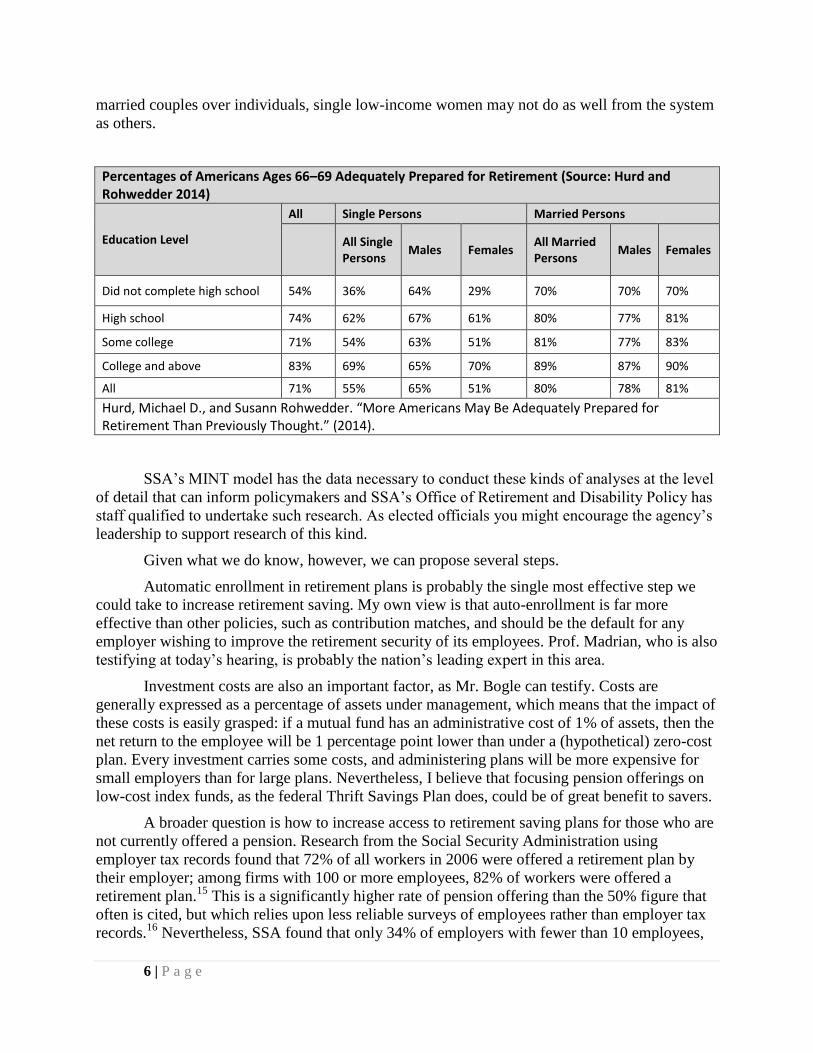
RAND economists Michael Hurd and Susanne Rohwedder find that 71% of Americans
currently aged 66-69 are adequately prepared for retirement.14
Likewise, the University of
Wisconsin’s Karl Scholz and Ananth Seshadri along with the Brookings Institution’s William
Gale conclude that only around 26% of households are currently under-saving for retirement.
Those who are under-prepared have savings about 17% below where they should be. The authors
conclude that while “some households will need to ratchet their living standards downward in
retirement, most Americans are, by in large, preparing sensibly, given the existing generosity of
social security, Medicare, and pension arrangements.”
This picture is consistent with the SSA MINT figures I cited above, but is very different
from the studies that so often generate headlines. Where we need more and better research is
figuring out precisely who those under-prepared Americans are, by how much they fall short of
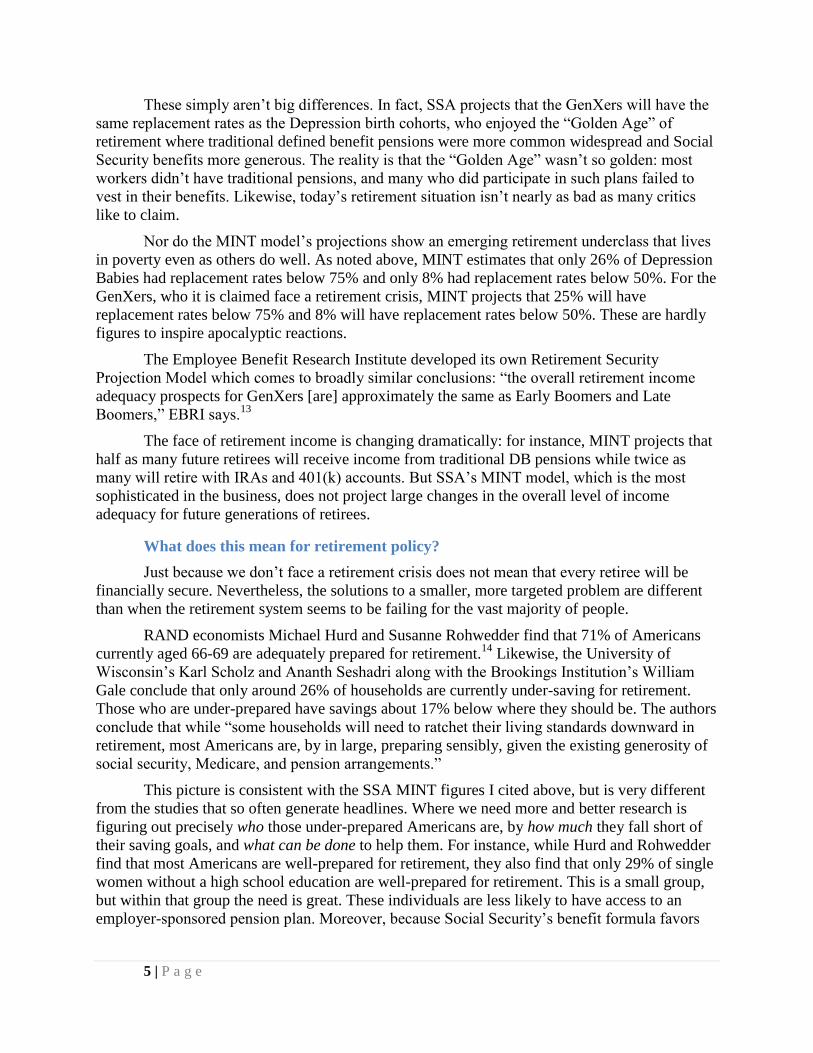
their saving goals, and what can be done to help them. For instance, while Hurd and Rohwedder
find that most Americans are well-prepared for retirement, they also find that only 29% of single
women without a high school education are well-prepared for retirement. This is a small group,
but within that group the need is great. These individuals are less likely to have access to an
employer-sponsored pension plan. Moreover, because Social Security’s benefit formula favors
6 | P a g e
married couples over individuals, single low-income women may not do as well from the system
as others.
Percentages of Americans Ages 66–69 Adequately Prepared for Retirement (Source: Hurd and Rohwedder 2014)
Education Level
All Single Persons Married Persons
All Single Persons
Males Females All Married Persons
Males Females
Did not complete high school 54% 36% 64% 29% 70% 70% 70%
High school 74% 62% 67% 61% 80% 77% 81%
Some college 71% 54% 63% 51% 81% 77% 83%
College and above 83% 69% 65% 70% 89% 87% 90%
All 71% 55% 65% 51% 80% 78% 81%
Hurd, Michael D., and Susann Rohwedder. “More Americans May Be Adequately Prepared for Retirement Than Previously Thought.” (2014).
SSA’s MINT model has the data necessary to conduct these kinds of analyses at the level
of detail that can inform policymakers and SSA’s Office of Retirement and Disability Policy has
staff qualified to undertake such research. As elected officials you might encourage the agency’s
leadership to support research of this kind.
Given what we do know, however, we can propose several steps.
Automatic enrollment in retirement plans is probably the single most effective step we
could take to increase retirement saving. My own view is that auto-enrollment is far more
effective than other policies, such as contribution matches, and should be the default for any
employer wishing to improve the retirement security of its employees. Prof. Madrian, who is also
testifying at today’s hearing, is probably the nation’s leading expert in this area.
Investment costs are also an important factor, as Mr. Bogle can testify. Costs are
generally expressed as a percentage of assets under management, which means that the impact of
these costs is easily grasped: if a mutual fund has an administrative cost of 1% of assets, then the
net return to the employee will be 1 percentage point lower than under a (hypothetical) zero-cost
plan. Every investment carries some costs, and administering plans will be more expensive for
small employers than for large plans. Nevertheless, I believe that focusing pension offerings on
low-cost index funds, as the federal Thrift Savings Plan does, could be of great benefit to savers.
A broader question is how to increase access to retirement saving plans for those who are
not currently offered a pension. Research from the Social Security Administration using
employer tax records found that 72% of all workers in 2006 were offered a retirement plan by
their employer; among firms with 100 or more employees, 82% of workers were offered a
retirement plan.15
This is a significantly higher rate of pension offering than the 50% figure that
often is cited, but which relies upon less reliable surveys of employees rather than employer tax
records.16
Nevertheless, SSA found that only 34% of employers with fewer than 10 employees,
7 | P a g e
and 46% of employers with 10-24 employees, offered a retirement plan. These smaller
employers cite the complexity and costs of maintaining a plan, which can include legal,
accounting, consulting, record-keeping and communication services. For a small business this
may simply be more than they can handle. Some experts propose a “Super Simple” savings plan
that reduces cost and complexity for small employers while maintaining the tax benefits that
make 401(k) plans attractive.17
It also is worth addressing proposals that I believe are more problematic. Specifically, a
number of plans exist in the House, Senate and think tanks to expand the Social Security
program. Social Security is already underfunded by more than $10 trillion over the next 75 years.
According to the CBO, Social Security’s long-term shortfall has quadrupled over the past six
years, from 1% of payroll to 4%. Expanding Social Security under these circumstance raises
problems that are almost too obvious to mention.
In the interest of clarity, however, I will mention two. First, such plans “use up” policy
options that that previously had been pegged for restoring Social Security’s solvency and instead
use them to raise benefits. For instance, some people favor improving Social Security’s finances
by lifting the $117,000 ceiling upon which payroll taxes are levied. This would generate
additional revenues for the program. Most Social Security expansion plans also lift the so-called
“tax max” but use the extra revenues to increase benefits. These plans do relatively little to
improve Social Security’s finances, but leave fewer options on the table when Congress does
eventually act on Social Security reform.
Moreover, it’s not clear that raising benefits across the board would help the people who
are mostly likely to be falling short in retirement. For instance, I mentioned above that single,
less-educated women appear to be at particular financial risk in retirement. What you may not
know is that, under Social Security’s benefit formula, a single, low-income woman who works
and contributes to Social Security every year of her life would receive a lower benefit in
retirement than the non-working spouse of a high-wage earner. This is despite the fact that the
single woman both needs the benefits more and has paid more into the program. Likewise,
individuals with full working careers are often penalized versus those who fit all their earnings
into just 35 years, the period over which Social Security averages earnings in order to calculate
benefits. Single women have significantly greater labor force participation than married women
and thus are more likely to be denied credit for working more than 35 years. An across-the-board
benefit increase won’t fix this problem.
Similarly, the Social Security Administration estimates that 4% of retirees will never
receive benefits from the program. These so-called “never-beneficiaries” have
lower education levels and higher proportions of women, Hispanics, immigrants, the
never-married, and widows than the beneficiary population. Never-beneficiaries have a
far higher poverty rate (about 44%) than current and future beneficiaries (about 4%).
Ninety-five percent of never-beneficiaries are individuals whose earnings histories are
insufficient to qualify for benefits.18
And under proposals to expand Social Security, these individuals would remain never-
beneficiaries because these plans deal principally with benefit levels, not the way people qualify
for benefits or how those benefits are allocated.

8 | P a g e
To address these issues, I and others have proposed a universal, flat benefit paid to all
retirees, regardless of their earnings or workforce participation. On top of this, individuals would
save for retirement in accounts that would supplement Social Security.19
This approach would
effectively take the poverty rate among seniors from about 9% to zero percent, while making
Social Security a more reliable and understandable social insurance benefit for those who need it
the most. Yes, middle and high income workers would need to save more on their own. But these
are individuals who could, should and would save more for retirement if they saw the need to do
so. Other countries’ pension plans, such as in the United Kingdom, New Zealand, Australia and
Canada, embrace this broad theme. Such an approach can improve retirement security, lower
poverty rates, and increase real retirement saving.
In short, we don’t need to make Social Security larger so much as make it work better.
9 | P a g e
Appendix: The Replacement Rates Controversy
In recent months a debate has developed over how to calculate “replacement rates” for
Social Security. Replacement rates are a common measure of benefit adequacy, but there is no
single agreed-upon way in which to calculate replacement rates. This can create confusion
among consumers of this information. For instance, financial advisors often recommend that
retirees have a replacement rate of 70% of their final earnings immediately prior to retirement.
But one cannot apply this 70% target to replacement rates calculated in other ways. For instance,
SSA has commonly stated that a typical individual receives a replacement rate of 40 percent
from the program, but this figure is calculated by SSA’s actuaries using a different method.
Thus, in my view, there is an apples-and-oranges problem.
Until 2014, the annual Social Security Trustees Report published replacement rates for
stylized individuals at different earnings levels. The Trustee’s 2013 Report makes clear that
discomfort was growing with regard to how these figures were calculated. The Trustees noted
that SSA’s
method of calculation produces percentages that may differ significantly from those that
would be produced by comparing benefits to these representative workers’ recent average
earnings levels or to other more common measures of pre-retirement income.20
In 2014, the Trustees Report ceased publishing replacement rates. SSA’s Office of the Chief
Actuary has recently published Social Security replacement rates under its own auspices and
issued an actuarial note defending its figures.21
Not surprisingly, these events have generated controversy, including accusations of
political manipulation. In reality, what is happening is a technical – but very important – debate
among retirement policy analysts. The whole debate cannot be outlined here, but it might help to
distinguish between two types of replacement rates:
American-style replacement rates: these measure a retiree’s income as a percentage of
that retiree’s previous earnings and thus represent the degree to which the retiree can
maintain his pre-retirement standard of living.
European-style replacement rates: these measure retirees’ incomes in a given year as a
percentage of workers’ incomes in that same year, and thus compares retirees’ standard
of living to that of working-age members of society.
The point isn’t that one approach is better than another, but that they measure very different
things. Economists Olivia Mitchell of Wharton and John Phillips of the National Institutes of
Health state that the ratio of pension benefits to average wages “is commonly used in Europe,
where retirement adequacy is often judged according to whether retirees maintain a given
relative position vis-à-vis current working cohorts.” But, Mitchell and Phillips, note “Historically
in the United States, policy makers have tended to prefer a replacement rate measure tied to
workers’ own past earnings.”22
While SSA’s actuaries describe their figures as American-style replacement rates, in
reality the actuaries’ figures are European-style replacement rates which compare benefits paid
to retirees today with the wages earned by workers today. This is easily demonstrated with data
from Table V.C7 of the 2014 Trustees Report, which includes annual benefit amounts for SSA’s
stylized workers retiring in a given year along with the annual wages paid to workers in that
year. To illustrate, SSA’s stylized medium earner retiring in 2014 receives an annual benefit of
10 | P a g e
$19,477; the average wage paid to workers in 2014 is estimated at $46,787. Divide the two
figures and get 41.6%, which is almost precisely equal to the 41.1% replacement rate published
by SSA’s actuaries that purports to compare the median earner’s benefits to his own pre-
retirement earnings.23
Simply put, the replacement rate figures that previously were published in
the Social Security Trustees Reports do not represent what most readers think they represent, and
thus they may incorrectly shape perceptions of retirement income adequacy and Social Security
policy.
SSA’s Office of the Chief Actuary has cited international organizations such as the
OECD, stating that SSA is following an “internationally recognized standard” in calculating
replacement rate. But the OECD as an institution explicitly defines the replacement rate as “The
ratio of an individual’s (or a given population’s) (average) pension in a given time period and the
(average) income in a given time period.”24
The World Bank and IMF also measure replacement
rates relative to average incomes at the time, but similarly do not claim that these figures are
measures of retirement income adequacy.25
SSA’s actuaries point to a single OECD publication
that describes its replacement rates as being measured relative to pre-retirement earnings, but this
publication – like others from the OECD, IMF and World Bank – in fact compares benefits paid
to today’s retirees to the incomes of today’s workers.
When we measure replacement rates relative to workers’ prior earnings, the adequacy of
Social Security benefits appears to be higher. For instance, while the standard belief is that
Social Security pays a typical worker a replacement rate of around 40 percent of his pre-
retirement earnings, in a 2008 study published with Glenn Springstead of SSA I found that the
median household aged 64-66 in 2005 received a Social Security benefit equal to 53 percent of
its inflation-adjusted career-average earnings.26
But further research is necessary: the replacement rates that Social Security pays to
beneficiaries vary widely: even among retirees with the same lifetime earnings, some receive
very high replacement rates and others receive much lower replacement rates.27
At the same
time, Scholz and Seshadri show that the target replacement rates for households also vary
considerably, based upon factors such as marital status, income level, and the number of children
a household has. While the authors calculated a median target replacement rate of 68 percent of
inflation-averaged lifetime earnings, 48 percent of households have optimal replacement rates
below 65 percent and 37 percent of households have optimal replacement rates above 90 percent.
At this time we have little idea of how well Social Security is matching replacement rates to
households’ actual needs. But this is the sort of research topic that SSA’s Office of Retirement
and Disability Policy is well-situated to address.
11 | P a g e
1 Munnell, Alicia H., Anthony Webb, and Luke Delorme, 2006, “A New National Retirement Risk Index,” Center
for Retirement Research at Boston College. 2 Nari Rhee. “The Retirement Crisis: Is It Even Worse Than We Think?” The National Institute on Retirement
Security. June 2013. 3 Lind, Michael, Joshua Freedman, Steven Hill, and Robert Hiltonsmith. “Expanded Social Security: A Plan to
Increase Retirement Security for All Americans.” New America Foundation. April 2013. 4 The discussion here draws upon Biggs, Andrew G. and Sylvester J. Schieber. “Is There a Retirement Crisis?”
National Affairs 20, Summer 2014, pp. 55-75. Also see Pang, Gaobo, and Sylvester J. Schieber. “Why American
Workers’ Retirement Income Security Prospects Look So Bleak: A Review of Recent Assessments.” The Journal of
Retirement 2.1 (2014): 35-54. 5 Source: United States Census Bureau. https://www.census.gov/hhes/www/poverty/about/overview/
6 Miller, Billie Jean, and Sylvester J. Schieber. “Contribution of Pension and Retirement Savings to Retirement
Income Security: More Than Meets the Eye.” The Journal of Retirement 1.3 (2014): 14-29. 7 See Butrica, Barbara A., Karen E. Smith, and Howard M. Iams. “This Is Not Your Parents' Retirement: Comparing
Retirement Income Across Generations.” Social Security Bulletin 72 (2012): 37. 8 Scholz, John Karl, and Ananth Seshadri. “What Replacement Rates Should Households Use?” University of
Michigan, Michigan Retirement Research Center, 2009. 9 Gallup. “U.S. Retirees More Financially Comfortable Than Nonretirees.” June 4, 2013.
http://www.gallup.com/poll/162890/retirees-financially-comfortable-nonretirees.aspx 10
Seligman, Jason S. “Missing the Mark: Employment Related Risks to Retirement Security for Older Workers.”
TIAA-CREF Policy Briefs (2010). 11
Hurd, Michael, and Susann Rohwedder. “The Retirement-Consumption Puzzle.” RAND Labor and Population
Working Paper (2005). 12
VanDerhei, Jack, “Contributory ‘Negligence?’ The Impact of Future Contributions to Defined Contribution Plans
on Retirement Income Adequacy for Gen Xers” EBRI Notes, Vol. 35, No. 8, August 2014. 13
VanDerhei, Jack, “Contributory ‘Negligence?’ The Impact of Future Contributions to Defined Contribution Plans
on Retirement Income Adequacy for Gen Xers” EBRI Notes, Vol. 35, No. 8, August 2014. 14
Source: Hurd, Michael D., and Susann Rohwedder. “More Americans May Be Adequately Prepared for
Retirement Than Previously Thought.” (2014). Also see Hurd, Michael D., and Susann Rohwedder. “Adequacy of
economic resources in retirement and returns-to-scale in consumption.” Michigan Retirement Research Center
Research Paper No. WP 174 (2008). 15
Dushi, Irena, Howard M. Iams, and Jules Lichtenstein. “Assessment of Retirement Plan Coverage by Firm Size,
Using W-2 Tax Records.” Soc. Sec. Bull. 71 (2011): 53. 16
See Rhee (2013). 17
Perun, Pamela, and C. Eugene Steuerle. 2008. “Why Not a ‘Super Simple’ Saving Plan for the United States?”
Washington, DC: The Urban Institute. Opportunity and Ownership Project Report 3. 18
Whitman, Kevin, Gayle L. Reznik, and Dave Shoffner. “Who Never Receives Social Security Benefits?” Social
Security Bulletin 71.2 (2011). 19
See Biggs, Andrew G. “A New Vision for Social Security.” National Affairs 16, Summer 2013. 20
Social Security Trustees. The 2013 Annual Report of the Board of Trustees of the Federal Old-Age and Survivors
Insurance and Federal Disability Insurance Trust Funds. May 31, 2013. 21
Goss, Stephen, Michael Clingman, Alice Wade, and Karen Glenn. “Replacement Rates For Retirees: What Makes
Sense For Planning And Evaluation?” Social Security Administration. Actuarial Note Number 155. July 2014. 22
Mitchell, Olivia S., and John WR Phillips., 2006, “Social Security Replacement Rates for Alternative Earnings
Benchmarks.” Benefits Quarterly. Fourth Quarter, pp. 37-47. 23
Michael Clingman, Kyle Burkhalter, and Chris Chaplain. “Replacement Rates For Hypothetical Retired
Workers.” Office of the Chief Actuary, Social Security Administration. Actuarial Note Number 2014.9, July 2014. 24
Organisation for Economic Cooperation and Security. Glossary of Statistical Terms. “Replacement rate.” Updated
August 17, 2005. 25
See Forteza, Alvaro., and Ourens, Guzman, 2009, “How Much Do Latin American Pensions Promise to Pay
Back?” Washington DC: World Bank; and Clements, Benedict J., et al., “The Challenge of Public Pension Reform
in Advanced and Emerging Economies,” 2013, International Monetary Fund. 26
See Biggs, Andrew G., and Glenn R. Springstead. “Alternate measures of replacement rates for Social Security
benefits and retirement income.” Social Security Bulletin 68 (2008): 1. In a recent actuarial note, Goss et al (2014)
12 | P a g e
found a significantly lower replacement rate of around 45 percent of inflation-adjusted pre-retirement earnings for
individuals claiming benefits in 2011. A variety of factors could account for this difference: First, Biggs and
Springstead (2008) measured replacement rates on the more economically-relevant household basis while Goss et al
(2014) measure them on an individual basis; the dataset used by Goss et al (2014) does not allow for household
measurements. Second, Biggs and Springstead (2008) measured replacement rates for a household with median
earnings, while Goss et al (2014) measured the median replacement rate, which may differ. Third, Biggs and
Springstead (2008) included all non-disabled beneficiaries and all benefits paid to them, while Goss et al (2014)
exclude spouse-only and widow-only beneficiaries and, for retired worker beneficiaries, exclude supplemental
spousal and widow benefits. While excluding spouse/widow-only beneficiaries may make sense when replacement
rates are calculated on an individual basis, since replacement rates would be extremely high, these beneficiaries
should be included in a household calculation where such issues do not arise. Benefits for dually-entitled retired
workers should be included in either an individual- or household-level replacement rate calculation. Nearly half of
female retired worker beneficiaries receive supplemental spousal or widow benefits and, on average, these
supplements increase total benefits received by such individuals by over 75 percent, according to SSA’s Statistical
Supplement. Fourth, the time period in which replacement rates were measured differed in regard to inflation, wage
growth, and labor force participation and earnings of older workers, which generate different replacement rates in
retirement. 27
See Biggs, Andrew G. “Will Your Social Insurance Pay Off? Making Social Security Progressivity Work for
Low-Income Retirees.” AEI Retirement Policy Outlook 1 (2009).