the restructuring of large ukrainian enterprises… · ukrainian enterprises: impact of...
TRANSCRIPT

THE RESTRUCTURING OF LARGE UKRAINIAN ENTERPRISES: IMPACT OF COMPETITION, PRIVATIZATION AND HARD BUDGET CONSTRAINTS
by
Svitlana Koretska
A thesis submitted in partial fulfillment of the requirements for the
degree of
Master of Arts in Economics
National University of Kiev-Mohila Academy
2002
Approved by Professor Serhiy Korablin, Institute for Economic Chairperson of Supervisory Committee
Forecasting at the National Academy of Sciences of Ukraine ___
__________________________________________________
__________________________________________________
Program Authorized to Offer Degree _________________________________________________
Date __________________________________________________________

Economics Education and
Research Consortium at National University of Kyiv-Mohila
Academy
Abstract
THE RESTRUCTURING OF LARGE UKRAINIAN ENTERPRISES: IMPACT OF COMPETITION, PRIVATIZATION AND HARD BUDGET CONSTRAINT
by Svitlana Koretska
Chairperson of the Supervisory Committee: Professor Serhiy Korablin
Institute for Economic Forecasting at the
National Academy of Sciences of Ukraine
This thesis investigates the impact of competition, privatization and
hard budget constraints on enterprise restructuring and performance, using
the dataset of 177 Ukrainian industrial enterprises with more than 250
employees. The paper also concentrates on the interactive effects between
competition, privatization and hard budget constraints in order to reveal the
presence of complementarity or substitutability between them. We find
positive association between competition and restructuring, and positive
effect of privatization, hard budget constraints and foreign competition on
performance of the enterprises. Moreover, since the privatization,
competition and hard budgets are complements in their effect on
restructuring, the positive effect of one policy will be strengthened in the
presence of other two. As a policy implication, the study suggests that
speeding up privatization process, tightening financial discipline for firms and
encouraging competition would foster restructuring process on Ukrainian
enterprises and improve their performance.

TABLE OF CONTENTS
Glossary………………………………………………………………...
Chapter 1. INTRODUCTION…………………………………………
Chapter 2. LITERATURE REVIEW…………………………………...
Chapter 3. AGENTS AND INSTITUTIONS………………………….
Agents……………………………………………………………
Institutions……………………………………………………….
Description of restructuring process in Ukraine…………………..
Chapter 4. EMPIRICS………………………………………………….
Data description………………………………………………….
Definition of the variables……………………………………...…
Specification of the models..…………………………………...…
Results…………………………………………………………....
Limitations of the research and suggestions for further work..
Chapter 5. CONCLUTIONS AND POLICY IMPLICATIONS……….
BIBLIOGRAPHY……………………………………………………...
APPENDIX 1: Composition of the sample……………………………
APPENDIX 2: Summary statistics for the variables used in the analysis...
APPENDIX 3: Construction of dummies for restructuring activity……..
APPENDIX 4: Survey questions used for the construction of
variables……………………………………………………………..
APPENDIX 5: Regression results on hypothesis 1; labor productivity as
dependent variable…………………………………………………..
APPENDIX 6: Regression results on hypothesis 1; restructuring
dummies as dependent variables………………………………….….
APPENDIX 7: Regression results on hypothesis 2; labor productivity as
dependent variable…………………………………………………...
APPENDIX 8: Regression results on hypothesis 2; restructuring
dummies as dependent variables………………………………….….
iii
1
4
12
12
12
15
17
17
18
22
26
30
32
34
39
40
41
43
44
45
46
47

ACKNOWLEDGMENTS
I would like to express my gratitude to everybody who helped me in
developing of my thesis. First of all, this is my thesis adviser prof. Roy
Gardner, who helped me a lot with his useful advice and support. I am also
grateful to prof. Ron Johnson, prof. Magdalena Sokalska, prof. Ghaffar
Mughal and prof. Stephan Lutz for their valuable comments.
I want to express my sincere appreciation to Dr. Iryna Akimova and
Alexander Scherbakov for their numerous and insightful suggestions and
ideas. And also I would like to thank the Institute for Economic Research and
Policy Consulting at German Advisory Group in Ukraine for providing me
with the data.
I also want to thank second-year students, especially Edward Melnichenko,
Olexandr Zhylevskyy and Marianna Kudlyak, for their useful remarks and
help. And special thanks to my husband, Stanislav Koretsky, for his patience
and support.
ii

GLOSSARY
Hard Budget Constraints exist when an enterprise faces tight financial discipline from the side of government and banks, i.e. it does not get subsidies or credits on preferential terms.
Newly-created enterprises are the private enterprises that have been created after January 1991.
Privatized enterprises are former state enterprises, where state has transferred more than 50% of shares to the private owners in the process of privatization.
Regressive restructuring includes labor shedding, cutting of real wage, reduction in social and unused production assets, and closure of unprofitable product lines.
Restructuring involves substantial changes in enterprise’s activity, relationships and organization, which lead to the creation of agents responsive to changes in market environment.
Soft Budget Constraints exist on an enterprise that could expect financial support from the state or other economic agents in the situation of bankruptcy or other financial problems.
State-owned enterprise is the type of enterprise with more than 50% of the shares owned by the state.
Strategic restructuring is a radical change in strategic outlook of the firm and is accompanied by investment in new equipment, development of new products and new markets, increased product quality, structural changes in labor force, and improvements in organizational structure.
iii
C h a p t e r 1
INTRODUCTION
A change from a planned to market economy in former communist
countries has resulted in unexpectedly slow period of transition. This has
stimulated an investigation of the usefulness and effectiveness of a great
variety of policies that could influence the speed and successfulness of
transition.
In this thesis, we will concentrate on three policy variables:
competition, privatization, and hard budget constraints, which are believed to
be main determinants in improving performance of enterprises in transition
countries. Previous works discovered positive effect of privatization on
performance and restructuring indicators for enterprises from different
transition countries (Djankov and Pohl, 1997, Carlin and Lendesmann, 1997,
Grosfeld and Nivet, 1997, Earle and Estrin, 1997, Brown and Earle, 2000,
Grigorian, 2000). The positive influence on performance was also found for
increased competitive pressure (Konings, 1998, Anderson et al, 1999, Brown
and Earle, 2000, Carlin et al, 2001, Grosfeld and Tressel, 2001) and harder
budgets (Grigorian, 2000, Earle and Estrin, 1998, Konings, 1998). An
interesting observation has been made by Konings (1998) that tight financial
and competitive pressure has positive and significant impact on total factor
productivity only at early stages of transition, whereas in the ‘advanced’
transition countries, where restructuring has occurred, these factors “have no
longer any effect because they have reached their optimum” (Konings, 1998,
p.13).
In the face of institutional changes in post-communist countries, the
question about substitutability and complementarity of different policy
alternatives arises. The focus of interest concerns the question about whether
one policy can be enhanced by another policy and, thus, this would lead to
higher results, or whether the policies could work without one another and
still be effective. The answer to this question could help policy-makers to
formulate strategies of enterprise restructuring in transition period. The
discussion of this problem and empirical research is found in the works of
Earle and Estrin (1997), Commander et al (1999), Brown and Earle (2001a),
Grosfeld and Tressel (2001).
In this research, we will try to find the best policy alternative for
Ukraine by estimating the effect of privatization, competitive pressure,
financial discipline and their interactions on the performance of 177 large
industrial enterprises. Ukrainian government has undertaken reforms in all
three policy fields we are interested in. Although the reforms are not
completed, there are first results. According to EBRD Transition Report
2001, private sector’s share of GDP in mid-2001 constituted 60%. More than
20-25% of large-scale enterprise assets are in private hands, but,
unfortunately, main questions regarding corporate governance remain
unresolved. Although hardening of budgets is observed, bankruptcy
enforcement remains to be weak. Competition policy and corresponding
institutions are designed, while law enforcement is to be strengthened.
Substantial progress has been achieved in price liberalization. According to
the survey of 2100 enterprises the competition turned out to be the main
incentive to undertake restructuring (EBRD Transition report 2001, p. 207).
As we can see, there is a great room for improvement in reforms in
Ukraine. In this light, it is important to know which policy could give the best
outcome. Estimating effects of the policies separately could show which one
is more important when implemented alone. The estimation of the interaction
effects between policy variables will show whether two policies implemented
simultaneously are more efficient in their outcomes or not. If, for instance,
there were positive effect of interaction between competition and
privatization (i.e. if they are complements), this would mean that the
2

effectiveness of privatization in affecting restructuring of enterprises depends
on implementation of competition policy. If, on the other hand, no
interaction effect is discovered, this would point on the fact that the effect of
one policy is not strengthened in the presence of another one, and we could
design quite different strategies: for example, we may postpone or slow the
pace of privatization until the good competitive environment and sound
system of property rights are established. The same reasoning applies to the
competition and hard budget constraints. Since there had been no
quantitative studies investigating the interaction effects between the above-
mentioned policies in Ukraine, this paper will first attempt to explore this
area.
The thesis is organized as follows. In the next chapter we will take a
close look on the existing literature on the topic. Then follows the description
of Ukrainian case, and in particularly, of agents and institutions. The empirical
model and regression results are presented in the chapter 4. Finally, the paper
ends up with conclusions and policy recommendations.
3

C h a p t e r 2
LITERATURE REVIEW
A great variety of literature investigating the effects of competition,
privatization and hard budget constraints on efficiency of enterprises has
appeared in recent times. In this section we will first briefly define what
restructuring of an enterprise means. Then we will consider the works that
concentrate on effect of different policies on enterprise efficiency and
restructuring.
Restructuring1 is a set of changes on the enterprise aimed to increase
efficiency, to improve the general situation of an enterprise and to ensure its
profitability over long period of time. We can define two types of
restructuring: regressive and strategic. Regressive (or passive) restructuring
means the implementation of measures that will ensure good functioning of
an enterprise, at least in the short-run, without significant costs. These
measures usually include maximization of productive efficiency of existing
equipment (without significant costs), decreasing employment, selling of some
property, cutting the expenses etc.
Strategic restructuring requires implementation of measures that will
ensure efficient operation of an enterprise and make it competitive in the long
term. Such measures should include not only replacement of obsolete
equipment, but changes in technological process, the development of new
products, and the search for new markets. It could also include changes in the
organizational structure of an enterprise in order to improve management.
One can subdivide strategic restructuring into two categories: hard, which
results in investment in new equipment and technologies, and soft, which is
characterized by improvements in marketing activities, increased promotion
of products etc.
4

One should note that restructuring and performance (in terms of
efficiency) of an enterprise are closely linked: successful restructuring will
most likely result in better performance of an enterprise. Therefore, to
investigate the impact of different policies on restructuring of an enterprise it
is worthwhile to look not only at restructuring measures, but also at
performance indicators.
Let us now concentrate on the existing literature that investigates
impact of different policies on restructuring and efficiency of enterprises in
transition.
According to standard economic theory, competition forces firms to
produce at the point where prices are equated to marginal cost and, therefore,
where firms earn zero profits in long run and where production (as well as
consumption) is efficient. The positive influence of competition can be
expanded into productive efficiency: tight competitive pressure tends to
discipline firms by exerting a pressure on managers to cut costs and to reduce
slack. Allowing for comparison relative to other firms competition stimulates
managers to work hard to get higher rewards, which in turn improves
performance of the firm. Besides, in the period of uncertainty competition
reveals more investment opportunities and gives more information on quality
of managers. In the long run only most efficient firms survive in competitive
environment.
In an open economy international competition is a significant factor
in determining market power. Consider the case of a domestic monopoly.
Once the economy is open, this monopoly faces competition from foreign
firms either in the form of imports or actual entry into the market of the firms
themselves. In either case, the outcome is more competition on domestic
market. Import competition may be especially effective in Ukraine due to the
1 Definitions of different types of restructuring are based on the works of Commander et al., 1999,
Akimova and Schwödiauer, 1999, and Blanchard, 1997.
5
substantial quality deficit of most goods in Soviet times. Brown and Earle,
2000, provide strong evidence that import competition has positive significant
effect on total factor productivity of Russian firms.
According to Commander et al. (1999) there exist several ways in
which competitive pressure affects restructuring. Firstly, through price and
profit signaling firms ensure to undertake appropriate restructuring measures.
Secondly, closure of bad governed firms and emergence of innovation induce
managerial incentives to restructure.
Therefore, one might assume that in transition period competition
will lead to increased productivity and more restructuring activity. However,
empirical evidence is rather mixed on this point. Studies of enterprise
restructuring in Bulgaria (Konings, 1998), Mongolia (Anderson et al., 1999),
Russia (Earle and Estrin, 1998, Brown and Earle, 2000), Poland (Grosfeld and
Tressel, 2001) reveal significant positive effect of competitive pressure on
firms’ efficiency and performance indicators. Moreover, Anderson et al.
(1999) find out that competition is the most efficient disciplinary device. On
the other hand, Grigorian, 2000, finds “no clear evidence of market
competition … on performance indicators in the sort-run”. Similar results
were found for Estonian firms (Konings, 1998).
In studies on Ukraine, results on impact of competition are not
homogeneous: Warzynski, 2000, find no straightforward link between
competition and performance, while Akimova and Schwödiauer, 1999,
discovered positive impact of competition on performance and of foreign
competition on restructuring.
Let us now turn to the question of relative efficiency of state-owned
and private enterprises. Private enterprises are generally believed to perform
better that their state-owned counterparts since the main goal of the former is
economic performance, while the latter should follow social targets of the
6

government. Moreover, it is harder to evaluate managerial performance and
more difficult to enforce corporate governance on state-owned firms.
Early studies concluded that privatization results in little restructuring.
For instance Carlin et al. (1994) found that for a sample of enterprises in
Poland, Hungary, Czech Republic, Slovakia and Russia “there is little evidence
that privatized enterprises were more likely to restructure than state-owned
enterprises”. Estrin, 1997, notes that though “initial studies have found little
evidence that privatized firms behave differently to their state-owned
counterparts, it is still too early to make some conclusions”. Indeed, since the
effects of privatization have appeared only several years after its start, we see
quite different findings in more recent literature. Different studies on
enterprise restructuring in transition countries prove the hypothesis that
privatized enterprises tend to perform better than the state-owned ones:
Djankov and Pohl (1997) for Slovak firms; Carlin and Lendesmann (1997);
Grosfeld and Nivet (1997) for Polish firms; Earle and Estrin (1997) and
Brown and Earl (2000) for Russian firms; Grigorian (2000) for Lithuanian
enterprises. Djankov (1999) found non-linear significant relationship between
different types of owners and enterprise restructuring for enterprises in
Georgia, Kazakhstan, the Kyrgyz Republic, Moldova, Russia and Ukraine.
Nevertheless, Anderson et al. (1999) in their study of Mongolian enterprises
reached the conclusion that enterprises with state ownership perform better
than firms with other owners. This striking difference in the results could be
explained by the advances in country’s transition: Mongolia lags far behind
other transition countries, and thus the effect of privatization has not been
revealed yet. Another possible explanation is a difference in privatization
programs.
For Ukrainian enterprises, Akimova and Schwödiauer, 1999, find
significant impact of private ownership variable on performance, whereas
Warzynski, 2000, states that enterprise performance is positively associated
7
only with certain ownership types (foreign owners and banks). Finally, Estrin
and Rosevear, 1999, find no relation between ownership and performance.
Soft budget constraints turned out to be another important factor in
influencing restructuring and performance. They lead to “the lack of
productivity improvements and continuation of unprofitable production
activities” (Djankov and Murrel, 2000a). Soft budgets allow managers to think
that government would subsidize their enterprises whatever the performance
they show. Therefore, tightening of constraints should encourage firms to cut
costs allowing efficiency to increase.
Earle and Estrin, 1997, pointed out on the significance of eliminating
soft financial discipline, since it slackens the pace of restructuring even at
private enterprises. Further studies verify the general tendency that subsidies
and other forms of government support of enterprises contribute negatively
to performance indicators (Konings, 1998; Grigorian, 2000). Konings, 1998,
finds that hard budgets do not play any role in affecting firm performance in
Estonia, more advanced transition country, and concludes that this factor
matters on early stages of transition, when financial discipline is only in the
process of implementation or has been implemented recently. Reviewing
most empirical studies on this topic Djankov and Murrel, 2000a, estimated
that tightening of budget constraints has more significant effect on total
factor productivity and labor productivity growth in non-CIS countries, which
are more advanced in transition process, rather than in CIS countries, where
transition is very slow.
However, tightening of financial discipline could entail negative
outcomes as well. Coricelli and Djankov, 2001, concluded that hard budgets
induced passive restructuring in Romanian enterprises, but not an active one,
which they measured as new investments. They argued that “tightening of
bank credit may raise enterprise efficiency in the short run, but at the cost of
curtailing investments”. In addition, firms with financial constraints may not
8

be able to pay in time or may be forced to pay lower prices for suppliers. This
could lead to delays in delivery or even loss of suppliers, which, in turn,
results in lost efficiency (Blanchard and Kremer, 1997).
For Ukrainian enterprises, Akimova and Schwödiauer, 1999,
discovered hard budgets to be one of the driving forces in enhancing
restructuring.
Let us now turn to the question of complementarity and
substitutability between competitive pressure, privatization and budget
constraints. These factors are most likely to be more important in the
transition context (Earle and Estrin, 1998). In developed Western countries,
where most firms are privatized, operate in competitive environments and are
independent from the government, the general environment is such that it
exerts a disciplinary pressure even on firms not characterized by any of these
features. However, in transition one can compare performance of, say,
subsidized, state-owned enterprises with the performance of privatized,
competitive firms and make inferences about relative efficiency and necessary
measures to mitigate the lag, if any. One could find that competition
disciplines only privatized firms, or that monopolized enterprises behave
differently depending on the ownership type. And it is possible that neither
privatization nor competition will have any effect on performance and
restructuring if budget constraints remain to be soft.
Some authors, e.g. Grosfeld and Tressel, 2001, believe that
competition and ownership structure should have not only separate effects on
performance of enterprises in transition, but influence the latter in
interrelationship with each other. A substitution effect between them means
that in the absence of good corporate governance competition may play
disciplinary role and, as a result, influence increases in productivity and cutting
costs; or in the situation of good corporate governance, competitive pressure
play minor role. A complementary effect, however, means that “effectiveness
9

of corporate governance would be enhanced by market competition and vice-
versa” (Grosfeld and Tressel, 2001).
Yet, there is little empirical evidence in this field and existing results
do not point to any definite tendency. One of the early works examining
interaction effects is Earle and Estrin, 1998. They find a complementarity
relationship between privatization and competition, as well as between
competition and budget constraints, while privatization and hard budgets
turned out to be substitutes.
Later, Commander et al., 1999, support the previous finding. They
find that changes in ownership structure without adequate changes in product
market competition can result in long-term negative effects (i.e.
complementarity relationship). However, they also find that competitive
environment substitutes tight financial discipline, which they explain by two
reasons: first, more competition enhances cost-reduction incentives of the
firms and, second, competitive pressure improves corporate control by
driving managers to profit maximization.
Grosfeld and Tressel, 2001, found that for the sample of Polish
enterprises listed on Warsaw stock exchange competition and privatization
tend to complement each other rather than substitute; that is competitive
pressure acts more effectively on enterprises with ‘good’ corporate
governance. This means that competition or privatization policy alone may
not be successful in improving the efficiency of enterprises.
Brown and Earle, 2001a, also point out on the importance of
“substitutability or complementarity of market competition and private
ownership” when choosing policy strategy. They construct a model where
privatization enhances competition in the product market, which in turn
stimulates firms to improve their efficiency. Econometric analysis, which was
based on a dataset of Russian medium- and large-sized industrial enterprises,
10

reveals that there exist strong complementarity relationship between market
competition and private ownership.
Summing up this review, we should point out that competitive
pressure, privatization and hard budget constraints are found to be the main
determinants of enhancing enterprise efficiency and restructuring. Still, there
are deviations from this result, which are mainly explained by peculiarities of
the country in question. Moreover, there exists strong evidence of
complementarity between private ownership and competition. The purpose
of the research is to find whether the above-mentioned tendencies are true for
Ukraine or whether there are some other, unforeseen relations.
11

C h a p t e r 3
AGENTS AND INSTITUTIONS
This chapter is devoted to the description of major agents and institutions
that are relevant in the light of this paper.
Agents
Main agents in this thesis are large Ukrainian enterprises from all
over the Ukraine, mainly from Kiev, Lviv, Sumy and Kharkiv. The criteria
for choosing the firm in the sample were as follows: it should be and
industrial enterprise with the labor force more than 250 employees. The
sample presents the enterprises of different forms of ownership: joint stock
companies, state enterprises, collective enterprises, holding companies and
other. Great part of the firms is privatized (see appendix 3).
Ukrainian enterprisers are not the only actors in the thesis. Another
actor is the Ukrainian government, which sets the policies determining further
development of industries. Other actors are firms (not necessarily from
Ukraine) that act as competitors of the given enterprises. They are present in
the paper implicitly: these firms are not necessarily in the sample, but they are
taken into account when calculating different indices of competitive pressure.
Institutions
Competition. Competition policy in Ukraine started its development
in 1991 and since that time there has been created a proper legislative
framework. Its main principles are stated in the Constitution of Ukraine, the
Law # 2210-3 “On the protection of economic competition”, the Law # 236/96
“On the protection from unfair competition”, and the Law # 1682-3 “On
natural monopolies”. It is worth to note that Ukrainian government stuck
12

to the international standards of competition law when developing the
above-mentioned laws.
In addition to the laws there are now in action around 25
competition-related normative documents like “State program of de-
monopolization of the economy and competition development”, “Major targets of
competition policy in 1999-2000 and measures of its implementation” etc.
However, the existence of such great number of regulatory procedures
does not necessarily mean their proper implementation.
The state body, which controls execution of antimonopoly
legislation, is Antimonopoly Committee of Ukraine (AMC). Among
major functions of AMC, which are defined in the Law #3629-12 “On
the Antimonopoly Committee of Ukraine” are prevention, detection and
elimination of violations of antimonopoly legislation, control over
market concentration, and encouragement of the development of fair
competition. The major problem of the antitrust regulatory body is its
under-financing. This limitation could not ensure proper functioning of
such widely distributed agency as AMC (it has 27 territorial divisions).
Moreover, in accordance to the Law “On natural monopolies”, there could
be created national commissions on regulation of natural monopolies.
Presence of multiple regulatory authorities at local and regional levels
makes monitoring and control over execution of antitrust legislation
inefficient.
To sum up, at present time there exist good legislative
background for the development of competition policy in Ukraine. The
laws are designed to protect competition on domestic markets, to
control merger activities, and to prevent practices of unfair
competition. However, regulatory authorities are not functioning
properly. Enforcement of competition laws could not be called
“satisfactory”. Enterprises could still get unfair competitive advantage.
13

Usually state enterprises, and especially monopolized ones, have more
opportunities to receive aid from government, either explicit or implicit
– in form of subsidies or state order. Clearly, this creates more
favorable conditions for them comparing to other enterprises.
Privatization. In 1991 Ukrainian Parliament (Verchovna Rada)
approved the “Concept for De-statization and Privatization of State Enterprises, Land
and Housing”, where major principles of the privatization process were
declared. In 1992 main privatization laws were adopted: “On privatization of
Property of Large Enterprises”, “On Privatization of Small State Enterprises” and “On
Privatization Certificates”. June 1992, when the first privatization program has
been adopted, can be considered as the starting point in the Ukrainian
privatization.
In 2000 President of Ukraine issued a decree on “Measures for
accelerating Privatization of Property in Ukraine”, which plans privatization of
Ukrainian companies for the years 2000-2002. This decree specified new
priorities and goals of privatization policy in Ukraine. In particular, the goal of
finding new owners for state enterprises has expanded into one of finding
“more effective” owners, who will be able and willing to invest in an
enterprise and to improve its current business operation. Another new aspect
of privatization policy, which had been announced in this decree, was a
strategy to accelerate privatization by selling state shares in large packets via
tenders to “strategic” investors, i.e. large industrial corporations with good
knowledge of the industry where a given company operate. Other principles
of the degree include reducing state control over enterprises and improving
corporate management.
Tight financial discipline. Hardness of budget constraints faced by
enterprises is most often associated with the subsidization, tax arrears and
bankruptcy procedures. In June 1999 Ukrainian Parliament adopted new
14

bankruptcy law2. Compared to previous bankruptcy procedure, which was
enacted in 1992, present law has been improved significantly. It specifies the
steps of bankruptcy process, identifies the categories of agents that might
initiate bankruptcy procedure, sets the minimum debt that may serve as a
minimum for bankruptcy, and identifies the rights of parties to an arbitration
hearing. The efficiency of the present law can be characterized by its
flexibility: there exist several different paths for an enterprise to follow during
the restructuring of its debts.
Description of Restructuring Process in Ukraine
Ukrainian privatization process can be divided into the three stages:
“the initial period of legitimate privatization (1992-95), the mass privatization
(1995-98), and the money-driven, predominantly industrial, privatization
period (1999-now)” (Voronkova, 2000).
Unfortunately, Ukraine was not able to ensure fast and efficient
reforms. First privatization program was not adopted as a law, and small-scale
privatization was blocked. As a result, only 1% of enterprises3 subject to
privatization were privatized in 1992. In the whole period from 1992 to 1994,
1240 medium and large enterprises has been privatized4. At that time,
domestic and foreign investors were not involved in privatization.
At the mass privatization stage, rates of privatization have increased
on average 4.2 times compared to the previous period. (Voronkova, 2000).
There have been privatized 9,504 medium and large enterprises5.
2 “The Law on Restoring the Solvency of the Debtor or Declaring It Debtor”.
3 Voronkova, 2000
4 IMF Staff Country Report, 1999. Ukraine: Recent economic development. #99/42
5 IMF Staff Country Report, 1999. Ukraine: Recent economic development. #99/42
15

The third state of privatization program started in 1999. This is a stage
of money-driven privatization, which should facilitate transparency of
privatization and reduce below market selling prices (Voronkova, 2000).
In general, the share of private enterprises in GDP has increased
significantly during the period 1991 – 2000: private sector’s output comprised
only 10% of GDP in 1991, while in 1997-2000 this share has increased up to
60% level6.
With regard to what has been done in competition policy, one should
note that the progress was made in establishing independent antitrust
regulatory authorities, breaking up some monopolies, separating out the
natural monopolies from other activities in order to improve competition
(IMF, 1999). However, there still exist unfair competition on domestic
markets. According to the survey of 2200 Ukrainian firms, which was
conducted by International Financial Corporation in 2000, the major cause of
unfair competition for the producers is the existence of shadow economy.
Other obstacles are the system of tax concessions, privileges to some firms to
entry certain markets or to access credit resources.
The development of enterprises in present times is limited due to the
number of factors, most important of which are difficulties to attract capital
for investment, failure of bankruptcy laws enforcement and weak financial
discipline. According to EBRD transition report (2001), governance and
restructuring of Ukrainian enterprises has the mark ‘2’ on 1-4 scale, which
corresponds to the moderately tight financial discipline, weak enforcement of
bankruptcy laws and little actions with respect to strengthening of
competition and corporate governance.
6 EBRD Transition report, 2001. p 208.
16

C h a p t e r 4
EMPIRICS
This chapter is devoted to the empirical part of the work. First we will
present description of the data used. Then models’ specification will be
described. Obtained empirical results conclude the section.
Data
The dataset used in this research is provided by the Institute for
Economic Research and Policy Consulting at German Advisory Group in
Ukraine. It consists of 2 parts. The first part contains qualitative indicators for
each enterprise. These indicators were constructed on the basis of the survey7
of 210 large industrial enterprises from all over the Ukraine, mainly from
Kiev, Kharkiv, Sumy, and Lviv (the survey was conducted in the summer-fall
2001 under the supervision of the above-mentioned Institute). In the process
of the survey, in-depth interviews with the representative of top management,
such as president, vice-president on economics or finance, chief accountant,
or chief economist were conducted in each enterprise. However, in the
process of estimation the sample was reduced to 177 enterprises, since some
firms have not reported answers on many important questions and these
observations were dropped.
The second part of the dataset contains information from the balance
sheets of the sample enterprises for the years 1998 - 2000. Using this
information we were able to construct quantitative indicators for each
enterprise. In particular, we needed information on sales, number of
employees, and wear and tear of capital.
7 Survey questions used for construction of the variables are listed in the appendix 4.
17

The characteristics of the sample are presented in the appendix 1.
Even though the quantitative indicators are available for the period of
three years, qualitative indicators, which are taken from the survey, cover only
a period of two years – 1998 and 2000. Moreover, many indicators, such as
ones of budget constraints and market shares, were available only for the year
2000. Therefore, in the regression analysis we will use cross-section data for
the year 2000 that covers 177 enterprises. Indicators for the year 1998 would
not be wasted, since most of them would be used as instruments for
endogenous variables or as control variables in the regressions.
Definition of the Variables
As we learned from the literature review, competitive forces should
positively influence restructuring and performance indicators of enterprises.
So should privatization and hardened budget constraints. Let us now
concentrate more closely on the variables that will appear in the model.
Two types of depended variables will be employed in the analysis.
First is performance indicator. Depending on the country in question and
available data, different authors use different indices. In developed market
setting one may use accounting profits, stock market prices and Tobin’s Q as
measures of firm performance. However, in the transition context these
indices are either unavailable (as in the case of stock market prices and
Tobin’s Q) or unreliable (accounting profits). Therefore, we should appeal to
other indicators that would adequately reflect transition reality. Most
commonly used indices corresponding to transition economies are level of
sales (Akimova and Schwödiauer, 1999) and export (Grigorian, 2000), labor
productivity (Earle and Estrin, 1997, Akimova and Schwödiauer, 1999,
Pivovarsky, 2001), and total factor productivity (TFP) (Nickel, 1996, Brown
and Earle, 2001a). In the context of this work, it would be better to use
performance indicator that reflect efficiency of an enterprise rather than
profitability, since in competitive environment profits tend to decrease. For
18
data-driven reasons, we use labor productivity (measured as the sales per
employee) as a performance indicator, which reflects how efficiently
enterprises are operating.
Another type of dependent variable we will use is a measure of
restructuring activity. In this regard there are available different restructuring
indices depending on the depth of the problem analyzed. In our work we will
construct 4 restructuring dummies in order to follow the impact of different
types of restructuring separately. (Detailed explanation of how these dummies
were constructed is presented in the appendix 3). Therefore, other four
dependent variables, which we will employ in our analysis, are dummy for
overall restructuring activity, dummy for regressive restructuring and
dummies for hard and soft strategic restructuring.
Main independent variables that will appear in the model are
competition indices, ownership dummy and budget constraint indices. We
will use also interaction terms for competition, privatization and hard budget
constraints.
Usually competitive pressure is measured by concentration ratios or
Herfindahl-Hirschman index (e.g. in Brown and Earle, 2000). Unfortunately,
due to the data limitations these indices could not be constructed and,
therefore, we will rely on indicators, based on the managers’ responses on the
survey questions about market share of the main products of an enterprise
and degree of competition from the side of Ukrainian and foreign producers.
Thus, competitive pressure will be measured by the following indices:
o MSHAREi represents the market share of the main product of i-th
enterprise. It varies from 1 to 5, where 1 stands for the market share
>40%, 2 – 31-40%, 3 – 21-30%, 4 – 11-20%, 5 – <10%.
o Indices CP_UKR00i and CP_FOREIGN00i show the tightness
of competitive pressure on the markets i-th firm operate from
19
the side of domestic and foreign producers8 respectively in
2000. They are measured on 0-5 scale (0 - do not operate on
this market, 1 - no competitive pressure, 5 - very tight).
One may argue that these indicators might be biased because they
reflect managers’ subjective beliefs. That is why we use different measures of
competition parallel. In the first index, subjective bias should be very small,
because usually managers of an enterprise are very much aware of the
approximate share of their enterprise in the market. Other two indices, which
measure degree of competition from Ukrainian and foreign producers, could
be biased because managers may subjectively value tightness of competitive
pressure from the side of some rival firms or countries. However, we could
not exclude these indices from the set of the variables used in the regression
analysis, since we are interested in the relative importance of foreign
competition as a disciplinary device.
The effect of ownership structure of each enterprise is captured in the
dummy PRIV00i, which is equal to 1 if more than 50% of i-th enterprise’s
equity capital is concentrated in private hands, and equal to 0 if 100% of i-th
enterprise’s equity capital is held by state or it is partly privatized with at least
50% of shares in state ownership.
Budget constraints are measured by an index of hard budget
constraints, HBINDEXi. It is constructed using the following set of
dummies, which were derived from the managers’ answers on the survey
questions:
o StSubsi = 1 if a manager reported that the enterprise had received
subsidies during the last three years; =0 if not.
8 Under foreign producers we mean the producers from “far abroad”, i.e. excluding CIS countries.
20

o TaxExempti = 1 if a manager reported that the enterprise had been
exempted from tax arrears or permitted to postpone tax payments in
the last three years; = 0 if not, or if there were no tax arrears on the
enterprise.
o CrExepmti = 1 if a manager reported that the enterprise had
obtained a permission for a delay in credit payments in the last three
years; = 0 if not.
The three dummies above, which measure softness of budget
constraints (since for all four dummies 1 means soft budget constraints), do
not have bias that could arise from the subjectivity of managers’ answers. The
questions were well-defined and clear-cut, as well as the answers: managers
usually know whether the enterprise has received any kind of subsidy from
state or not, and answered the questions respectively, i.e. “yes” or “no”.
To get an overall index of hard budget constraints we calculate the
average of the above three dummies and subtract it from 1:
HBINDEXi = 1 - (StSubsi + TaxExempti + CrExepmti)/3
This index ranges from 0 to 1, where 0 shows that i-th
enterprise has received some support from state or banks during the
last three years, which corresponds to soft budget constraints on
enterprise, and 1 means that i-th enterprise faces tight financial
discipline.
In order to account for differences in performance that are not caused
by ownership structure, competition or budget constraints we will also
introduce control variables into our model:
o Industry and region dummies, which correspond to an
industry, in which an enterprise is operating, and to a region,
21

where an enterprise is located, respectively. They are used in
order to capture the effects of regional peculiarities and growth
opportunities of particular industries.
o FINPOS98i is an index, which was also constructed on the
basis of the survey question and which captures the differences
in the financial position of enterprises in 1998. This is an
interval variable with the range from 1 to 5 (1 – much worse
compared to other enterprises in the industry, 3 – average, 5 –
much better). Even though this variable could be biased we
could not through it away because of its importance and
because of our inability to measure it in any other way.
o LABOR00i stands for the number of employees on i-th
enterprise in 2000 and it captures differences between
enterprises due to their sizes.
o AMORT00i shows the level of wear and tear of the capital on
i-th enterprise. Though this variable may have no effect on
restructuring, it could be very important in determining
enterprise efficiency – obviously, labor productivity will be
higher, ceteris paribus, on an enterprise with better (modern)
equipment rather than with out-of-dated one.
Specification of the Models
We will test two hypotheses in our research. Under the first, increased
competitive pressure, change of ownership structure from state to private and
hardening of budget constraints positively influence performance indicators
and restructuring activity of large industrial enterprises in Ukraine. Secondly,
we will investigate whether these policy variables are complements or
substitutes in their effect on performance and restructuring.
22

To see whether competition, ownership change and hardening of
budget constraints separately influence restructuring and performance of an
enterprise we will first estimate the following models:
P=P(own, comp, hbc, controls), (1)
R=R(own, comp, hbc, controls), (2)
where P stands for performance indicator (labor productivity in our case) and
R – for restructuring indicator (index of overall restructuring activity, index of
regressive restructuring, and indices of hard and soft strategic restructuring);
own represents an ownership dummy; comp – a competition index; hbc – an
index of hard budget constraints; and controls stands for other variables that
influence performance and restructuring.
Since we have two kinds of competition variables, we will use them
parallel in the analysis. This would help us to distinguish between two effects:
an effect of an overall competitive pressure on a firm and an effect of
competitive pressure from the side of two types of producers - domestic and
foreign. The question about the impact of foreign competition on domestic
producers is controversial. On the one hand, foreign competition may act as
an independent disciplinary device in improving firm’s efficiency, but on the
other hand it may have no separate effect and influence efficiency of domestic
firms jointly with domestic competition.
We will employ different kinds of control variables in different
specifications. Some factors, like regional and industrial discrepancies, have an
influence on both efficiency and restructuring. However, other factors do not
necessarily have to be equally important. In the specification with the labor
productivity as a dependent variable we will use the following controls:
regional and industrial dummies, size of an enterprise (LABOR00), lagged
value of labor productivity (logLPROD98), and the level of wear and tear of
firm’s equipment (AMORT00). Test for omitted variables empirically proved
23
a relevance of the above-mentioned controls. However, it seems that other
factors should determine incentive of an enterprise to restructure. What
seems to be more relevant and significant is financial position of an enterprise
before 2000, which we captured in the variable FINPOS98. Of course, one
could think of wider range of factors that could influence efficiency or
restructuring activity, however, our data sample limits us to use the above-
mentioned indicators.
To test the second hypothesis of complementarity and substitutability
of the three policies we need to introduce interaction terms. Therefore, we
will estimate following models:
P=P(own, comp, hbc, Compi* Owni , Compi* HBCi , Owni* HBCi , (3) controls), R=R(own, comp, hbc, Compi * Owni , Compi * HBCi , Owni * HBCi , (4) controls),
where P, R, own, comp, hbc, and controls denote the same variables as in
the models (1) and (2). Compi * Owni, Compi * HBCi, and Owni * HBCi
stand for interaction terms between competition and ownership,
competition and budget constraints, and ownership and hard budget
constraints. They are measured by the following variables: Compi *
Owni is measured by MSHARE*PRIV00, CP_UKR00*PRIV00 and
CP_FOREIGN00*PRIV00; Compi * HBCi – by MSHARE*HBINDEX,
CP_UKR00*HBINDEX and CP_FOREIGN00*HBINDEX; Owni *
HBCi – by PRIV00*HBINDEX.
Before we define the method of estimation of our models let us
concentrate on some econometric problems that could arise in the process of
estimation. First, there is a possibility of endogeneity of independent variables
with respect to the firm performance. Endogeneity of market structure was
first suggested by Demzetz in his “efficient market structure hypothesis”,
24
1973, which stated that market concentration rises as a result of growth of
more efficient firms. Ownership structure may also be endogenous, since
better performing enterprises are more likely to be privatized. To avoid this
problem one should use instruments, which are highly correlated with the
endogenous variable in question and not correlated with an error term.
Lagged values of market concentration can serve as an instrument, though
some authors suggest that more appropriate instrument may be competition
index in the period prior to transition, when market structure was determined
by central planners and was purely exogenous to profitability (Brown and
Brown, 2001; Brown and Earle, 2000, 2001a, 2001b). Unfortunately we are
not able to construct competition index for the distant past and thus we will
use the measures of tightness of competitive pressure for the year 1998
(CP_UKR98 and CP_FOREIGN98), which are available from the survey. To
handle problem of endogeneity of ownership structure, we choose ownership
measure with the lag 2 years (PRIV98) as an instrument.
Another econometric problem that can arise is multicollinearity of
regressors. However, examination of matrix of correlation coefficients
between independent variables shows that neither variable is correlated with
another, except that variables with lagged values are highly correlated with
their current values (which just proves correct choice of instruments).
Finally, heteroskedasticity of the error term is possible since
enterprises are heterogeneous, so there could be some specific factors that
affect performance and restructuring activity of each enterprise non-
uniformly. This means that variance of the error terms may have the
functional form as follows: var(εi) = σ g(Xi), where Xi is a vector of enterprise
characteristics. Formal econometric tests proved the existence of
heteroskedasticity of residuals, which may cause inconsistency of the
estimated coefficients. Therefore, to get consistent estimates we will use the
Huber/White/Sandwich estimator of variance, which is computed
automatically by Stata7.0 software.
25

Taking into account econometric problems specified above we
suggest following methods for estimation of our models.
Since we have two types of dependent variables and since one is a
continuous variable (logLPROD00) and the other are discrete variables
(restructuring dummies), estimation techniques for these two kinds of
regression will be different. For the models (1) and (3) Hausman test reported
that there indeed exists endogeneity of regressors. Hence, we will apply a two-
stage least squares (instrumental variables) technique with robust standard
errors. In the models (2) and (4) dependent variable is a dummy; therefore, we
will applying probit model with robust standard errors. Tests of the probit
regressions showed that error terms are distributed normally.
Results9
Let’s first explore the empirical results for the first hypothesis
that privatization, increased competition and hardening of budget
constraints positively influence restructuring and performance of large
Ukrainian enterprises10.
As we can see, increased competitive pressure in general has
negative and insignificant effect on labor productivity, while the
competition from the side of foreign producers is positive and
significant. The significance of this coefficient points out on the
importance of imports as a disciplinary device for domestic
enterprises.
In the case of restructuring, we cannot unambiguously evaluate
the impact of competition: overall competitive pressure, measured as
9 Note: the regression outputs are reported in the appendices 5 – 8. Each type of equation was estimated
with alternative competition measures. Specifications are numbered according to the hypothesis tested, a dependent variable and a measure of competitive pressure used. For instance, specification 2.3.1 means that we are testing 2nd hypothesis, dependent variable is RESTRSOFT00, and competitive pressure is measured by CP_UKR00 and CP_FOREIGN00.
10 Regression outputs are presented in the appendices 5 and 6.
26
MSHARE, is insignificant and has different signs in different
specifications. However, domestic competition positively influences
all types of restructuring activities. Moreover, in regressions with
overall and regressive restructuring as dependent variables, this
coefficient becomes significant. Foreign competition seems to have
positive and significant effect only on inducing overall restructuring
activity.
Privatization has a positive influence on performance, and in
one specification this coefficient is significant. However,
privatization’s effect on restructuring activity is negative and
insignificant. This could mean that state-owned enterprises tend to
undertake more restructuring than privatized ones. It is most likely
that insignificance of this variable is caused by the small sample size,
and increasing the latter could bring up the significance and, perhaps,
change the size of the coefficients.
The hard budget constraint variable has a positive, though
insignificant, impact on performance. A similar result is observed for
strategic restructuring (both soft and hard). However, in case of
regressive restructuring hard budgets seem to have negative effect.
This negative impact overweighs the positive one on strategic
restructuring, resulting in a negative (though insignificant) influence
on overall restructuring activity.
Summing up the results on the first hypothesis, one notes that
privatization and hard budget constraints positively influence labor
productivity, which is consistent with the findings in the previous
researches. The effect of competition on performance is insignificant.
However, subdividing competitive pressure on the one from the side
of Ukrainian and foreign producers, we see that the latter have a
27

positive and significant effect on labor productivity of domestic
enterprises.
Let us now consider the evidence on the second hypothesis
about complementarity and substitutability between competition,
privatization and hard budgets11. A positive sign of the coefficient at
interaction term indicates a complementary relationship between two
variables, while a negative sign indicates a substitutability relationship.
The results from the regression with the labor productivity as
dependent variable point on no clear interrelationship between
privatization and competition, and between competition and hard
budget constrains. However, coefficient at interaction term
PRIV00*HBINDEX is statistically significant and negative, indicating
on the possible existence of substitutability relationship between
privatization and hard budget constraints. This means that private
ownership can substitute tight financial discipline in its effect on labor
productivity, i.e. private enterprise, even if it has soft budget
constraints, have enough incentives to stimulate labor productivity
growth and improve their performance. Similarly, if placing state
enterprises into tight budget constraints should induce them to
improve their performance.
Let us now turn to the regressions with restructuring dummies
as dependent variables. We observe a clear tendency for privatization
and competition to complement each other in their effect on all types
of restructuring: the respective coefficients in all specifications are
positive, and in regressions with overall restructuring and regressive
restructuring these coefficients are significant. This complementarity
effect means that competitive pressure acts more effectively on
privatized enterprises rather than on state-owned ones, and thus is
11 Regression outputs are presented in appendices 7 and 8.
28

more successful in inducing restructuring. On the other hand,
privatizing enterprises that operate in monopolized markets, or
exerting high competitive pressure on state enterprises would have
smaller (or even negative) effect on restructuring.
One also observes an existence of another strong
complementarity relationship – the one between competition and hard
budget constraints. In the regressions with overall restructuring
activity and hard strategic restructuring the coefficients at
MSHARE*HBINDEX are not only positive but also significant. This
means that competition has stronger effect on an enterprise
restructuring if the enterprise faces hard budget constraints.
The last interaction term we should consider is
PRIV00*HBINDEX, which points on interaction between
privatization and hard budgets. As one can see, it is insignificant in
three regressions. However, in specifications with regressive
restructuring, the coefficients at this interactive term are positive and
highly significant, which means that privatization and hard budget
constraints are complements in their effect on regressive restructuring
of an enterprise. The intuitive explanation behind this result is as
follows: in order to induce regressive restructuring, enterprises have
not only to be privatized but also have to face tight financial
discipline. Otherwise, say, if enterprise is private but has soft budget
constraints, managers will not have enough incentives to start
regressive restructuring. As we know, regressive restructuring is the
most painful type of the restructuring since it requires firing
redundant labor. Thus, managers should have sound reasons, such as
change of ownership together with elimination of state support, to
start regressive restructuring.
29

To sum up the empirical results on the second hypothesis, we
should note that there exists strong evidence in support of the
complementarity between privatization, competition and hard budget
constraints in their effect on different types of restructuring. In the
labor productivity regressions we found only one significant
interrelationship between policy variables: privatization and hard
budget constraints turned out to be substitutes in improving efficiency
of an enterprise.
Limitations of the Research and Suggestions for Further
Work
Unfortunately there exist some limitations of the present
research that we should mention. And here we will also discuss the
possible ways to improve this work.
First, and most important limitation is the small sample size.
Therefore, in the future works it should be increased.
Secondly, it would be worthwhile to include in the model
other, more formal measures of the competition, such as
concentration ratios or Herfindahl-Hirschman index. Since the survey
indicators we are using here are rather objective, we expect
regressions with new variables on competition to give approximately
the same results. However, if the results differ, this will indicate on
possible drawbacks in the survey data.
Next, we would like to consider several types of private
ownership: concentrated and non-concentrated, outsider and insider
owned. According the existing literature, different types of owners
have different incentives, and therefore, their impact on performance
and restructuring activity will be uneven. For example, Akimova and
Schwödiauer, 2000, found that performance of privatised enterprises is
30

significantly improved by concentrated outsider ownership. Aghion and
Blanchard, 1998, discovered that concentrated outsider ownership stimulates
more restructuring, especially strategic one, than the insider ownership.
It would be also worthwhile to investigate dynamic impact of
ownership, competition and hard budget constraints on performance and
restructuring by using time series data.
31

C h a p t e r 5
CONCLUTIONS AND POLICY IMPLICATIONS
In conclusion we should say that private ownership, foreign
competition and hardening of budget constraints appear to have positive
influence on efficiency of large Ukrainian enterprises. It seems also that both
domestic and foreign competition has positive impact on restructuring, and
hard budgets has positive effect on strategic restructuring.
In regard to interactive effects, we discovered that in case of
enterprise restructuring there exist strong complementarity relationship
between competition and privatization, and competition and hard budget
constraints. Privatization and hard budget constraints turned out to be
complements in their effect on regressive restructuring, while they are
substitutes in affecting performance.
We would like to note that our results are based on the measures of
competition, which are not perfect. However, the fact that we obtained
similar results in different specifications in almost all regressions suggests that
they are robust.
Our findings reveal a crucial point that the effect of one policy
variable depends on another two. That is, in order to pursue active
restructuring activity on enterprises it is not enough to make them privately
owned. Privatization would have stronger effect on restructuring if these
enterprises are placed into more competitive environment and have tight
financial discipline.
Therefore, the policy advice that emerges from this research is as
follows: Ukrainian government should continue to foster privatization
32

process so that to complete privatization of state-owned enterprises and
partially privatized ones. At the same time, competition policy should be
strengthened by improving enforcement of the current law, and soft budget
constraints should be eliminated. First of all this concerns state-owned
enterprises, especially monopolized ones, which have more opportunities to
receive state support. All these measures should be done simultaneously in
order to stimulate more restructuring on Ukrainian enterprises.
33

BIBLIOGRAPHY
Aghion, Philippe and Olivier Blanchard. 1998. On Privatization Methods in Eastern Europe and Their Implications. Economics of Transition, Vol 6, # 1, pp.87-99.
Akimova, Iryna, and Alexander
Scherbakov. 2001. Competition policy in Ukraine. Draft. Institute for Economic Research and Policy Consulting.
Akimova, Irina, Gerhard
Schwödiauer. 1999. Restructuring of Ukrainian Enterprises after Privatization: Does Ownership Structure Matter? Discussion Paper.
Akimova, Irina, Gerhard
Schwödiauer. 2000. The Impact of Ownership Concentration on the Performance of Privatized Ukrainian Enterprises. Discussion Paper.
Anderson, James H., Young Lee,
Peter Murrel. 1999. Do Competition and Ownership Affect Enterprise Efficiency in the Absence of Market Institutions? Evidence after Privatization in Mongolia. IRIS Center, University of Maryland.
Andreyeva, Tatiana. 1999.
Privatization, Ownership Structure and Company Performance: Case of Ukraine. EERC MA Thesis.
Antimonopoly Committee’s Reports, 1994-2000
Bevan, Alan A., Saul Estrin, and
Mark E. Schaffer. 1999. Determinants of Enterprise Performance during Transition. CERT DP # 99/03.
Blanchard, Oliver. 1997. The
Economics of Post-Communist Transition. Clarendon Press. Oxford.
Blanchard, Oliver and M. Kremer,
1997. Disorganization. Quarterly Journal of Economics.
Bornstein, Morris. 2000. Post-
Privatization Enterprise Restructuring. Working Paper # 327.
Brown, Annette N., J. David
Brown. 2001. Does market structure matter? New evidence using exogenous market structure. SITE Working Paper #130.
Brown, David J., John Earle. 2000.
Competition and firm performance: Lessons from Russia. SITE Working Paper #154.
______ , ______. 2001a.
Privatization, Competition and Reform Strategies: Theory and Evidence from Russian Enterprise Panel Data. SITE Working Paper #159.
34

______ , ______. 2001b. Competition-Enhancing Policies and Infrastructure: Evidence from Russia. SITE Working Paper #161.
Carlin, Wendy, John van Reen,
Toby Wolfe. 1994. Enterprise Restructuring in Transition: An Analytical Survey of the Case Study Evidence from Central and Eastern Europe. European Bank for Reconstruction and Development, Working Paper #14.
Carlin, Wendy, Steven Fries, Mark
Schaffer, Paul Seabright. 2001. Competition and Enterprise Performance in Transition Economies: Evidence from Cross-Country Survey. CEPR Working Paper #376.
Carlin, Wendy, Michael
Landesmann. 1997. From Theory into Practice? Restructuring and Dynamism in Transition Economies. The William Davidson Institute Working Paper # 155.
Caves, Richard E. 1997. Industrial
organization and new findings on the turnover and mobility of firms. Harvard Institute of Economic Research, Discussion Paper # 1808.
Claessens, Stijn and Simeon
Djankov, Gerhard Pohl. 1997. Determinants of Performance of Manufacturing Firms in Seven European Transition Economies. The William Davidson Institute Working Paper # 74.
Commander, Simon and Mark Dutz, Nicolas Stern. 1999. Restructuring in Transition Economies: Ownership, Competition and Regulation. World Bank ABCDE Paper.
Coricelli, Fabrizio and Simeon
Djankov. 2001. Hardened budgets and enterprise restructuring: theory and an application to Romania. SEPR Discussion Paper #2950.
Demzetz, Harold. 1973. Industry
structure, Market Rivalry, and Public Policy. Journal of Law and Economics, XVI, 1-9.
Djankov, Simeon. 1999. Ownership
Structure and Enterprise Restructuring in Six Newly Independent States. Comparative Economic Studies, 41, 1: 75-95.
Djankov, Simeon and Peter Murrel.
2000a. Enterprise restructuring in transition: a quantitative survey. Draft.
_______ , _______ . 2000b. The
Determinants of Enterprise Restructuring in Transition: An Assessment of the Evidence. World Bank.
Djankov, Simeon, and Gerhard
Pohl. 1997. Restructuring of Large Firms in Slovakia. The William Davidson Institute Working Paper # 73.
D’Souza, Juliet, William Megginson,
and Robert Nash. 2001. Determinants Of Performance Improvements In Privatized
35
Firms: The Role Of Restructuring And Corporate Governance. Draft.
Dutz, Mark A., Steven Fries, Maria
Vagliasindi. 2000. Promoting Competition and Entrepreneurship in Russia. EBRD Conference on Post-Election Strategy, Moscow.
Dutz, Mark A., Aydin Hayri. Does
market intense competition lead to higher growth? World Bank research paper RPO-682-47
EBRD Transition Report, 2000,
2001. Earle, John S. and Saul Estrin. 1997.
Privatization vs. competition: changing enterprise behavior in Russia. The William Davidson Institute Working Paper # 70.
_______ , _______ . 1998.
Privatization, Competition and Budget Constrains: Disciplining Enterprises in Russia. Site WP # 128.
Ericson, Richard E. 1998.
Restructuring in transition: Conception and Measurement. Comparative Economic Studies, 40, #2, p.p. 103-108.
Estrin, Saul. 1997. Privatization in
Central and Eastern Europe. The William Davidson Institute Working Paper # 87.
Estrin, Saul, and Adam Rosevear.
1999. Enterprise Performance and Corporate Governance in Ukraine. Journal of
Comparative Economics 27(1999): 442-458.
Frydman, Roman, Cheryl Gray,
Marek Hessel, Andrzej Rapaczynski. 1999. When Does Privatization Work? The Impact of Private Ownership on Corporate Performance in the Transition Economies. Site Working Paper # 142.
Greene, William H. Econometric
Analysis. 4th edition Griffith, Rachel. 2001. Product
Market competition, efficiency and agency costs: an empirical analysis. Institute foe Fiscal Studies, WP 01/12.
Grigorian, David A. 2000.
Ownership and performance of Lithuania enterprises. World Bank Policy Research Working Paper 2343.
Grosfeld, Irena, Jean-François
Nivet. 1997. Firm’s heterogeneity in transition: Evidence from a Polish data set. The William Davidson Institute Working Paper # 47.
Grosfeld, Irena, Thierry Tressel.
2001. Competition and corporate governance: substitutes or complements? Evidence from the Warsaw Stock Exchange. Working Paper # 369.
Gujarati, Damodar N. Basic Econometrics. 3rd ed.
Heinrich, Ralph P. 2000.
Complementarities in Corporate Governance: Ownership
36
Concentration, Capital Structure, Monitoring and Pecuniary Incentives. Kiel Institute of World Economics, Working Paper #968.
Ivashchenko, Natalija, Iryna
Savchenko. 1997. Restructuring the Russian Economy: Problems and Tendencies. CERT Working Paper.
IMF, 1999. Ukraine: Recent
Economic Development. Staff Country Report #99/42
Johnston, Jack and John DiNardo.
Econometric methods. 4th edition. Kikeri, Sunita and John Nellis. 2001.
Privatization In Competitive Sectors: The Record So Far. World Bank.
Konings, Jozef. 1998. Firm
Performance in Bulgaria and Estonia: the effects of competitive pressure, financial pressure and disorganization. The William Davidson Institute WP Series # 185.
Kornai, János. 2000. Making the
Transition to Private Ownership. Finance and Development, XXXVII (September 2000), 12-13.
Linz, Susan, Gary Krueger. 1998.
Enterprise Restructuring in Russia’s Transition Economy: Formal and Informal Mechanisms. The William Davidson Institute Working Paper # 152.
Megginson, William and Jeffrey M. Netter. 2001. From State To Market: A Survey Of Empirical Studies On Privatization. Draft. Fothcoming in Journal of Economic Literature.
Moers, Luc. 2000. Determinants of
Enterprise Restructuring in Transition. Tinbergen Institute Discussion Paper TI 2000 - 026/2.
Murphy, Kevin M., Andrei Shleifer,
Robert W. Vishny. 1992. The Transition to a Market Economy: Pitfalls of Partial Reform. The Quarterly Journal of Economics.
Nickell, Stephen J. 1996.
Competition and Corporate Performance. Journal of Political Economy, 1996, vol. 104, no. 4, p.p. 724-746.
Nickell, Stephen J., Dalhne
Nicolitas. 1995. How Does Financial Pressure affects firms? Centre for Economic Performance Discussion Paper # 266.
Pivovarsky, Alexander. 2001. How
Does Privatization Work? Ownership Concentration and Enterprise Performance in Ukraine. IMF Working Paper WP/01/42.
Pohl, Grehard, Robert E.
Anderson, Stijin Claessens, and Simeon Djankov. Privatization and Restructuring in Central and Eastern Europe: Evidence and
37
Policy Options. World Bank Technical Paper #368.
Recanatini, Francesca, Scott J.
Wallsten, Lixin Colin Xu. Surveying Surveys and Questioning Questions: Learning From the World Bank Experience.
Sheshinski, Eytan and Luis Felipe
López-Calva. 1998. Privatization and its Benefits: Theory and Evidence. Consulting Assistance on Economic Reform II project at HIID.
Shleifer, Andrei, and Robert W.
Vishny. 1996. A Survey of Corporate Governance. NBER Working Paper #5554.
Stiglitz, Joseph E. 1999. Whither
Reform? Ten Years of Transition. World Bank ABCDE Conference Paper.
The Law of Ukraine. On the
protection of economic competition. 11 January 2001 № 2210-III
The Law of Ukraine. On the
protection from unfair
competition. 30 June 1999, # 783-XIV.
Tirole, Jean. 1999. The Institutional
Infrastructure of Competition Policy. Institut D’Economie Industrielle.
Verbeek, Marno. A Guide to
Modern Econometrics. Voronkova Taisiya. 2000. Privatiza-
tion Results over the Eight-Year Period. The Ukrainian Economic Monitor: Analytical Bulletin of the Center for Economic Privatization in Ukraine, #2(45), July 2000.
Warzynski, Frederic. 2000. The
Causes and Consequences of Managerial Change in Ukraine and the Complementarity of Reforms. LICOS Centre for Transition Economics.
Yakub, Maks, Bogdan Senchuk, and
Taras Tkachenko. 2001. Ukrainian Enterprises in 2000. International Financial Corpo-ration Report. (In Russian). IFK, Project on support of entrepreneurship in Ukraine.
38

APPENDIX 1: Composition of the Sample.
Number of enterprises
% of the total number of enterprises
Industry Categories: 1. Energy 2. Chemical industry 3. Engineering industry 4. Woodworking industry 5. Construction industry 6. Light industry 7. Food industry 8. Other industrial productions (includes printing
industry, stomatology, jeweler’s art) Region Categories:
1. Kiev 2. Lviv 3. Kharkiv 4. Sumy 5. Other cities
Ownership Categories: • Privatized • State-owed
3 8 84 7 10 26 25 14
37 40 63 12 25
130 47
1.70 4.52 47.46 3.95 5.65 14.69 14.12 7.91
20.90 22.60 35.60 6.78 14.12
73.45 26.55
Overall 177 100%
Note:
o The enterprises from the sample were divided into 8 industries according to the 5-digit industry classification adopted in Ukraine (OKONKh).
39
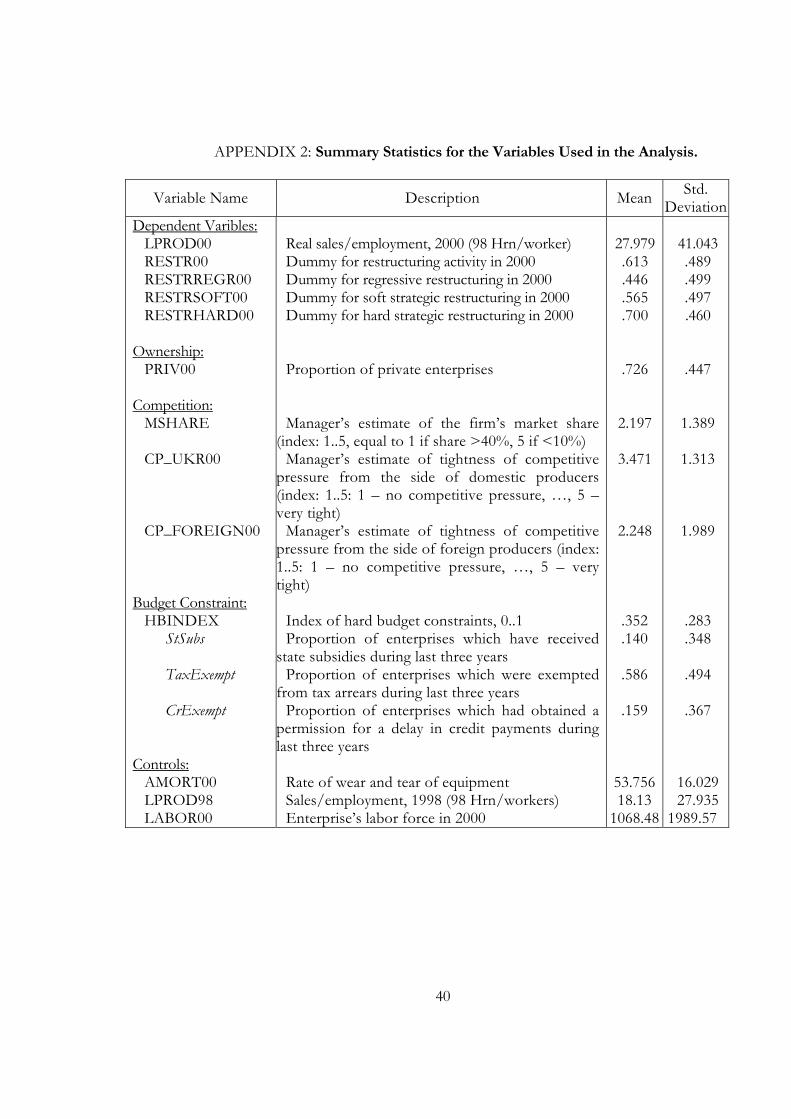
APPENDIX 2: Summary Statistics for the Variables Used in the Analysis.
Variable Name Description Mean Std. Deviation
Dependent Varibles: LPROD00 RESTR00 RESTRREGR00 RESTRSOFT00 RESTRHARD00
Ownership:
PRIV00 Competition:
MSHARE CP_UKR00 CP_FOREIGN00
Budget Constraint:
HBINDEX StSubs TaxExempt CrExempt
Controls:
AMORT00 LPROD98 LABOR00
Real sales/employment, 2000 (98 Hrn/worker) Dummy for restructuring activity in 2000 Dummy for regressive restructuring in 2000 Dummy for soft strategic restructuring in 2000 Dummy for hard strategic restructuring in 2000 Proportion of private enterprises Manager’s estimate of the firm’s market share
(index: 1..5, equal to 1 if share >40%, 5 if <10%) Manager’s estimate of tightness of competitive
pressure from the side of domestic producers (index: 1..5: 1 – no competitive pressure, …, 5 – very tight)
Manager’s estimate of tightness of competitive pressure from the side of foreign producers (index: 1..5: 1 – no competitive pressure, …, 5 – very tight)
Index of hard budget constraints, 0..1 Proportion of enterprises which have received
state subsidies during last three years Proportion of enterprises which were exempted
from tax arrears during last three years Proportion of enterprises which had obtained a
permission for a delay in credit payments during last three years
Rate of wear and tear of equipment Sales/employment, 1998 (98 Hrn/workers) Enterprise’s labor force in 2000
27.979 .613 .446 .565 .700
.726
2.197
3.471
2.248
.352
.140
.586
.159
53.75618.13
1068.48
41.043 .489 .499 .497 .460
.447
1.389
1.313
1.989
.283
.348
.494
.367
16.029 27.935
1989.57
40

APPENDIX 3: Construction of Dummies for Restructuring Activity.
The dummy for overall restructuring activity, dummy for regressive restructuring
and dummies for hard and soft strategic restructuring are constructed on the basis
of managers’ response on what types of restructuring activity out of 17 specified in
the question (see table below) has been undertaken on their enterprise in the years
1998-2000. Each positive answer was converted into a dummy rdj , which is equal
to 1 if j-th measure has been adopted on an enterprise. The maximum number of
these dummies corresponding to regressive restructuring is 6, hard strategic
restructuring – 4, and soft strategic restructuring – 7. The restructuring dummies
were obtained in the following way:
- Dummy for overall restructuring activity, RESTR00, is equal to 1 if
and 0 otherwise. 9≥∑=
17
1iijrd
- Dummy for regressive restructuring, RESTRREGR00, is equal to 1 if a
sum of dummies rdj corresponding to this type of restructuring is greater of
equal than 4.
- Dummy for soft strategic restructuring, RESTRSOFT00, is equal to 1 if a
sum of dummies rdj corresponding to this type of restructuring is greater of
equal than 5.
- Dummy for hard strategic restructuring, RESTRHARD00, is equal to 1 if
a sum of dummies rdj corresponding to this type of restructuring is greater
of equal than 3.
41

Number Restructuring measures Type of
restructuring
1
2
3
4
5
6
7
8
9
10
11
12
13
14
15
16
17
Selling/leasing out some basic production assets
Closure of plant’s subdivisions and shops
Closure of outdated production lines
Selling/transferring in state ownership social assets
Reduction of labor force
Keeping real wage at low level
Increasing the share of qualified labor in the total number of employees
Buying new equipment and technologies
International certification of products’ quality
Significant product innovations
Innovations in the existing range of products
Entering new markets
Significant changes in packaging and design of existing products
Developing of sales channels
Increasing of expenditures on advertising
Changes in organizational structure
Studying consumer demand and conducting other marketing research
Regressive
Regressive
Regressive
Regressive
Regressive
Regressive
Hard strategic
Hard strategic
Hard strategic
Hard strategic
Soft strategic
Soft strategic
Soft strategic
Soft strategic
Soft strategic
Soft strategic
Soft strategic
42

APPENDIX 4: Survey Questions Used for the Construction of Variables.
1. How much is the market share of your enterprise’s main product:
<10% ____ 11-20%_____ 21-30%_____ 31-40%_____ >40%_____
2. Estimate the level of competitive pressure from the side of the following groups of producers on the main markets where your enterprise operates. Please, use the following scale: 0 – the enterprise does not operate on this market, 1 – the enterprise is the only producer on the market, 2 – very weak competitive pressure, 3 – weak competitive pressure, 4 – tight competitive pressure, 5 – very tight competitive pressure
In 1998 In 2000 Ukrainian producers Producers from Russia and other New
Independent States countries Producers from Eastern Europe Producers from developed countries in
Western Europe Producers from other countries
0 1 2 3 4 5 0 1 2 3 4 5 0 1 2 3 4 5 0 1 2 3 4 5 0 1 2 3 4 5
0 1 2 3 4 5 0 1 2 3 4 5 0 1 2 3 4 5 0 1 2 3 4 5 0 1 2 3 4 5
3. Compare your enterprise’s financial position with the average for other
enterprises on your industry:
Much worse____ Worse____ Average____ Better____ Much better____
4. Has your enterprise received any state subsidy during the last 3 years?
Yes_____ No______
5. Has your enterprise had any tax arrears during the last 3 years?
Yes_____ No______
6. If yes, has it been canceled during the last 3 years?
Yes_____ No______
7. Has your enterprise received a delay of tax payments during the last 3 years?
Yes_____ No______
8. Has your enterprise received a delay of bank credit payments during the last 3 years?
Yes_____ No______
43

APPENDIX 5: Regression Results on Hypothesis 1; Labor Productivity as Dependent Variable.
Dependent Variable: Log of LPROD00 (measured as real sales per employee in 2000, 98 Hrn/worker) Method of estimation: IV (2SLS) regression with robust standard errors
Specification 1.1.1 1.1.2 Independent variables
Coef. St. Error Coef. St. Error Ownership:
PRIV00 Competition:
MSHARE CP_UKR00 CP_FOREIGN00
Budget Constraint: HBINDEX
Controls: LABOR00 LOGLPROD98 AMORT00
INDUSTRIES REGIONS Constant
.441
--
-.026 .124**
.192
.0006** .638***
.001 +/-
+/-
-.195
.298
--
.058
.061
.391
.00003 .106 .006
2 out of 8 coef’s are significant 2 out of 4 coef’s are significant
.746
.483**
-.019
-- --
.077
.0008*** .625*** -.003 +/-
+/-
.613
.281
.123 -- --
.379
.00003 .108 .006
4 out of 8 coef’s are significant 2 out of 4 coef’s are significant
.647 R-SQUARED .6342 .6105 F-statistics (p-value) 17.51 (0.0000) 16.40 (0.0000) Omitted Variables Test (p-value) .1728 .3262 Hausman Test (p-value) .0178 .0026 OIR Test (p-value) .99989 .9997 Note: “Industries” and “Regions” represent eight industries and four regions respectively.
Standard errors are calculated using heteroskedasticity-consistent variance-covariance matrix * means that the coefficient is significant at 10% level, ** - significant at 5%, *** -
significant at 1%.
44

45
APPENDIX 6: Regression Results on Hypothesis 1; Restructuring Dummies as Dependent Variables.
Method of estimation: Probit model The table below reports marginal effects, which show the change in probability for an infinitely small change in each independent continuous variable and the discrete change in the probability for dummy variable.
Dependent variable RESTR00 RESTRREGR00 RESTRSOFT00 RESTRHARD00Specification Specification Specification Specification
1.2.1 1.2.2 1.3.1 1.3.2 1.4.1 1.4.2 1.5.1 1.5.2Independent variables
Coef. St. Error Coef. St. Error Coef. St. Error Coef. St. Error Coef. St. Error Coef. St. Error Coef. St. Error Coef. St. Error Ownership:
PRIV00 Competition:
MSHARE CP_UKR00 CP_FOREIGN00
Budget Constraint: HBINDEX
Controls: FINPOS98
-.067
--
.071*
.047*
-.128
-.078
.134
--
.041
.027
.238
.056
.021
-.022
-- --
-.049
-.073
.138
.036 -- --
.228
.058
-.251
--
.149***.036
-.477*
-.266***
.169
--
.049
.035
.261
.080
-.064
.021
-- --
-.305
-.237***
.160
.045 -- --
.235
.072
-.094
--
.038
.032
.271
-.054
.110
--
.037
.028
.219
.061
-.076
-.030
-- --
.300
-.057
.118
.034 -- --
.221
.058
-.185
--
.008 -.016
.213
.019
.119
--
.033
.029
.204
.049
-.182
.019 -- --
.195
.061
.119
.032 -- --
.180
.151 INDUSTRIES
REGIONS
+/- (3 out of 8 coef’s are
significant) +/- (2 out of 4
coef’s are significant)
+/- (2 out of 8 coef’s are
significant) +/- (1 out of 4
coef’s are significant)
+/- (5 out of 8 coef’s are significant)
+/- (2 out of 4 coef’s are
significant)
+/- (2 out of 8 coef’s are significant)
+/- (2 out of 4 coef’s are
significant)
+/- (3 out of 8 coef’s are significant)
+/- (2 out of 4 coef’s are
significant)
+/- (4 out of 8 coef’s are significant)
+/- (2 out of 4 coef’s are
significant)
+/- (2 out of 8 coef’s are significant)
+/- (2 out of 4 coef’s are
significant)
+/- (3 out of 8 coef’s are significant)
+/- (2 out of 4 coef’s are
significant) Wald Statistics (p-Value) Pseudo R-Squared
25.64 (0.0287) .1751
20.25 (0.0892) .1424
52.37 (0.0000) .4031
54.22 (0.0000) .3541
25.71 (0.0282) .1523
23.90 (0.0321) .1461
25.50 (0.0198) .2356
27.10 (0.0121) .2343
Note: “Industries” and “Regions” represent eight industries and four regions respectively. Standard errors are calculated using heteroskedasticity-consistent variance-covariance matrix. * means that the coefficient is significant at 10% level, ** - significant at 5%, *** - significant at 1%.

APPENDIX 7: Regression Results on Hypothesis 2; Labor Productivity as Dependent Variable.
Dependent Variable: Log of LPROD00 (measured as real sales per employee in 2000, 98 Hrn/worker) Method of estimation: IV (2SLS) regression with robust standard errors
Specification 2.1.1 2.1.2 Independent variables
Coef. St. Error Coef. St. Error Ownership:
PRIV00 Competition:
MSHARE CP_UKR00 CP_FOREIGN00
Budget Constraint: HBINDEX
Interaction terms: MSHARE*PRIV00 CP_UKR00*PRIV00 CP_FOREIGN00*PRIV00 MSHARE*HBINDEX CP_UKR00*HBINDEX CP_FOREIGN00*HBINDEX PRIV00*HBINDEX
Controls: LABOR00 LOGLPROD98
INDUSTRIES REGIONS Constant
3.596
--
.337
.178
-1.609
-- -.523 -.003
-- .202 -.094
-3.680**
.00003 .658***
+/-
+/-
-.838
2.262
--
.332
.185
.932
-- .413 .139 --
.207
.225 1.614
.00003 .090
2 out of 8 coef’s are significant 2 out of 4 coef’s are significant
2.505
.847
-.388
-- --
-.918
.231 -- --
.531 -- --
-3.390**
.00005*
.668*** +/-
+/-
.843
.983
.458 -- --
.784
.401 -- --
.672 -- --
1.247
.00003 .090
2 out of 8 coef’s are significant 2 out of 4 coef’s are significant
1.797 R-squared .6429 .5696 F-statistics (p-value) 15.79 (0.0000) 15.52 (0.0000) Omitted Variables Test (p-value) .8588 .5295 Hausman Test (p-value) .0903 .0045 OIR Test (p-value) .9997 .9998 Note: “Industries” and “Regions” represent eight industries and four regions respectively.
Standard errors are calculated using heteroskedasticity-consistent variance-covariance matrix * means that the coefficient is significant at 10% level, ** - significant at 5%, *** -
significant at 1%.
46
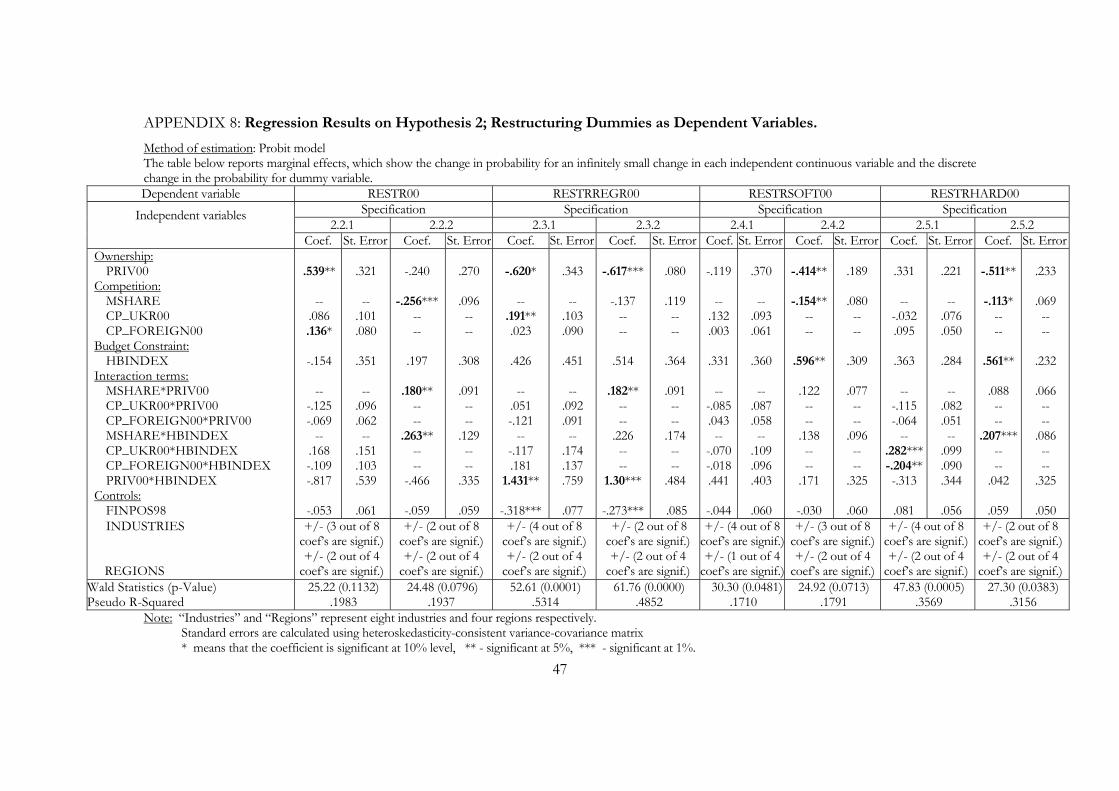
47
APPENDIX 8: Regression Results on Hypothesis 2; Restructuring Dummies as Dependent Variables. Method of estimation: Probit model The table below reports marginal effects, which show the change in probability for an infinitely small change in each independent continuous variable and the discrete change in the probability for dummy variable. Dependent variable RESTR00 RESTRREGR00 RESTRSOFT00 RESTRHARD00
Specification Specification Specification Specification2.2.1 2.2.2 2.3.1 2.3.2 2.4.1 2.4.2 2.5.1 2.5.2
Independent variables
Coef. St. Error Coef. St. Error Coef. St. Error Coef. St. Error Coef. St. Error Coef. St. Error Coef. St. Error Coef. St. Error Ownership:
PRIV00 Competition:
MSHARE CP_UKR00 CP_FOREIGN00
Budget Constraint: HBINDEX
Interaction terms: MSHARE*PRIV00 CP_UKR00*PRIV00 CP_FOREIGN00*PRIV00 MSHARE*HBINDEX CP_UKR00*HBINDEX CP_FOREIGN00*HBINDEX PRIV00*HBINDEX
Controls: FINPOS98
.539**
--
.086 .136*
-.154
--
-.125 -.069
-- .168 -.109 -.817
-.053
.321
--
.101
.080
.351
-- .096 .062 --
.151
.103
.539
.061
-.240
-.256***
-- --
.197
.180** -- --
.263** -- --
-.466
-.059
.270
.096 -- --
.308
.091 -- --
.129 -- --
.335
.059
-.620*
--
.191** .023
.426
--
.051 -.121
-- -.117 .181
1.431**
-.318***
.343
--
.103
.090
.451
-- .092 .091 --
.174
.137
.759
.077
-.617***
-.137
-- --
.514
.182** -- --
.226 -- --
1.30***
-.273***
.080
.119 -- --
.364
.091 -- --
.174 -- --
.484
.085
-.119
--
.132
.003
.331
-- -.085 .043 --
-.070 -.018 .441
-.044
.370
--
.093
.061
.360
-- .087 .058 --
.109
.096
.403
.060
-.414**
-.154**
-- --
.596**
.122 -- --
.138 -- --
.171
-.030
.189
.080 -- --
.309
.077 -- --
.096 -- --
.325
.060
.331
--
-.032 .095
.363
--
-.115 -.064
-- .282***-.204**-.313
.081
.221
--
.076
.050
.284
-- .082 .051 --
.099
.090
.344
.056
-.511**
-.113*
-- --
.561**
.088 -- --
.207*** -- --
.042
.059
.233
.069 -- --
.232
.066 -- --
.086 -- --
.325
.050 INDUSTRIES
REGIONS
+/- (3 out of 8 coef’s are signif.) +/- (2 out of 4
coef’s are signif.)
+/- (2 out of 8 coef’s are signif.) +/- (2 out of 4
coef’s are signif.)
+/- (4 out of 8 coef’s are signif.) +/- (2 out of 4
coef’s are signif.)
+/- (2 out of 8 coef’s are signif.) +/- (2 out of 4
coef’s are signif.)
+/- (4 out of 8 coef’s are signif.)+/- (1 out of 4
coef’s are signif.)
+/- (3 out of 8 coef’s are signif.)+/- (2 out of 4
coef’s are signif.)
+/- (4 out of 8 coef’s are signif.) +/- (2 out of 4
coef’s are signif.)
+/- (2 out of 8 coef’s are signif.) +/- (2 out of 4
coef’s are signif.) Wald Statistics (p-Value) Pseudo R-Squared
25.22 (0.1132) .1983
24.48 (0.0796) .1937
52.61 (0.0001) .5314
61.76 (0.0000) .4852
30.30 (0.0481).1710
24.92 (0.0713) .1791
47.83 (0.0005) .3569
27.30 (0.0383) .3156
Note: “Industries” and “Regions” represent eight industries and four regions respectively. Standard errors are calculated using heteroskedasticity-consistent variance-covariance matrix * means that the coefficient is significant at 10% level, ** - significant at 5%, *** - significant at 1%.