the required elements of an effective...
TRANSCRIPT

THE REQUIRED ELEMENTS OF AN EFFECTIVE OPERATIONAL RISK FRAMEWORK TO MEET THE GLOBAL REGULATORY REQUIREMENTS OF
BASEL II
by
PHILIPPA GIRLING
A Dissertation submitted to the
Graduate School-Newark
Rutgers, The State University of New Jersey
in partial fulfillment of the requirements
for the degree of
Doctor of Philosophy
Graduate Program in Division of Global Affairs
written under the direction of
Professor Carlos Seiglie
and approved by
________________________
________________________
________________________
________________________
Newark, New Jersey
May, 2014

Copyright page:
©2013
Philippa Girling
ALL RIGHTS RESERVED
ABSTRACT OF THE DISSERTATION
The required elements of an effective operational risk framework to meet the global regulatory requirements of Basel II
By PHILIPPA GIRLING
Dissertation Director: Professor Carlos Seiglie
The definition of operational risk adopted under Basel II is
“Operational risk is defined as the risk of loss resulting from inadequate or failed
processes, people and systems or from external events.”
Regulatory requirements for operational risk management and
measurement have been established under the Basel II rule, with local
implementation rules developed by national regulators. The cost of operational
risk losses and the impact of operational risk on share value have been
established. As a result of these regulatory and financial drivers, financial
services firms are seeking robust operational risk frameworks to enable them to
meet the four core operational risk requirements to identify, assess, control, and
mitigate operational risk.
This paper researches the regulatory landscape including a
historical review of The Bank of International Settlements (BIS) rules regarding
operational risk. The author reviews the local rules that have been adopted in the
United States and across Europe. This review includes the Group of Twenty
(G20) push for stronger adoption of risk regulation since the financial crisis began
ii
in 2007, including U.S. Dodd-Frank legislation, European Directives, Sound
Practices documents and Basel III.
The paper analyzes sources of operational risk data to determine
the size of operational risk losses and the main drivers for those losses. IBM Algo
FIRST subscription data and ORX consortium data sources are used for this
analysis. The relative biases in subscription data and consortium data are
discussed. In addition, a literature review summarizes previous findings
regarding the impact of operational risk and reputational risk events on share
value. This review is supplemented by original analysis of the impact on share
price and trading volumes as a result of the recent JP Morgan Whale operational
risk event.
The paper concludes with a recommended operational risk
framework for the implementation of the important elements of an effective
operational risk framework. These elements include the foundations of
governance, risk appetite, culture and awareness, and policy and procedure; the
building blocks of data collection including loss data, risk and control self-
assessment, scenario analysis, and key risk indicators; and the final capstones of
calculation of capital and reporting.
iii

Preface
In 2004, the Basel II rules were implemented, introducing a new era
of operational risk management. The evolution of operational risk over the past
10 years has given rise to a new profession: the operational risk manager. Best
practices and regulatory guidelines are now readily available for both the
qualitative and the quantitative elements of operational risk, and this paper
establishes the operational risk framework elements that are necessary in order
to meet the Basel II regulatory requirements. The framework proposed provides
practical steps to ensure effective identification, assessment, monitoring, and
mitigation of operational risks. In starker terms, how can you find operational risk,
size it, watch it, and kill it (or choose to accept it)?
The author explores how the operational risk regulatory framework
was established and how it has evolved over the past few years in response to
the recent economic crises.
The author examines the cost of operational risk to the financial
services industry globally, both in absolute losses and in share price decline,
including analysis of the JP Morgan Whale event.
Finally, the author proposes an operational risk framework to meet
both global regulatory expectations and the industry’s risk management goals.
iv

Acknowledgement
Thank you to the whole Wiley & Sons team for supporting the
evolution of this dissertation into a textbook. Thank you to Cathy Hampson, Jon
Holland, Nicole Hubert, Lorinda Opsahl‐Ong, Ilya Rozenfeld, David Silverman,
Mark Taylor, Jedediah Turner, and Jan Voigts — my friends, colleagues, and
peers, who generously agreed to review portions of my writing and to provide
their thoughts and suggestions. This is a much stronger work as a result of their
excellent insight and in-depth knowledge of the field of operational risk.
Thank you to both ORX and IBM Algo First for providing external
loss data for analysis with a generous spirit and remarkable efficiency and to
GARP for allowing me open access to my earlier writings on operational risk.
Thank you to Penelope Vance for coaching me through the entire
process and for asking all of the right questions at the right time.
Thank you to my dissertation director, Professor Carlos Seiglie and
dissertation committee Professor Mariana Spatareanu and Professor Douglas
Coate for their advice and support.
Finally, a special thank you to my children, Leah, Holly, Tegwen,
Hayley and Allison for their patience with me as I studied and wrote, and to my
husband, Joe, for his constant encouragement that I could, and should, pursue a
PhD.
v

Table of Contents
ABSTRACT OF THE DISSERTATION ................................................................. ii
Preface ................................................................................................................ iv
Acknowledgement ............................................................................................... v
Chapter 1: Definition and Drivers of Operational Risk .......................................... 1
The Definition of Operational Risk .................................................................... 1
Operational Risk Management and Operational Risk Measurement ................ 6
Operational Risk Management ...................................................................... 7
Operational Risk Measurement ..................................................................... 8
The Relationship between Operational Risk Management and Other Risk Types ............................................................................................................... 9
Enterprise Risk Management ......................................................................... 10
Drivers of Operational Risk Management ....................................................... 11
Chapter 2: The Regulatory Push for Operational Risk Management ................. 13
History of the Basel Accords .......................................................................... 13
Rules of the Accords ...................................................................................... 15
Basel I......................................................................................................... 15
Basel II........................................................................................................ 17
Pillar 1 ............................................................................................................ 18
Credit Risk .................................................................................................. 18
Market Risk ................................................................................................. 19
Operational Risk ......................................................................................... 19
Capital Reserves ........................................................................................ 21
Pillar 2 ............................................................................................................ 21
Pillar 3 ............................................................................................................ 22
Adoption of Basel II in Europe ........................................................................ 22
Adoption of Basel II in the United States ........................................................ 22
Securities and Exchange Commission Amendments to the Net Capital Rule ................................................................................................................... 22
U.S. Regulators’ Adoption of New Regulations to Apply Basel II ................. 23
Impact of the Financial Crisis ......................................................................... 25
vi

The Promise of Basel III .............................................................................. 25
European Response to the Crisis ................................................................... 27
U.S. Response to the Crisis ........................................................................... 27
U.S. Interagency Guidance on Advanced Measurement Approach ................ 29
Dodd-Frank Act .............................................................................................. 29
The Future ..................................................................................................... 33
Chapter 3: The Cost of Operational Risk in the Financial Services Industry ...... 35
Single Large Events ....................................................................................... 35
Société Générale and the External Event that Shook the Operational Risk World ............................................................................................................. 35
Operational Risk Event Data .......................................................................... 42
Subscription Databases ................................................................................. 43
Analysis of Subscription Operational Risk Loss Data .................................. 44
Consortium Data ............................................................................................ 47
Analysis of Consortium Operational Risk Loss Data ................................... 48
Comparisons between Subscription and Consortium Databases ................... 53
Size of Losses by Risk Category ................................................................ 53
Frequency of Losses by Risk Category ....................................................... 55
Size of Losses by Business Line ................................................................. 56
Number of Events by Business Line ........................................................... 57
Challenges of External Data ........................................................................... 58
Impact to Share Value .................................................................................... 60
The LIBOR Scandal .................................................................................... 60
JP Morgan Whale’s Impact on Stock Price ................................................. 64
Chapter 4: Proposed Operational Risk Framework ........................................... 69
Overview of the Operational Risk Framework ................................................ 69
The Foundations of the Framework ................................................................ 70
Governance ................................................................................................ 70
Culture and Awareness ............................................................................... 71
Policies and Procedures ............................................................................. 72
The Four Data Building Blocks ....................................................................... 72
vii

Loss Data Collection ................................................................................... 73
Risk and Control Self-Assessment .............................................................. 74
Scenario Analysis ....................................................................................... 75
Key Risk Indicators ..................................................................................... 75
Measurement and Modeling ........................................................................... 76
Reporting ....................................................................................................... 76
Risk Appetite .................................................................................................. 77
Conclusion ..................................................................................................... 77
Bibliography ...................................................................................................... 78
viii

List of Tables
Table 1: Classification in IBM® Algo FIRST® ..................................................... 39 Table 2: Total Operational Risk Losses Recorded to Date in Algo FIRST, Q4 2012 .................................................................................................................. 44 Table 3: FIRST Losses to Date by BIS Business Line, Q4 2012 ....................... 46 Table 4: Number and Amount of Losses (EURO) by Business Line and Risk Category ........................................................................................................... 49 Table 5: The Percentage Contribution to Number of Events and Amount of Losses by Business Line and Risk Category ..................................................... 51 Table 6: JPM price and trade volume ................................................................ 67
List of Equations
Equation 1 ......................................................................................................... 21
ix

List of illustrations
Figure 1: Enterprise Risk Management Wheel .................................................. 10 Figure 2: Three Capital Calculation Approaches for the Treatment of Operational Risk under Pillar 1 of Basel II ............................................................................ 20 Figure 3: ORX Classification of the Société Générale Event ............................. 40 Figure 4: Percentage of Dollar Losses and Number of Events to Date for the Financial Services Industry ................................................................................ 45 Figure 5: Percentage of Losses and Number of Events to Date, by BIS Business Line in FIRST .................................................................................................... 47 Figure 6: Dollar Value Losses to Date, by Risk Category for All Business Lines 53 Figure 7: Percentage of Dollar Value Losses to Date in ORX and First Databases, by Event Category, for All Business Lines ...................................... 54 Figure 8: Percentage of Number of Events to Date in ORX and FIRST Databases, by Event Category, for All Business Lines ...................................... 55 Figure 9: Percentage of Value of Losses to Date in ORX and FIRST Databases, by BIS Business Lines ....................................................................................... 56 Figure 10: Percentage of Number of Events to Date in ORX and FIRST Databases, by Business Lines .......................................................................... 58 Figure 11: Whale Event’s Impact on JP Morgan Stock Price and Trading Volume .......................................................................................................................... 67 Figure 12: Proposed Operational Risk Framework ............................................ 70
x
1
Chapter 1: Definition and Drivers of Operational Risk
The Definition of Operational Risk
What do we mean by operational risk? Operational risk
management had been defined in the past as all risk that is not captured in
market and credit risk management programs. Early operational risk programs,
therefore, took the view that if it was not market risk, and it was not credit risk,
then it must be operational risk. However, today a more concrete definition has
been established, and the most commonly used of the definitions can be found in
the International Convergence of Capital Measurement and Capital Standards: A
Revised Framework regulations. These regulations are commonly known as
“Basel II”. The Basel II definition of operational risk is:
…the risk of loss resulting from inadequate or failed processes, people and systems or from external events. This definition includes legal risk, but excludes strategic and reputational risk (Basel Committee for Banking Supervision, 2004).
Let us break this definition down into its components. First, there
must be a risk of loss. So for an operational risk to exist there must be an
associated loss anticipated. The definition of “loss” will be considered more fully
when we look at internal loss data in Chapter 3, but for now we will simply
assume that this means a financial loss.
Next, let us look at the defined causes of this loss. The preceding
definition provides four causes that might give rise to operational risk losses.

2
These four causes are (1) inadequate or failed processes, (2)
inadequate or failed people (the regulators do not get top marks for their
grammar, but we know what they are getting at), (3) inadequate or failed
systems, or (4) external events.
While the language is a little awkward (what exactly are “failed
people,” for example), the meaning is clear. There are four main causes of
operational risk events: the person doing the activity makes an error, the process
that supports the activity is flawed, the system that facilitated the activity is
broken, or an external event occurs that disrupts the activity.
With this definition in our hands, we can simply look at today’s
newspaper or at the latest online headlines to find a good sample of operational
risk events. Failed processes, inadequate people, broken systems, and violent
external events are the mainstay of the news. Operational risk surrounds us in
our day-to-day life.
Examples of operational risk in the headlines in the past few years
include egregious fraud (Madoff, Stanford), breathtaking unauthorized trading
(Société Générale and UBS), shameless insider trading (Raj Rajaratnam,
Nomura, SAC Capital), stunning technological failings (Knight Capital, Nasdaq
Facebook IPO, anonymous cyber-attacks), and heartbreaking external events
(hurricanes, tsunamis, earthquakes, terrorist attacks). We will take a deeper look
at several of these cases throughout the dissertation.
All of these events cost firms hundreds of millions, and often
billions, of dollars. In addition to these headline-grabbing large operational risk
3
events, firms constantly bleed money due to frequent and less severe events.
Broken processes and poorly trained staff can result in many small errors that
add up to serious downward pressure on the profits of a firm.
The importance of these types of risks, both to the robustness of a
firm and to the systemic soundness of the industry, has led regulators to push for
strong operational risk frameworks, and has driven executive managers to fund
and support such frameworks.
The Basel II definition of operational risk has been adopted or
adapted by many firms and is now generally accepted as the standard. It has
been incorporated into national regulations across the globe with only minor
adaptations and is consistently referred to by regulators and operational risk
managers.
Basel II is the common name used to refer to the “International
Convergence of Capital Measurement and Capital Standards: A Revised
Framework,” which was published by the Bank for International Settlements in
Europe in 2004.
The Basel II framework set out new risk rules for internationally
active financial institutions that wished to continue to do business in Europe.
These rules related to the management and capital measurement of market and
credit risk, and introduced a new capital requirement for operational risk. In
addition to the capital requirement for operational risk, Basel II laid out qualitative
requirements for operational risk management, and so a new era of operational
risk management development was born.
4
JPMorgan Chase has adapted the definition very simply as follows:
Operational risk is the risk of loss resulting from inadequate or failed processes or systems, human factors or external events (JP Morgan, 2008).
Deutsche Bank has a more creative interpretation:
Operational risk is the potential for failure (incl. the legal component) in relation to employees, contractual specifications and documentation, technology, infrastructure and disasters, external influences and customer relationships. Operational risk excludes business and reputational risk (Deutsche Bank , 2011).
Under the Basel II definition, legal events are specifically included
in the definition of operational risk, and a footnote is added to further clarify this.
Legal risk includes, but is not limited to, exposure to fines, penalties, or punitive damages resulting from supervisory actions, as well as private settlements1.
This is a helpful clarification, as there is often some tension with the
legal department when the operational risk function first requests information on
legally related events. This is something that will be considered in more detail
later in the chapter on loss data collection.
The Basel II definition also specifically excludes several items from
operational risk:
This definition includes legal risk, but excludes strategic and reputational risk2.
These nuances in the Basel II definition are often reflected in the
definition adopted by a firm, whether or not they are governed by that regulation.
However, these exclusions are not always applied in operational risk frameworks.

5
For example, some firms have adopted definitions of operational
risk that include reputational risk. For example, Citi’s definition includes
reputational risk:
Operational risk is the risk of loss resulting from inadequate or failed internal processes, systems or human factors, or from external events. It includes the reputation and franchise risk associated with business practices or market conduct in which Citi is involved (Citi, 2011).
In this paper will be examining ways that operational risk
management and measurement can meet the underlying need to accomplish five
tasks:
1. Identifying operational risks.
2. Assessing the size of operational risks.
3. Monitoring and controlling operational risks.
4. Mitigating operational risks.
5. Calculating capital to protect you from operational risk losses.
These five requirements occur again and again in global and
national regulations and are the bedrock of successful operational risk
management.
In addition to putting these tools in place, a robust operational risk
framework must look at all types of operational risk. There are seven main
categories of operational risk as defined by Basel II3.
1. Internal Fraud
2. External Fraud
3. Employment Practices and Workplace Safety
4. Clients, Products, and Business Practices

6
5. Damage to Physical Assets
6. Business Disruption and System Failures
7. Execution, Delivery, and Process Management
Operational risk has some similarities to market and credit risk.
Most important, it should be actively managed because failure to do so can result
in a misstatement of an institution’s risk profile and expose it to significant losses.
However, operational risk has some fundamental differences to
market and credit risk. Operational risk, unlike market and credit risk, is typically
not directly taken in return for an expected reward. Market risk arises when a firm
decides to take on certain products or activities. Credit risk arises when a firm
decides to do business with a particular counterparty. In contrast, operational risk
exists in the natural course of corporate activity. As soon as a firm has a single
employee, a single computer system, a single office, or a single process,
operational risk arises.
While operational risk is not taken on voluntarily, the level of that
risk can certainly be impacted by business decisions. Operational risk is inherent
in any enterprise, but strong operational risk management and measurement
allows for that risk to be understood and either mitigated or accepted.
Operational Risk Management and Operational Risk Measurement
There are two sides to operational risk: operational risk
management and operational risk measurement. There is often tension between
these two activities, as well as overlap. Basel II requires capital to be held for
operational risk and offers several possible calculation methods for that capital,
7
which will be discussed later in this chapter. This capital requirement is the heart
of the operational risk measurement activities and requires quantitative
approaches.
In contrast, firms must also demonstrate that they are effectively
managing their operational risk, and this requires qualitative approaches. A
successful operational risk program combines qualitative and quantitative
approaches to ensure that operational risk is both appropriately measured and
effectively managed.
Operational Risk Management
Helpful guidelines for appropriate operational risk management
activities in a firm can be found in Pillar 2 of Basel II:
736. Operational risk: The Committee believes that similar rigour should be applied to the management of operational risk, as is done for the management of other significant banking risks. … 737. A bank should develop a framework for managing operational risk and evaluate the adequacy of capital given this framework. The framework should cover the bank’s appetite and tolerance for operational risk, as specified through the policies for managing this risk, including the extent and manner in which operational risk is transferred outside the bank. It should also include policies outlining the bank’s approach to identifying, assessing, monitoring and controlling/mitigating the risk. (Basel Committee for Banking Supervision, 2004)
There are several important things to note in these sections. First,
operational risk should be managed with the same rigor as market and credit
risk. This is an important concept that has many implications when considering
how to embed an operational risk management culture in a firm.
Second, policies regarding risk appetite are required. This is no
easy task, as articulating a risk appetite for operational risk can be very

8
challenging. Most firms would prefer to have no operational risk, and yet these
risks are inherent in their day-to-day activities and cannot be completely avoided.
Recently, regulators have been very interested in how firms are responding to
this challenge, and there is much debate about how to express operational risk
appetite or tolerance and how to manage against it. This will be explored further
in each of the framework sections later in the chapter.
Finally, policies must be written that outline the bank’s approach to
“identifying, assessing, monitoring, and controlling/mitigating” operational risk.
This is the heart of the definition of operational risk management, and the
elements of an operational risk framework need to address these challenges.
Does each element contribute to the identification of operational risks, the
assessment of those risks, the monitoring of those risks, and the control or
mitigation of those risks? To be successful, an operational risk framework must
be designed to meet these four criteria for all operational risk exposures, and it
takes a toolbox of activities to achieve this.
In the operational risk management toolbox are loss data collection
programs, risk and control self-assessments, scenario analysis activities, key risk
indicators, and powerful reporting. Each of these elements will be considered in
turn in this paper.
Operational Risk Measurement
Operational risk measurement focuses on the calculation of capital for
operational risk, and Basel II provides for three possible methods for calculating
operational risk capital, which will be discussed later. Some firms choose to

9
calculate operational risk capital, even if they are not subject to a regulatory
requirement, as they wish to include the operational risk capital in their strategic
planning and capital allocation for strategic and business reasons.
The Relationship between Operational Risk Management and Other Risk
Types
Operational risk often arises in the presence of other risk types, and
the size of an operational risk event may be dramatically impacted by market or
credit risk forces.
This can best be illustrated by a fictional example:
One of Gamma Bank’s business lines offers retail customers the ability to
trade bonds. One of the customers calls the broker at Gamma Bank and
instructs the broker to buy Andromeda Corporation bonds for the
customer’s account. The trade is executed, but it is mistakenly booked as
a sell, instead of a buy; this will result in a significantly larger loss if the
market moves up. The cost of making the customer whole will now be
much higher than if the market had remained stable. In fact, there could
be a gain if the market drops. It is clear, then, that market risk can magnify
operational risk.
There are also events that include both credit and operational risk
elements. If a counterparty fails, and there was an operational error in securing
adequate collateral, then the credit risk event is magnified by operational risk.
While market risk, credit risk, and operational risk functions are
usually run separately, there are benefits in integrating these functions where

10
possible. The overall risk profile of a firm depends not on the individual market,
credit, and operational risks, but also on elusive strategic and reputational risks
(or impacts) and the relationships among all of these risk categories.
Enterprise Risk Management
Additional risk categories also exist—for example, geopolitical risk
and liquidity risk. For these reasons, some firms adopt an enterprise risk
management (ERM) view of their risk exposure. It is important to consider the
role of operational risk management as an element in ERM and to appreciate its
relationship with all other risk types. The relationship among risks can be
illustrated in Figure 1
Figure 1: Enterprise Risk Management Wheel
This ERM wheel illustrates that all risk types are interrelated and
that central risk types can have an impact on risk types on the outer spokes of
the wheel. For example a geopolitical risk event might result in risks arising in
market risk, credit risk, strategic risk, liquidity risk, and operational risk.
11
For example, if a country’s government banned trades in a particular type of
derivative. This ban could result in market risk (the value of the derivatives
plummets), credit risk (counterparties who are concentrated in this product might
fail), strategic risk (the business model might rely on growth in that product), and
operational risk (certain activities might now be illegal).
Similarly, reputational risk or reputational impact can occur as a
result of any risk event and so is at the center of the ERM wheel. This is just one
possible model for the relationship between risk types and simply illustrates the
complexity of effective ERM. Operational risk sits on the ERM wheel and is best
managed and measured with that in mind.
Drivers of Operational Risk Management
Operational risk management has arisen as a discipline as a result
of drivers from three main sources: regulators, senior management, and third
parties.
In addition to Basel II, there are other regulatory drivers for
operational risk management including Solvency II, which imposes Basel-like
requirements on insurance firms, and a host of local regulations such as the
Markets in Financial Instruments Directive (MiFID) legislation in Europe and the
Sarbanes-Oxley Act (which includes risk and control requirements for financial
statements) in the United States. The regulatory evolution of operational risk is
discussed in Chapter 2.
Additional business drivers from within the banks and from third
parties complement the many regulatory drivers of operational risk management.

12
One of the most important of these additional drivers is that senior management
and the board both want to be fully informed of the risks that face the firm,
including operational risk exposures. They are fully aware that operational risk
events can have catastrophic financial and reputational impact. An effective
operational risk program should provide transparency of operational risk
exposure to allow senior management to make strategic business decisions fully
informed of the operational risk implications.
A strong operational risk framework provides transparency into the
risks in the firm, therefore allowing for informed business decision making. With a
strong operational risk framework, a firm can avoid bad surprises and equip itself
with tools and contingency planning to be able to respond swiftly when an event
does occur.
Furthermore, external third parties have started to ask about the
operational robustness of a firm.
Ratings agencies, investors, and research analysts are now aware
of the importance of operational risk management and often ask for evidence that
an effective operational risk framework is in place, and whether sufficient capital
is being held to protect a firm from a catastrophic operational risk event.
13
Chapter 2: The Regulatory Push for Operational Risk Management
The regulation of operational risk is globally founded on Basel II.
This chapter discusses the regulatory response to the Basel Capital Accords
(commonly known as Basel I and Basel II) that were presented by the Basel
Banking Committee of the Bank of International Settlements in 1988 and 2004,
which were intended to provide a robust capital framework and risk management
approach for internationally active banks.
The focus of this chapter is on (1) the history of the Basel Accords;
(2) the rules of the Basel Accords; (3) the adoption of Basel II in Europe and (4)
in the United States; (5) the impact of the financial crisis and resulting European
and U.S. regulatory changes, including the Dodd-Frank regulation in the United
States; and, finally, (6) the future of Basel regulation and the role of operational
risk management.
History of the Basel Accords
The Basel Accords were developed by the Bank of International
Settlements (BIS), which is headquartered in Basel, Switzerland. The BIS
describes its mission and activities as follows:
BIS is an international organization which fosters international monetary and financial cooperation and serves as a bank for central banks.
The BIS fulfills this mandate by acting as:
14
• a forum to promote discussion and policy analysis among central banks and within the international financial community
• a center for economic and monetary research • a prime counterparty for central banks in their financial
transactions • agent or trustee in connection with international financial
operations (Bank of International Settlements)4 The BIS was originally established in 1930 to assist with the
management of reparation loans post World War I, but it soon transitioned into a
body that addressed monetary and financial stability through statistical analysis,
economic research, and regular meetings between central bank governors and
other global financial experts.
Over the years, the BIS has established several standing
committees to take on the important financial topics of the day. It was heavily
involved in supporting the Bretton Woods System in the early 1970s, and tackled
the challenges of cross-border capital flows and the importance of financial
regulation in the late 1970s and 1980s. In 1974, the G10 nations5 formed the BIS
Basel Committee on Banking Supervision to address shortcomings in the
regulation of internationally active banks. The committee membership has now
grown to include 27 countries’ central banks and monetary authorities.6
In 1988, the Basel Committee on Banking Supervision published
the Basel Capital Accord7 (commonly known today as Basel I) to provide a
framework for the consistent and appropriate regulation of capital adequacy and
risk management in internationally active banks. In 2004, the Basel Committee
published a revised framework (Basel Committee for Banking Supervision,
15
2004), which came to be known as Basel II. Today, the Basel Committee has
four subcommittees: the Standards Implementation Group, the Policy
Development Group, the Accounting Task Force, and the Basel Consultative
Group, each of which also has its own subcommittees and working groups.
By its own admission, the Basel Committee has no legal authority
over member central banks:
The Committee does not possess any formal supranational supervisory authority, and its conclusions do not, and were never intended to, have legal force. Rather, it formulates broad supervisory standards and guidelines and recommends statements of best practice in the expectation that individual authorities will take steps to implement them through detailed arrangements—statutory or otherwise—which are best suited to their own national systems. In this way, the Committee encourages convergence towards common approaches and common standards without attempting detailed harmonization of member countries' supervisory techniques. ( Bank of International Settlements)
However, the U.S. Federal Reserve, along with the majority of
member central banks, moved forward with national regulatory implementation of
most of the Basel Committee recommendations.
Rules of the Accords
The Basel Accords outline rules for financial institutions and for the
national regulators who supervise those institutions.
Basel I
In 1988, the BIS Basel Committee on Banking Supervision
published the International Convergence of Capital Measurement and Capital
Standards (commonly known then as the Basel Capital Accord and today as
16
Basel I). The report aimed to “secure international convergence of supervisory
regulations governing the capital adequacy of international banks” (Basel
Committee for Banking Supervision, 1988). Balin outlined the four “pillars” of
Basel I as the Constituents of Capital, the Risk Weights, a Target Standard Ratio,
and Transitional and Implementing Agreements. (Balin, 2008)
Basel I focused on credit risk and assigned different weightings (0
percent, 10 percent, 20 percent, 50 percent, and 100 percent) for capital
requirements, depending on the level of credit risk associated with the asset.
Later amendments to Basel I added further weightings to accommodate more
sophisticated instruments. The Target Standard Ratio set a minimum standard
whereby 8 percent of a bank’s risk-weighted assets had to be covered by Tier 1
and Tier 2 capital reserves.
There were no requirements to either manage or measure
operational risk under the Basel Accord.
The Basel Accord was adopted with relative ease by the G10
nations who were members of the Basel Banking Committee at that time,
including the United States. In the United States, the Basel recommendations
were codified in Title 12 of the United States Code and Title 12 of the Code of
Federal Regulations.
The Basel Accord (Basel I) was seen as a safety and soundness
standard that would protect banks from insolvency and the minimum capital
requirements provided a standard below which regulators would not permit a
17
bank to continue to conduct business. However, regulators soon began to
question whether Basel I adequately captured the risks of the increasingly
complex and changing financial markets. In addition, banks were able to “game”
the system by moving assets off balance sheet and by manipulating their
portfolios to minimize their required capital, while not necessarily minimizing their
actual risk exposure.
Basel II
As pressure mounted for a revised approach, the Basel Committee
responded by proposing a revised Capital Adequacy Framework in June 1999.
They described the new proposed capital framework as consisting of three
pillars: “minimum capital requirements; … supervisory review of an institution’s
internal assessment process and capital adequacy; and effective use of
disclosure to strengthen market discipline as a complement to supervisory
efforts.” ( Bank of International Settlements)
Comments and discussions were held over the next few years, with
the newly broadened membership of the Committee providing a global
perspective on the proposed changes. The International Convergence of Capital
Measurement and Capital Standards, a Revised Framework was issued on June
26, 2004, and served as a basis for national rule-making to reflect the Basel II
approaches. The Basel Committee outlined the goal of the revised framework as
follows:
The Basel II Framework describes a more comprehensive measure and minimum standard for capital adequacy that national supervisory authorities are now working to
18
implement through domestic rule-making and adoption procedures. It seeks to improve on the existing rules by aligning regulatory capital requirements more closely to the underlying risks that banks face. In addition, the Basel II Framework is intended to promote a more forward-looking approach to capital supervision, one that encourages banks to identify the risks they may face, today and in the future, and to develop or improve their ability to manage those risks. As a result, it is intended to be more flexible and better able to evolve with advances in markets and risk management practices. (Basel II: Revised International Capital Framework, 2012)
On July 4, 2006, the Committee issued an updated version of the
revised framework incorporating additional guidance and including those sections
of Basel I that had not been revised. The revised framework is almost 10 times
the length of Basel I, running to over 300 pages. For the first time, operational
risk management and measurement were required.
Basel II consists of three pillars: Pillar 1—Minimum Capital
Requirements, Pillar 2—Supervisory Review Process, and Pillar 3—Market
Discipline.
Pillar 1
The major changes to the capital adequacy rules are outlined in
detail in Pillar 1. Basel II requires banks to hold capital for assets in the holding
company, so as to prevent banks from avoiding capital by moving assets around
within its corporate structure.
Credit Risk

19
Pillar 1 offers three possible approaches to calculating credit risk:
the standardized approach, the foundation internal ratings based (F-IRB)
approach, and, finally, the advanced IRB approach.
Under the standardized approach a bank uses “authorized” rating
institution ratings in order to assign risk weightings and to calculate capital.
Under the IRB approaches, the banks may take advantage of
capital improvements on the standardized approach by applying their own
internal credit rating models. Under F-IRB, a bank may develop their own model
to estimate the probability of default (PD) for individual clients or groups of
clients, subject to approval from their local regulators. F-IRB banks are required
to use their regulator’s prescribed loss given default (LGD) and to calculate the
risk-weighted asset (RWA) and the final required capital.
Under advanced IRB (A-IRB), banks may use their own estimates
for PD, LGD, and exposure at default (EAD) to calculate RWA and the final
required capital.
Market Risk
Pillar 1 also provides market risk capital requirements, based
mainly on a value at risk (VaR) approach.
Operational Risk
Finally, Pillar 1 introduces a new risk category: operational risk. As
discussed in Chapter 1, operational risk is defined in Basel II as the “risk of loss
resulting from inadequate or failed internal processes, people and systems or

20
from external events. This definition includes legal risk, but excludes strategic
and reputational risk”. (Basel Committee for Banking Supervision, 2006)
Pillar 1 offers three possible methods to calculate capital for
operational risk: the basic indicator approach (BIA), the standardized approach
(TSA) or the advanced measurement approach (AMA).8
Under BIA, capital is simply calculated from a percentage (currently
set at 15 percent) of the average of the last three years’ revenue. TSA offers
different percentage weightings depending on the business line—ranging from 12
percent for retail banking to 18 percent for sales and trading. AMA offers banks
the opportunity to develop their own risk-based model for calculating operational
risk capital. AMA requires that the model include four elements: internal loss
data, external loss data, scenario analysis, and business environment and
internal control factors. These three methods are summarized in Figure 2.
Figure 2: Three Capital Calculation Approaches for the Treatment of Operational Risk under Pillar 1 of Basel II

21
While Pillar 1 offers three possible methods to calculate operational
risk capital, most large banks have found that their local regulator requires them
to pursue an AMA approach. In addition, even where a bank is not required to
take an AMA approach to calculating capital, their regulator often advises them
that they should adopt best practices and that best practices require them to
ensure they have fully developed all four elements of AMA.
Therefore, the standard for a strong operational risk framework is
based on the effective development of internal and external loss data systems,
appropriate use of scenario analysis, and effective development of business
environment and internal control factors. Whether or not these are used as direct
inputs into a capital model, they are considered vital elements of a sound
operational risk management framework.
Capital Reserves
Finally, under Pillar 1, a bank must hold capital reserves of at least
8 percent of their total credit, market, and operational risk-weighted assets:
Equation 1
𝑐𝑎𝑝𝑖𝑡𝑎𝑙𝑚𝑎𝑟𝑘𝑒𝑡 𝑟𝑖𝑠𝑘 + 𝑐𝑟𝑒𝑑𝑖𝑡 𝑟𝑖𝑠𝑘 + 𝑜𝑝𝑒𝑟𝑎𝑡𝑖𝑜𝑛𝑎𝑙 𝑟𝑖𝑠𝑘 ≥ 8%
Pillar 2
Basel II introduces the Pillar 2 requirements as follows:
This section discusses the key principles of supervisory review, risk management guidance and supervisory transparency and accountability produced by the Committee with respect to banking risks, including guidance relating to, among other things, the treatment of interest rate risk in the banking book,

22
credit risk (stress testing, definition of default, residual risk, and credit concentration risk), operational risk, enhanced cross-border communication and cooperation, and securitization.9
Pillar 2 outlines how the regulators are expected to enforce
soundness standards and provides a mechanism for additional capital
requirements to cover any material risks that have not been effectively captured
in Pillar 1.
Pillar 3
Pillar 3 provides methods for disclosure of risk management
practices and capital calculation methods to the public. The purpose of Pillar 3 is
to increase transparency and to allow investors and shareholders a view into the
inner risk practices of the bank.
Adoption of Basel II in Europe
In the European Union, Basel II was codified through the European
Parliament through the Capital Requirements Directive,10 which required member
states to enact appropriate local regulations by January 1, 2007, with advanced
approaches available by January 1, 2008.
Adoption of Basel II in the United States
In the United States, the plethora of regulators added to the
complexities of implementation.
Securities and Exchange Commission Amendments to the Net
Capital Rule

23
U.S. investment banks needed to select a global Basel II regulator,
and the Securities and Exchange Commission (SEC) looked for ways for them to
be able to select the SEC as that regulator. To support this, the SEC adopted
rules that allowed for consolidated supervised entities (CSEs) to apply to the
SEC for regulatory supervision for Basel II. The five large U.S. investment banks
took this opportunity: Goldman Sachs, Morgan Stanley, Bear Stearns, Merrill
Lynch, and Lehman Brothers successfully applied for CSE status.
The SEC moved swiftly to make changes to its net capital rules to
reflect Basel II standards (Securities Exchange Commission, June 21, 2004), and
the five investment banks were quickly approved for Basel II supervision by the
SEC.
U.S. Regulators’ Adoption of New Regulations to Apply Basel II
Meanwhile, the remaining United States banks were waiting to see
whether U.S. banking regulations would be amended to apply the Basel II rules
to them. Questions were raised on the appropriateness of the rules, and the
audacity of the European Union in driving these global standards was hotly
debated in Congress. Pressure was mounting from the regulators and the banks,
and international political tensions were increasing as banks waited for the
United States to move forward with Basel II rules.
On September 25, 2006, the Federal Banking Agencies (the Office
of the Comptroller of the Currency (OCC), the Board of Governors of the Federal
Reserve System, the Federal Deposit Insurance Corporation (FDIC), and the
Office of Thrift Supervision (OTS), came together to collect comments on the
24
adoption of Basel II rules in the United States through two Notices of Proposed
Rulemaking relating to capital requirements: New Risk-Based Capital Rules for
large or internationally active U.S. banks in accordance with Basel II (Basel II
Capital Accord: Notice of Proposed Rulemaking, 2006), and Market Risk Rule
(Risk-Based Capital Standards: Market Risk, 2006).
On November 2, 2007, the Federal Reserve Board approved final
rules to implement new risk-based capital requirements in the United States for
large, internationally active banking organizations, stating:
The new advanced capital adequacy framework, known as Basel II, more closely aligns regulatory capital requirements with actual risks and should further strengthen banking organizations’ risk-management practices.
‘Basel II is a modern, risk-sensitive capital standard that will protect the safety and soundness of our large, complex, internationally active banking organizations. The new framework is designed to evolve over time and adapt to innovations in banking and financial markets, a significant improvement from the current system,’ said Federal Reserve Board Chairman Ben S. Bernanke. (Risk-Based Capital Standards: Advanced Capital Adequacy, 2007)
On July 20, 2008, the Federal Reserve, OCC, OTS, and FDIC
reached agreement regarding implementation of Basel II in the United States.
There would be mandatory Basel II rules for large banks, and opt-in provisions
for noncore banks as had been proposed in the Notices of Proposed Rulemaking
(NPRs).
The new standards were to be transitioned into over a parallel run
period, with Basel I based capital floors being set for the first three years.
25
Pillar 2 guidance was provided later, resulting in supervisory
guidance being published on December 7, 2007. (Federal Reserve, 2007)
The Pillar 2 guidance provided for an Internal Capital Adequacy
Assessment Process (ICAAP) for the implementation of Pillar 2 standards in a
bank. The final rules were published in the Federal Register, mostly through
amendments to Title 12.
Impact of the Financial Crisis
The global economic crisis that began in 2007 led to much soul-
searching by governments, regulators, and the BIS as they sought to understand
how the Basel frameworks had failed to protect the global economy.
The Promise of Basel III
Global political pressure has resulted in the BIS Basel Committee
on Banking Supervision revisiting Basel II to consider what further regulatory and
capital enhancements are needed in order to ensure global financial stability.
Christopher Cox himself has been vocal about the need for regulatory reform,
recently stating that “in March 2008, I formally requested that the Basel
Committee address the inadequacy of the Basel capital and liquidity standards”.
(Securities Exchange Commission Press Release, 2008)
The Group of Twenty (G20) has also been meeting regularly to
address concerns regarding global regulatory requirements and capital
adequacy. They established a Financial Stability Board (FSB) to address these
concerns and to make recommendations for change, and the BIS has been
26
working closely with the FSB and the International Monetary Fund (IMF) to
develop new recommendations to enhance the Basel framework. In April 2010,
the G20 met to review a report prepared by IMF and FSB and “the main
message coming through this document from central banks and regulators is that
priority number one is Basel III,” two sources involved in the G20 process said.
(G20 Must Make Basel III Top Priority, 2010)
Indeed, the G20 agreed to introduce Basel III by the end of 2012.
Proposals for an updating of Basel II were put forward by the Basel Committee
on Banking Supervision in December 2009 in two documents: “Strengthening the
Resilience of the Banking Sector” (Basel Committee for Banking Supervision -
Resilience, 2009) and “International Framework for Liquidity Risk Measurement,
Standards and Monitoring.” (Basel Committee on Banking Supervision - Liquidity,
2009)
The Committee gathered comments and feedback, and the main
recommendations were:
• An increase in Tier One capital.
• Additional capital for derivatives, securities financing and repo markets.
• Tighter leverage ratios.
• Setting aside revenue during upturns to protect against cyclicality of
markets.
• Minimum 30-day liquidity standards.

27
• Enhanced corporate governance, risk management, compensation
practices, disclosure, and board supervision practices.
European Response to the Crisis
The Committee of European Banking Supervisors (CEBS)
produced the “Guidelines on the Management of Operational Risk in Market
Related Activities” (Committee of European Banking Supervisors, 2010) in
October 2010. They placed a heavy emphasis on the importance of strong
corporate governance, an area that many saw as one of the key causes of the
financial crisis. This document supplemented the earlier “Guidelines on the
Scope of Operational Risk and Operational Risk Loss” (Committee of European
Banking Supervisors, 2009) and rounded out the European detailed guidance on
the implementation of a robust operational risk framework under Basel II.
This guidance is now used by European regulators as a measure
against which to assess the operational risk frameworks of European banks.
U.S. Response to the Crisis
The financial turmoil of 2007–2009 resulted in a quick and
fundamental change in the way that Basel II was applied to large financial
institutions in the United States. Of the original five investment banks that had
opted for CSE status with the SEC, three no longer existed by 2009: Bear
Stearns, Lehman Brothers, and Merrill Lynch. The remaining two, Goldman
Sachs and Morgan Stanley, changed their structures to Bank Holding
Companies, and they were now under the regulatory auspices of the Federal

28
Reserve. As a result, the SEC Basel II framework was simply no longer relevant
and was formally ended by then chairman Christopher Cox on September 26,
2008. Chairman Cox maintained that the economic turmoil was not a result of
SEC Basel II implementation, but instead that the voluntary opt-in nature of the
regulations was to blame.
As I have reported to the Congress multiple times in recent months, the CSE program was fundamentally flawed from the beginning, because investment banks could opt in or out of supervision voluntarily. (Cox Testimony, 2010)
However, there was some speculation and criticism that the SEC
had taken a light touch approach to the application of Basel II rules for its five
CSEs and that it had, in fact, thereby contributed to the economic crisis. In
particular, the high levels of leverage that were permitted by the investments
banks were strongly debated, with suggestions that the SEC’s CSE rules allowed
them to lever up to levels of 30-to-1 (Madigan, 2009). The operational risk
requirements of Basel II did not seem to receive strong enforcement by the SEC,
and operational risk frameworks were put under intense scrutiny once the
Federal Reserve moved in as the new regulator for the original CSEs.
Morgan Stanley and Goldman Sachs are currently operating their
new bank status under the Basel I framework while they seek to be readmitted to
the Basel II club under the Federal Reserve’s Basel II regulations. The time taken
to meet the Federal Reserve standards does suggest that there may be some
truth to the suggestion that their previous Basel II framework under the SEC,
29
including the operational risk requirements, may have been relatively, and
inappropriately, light.
Banks that were operating under the Federal Reserve’s Basel II
framework before the economic crisis are continuing to pursue their Basel II
approval with no major changes. However, they too may have noticed an
increased vigilance from their regulator as the current emphasis on regulatory
stringency is on the upswing.
U.S. Interagency Guidance on Advanced Measurement Approach
In June 2011, the United States regulators issued the Interagency
Guidance on the Advanced Measurement Approaches for Operational Risk
(Office of the Comptroller of the Currency, 2011). This guidance was agreed by
the Board of Governors of the Federal Reserve System, the FDIC, the OCC, and
the OTS.
The guidance had been long awaited and addressed several areas
where the range of practices in operational risk had been broad among U.S.
banks. While some of the conclusions may have been unpopular, the written
guidance pointed toward a clearer path to Basel II AMA approval in the United
States. However, as of the time of writing, there has still not been an approval in
the United States.
Dodd-Frank Act
In the United States, regulatory reform has been progressing along
similar lines to those that were proposed by G20. President Barack Obama

30
introduced a guidance document, “A New Foundation: Rebuilding Financial
Supervision and Regulation,” on June 17, 2009 (Department of the Treasury,
2009), and 2009 saw many bills introduced that addressed specific aspects of
regulatory reform, often overlapping with existing Basel II rules. Davis Polk
summarized these as follows:
• The Financial Stability Improvement Act as amended by the House Financial Services Committee through November 6, 2009, or the “House Interim Version.”
• The Investor Protection Act, passed by the House Financial Services Committee on November 4, 2009, or the “House Investor Protection bill.”
• The Consumer Financial Protection Agency Act, passed by the House Financial Services Committee on October 29, 2009, or the “House CFPA bill.”
• The Accountability and Transparency in Rating Agencies Act, passed by the House Financial Services Committee on October 28, 2009, or the “House Rating Agencies bill.”
• The Private Fund Investment Advisers Registration Act, passed by the House Financial Services Committee on October 27, 2009, or the “House Private Fund Investment Advisers bill.”
• The Derivatives Markets Transparency and Accountability Act, passed by the House Committee on Agriculture on October 21, 2009, or the “Peterson bill.”
• The Over-the-Counter Derivatives Markets Act, passed by the House Financial Services Committee on October 15, 2009, or the “Frank OTC bill.”
• The Federal Insurance Office Act, introduced by Representative Paul Kanjorski (D-PA) on October 1, 2009, or the “House Insurance bill.”
• The Liability for Aiding and Abetting Securities Violations Act, introduced by Senator Arlen Specter (D-PA) on July 30, 2009, or the “Specter bill.”
• Treasury Proposals released in the summer of 2009, or the “Treasury proposals.”
31
• The Shareholder Bill of Rights Act, introduced by Senator Charles Schumer (D-NY) on May 19, 2009, or the “Schumer bill.” (Davis Polk, 2009)
These all finally culminated in a catch-all bill, the Restoring
American Financial Stability Act of 2009, which was introduced into the Senate
by Senator Christopher Dodd (D-CT) and into the House of Representatives by
Representative Barney Frank (D). It was subsequently renamed the “Dodd-Frank
Wall Street Reform and Consumer Protection Act,” and President Obama signed
the bill into law on July 21, 2010.
The full title of the Act is rather emotive:
An Act to promote the financial stability of the United States by improving accountability and transparency in the financial system, to end “too big to fail,” to protect the American taxpayer by ending bailouts, to protect consumers from abusive financial services practices, and for other purposes (Dodd-Frank, 2012).
Dodd-Frank addresses some of the Basel III issues and will result
in United States regulatory changes that meet many of the Financial Stability
Board recommendations. The main elements of Dodd-Frank are outlined in the
summary released by the Senate Committee on Banking, Housing, and Urban
Affairs under the following categories:
Consumer Protections with Authority and Independence: The bill
creates “a new independent watchdog, the Consumer Financial Protection
Bureau, housed at the Federal Reserve, with the authority to ensure that
American consumers get the clear, accurate information they need to
32
shop for mortgages, credit cards, and other financial products, and protect
them from hidden fees, abusive terms, and deceptive practices.”
Ends Too Big to Fail: The bill “ends the possibility that taxpayers will be
asked to write a check to bail out financial firms that threaten the economy
by: creating a safe way to liquidate failed financial firms; imposing tough
new capital and leverage requirements that make it undesirable to get too
big; updating the Fed’s authority to allow system-wide support but no
longer prop up individual firms; and establishing rigorous standards and
supervision to protect the economy and American consumers, investors
and businesses.”
Advanced Warning System: The bill “creates a council to identify and
address systemic risks posed by large, complex companies, products, and
activities before they threaten the stability of the economy.”
Transparency and Accountability for Exotic Instruments: The bill
“eliminates loopholes that allow risky and abusive practices to go on
unnoticed and unregulated—including loopholes for over-the-counter
derivatives, asset-backed securities, hedge funds, mortgage brokers and
payday lenders.”
Federal Bank Supervision: The bill “streamlines bank supervision to
create clarity and accountability and protects the dual banking system that
supports community banks.”

33
Executive Compensation and Corporate Governance: The bill
“provides shareholders with a say on pay and corporate affairs with a non-
binding vote on executive compensation”
Protects Investors: The bill “provides tough new rules for transparency
and accountability for credit rating agencies to protect investors and
businesses.”
Enforces Regulations on the Books: The bill “strengthens oversight and
empowers regulators to aggressively pursue financial fraud, conflicts of
interest and manipulation of the system that benefit special interests at the
expense of American families and businesses.” (Summary: Restoring
American Financial Stability, 2009)
With President Obama having successfully entered his second
term, any hopes of a full-scale repeal of Dodd-Frank have been put to rest. While
there may be changes made to some of the elements of the Act, much of the
main content will move forward into regulation, albeit at a slower pace than had
been originally planned.
The Future
The Basel Accords have resulted in global regulatory changes that
have reached beyond G10, beyond G20, and into the far reaches of the global
financial regulatory environment. Basel I introduced credit risk capital measures,
and Basel II provided enhanced risk capital calculation for credit, market, and
operational risk. The United States has played a key role on the Basel
Committee for Banking Supervision that designed these accords and so it is not

34
surprising to find that United States regulators have consistently adopted these
measures.
The recent economic crisis has highlighted the need for further
refinements in the way that banks calculate and hold capital for all risk types, and
the importance of sound operational risk management and measurement. In
addition, it has drawn close scrutiny of the methods used to ensure there is
robust risk management and healthy liquidity in the bank. Basel III was
scheduled for adoption in January 2013, but at the time of writing, this deadline
had been missed by both the EU and the US and a delayed and phased
implementation was being crafted for implementation over the next few years.
Meanwhile, the writing and implementation of rules under Dodd-
Frank and similar nation specific rules across the globe continues at a fast pace.
While the operational risk framework has remained mostly unchanged since
Basel II, the plethora of new regulatory requirements and governance
enhancements has led to increasing complexity in managing the operational risks
faced by a bank on a day to day basis. This has added further challenges to the
implementation of an effective operational risk framework.
35
Chapter 3: The Cost of Operational Risk in the Financial Services Industry
Single Large Events
In 2006 Société Générale suffered a $7 billion unauthorized trading
scandal. This event provided a stark example of how operational risk can give
rise to huge losses. The event had a strong impact on the operational risk
discipline as it had many of the characteristics of a classic operational risk event.
Société Générale and the External Event that Shook the Operational
Risk World
This event is reported in IBM® Algo FIRST® as follows: In what the Wall Street Journal (1/24/2008) called a “singular feat in the world of finance” Societe Generale announced a €4.9 billion (USD $7.2 billion) loss on January 24, 2008, arising from the misdeeds of a single rogue trader. The bank characterized the largest rogue trading event to date as involving “elaborate fictitious transactions” that allowed Jerome Kerviel to circumvent its internal controls. The trades involved the arbitrage of “plain vanilla” stock-index futures. Mr. Kerviel had previously worked in a back office function and learned how to circumvent the bank’s systems. Although he was initially characterized by the governor of the Bank of France as a “computer genius” later he was described as an unexceptional employee who worked very hard to conceal unauthorized trading positions, which SocGen estimated to have a value of €50 billion ($73.26 billion). The French Finance Ministry said that Kerviel’s rogue trading started in 2005; he was allegedly given a warning at the time concerning trading above prescribed limits. In addition to the €4.9 billion trading loss, the French Banking Commission levied a €4 million fine against Societe Generale on July 4, 2008, bringing the total loss amount to €4,904,000,000. On October 5, 2010, a court in Paris sentenced Mr. Kerviel to three years’ imprisonment,
36
plus a two year suspended sentence and ordered him to repay €4.9 billion ($6.7 billion) to his employer11.
On October 24, 2012, a French appeals court upheld Kerviel’s
fraud conviction and lifetime trading ban.
This external event galvanized the operational risk world as it
clearly demonstrated the dangers that exist in unmitigated operational risk.
In 2008, many firms were still engaged in developing their early
operational risk frameworks and were often focused on first-run delivery of
new reporting, new loss data tools, and new adaptions to their risk
assessment and scenario analysis programs. The regulatory requirements
were paramount in many programs, with the business benefits being
developed as rapidly as possible, but sometimes lagging behind the
urgent regulatory pressures.
However, when the news hit of Mr. Kerviel’s audacious activities
and their multibillion-dollar impact on his firm many heads of operational
risk found themselves in front of their executive management being asked
the urgent question: “Could that happen here?”
This was a classic large operational risk event in that it resulted
from numerous control failings. Mr. Kerviel’s job was to make arbitrage
trades that would result in small gains, but he began taking unauthorized
“directional” positions starting in 2005, and these grew in size until he was
discovered in January 2008.

37
Reports on the events suggest that Mr. Kerviel may have been
more motivated by a sense of pride than an attempt to defraud the firm.
His unauthorized activities did not result in secret transfers into his bank
account; they resulted in huge positions at the bank.
At one point, Mr. Kerviel’s activities allegedly resulted in gains for
the firm that have been estimated to have been as high as €1 billion in
2007. It has been suggested that he realized that these gains were too
large to explain and so pursued a strategy to reduce them. That strategy,
it is alleged, resulted in losses of €1.5 billion by February 2008. The
adverse market conditions that existed when Société Générale discovered
the unauthorized trading and unwound the positions resulted in the loss
growing to €4.9 billion.
This is an extreme example of how an operational risk event can be
exacerbated by a market risk event.
IBM® Algo FIRST® provides an in-depth prose analysis of the event
based on extensive press reviews. The highlights of the many contributing
factors that are alleged can be summarized as follows:
1. Mr. Kerviel engaged in extensive unauthorized activities in order to
demonstrate his prowess as a trader, rather than to defraud the
bank.
2. He was insufficiently supervised and at times had no supervisor at
all.
38
3. He had worked in the middle and back offices prior to becoming a
trader and used his knowledge of those controls to ensure that his
activities were not detected.
4. He gained password access to back office systems that allowed
him to manipulate data and approve his own trades.
It is alleged that many red flags were raised but were ignored or
were dismissed as unimportant.
The head of the Bank of France, Christian Noyer, said that Mr. Kerviel managed to breach “five levels of controls.” The controls were identified in the earlier Mission Green report12 and included cancelled or modified transactions; transactions with deferred dates; technical (internal) counterparties; nominal (non-netted exposures) and intra-month cash flows. In addition, the second and more detailed Mission Green report13 identified a host of supervisory lapses, organizational gaps, and warning signs that were never heeded.14
It is alleged that there were numerous other red flags that were not
heeded including:
1. Mr. Kerviel requested an unusually high bonus due to his above
market returns.
2. He frequently breached limits, and despite being reprimanded for this
in the past, was able to continue to do so.
3. Concerns were raised by EUREX regarding his trading volume, but
were dropped after a response from Mr. Kerviel satisfied their
concerns.
4. At least 75 compliance alerts were raised, but were dismissed when
39
Mr. Kerviel supplied minimal, and sometimes forged, documentation to
explain his unusual activity.
5. Mr. Kerviel never took his vacation time, allowing him to be on site to
continue to maintain and conceal his unauthorized activities.
6. The bank had to rely on manual processing due to inadequate
technology to support the increasing volumes in the market.
7. Net cash flows were monitored, whereas monitoring of nominal flows
might have revealed the unauthorized activity.
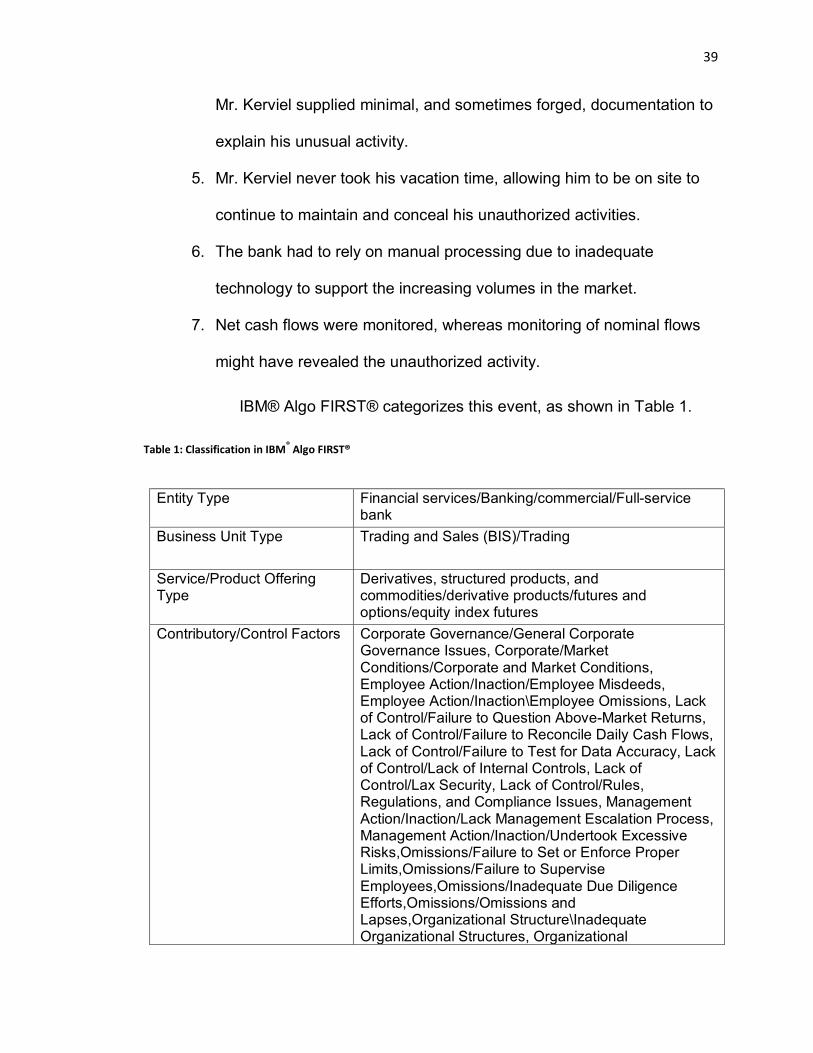
IBM® Algo FIRST® categorizes this event, as shown in Table 1.
Table 1: Classification in IBM® Algo FIRST®
Entity Type Financial services/Banking/commercial/Full-service
bank Business Unit Type Trading and Sales (BIS)/Trading
Service/Product Offering Type
Derivatives, structured products, and commodities/derivative products/futures and options/equity index futures
Contributory/Control Factors Corporate Governance/General Corporate Governance Issues, Corporate/Market Conditions/Corporate and Market Conditions, Employee Action/Inaction/Employee Misdeeds, Employee Action/Inaction\Employee Omissions, Lack of Control/Failure to Question Above-Market Returns, Lack of Control/Failure to Reconcile Daily Cash Flows, Lack of Control/Failure to Test for Data Accuracy, Lack of Control/Lack of Internal Controls, Lack of Control/Lax Security, Lack of Control/Rules, Regulations, and Compliance Issues, Management Action/Inaction/Lack Management Escalation Process, Management Action/Inaction/Undertook Excessive Risks,Omissions/Failure to Set or Enforce Proper Limits,Omissions/Failure to Supervise Employees,Omissions/Inadequate Due Diligence Efforts,Omissions/Omissions and Lapses,Organizational Structure\Inadequate Organizational Structures, Organizational

40
Structure/Organizational Gap(s), Strategy Flaw/Inadequate Technology Planning Process, Organizational Structure/Organizational Structure—General, Lack of Control/Lack of Internal Controls—General, Management Action/Inaction/Undertook Excessive Risks, Omissions/Omissions—General
Loss Impact Direct Loss/Regulatory/Compliance/Taxation Penalty (BIS)/Fines/Penalties, Direct Loss/Write-Down (BIS)/Write-Downs, Indirect Loss/Management Remediation, Indirect Loss/Ratings Agency Downgrade/Ratings Watch, Indirect Loss/Related Market Risk Losses, Indirect Loss/Reputational (Nonmonetary), Indirect Loss/Share Price
Loss Detection Sources Whistle Blowing/Employee Originated Market Focus Institutional Services Event Trigger People Risk Class/Trading Misdeeds/Unauthorized
Trading/Activity above Limits\Unauthorized Trading—Proprietary Accounts
Basel Levels I & II Internal Fraud/Unauthorized Activity/Trans type unauthorized (w/monetary loss)
Basel Business Line Investment Banking/Trading and Sales/Proprietary Positions
Entity Type Financial Services/Banking/Commercial/Full Service Bank
Business Unit Type Trading and Sales (BIS)/Trading
ORX provides a news service also, and they categorized this event
as shown in Figure 3.
Figure 3: ORX Classification of the Société Générale Event
The industry responded to this event with energy. Operational Risk
teams met with senior management, as executive teams and boards
41
asked whether it could happen at their firm. Perhaps for the first time, the
possible size of an OR event was fully appreciated, and the OR function
had an opportunity to demonstrate its relevance and importance.
Fraud risk assessments were conducted in many firms and
numerous control improvements were implemented. Mandatory vacation
policies were written, and enforced. Passwords were disabled for
employees that had moved to new roles. Supervisory oversight was
reviewed.
Industry forums were held as operational risk managers compared
notes on how best to minimize the risk such an event could not happen in
the industry again. As an external data point, the event galvanized many
aspects of OR frameworks across the industry and also paved the way for
how to respond to future serious events.
Work plans were drawn up to evaluate the current state of the
controls that had failed at Société Générale and to kick off work to
remediate any control gaps that might be uncovered. RCSAs and scenario
analysis were updated in the unauthorized trading aspects of internal
fraud. Working groups were formed, Board packs prepared and external
event tracking was enhanced. As IBM® Algo FIRST® notes in its longer
description of the event:
The AFP press agency reported (October 8, 2010) that Société Générale’s own efforts to enhance its internal controls in the wake of the event were

42
estimate to have cost the bank at least 150 million euros over a three-year period15.
The Société Générale event shocked the financial services
industry, and turned the spotlight on to operational risk. However, only
three years later another startlingly similar event occurred at UBS.
Despite the lessons learned from that event, the industry saw
another huge unauthorized trading event at UBS in 2011. This led financial firms
to revisit what they had learned from Société Générale just three years earlier
and to reassess the way that they respond to large external events to ensure that
the lessons have truly been learned. Operational risk losses drain the net
revenue of financial services firms every year. The size of individual losses and
the total losses incurred are staggering and an effective operational risk
framework is needed to provide a structure for the identification and remediation
of events so as to minimize this drag on the profitability of the industry.
Operational Risk Event Data
There are many good online sources of operational risk event data
in the form of news articles, journals, and e-mail update services. Some
operational risk system vendors also have external databases that they make
available on a subscription basis. For example, SAS offers an external database
to its technology users, and IBM offers a subscription service called IBM® Algo
FIRST®16. There are also consortiums of operational risk losses.

43
External events are a valuable source of operational risk
information on an individual event basis and also as a benchmarking tool.
Comparing internal loss patterns to external loss patterns can provide insight into
whether the losses in a firm reflect the usual losses in their industry.
Subscription Databases
These databases include descriptions and analyses of operational
risk events, gleaned from legal and regulatory sources and from news articles,
and they provide helpful data to assist with mapping the events to the appropriate
business lines, risk categories and causes. The mission of these external
databases is to collect tail losses and so to provide examples of potential large
exposures.
The IBM® Algo FIRST®17 database has collected losses from the
past twenty years and they describe themselves as follows:
About IBM Algo FIRST The IBM® Algo FIRST® database is a collection of external, public operational risk loss events in the form of risk case studies. Algo FIRST events are targeted at the financial sector and contain over 20 years’ worth of events, which have been indexed to 13 keyword hierarchies, including Basel category and business line. Other hierarchies include control factor, event trigger, business unit type, entity type. Algo FIRST cases include detailed descriptions that break down the event to analyze root cause, identify control breakdowns, lessons learned, management response and aftermath of the event. Events can also include sections with supporting detail that timeline the event, relevant information about the institution that it happened to, or other detail about loss impacts. The bulk of events in FIRST capture quantitative information as well as detailed qualitative analysis. This quantitative information takes the form of loss amounts that are captured at the time of the event (About IBM Algo FIRST).

44
Analysis of Subscription Operational Risk Loss Data
The total operational risk losses to date by risk category in the IBM®
Algo FIRST® (FIRST) database are represented in Table 2.
Table 2: Total Operational Risk Losses Recorded to Date in Algo FIRST, Q4 201218
Event Type Losses ($) % of Losses Records % of
Records Average Loss ($)
Business Disruption and System Failures 5,941,530,424 0.41% 113 1.54% 52,579,915
Clients, Products, and Business Practices 704,366,741,158 48.25% 3,381 46.11% 208,330,891
Damage to Physical Assets 280,556,835,241 19.22% 233 3.18% 1,204,106,589
Employment Practices and Workplace Safety 12,793,739,772 0.88% 438 5.97% 29,209,452
Execution Delivery and Process Management 97,465,053,049 6.68% 534 7.28% 182,518,826
External Fraud 57,551,520,972 3.94% 712 9.71% 80,830,788
Internal Fraud 301,091,891,856 20.63% 1,921 26.20% 156,737,060
Grand Total 1,459,767,312,472 100.00% 7,332 100.00% 199,095,378
The vast amount of losses collected by FIRST to date indicates the
size of operational risk in the industry. A grand total of $1,459 billion of losses
have been collected in the database.
From the table it is clear that a majority of the operational risk
events that are included in this database, 46 percent of all records, fall into the
category of Clients, Products, and Business Practices. This category also
accounts for 48 percent of the dollar value of the losses.
Internal Fraud accounts for 26 percent of the records, and this
category represents 21 percent of the dollar loss amount. Damage to Physical
Assets is the next most expensive category, with only 3 percent of the loss
events, but an impressive 19 percent of the cost of losses. This information is
further illustrated in Figure 4.

45
Figure 4: Percentage of Dollar Losses and Number of Events to Date for the Financial Services Industry19
This shows that in an external database such as FIRST the
operational risk data collected suggests that the losses from Internal Fraud,
Damage to Physical Assets, and Client, Products, and Business Practices are
much more significant than those from other categories. However, it is important
to note that the FIRST data includes business lines other than the Basel BIS
business lines. Business lines that are not captured in the Basel II requirements
fall in its scope. This accounts for the relatively high Damage to Physical Assets
losses as insurance company losses are included. While insurance companies
are facing Basel II type requirements under similar global requirements known as
Solvency II rules, we will exclude them for the purposes of this analysis so as to
ensure a more appropriate comparison to other Basel II data sources.

46
It is also possible to examine a subset of losses in FIRST by BIS
business lines as follows. In Table 3 all losses attributed to businesses that are
not one of the BIS business lines have been removed.
Table 3: FIRST Losses to Date by BIS Business Line, Q4 201220
BIS Business Unit Losses ($) % of Losses Records % of Records Average Loss ($)
Agency Services 4,092,601,937 0.35% 174 2.22% 23,520,701
Asset Management 169,054,229,189 14.40% 1,284 16.37% 131,662,172
Commercial Banking 274,983,936,373 23.42% 1,388 17.70% 198,115,228
Corporate Finance 206,271,120,093 17.56% 706 9.00% 292,168,725
Payment And Settlement 31,938,754,339 2.72% 463 5.90% 68,982,191
Retail Banking 278,008,980,318 23.67% 1,631 20.79% 170,453,084
Retail Brokerage 15,260,092,920 1.30% 810 10.33% 18,839,621
Trading & Sales 194,759,791,628 16.58% 1,388 17.70% 140,316,853
Grand Total 1,174,369,506,797 100.00% 7,844 100.00% 149,715,643
It can be seen from this view that although about 10 percent of
events occur in Retail Brokerage, that business line has generated only 1 percent
of the dollar value of the losses, as the average losses in this business line are
relatively small. In contrast, Corporate Finance generated only 9 percent of the
events but 18 percent of the dollar value of the losses, as losses in this line tend
to be more expensive. The relative weight of loss amounts and number of events
in the FIRST data is represented in Figure 5.
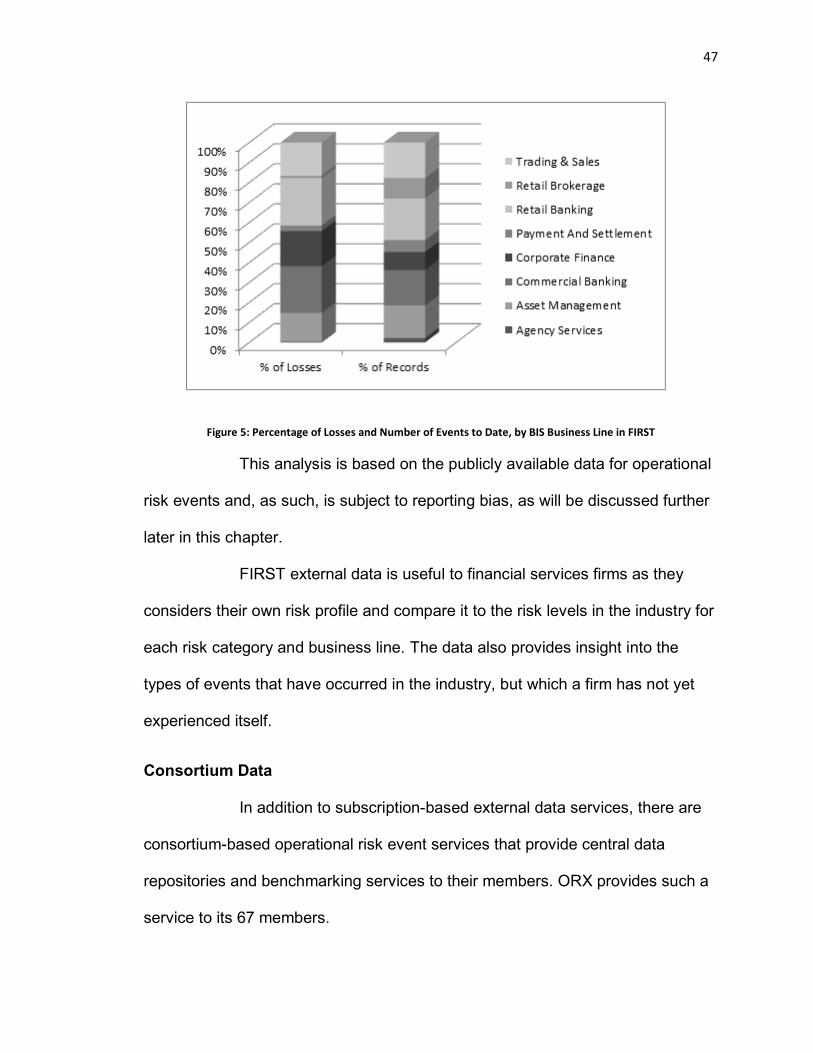
47
Figure 5: Percentage of Losses and Number of Events to Date, by BIS Business Line in FIRST
This analysis is based on the publicly available data for operational
risk events and, as such, is subject to reporting bias, as will be discussed further
later in this chapter.
FIRST external data is useful to financial services firms as they
considers their own risk profile and compare it to the risk levels in the industry for
each risk category and business line. The data also provides insight into the
types of events that have occurred in the industry, but which a firm has not yet
experienced itself.
Consortium Data
In addition to subscription-based external data services, there are
consortium-based operational risk event services that provide central data
repositories and benchmarking services to their members. ORX provides such a
service to its 67 members.
48
ORX gathers operational risk event data from its members and
produces benchmarking information. It applies quality assurance standards
around the receipt and delivery of data to promote members’ anonymity and to
provide consistency in definitions.
Analysis of Consortium Operational Risk Loss Data
Unlike news-based subscription services, ORX data does not suffer
from the availability bias that skews the FIRST data, which relies on public
sources of data. In contrast, all operational risk events are provided anonymously
into the ORX database. However, the data relate only to a subset of financial
services, those member banks that provide data to ORX. ORX publishes reports
that summarize the data. Table 4 is derived from ORX data and illustrates the
number of losses and the amount of losses in euros for each business line and
each risk category.
ORX use slightly different business lines, as they split out Retail
Banking into two groups: Retail Banking and Private Banking. They also rename
Payment and Settlement as Clearing.

49
Table 4: Number and Amount of Losses (EURO) by Business Line and Risk Category
This data was generated using the 2012 Q4 ORX Global Data Set, which contains losses up to the end of 2012 Q3 (Most recent date of recognition) 30th September 2012
50
To date, ORX has gathered nearly 30,000 events that have cost
their consortium members over €100 billion euros. The cost of operational risk is
abundantly clear. This table shows that ORX business line data is dominated by
Retail Banking events, both in size of losses and frequency of events.
To further understand the relative impact to the different businesses
and from the different risk categories, it is helpful to take another look at this data
in percentage format as shown in Table 5.

51
Table 5: The Percentage Contribution to Number of Events and Amount of Losses by Business Line and Risk Category
These data were generated using the Q4 2012 ORX Global Data Set, which contains losses up to the end of Q3 2012 (most recent date of recognition), September 30, 2012
52
From Table 5 we can see that nearly 58 percent of the total number
of events is generated in the Retail Banking business area and most of those are
in the External Fraud category. Trading and Sales and Commercial Banking are
the next business lines, with about 10 percent of the total number of events each.
Retail Banking also has a lion’s share of the total costs of events, with 46 percent
of the total losses. Trading and Sales has over 16 percent of losses, and
Commercial Banking and Corporate Finance follow with 10 percent and 9
percent.
It is clear that External Fraud and Execution, Delivery, and Process
Management produce the greatest number of events in a risk category,
accounting for nearly 36 percent of the number of events and 25 percent of the
total costs.
Clients, Products, and Business Practices accounts for about 17
percent of the events, but carries more than 50 percent of the total loss amount.
This demonstrates that for the member banks of ORX, Clients, Products, and
Business Practices events tend to be larger events. It is for this reason that many
firms carefully investigate this category in scenario analysis to attempt to identify
potential “fat tail” events—that is, events that are infrequent but very large.
The data can also be used to visually represent the relative levels of operational
risk in each business line, as shown in Figure 6.
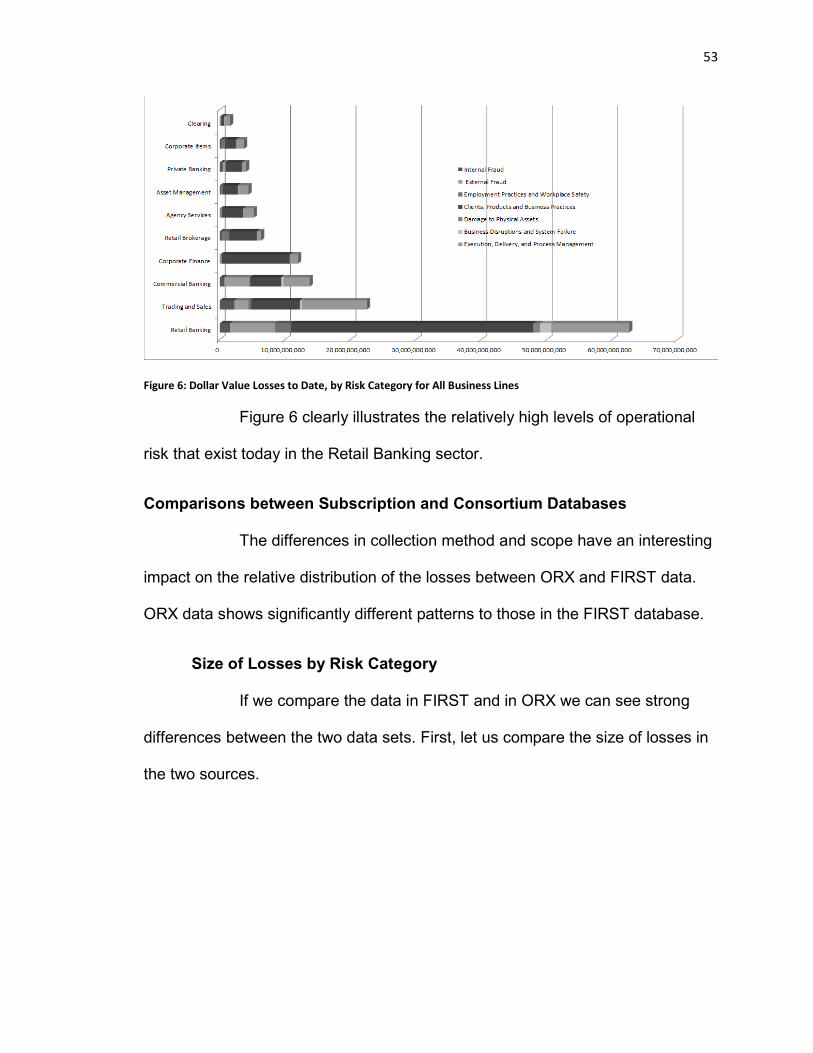
53
Figure 6: Dollar Value Losses to Date, by Risk Category for All Business Lines
Figure 6 clearly illustrates the relatively high levels of operational
risk that exist today in the Retail Banking sector.
Comparisons between Subscription and Consortium Databases
The differences in collection method and scope have an interesting
impact on the relative distribution of the losses between ORX and FIRST data.
ORX data shows significantly different patterns to those in the FIRST database.
Size of Losses by Risk Category
If we compare the data in FIRST and in ORX we can see strong
differences between the two data sets. First, let us compare the size of losses in
the two sources.
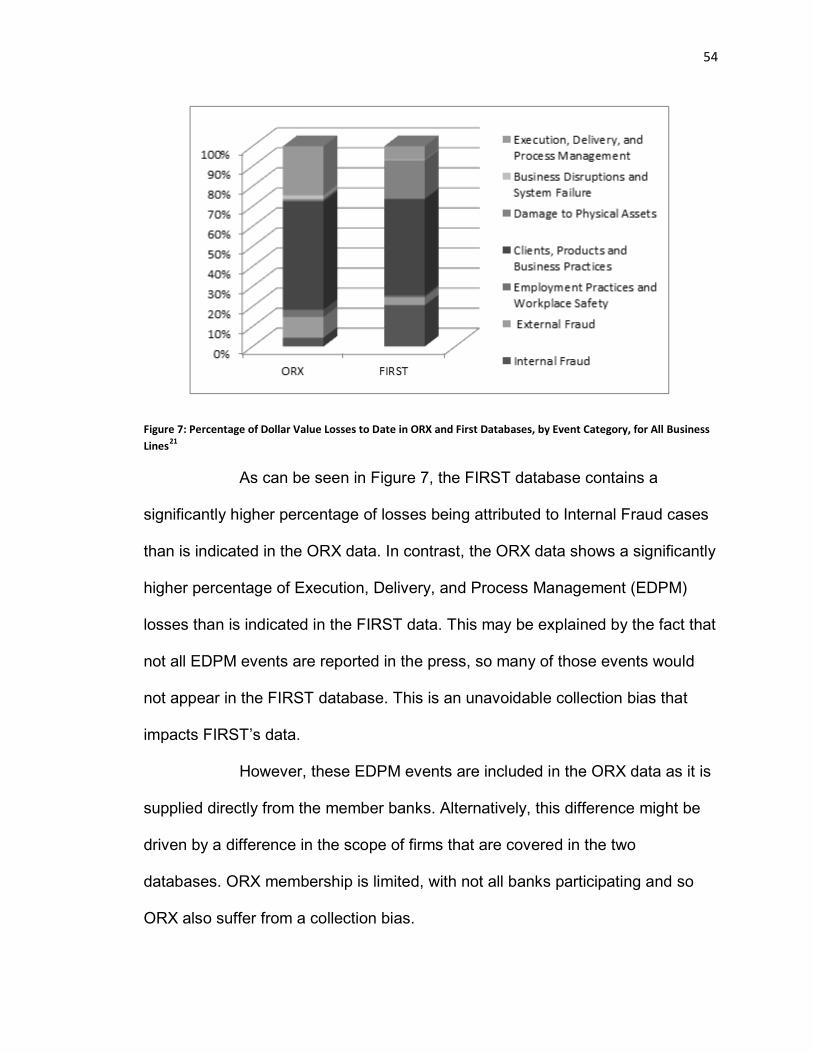
54
Figure 7: Percentage of Dollar Value Losses to Date in ORX and First Databases, by Event Category, for All Business Lines21
As can be seen in Figure 7, the FIRST database contains a
significantly higher percentage of losses being attributed to Internal Fraud cases
than is indicated in the ORX data. In contrast, the ORX data shows a significantly
higher percentage of Execution, Delivery, and Process Management (EDPM)
losses than is indicated in the FIRST data. This may be explained by the fact that
not all EDPM events are reported in the press, so many of those events would
not appear in the FIRST database. This is an unavoidable collection bias that
impacts FIRST’s data.
However, these EDPM events are included in the ORX data as it is
supplied directly from the member banks. Alternatively, this difference might be
driven by a difference in the scope of firms that are covered in the two
databases. ORX membership is limited, with not all banks participating and so
ORX also suffer from a collection bias.

55
In contrast, FIRST collects data on all firms, including a significant
number of firms that are outside of Basel II, and that are not BIS business lines,
for example, insurance companies.
Frequency of Losses by Risk Category
A comparison of the relative frequency of events in the two
databases is also interesting and is illustrated in Figure 8.
Figure 8: Percentage of Number of Events to Date in ORX and FIRST Databases, by Event Category, for All Business Lines22
It is clear from Figure 8 that EDPM events rarely result in public
press coverage, and so are missing from the FIRST data. ORX also has larger
number of External Fraud events than FIRST, suggesting that External Events
are often successfully kept out of the press. The ORX underlying data show that
the dominance of External Fraud events occurs mostly due to the participation of
retail banks in the consortium. (Most, if not all, ORX members had a retail
banking division for the period covered by the report). Retail Banking includes

56
credit card services, and so it may be that this dominance by the External Fraud
category is driven by many relatively small credit card and retail banking frauds.
The threshold for loss data delivery to ORX is €20,000, so “small” losses are
obviously only relatively small when compared to the very large frauds that are
covered in the media.
Size of Losses by Business Line
When comparing the relative role of the different business lines,
there is also a marked difference in the ORX and FIRST data when comparing
the size of losses. For Figures 9 and 10 the ORX data has been mapped23 into
equivalent BIS lines to allow for a comparison with FIRST data. Similarly, all non-
BIS business line data have been removed from the FIRST data.
Figure 9: Percentage of Value of Losses to Date in ORX and FIRST Databases, by BIS Business Lines24

57
It is clear from this chart that while FIRST’s loss amounts are
dominated by Commercial Banking and then Retail Banking, in ORX the loss
amounts are more heavily weighted to the Retail Banking business line. In the
ORX database, Commercial Banking accounts for a smaller percentage of the
financial value of the losses. This is probably a reflection of the fact that recent
commercial banking events have made it into the press, and so into FIRST’s
data, while those firms might not be members of ORX.
ORX has an additional category “Corporate Items,” which it does
not map to a Basel business line. Events in this category are corporate-level
events such as the kidnapping of the CEO or fines for group-level financial
misreporting.
Number of Events by Business Line
Similarly, the number of events in the two databases can be
compared (see Figure 10).
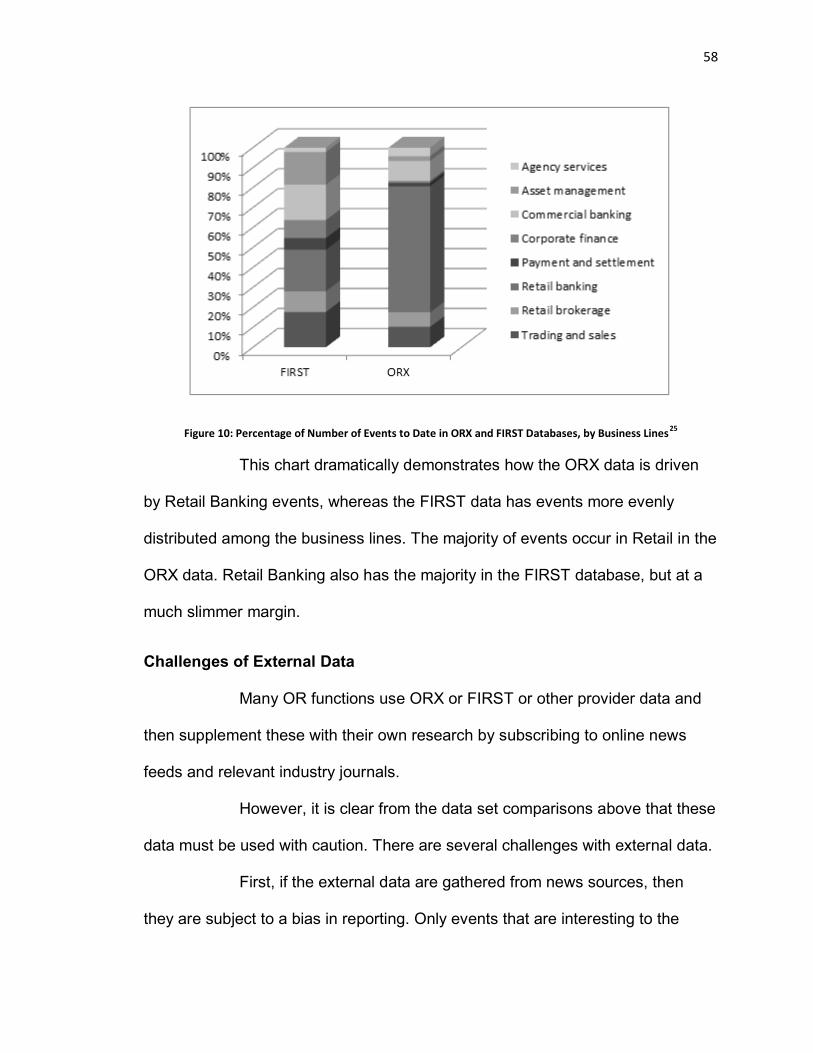
58
Figure 10: Percentage of Number of Events to Date in ORX and FIRST Databases, by Business Lines25
This chart dramatically demonstrates how the ORX data is driven
by Retail Banking events, whereas the FIRST data has events more evenly
distributed among the business lines. The majority of events occur in Retail in the
ORX data. Retail Banking also has the majority in the FIRST database, but at a
much slimmer margin.
Challenges of External Data
Many OR functions use ORX or FIRST or other provider data and
then supplement these with their own research by subscribing to online news
feeds and relevant industry journals.
However, it is clear from the data set comparisons above that these
data must be used with caution. There are several challenges with external data.
First, if the external data are gathered from news sources, then
they are subject to a bias in reporting. Only events that are interesting to the

59
press are reported in the press, resulting in a bias in favor of illegal and dramatic
events over errors. For example, a large fraud will receive intensive coverage,
while a major systems outage might not make it into any press report. It is also
unlikely that a major gain will make the press in the same way that a major loss
would, although the same lessons could be learned in both cases.
Second, it can be difficult to determine whether an event is
relevant. The fact that a firm has the same business line does not mean it could
have the same event occur, as it may have a different product or a stronger (or
weaker) control environment. Indeed, many external events might be ignored
simply because they “could not happen here” for one or many reasons. However,
external data are not best used to try to spot an exact event that should be
avoided, but rather to determine the types of errors and control failings that can
occur so as to avoid similar (rather than identical) losses.
Third, the use of benchmarked data relies on the quality of the
underlying data, and there may be a chance that the comparisons made are not
accurate due to a different interpretation of the underlying definitions.
However, if all of these challenges are acknowledged, then external
data have a very valuable role to play in operational risk management. It provides
insight into lessons that can be learned, prior to an event’s occurring at the firm.
It demonstrates that the size of an event may be beyond the initial estimation
made by the firm. It provides context and highlights trends in the industry.
Internal and external operational risk events provide a rich source of data on
what has already gone wrong. It is possible to use these data to implement
60
mitigating controls to prevent future repetitions of the same events. Moreover,
operational risk event data provide a valuable input into the other elements of the
operational risk framework that will be designed to predict potential events that
have not yet occurred.
Loss data provides useful examples for risk and control self-
assessment and scenario analysis discussions and analysis, as well as key risk
indicators (KRIs) that can indicate trends of losses and control weaknesses.
Impact to Share Value
One of the major drivers for strong operational risk management is
not the direct costs of the event that has occurred, but rather the negative impact
on share value.
The LIBOR Scandal
An operational risk event, where the cause is attributed to the
internal actions of a bank often gives rise high levels of reputational damage. The
LIBOR scandals of 2012 and 2013 tarnished the reputations of many banks.
It was alleged that several major banks had manipulated the LIBOR rate over an
extended period, in order to benefit financially from the altered rate. The brush
was quickly used to also tarnish other benchmark rates globally and regulators
from many nations became engaged in uncovering the breadth and depth of the
bad behavior.
Headlines from this period show the reputational wounds that were
inflicted on those involved, above and beyond the direct OR losses that they
suffered in direct fines.
61
Rigged Rates, Rigged Markets Marcus Agius, the chairman of Barclays, resigned on Monday, saying “the buck stops with me.” His was the first departure since the British bank agreed last week to pay $450 million to settle findings that, from 2005 to 2009, it had tried to rig benchmark interest rates to benefit its own bottom line. (Rosenthal, 2012) RBS Managers Condoned Libor Manipulation Royal Bank of Scotland Group Plc managers condoned and participated in the manipulation of global interest rates. (Bloomberg, 2012) UBS and LIBOR Horribly rotten, comically stupid. (J.R., 2012)
As a result of its role in the alleged LIBOR manipulation, Barclays
paid out $450 million in a settlement with the British and United States regulators
and lost its chief executive officer, Robert E. Diamond Jr.; its chairman, Marcus
Agius; and its chief operating officer, Jerry del Missier, along with many other key
senior managers.
It then suffered a ratings hit as both Standard and Poor’s (S&P) and
Moody’s rating agencies placed the firm on negative watch:
The abrupt changes alarmed the ratings agencies. Standard &
Poor’s said in its statement that “the negative outlook reflects our view of the
current management flux and near-term strategic uncertainty” (Scott, 2012).
In a separate statement, Moody’s said: “The senior resignations at
the bank and the consequent uncertainty surrounding the firm’s direction are
negative for bondholders” (Scott, 2012).
In addition, Barclays, along with many other alleged participants, at
the time of writing was facing multiple lawsuits from firms and individuals who
allege that the LIBOR manipulation impacted them adversely.

62
Charles Schwab Sues Banks Over Rate Manipulation Charles Schwab is seeking unspecified compensatory and punitive damages from the banks. Other defendants include foreign banks like Barclays, Credit Suisse, Deutsche Bank, HSBC Holdings, Royal Bank of Scotland, Lloyds, WestLB andUBS. - NY Times (Roose, 2011) Banks Rigged Libor To Inflate Adjustable-Rate Mortgages: Lawsuit Homeowners in the U.S. are suing some of the world’s biggest banks for fraud–not over any foreclosure issues but over the alleged Libor manipulation scam that they say sparked increases on their adjustable rate mortgages, and resulted in unlawful profits for the banks. - Forbes (Touryalai, 2012)
Finally, the threat of fines and lawsuits across the industry pushed
stock prices down.
Barclays Libor Fine Sends Stocks Lower as Probes Widen Barclays Plc (BARC)’s record $451 million fines for interest rate manipulation sent bank shares plunging as U.S. and U.K. authorities pursue sanctions in a global investigation of more than a dozen lenders. - Bloomberg (Gallu, Brush, & Fortado, 2012)
The scandal eventually spread to other banks involved in LIBOR,
and at the time of writing, the New York and Connecticut attorneys general had
16 banks under investigation on this issue: Bank of America, Bank of Tokyo
Mitsubishi UFJ, Barclays, Citigroup, Credit Suisse, Deutsche Bank, HSBC,
JPMorgan Chase, Lloyds Banking Group, Norinchukin Bank, Rabobank, Royal
Bank of Canada, Royal Bank of Scotland, Société Générale, UBS, and West LB.
In December 2012, UBS agreed to settle with regulators for a huge $1.5 billion in
total fines.
All of these banks faced the same reputational damage above and
beyond the regulatory dollar fines that they were likely to pay. They faced loss of
63
key personnel (who might also face jail time), credit downgrading, litigation, and
stock price devaluation.
A reputational risk event therefore results in multiple impacts
occurring, some of which are captured in a Basel II Pillar 1 framework, but some
might not be. Fines and litigation are captured in an operational framework as
they meet the definition of operational risk:
Operational risk is defined as the risk of loss resulting from inadequate or failed processes, people and systems or from external events. This definition includes legal risk, but excludes strategic and reputational risk. (Basel Committee for Banking Supervision, 2004)
Stock price losses, credit downgrades, and loss of key personnel
are not generally considered financial losses within this definition, and
reputational risk is expressly excluded. However, this does not mean these risks
should remain unmanaged or unmitigated.
As we saw earlier, the banking sector as a whole took a major
stock hit as a result of the widespread LIBOR scandal. Barclays themselves saw
an 18 percent slide during the early stages of the news breaking.
In 2004 Cummins, Lewis and Wei studied the market value impact
of operational loss announcements by US banks and insurance companies. They
concluded that equity values respond negatively to operational loss
announcements (Cummins, Lewis, & Wei, 2004).
In 2005, Perry and de Fontnouvelle completed a study on the
market reaction to operational risk announcements. They examined the
difference between internal fraud events and other events, on the assumption

64
that internal fraud events carry a much higher reputational impact than, for
example, execution errors.
They concluded that: “market values fall one-for-one with losses
caused by external events” (de Fontnouvelle & Perry, 2005) indicating the
significant impact of operational risk events on share value. Furthermore they
found that “market values fall…by over twice the loss percentage in cases
involving internal fraud.” suggesting operational risk is even more costly where
there is associated reputational impact.
A similar study was conducted in 2010 by Gillet, Hubner, and
Plunus. The authors examined 154 events coming from the FIRST database
Events occurred between 1990 and 2004 in companies belonging to the financial
sector and that are listed on the major European and US Stock
Exchanges. The authors analyzed stock market reactions to the announcement
of operational losses by financial companies, and also attempted to disentangle
operational losses from reputational damage. Their results showed:
… significant, negative abnormal returns at the announcement date of the loss, along with an increase in the volumes of trade. In cases of internal fraud, the loss in market value is greater that the operational loss amount announced, which is interpreted as a sign of reputational damage. (Gillet, Hübner, & Plunus, 2010)
The impact of an operational risk event on stock price can be seen
in the recent JPMorgan ‘Whale’ operational risk event.
JP Morgan Whale’s Impact on Stock Price26

65
In May 2012, JPMorgan announced that it had lost $2 billion
(eventually much more), on a hedging strategy that was being driven by Bruno
Michel Iksil, aka “The London Whale” in its chief investment office.
The headlines were witty and the event dominated the news for
months:
“London Whale Harpooned” - Forbes (Vardi, 2012) “JPMorgan’s ‘Whale’ Causes a Splash” - Financial Times (Schäfer & Makan, 2012) “Beached London Whale” (Yahoo, 2012)
Both the Wall Street Journal27 and Bloomberg28 raised concerns
about the size of Iksil’s trades earlier in April and hedge funds quickly responded
and set about taking the other side of his trades, betting that the Whale’s position
was outsized and unmanageable. Jamie Dimon, CEO and chairman of
JPMorgan, made comments that he certainly now regrets, calling the concerns
raised “a complete tempest in a teapot.”29 Jamie Dimon later admitted,
“In hindsight, the new strategy was flawed, complex, poorly reviewed, poorly executed, and poorly monitored. The portfolio has proven to be riskier, more volatile, and less effective as an economic hedge than we thought.” (WSJ Blog, 2012)
It became apparent that JPMorgan’s own risk management tools
were not working effectively, as Dimon added:
“We are also amending a disclosure in the first quarter press release about CIO’s VaR, value at risk. We’d shown average VaR at 67. It will now be 129.”30
VaR, or value at risk, is the strongest tool in the risk manager’s
arsenal, providing an indication of the actual current risk taking of the firm
66
measured against its expected levels of risk taking. JP Morgan shut down the
trading strategy four days after the news hit the press in April.
The SEC swiftly opened a review (NY Post, 2012) into the
accounting practices used by JPMorgan and the Justice Department opened a
criminal inquiry31 into the whole affair. Lawsuits32 also sprung up among
disgruntled JPMorgan shareholders.
This was a massive operational risk event. JPMorgan released two
reports of the event in January, 2102, one by an internal task force (Task Force
Report, 2013), and the other conducted independently by the board (JP Morgan
Board, 2013). In the task force report, they were transparent about their
operational risk failings, as summarized by Bloomberg:
In a 129-page report issued yesterday, the bank described an “error prone” risk-modeling system that required employees to cut and paste electronic data to a spreadsheet. Workers inadvertently used the sum of two numbers instead of the average in calculating volatility. The firm also reiterated an assertion that London traders initially tried to hide losses that ballooned beyond $6.2 billion in last year’s first nine months. (JP Morgan Halves Dimon Pay, 2013)
The share value impact of this event can be clearly seen in Figure
10. In the first 11 painful days after the event, JPM stock went from 40.64 to
32.51 and only recovered a little when all banks stocks got a boost on news of
good U.S. home sales. The data in Figure 11 was derived by comparing news
headlines with trade volume and share price data retrieved from Bloomberg and
shown in Table 6.
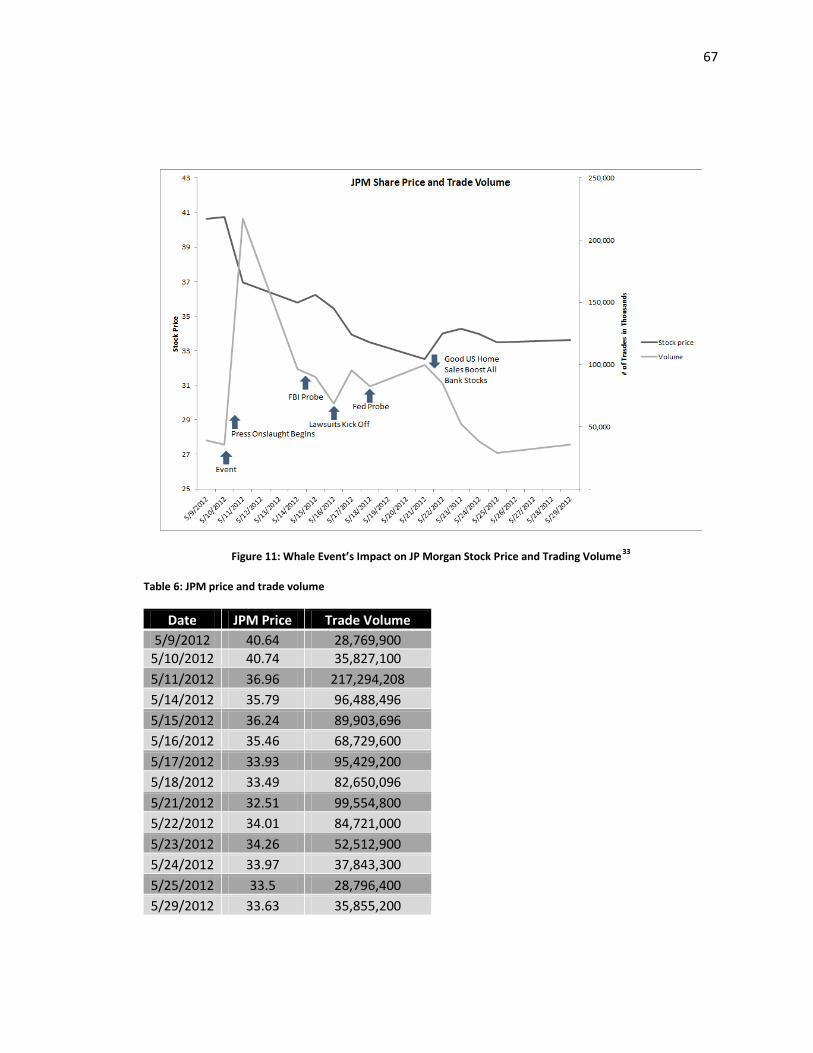
67
Figure 11: Whale Event’s Impact on JP Morgan Stock Price and Trading Volume33
Table 6: JPM price and trade volume
Date JPM Price Trade Volume 5/9/2012 40.64 28,769,900
5/10/2012 40.74 35,827,100 5/11/2012 36.96 217,294,208 5/14/2012 35.79 96,488,496 5/15/2012 36.24 89,903,696 5/16/2012 35.46 68,729,600 5/17/2012 33.93 95,429,200 5/18/2012 33.49 82,650,096 5/21/2012 32.51 99,554,800 5/22/2012 34.01 84,721,000 5/23/2012 34.26 52,512,900 5/24/2012 33.97 37,843,300 5/25/2012 33.5 28,796,400 5/29/2012 33.63 35,855,200

68
The cost of operational risk is clearly established, both in actual losses as recorded in FIRST and ORX and in the share value impact that events have on the firms that suffer those losses.
Chapter 4 proposes an operational risk framework that provides a firm with the tools needed to avoid losses, avoid share price impact and meet the Basel II regulatory requirement for operational risk management and measurement.
69
Chapter 4: Proposed Operational Risk Framework
Overview of the Operational Risk Framework
As discussed in Chapter 1, an operational risk program should
ensure that operational risk is identified, assessed, monitored, controlled and
mitigated. The Basel Committee on Banking Supervision’s 2011 “Sound
Practices for the Management and Supervision of Operational Risk” (Risk
Management Group of the Basel Committee on Banking Supervision, 2011)
provides helpful guidelines for best practices for operational risk departments.
When meeting these standards, an operational risk framework needs to be
developed that will fit with the culture of the bank and reflect best practice in the
industry.
The main data building blocks of an operational risk framework are:
Loss data collection
Risk and control self-assessment
Scenario analysis
Key risk indicators
The framework must also address governance, provide policies and
procedures, drive culture change, and respond to and inform risk appetite. In
addition, the framework should feed data into any capital modeling and should
feed data and analysis into risk reporting.
Figure 12 illustrates a possible framework that includes all of these
elements.
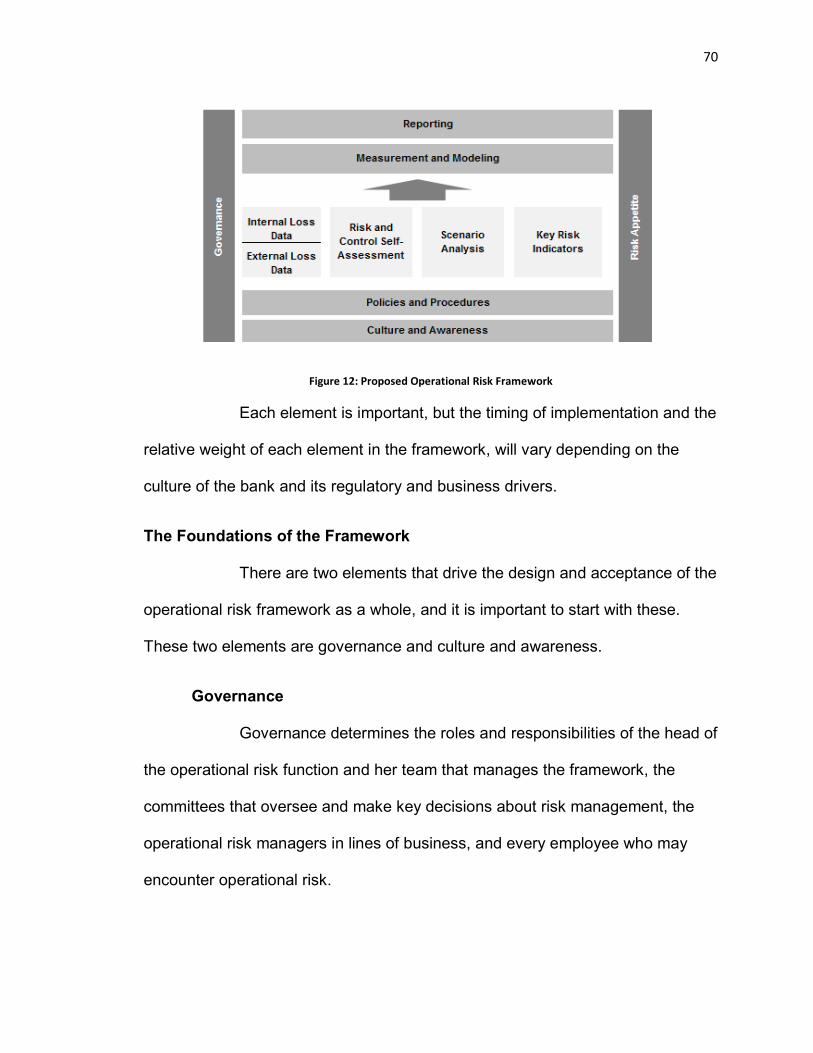
70
Figure 12: Proposed Operational Risk Framework
Each element is important, but the timing of implementation and the
relative weight of each element in the framework, will vary depending on the
culture of the bank and its regulatory and business drivers.
The Foundations of the Framework
There are two elements that drive the design and acceptance of the
operational risk framework as a whole, and it is important to start with these.
These two elements are governance and culture and awareness.
Governance
Governance determines the roles and responsibilities of the head of
the operational risk function and her team that manages the framework, the
committees that oversee and make key decisions about risk management, the
operational risk managers in lines of business, and every employee who may
encounter operational risk.
71
In order to develop an operational risk framework that is effective,
an appropriate governance structure must be carefully considered at the outset.
Governance should also be revisited at least annually, to check whether it is still
working as intentioned. Good governance enables the escalation of risk and
ensures that risk transparency is effective through all of the layers of operational
risk management that may exist.
Governance holds the whole operational risk framework together,
including who should own the operational risk functions, and what the operational
risk functions should own.
Culture and Awareness
Once governance has been addressed, the next step in developing
an operational risk framework is to proactively tackle culture and awareness.
While it may be tempting to jump into developing the building blocks of
operational risk management, such as loss data collection and risk and control
self-assessment, those building blocks will only be successful if sufficient time
and energy has been spent on culture and awareness.
The implementation of a successful operational risk framework
requires winning over the hearts and minds of the employees of the firm. Spotting
operational risks is a developed skill. While the risks exist in all lines of business,
it takes the right tone at the top, training and awareness to identify the risks.
Operational risk can arise in any corner of the firm and can result in best practice
responses, or may be met with indifference. The response will depend on the
work that has been done in the area of culture and awareness. It is necessary to

72
look at various aspects of this essential activity, including training, marketing, and
building a brand for the operational risk function.
Policies and Procedures
The next foundational element of the framework is policies and
procedures. There was a time, not that long ago, when banks and financial
institutions did not take their policy and procedure programs very seriously.
Today, that has changed dramatically under the watchful eye of the regulators.
Firms are expected to have clear, actionable, and measurable policies and
procedures.
Indeed, there is a trend in financial services to pay closer attention
to writing and actively managing policies and procedures. A well-managed policy
framework gives lines of business increased flexibility because the rules of the
road are not ambiguous. Having well-managed policies and procedures gives a
financial firm a head start and increased autonomy when interacting with
regulators. A good operational risk framework will have well documented policies
and procedures that reflect the requirements of each of the elements.
The Four Data Building Blocks
With governance, culture and awareness, and policy and
procedures holding the framework together, we can now turn to the four main
pieces of work that are needed in order to have an effective operational risk
framework: loss data collection, risk and control self-assessment, scenario
analysis, and key risk indicators.

73
Loss Data Collection
There are two types of loss data that are key to the framework:
internal loss data, which occurs within the firm, and external loss data, which
occurs outside the firm.
Internal Loss Data
Operational risk management and measurement require access to
data on events that have already occurred in the firm, and in the industry and
loss data collection is the first of four activities that form the heart of an
operational risk framework. The firm’s own data is referred to as internal loss
data, while industry data is referred to as external loss data.
Developing an effective set of internal loss data is often the first
major task faced when building out an operational risk framework. Basel II
requires a firm to have at least three years of internal loss data in order to pursue
an advanced measurement approach. Therefore, loss data collection needs to be
quickly established, and carefully implemented to ensure good quality data is in
place.
If loss data collection is started before appropriate governance is
established and before culture and awareness have been addressed, then the
data collected is likely to be lower quality.
External Loss Data
Operational risk events that have occurred in the industry (but
outside the firm) are very important in understanding the operational risk faced by
74
the firm. Therefore, the collection and analysis of external loss data is a key
element in an effective loss data program.
There are regulatory requirements regarding the use of external
data in an advanced measurement approach, but the lessons learned from peers
are valuable beyond those requirements. External data help inform risk and
control self-assessment and scenario analysis and are often an important
component in effective reporting.
Risk and Control Self-Assessment
The second of the four main building blocks of operational risk
management activity is risk and control self-assessment (RCSA). Risks and
controls are identified and assessed through RCSA, with a view to controlling
and mitigating any unacceptable risks.
While loss data tells us what has already happened, RCSA is
designed to help us to understand what risks we face today. Loss data are
backward looking, but RCSA looks at risk levels now.
The RCSA might be the most important part of the framework
because it addresses the requirements that we first looked at in Chapter 1.
Those requirements are that the operational risk framework should identify,
assess, control, and mitigate risk.
While loss data allow us to identify and assess risks that have
occurred and to consider how to control and mitigate those risks in the future,
RCSA allows us to identify all risks, not just those that have already materialized.
Loss data is about hindsight. Risk and control self-assessment is about foresight.

75
Scenario Analysis
The third activity in the framework is scenario analysis. Unlike risk
and control self-assessment, scenario analysis is only looking for rare,
catastrophic risks. It is focused on identifying plausible risks that are so large as
to be potentially fatal or severely destructive to a firm.
Scenario analysis stresses the operational risk framework and
pushes participants to think outside their comfort zone. RCSA centers on
discussions of the risks that are faced and the controls that are in place, whereas
scenario analysis requires participants to consider what could happen if there is a
serious failure of controls or a previously unassessed combination of risks.
Scenario analysis is a challenging area, and many firms struggle
with meeting the regulatory requirements while retaining business value in the
process.
Key Risk Indicators
The final building block of operational risk data gathering is key risk
indicators. Operational risk practitioners sometimes use the terms key risk
indicator and metric interchangeably; however, they are quite different. Metrics
provide an important monitoring function across the framework and they can be
attached to loss data and to risks or controls in risk and control self-assessment
and can provide useful input to scenario analysis. Metrics also provide
information for the business environment internal control factors that are required
for an advanced measurement approach.

76
A key risk indicator predicts that a risk is changing and would allow
for proactive intervention. It is difficult to find metrics that are true key risk
indicators or can be combined to form a key risk indicator, because many metrics
are simply counting exceptions or measuring performance, rather than
measuring an increase or decrease in risk levels.
Measurement and Modeling
Once the four data-gathering building blocks of loss data, risk and
control self-assessment, scenario analysis and key risk indicators are in place,
then operational risk can be measured and modeled.
An advanced measurement approach capital calculation requires
the following four elements: internal loss data, external loss data, scenario
analysis, and business environment internal control factors. The latter can be
gathered from risk and control self-assessment and from key risk indicators.
Reporting
All of the above elements feed into operational risk reporting.
Without effective reporting, the operational risk framework is a factory that is
busy making data widgets that are not used. Reporting gathers all of the
information that has been collected and analyzed in the loss data program, the
RCSA program, the scenario analysis program, the metrics program, and the
capital modeling program and puts it to use.
The quality of reporting is critical to the success of an operational
risk framework. Reporting that leaves its audience asking “so what?” is of little
value. Reporting that asks its audience to think or say or do something is of great
77
value. It is essential to provide reporting that is not data gathering, but instead
provides risk analysis and risk transparency and that leads to better business
decision making.
Risk Appetite
Finally, the whole framework is held together by risk appetite. It is
difficult, but not impossible, to express a risk appetite for operational risk. It often
takes time for an operational risk framework to mature to the stage where risk
appetite can be effectively discussed and agreed upon.
While governance is the first pillar or support for the framework, risk
appetite is its partner. Effective governance requires a clear articulation of risk
appetite, and risk appetite can be set only when strong governance is in place.
Conclusion
The effective identification, assessment, monitoring and mitigation
of operational risk is vital to the financial health of the financial services industry.
The cost of direct losses and the impact of operational risk events on share value
is clearly established. Therefore, a robust operational risk management and
measurement framework should be embedded in all large financial institutions.
The proposed framework attempts to address Basel II regulatory requirements,
the Sound Practices recommendations, the US Federal Reserve and OCC rules
and the risk management needs of senior management.

78
Bibliography
Basel II Capital Accord: Notice of Proposed Rulemaking. (2006, September 5). Retrieved from Federal Reserve Web Site: http://www.federalreserve.gov/GeneralInfo/Basel2/NPR_20060905/NPR/
Risk-Based Capital Standards: Market Risk. (2006, September 25). Retrieved from Federal Reserve Web Site: http://www.federalreserve.gov/newsevents/press/bcreg/bcreg20060905a1.pdf
Risk-Based Capital Standards: Advanced Capital Adequacy. (2007, November 2). Retrieved January 30, 2013, from Federal Reserve Press Releases: www.federalreserve.gov/newsevents/press/bcreg/20071102a.htm.
(2009). Summary: Restoring American Financial Stability. Washington, DC: Senate Committee on Banking, Housing, and Urban Affairs.
G20 Must Make Basel III Top Priority. (2010, April 20). Retrieved from Reuters Web Site: www.reuters.com/article/idUSTRE63J2QU20100420
Basel II: Revised International Capital Framework. (2012, September 30). Retrieved from Bank of International Settlements Web Site: www.bis.org/publ/bcbsca.htm
Deal Journal. (2012, April 6). Retrieved from Wall Street Journal: http://blogs.wsj.com/deals/2012/04/06/deals-of-the-day-meet-j-p-morgans-london-whale/?KEYWORDS=jp+morgan+whale.
JP Morgan Halves Dimon Pay. (2013, January 16). Retrieved from Bloomberg Web Site: www.bloomberg.com/news/2013-01-16/jpmorgan-halves-dimon-pay-says-ceo-responsible-for-lapses-1-.html.
Task Force Report. (2013). Retrieved from http://files.shareholder.com/downloads/ONE/2665183328x0x628656/4cb574a0-0bf5-4728-9582-625e4519b5ab/Task_Force_Report.pdf
About BIS. (n.d.). Retrieved January 20, 2013, from Bank of International Settlements Web Site: http://www.bis.org/about/index.htm
About IBM Algo FIRST. (n.d.). Retrieved from IBM Web Site: http://pic.dhe.ibm.com/infocenter/op/v6r2m1f0/index.jsp?topic=%2Fcom.ibm.swg.ba.cognos.OP_ORM_Module_Overview.6.2.1.doc%2Fc_oppm_orm_about-algo-first.html

79
Balin, B. J. (2008). Basel I, Basel II, and Emerging Markets: A Non-Technical Analysis. Washington DC: Johns Hopkins University School of Advanced International Studies (SAIS).
Bank of International Settlements. (n.d.). BIS Activities. Retrieved January 20, 2013, from Bank of International Settlements Web Site: http://www.bis.org/about/functions.htm
Basel Committee for Banking Supervision - Resilience. (2009). Strengthening the Resilience of the Banking Sector : Consultative Document. Basel: Bank of International Settlements.
Basel Committee for Banking Supervision. (1988). International Convergence of Capital Measurement and Capital Standards. Basel: Bank of International Settlements.
Basel Committee for Banking Supervision. (2004). International Convergence of Capital Measurement and Capital Standard, A Revised Framework. Basel: Bank of International Settlements.
Basel Committee for Banking Supervision. (2006). International Convergence of Capital Measurement and Capital Standards, A Revised Framework, Comprehensive Version. Basel: Bank of International Settlements.
Basel Committee on Banking Supervision - Liquidity. (2009). International framework for Liquidity Risk, Measurement, Standards and Monitoring. Basel: Bank of International Settlements.
Basel Committee on Banking Supervision,. (2011). Operational Risk – Supervisory Guidelines for the Advanced Measurement Approaches. Basel: Bank of International Settlements.
Bloomberg. (2012, September 24). RBS managers said to condone manipulation of LIBOR. Retrieved September 30, 2012, from Bloomberg Business Week Web Site: http://www.businessweek.com/news/2012-09-24/rbs-managers-said-to-condone-manipulation-oflibor-rates
Board of Governors of the Federal Reserve. (2011, June 3). OCC Bulletins. Retrieved 2012, from www.occ.gov: http://www.occ.gov/news-issuances/bulletins/2011/bulletin-2011-21a.pdf
CEBS Consultation Paper. (2005). Application of the Supervisory Review Process under Pillar 2 (CP03 revised). Brussels: Committee of European Banking Supervisors.
Citi. (2011). Annual Report.
Committee of European Bank Supervisors. (2010). Compendium of Supplementary Guidelines on implementation issues of operational risk. European Banking Authority.
Committee of European Banking Supervisors. (2009). Guidelines on the Scope of Operational Risk and Operational Risk Loss. Retrieved from European Banking Authority:
80
http://eba.europa.eu/getdoc/0448297d-3f85-4f7d-9fa6-c6ba5f80895a/CEBS-2009_161_rev1_Compendium.aspx.
Committee of European Banking Supervisors. (2010, October). Guidelines on the Management of Operational Risk in Market Related Activites. Retrieved from European Banking Authority Web Site: www.eba.europa.eu/documents/Publications/Standards---Guidelines/2010/Management-of-op-risk/CEBS-2010-216-(Guidelines-on-the-management-of-op-.aspx.
Cox Testimony. (2010, April 20). Statement of Christopher Cox Former Chairman, U.S. Securities and Exchange Commission before the Committee on Financial Services U.S. House of Representatives. Retrieved August 15, 2012, from United States House of Representatives Web Site: www.house.gov/apps/list/hearing/...dem/cox_testimony_2010-04-20.pdf
Cummins, D. J., Lewis, C. M., & Wei, R. (2004). The Market Value Impact of Operational Losses For U.S. Banks and Insurers. Unpublished Working Paper. (referenced in Perry & Fontnouvelle).
Davis Polk. (2009). Summary of the Restoring American Financial Stability Act of 2009, Introduced by Senator Christopher Dodd (D-CT) November 10, 2009 Discussion Draft. New York: Davis Polk.
de Fontnouvelle, P., & Perry, J. (2005). Measuring Reputational Risk: The Market Reaction to Operational Loss Announcements. Retrieved August 30, 2012, from Boston Federal Reserve Web Site: http://www.bostonfed.org/bankinfo/qau/research/papers/jppd1005.pdf
Department of the Treasury. (2009). A New Foundation: Rebuilding Financial Supervision and Regulation. Washington, DC: Treasury.
Deutsche Bank . (2011). Financial Report.
Dodd-Frank. (2012, September 30). Dodd-Frank Wall Street Reform and Consumer Protection Act. Retrieved from US Government Printing Office Web Site: http://www.gpo.gov/fdsys/pkg/PLAW-111publ203/html/PLAW-111publ203.htm
European Community. (2006). Directive 2006/48/EC .
European Community. (2006). Directive 2006/49/EC.
Fact Sheet—Basel Committee on Banking Supervision. (n.d.). Retrieved August 30, 2012, from Bank of International Settlements Web Site: www.bis.org/about/factbcbs.htm.
Federal Reserve. (2007). Supervisory Guidance: Supervisory Review Process of Capital Adequacy (Pillar 2) Related to the Implementation of the Basel II Advanced Capital Framework.
81
Gallu, J., Brush, S., & Fortado, L. (2012, June 28). Barclays Libor Fine Sends Stocks Lower as Probes Widen. Retrieved November 30, 2012, from Bloomberg Web Site: http://www.bloomberg.com/news/2012-06-28/barclays-451-million-libor-fine-paves-the-way-forcompetitors.html
Gillet, R., Hübner, G., & Plunus, S. (2010). Operational risk and reputation in the financial industry. Journal of Banking & Finance, 224–235. Retrieved from y, R.Gillet, G. Hubner, S. Plunus, 2010 http://
Gustin, S. (2012, May 17). JPMorgan’s ‘London Whale’ Loss Rises to $3 Billion as Lawsuits Fly. Retrieved from Time Web Site: http://business.time.com/2012/05/17/jpmorgans-london-whale-loss-rises-to-3-billion-as-lawsuits-fly/.
History of the Basel Committee and its Membership. (n.d.). Retrieved January 30, 2013, from Bank of International Settlements Web Site: http://www.bis.org/bcbs/history.htm
J.R. (2012, December 19). UBS and LIBOR: Horribly rotten, comically stupid. Retrieved January 30, 2013, from The Economist Blogs: http://www.economist.com/blogs/schumpeter/2012/12/ubs-and-libor
JP Morgan . (2012, May 5). Business Update Call Transcript. Retrieved from http://i.mktw.net/_newsimages/pdf/jpm-conference-call.pdf.
JP Morgan. (2008). Annual Report.
JP Morgan. (2012, January 16). Report of JPMorgan Chase & Co. Management Task Force Regarding 2012 CIO Losses. Retrieved August 30, 2012, from Bloomberg Web Site: http://media.bloomberg.com/bb/avfile/rM8QB5s4.Eoc
JP Morgan Board. (2013, January 15). Board Review Committee Report. Retrieved from JP Morgan: http://files.shareholder.com/downloads/ONE/2665183328x0x628655/752f9610-b815-428c-8b22-d35d936e2ed8/Board_Review_Committee_Report.pdf
Madigan, P. (2009). SEC adoption of Basel II "allowed 30-to-1 leverage". Risk Magazine.
NY Post. (2012). JP Morgan Trading Loss Leads to SEC. Retrieved from NY Post Web Site: www.nypost.com/p/news/business/jpmorgan_trading_loss_leads_to_us_JYULwjSYhaCot9ZrdoakUM.
Office of the Comptroller of the Currency. (2011). Interagency Guidance on the Advanced Measurement Approaches for Operational Risk. Washington, DC: OCC.
Reuters. (2012, May 18). JP Morgan Crisis Communications. Retrieved from Reuters Web Site: www.reuters.com/article/2012/05/18/us-jpmorgan-crisiscommunications-idUSBRE84H05G20120518.

82
Risk Management Group of the Basel Committee on Banking Supervision. (2003). Sound Practices for the Management and Supervision of Operational Risk. Basel: Bank of International Settlements.
Risk Management Group of the Basel Committee on Banking Supervision. (2011). Sound Practices for the Management and Supervision of Operational Risk. Basle: Basle Committee.
Risk Management Group of the Basel Committee on Banking Supervision. (2011). Sound Practices for the Management and Supervision of Operational Risk. Basel: Bank of International Settlements.
Roose, K. (2011, August 25). Charles Schwab Sues Banks Over Rate Manipulation. Retrieved August 30, 2012, from NY Times Dealbook Web Site: http://dealbook.nytimes.com/2011/08/25/charles-schwab-sues-banks-over-rate-manipulation/
Rosenthal, A. (2012, July 3). Rigged Rates, Rigged Markets. Retrieved August 30, 2012, from New York Times Opinion Pages: http://www.nytimes.com/2012/07/03/opinion/rigged-rates-rigged-markets.html?_r=0
Ruhle , S. (2012, April 9). London's Biggest Whale. Retrieved from Bloomberg Web Site: www.bloomberg.com/news/2012-04-09/london-s-biggest-whale.html.
Schäfer , D., & Makan, A. (2012, May 11). JPMorgan’s ‘whale’ causes a splash. Retrieved from Financial Times Web Site: www.ft.com/cms/s/0/fbab63ae-9b72-11e1-b097-00144feabdc0.html#axzz1x77Fp2ct.
Scott, M. (2012, July 5). Interest Rate-Fixing Scandal Puts Barclays at Risk With 2 Ratings Agencies. Retrieved September 30, 2012, from NY Times Dealbook Web Site: http://dealbook.nytimes.com/2012/07/05/attention-turns-to-barclays-future/
Securities Exchange Commission. (June 21, 2004). Net Capital Rule Amendments., Release No. 34-49830, 69 Fed. Reg. 34427.
Securities Exchange Commission Press Release. (2008). Chairman Cox Announces End of Consolidated Supervised Entities. Retrieved August 30, 2012, from Securities Exchance Commission Web Site: http://www.sec.gov/news/press/2008/2008-230.htm
Senate Committee on Banking, Housing, and Urban Affairs. (2009). Summary: Restoring American Financial Stability.
Société Générale. (2008). Mission Green Investigatory Report. Paris: Société Générale.
The Basel Committee on Banking Supervision. (2010). Principles for enhancing corporate governance. Basel: Bank of International Settlements.

83
Touryalai, H. (2012, October 15). Banks Rigged Libor To Inflate Adjustable-Rate Mortgages: Lawsuit. Retrieved November 30, 2012, from Forbes Web Site: http://www.forbes.com/sites/halahtouryalai/2012/10/15/banks-rigged-libor-to-inflate-adjustable-rate-mortgages-lawsuit/
Vardi, N. (2012, May 16). London Whale Harpooned: Iksil On His Way Out At JPMorgan. Retrieved from Forbes Web Site: www.forbes.com/sites/nathanvardi/2012/05/16/london-whale-harpooned-iksil-out-at-jpmorgan
Wall Street Journal. (2012). Retrieved from Wall Street Journal: http://online.wsj.com/article/SB10001424052702304192704577406093989791910.html.
WSJ Blog. (2012, May 10). Whale of a Call: Dimon’s Notable Quotes. Retrieved from Wall Street Journal Web Site: http://blogs.wsj.com/deals/2012/05/10/whale-of-a-call-dimons-best-quotes/.
Yahoo. (2012). Beached London Whale Loses 2 Billion. Retrieved from Yahoo: http://news.yahoo.com/beached-london-whale-loses-2-billion-j-p-213300751--finance.html.
1 Footnote 90, (Basel Committee for Banking Supervision, 2004). 2 S644, (Basel Committee for Banking Supervision, 2004). 3 Annex 9, (Basel Committee for Banking Supervision, 2004). 4 “About BIS” 5 Central bank and lead financial regulatory representatives from France, Germany, Italy, Japan, the Netherlands, Sweden, Switzerland, the United Kingdom, the United States, and Luxembourg. 6 Argentina, Australia, Belgium, Brazil, Canada, China, France, Germany, Hong Kong SAR, India, Indonesia, Italy, Japan, Korea, Luxembourg, Mexico, Netherlands, Russia, Saudi Arabia, Singapore, South Africa, Spain, Sweden, Switzerland, Turkey, United Kingdom, United States. (Fact Sheet—Basel Committee on Banking Supervision) 7 (Basel Committee for Banking Supervision, 1988) 8 (Basel Committee for Banking Supervision, 2004), p.144. 9 (Basel Committee for Banking Supervision, 2004) p.204. 10 Comprising (European Community, 2006) and (European Community, 2006) 11 Sourced from online loss data service provider and reproduced with permission of Reproduced with permission of IBM® Algo FIRST®. 12 Investigatory report published on February 20, 2008, by Société Générale (Société Générale, 2008) 13 Updated report published May 20, 2008 14 Sourced from online loss data service provider and reproduced with permission of IBM® Algo FIRST®. 15 Sourced from online loss data service provider and reproduced with permission of IBM® Algo FIRST®. 16 IBM® Algo FIRST® for Web Edition on Cloud. Property of IBM. 5725-H59 © Copyright IBM Corp.

84
and others 1992, IBM, the IBM logo, ibm.com, Algo FIRST, and Algorithmics are trademarks of IBM Corporation, registered in many jurisdictions worldwide. 17 SAS also has a subscription database available. 18 Source: IBM® Algo FIRST® for Web Edition on Cloud, Q4 2012. 19 IBM® Algo FIRST®, 2012, 4th Quarter Overview, nonoperational risk categories removed. 20 See note 34. 21Sources: ORX Report, 2012 and FIRST Database, 2012 - 4th Quarter Overview, nonoperational risk categories removed. 22 Sources: ORX Report, Q4 21012 and FIRST Database, Q4 2012. 23Clearing has been renamed Payment and Settlement, and Private Banking has been included in Retail Banking and items mapped to corporate items have been removed. 24 Sources: ORX Report, Q4 2012, and FIRST Database, Q4 2012. 25 Sources: ORX Report, Q4 2012, and FIRST Database, Q4 2012. 26 Extract from blog posted by Philippa Girling at www.pxgassociates.com, reproduced with permission. 27 (Deal Journal, 2012) 28 (Ruhle , 2012) 29 Reported by Reuters: (Reuters, 2012) 30 A full transcript of the call is available at (JP Morgan , 2012) 31 As reported in the Wall Street Journal (Wall Street Journal, 2012) 32 As reported in Time (Gustin, 2012)

RESUME Philippa Girling Email [email protected] 128 Cooper Ave Phone 973 460 2745
Montclair, NJ 07043 BIO SUMMARY AND KEY SKILLS
Global Operational Risk Manager
Attorney: Banking & Financial Services
Eighteen years’ experience in global financial services industry.
Recognized industry expert on operational risk and regulatory developments.
Experienced in operational risk, information security, business continuity, risk and insurance, new product approval and law.
Experienced in strategic and operational business transformation providing extensive support, structure, motivation and business process reengineering techniques
Twenty years’ experience in project management. Advanced in the tools of project management and the processes involved in the successful completion of a project.
Experienced in Basel II regulatory requirements and recent global regulatory developments
Goal-oriented, profit driven, pragmatic and conscientious, a natural communicator with passion and enthusiasm in business transformation and change.
Team skills, calmness and confidence in presentation and negotiation at all levels, able to establish and maintain good business relationships at all levels and across different cultures. Natural motivator and mentor.
Enterprising, focused and flexible business style with rapid acquisition of new scenarios.
In all a strong communicator and leader with absolute integrity and high standards of business ethics.
SELECTED ACHIEVEMENTS
Global Head of Operational Risk and Business Chief Risk Officer for Global Financial Services Firms.
Established new Operational Risk Department for three major international financial institutions.
Built new banking and financial services legal practice for established law firm.
Authored two Operational Risk textbooks.
Frequent public speaker on Operational and Regulatory Risk.
Adjunct professor in Masters level and Executive Management Operational Risk courses for Columbia Business School, University of Connecticut, Rutgers University and London Business School.
Holder of NY Bar and Financial Risk Manager (FRM) qualifications.
Successfully led project management consultancy firm for 5 years, specializing in strategic and operational project management consulting to the financial services industry
Successfully designed and implemented two large training organizations and a global in house training program.
Leader in the industry: chair of SIFMA Operational Risk Committee, Chair of Data Issues sub-group of AMAG, member of NY Steering Committee and Ethics Committee of PRMIA, Board Member of committee of Women’s Bond Club of NY.
Recognized in 2009 by Op Risk and Compliance magazine as one of the decade’s “Top Fifty Faces of Operational Risk”.
WORK EXPERIENCE
CAPITAL ONE COMMERCIAL BANK Business Chief Risk Officer 1/2013 - current
Head of Commercial Banking Business Risk Office
Leading teams for business continuity management, information security, third party risk management, operational risk management, compliance control monitoring, audit management, regulatory exam management to meet Basel II requirements and business non-credit risk management needs.
MORGAN STANLEY Acting Global Head of Firmwide Operational Risk 9/2011 – 8/2012
Responsible for governance, policy and oversight for Operational Risk.
Lead PMO for Basel OR PMO.
Managed team of 35.
Responsible for OR regulatory exams and internal audits.
Responsible for quarterly reporting cycle to Firm Risk Committee and Board.
Responsible for independent assessment of operational risk exposure in all business units.
Responsible for validation of effectiveness of OR framework and alignment of model and management.
Global Chief Operating Officer, FHC Governance and Assurance 4/2010 – 9/2011
Department of 200 people including Operational Risk, Business Continuity Management, Information Security, Insurance, Environmental Risk, New Product Approval, Policy Office and Financial Holding Company Program Management.
Manage strategic planning and $75m budget process for department.
Established and managed departmental PMO, including coordinating regulatory and audit responses
Managed departmental administration and operations.
Established departmental brand.
Responsible for identifying and leading strategic cross-departmental initiatives, including metrics, issue and action tracking, and multiple assessments, leading to an integrated technology solution.
Sponsored and managed integrated IT initiative, including vendor assessment, RFP process and proof of concept.
Sponsored and managed firm wide risk and control taxonomy project.
Responsible for identifying and implementing coverage integration activities across the department.
Established and managed communication, networking, training and development activities across the department
Lead role in regulatory exams and audits
GARRITY, GRAHAM, MURPHY, GAROFALO & FLINN P.C. 6/2008 – 4/2010 Of Counsel
Headed a new banking and financial services group within the law firm.
Responsible for the development and management of a legal services practice specializing in banking and financial services sector

Provided management consulting in operational, strategic and geopolitical risk management NOMURA HOLDING AMERICA, NY 4/2006 – 6/2008 Global Co-Head of Operational Risk Management Established new Firm-Wide Operational Risk department including:
Recruited teams in NY and London
Designed and developed global strategic plan for Operational Risk and developed and managed implementation plan for new Operational Risk Framework including:
Basel II AMA compliance; Governance; Culture and awareness; Policy and procedures; Loss data collection; Risk and control self assessment; Scenario analysis; Key risk indicators; Reporting
Managed new product approval process
Managed RFP and vendor selection process for global OR system
Designed and implemented scenario analysis and facilitated workshops
Developed pilot capital model based on scenario analysis
Designed and lead training and facilitation sessions MORGAN STANLEY 5/2003 – 4/2006 Program Director, Firm Operational Risk Dept Established new Firm-wide Operational Risk department including:
Recruited full team
Established workstreams for RCSA, Loss Data, Reporting, Technology and Measurement
Managed strategic development and structure of department
Planned for Basel II SEC CSE and London FSA regulatory compliance
Developed coverage model
Coverage lead for Finance, Law and Compliance Divisions
Managed department budget and coordination of department activity
Managed OR communications throughout firm
Lead on RCA workstream, including designing and leading RCA workshops
Developed and delivered OR training across the firm
Participated in industry working groups and events as representative for Morgan Stanley
COO, Firm Financial Control Group Provided structure, direction and facilitation for intra-divisional activities including:
Developed and managed operational risk framework for Finance Division
Established and managed Basel II PMO for Financial Control Group Division
Designed and delivered IT project prioritization strategy
Designed and managed ‘people agenda’ communications, including new website and newsletter for 2000 employees
Coordinated senior management meetings and deliverables CAO, Retail Financial Control Group
Provided structure, direction and facilitation for Retail FCG activities including:
Developed and managed project management framework for Finance Division
Coordinated integration and SOX project activities
Coordinated senior management meetings and deliverables CREDIT SUISSE GROUP, Zurich, Switzerland: Senior Project Advisor, 6/2001 – 2/2002
Provided strategic consulting to the global IT advisory group on Knowledge Management. Liaised with senior IT executives globally.

PHILIPPA EVANS ASSOCIATES, NY: President/Senior Consultant, 3/1996 – 5/2001 Placed self at Morgan Stanley and Credit Suisse. Placed others as project management and project analyst consultants in financial services placements. Grew revenue to $850,000. Personal assignments included:
Senior Project Advisor, Morgan Stanley, NY 10/1997 - 12/2000
Balanced Scorecard: Senior Project Advisor to the Balanced Scorecard Project in MSDW Institutional Securities Infrastructure. Participated in strategic development of scorecard.
Y2k: Senior Project Advisor responsible for the development of effective reporting package for the integration testing and event management phases of the Y2k project.
Facilitation: provided strategic and planning meeting facilitation
Project Office Design: responsible for the research and development of appropriate project management tools for Operations globally.
Project Resource Management: responsible for the design of effective Operations Program Office reporting to alert Operations to potential human resource red flags.
End User Training: responsible for the design and implementation of an effective End User Computing training program that would facilitate organizational change in the Operations department worldwide.
Consultant, Credit Suisse, Zurich/Switzerland 3/1996 - 6/1996
Responsible for project to develop new international training strategy for a mainframe banking application.
CITYMAX LTD, (subs of Credit Suisse), London, UK: Head of Training, 3/1995 - 3/1996
Responsible for project managing the launch and marketing of a new external IT training services division. Implemented internal project management training program. Team leader responsible for selection, development and management of members of successful team.
SOUTH BANK UNIVERSITY, London, UK: Head of Training, 3/1993 - 3/1995
Responsible for a two year project: launching, managing and internally marketing the organization's new technology training and development program and facilities. Successfully managed training of over 2000 university staff and delivery of over 200 courses within two years. Personally delivered over 30 different training courses.
EUROPEAN SEMINARY OF BUSINESS AND LAW, Northampton, UK: Director9/1991 - 10/1992
Director, responsible for the development and delivery of training in pan-European business methods and strategies.
MACABILITY, Singapore: Director 10/1989 - 7/1991
Consultant in Singapore, project managing and programming software solutions and providing training for the business and education sectors.
EDUCATION Dates Qualification
2/2007 Financial Risk Manager (FRM) 11/2004 New York Bar 6/1995 Post Graduate Diploma in International Business
South Bank University, London, UK 6/1987 LLB (Hons) Law Degree University of East Anglia, London, UK

AFFILIATIONS Member of Global Association of Risk Professionals (GARP) Member of Professional Risk Manager International Association (PRMIA) Member of New York City Bar Member of American Bar Association (ABA) Board Member of Women’s Bond Club Chair of SIFMA Committee on Operational Risk Chair of AMAG Sub-Group on Data Issues