the relationship between price volatility, maturity and...
TRANSCRIPT
The Relationship Between Price Volatility, Maturity and Volume of Trade of the Malaysian Bond Market
Rubayah Binti Yakob Liza Marwati Binti Mohd Yusoff
Fauzias Binti Mat: Nor
Kajian ini Cuba untuk nzembuat eksplorasi ke atas kesan tempoh matang dan volum dagangan ke atas kemeruapan pasaran bon Malaysia. Bon MGS, Cagamas clan Korporat yang aktif didagangkan merupakan data yang digunakan di dalam kajian ini. Perhubungan di antara pembolehubah-pembolehubah ini seterusnya dicerap dengan menggunakan analisa regresi. Tempoh kajian ini debahagaikan kepada tiga tempoh iaitu tempoh krisis (Mac 1996-Jun I997), tempoh semasa krisis sebelum pegging (Julai 1997-Ogos 1998) dan tempoh krisis selepas pegging (September 1998-Mac 1999). Adalah didapati bahawa tidak wujud perhubungan di antara kemeruapan harga dan tempoh matang bagi bon MGS dan Cagamas tetapi bagi bon Korporat, perhubungan di antara pembolehitbah tersebut adalah positif dalam semua tempoh masa. Keputusan kajian juga mentrnjukkan bagi bon Korporat apabila volum dagangan dimasukkan ke dalam persamaan regwsi, perhubungan di antara tempoh matang dan kemeruapan harganya menjadi tidak signijikan kecuali bagi tempoh semasa krisis sebeltini pegging.
Kata kunci: Kemeruapan, portfolio bon, harga bon, analisis matematik dan tempoh matang. Key words": Volatility, bond portfolio,, bond price, mathematics anaLysis and term to maturity
Introduction
A lot of previous studies discussed on the determinants of bond price volatility. One of the more common and accepted generalizations in the mathematics of bond prices is that for a given change in yield, the fluctuations in the market price will be greater the longer the term to maturity, Freund (1970). It will be useful to review Malkiel s (1962,1965) five theorems as these theorems are well-known preliminary relationship between yield changes and bond price movements. Theorem one states that bond price move inversely to bond yields. Theorem two states that for a given change in yield fiom the nominal yield, changes in bond prices are greater, the
51
Malaysian Bond Market
longer is the term to maturity. Theorem three states that the percentage price changes described in theorem two increase at a diminishing rate as years to maturity increase. Theorem four states that results from an equal-sized increase or decrease in a bond’s yield is asymmetrical or to be more specifically, for any given maturity, a decrease in yields causes a price rise that is larger than the price loss that results from an equal increase in yields. Theorem five states that the higher is the coupon carried by the bond, the smaller will be the percentage price fluctuation for a given change in yield except for one-year securities and consoles’. Mathematically, Malkiel had proven the theory. Similar statements may be found in almost every investment book discussing the mechanics of bond pricing. The study by Fuller and Settle (1984) investigates the relationship between duration and bond volatility. In their study, the volatility of bonds are determined by the bonds’ coupon rate, term to maturity and yield to maturity. Results of an analysis of these issues include: the duration and volatility are inversely related to the coupon rate, short-term bonds can have a longer duration and be more volatile than long-term bonds under certain circumstances such as when the bonds are selling at a discount, there are certain longer-term discount bonds less sensitive to a given change in market interest rates than are shorter term bonds and a negative relationship exists between yield to maturity, duration and bond price volatility. Walls (1999) also examines the relationship between volatility, volume and maturity but not in bond market. He focuses his study in electricity futures market. He uses regression model in examining this relationship; volatility is considered as a dependent variable while maturity and volume as independent variables. The results show that the electricity future price volatility is negatively associated with maturity but positively associated with the contemporaneous volume of trade conditional on the term to maturity. The role of emerging market bonds in global investment portfolios is examined by Claude, Campbell and Tadas (1999). They concluded that volatility has been one of the characteristics in emerging market bonds throughout time. In relatively good times, the emerging market bonds seem to be unique in return characteristic. In the time of crisis, they are highly related with equity markets.
There is still not much research has been done on Malaysian bond market. There are only a few of it such as articles written by Muhammad Muda (1985) who looks at the behaviour of MGS’s coupon rate and by Noniszura & Tan (1999) who investigate the financial risk of Malaysian Corporate bond.
’ Bond that has no specific maturity or unending cash flow stream 52
Vol. 3, No. 7, 2002 Background on Malaysian E%ond Market
This study concentrates on Malaysia bond market, which includes government securities (represent public sector instruments), Cagamas bonds and Corporate Bonds (represent private sector instruments).
Malaysian Government Securities (MGS), which is generally known as government bond, is an established securities since it is guaranteed by the Malaysian Government. The issuance of MGS basically is for providing funds for any long-term development projects with interest payable semi annually. MGS are auctioned by the Central bank through the 23 primary dealer participants (banks, discount houses and merchant banks). Therefore, the coupon rate is determined by the weighted average of the successful yield. The central bank accepts no direct subscriptions for MGS from investors (except for two major government-related institutional investors, the Employees Provident Fund and the National Savings Bank). The tenor of MGS is normally above one year. The primary investors in MGS are tax- exempt pension funds, the Employees Provident Fund, insurance companies and commercial banks.
Cagamas bonds are securities issued by Cagamas Berhad, a Malaysian mortgage corporation, established in 1986 to foster growth in the Malaysian mortgage market, raises funds through the issuance of securities, and utilizes the proceeds to purchase residential mortgages from financial institutions. Ownership is currently held by a broad group of financial institutions, with Bank Negara Malaysia being the single largest shareholder. This is the reason why some may argue that Cagamas bond is actually a public sector instrument. One must not forget that despite the central bank’s ownership, there is no explicit government guarantee attached to Cagamas bonds. Therefore, Cagamas bonds are considered private sector instruments.
Corporate bonds are long-term securities issued by the corporations to meet their financing needs. The issuer may issue these bonds based on Islamic or conventional principle, and with fixed or floating rate bonds or without interest (zero coupon bonds) attached. The interest may be payable on a quarterly, semi annually or annually depending on the cashflow of the issuer.
Although the range of products available to issuers and investors is broad, the Malaysian fixed income market is still hampered by limited secondary trading activity in certain sovereign and private sector issues and still-modest primary issuance by the private sector. A number of steps the Malaysian government has taken in order to alleviate some of these drawbacks, stated briefly, the key changes includes the establishment of the first credit rating, Rating Agency Malaysia Berhad which provides some guidance on the credit worthiness of the issuers in November 1990 and the second rating agency, Malaysian Rating Corporation Berhad in October 1995. Other steps taken by the Malaysian government are eliminating stamp duties and income taxes on
53
Malaysian Bond Market
certain bond issues, ensuring greater access by the investing public to a series of government and private securities issues, creating a centralized clearing system for sovereign securities and introducing interest rate futures.
The objectives of this study is to analyze the relationship between price volatility, term to maturity and volume of trade of the Malaysian bond market by imposing Wall’s (1999) model with a little modification to fit the nature of the bonds. Empirical assessment of the findings should prove useful to market participants and regulators since they need to understand the volatility of bonds’ price to effectively employ fixed income portfolio strategies as mentioned by Fabozzi, Pitts and Dattatreya (1995).
Data and Methodology
Monthly actively traded Malaysian Government Securities (MGS), Cagamas Bond and Corporate Bond data published by RAM Bond Newsletter and Investors Digest is used in this study. The data set consists of term to maturity and volume of trade at the end of every month and the highest and lowest price in the month between March 1996 and March 1999. The time period is then divided into three periods. Data from March 1996 to June 1997 represent the period before the currency crisis, data from July 1997 to August 1998 represent the period during the crisis before pegging and data from September 1998 to March 1999 represent the period during the crisis after pegging.
Measure of volatility is as proposed by Parkinson (1980) and Garman and Klass (1980). All variables are transformed to logarithmic form.
The volatility is estimated as follows:
Volatility,=log price(high,) - log price(low,)12/[4 log 21 (1)
where volatility is the fluctuation or variability of bond price over time. Statistically, volatility is a measure of the dispersion or spread of bond price around the mean of the bond price.
According to Wall (1999), to quantify the effect of time until maturity on price volatility, the following linear regression equation is used:
Volatility, = CC, + p log(maturity), + p, (2)
where time until maturity refers to the number of month to the date the contract between the firm and bondholder expires and the firm repays a bond’s principal to the bondholder.
54
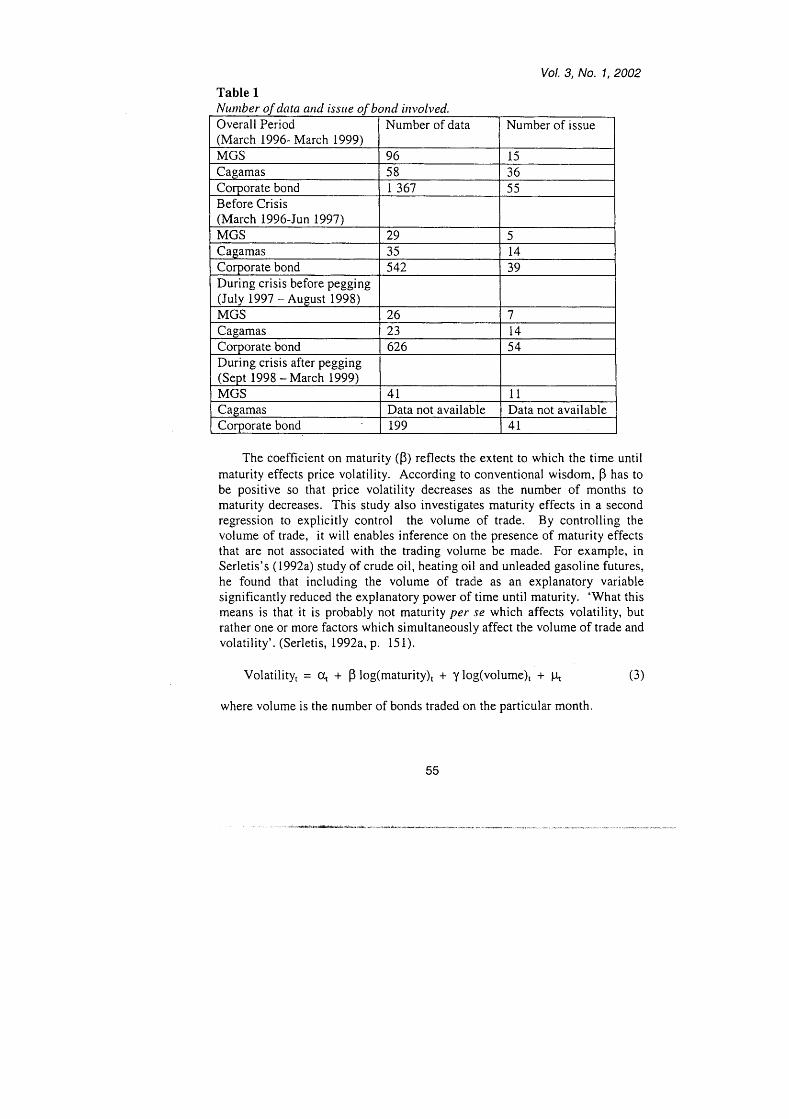
Vol. 3, No. 1, 2002 Table 1
Overall Period Number of data (March 1996- March 1999)
Y
Corporate bond 1367 Before Crisis (March 1996-Jun 1997) MGS 29 Cagamas 35 Corporate bond 542 39 During crisis before pegging
MGS 26 Cagamas 23
(July 1997 -August 1998)
During crisis after pegging
Cagamas Corporate bond 199 .
The coefficient on maturity (0) reflects the extent to which the time until maturity effects price volatility. According to conventional wisdom, p has to be positive so that price volatility decreases as the number of months to maturity decreases. This study also investigates maturity effects in a second regression to explicitly control By controlling the volume of trade, it will enables inference on the presence of maturity effects that are not associated with the trading volurne be made. For example, in Serletis's (1992a) study of crude oil, heating oil and unleaded gasoline futures, he found that including the volume of trade as an explanatory variable significantly reduced the explanatory power of time until maturity. 'What this means is that it is probably not maturity per ,ye which affects volatility, but rather one or more factors which simu1taneousl:y affect the volume of trade and volatility'. (Serletis, 1992a, p. 15 1).
the volume of trade.
Volatility, = a, + p log(maturity), + y log(volume), + (3)
where volume is the number of bonds traded on the particular month.
55
Malaysian Bond Market
Findings
Descriptive Siriiiniary
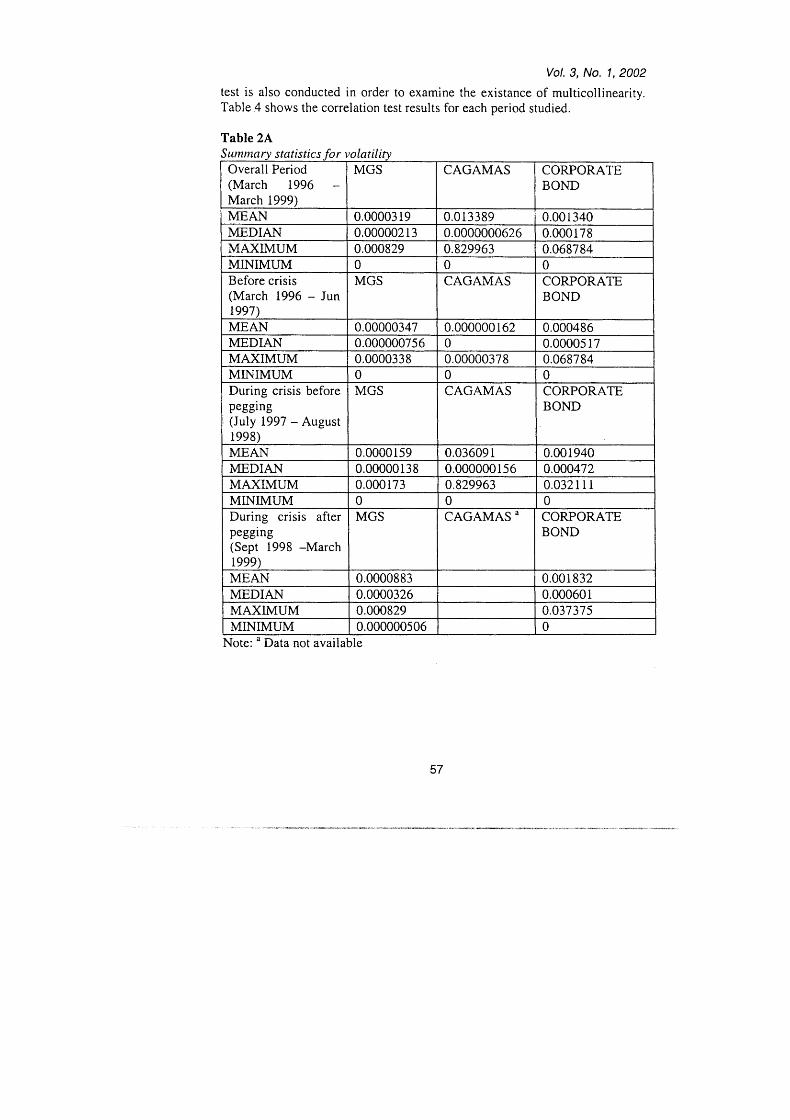
Table 2A, 2B and 2C presents the summary statistics, respectively, on volatility, maturity and volume for MGS, Cagamas and Corporate bonds respectively for the overall , before the crisis, during the crisis before pegging and during the crisis after pegging period.
The high level of volatility is demonstrated by the high level of mean value from table 2A. It is clearly shown that the volatility for MGS, Cagamas and Corporate Bond is higher during the crisis compared before the crisis. In the overall and during the crisis before pegging period, the price of Cagamas is the most volatile while the price of MGS is the least volatile. Before the crisis, i t is found that price of the Corporate bond is the most volatile while the price of Cagamas is the least volatile.
From table 2B, it could be seen that the volume of trade for MGS is the highest while Corporate bond is the lowest not only before the crisis and during the crisis before pegging but also in the overall period. During the crisis before pegging, the volume of trade for Cagamas and Corporate bond is higher compared to before the crisis but for MGS the result is different since its volume of trade decrease during the crisis before pegging compared to before the crisis.
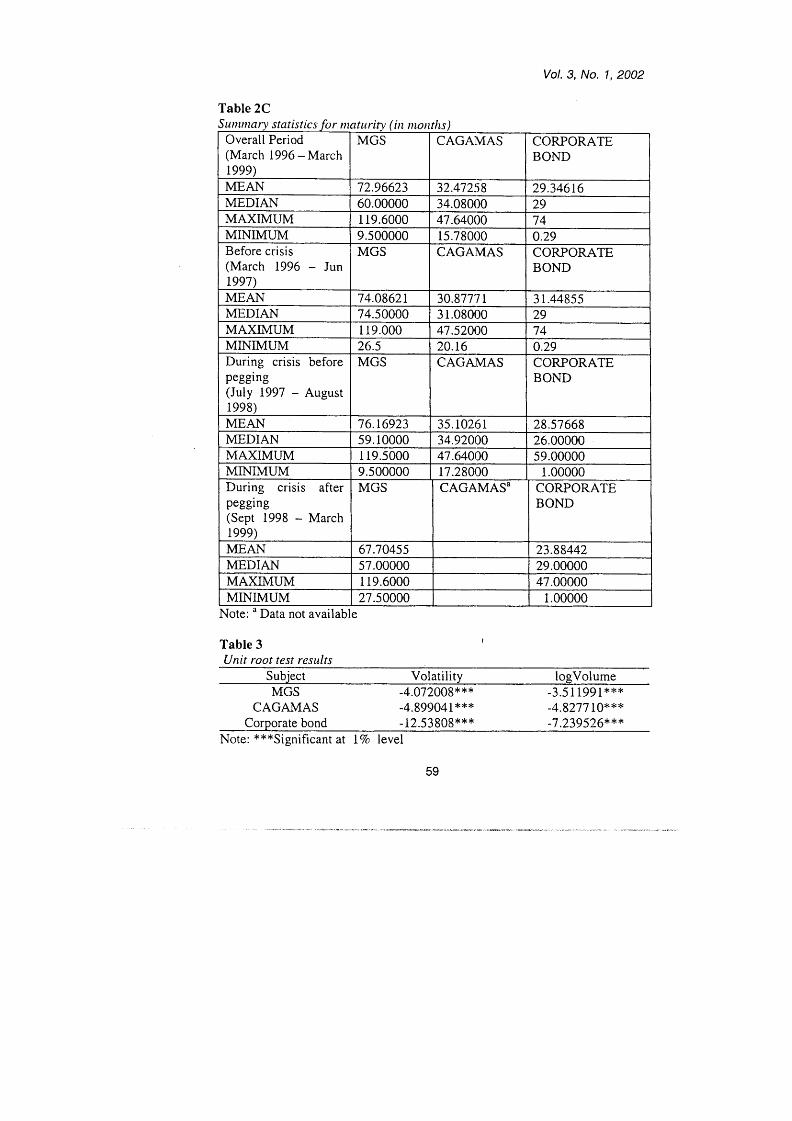
Table 2C indicates that MGS has the longest term to maturity in all period. Before the crisis, Cagamas bond has the shortest term to maturity while during the crisis before pegging, Corporate bond has the shortest term to maturity. The result for the period during the crisis after pegging is not discussed here because the data for Cagamas is not sufficient.
Regression Sitnitnary
The empirical analysis begins by first investigating the time series properties, i.e., volume and volatility. Data generated in financial markets are often nonstationary. If the data are nonstationary the standard statistical procedures, including the usual t- and F-tests in the regression analysis, will give misleading results. Therefore, volatility and logvolume are tested for nonstationary using ADF unit root test. The results of the unit root tests displayed in Table 3, indicate a clear rejection of the hypotheses that volume and volatility contain a unit root. For all types of bonds, the hypothesis of a unit root is rejected at the 1% significanse level. In other words, the unit root test results indicate that the series have a constant unconditional variance across time. Given the strong evidence that the time series data to be analysed are stationary, we will proceed using standard statistical methods. Correlation
56
Vol. 3, No. I, 2002 test is also conducted in order to examine the. existance of multicollinearity. Table 4 shows the correlation test results for each period studied.
Table 2A Suiniiinrv statistics for volntilitv
CAGAMAS MGS Overall Period
March 1999) 1 Zrrc 1996 -
CORPORATE BOND
I MINIMUM
0.00000213 0.000829
Before crisis (March 1996 - Jun 1997)
0.0000000626 0.000178 0.829963 0.068784
I MEDIAN 0.00003 3 8 0 MGS
I MAXIMUM 0.00000378 0.068784 0 0 CAG,4MAS CORPORATE
BOND P== During crisis before
0.0000159 I 0.036091 0.00000138 0.000000156 tp&-
MAXIMUM
0.00 1940 0.000472
MINIMUM During crisis after
(Sept 1998 -March I 1999)
pegging
I MINIMUM Note: a Data not availa
0.0000319 I 0.013389 I 0.001340
0 I 0 10 CAGAMAS CORPORATE
I I
0.00000347 I 0.000000162 I 0.000486 0.000000756 I 0 I 0.0000517
0.000173 10.829963 10.032111 I
0.0000883 0.00060 1 0.037375
0.000000506 I I 0 I ik

Srinuiimy statistics for volume ( iii uriits) Overall Period MGS CAGAMAS CORPORATE (March 1996 - BOND March 1999) MEAN 66803990 5592664 2483501 MEDIAN 16481870 19945 16 345000 MAXIMUM 476000000 60726928 176000000 MINIMUM 30 1204.8 90895.87 730000 Before crisis MGS CAGAMAS CORPORATE (March 1996 - Jun BOND 1997) MEAN 60562077 2807055 1772057 MEDIAN 13478434 1500300 210500 MAXIMUM 362000000 15978429 5 8374000 MINIMUM 49407 1.1 498603.9 730000 During crisis before MGS CAGAMAS CORPORATE pegging BOND
1998) MEAN 25855923 10299559 3144166 MEDIAN 5846470 4000000 489500 MAXIMUM 191000000 60726928 176000000 MINIMUM 30 1204.8 90895.87 1000 During crisis after MGS CAGAMAS a CORPORATE pegging BOND (Sept 1998 - March 1999) MEAN 123000000 2257 186 MEDIAN 6 197444 1 586000 MAXIMUM 476000000 36672000 MINIMUM 1463772 1000
-
(July 1997 - August
Note: Data not available
58
Vol. 3, No. 1, 2002
' 74
Table 2C Suniniaiv statistics for rnaturitv (in niontlis
i 0.29
Overall Period (March 1996 -March 1999)
72.96623 MEDIAN MAXIMUM
60.00000 119.6000
MINIMUM 9.500000 Before crisis (March 1996 - Jun 1997)
74.0862 1
MAXIMUM MINIMUM
MEDIAN I74.50000 119.000 26.5
MEAN MEDIAN
- I -- CAGAMAS
76.16923 35.10261 28.57668 59.10000 34.92000 26 .OOOOO
32.47258 34.08000
MAXIMUM MINIMUM During crisis after
47.64000
119.5000 47.64000 59.00000 9.500000 17.2 8000 1 .ooooo MGS I CAGAMASa I CORPORATE
15.7 8000 CAGAMAS
MEAN MEDIAN MAXIMUM
30.877'7 1
67.70455 23.88442 57.00000 119.6000
-- 3 1.08000 47.52000 20.16
CORPORATE BOND
29.34616 29 74 0.29 CORPORATE BOND
~
3 1.44855 29
pegging (July 1997 - August
pegging (Sept 1998 - March 19991 I
I I
MINIMUM I 27.50000 I 1 1.00000 Note: a Data not available
Table 3 Unit root test results
I
Subject Volatility 1ogVolume MGS -4.072008* * * -3.51 1991***
-4.89904 1 * * * -4.8277 1 O* * * Corporate bond - 12.5 3 808 * ** -7.239526***
CAGAMAS
Note: ***Significant at 1% level
59
Malaysian Bond Market
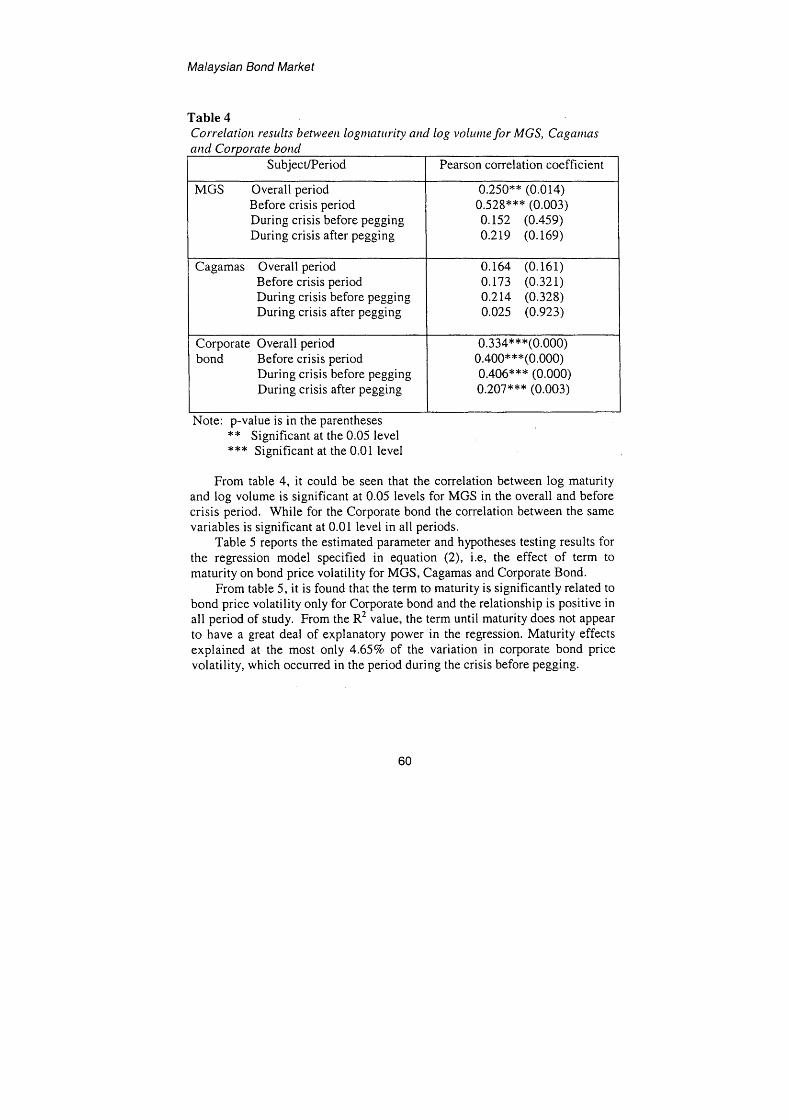
Table 4 Correlation results between logniatririty a d log voliriiie for MGS, Cagaiiins and Corporate boiid
I SubjecVPeriod I Pearson correlation coefficient I MGS Overall period
Before crisis period During crisis before pegging During crisis after pegging
0.250** (0.014) 0.528*** (0.003) 0.152 (0.459) 0.219 (0.169)
Cagamas Overall period Before crisis period During crisis before pegging During crisis after pegging
0.164 (0.161) 0.173 (0.321) 0.214 (0.328) 0.025 (0.923)
Corporate Overall period 0.334* * *(O.OOO) 0.400***(0.000) 0.406*** (0.000) 0.207*** (0.003)
During crisis before pegging During crisis after pegging
Note: p-value is in the parentheses ** Significant at the 0.05 level *** Significant at the 0.01 level
From table 4, i t could be seen that the correlation between log maturity and log volume is significant at 0.05 levels for MGS in the overall and before crisis period. While for the Corporate bond the correlation between the same variables is significant at 0.01 level in all periods.
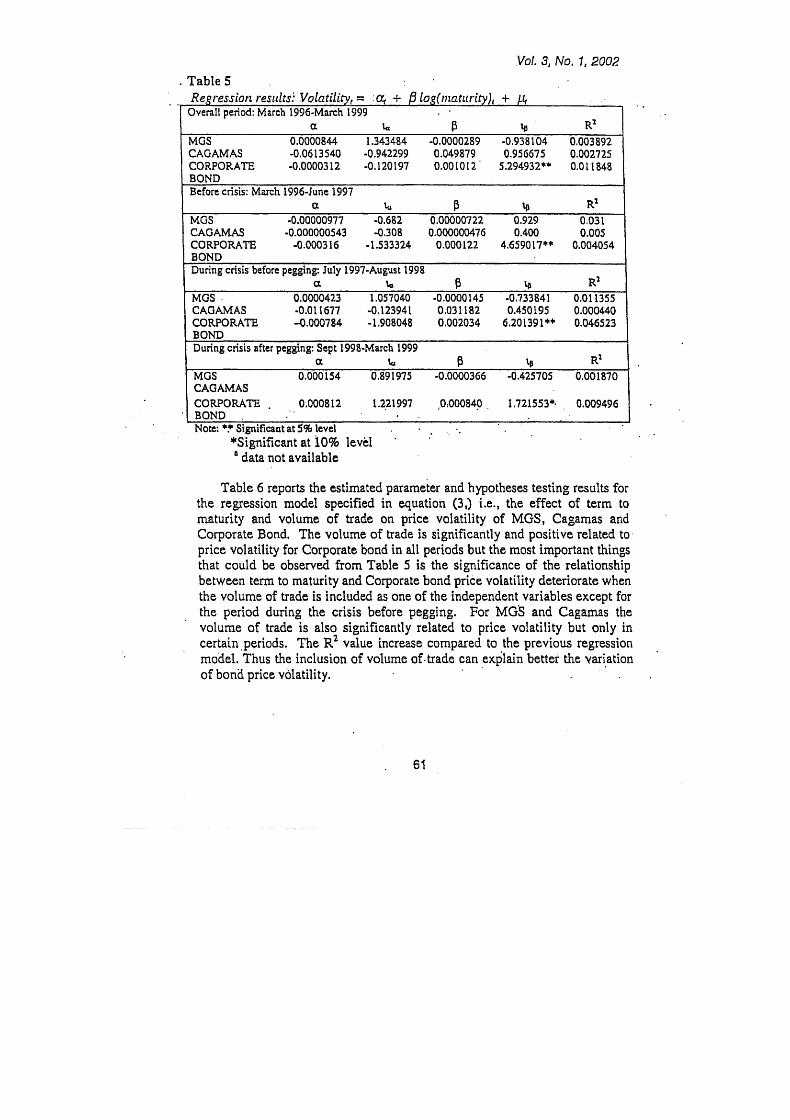
Table 5 reports the estimated parameter and hypotheses testing results for the regression model specified in equation (2), i.e, the effect of term to maturity on bond price volatility for MGS, Cagamas and Corporate Bond.
From table 5 , i t is found that the term to maturity is significantly related to bond price volatility only for Corporate bond and the relationship is positive in all period of study. From the R2 value, the term until maturity does not appear to have a great deal of explanatory power in the regression. Maturity effects explained at the most only 4.65% of the variation in corporate bond price volatility, which occurred in the period during the crisis before pegging.
60
.Vol. 3, No. I , 2002
'
. Table 5
a h P b R2 MGS 0.0000844 1.343484 -0.0000289 -0.9381 04 0.003892 CAG AM AS -0,0613540 -0.942299 0.049879 0.956675 0.002725 CORPORATE -0.00003 12 -0.120 197 0.00 I0 1 2 ' 5.294932'" 0.0 1 1848 BOND Before crisis: March 1996-June 1997
MGS -0.00000977 -0.682 0.00000722 0.929 0.03 1 CAGAMAS -0.000000543 -0.308 0.000000476 0.400 0.005
BOND During crisis before pegging: July 1997-August 1998
a kI P b RZ
CORPORATE -0.0003 16 -1 S33324 0.000122 4.659017** 0.004054
a L B L RZ MGS . 0.0000423 1.057040 -0.0000145 -0.733841 0.01 1355 CAOAMAS -0.01 I677 -0.123941 0.031 182 0.450195 0.000440 CORPORATE -0.000784 -1.908048 0.002034 6.201391** 0.046523 BOND During crisis after pegging: Sept 1998-March 1999
a tr B 9 RZ MGS 0.000154 0.891975 -0.0000366 -0.425705 0,001870 CAGAMAS CORPORATE . 0.000812 1.221997 .0;000840. I.721553". 0.009496 - BOND . - . Note: ** Significant at 5% level
- .. Regr-essiorz results! Volatility, = : Q + p fog(nznttu-ity), + I f t . . I Ovenll period: March 1996-March 1999
Table 6 reports the estimated parameter and hypotheses testing results for the regression model specified in equation (3,) i.e., the effect of term to maturity and volume of trade on price volatility of MGS, Cagamas and Corporate Bond. The volume of trade is significantly and positive related to price volatility for Corporate bond in all periods but the most important things that could be observed from Table 5 is the significance of the relationship between term to maturity and Corporate bond price volatility deteriorate when the volume of trade is included as one of the independent variables except for the period during the crisis before pegging. For MG'S and Cagamas the volume of trade is also significantly related to price volatility but only in certain, periods. The R2 value increase compared to the previous regression model. Thus the inclusion of volume of-trade can explain better the Variation of bona price volatility,
' '
. 61
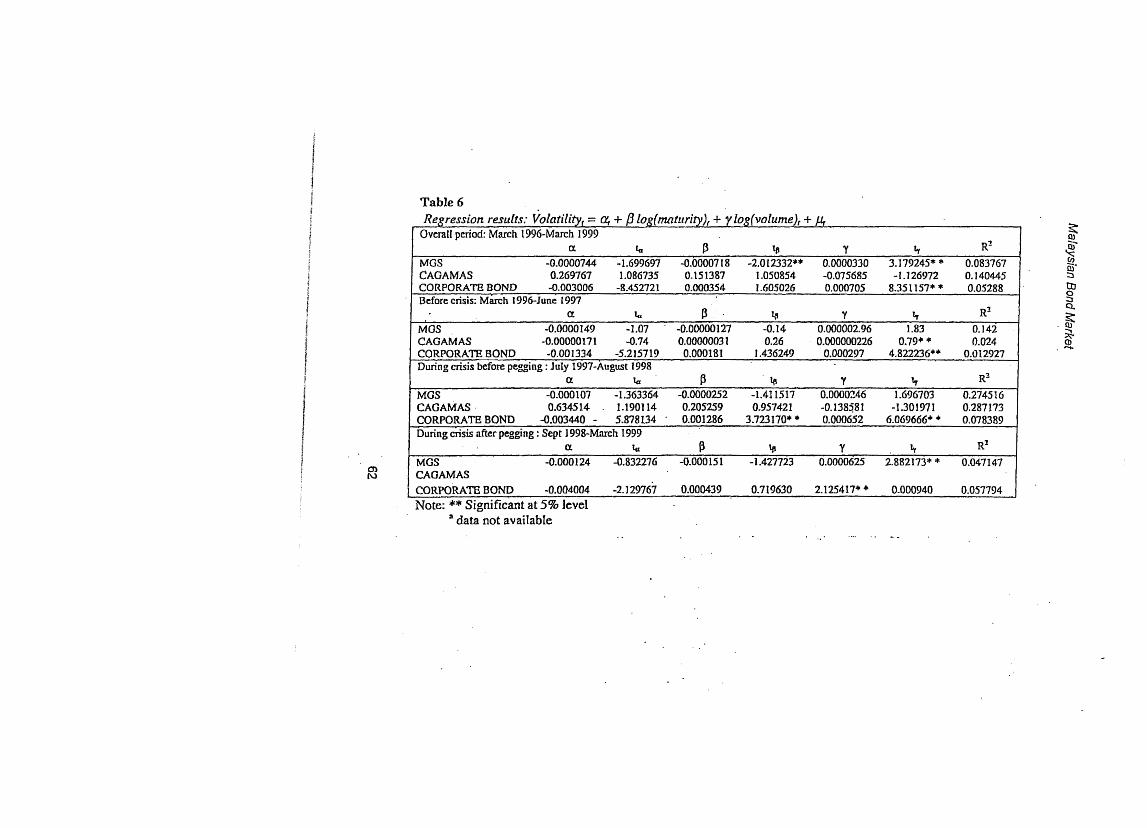
Overall: period: March 1996-March 1999 R' a h P 9 Y tr
m 2 %
. . . .. . . . - - . -
CORPORATE BOND -0.003006 -8.452721 0.000354 I A05026 0.000705 8.351 157" * 0.05288 Before crisis: M&h 1995-June 1997
a L P * 9 Y CI R' 1.83 0.1 42
0.024 -0.0000149 -1.07 -0.00000127 -0.14 0.000002.96 M GS
0.000000226 0.79" * 0.26 CAGAMAS -0.00000171 -0.74 0.00000031 CORPORATE BOND -0.001334 -5.215719 0.000181 I .436249 0.000297 4.822236** 0.012927 During crisis before pegging : July 1997-August 1998
R' a h P b Y tr MCS -0.000107 -1.363364 -0.0000252 -1.41 1517 0.0000246 1.696703 0.274516 CAGAMAS 0.634514 . 1.1901 14 0.205259 0.957421 -0.138581 -1.301971 0.287173 CORPORATE BOND -0.003440 - 5.878134 . 0.001286 3.723170* * 0.000652 6.069666* * 0.078389 During crisis after pegging : Sept 1998-March 1999
MGS -0.000124 -0.832276 -0.000151 -1.427723 0.0000625 2.8821734 * 0.047147 CAGAMAS CORPORATE BOND 6.004004 -2.129767 0.000439 0.729630 2.125417* * 0.000940 0.057794
R2 . h ot kl Q 9 Y
m 0 3 4
9, 3
2 . -
Vol. 3, No. I , 2002 Conclusion
The results of this study implies that volatility for MGS, Cagamas and Corporate Bond is higher during the crisis before pegging compared to before crisis. This could be due to the instability of interest rate during the crisis period and the most preferable bond to risk adverse investors during the crisis could be MGS since the price of MGS is the least volatile during the period. The volume of trade is higher for the period during the crisis before pegging compared to before the crisis for Cagamas and Corporate bond but for MGS the result between the two periods is the opposite. Changes in economic situations during the crisis may altered investors behaviour. Some investors are worry if they are holding bonds with high probability of going default. Therefore, there is a high possibility that they actively changing their portfolio of Cagamas and Corporate bond but at the same time they may choose to keep holding MGS since its default risk is zero. On average, MGS has the longest term to maturity while Corporate bond has the shortest term to maturity. It is discovered that the higher the term to maturity the more volatile the Corporate bond price but the relationship between price volatility and maturity for MGS and Cagamas bond do not exist. Therefore, result for the Corporate bond is consistent with the statements made by Livingstone (1993,' p. 297) which similar to the statement made by Malkiel in his theorem two which stated that for a given change in yield from the nominal yield, changes '
in bond prices are greater, the longer the term to maturity. The results also suggest that for Corporate bond investors who are concern with the stability of the bond price are advised to choose Corporate bonds with shorter maturity. How reliable are the results of Corporate bond is quite difficult to be confirmed since correlation between its log maturity and log volume is significant. In addition, when volume of trade is included into the regression equation, the relationship between term to maturity to price volatility become insignificant except for the period during the crisis before pegging. Anyway, the higher the volume of trade, the more volatile the Corporate bond price and the relationship is significant in all period. For MGS and Cagamas, the volume of trade is significantly related to price volatility but only in certain period of study. According to Brailsford (1996), there are three types of volume measurement i.e. number of transactions, number of shares traded and value of shares traded. In this study, the number of shares traded is used. Maybe in the future, the other two measurements for volume could be used to measure the relationship between bond volatility and volume. Since the Rz value increased in the second regression model, the study concludes that the volume of trade helps to explain better the variation of bond price volatility. Although the R2 value increased but the value it is still low and this phenomenon suggest that other factors such as interest rate, duration and coupon rate can explain the bond price volatility better. The difference between interest rate and coupon
63
Malaysian Bond Market
rate is that interest rate is the cost of fund that prevai,ls in the financial market while coupon rate is the stipulated interest rate to be paid on the face value of a bond. It represents a .fixed annual dollaramount that is paid as long as the debtor is solvent. Duration may be defines as the weighted average number of period until the cashflows occur, with the relative present values of each cash flow used as the weight. Further empirical work should seek to investigate these factors.
References
Brailsford, T.J. (1996). The empirical relationship between trading volume, returns and volatility. Journal of Accounting arid Finance ,89- 1 10.
Claude,B.E ; Campbell, R.H and Tadas, E.V. (1999). New perspectives on emerging market bonds. Journal of Por#olio Maizagement: 83-92.
De Vany, A.S and Walls, W.D. (1997). Open transmission and spot markets for power:models of power and transmission pricing on the western network. Paper presented at the 72 nd Western Economic Association Annual Coirference, Seattle, Washington.
Fabozzi, J.F., Pitts, M. and Dattatreya, E.R. (1995). Price volatility characteristics of fixed income securities. In Fabozzi, J.F. and Fabozzi, D.T (Eds.), The handbook of fixed income securities (pp. 83-112). United States of America: Irwin.
Freund, W.C. (1970). Investment Fundamentals, Washington. Fuller, J.F. and Settle, J.W. (1984). . Determinants of duration and bond *
volatility. The Journal of Portfolio Management: 66-72 Garman, M..B and Klass, M. (1980). On the estimation of security price
volatilities from historical data. Journal of Business, 53,67-78 Livengstone, M. (1993). Money and capital markets (second edition). New
York Institute of Finance, 296-297. MaIkiel, B.G. ( 1962). Expectations, bond price and the term structure of
interest rates. Qtiartely Journal of Economics: 198-205. Malkiel, B.G . (1965). The tenn structure of interest rate. Princeton, N.J:
Princeton University Press. Muhamrnad Muda. (1985). Kelakuan kadar kupon dan struktur yield bon
Kerajaan Malaysia berkelompok: Implikasinya ke atas dagangan pasaran kedua. Jirrnal Pengurusan, 4, 3-2 1.
Noniszura Hj. Ismail dan Tan Kay How. (1999). Corak kemandiran dan risiko kewangan bon Korporat di Malaysia, Utara Management Review,
Parkinson, M. (1980). The extreme value method for estimating the variance . 6, 171.
on the rate of return Journal of Business, 53, 61-65.
Vol. 3, No. 7, 2002 Serletis, A. (1992). Maturity effects in energy futures, Energy Econoiizics, 14,
150-157.
Rubayah Binti Yakob (rubayah @Dkrisc.cc.ukm.mv), Liza Marwati Binti Mohd Yusoff and Fauzias Binti Mat Nor are lecturers at the Department of Finance, Faculty of Business Management, Universiti Kebangsaan Malaysia, 43600 Bangi, Selangor Darul Ehsan.Te1: (03) 89293730, (03) 89292736. Fax: (03) 89293306
65