municipal strategy report september 2011 - loopcapital.com strategy... · volatility maturity (yr)...
TRANSCRIPT

This report is available on Bloomberg LPCM
Municipal Strategy Report September 2011
Getting Our Economy ‘Off the Dime’?
1
No president since FDR has been reelected with the un-employment rate above 6.0% other than Reagan, who was reelected in 1984 with a 7.4% unemployment rate that had fallen from 10.8%. Republicans in the Senate and the House are keenly aware of the opportunity at hand. The House returned to the Republican fold in the mid-term election and they are expected to expand their majority in 2012. Republicans may also take over the Senate given that 13 more Democratic than Republican held seats are up for grabs. The Administration under-played their hand over the entire budget deficit debt limit saga, badly misjudging the situation, and opting for bi-partisanship (weakness) rather than a more Clin-tonesque approach. The political blood is now in the water, and the GOP is pressing the bet. A strong candi-date as the standard bearer could seal the deal, although that is not a given as of this point. It is 14 months before the election and the attention of the marketplace is being steadily drawn into politics—local and national—and its significance for the business community both big and small. The rational business manager is now within a time period where decisions to invest, expand output, and hire employees have to in-clude the expected political outcome in addition to all of the other standard business decision variables. This dy-namic guarantees that there will be little progress on im-proving the economy over the next 14 months. With a vulnerable president at the nadir of his approval ratings, and generally unpopular with the business community from the start, most businesses will likely continue to keep the powder dry and wait for a possible new admini-stration in Washington. This “business strike” is completely rational under the circumstances and not necessarily politically motivated in any malevolent way. For most businesses the cost of waiting affords little opportunity cost and the prospect of a change in political regime to something likely to be more favorable to business is a net present value calcula-tion that is probably politically agnostic, and assuredly in line with financial self interest and profit maximization. Maybe the invisible hand guides with a few political fin-gers. The $447 billion jobs plan that President Obama dis-cussed on a scheduled nationally televised infomercial has been clearly designed to press the right political but-tons. Tax cuts for employers and employees via the pay-roll tax cut, aid to local government for schoolteachers and construction, and adoption of a “model” jobs re-training program, apparently from the State of Georgia.
Passage of the plan is uncertain given the budget impact and the Administration’s deliberate punting on the revenue raising measures required to pay for the pro-gram. Even if the jobs plan does become law, it will not stimulate the economy even close to what stimulus will be provided when business eventually get off the dime to invest, hire, and expand output. The corporations of the S&P500 have borrowed $618 billion through the credit markets since January of 2010. Of the 500 companies about 250 have sold bonds to raise funds at the lowest levels in most CFO’s life-times. Most of that cash is still on their balance sheets waiting for the opportunity bell to ring. A new admini-stration with a more favorable attitude towards business is just that opportunity. If the prospects that the GOP can pull off the “hat trick”—new Republican Admini-stration, control of the Senate, and expansion of control of the House—start to rise with the passage of time, you will see business optimism rise like a Saturn rocket. A Republican rout on November 6th 2012 would set off animal spirits (“…a spontaneous urge to action…” as Keynes explained) not seen in what is beginning to feel like an eternity. The point is this: stimulating the economy is fully in the political realm now. Any federal government fiscal programs to stimulate the economy will provide small potatoes compared to the unleashing of the piles of cash collecting tiny basis points in interest earnings on the balance sheets of corporate America. The road out of this flagging recovery is visible, but it probably re-quires a major change of political scenery before it hap-pens. Like it or not. This is one vision of the future, but a fairly plausible one, offered without any political preference or implied or explicit editorial opinion on our part. The basic eco-nomic outlook is for weak growth, no recession, very low Treasury rates and persistent inflation slightly to the plus side of 2%. IN THIS ISSUE WE FEATURE ▪ Portfolio Manager’s Page (Page 9) ▪ A sneak peak at our upcoming white paper
on migration between the states. This white paper, due in December, will build on coun-try migration models. (Page 10)
Analytical Services Division
Chris Mier, Strategist
312.356.5840
Source: Loop Capital Markets’ Analytical Services Division and Short-Term Desk Black Text: Actual Gold Text: Forecast as of September 6, 2011
2
Municipal Strategy Report September 2011
Factors Supportive of Higher Rates Factors Supportive of Lower Rates
▪ Unemployment remains elevated and has risen in recent months.
▪ Another poor month in the labor market, with zero jobs added in August, has economists calling for a renewed rise in the un-employment rate.
▪ Stagnant housing market and low consumer confidence point toward a weakening economy and the Federal Reserve keeping rates low.
▪ Softer lower Treasury rates have done little to stimulate borrow-ing and spending. Cash is being hoarded on corporate balance sheets.
▪ The Fed's ambitions for monetary stimulus are growing with discussion of various possible tactics up to a QE3.
▪ Commodities prices remain elevated, and have grown by 4.4% this year.
▪ Low dollar threatens rise in import prices, while boosting ex-ports. (Flagging growth in Europe a concern.)
▪ Inflation appears to be solidify around the 2% level, complicat-ing the Fed's conduct of monetary policy.
▪ Euro psychosis over Greece, Italy, Portugal and Spain is crater-ing the Euro and US equities.
▪ The budget deficit/debt limit passion play appears to be ready to start up again with GOP Senator Kyl threatening to quit if defense cuts are proposed.
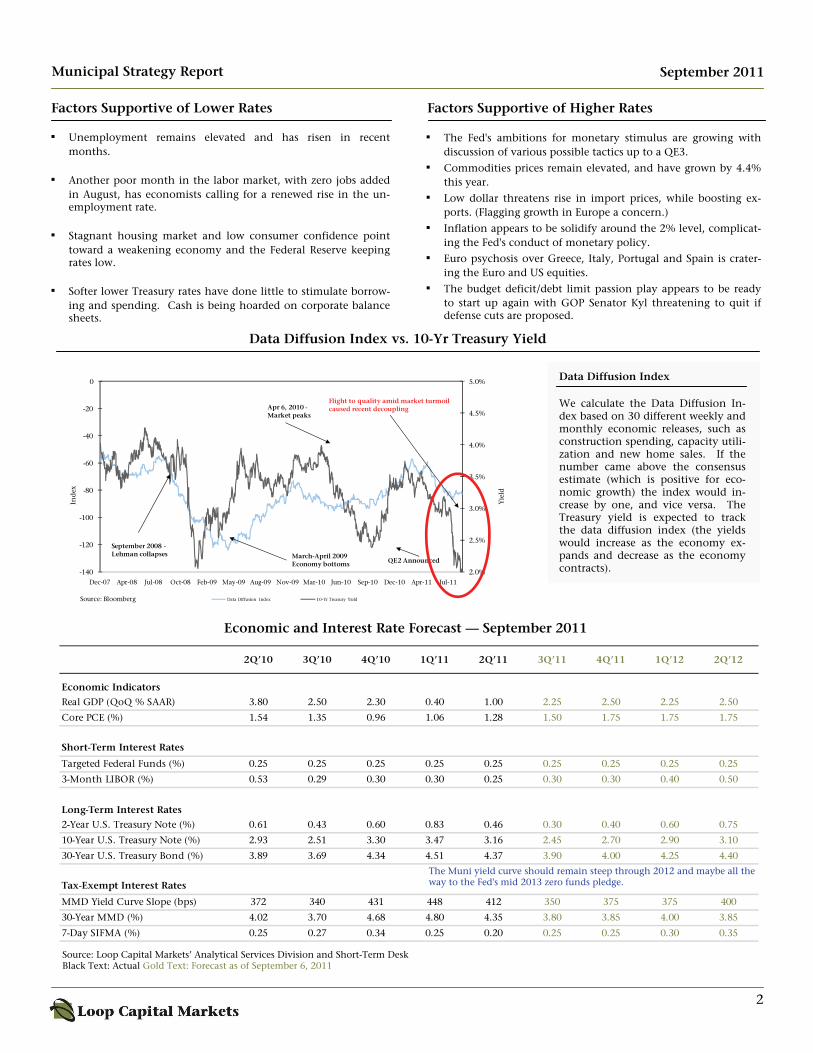
Data Diffusion Index We calculate the Data Diffusion In-dex based on 30 different weekly and monthly economic releases, such as construction spending, capacity utili-zation and new home sales. If the number came above the consensus estimate (which is positive for eco-nomic growth) the index would in-crease by one, and vice versa. The Treasury yield is expected to track the data diffusion index (the yields would increase as the economy ex-pands and decrease as the economy contracts).
Data Diffusion Index vs. 10-Yr Treasury Yield
Economic and Interest Rate Forecast — September 2011
2Q’10 3Q’10 4Q’10 1Q’11 2Q’11 3Q’11 4Q’11 1Q’12 2Q’12
Economic Indicators
Real GDP (QoQ % SAAR) 3.80 2.50 2.30 0.40 1.00 2.25 2.50 2.25 2.50
Core PCE (%) 1.54 1.35 0.96 1.06 1.28 1.50 1.75 1.75 1.75
Short-Term Interest Rates
Targeted Federal Funds (%) 0.25 0.25 0.25 0.25 0.25 0.25 0.25 0.25 0.25
3-Month LIBOR (%) 0.53 0.29 0.30 0.30 0.25 0.30 0.30 0.40 0.50
Long-Term Interest Rates
2-Year U.S. Treasury Note (%) 0.61 0.43 0.60 0.83 0.46 0.30 0.40 0.60 0.75
10-Year U.S. Treasury Note (%) 2.93 2.51 3.30 3.47 3.16 2.45 2.70 2.90 3.10
30-Year U.S. Treasury Bond (%) 3.89 3.69 4.34 4.51 4.37 3.90 4.00 4.25 4.40
Tax-Exempt Interest Rates
MMD Yield Curve Slope (bps) 372 340 431 448 412 350 375 375 400
30-Year MMD (%) 4.02 3.70 4.68 4.80 4.35 3.80 3.85 4.00 3.85
7-Day SIFMA (%) 0.25 0.27 0.34 0.25 0.20 0.25 0.25 0.30 0.35
2.0%
2.5%
3.0%
3.5%
4.0%
4.5%
5.0%
-140
-120
-100
-80
-60
-40
-20
0
Dec-07 Apr-08 Jul-08 Oct-08 Feb-09 May-09 Aug-09 Nov-09 Mar-10 Jun-10 Sep-10 Dec-10 Apr-11 Jul-11
Yie
ld
Ind
ex
Data Diffusion Index 10-Yr Treasury YieldSource: Bloomberg
September 2008 -Lehman collapses
Apr 6, 2010 -Market peaks
March-April 2009 Economy bottoms QE2 Announced
Flight to quality amid market turmoil caused recent decoupling
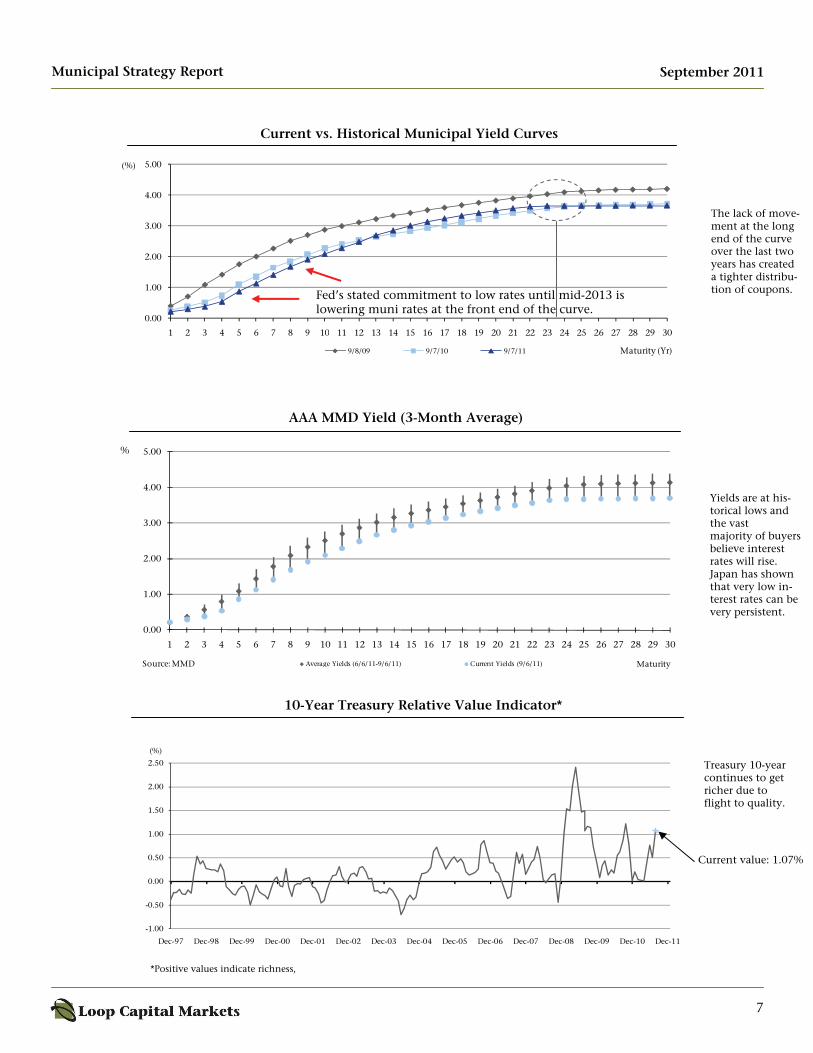
The Muni yield curve should remain steep through 2012 and maybe all the way to the Fed's mid 2013 zero funds pledge.
3
Municipal Strategy Report
Charting the Economy
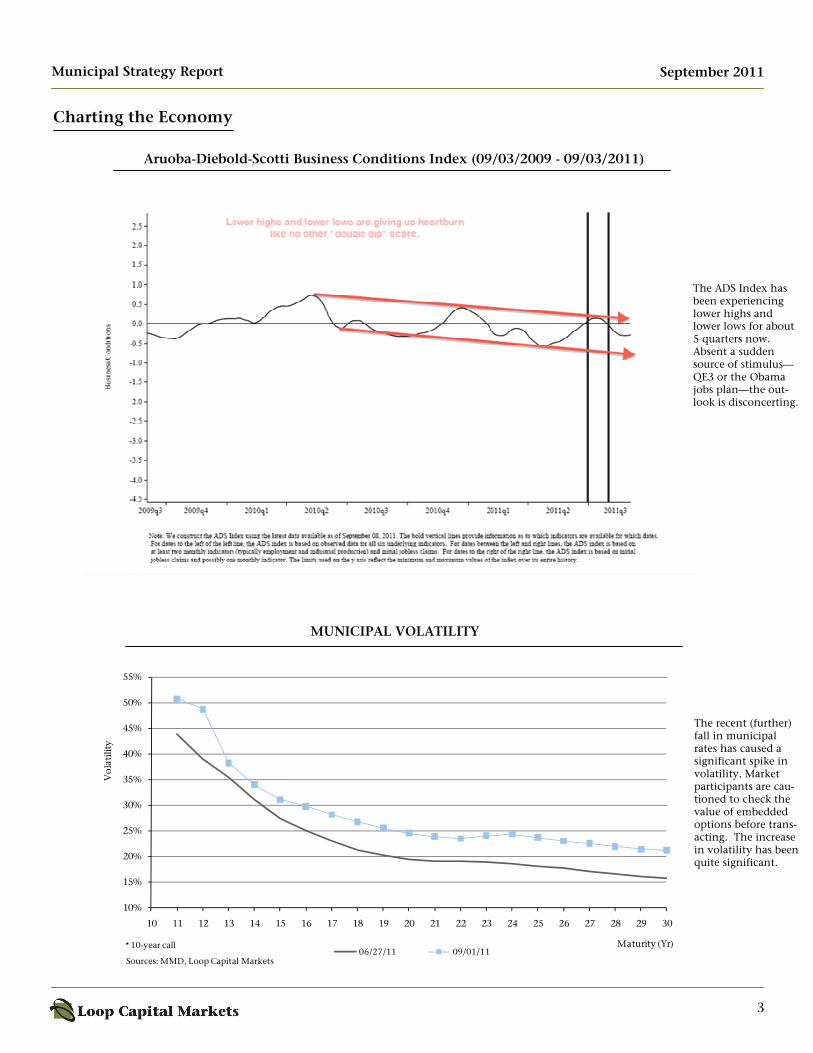
Aruoba-Diebold-Scotti Business Conditions Index (09/03/2009 - 09/03/2011)
September 2011
10%
15%
20%
25%
30%
35%
40%
45%
50%
55%
10 11 12 13 14 15 16 17 18 19 20 21 22 23 24 25 26 27 28 29 30
Vo
lati
lity
Maturity (Yr)
IMPLIED MUNICIPAL VOLATILITY
06/27/11 09/01/11* 10-year call
Sources: MMD, Loop Capital Markets
The ADS Index has been experiencing lower highs and lower lows for about 5 quarters now. Absent a sudden source of stimulus—QE3 or the Obama jobs plan—the out-look is disconcerting.
The recent (further) fall in municipal rates has caused a significant spike in volatility. Market participants are cau-tioned to check the value of embedded options before trans-acting. The increase in volatility has been quite significant.
MUNICIPAL VOLATILITY
4
Municipal Strategy Report
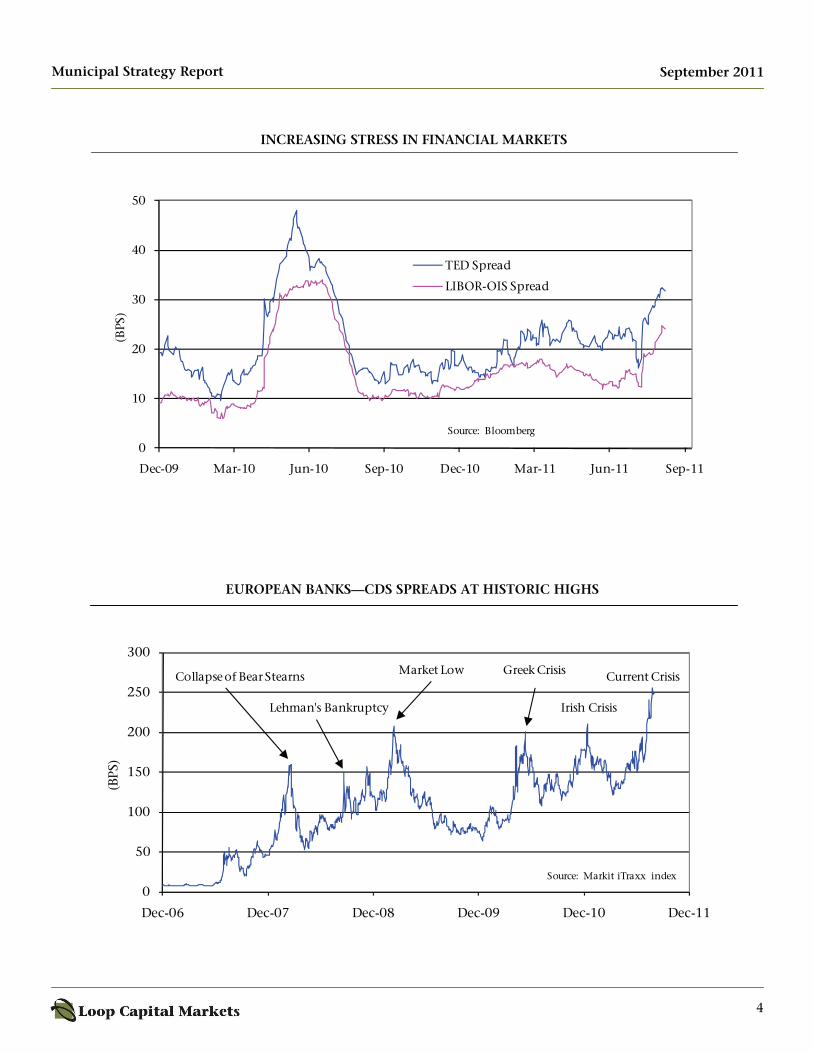
INCREASING STRESS IN FINANCIAL MARKETS
September 2011
EUROPEAN BANKS—CDS SPREADS AT HISTORIC HIGHS
0
50
100
150
200
250
300
Dec-06 Dec-07 Dec-08 Dec-09 Dec-10 Dec-11
(BPS
)
Collapse of Bear Stearns
Lehman's Bankruptcy
Market Low Greek Crisis
Irish Crisis
Current Crisis
Source: Markit iTraxx index
0
10
20
30
40
50
Dec-09 Mar-10 Jun-10 Sep-10 Dec-10 Mar-11 Jun-11 Sep-11
(BPS
)
TED Spread
LIBOR-OIS Spread
Source: Bloomberg
5
Municipal Strategy Report
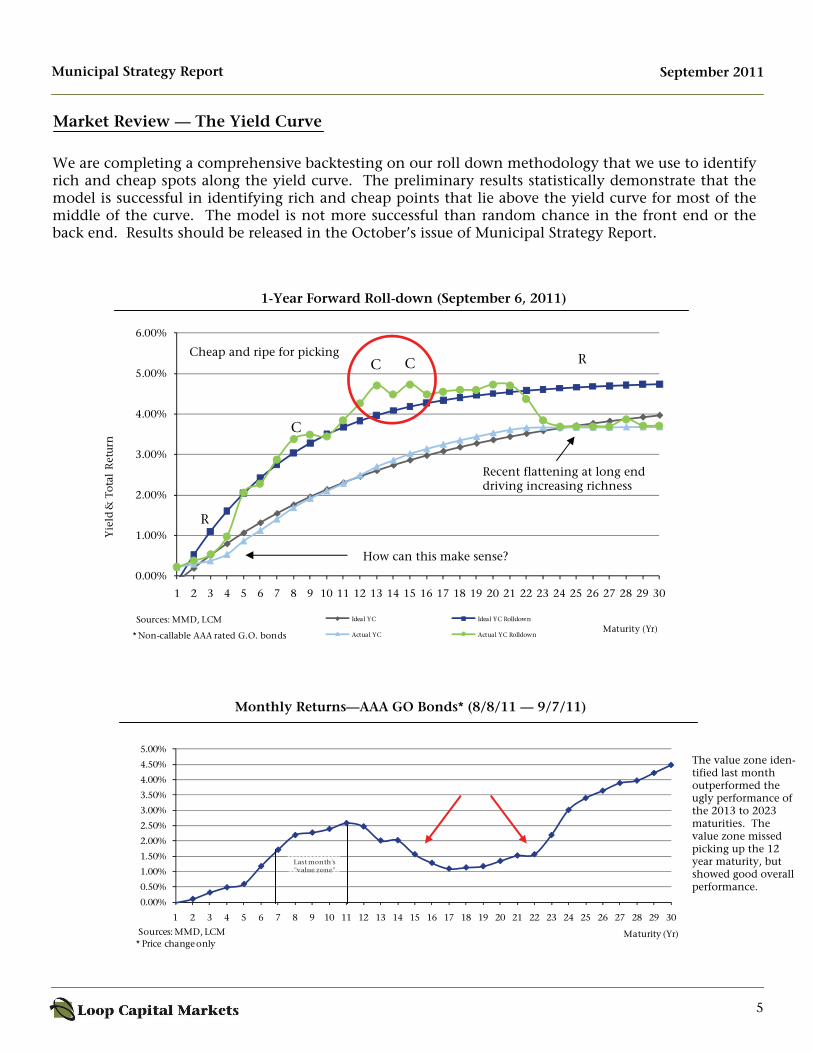
1-Year Forward Roll-down (September 6, 2011)
We are completing a comprehensive backtesting on our roll down methodology that we use to identify rich and cheap spots along the yield curve. The preliminary results statistically demonstrate that the model is successful in identifying rich and cheap points that lie above the yield curve for most of the middle of the curve. The model is not more successful than random chance in the front end or the back end. Results should be released in the October’s issue of Municipal Strategy Report.
Market Review — The Yield Curve
Monthly Returns—AAA GO Bonds* (8/8/11 — 9/7/11)
September 2011
0.00%
1.00%
2.00%
3.00%
4.00%
5.00%
6.00%
1 2 3 4 5 6 7 8 9 10 11 12 13 14 15 16 17 18 19 20 21 22 23 24 25 26 27 28 29 30
Yie
ld &
Tot
al R
etur
n
Maturity (Yr)Ideal YC Ideal YC Rolldown
Actual YC Actual YC Rolldown
Sources: MMD, LCM
* Non-callable AAA rated G.O. bonds
R
R
C
C
C
0.00%
0.50%
1.00%
1.50%
2.00%
2.50%
3.00%
3.50%
4.00%
4.50%
5.00%
1 2 3 4 5 6 7 8 9 10 11 12 13 14 15 16 17 18 19 20 21 22 23 24 25 26 27 28 29 30
Maturity (Yr)Sources: MMD, LCM* Price change only
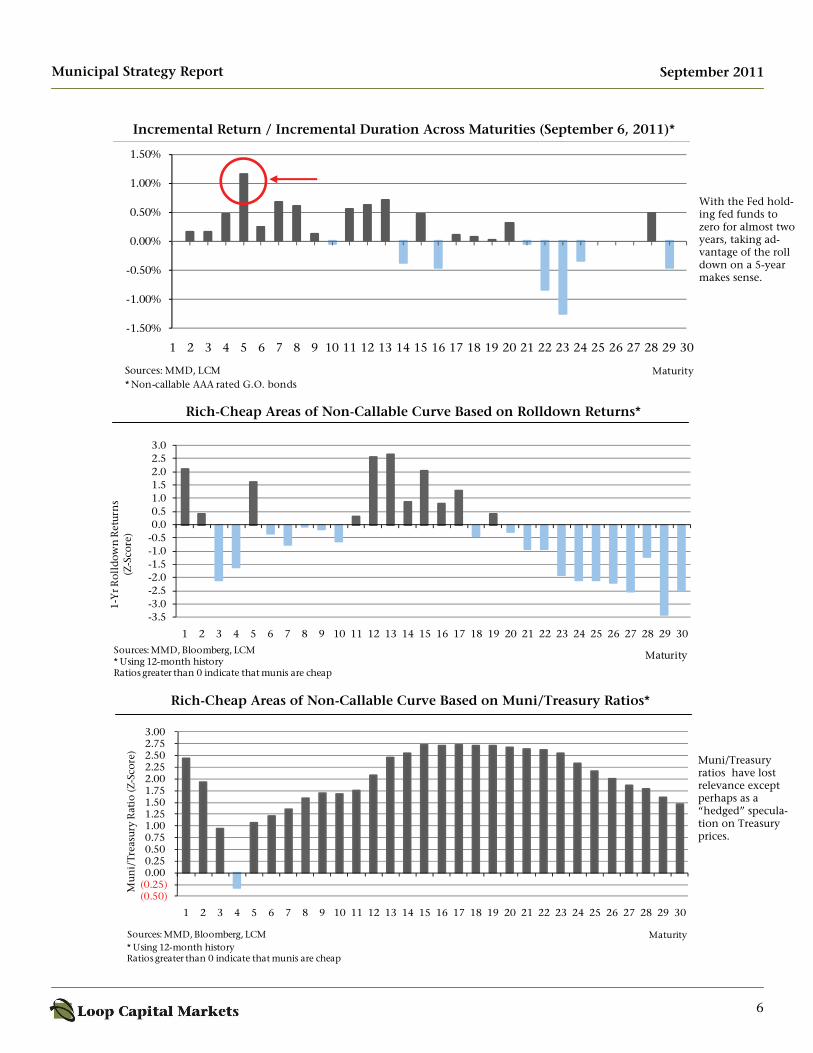
The value zone iden-tified last month outperformed the ugly performance of the 2013 to 2023 maturities. The value zone missed picking up the 12 year maturity, but showed good overall performance.
Last month's "value zone"
Cheap and ripe for picking
Recent flattening at long end driving increasing richness
How can this make sense?
6
Municipal Strategy Report
Rich-Cheap Areas of Non-Callable Curve Based on Muni/Treasury Ratios*
Rich-Cheap Areas of Non-Callable Curve Based on Rolldown Returns*
Incremental Return / Incremental Duration Across Maturities (September 6, 2011)*
September 2011
-1.50%
-1.00%
-0.50%
0.00%
0.50%
1.00%
1.50%
1 2 3 4 5 6 7 8 9 10 11 12 13 14 15 16 17 18 19 20 21 22 23 24 25 26 27 28 29 30
MaturitySources: MMD, LCM* Non-callable AAA rated G.O. bonds
-3.5-3.0-2.5-2.0-1.5-1.0-0.50.00.51.01.52.02.53.0
1 2 3 4 5 6 7 8 9 10 11 12 13 14 15 16 17 18 19 20 21 22 23 24 25 26 27 28 29 30
1-Y
r Rol
ldow
n R
etur
ns
(Z-S
core
)
MaturitySources: MMD, Bloomberg, LCM* Using 12-month historyRatios greater than 0 indicate that munis are cheap
(0.50)(0.25)0.00 0.25 0.50 0.75 1.00 1.25 1.50 1.75 2.00 2.25 2.50 2.75 3.00
1 2 3 4 5 6 7 8 9 10 11 12 13 14 15 16 17 18 19 20 21 22 23 24 25 26 27 28 29 30
Mun
i/Tr
easu
ry R
atio
(Z-S
core
)
MaturitySources: MMD, Bloomberg, LCM* Using 12-month historyRatios greater than 0 indicate that munis are cheap
Muni/Treasury ratios have lost relevance except perhaps as a “hedged” specula-tion on Treasury prices.
With the Fed hold-ing fed funds to zero for almost two years, taking ad-vantage of the roll down on a 5-year makes sense.
7
Municipal Strategy Report
Current vs. Historical Municipal Yield Curves
AAA MMD Yield (3-Month Average)
10-Year Treasury Relative Value Indicator*
*Positive values indicate richness,
Treasury 10-year continues to get richer due to flight to quality.
Yields are at his-torical lows and the vast majority of buyers believe interest rates will rise. Japan has shown that very low in-terest rates can be very persistent.
The lack of move-ment at the long end of the curve over the last two years has created a tighter distribu-tion of coupons.
September 2011
0.00
1.00
2.00
3.00
4.00
5.00
1 2 3 4 5 6 7 8 9 10 11 12 13 14 15 16 17 18 19 20 21 22 23 24 25 26 27 28 29 30
Maturity (Yr)9/8/09 9/7/10 9/7/11
(%)
0.00
1.00
2.00
3.00
4.00
5.00
1 2 3 4 5 6 7 8 9 10 11 12 13 14 15 16 17 18 19 20 21 22 23 24 25 26 27 28 29 30
Average Yields (6/6/11-9/6/11) Current Yields (9/6/11) MaturitySource: MMD
%
-1.00
-0.50
0.00
0.50
1.00
1.50
2.00
2.50
Dec-97 Dec-98 Dec-99 Dec-00 Dec-01 Dec-02 Dec-03 Dec-04 Dec-05 Dec-06 Dec-07 Dec-08 Dec-09 Dec-10 Dec-11
*
(%)
Current value: 1.07%
Fed’s stated commitment to low rates until mid-2013 is lowering muni rates at the front end of the curve.
8
Municipal Strategy Report September 2011
2011 State & Local Pension Funding Review
Each year, Loop Capital Markets issues an in-depth review of state pension plans and their funded status. This year’s re-port will be our ninth review and represents a significant expansion from previous reports. In our 2010 analysis we examined 244 of the largest state pension plans, up from 241 the prior year, and have continued to expand our prior focus on state employee and teacher retirement plans to capture legislative, military, and judicial plans as well. Last year our expansion included a section on actual versus prescribed annual required contributions, and an analysis of each states other post-employment benefits plans. This year we have more comprehensive data on other post-employment bene-fits with the final phase in of GASB 45, and have included a section on the breakdown of asset allocation for states pen-sion plans. Our prior reports focused strictly on state-level pensions, but this year we have further enhanced the publications with a section dedicated to the analysis of the twenty largest cities public pension plans. We chose to focus on the twenty larg-est cities versus counties due to the sheer magnitude of the number of plans in any one county. We have, however, included the major county plans in which the largest cities lie, as well as any special district-administered systems within the cities. With the addition of an analysis of local-level plans we hope to shed light on some of the different problems local municipalities face versus state administered plans.
Preliminary Findings: While the economy has begun to recover, state and local pension liabilities remain at historic highs. The combina-tion of continued volatility in the stock market, forgone annual required contributions and inflated actuarial assump-tions continue to plague most plans. While the funding levels remain depressed, many state and local plans have begun to make positive changes. This year far more plans have begun to contemplate switching from a defined benefit to a defined contribution or hybrid plan, and both Michigan and Utah already replaced their defined benefit plans with hybrids this year. Many states have focused their efforts on shoring up their unfunded liabilities by either postponing or completely eliminating retirees’ cost of living increases as Colorado, Minnesota, and South Dakota did this year for current beneficiaries. The most prevalent positive change state and local pensions have made has been trimming bene-fits for new employees. A few states have even managed to reduce benefits for existing employees and retirees. We’ve also found more state plans this year than last passing legis-lation to increase employee contribution requirements. In short, our preliminary finding suggests that while the major-ity of plans remain underfunded, both state and local plans have begun to seriously address the issue, implementing more conservative changes to actuarial assumptions. Stay tuned for the complete report!
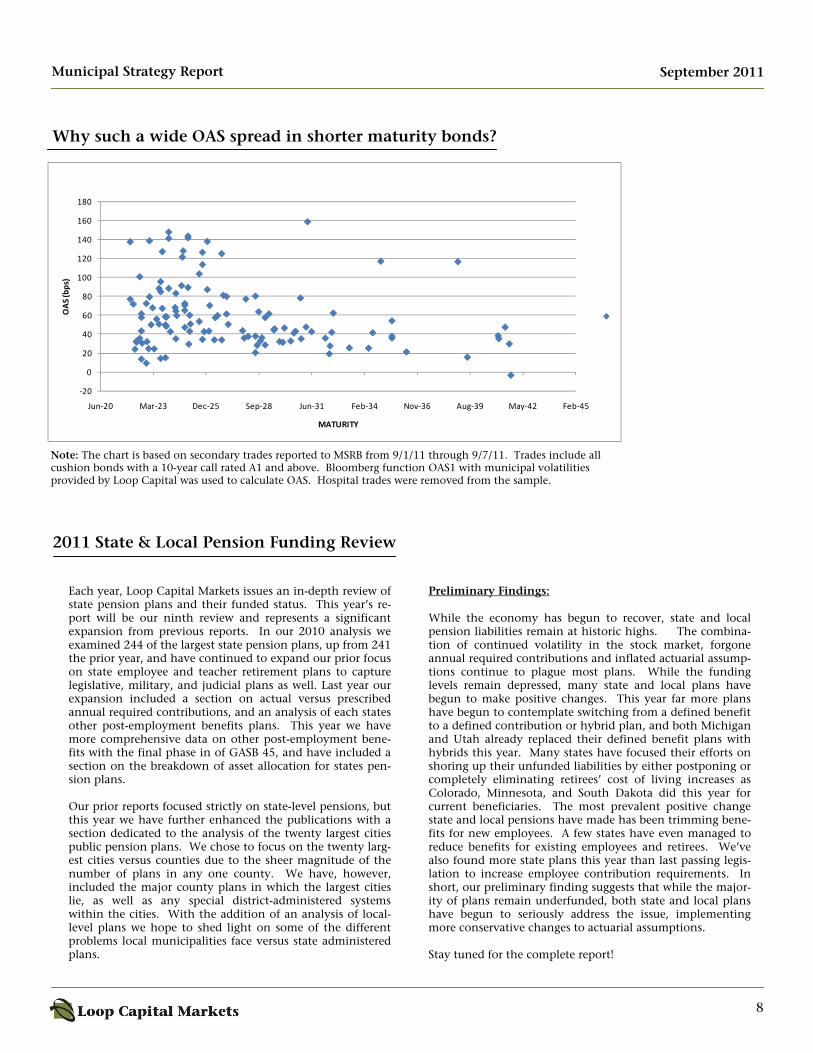
Why such a wide OAS spread in shorter maturity bonds?
‐20
0
20
40
60
80
100
120
140
160
180
Jun‐20 Mar‐23 Dec‐25 Sep‐28 Jun‐31 Feb‐34 Nov‐36 Aug‐39 May‐42 Feb‐45
OAS (bps)
MATURITY
Note: The chart is based on secondary trades reported to MSRB from 9/1/11 through 9/7/11. Trades include all cushion bonds with a 10-year call rated A1 and above. Bloomberg function OAS1 with municipal volatilities provided by Loop Capital was used to calculate OAS. Hospital trades were removed from the sample.
9
Municipal Strategy Report September 2011
Portfolio Manager’s Page
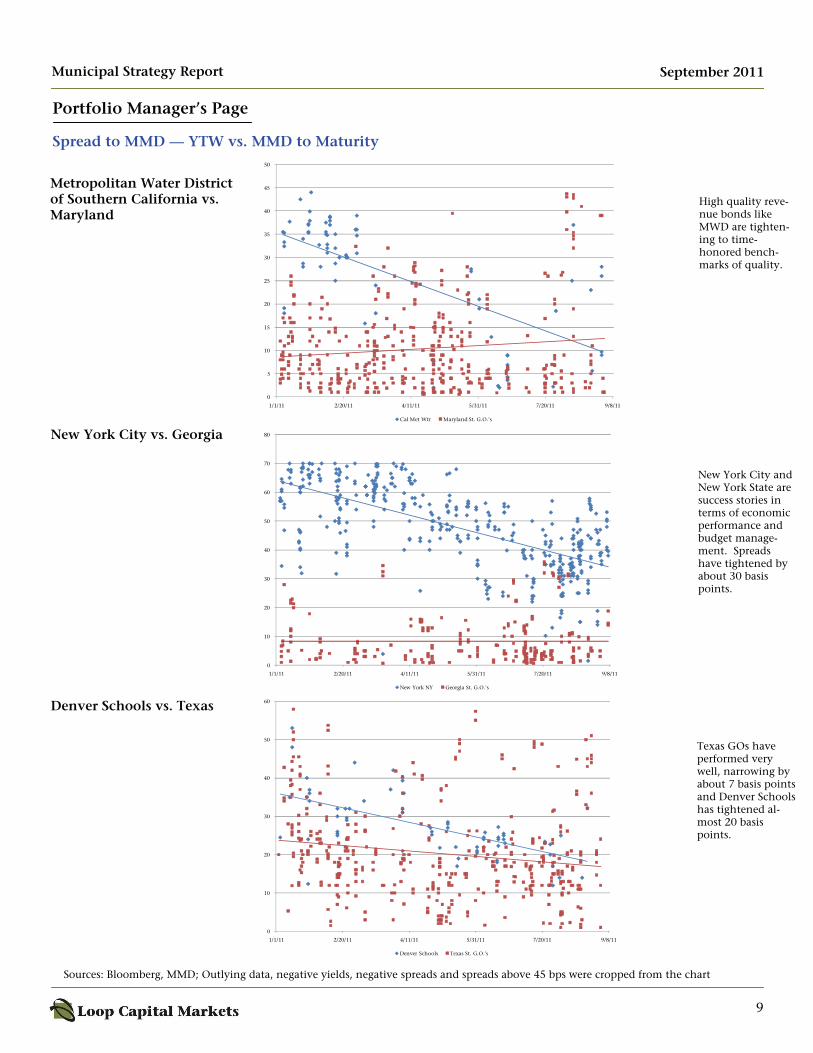
Sources: Bloomberg, MMD; Outlying data, negative yields, negative spreads and spreads above 45 bps were cropped from the chart
0
5
10
15
20
25
30
35
40
45
50
1/1/11 2/20/11 4/11/11 5/31/11 7/20/11 9/8/11
Cal Met Wtr Maryland St. G.O.'s
0
10
20
30
40
50
60
70
80
1/1/11 2/20/11 4/11/11 5/31/11 7/20/11 9/8/11
New York NY Georgia St. G.O.'s
0
10
20
30
40
50
60
1/1/11 2/20/11 4/11/11 5/31/11 7/20/11 9/8/11
Denver Schools Texas St. G.O.'s
Metropolitan Water District of Southern California vs. Maryland
New York City vs. Georgia
Denver Schools vs. Texas
Spread to MMD — YTW vs. MMD to Maturity
High quality reve-nue bonds like MWD are tighten-ing to time-honored bench-marks of quality.
New York City and New York State are success stories in terms of economic performance and budget manage-ment. Spreads have tightened by about 30 basis points.
Texas GOs have performed very well, narrowing by about 7 basis points and Denver Schools has tightened al-most 20 basis points.

10
Municipal Strategy Report
Should I Stay or Should I Go: Looking at Migration Decisions
September 2011
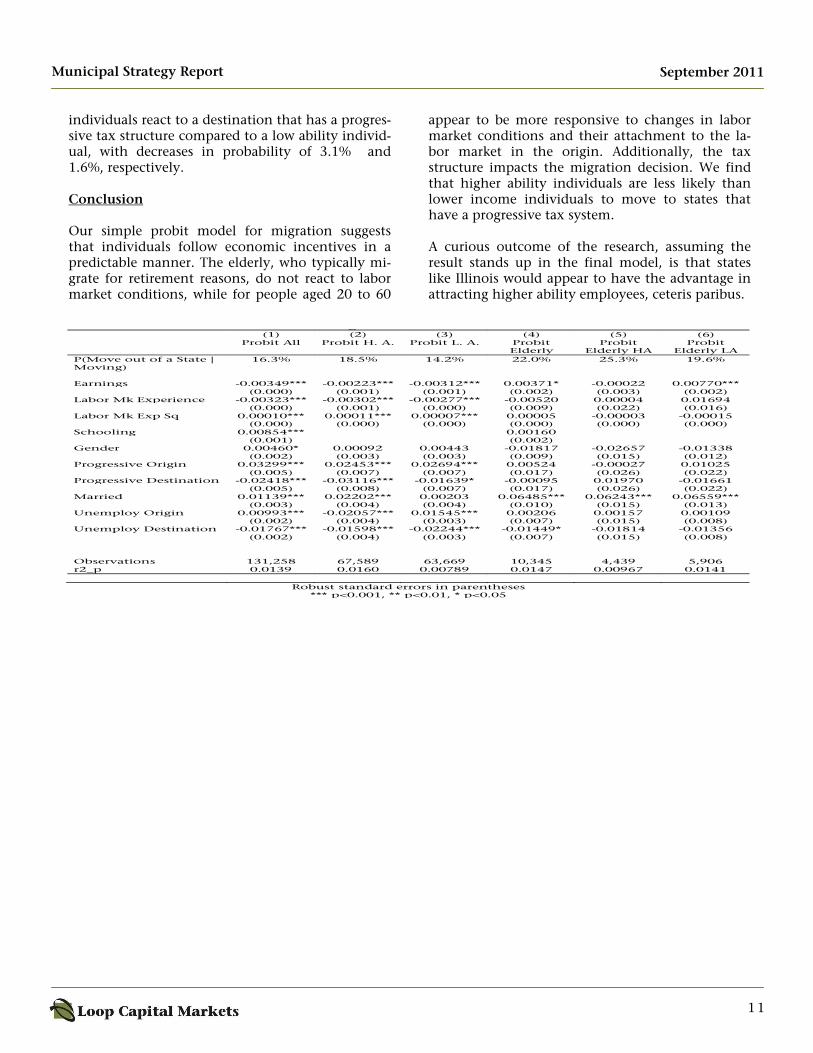
Introduction When states issue municipal bonds one concern is the availability of money throughout the lifetime of the bond. Budgets are planned out under the expectation of future tax revenues. But, state to state migration leads to a redistribution of human capital among states, potentially hurting their abil-ity to pay their debt. This effect is particularly im-portant in the case of a net loss of high skilled workers diluting a state’s relative earning potential. Preliminary Model Various economic papers have focused on what motivates people to move from one location to an-other. Following a basic human capital model of investment in migration (Sjaastad 1962, Becker 1964, and Chiswick 2000) focus on a micro analy-sis, while Pissarides and McMaster (1990), Green-wood et al (1991), and Gallin (2004) have explored the macro side focusing on variations in labor mar-ket condition among states. In both models, the key economic factor is the wage differential be-tween states. Yet, people may move for reasons unrelated to economic factors, the primary example being elderly retiring to warmer climates. In this brief introduction we will present one sim-ple model that examines what changes the likeli-hood someone will leave their current state, condi-tional upon them being a mover. To accomplish this we utilize a probit model that estimates the probability of migrating from one state to another state conditional upon them moving. Because eco-nomic conditions vary based individual’s character-istics, we control for education level, labor market experience, income level, gender, marital status, expected labor market conditions based upon their education level using a cross section of data for 2001 to 2010 compiled from the Current Popula-tion Survey. Additionally, we are interested in how the income tax structure impacts the migration decision. A di-chotomous variable indicating a whether a state is a progressive income tax state or a flat (or no) in-come tax state. Our basic theory is that, ceteris paribus, if the origin is a progressive tax state the
expected return to migration out of the state will be higher for a high income individual relative to the low income individual, with the reverse being true for flat tax states. Data on the tax structure is con-structed using data from the taxfoundation.org. This paper’s analysis represents preliminary results of a more in depth study with a targeted release date in December. The full study will consist of the full derivation of the theoretical model including case studies, the determinants of individual migra-tion decisions, and an analysis of state to state net migration flows. Empirical Results Our preliminary results are presented in the follow-ing table. As expected, driven primarily by retire-ment, the elderly have the highest probability of migrating out of a state if they are going to move. Additionally, the results suggest that the elderly do not respond to labor market conditions like people younger than 60. The negative coefficient on earnings and labor mar-ket experience suggests the more tied the individual becomes to the labor market in the origin the less likely they are leave the state. The earnings variable is the opportunity cost to migrating, the direct sal-ary they give up. While the labor market experi-ence reflects the time invested within their industry and in some cases a direct cost, for example state licensing. The results pertaining to the labor market suggest that overall people are less likely to migrate to poor labor markets. The coefficient for the high ability individuals unemployment in the origin being negative on the surface appears puzzling, it should be noted though that high ability individuals are less prone to facing a job loss than low ability indi-viduals and they face lower average unemployment rates (5.92% compared to 6.77%). The results suggest both the high ability and the low ability react similar to tax structure in origin with increases in the probability of migration 2.4% compared to 2.7%, respectively. But, a more dra-matic differences occurs in how high ability
11
Municipal Strategy Report September 2011
individuals react to a destination that has a progres-sive tax structure compared to a low ability individ-ual, with decreases in probability of 3.1% and 1.6%, respectively. Conclusion Our simple probit model for migration suggests that individuals follow economic incentives in a predictable manner. The elderly, who typically mi-grate for retirement reasons, do not react to labor market conditions, while for people aged 20 to 60
appear to be more responsive to changes in labor market conditions and their attachment to the la-bor market in the origin. Additionally, the tax structure impacts the migration decision. We find that higher ability individuals are less likely than lower income individuals to move to states that have a progressive tax system. A curious outcome of the research, assuming the result stands up in the final model, is that states like Illinois would appear to have the advantage in attracting higher ability employees, ceteris paribus.
g (1) (2) (3) (4) (5) (6) Probit All Probit H. A. Probit L. A. Probit
Elderly Probit
Elderly HA Probit
Elderly LA P(Move out of a State | Moving)
16.3% 18.5% 14.2% 22.0% 25.3% 19.6%
Earnings -0.00349*** -0.00223*** -0.00312*** 0.00371* -0.00022 0.00770*** (0.000) (0.001) (0.001) (0.002) (0.003) (0.002)Labor Mk Experience -0.00323*** -0.00302*** -0.00277*** -0.00520 0.00004 0.01694 (0.000) (0.001) (0.000) (0.009) (0.022) (0.016) Labor Mk Exp Sq 0.00010*** 0.00011*** 0.00007*** 0.00005 -0.00003 -0.00015 (0.000) (0.000) (0.000) (0.000) (0.000) (0.000)Schooling 0.00854*** 0.00160 (0.001) (0.002) Gender 0.00460* 0.00092 0.00443 -0.01817 -0.02657 -0.01338 (0.002) (0.003) (0.003) (0.009) (0.015) (0.012)Progressive Origin 0.03299*** 0.02453*** 0.02694*** 0.00524 -0.00027 0.01025 (0.005) (0.007) (0.007) (0.017) (0.026) (0.022)Progressive Destination -0.02418*** -0.03116*** -0.01639* -0.00095 0.01970 -0.01661 (0.005) (0.008) (0.007) (0.017) (0.026) (0.022)Married 0.01139*** 0.02202*** 0.00203 0.06485*** 0.06243*** 0.06559*** (0.003) (0.004) (0.004) (0.010) (0.015) (0.013)Unemploy Origin 0.00993*** -0.02057*** 0.01545*** 0.00206 0.00157 0.00109 (0.002) (0.004) (0.003) (0.007) (0.015) (0.008) Unemploy Destination -0.01767*** -0.01598*** -0.02244*** -0.01449* -0.01814 -0.01356 (0.002) (0.004) (0.003) (0.007) (0.015) (0.008) Observations 131,258 67,589 63,669 10,345 4,439 5,906r2_p 0.0139 0.0160 0.00789 0.0147 0.00967 0.0141
Robust standard errors in parentheses *** p<0.001, ** p<0.01, * p<0.05
12
Municipal Strategy Report
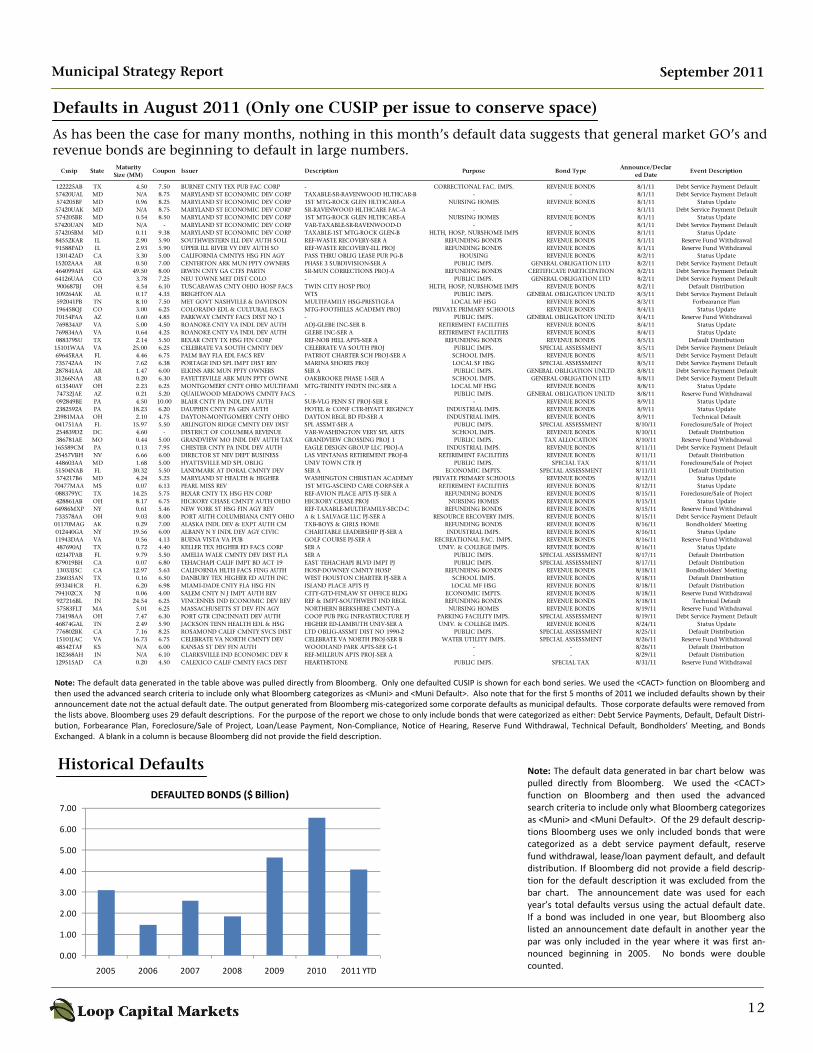
Defaults in August 2011 (Only one CUSIP per issue to conserve space)
Note: The default data generated in the table above was pulled directly from Bloomberg. Only one defaulted CUSIP is shown for each bond series. We used the <CACT> function on Bloomberg and then used the advanced search criteria to include only what Bloomberg categorizes as <Muni> and <Muni Default>. Also note that for the first 5 months of 2011 we included defaults shown by their announcement date not the actual default date. The output generated from Bloomberg mis‐categorized some corporate defaults as municipal defaults. Those corporate defaults were removed from the lists above. Bloomberg uses 29 default descriptions. For the purpose of the report we chose to only include bonds that were categorized as either: Debt Service Payments, Default, Default Distri‐bution, Forbearance Plan, Foreclosure/Sale of Project, Loan/Lease Payment, Non‐Compliance, Notice of Hearing, Reserve Fund Withdrawal, Technical Default, Bondholders’ Meeting, and Bonds Exchanged. A blank in a column is because Bloomberg did not provide the field description.
Historical Defaults Note: The default data generated in bar chart below was pulled directly from Bloomberg. We used the <CACT> function on Bloomberg and then used the advanced search criteria to include only what Bloomberg categorizes as <Muni> and <Muni Default>. Of the 29 default descrip‐tions Bloomberg uses we only included bonds that were categorized as a debt service payment default, reserve fund withdrawal, lease/loan payment default, and default distribution. If Bloomberg did not provide a field descrip‐tion for the default description it was excluded from the bar chart. The announcement date was used for each year’s total defaults versus using the actual default date. If a bond was included in one year, but Bloomberg also listed an announcement date default in another year the par was only included in the year where it was first an‐nounced beginning in 2005. No bonds were double counted.
As has been the case for many months, nothing in this month’s default data suggests that general market GO’s and revenue bonds are beginning to default in large numbers.
September 2011
Cusip StateMaturity
Size (MM)Coupon Issuer Description Purpose Bond Type
Announce/Declared Date
Event Description
122225AB TX 4.50 7.50 BURNET CNTY TEX PUB FAC CORP - CORRECTIONAL FAC. IMPS. REVENUE BONDS 8/1/11 Debt Service Payment Default57420UAL MD N/A 8.75 MARYLAND ST ECONOMIC DEV CORP TAXABLE-SR-RAVENWOOD HLTHCAR-B - - 8/1/11 Debt Service Payment Default574205BF MD 0.96 8.25 MARYLAND ST ECONOMIC DEV CORP 1ST MTG-ROCK GLEN HLTHCARE-A NURSING HOMES REVENUE BONDS 8/1/11 Status Update57420UAK MD N/A 8.75 MARYLAND ST ECONOMIC DEV CORP SR-RAVENWOOD HLTHCARE FAC-A - - 8/1/11 Debt Service Payment Default574205BR MD 0.54 8.50 MARYLAND ST ECONOMIC DEV CORP 1ST MTG-ROCK GLEN HLTHCARE-A NURSING HOMES REVENUE BONDS 8/1/11 Status Update57420UAN MD N/A - MARYLAND ST ECONOMIC DEV CORP VAR-TAXABLE-SR-RAVENWOOD-D - - 8/1/11 Debt Service Payment Default574205BM MD 0.11 9.38 MARYLAND ST ECONOMIC DEV CORP TAXABLE-1ST MTG-ROCK GLEN-B HLTH, HOSP, NURSHOME IMPS REVENUE BONDS 8/1/11 Status Update84552KAR IL 2.90 5.90 SOUTHWESTERN ILL DEV AUTH SOLI REF-WASTE RECOVERY-SER A REFUNDING BONDS REVENUE BONDS 8/1/11 Reserve Fund Withdrawal91588PAD IL 2.93 5.90 UPPER ILL RIVER VY DEV AUTH SO REF-WASTE RECOVERY-ILL PROJ REFUNDING BONDS REVENUE BONDS 8/1/11 Reserve Fund Withdrawal130142AD CA 3.30 5.00 CALIFORNIA CMNTYS HSG FIN AGY PASS THRU OBLIG LEASE PUR PG-B HOUSING REVENUE BONDS 8/2/11 Status Update15202AAA AR 0.50 7.00 CENTERTON ARK MUN PPTY OWNERS PHASE 3 SUBDIVISION-SER A PUBLIC IMPS. GENERAL OBLIGATION LTD 8/2/11 Debt Service Payment Default464099AH GA 49.50 8.00 IRWIN CNTY GA CTFS PARTN SR-MUN CORRECTIONS PROJ-A REFUNDING BONDS CERTIFICATE PARTICIPATION 8/2/11 Debt Service Payment Default64126UAA CO 3.78 7.25 NEU TOWNE MET DIST COLO - PUBLIC IMPS. GENERAL OBLIGATION LTD 8/2/11 Debt Service Payment Default900687BJ OH 4.54 6.10 TUSCARAWAS CNTY OHIO HOSP FACS TWIN CITY HOSP PROJ HLTH, HOSP, NURSHOME IMPS REVENUE BONDS 8/2/11 Default Distribution109264AK AL 0.17 4.35 BRIGHTON ALA WTS PUBLIC IMPS. GENERAL OBLIGATION UNLTD 8/3/11 Debt Service Payment Default592041PB TN 8.10 7.50 MET GOVT NASHVILLE & DAVIDSON MULTIFAMILY HSG-PRESTIGE-A LOCAL MF HSG REVENUE BONDS 8/3/11 Forbearance Plan196458QJ CO 3.00 6.25 COLORADO EDL & CULTURAL FACS MTG-FOOTHILLS ACADEMY PROJ PRIVATE PRIMARY SCHOOLS REVENUE BONDS 8/4/11 Status Update70154PAA AZ 0.60 4.85 PARKWAY CMNTY FACS DIST NO 1 - PUBLIC IMPS. GENERAL OBLIGATION UNLTD 8/4/11 Reserve Fund Withdrawal769834AP VA 5.00 4.50 ROANOKE CNTY VA INDL DEV AUTH ADJ-GLEBE INC-SER B RETIREMENT FACILITIES REVENUE BONDS 8/4/11 Status Update769834AA VA 0.64 4.25 ROANOKE CNTY VA INDL DEV AUTH GLEBE INC-SER A RETIREMENT FACILITIES REVENUE BONDS 8/4/11 Status Update088379SU TX 2.14 5.50 BEXAR CNTY TX HSG FIN CORP REF-NOB HILL APTS-SER A REFUNDING BONDS REVENUE BONDS 8/5/11 Default Distribution
15101WAA VA 25.00 6.25 CELEBRATE VA SOUTH CMNTY DEV CELEBRATE VA SOUTH PROJ PUBLIC IMPS. SPECIAL ASSESSMENT 8/5/11 Debt Service Payment Default69645RAA FL 4.46 6.75 PALM BAY FLA EDL FACS REV PATRIOT CHARTER SCH PROJ-SER A SCHOOL IMPS. REVENUE BONDS 8/5/11 Debt Service Payment Default735742AA IN 7.62 6.38 PORTAGE IND SPL IMPT DIST REV MARINA SHORES PROJ LOCAL SF HSG SPECIAL ASSESSMENT 8/5/11 Debt Service Payment Default287841AA AR 1.47 6.00 ELKINS ARK MUN PPTY OWNERS SER A PUBLIC IMPS. GENERAL OBLIGATION UNLTD 8/8/11 Debt Service Payment Default31266NAA AR 0.20 6.30 FAYETTEVILLE ARK MUN PPTY OWNE OAKBROOKE PHASE 1-SER A SCHOOL IMPS. GENERAL OBLIGATION LTD 8/8/11 Debt Service Payment Default613540AY OH 2.23 6.25 MONTGOMERY CNTY OHIO MULTIFAMI MTG-TRINITY FNDTN INC-SER A LOCAL MF HSG REVENUE BONDS 8/8/11 Status Update74732JAE AZ 0.21 5.20 QUAILWOOD MEADOWS CMNTY FACS - PUBLIC IMPS. GENERAL OBLIGATION UNLTD 8/8/11 Reserve Fund Withdrawal092849BE PA 4.50 10.00 BLAIR CNTY PA INDL DEV AUTH SUB-VLG PENN ST PROJ-SER E - REVENUE BONDS 8/9/11 Status Update2382592A PA 18.23 6.20 DAUPHIN CNTY PA GEN AUTH HOTEL & CONF CTR-HYATT REGENCY INDUSTRIAL IMPS. REVENUE BONDS 8/9/11 Status Update
23981MAA OH 2.10 4.75 DAYTON-MONTGOMERY CNTY OHIO DAYTON REGL BD FD-SER A INDUSTRIAL IMPS. REVENUE BONDS 8/9/11 Technical Default041751AA FL 15.97 5.50 ARLINGTON RIDGE CMNTY DEV DIST SPL ASSMT-SER A PUBLIC IMPS. SPECIAL ASSESSMENT 8/10/11 Foreclosure/Sale of Project254839D2 DC 4.60 - DISTRICT OF COLUMBIA REVENUE VAR-WASHINGTON VERY SPL ARTS SCHOOL IMPS. REVENUE BONDS 8/10/11 Default Distribution386781AE MO 0.44 5.00 GRANDVIEW MO INDL DEV AUTH TAX GRANDVIEW CROSSING PROJ 1 PUBLIC IMPS. TAX ALLOCATION 8/10/11 Reserve Fund Withdrawal165589CM PA 0.13 7.95 CHESTER CNTY PA INDL DEV AUTH EAGLE DESIGN GROUP LLC PROJ-A INDUSTRIAL IMPS. REVENUE BONDS 8/11/11 Debt Service Payment Default25457VBH NV 6.66 6.00 DIRECTOR ST NEV DEPT BUSINESS LAS VENTANAS RETIREMENT PROJ-B RETIREMENT FACILITIES REVENUE BONDS 8/11/11 Default Distribution448603AA MD 1.68 5.00 HYATTSVILLE MD SPL OBLIG UNIV TOWN CTR PJ PUBLIC IMPS. SPECIAL TAX 8/11/11 Foreclosure/Sale of Project51504NAB FL 30.32 5.50 LANDMARK AT DORAL CMNTY DEV SER A ECONOMIC IMPTS. SPECIAL ASSESSMENT 8/11/11 Default Distribution574217B6 MD 4.24 5.25 MARYLAND ST HEALTH & HIGHER WASHINGTON CHRISTIAN ACADEMY PRIVATE PRIMARY SCHOOLS REVENUE BONDS 8/12/11 Status Update
70477MAA MS 0.07 6.13 PEARL MISS REV 1ST MTG-ASCEND CARE CORP-SER A RETIREMENT FACILITIES REVENUE BONDS 8/12/11 Status Update088379YC TX 14.25 5.75 BEXAR CNTY TX HSG FIN CORP REF-AVION PLACE APTS PJ-SER A REFUNDING BONDS REVENUE BONDS 8/15/11 Foreclosure/Sale of Project428861AB OH 8.17 6.75 HICKORY CHASE CMNTY AUTH OHIO HICKORY CHASE PROJ NURSING HOMES REVENUE BONDS 8/15/11 Status Update64986MXP NY 0.61 5.46 NEW YORK ST HSG FIN AGY REV REF-TAXABLE-MULTIFAMILY-SECD-C REFUNDING BONDS REVENUE BONDS 8/15/11 Reserve Fund Withdrawal733578AA OH 9.03 8.00 PORT AUTH COLUMBIANA CNTY OHIO A & L SALVAGE LLC PJ-SER A RESOURCE RECOVERY IMPS. REVENUE BONDS 8/15/11 Debt Service Payment Default01170MAG AK 0.29 7.00 ALASKA INDL DEV & EXPT AUTH CM TXB-BOYS & GIRLS HOME REFUNDING BONDS REVENUE BONDS 8/16/11 Bondholders' Meeting012440GA NY 19.56 6.00 ALBANY N Y INDL DEV AGY CIVIC CHARITABLE LEADERSHIP PJ-SER A INDUSTRIAL IMPS. REVENUE BONDS 8/16/11 Status Update11943DAA VA 0.56 4.13 BUENA VISTA VA PUB GOLF COURSE PJ-SER A RECREATIONAL FAC. IMPS. REVENUE BONDS 8/16/11 Reserve Fund Withdrawal487690AJ TX 0.72 4.40 KELLER TEX HIGHER ED FACS CORP SER A UNIV. & COLLEGE IMPS. REVENUE BONDS 8/16/11 Status Update02347PAB FL 9.79 5.50 AMELIA WALK CMNTY DEV DIST FLA SER A PUBLIC IMPS. SPECIAL ASSESSMENT 8/17/11 Default Distribution879019BH CA 0.07 6.80 TEHACHAPI CALIF IMPT BD ACT 19 EAST TEHACHAPI BLVD IMPT PJ PUBLIC IMPS. SPECIAL ASSESSMENT 8/17/11 Default Distribution13033J5C CA 12.97 5.63 CALIFORNIA HLTH FACS FING AUTH HOSP-DOWNEY CMNTY HOSP REFUNDING BONDS REVENUE BONDS 8/18/11 Bondholders' Meeting236035AN TX 0.16 6.50 DANBURY TEX HIGHER ED AUTH INC WEST HOUSTON CHARTER PJ-SER A SCHOOL IMPS. REVENUE BONDS 8/18/11 Default Distribution59334HCR FL 6.20 6.98 MIAMI-DADE CNTY FLA HSG FIN ISLAND PLACE APTS PJ LOCAL MF HSG REVENUE BONDS 8/18/11 Default Distribution794102CX NJ 0.06 4.00 SALEM CNTY N J IMPT AUTH REV CITY-GTD-FINLAW ST OFFICE BLDG ECONOMIC IMPTS. REVENUE BONDS 8/18/11 Reserve Fund Withdrawal927216BL IN 24.54 6.25 VINCENNES IND ECONOMIC DEV REV REF & IMPT-SOUTHWEST IND REGL REFUNDING BONDS REVENUE BONDS 8/18/11 Technical Default57583FLT MA 5.01 6.25 MASSACHUSETTS ST DEV FIN AGY NORTHERN BERKSHIRE CMNTY-A NURSING HOMES REVENUE BONDS 8/19/11 Reserve Fund Withdrawal734198AA OH 7.47 6.30 PORT GTR CINCINNATI DEV AUTH COOP PUB PKG INFRASTRUCTURE PJ PARKING FACILITY IMPS. SPECIAL ASSESSMENT 8/19/11 Debt Service Payment Default46874GAL TN 2.49 5.90 JACKSON TENN HEALTH EDL & HSG HIGHER ED-LAMBUTH UNIV-SER A UNIV. & COLLEGE IMPS. REVENUE BONDS 8/24/11 Status Update776802BK CA 7.16 8.25 ROSAMOND CALIF CMNTY SVCS DIST LTD OBLIG-ASSMT DIST NO 1990-2 PUBLIC IMPS. SPECIAL ASSESSMENT 8/25/11 Default Distribution15101JAC VA 16.73 6.75 CELEBRATE VA NORTH CMNTY DEV CELEBRATE VA NORTH PROJ-SER B WATER UTILITY IMPS. SPECIAL ASSESSMENT 8/26/11 Reserve Fund Withdrawal48542TAF KS N/A 6.00 KANSAS ST DEV FIN AUTH WOODLAND PARK APTS-SER G-1 - - 8/26/11 Default Distribution182368AH IN N/A 6.10 CLARKSVILLE IND ECONOMIC DEV R REF-MILLRUN APTS PROJ-SER A - - 8/29/11 Default Distribution129515AD CA 0.20 4.50 CALEXICO CALIF CMNTY FACS DIST HEARTHSTONE PUBLIC IMPS. SPECIAL TAX 8/31/11 Reserve Fund Withdrawal
0.00
1.00
2.00
3.00
4.00
5.00
6.00
7.00
2005 2006 2007 2008 2009 2010 2011 YTD
DEFAULTED BONDS ($ Billion)
Loop Capital Markets LLC, an investment bank, prepared this document for informational purposes only. Loop Capital Markets LLC does not provide research services, therefore this product is not a research report and it should not be construed as such. Loop Capital has or may have provided invest-ment banking services to issuers referenced in this document. All materials are indicative and for discussion purposes only. Opinions expressed are our present opinions only and are subject to change without fur-ther notice. Opinions expressed herein are current opinions only as of the date indicated. Any historical price(s) or value(s) are also only as of the date indicated and as applicable from any source that may be noted. The information contained herein has been prepared solely for informational purposes and is not an offer to buy or sell or a solicitation of an offer to buy or sell any security or instrument or to participate in any trading strategy. Loop Capital Markets LLC shall have no liability, contingent or otherwise, to the user or to third parties, or any responsibility whatsoever, for the cor-rectness, quality, accuracy, timeliness, pricing, reliability, performance or completeness of the data or formulae provided herein or for any other aspect of the performance of the materials. Loop Capital Markets LLC is a Delaware limited liability company.
13
Municipal Strategy Report
Loop Capital Markets Upcoming Negotiated Calendar
Loop Capital Markets Upcoming Presentations
(All media inquiries should be directed to Chris Mier 312.356.5840)
Chris Mier, CFA Managing Director [email protected] 312.356.5840
Ivan Gulich, CFA Senior Vice President [email protected] 312.913.2204
Greg Bridwell Vice President [email protected] 312.913.2268
Ann Kibler Vice President [email protected] 312.913.2209
Nick Larsen, PhD Associate [email protected] 312.913.2236
Robert Haidari Intern [email protected] 312.913.2229
Loop Analytical Services Division
September 2011
DatePar Amount
($ mil)Issue Lead Manager
9/13/11 7.9 Haverstraw, NY King’s Daughter Library Refunding Loop Capital9/13/11 91.6 State of Texas GO (Texas Water Development Board) Piper Jaffrey9/14/11 245.0 Cal State University Systemwide Revenue Bonds Barclays9/14/11 44.0 Illinois Finance Authority Advocate Health Network Citigroup9/14/11 82.2 City of Philadelphia, PA Gas Works Revenue Bonds BofA/Merrill9/15/11 5,400.0 State of California RAN’s Wells Fargo9/15/11 375.0 Jacksonville Electric Authority St John’s River Power Park Ref. Bonds JPMorgan9/15/11 250.0 Long Island Power Authority Morgan Stanley9/20/11 125.0 Metropolitan Gov’t of Nashville & Davidson Co. TN JPMorgan9/20/11 438.0 Met Washington Airport Authority JPMorgan9/21/11 85.0 Cleveland, OH Water Revenue Refunding Bonds Loop Capital9/27/11 500.0 Cook County, IL GO William BlairSep-11 180.0 Tampa Hillsborough Expressway Authority BofA/MerrillSep-11 290.0 Orlando and Orange Co. Expressway Auth FRN’s Wells FargoSep-11 30.0 Atlanta, GA Development Auth Tax Allocation Raymond JamesSep-11 54.0 Newark Housing Authority Energy Savings Program COP’s RBCSep-11 105.0 City of Detroit, MI Capital Grant Receipts Revenue Bonds Loop Capital11/2/11 460.0 State of California Public Works Lease Revenue Bonds RBC Loop Capital
Date Event Topic Location
9/26/11 Institutional Investor Conference Debt Deleveraging and Restructuring Speaker (Chris Mier)
San Francisco, California
11/7/11 Institutional Investor Conference Municipal BankruptcySpeaker (Chris Mier with Jim Spiotto)
Chicago, Illinois