the relationship between peripapillary crescent and axial
TRANSCRIPT

Vision Research 51 (2011) 2132–2138
Contents lists available at SciVerse ScienceDirect
Vision Research
journal homepage: www.elsevier .com/locate /v isres
The relationship between peripapillary crescent and axial length: Implicationsfor differential eye growth
Toco Y.P. Chui ⇑, Zhangyi Zhong, Stephen A. BurnsSchool of Optometry, Indiana University, 800 E. Atwater Ave., Bloomington, IN 47405, USA
a r t i c l e i n f o
Article history:Received 2 June 2011Received in revised form 29 July 2011Available online 16 August 2011
Keywords:MyopiaOptic discOptic disc crescentSpectral domain optical coherencetomographyAdaptive optics scanning laserophthalmoscope
0042-6989/$ - see front matter � 2011 Elsevier Ltd. Adoi:10.1016/j.visres.2011.08.008
⇑ Corresponding author. Fax: +1 812 855 7045.E-mail address: [email protected] (T.Y.P. Chui).
a b s t r a c t
We evaluated the relationship between the size of the peripapillary crescent and the axial length (AL) ofthe eye as well as the fine structure of the peripapillary crescent in selected eyes. Infrared fundus imagingand spectral domain optical coherence tomography (SDOCT) (Spectralis HRA + OCT, Heidelberg Engineer-ing, Germany) centered at the fovea were performed on 72 healthy adults. On the infrared fundus images,we measured (a) the distance between the foveola and the temporal edge of the optic disc (FOD) and (b)the distance between the foveola and the temporal edge of the peripapillary crescent (FOC) (if present). Aperipapillary crescent presented at the nasal margin of the disc in 64% of the subjects. The FOD and FOCwere 4.22 mm ± 0.46 and 3.97 mm ± 0.25, respectively. Only the FOD was significantly correlated withaxial length. As AL increased by 10%, the FOD increased by 13%, the outer neural retina only expandedby 4% (as indicated by the FOC). This result emphasizes that retinal stretching may not mirror scleralgrowth, and the existence in some eyes of a difference between the photoreceptor margin and retinal pig-ment epithelium (RPE) margin suggests that within the retina there could be slippage during eye growth.
� 2011 Elsevier Ltd. All rights reserved.
1. Introduction
The most visible change in the appearance of the myopic fundusis the presence of the peripapillary crescent, which is also knownas b-peripapillary atrophy (Curcio et al., 2000; Jonas et al., 1989;Kubota, Jonas, & Naumann, 1993). The bright appearance of thecrescent reflects the absence of the retinal pigment epithelium(RPE) and choroid. The presence of an optic disc crescent thereforesuggests that the excessive scleral stretching as myopia develops isnot mirrored by the RPE and choroid at the region of the crescent.
The structural changes due to the formation of the peripapillarycrescent have been studied thoroughly with histological samples.Histological findings have shown that the photoreceptors, RPE,and choroid fall short at the temporal margin of the crescent inmyopia (Grossniklaus & Green, 1992) with a partial loss of the pho-toreceptors and a complete loss of the RPE at the atrophic area(Curcio et al., 2000; Kubota, Jonas, & Naumann, 1993). The scleraunderneath the crescent also appears stretched in pathologicalmyopia (Yasuzumi et al., 2003).
Clinically, it has been shown that the frequency of peripapillarycrescents increases with increasing axial length (Curtin & Karlin,1971; Hendicott & Lam, 1991) from 0% in eyes with AL of 20.0–21.4 mm to 100% in eyes with AL of 28.5 mm (Curtin & Karlin,1971). Although the presence of a crescent is associated with
ll rights reserved.
growth of the eye, a previous longitudinal study has shown thatthe distance between the foveola and the temporal edge of thecrescent remains constant as myopia progresses (Nakazawa,Kurotaki, & Ruike, 2008). All these findings suggest that the cres-cent represents an area where the strain resulting from scleralstretching, is accompanied by a slippage of the major retinal/choroidal layers as myopia progresses. This is also supported bythe increase in photoreceptor spacing on all retinal meridians withincreasing eye length, except along the nasal retinal meridian(Chui, Song, & Burns, 2008b), presumably due to a separation ofthe retina from the disc during myopic eye growth.
In the present study, we evaluate the relationship between theperipapillary crescent and axial length in 72 healthy eyes using dif-ferent imaging techniques. We tested the hypothesis that retinaland choroidal layer slippage is associated with myopic eye growthas reflected in adult eye length measurements.
2. Methods
2.1. Subjects
Seventy-two healthy subjects (35 males and 37 female; agerange 20–67 years, mean = 38, SD = ±14) participated in this study.All subjects received a complete eye examination, including a sub-jective refraction and fundus examination. Exclusion criteria forthis study included any evidence of retinal pathology (other thanmyopia) or systemic diseases. Spherical equivalent refractive

Fig. 2. Variation of retinal distance with axial length. Open symbols represent theretinal distance from the foveola to the temporal edge of the optic disc (FOD). Crosssymbols represent the retinal distance from the foveola to the temporal edge of thecrescent (FOC). The dotted and dashed lines represent the linear regression fit of theFOD and FOC in 72 subjects, respectively. The solid line represents the linearregression fit of the FOC in 46 subjects who had optic disc crescent.
T.Y.P. Chui et al. / Vision Research 51 (2011) 2132–2138 2133
errors ranged from +2.00 D to �13.75 D (mean �2.73 D; SD = ±3.21)with astigmatism less than �2.00 D when referenced to the specta-cle plane. All subjects had best corrected visual acuity of 20/20 orbetter. Only the right eye of each subject was tested in this study.Informed consent was obtained after a full explanation of the pro-cedures and consequences of the study. This study protocol wasapproved by the Indiana University Institutional Review Boardand complied with the requirements of the Declaration of Helsinki.
2.2. Procedures
2.2.1. Axial length measurementFive axial length (AL) measurements of each eye were made
using an IOL Master (Carl Zeiss Meditec, Dublin, California), andwe reported the mean AL for each eye.
2.2.2. Infrared fundus imaging and spectral domain optical coherencetomography (SDOCT) imaging
Infrared fundus imaging and SDOCT imaging were performed toobtain both en face fundus images and cross-sectional measure-ments of the posterior pole (Spectralis HRA + OCT, Heidelberg Engi-neering, Heidelberg, Germany). In this experiment, an infraredfundus image covering 30� of the central retina was obtained foreach eye, from which we measured the distance between (1) thefoveola and temporal edge of the optic disc (FOD) and (2) the fove-ola and temporal edge of the peripapillary crescent (FOC) (if pres-ent) (Fig. 1) along the horizontal axis. The retinal magnificationdifferences induced by different axial lengths were factored intoa calculation of linear retinal units as described by a previous study(Bennett, Rudnicka, & Edgar, 1994).
The foveola was located using SDOCT images obtained using asuper luminescent diode with a wavelength of 870 nm as a lightsource. The axial and lateral resolutions of the SDOCT were approx-imately 7 lm and 14 lm, respectively. A 15� � 15� raster scan cen-tered at the fovea consisting of 73 horizontal b-scans was obtainedin each subject using the manufacturer supplied eye-tracking fea-ture (Automatic Real Time, ART). Each b-scan was composed of 768equally spaced a-scans. The separation between b-scans was
Fig. 1. Retinal distances measured on the infrared fundus image. Both FOD and FOCwere measured along the horizontal axis from the foveola to the optic disc marginor the crescent margin.
Fig. 3. The difference of FOD and FOC as a function of axial length. Optic disccrescent presents in 64% of the subjects with an average of 0.42 mm in width. Linearregression to the data is showed by the solid line.
Table 1Demographic data of the six subjects tested with SDOCT and AOSLO.
SubjectNo.
Age Rx (D) AL (mm) Crescent width(mm)
1 54 +0.50 23.50 0.1752 31 �6.75 25.42 0.6623 24 �8.25 26.87 1.2634 24 �6.00 25.51 05 26 �4.75 26.51 0.8916 43 �4.75 26.23 0.629
Mean ± SD 33.67 ± 12.27 �5.00 ± 3.00 25.67 ± 1.20 0.60 ± 0.46
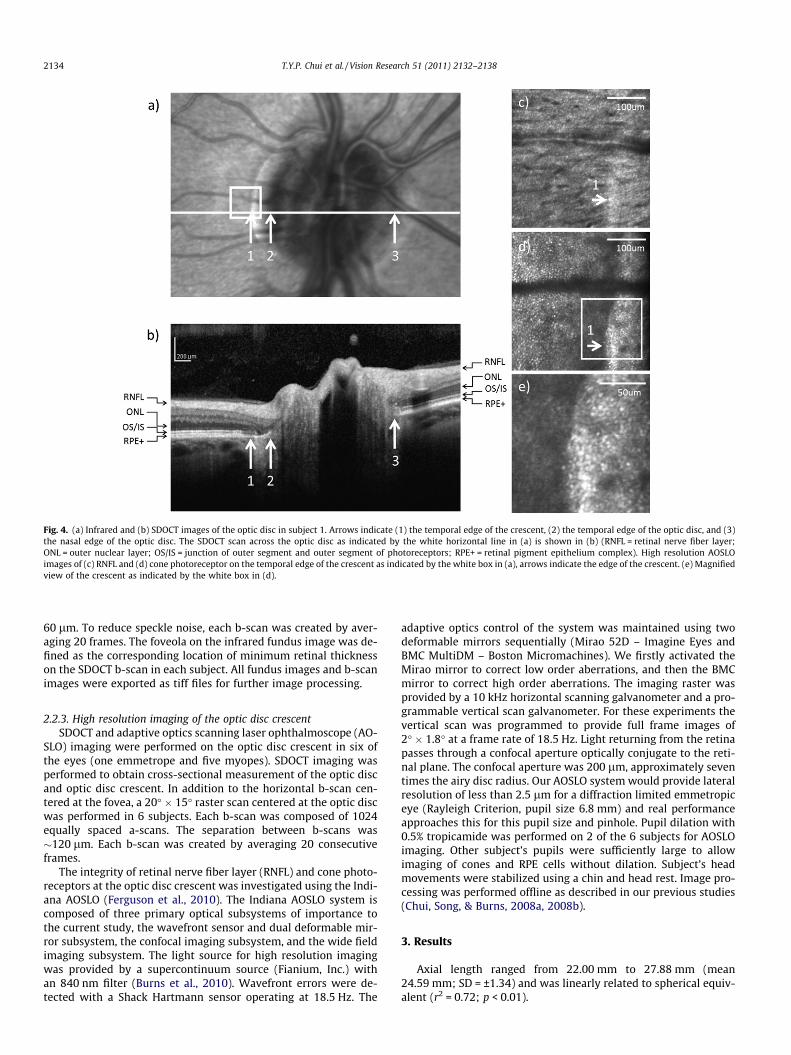
Fig. 4. (a) Infrared and (b) SDOCT images of the optic disc in subject 1. Arrows indicate (1) the temporal edge of the crescent, (2) the temporal edge of the optic disc, and (3)the nasal edge of the optic disc. The SDOCT scan across the optic disc as indicated by the white horizontal line in (a) is shown in (b) (RNFL = retinal nerve fiber layer;ONL = outer nuclear layer; OS/IS = junction of outer segment and outer segment of photoreceptors; RPE+ = retinal pigment epithelium complex). High resolution AOSLOimages of (c) RNFL and (d) cone photoreceptor on the temporal edge of the crescent as indicated by the white box in (a), arrows indicate the edge of the crescent. (e) Magnifiedview of the crescent as indicated by the white box in (d).
2134 T.Y.P. Chui et al. / Vision Research 51 (2011) 2132–2138
60 lm. To reduce speckle noise, each b-scan was created by aver-aging 20 frames. The foveola on the infrared fundus image was de-fined as the corresponding location of minimum retinal thicknesson the SDOCT b-scan in each subject. All fundus images and b-scanimages were exported as tiff files for further image processing.
2.2.3. High resolution imaging of the optic disc crescentSDOCT and adaptive optics scanning laser ophthalmoscope (AO-
SLO) imaging were performed on the optic disc crescent in six ofthe eyes (one emmetrope and five myopes). SDOCT imaging wasperformed to obtain cross-sectional measurement of the optic discand optic disc crescent. In addition to the horizontal b-scan cen-tered at the fovea, a 20� � 15� raster scan centered at the optic discwas performed in 6 subjects. Each b-scan was composed of 1024equally spaced a-scans. The separation between b-scans was�120 lm. Each b-scan was created by averaging 20 consecutiveframes.
The integrity of retinal nerve fiber layer (RNFL) and cone photo-receptors at the optic disc crescent was investigated using the Indi-ana AOSLO (Ferguson et al., 2010). The Indiana AOSLO system iscomposed of three primary optical subsystems of importance tothe current study, the wavefront sensor and dual deformable mir-ror subsystem, the confocal imaging subsystem, and the wide fieldimaging subsystem. The light source for high resolution imagingwas provided by a supercontinuum source (Fianium, Inc.) withan 840 nm filter (Burns et al., 2010). Wavefront errors were de-tected with a Shack Hartmann sensor operating at 18.5 Hz. The
adaptive optics control of the system was maintained using twodeformable mirrors sequentially (Mirao 52D – Imagine Eyes andBMC MultiDM – Boston Micromachines). We firstly activated theMirao mirror to correct low order aberrations, and then the BMCmirror to correct high order aberrations. The imaging raster wasprovided by a 10 kHz horizontal scanning galvanometer and a pro-grammable vertical scan galvanometer. For these experiments thevertical scan was programmed to provide full frame images of2� � 1.8� at a frame rate of 18.5 Hz. Light returning from the retinapasses through a confocal aperture optically conjugate to the reti-nal plane. The confocal aperture was 200 lm, approximately seventimes the airy disc radius. Our AOSLO system would provide lateralresolution of less than 2.5 lm for a diffraction limited emmetropiceye (Rayleigh Criterion, pupil size 6.8 mm) and real performanceapproaches this for this pupil size and pinhole. Pupil dilation with0.5% tropicamide was performed on 2 of the 6 subjects for AOSLOimaging. Other subject’s pupils were sufficiently large to allowimaging of cones and RPE cells without dilation. Subject’s headmovements were stabilized using a chin and head rest. Image pro-cessing was performed offline as described in our previous studies(Chui, Song, & Burns, 2008a, 2008b).
3. Results
Axial length ranged from 22.00 mm to 27.88 mm (mean24.59 mm; SD = ±1.34) and was linearly related to spherical equiv-alent (r2 = 0.72; p < 0.01).
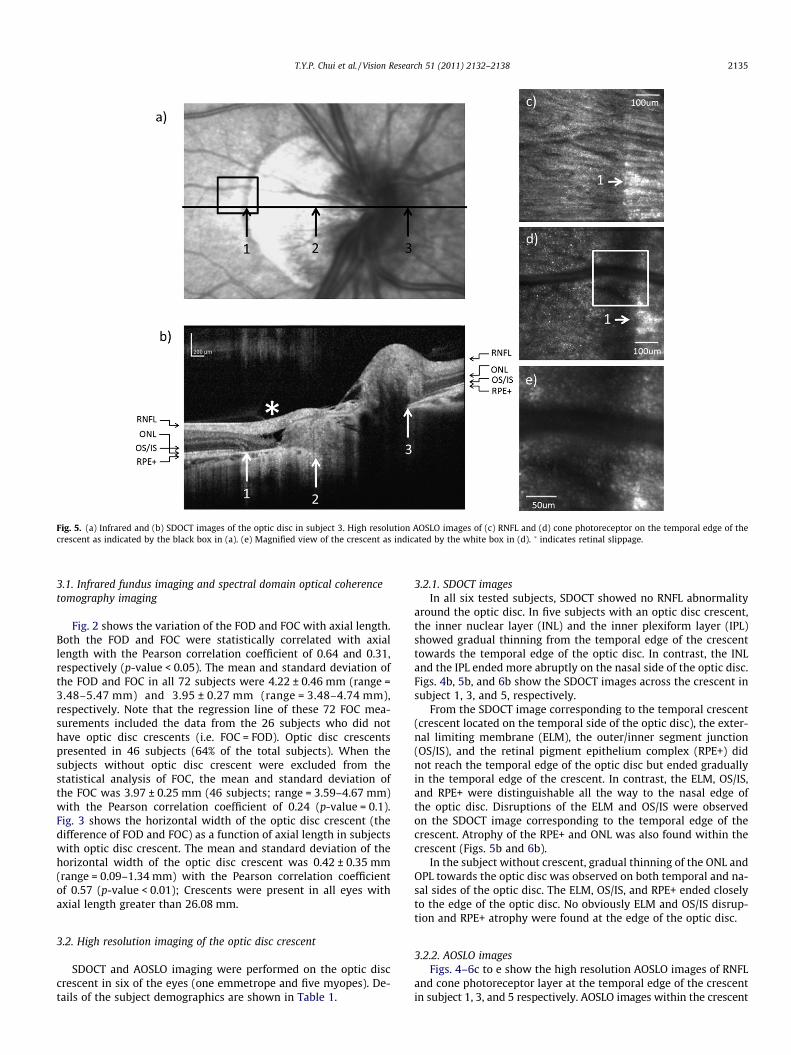
Fig. 5. (a) Infrared and (b) SDOCT images of the optic disc in subject 3. High resolution AOSLO images of (c) RNFL and (d) cone photoreceptor on the temporal edge of thecrescent as indicated by the black box in (a). (e) Magnified view of the crescent as indicated by the white box in (d). � indicates retinal slippage.
T.Y.P. Chui et al. / Vision Research 51 (2011) 2132–2138 2135
3.1. Infrared fundus imaging and spectral domain optical coherencetomography imaging
Fig. 2 shows the variation of the FOD and FOC with axial length.Both the FOD and FOC were statistically correlated with axiallength with the Pearson correlation coefficient of 0.64 and 0.31,respectively (p-value < 0.05). The mean and standard deviation ofthe FOD and FOC in all 72 subjects were 4.22 ± 0.46 mm (range =3.48–5.47 mm) and 3.95 ± 0.27 mm (range = 3.48–4.74 mm),respectively. Note that the regression line of these 72 FOC mea-surements included the data from the 26 subjects who did nothave optic disc crescents (i.e. FOC = FOD). Optic disc crescentspresented in 46 subjects (64% of the total subjects). When thesubjects without optic disc crescent were excluded from thestatistical analysis of FOC, the mean and standard deviation ofthe FOC was 3.97 ± 0.25 mm (46 subjects; range = 3.59–4.67 mm)with the Pearson correlation coefficient of 0.24 (p-value = 0.1).Fig. 3 shows the horizontal width of the optic disc crescent (thedifference of FOD and FOC) as a function of axial length in subjectswith optic disc crescent. The mean and standard deviation of thehorizontal width of the optic disc crescent was 0.42 ± 0.35 mm(range = 0.09–1.34 mm) with the Pearson correlation coefficientof 0.57 (p-value < 0.01); Crescents were present in all eyes withaxial length greater than 26.08 mm.
3.2. High resolution imaging of the optic disc crescent
SDOCT and AOSLO imaging were performed on the optic disccrescent in six of the eyes (one emmetrope and five myopes). De-tails of the subject demographics are shown in Table 1.
3.2.1. SDOCT imagesIn all six tested subjects, SDOCT showed no RNFL abnormality
around the optic disc. In five subjects with an optic disc crescent,the inner nuclear layer (INL) and the inner plexiform layer (IPL)showed gradual thinning from the temporal edge of the crescenttowards the temporal edge of the optic disc. In contrast, the INLand the IPL ended more abruptly on the nasal side of the optic disc.Figs. 4b, 5b, and 6b show the SDOCT images across the crescent insubject 1, 3, and 5, respectively.
From the SDOCT image corresponding to the temporal crescent(crescent located on the temporal side of the optic disc), the exter-nal limiting membrane (ELM), the outer/inner segment junction(OS/IS), and the retinal pigment epithelium complex (RPE+) didnot reach the temporal edge of the optic disc but ended graduallyin the temporal edge of the crescent. In contrast, the ELM, OS/IS,and RPE+ were distinguishable all the way to the nasal edge ofthe optic disc. Disruptions of the ELM and OS/IS were observedon the SDOCT image corresponding to the temporal edge of thecrescent. Atrophy of the RPE+ and ONL was also found within thecrescent (Figs. 5b and 6b).
In the subject without crescent, gradual thinning of the ONL andOPL towards the optic disc was observed on both temporal and na-sal sides of the optic disc. The ELM, OS/IS, and RPE+ ended closelyto the edge of the optic disc. No obviously ELM and OS/IS disrup-tion and RPE+ atrophy were found at the edge of the optic disc.
3.2.2. AOSLO imagesFigs. 4–6c to e show the high resolution AOSLO images of RNFL
and cone photoreceptor layer at the temporal edge of the crescentin subject 1, 3, and 5 respectively. AOSLO images within the crescent

Fig. 6. (a) Infrared and (b) SDOCT images of the optic disc in subject 5. High resolution AOSLO images of (c) RNFL and (d) cone photoreceptor on the temporal edge of thecrescent as indicated by the white box in (a). (e) Magnified view of the crescent as indicated by the white box in (d).
2136 T.Y.P. Chui et al. / Vision Research 51 (2011) 2132–2138
showed normal RNFL striation. The RNFL bundles were wellorganized and distinctive. No localized uneven reflectivity of theRNFL was observed. Cone photoreceptors were visualized at thetemporal margin of the crescent, which agrees with SDOCT esti-mates of the position of the edge of the ONL. In Figs. 4–6d and e,cone photoreceptors are seen as bright spots due to their fiber op-tic waveguide properties (Burns et al., 1995; Miller et al., 1996;Roorda & Williams, 2002; Stiles & Crawford, 1933; van Blokland,1986). Rods are not readily seen with the smaller pupils used inthis study. RPE cells near the crescent were visualized in 4 of the6 subjects using directly back scattered light. Fig. 7b and c showthat several RPE cells were visualized at the retinal area just out-side the crescent in subject 4. Hexagonal packing structure of theRPE cells is also observed. The center to center spacing of theRPE cells was �15.2 lm.
4. Discussion
4.1. Retinal dimensions
In the present study, we have investigated the relationship be-tween peripapillary crescent and axial length in 72 eyes with dif-ferent axial lengths using different retinal imaging techniques.Direct comparisons of the data from previous studies are difficult,owing to the differences in the definition of FOD and FOC. Whileprevious studies measured the retinal distance along a line whichconnects the foveola to the optic disc and the temporal crescentmargin directly, the present study measured the horizontal retinaldistance between the foveola and the optic disc (Fig. 1). Assumingthat the foveola is located 6.11� below the horizontal meridianpassing through the optic disc center (Williams & Wilkinson,
1992) and this angular distance is relatively constant among sub-jects (Rohrschneider, 2004) , we computed the retinal distance be-tween the foveola and the optic disc margin along the horizontalaxis (computed FOD) for the data obtained from previous studies(Mok & Lee, 2002; Williams & Wilkinson, 1992). Our FOD data isapproximately 5–10% larger than the computed FOD data reportedby previous studies for normal healthy subjects; our mean FOCdata of 3.97 mm, however, are in close agreement with the FODdata reported by the same studies with the mean value of3.82 mm (Mok & Lee, 2002) and 4.01 mm (Williams & Wilkinson,1992).
Our FOD and FOC data are consistent with a previous longitudi-nal study that while the FOD increases, the FOC remains constantas myopia progresses (Nakazawa, Kurotaki, & Ruike, 2008). Accord-ing to our findings, as axial length increased by 10%, the FOD in-creases by 13%, but the FOC only expands by 4%. The FOD andFOC data in both studies imply that the outer neural retina doesnot follow the retinal stretching pattern along the nasal side ofthe eye. That is, it emphasizes that stretching in the outer neuralretina may not mirror that of the sclera and subretinal tissue. Theseresults explains our previous finding of cone packing density be-tween the fovea and optic nerve changed less than that predictedby observed eye growth (Chui, Song, & Burns, 2008b). It appearsas though the retina beneath the papillomacular bundle is main-taining an approximately constant length, and the growth inducedstrain which would otherwise cause retinal stretching, is amelio-rated in some cases by an increased crescent size.
If optic disc crescent formation is due to excessive oculargrowth as myopia progresses, one might expect that the widthof the crescent would associate with increasing myopia. Unlikethe present study, a previous study has shown that the size of

Fig. 7. (a) Infrared fundus image and (b) high resolution AOSLO images of the optic disc edge in subject 4. Arrows indicate the temporal edge of the optic disc. (c) Magnifiedview of the AOSLO image as indicated by the white box in (b).
T.Y.P. Chui et al. / Vision Research 51 (2011) 2132–2138 2137
crescents was not associated with increasing AL after excludingthe eyes without crescents (Fulk et al., 1992; Hendicott & Lam,1991). This discrepancy is probably due to the fact that our dataof crescent width are measured after correcting the retinal magni-fication induced by different axial lengths.
Understanding the changes in retinal dimensions associatedwith eye growth could improve our ability to better understandthe eye growth pattern during myopia development. Axial elonga-tion in myopia necessarily implies an increase in ocular surfacearea, suggesting a mechanical stretching on the retinal layers.Strang, Winn, and Bradley (1998) suggested three types of stretch-ing models in myopia: global expansion, posterior pole stretchingand equatorial stretching (Strang, Winn, & Bradley, 1998). Whilethe global stretching model assumes a uniform stretching acrossthe eyeball, the posterior pole stretching model assumes that ocu-lar stretching solely occurs at the posterior pole. Both the globalstretching and posterior stretching model predict an increase inFOD and FOC due to the radial expansion pattern at the posteriorpole. On the other hand, the equatorial stretching model assumesthat ocular stretching is limited to the equator of the eye, andwould therefore, predict a constant FOD and FOC due to the unaf-fected posterior pole. If the posterior pole expands uniformly as inthe global expansion model, we would expect that a 10% increasesin axial length would induce a 10% in both FOD and FOC (Fig. 8,dashed lines). In contrast, if the axial elongation is mainly due tothe stretching at the equator as in the equatorial stretching model,we would expect a constant FOD and FOC (Fig. 8, light solid lines).According to our data, however, the FOD and FOC increase approx-imately 13% and 4%, respectively. That is, while our FOD data is inclose agreement with the global expansion model of eye growththat occurs uniformly with a consequent increase in FOD, ourFOC data is consistent with the equatorial stretching model. Thus,
our data suggests that while the optic disc shifts nasally as myopiaprogresses, the outer neural retina does not follow such a stretch-ing pattern.
4.2. High resolution imaging of the peripapillary crescent
As myopia develops, the retina must expand its surface area tocover the increased area of the enlarged eyeball. One of the majorclinical signs of retinal stretching is the presence of a peripapillarycrescent, which suggests thinning and pulling of the RPE and cho-roid away from the optic disc. In the present study, the cross sec-tional configurations of the peripapillary retina were investigatedin 6 of the eyes using SDOCT. From the SDOCT images, the incom-plete loss of ONL and the absence of the RPE+ layers closely corre-spond to the extent of the crescents on the infrared fundus images.This structural abnormality within the crescent is also known asperipapillary atrophy. Previous histopathological studies have cat-egorized peripapillary atrophy into zone-a and zone-b. Whereaszone-a shows a disrupted RPE layer, zone-b represents a completeloss of the RPE layer and a partial loss of the photoreceptors at theaffected peripapillary retina (Curcio et al., 2000; Fantes & Ander-son, 1989; Kubota, Jonas, & Naumann, 1993). Therefore, our SDOCTimages further support previous histological findings of zone-batrophy within the crescent. Our results support the hypothesisthat as the eye is growing there is slippage of the major retinal lay-ers as the sclera eye grows. This slippage is most apparent at theoptic disc, where the tension established by scleral growth appearsto be relieved by a separation of the overlying outer retinal layersand RPE.
Of particular note is that one of the subjects showed a localizedperipapillary retinoschisis with the retina splitting into two dis-tinct layers within the crescent (Fig. 5b). The presence of columns
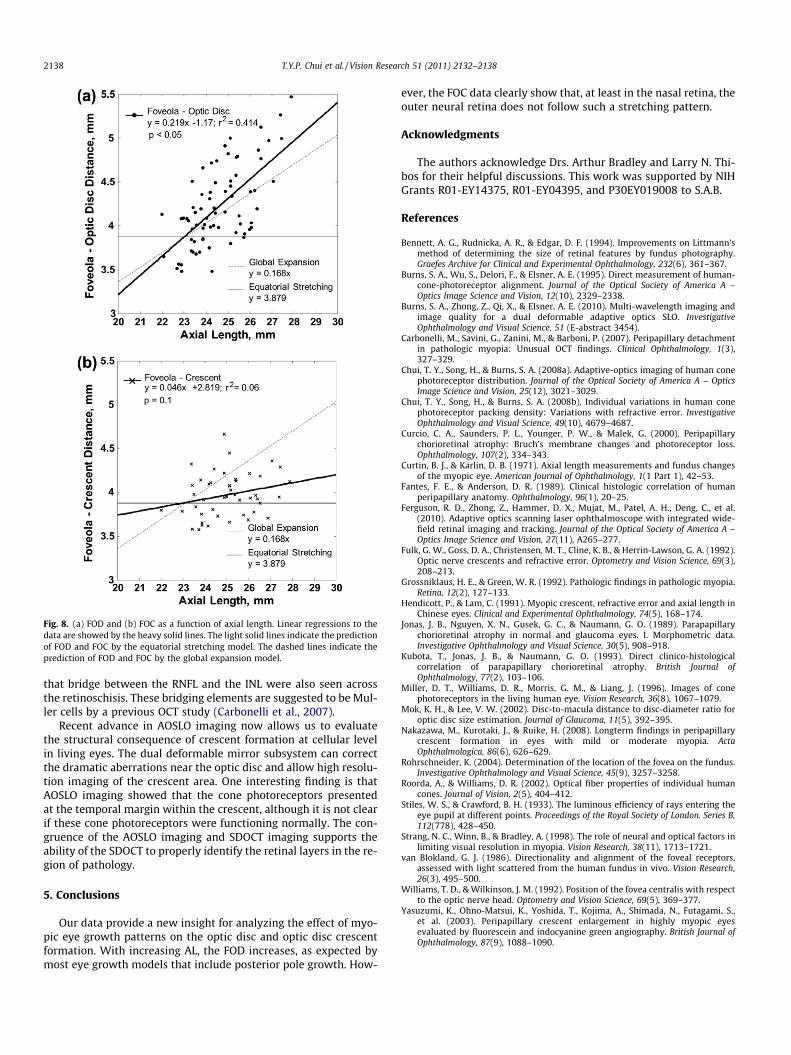
Fig. 8. (a) FOD and (b) FOC as a function of axial length. Linear regressions to thedata are showed by the heavy solid lines. The light solid lines indicate the predictionof FOD and FOC by the equatorial stretching model. The dashed lines indicate theprediction of FOD and FOC by the global expansion model.
2138 T.Y.P. Chui et al. / Vision Research 51 (2011) 2132–2138
that bridge between the RNFL and the INL were also seen acrossthe retinoschisis. These bridging elements are suggested to be Mul-ler cells by a previous OCT study (Carbonelli et al., 2007).
Recent advance in AOSLO imaging now allows us to evaluatethe structural consequence of crescent formation at cellular levelin living eyes. The dual deformable mirror subsystem can correctthe dramatic aberrations near the optic disc and allow high resolu-tion imaging of the crescent area. One interesting finding is thatAOSLO imaging showed that the cone photoreceptors presentedat the temporal margin within the crescent, although it is not clearif these cone photoreceptors were functioning normally. The con-gruence of the AOSLO imaging and SDOCT imaging supports theability of the SDOCT to properly identify the retinal layers in the re-gion of pathology.
5. Conclusions
Our data provide a new insight for analyzing the effect of myo-pic eye growth patterns on the optic disc and optic disc crescentformation. With increasing AL, the FOD increases, as expected bymost eye growth models that include posterior pole growth. How-
ever, the FOC data clearly show that, at least in the nasal retina, theouter neural retina does not follow such a stretching pattern.
Acknowledgments
The authors acknowledge Drs. Arthur Bradley and Larry N. Thi-bos for their helpful discussions. This work was supported by NIHGrants R01-EY14375, R01-EY04395, and P30EY019008 to S.A.B.
References
Bennett, A. G., Rudnicka, A. R., & Edgar, D. F. (1994). Improvements on Littmann’smethod of determining the size of retinal features by fundus photography.Graefes Archive for Clinical and Experimental Ophthalmology, 232(6), 361–367.
Burns, S. A., Wu, S., Delori, F., & Elsner, A. E. (1995). Direct measurement of human-cone-photoreceptor alignment. Journal of the Optical Society of America A –Optics Image Science and Vision, 12(10), 2329–2338.
Burns, S. A., Zhong, Z., Qi, X., & Elsner, A. E. (2010). Multi-wavelength imaging andimage quality for a dual deformable adaptive optics SLO. InvestigativeOphthalmology and Visual Science, 51 (E-abstract 3454).
Carbonelli, M., Savini, G., Zanini, M., & Barboni, P. (2007). Peripapillary detachmentin pathologic myopia: Unusual OCT findings. Clinical Ophthalmology, 1(3),327–329.
Chui, T. Y., Song, H., & Burns, S. A. (2008a). Adaptive-optics imaging of human conephotoreceptor distribution. Journal of the Optical Society of America A – OpticsImage Science and Vision, 25(12), 3021–3029.
Chui, T. Y., Song, H., & Burns, S. A. (2008b). Individual variations in human conephotoreceptor packing density: Variations with refractive error. InvestigativeOphthalmology and Visual Science, 49(10), 4679–4687.
Curcio, C. A., Saunders, P. L., Younger, P. W., & Malek, G. (2000). Peripapillarychorioretinal atrophy: Bruch’s membrane changes and photoreceptor loss.Ophthalmology, 107(2), 334–343.
Curtin, B. J., & Karlin, D. B. (1971). Axial length measurements and fundus changesof the myopic eye. American Journal of Ophthalmology, 1(1 Part 1), 42–53.
Fantes, F. E., & Anderson, D. R. (1989). Clinical histologic correlation of humanperipapillary anatomy. Ophthalmology, 96(1), 20–25.
Ferguson, R. D., Zhong, Z., Hammer, D. X., Mujat, M., Patel, A. H., Deng, C., et al.(2010). Adaptive optics scanning laser ophthalmoscope with integrated wide-field retinal imaging and tracking. Journal of the Optical Society of America A –Optics Image Science and Vision, 27(11), A265–277.
Fulk, G. W., Goss, D. A., Christensen, M. T., Cline, K. B., & Herrin-Lawson, G. A. (1992).Optic nerve crescents and refractive error. Optometry and Vision Science, 69(3),208–213.
Grossniklaus, H. E., & Green, W. R. (1992). Pathologic findings in pathologic myopia.Retina, 12(2), 127–133.
Hendicott, P., & Lam, C. (1991). Myopic crescent, refractive error and axial length inChinese eyes. Clinical and Experimental Ophthalmology, 74(5), 168–174.
Jonas, J. B., Nguyen, X. N., Gusek, G. C., & Naumann, G. O. (1989). Parapapillarychorioretinal atrophy in normal and glaucoma eyes. I. Morphometric data.Investigative Ophthalmology and Visual Science, 30(5), 908–918.
Kubota, T., Jonas, J. B., & Naumann, G. O. (1993). Direct clinico-histologicalcorrelation of parapapillary chorioretinal atrophy. British Journal ofOphthalmology, 77(2), 103–106.
Miller, D. T., Williams, D. R., Morris, G. M., & Liang, J. (1996). Images of conephotoreceptors in the living human eye. Vision Research, 36(8), 1067–1079.
Mok, K. H., & Lee, V. W. (2002). Disc-to-macula distance to disc-diameter ratio foroptic disc size estimation. Journal of Glaucoma, 11(5), 392–395.
Nakazawa, M., Kurotaki, J., & Ruike, H. (2008). Longterm findings in peripapillarycrescent formation in eyes with mild or moderate myopia. ActaOphthalmologica, 86(6), 626–629.
Rohrschneider, K. (2004). Determination of the location of the fovea on the fundus.Investigative Ophthalmology and Visual Science, 45(9), 3257–3258.
Roorda, A., & Williams, D. R. (2002). Optical fiber properties of individual humancones. Journal of Vision, 2(5), 404–412.
Stiles, W. S., & Crawford, B. H. (1933). The luminous efficiency of rays entering theeye pupil at different points. Proceedings of the Royal Society of London. Series B,112(778), 428–450.
Strang, N. C., Winn, B., & Bradley, A. (1998). The role of neural and optical factors inlimiting visual resolution in myopia. Vision Research, 38(11), 1713–1721.
van Blokland, G. J. (1986). Directionality and alignment of the foveal receptors,assessed with light scattered from the human fundus in vivo. Vision Research,26(3), 495–500.
Williams, T. D., & Wilkinson, J. M. (1992). Position of the fovea centralis with respectto the optic nerve head. Optometry and Vision Science, 69(5), 369–377.
Yasuzumi, K., Ohno-Matsui, K., Yoshida, T., Kojima, A., Shimada, N., Futagami, S.,et al. (2003). Peripapillary crescent enlargement in highly myopic eyesevaluated by fluorescein and indocyanine green angiography. British Journal ofOphthalmology, 87(9), 1088–1090.