the relationship between maternal pre-pregnancy …ftp.iza.org/dp9608.pdf · unobservable factors...
TRANSCRIPT

Forschungsinstitut zur Zukunft der ArbeitInstitute for the Study of Labor
DI
SC
US
SI
ON
P
AP
ER
S
ER
IE
S
The Relationship between Maternal Pre-Pregnancy BMI and Preschool Obesity
IZA DP No. 9608
December 2015
Susan L. AverettErin K. Fletcher

The Relationship between
Maternal Pre-Pregnancy BMI and Preschool Obesity
Susan L. Averett Lafayette College
and IZA
Erin K. Fletcher
Harvard University
Discussion Paper No. 9608 December 2015
IZA
P.O. Box 7240 53072 Bonn
Germany
Phone: +49-228-3894-0 Fax: +49-228-3894-180
E-mail: [email protected]
Any opinions expressed here are those of the author(s) and not those of IZA. Research published in this series may include views on policy, but the institute itself takes no institutional policy positions. The IZA research network is committed to the IZA Guiding Principles of Research Integrity. The Institute for the Study of Labor (IZA) in Bonn is a local and virtual international research center and a place of communication between science, politics and business. IZA is an independent nonprofit organization supported by Deutsche Post Foundation. The center is associated with the University of Bonn and offers a stimulating research environment through its international network, workshops and conferences, data service, project support, research visits and doctoral program. IZA engages in (i) original and internationally competitive research in all fields of labor economics, (ii) development of policy concepts, and (iii) dissemination of research results and concepts to the interested public. IZA Discussion Papers often represent preliminary work and are circulated to encourage discussion. Citation of such a paper should account for its provisional character. A revised version may be available directly from the author.

IZA Discussion Paper No. 9608 December 2015
ABSTRACT
The Relationship between Maternal Pre-Pregnancy BMI and Preschool Obesity
The increasing prevalence of obesity during pregnancy raises concerns over the intergenerational transmission of obesity and its potential to exacerbate the current obesity epidemic. The fetal origins hypothesis posits that the intrauterine environment might have lasting effects on children’s outcomes. A large literature establishes that mother’s pre-pregnancy obesity is correlated with obesity in her children. However, previous research is largely based on comparing individuals across families and hence cannot control for unobservable factors associated with both maternal and child obesity. We use both within-family comparisons and an instrumental variable approach on a sample of 4435 children to identify the effect of maternal pre-pregnancy obesity on obesity in preschool-aged children. Consistent with extant research, OLS models that rely on across-family comparisons indicate a significant correlation between maternal pre-pregnancy obesity and preschool obesity. However, maternal fixed effects render those associations insignificant. Instrumenting for mother’s BMI with her sisters’ BMI values confirms the null result indicating that the in utero transmission of obesity is likely not driving the increase in childhood obesity. JEL Classification: I12, J13 Keywords: preschool obesity, pre-pregnancy obesity, gestational weight gain Corresponding author: Susan Averett Lafayette College Department of Economics Easton, PA 18042 USA E-mail: [email protected]

1 Introduction and Previous Literature
Childhood obesity has more than doubled in the past 30 years (Ogden et al., 2014). While
alarming on its own, recent research has also shown that obesity is persistent and associated
with long-term health consequences: Obese children are more likely to be obese as adults
and are at greater risk of type 2 diabetes, heart disease, stroke and certain cancers (Pan et
al., 2012; Ogden et al., 2014). Authors of a recent study showed that one third of children
who were overweight in kindergarten were obese by eighth grade, and almost every child who
was obese remained that way as an adult (Cunningham et al., 2014). Calculations based
on U.S. data indicate spending on obesity-related illnesses could be as high as 20 percent of
annual health care expenditures (Cawley and Meyerhoefer, 2012).
In addition to the well known health consequences of obesity, research has also linked
childhood obesity to poor cognitive outcomes, although the evidence is mixed as to whether
the effect is causal (Kaestner and Grossman, 2009; Averett and Stifel, 2010; Zavodney,
2013). Capogrossi et al., (2013) posit that the effects of childhood obesity on cognitive
outcomes might be particularly acute for lower performing students. In addition, there is
mounting evidence that obese children suffer emotional and behavioral problems (Griffiths
et al., 2011). The consensus among experts is that it is far easier and less costly to prevent
childhood obesity rather than to reverse it (Oken et al., 2003; Whitaker, 2004). The goal
of this paper is to examine a potential early determinant of obesity, whether there is a
direct, observable link to childhood obesity from maternal obesity prior to pregnancy, using
a large-scale, national survey.
Maternal obesity also has been significantly associated with pregnancy complications.
Indeed, the research shows that obesity is fast becoming the most common complication of
pregnancy in the U.S. (McDonald, 2010; Lu et al., 2001). Underscoring the magnitude of
2

the problem, pre-pregnancy obesity prevalence continues to increase; in 2009 1 in 5 preg-
nant women were obese when they became pregnant (Fisher, 2013). Medical professionals
have long stressed the dangers of obesity and excessive weight gain during pregnancy and
highlighted how they might affect the pregnancy and the health of the fetus (Boney, 2005;
Whitaker, 2004). An increasing awareness of these links has led to repeated updating of
weight gain recommendations. As recently as 2009 the Institute of Medicine (IOM) issued
revised guidelines for healthy pregnancy weight gain.1 Recent research has investigated
whether pre-pregnancy maternal obesity is associated with adverse birth outcomes (Yan,
2015; Averett and Fletcher, forthcoming).
The hypothesis that maternal pre-pregnancy obesity and/or excess weight gain during
pregnancy might have an effect on childhood obesity has standing in the literature. Scholars
from various disciplines have established that pregnancy is a critical time for children’s
development and that a mother’s decisions and environmental exposures during pregnancy
can have profound effects on birth and later life outcomes. For example, the fetal origins
hypothesis posits that the uterine environment can have far-reaching and lasting impacts on
adult health (Almond and Currie, 2011). In this theory chronic, degenerative conditions of
adult health, including heart disease and type 2 diabetes, might be triggered by circumstances
occurring decades earlier, such as in utero nutrition2
The fetal origins theory posits that obesity is passed from mothers to children through
high concentrations of glucose and fatty acids that pass through the placenta. Mothers with
high pre-pregnancy BMI and those who gain excessive amounts of weight during pregnancy
have more fat and thus deliver greater concentrations of glucose and fatty acids to the
developing fetus (Catalano, 2003; Lawlor et al., 2008; Lawlor et al., 2011). The resulting
3

increase in fetal insulin accelerates fetal growth and predisposes the child to weight gain later
in life (Lawlor et al., 2008; Lawlor et al., 2011).3
Numerous studies using observational data have documented a correlation between ma-
ternal obesity (either pre-pregnancy or excess pregnancy weight gain) and childhood obesity
(e.g. Salsberry et al., 2007; Whitaker, 2004; Oken et al., 2007; Oken, 2009; Jaaskelainen et
al., 2011; Branum et al., 2011; Yu et al., 2013; Ludwig et al., 2013). Studies that focus solely
on a cross-section of children generally show that maternal pre-pregnancy obesity and/or
excess gestational weight gain (GWG) lead to an increased probability of childhood obesity
(e.g. Oken et al., 2003; Oken et al., 2007; Whitaker, 2004).
A primary challenge in using observational data to make cross-family comparisons of un-
related children concerning the effect of pre-pregnancy obesity on childhood obesity is that
the comparisons might reflect not only the intrauterine effects of maternal pre-pregnancy obe-
sity but also obesity-promoting or environmental factors that are shared between a mother
and her child (Lau et al., 2014; Ludwig et al., 2013). Some risk factors for childhood obesity
are observable and reflect post-natal interactions between mother and child, such as time
spent watching television, dietary patterns, or the general quality of the home environment
(Strauss and Knight, 1999; Reilly et al., 2005). Therefore, cross-section estimates could suf-
fer from omitted variable bias. When these omitted variables are positively correlated with
a woman’s pre-pregnancy obesity, studies may overstate the effects of her pre-pregnancy
obesity on her children’s obesity. This has led researchers to compare children of the same
mother (i.e. using mother fixed-effects models) to control for shared familial influences that
are unobserved but do not vary across time.
For example, Branum et al., (2011), using data on over 2700 families interviewed in the
Collaborative Perinatal Project, find in OLS models that pre-pregnancy weight and GWG
4
are statistically significantly associated with BMI z-scores in four-year old children but this
effect disappears in family fixed effects models. Using data on over 146,000 Swedish males,
Lawlor et al., (2011) find no association between GWG and BMI at age 18 when comparing
siblings. In contrast, Ludwig et al., (2013) using data on all school-age children in Arkansas,
find evidence in a maternal fixed-effects model that high pregnancy weight gain is associated
with childhood overweight status. They use this as support for the fetal origins explanation
that maternal obesity might program the fetus for future weight gain and obesity, though
they state that “the magnitude of the effect may be small” (Ludwig, et al., 2013, p. 5).
Despite the advantages afforded by maternal fixed-effects models, they cannot control
for time-varying factors that could be important. Thus, at least one previous study has
turned to the method of Instrumental Variables (IV). Lawlor et al., (2008) use data on
over 4000 families from the U.K. and in OLS models find a significant association between
pre-pregnancy BMI and childhood BMI at ages 9 to 11. This effect disappears when they
instrument for pre-pregnancy BMI with an obesity genotype as a predictor of pre-pregnancy
BMI.4
Given the health costs and potential cognitive consequences associated with childhood
obesity in the literature, we seek to add to this literature and identify whether a woman’s
weight status before pregnancy and her weight gain during pregnancy exert a potentially
causal effect on childhood obesity. If there is evidence that obesity is transmitted from
mothers to children during pregnancy, policy and practice aimed at reducing maternal weight
before pregnancy and controlling for weight gain during gestation might have profound health
impacts for not only the women themselves, but also their children.
Like much of the existing research (e.g. Oken et al., 2003; Whitaker, 2004), we focus
on children aged 2 to 4 years to avoid the confounding influence of the school environment
5

and its potential effect on obesity. Milliment and Tchernis (2015) find that transitions to
kindergarten are often correlated with movements in BMI percentile, so this sample criterion
is important. To preview the results, similar to previous studies that have used maternal
fixed effects or IV, we find little evidence that maternal pre-pregnancy BMI exerts a causal
impact on obesity among preschool-aged children. The rest of the paper is structured as
follows. In the next section, we discuss our data, sample creation and the variables we
use. Following that, we discuss our method and then our results. We end by drawing some
conclusions.
2 Data, Sample Creation and Variables
We use the National Longitudinal Survey of Youth 1979 (NLSY79) cohort for our analysis
(Bureau of Labor Statistics, 2012). The NLSY79 sampled 12,686 individuals between the
ages of 14 and 21 in 1979 with annual interviews conducted until 1994 and subsequent
interviews every other year up to the year 2010 (the most recent year available at the time
of this paper). The respondents report data on their labor market experience, births, and
marriages every survey round. Of utmost importance to our study, children who were born
to women in the NLSY79 have been surveyed biannually since 1986. In 2010, the mothers
were ages 45-53. Thus, for nearly all women in the sample, complete fertility histories are
observed. In fact, 99.97 percent of births used in this study occur by 2000 and the most recent
births we observe in our sample occurred in 2004. These data do not provide a nationally
representative sample of children or young adults. Rather, they are regarded appropriately
as representative of the population of offspring born to U.S. women who were aged 14–22 in
1979 (Wu and Li, 2005).
6

In our sample, observations are at the child level. Thus, mothers may appear multiple
times, once for each birth. We start with a sample of all women in the NLSY and their
children in the years they are sampled. We calculate each child’s age- and sex-specific BMI
percentile using the 2000 CDC reference data (CDC, 2000). Children with a BMI percentile
for their age and sex over 85 are considered by health professionals to be at risk of overweight
while those with BMI percentiles over 95 are described as overweight. To be consistent with
the adult categories of overweight and obese we refer to children with BMI percentiles greater
than 85 as overweight and those with BMI percentiles greater than 95 as obese.
The CDC growth charts were devised using survey data from three nationally represen-
tative samples of boys and girls aged 2 to 20 during the years 1963 to 1994.5 Thus, when a
child is identified as overweight in our sample, it indicates that his BMI is higher than 85%
of surveyed children of his age during the reference time period. By definition, 5 percent
of children are obese in the reference sample, but the metric allows for variance in obesity
prevalence over time and in our sample.
In addition, and crucial to this study, the NLSY collected information on the height and
weight of respondents and for each pregnancy we can observe the mother’s pre-pregnacy
height and weight. In particular, for mothers, weight is collected every round and height
was collected in four rounds: 1981, 1982, 1985 and 2006. A mother’s pre-pregnancy BMI
is our key explanatory variable of interest. We use the self-reported heights from 1985 and
weights from each recorded year preceding a birth to create pre-pregnancy BMI. According
to their BMI, mothers are each placed into one of four categories using the World Health
Organization Cutoffs. Underweight corresponds to a BMI of less than or equal to 18.5; BMI
in the recommended range is between 18.5 and 24.9; overweight women are those with a
BMI ranging from 25 to 29.9; and obese women have a BMI greater than or equal to 30.
7
The NLSY also asks women to self-report their GWG in pounds for each pregnancy, which
we control for in all of our models.
To create our analysis sample, we start with a sample of 8265 NLSY children observed
from 1986 to 2010 who are 24 to 59 months old and for whom we have information on
height and weight so that we can calculate their BMI percentile score. Because, as we noted
above, the key explanatory variable of interest is mother’s pre-pregnancy BMI, we drop the
1348 observations where this information is missing. In addition, because pre-term births
have their own set of complications, we further limit our sample to those children who were
not born preterm (eliminating an additional 845 observations), and those whose gestation
length was in excess of 42 weeks (169 observations), and those born below 500 grams (6
observations) or above 7000 grams (2 observations). We also drop 42 women who reported
having diabetes during the year they had a birth.6
Because the NLSY is longitudinal, some of the children are observed multiple times in
their preschool years. When this is the case we take only their first observation (dropping
an additional 1214 observations). We also drop multiple births (34 observations) and those
children for whom information on breastfeeding and c-section birth were not reported (170).
This leaves us with a sample of 4435 children. Of those, 1774 have no siblings in the sample.
1758 have one sibling in the sample, 672 have two siblings in the sample, 220 have three
siblings in the sample and 35 have four siblings in the sample and 6 have five siblings in the
sample. Of the 2691 mothers with more than one child in the sample, 1781 did not change
their pre-pregnancy weight category across births. Mothers of 910 children changed their
pre-pregnancy BMI category between pregnancies; of those, 213 changes were to a lower
BMI category while the rest were to a higher BMI category.
8

Our focus in this paper is on the effect of mother’s pre-pregnancy obesity on her preschool
aged child’s obesity status. However, as noted in the introduction, other factors such as
dietary habits, genetics and the quality of the child’s home environment might also affect
weight outcomes. The NLSY is a particularly rich source of data and we control for many
covariates to attempt to isolate the effect of mother’s pre-pregnancy weight on her preschool-
aged child’s weight. In particular, we control for mother’s age, age at first birth, parity,
education, urban residence, marital status and income; these means are shown in Table 2.7
We also control for the child’s age in months, birth order, birth weight, gender, and race.
In addition, we include controls for the month of the mother’s first prenatal visit, whether
she smoked or used alcohol during the pregnancy, whether or not the child was breastfed, and
the home environment using the Home Observation for Measurement of the Environment
(HOME) score.8 In the next section, we detail our econometric specifications.
3 Methods
3.1 OLS
Using the sample of mothers with singleton births over our sample period, we test whether
pre-pregnancy obesity and GWG are correlated with obesity among two-, three-, and four-
year olds using the following OLS specification:
yimt = α +Oimtβ +Ximtφ+ Zmξ + Ttθ + εimt (3.1)
where y is the ith child’s BMI the first time they appear in the sample between the ages
of two and four, for the mth mother in the tth year. O is a vector representing the mth
mother’s weight, either as a continuous measure of BMI, or a series of dichotomous variables
indicating underweight, overweight or obese status and a control for GWG for each child
(pregnancy) i in year t. The primary coefficient of interest is the vector β. Xim is a vector
9
of variables specific to each child as shown in Table 2 (e.g. child’s age in months, the HOME
score, mother’s education, marital status, mother’s age at the birth, parity, whether she
smoked, used alcohol or prenatal vitamins during the pregnancy and the month of her first
prenatal visit, the child’s birth weight, whether the child was breastfed, and whether the
child was born via c-section). The vector Z includes a mother’s characteristics that do not
vary with each child, which include mother’s race and her age at first birth. Tt is the vector
of year fixed effects.
3.2 Maternal Fixed Effects
As noted earlier, genetics and other time-invariant characteristics of the mother could af-
fect our outcomes of interest. These characteristics might include chronic health conditions,
health habits, or environmental exposure. For this reason, we add mother fixed effects to
our initial OLS specification in order to account for a mother’s time-invariant characteristics.
This specification allows us to compare births across mothers and the effect of pre-pregnancy
BMI is now identified off of mothers whose pre-pregnancy BMI status changes over pregnan-
cies. The specification is as listed in 3.1 but with mother fixed effects (γm) as follows:
yimt = α +Oimtβ +Ximtφ+ γm + Ttθ + εimt (3.2)
Note that the Zm vector drops out from this specification because these characteristics do
not vary across children. This specification only includes those mothers who had more than
one child in the sample. Identification of the parameters on the maternal pre-pregnancy BMI
categories comes from discordant siblings (i.e. siblings whose mother changed pre-pregnancy
BMI categories).
10

3.3 Instrumental Variables
Our OLS models establish a correlation between maternal obesity and preschool obesity.
This association disappears when we use a maternal fixed-effects specification which is con-
sistent with much of the literature, as described earlier. While the maternal fixed-effects
methodology is an improvement over the OLS specifications, this method cannot control
for time-varying, unobservable factors that might affect both mother and child obesity.
These factors include a mother’s pre- and post-natal behavior that could either reinforce
or compensate for a child’s initial health endowments and concerns about intergenerational
transmission of obesity. As a result, we cannot assert definitively that a causal relationship
exists between maternal pre-pregnancy obesity and childhood obesity using either OLS or
maternal fixed effects. In order to address the issue of causality, we turn to the IV method.
The NLSY lacks genetic information so we cannot use the same instrument as Lawlor et al.
(2008) but we are able to exploit the large-scale nature and sampling design of the NLSY79
to secure an instrument. In particular, among the original respondents to the NLSY are
a number of siblings. In the past, economists have used information on siblings and twins
as controls or instruments by appealing to the argument that biological siblings and twins
share many genes. Thus, using the BMI of a sibling as an instrument provides variation in
obesity propensity that is independent of the outcome of interest except through its effect
on obesity.
Drawing on previous work by Cawley (2004), we instrument the BMI of the mothers
in our sample using the BMI of the sisters of our NLSY79 mothers, a group we expect to
have similar health and obesity status as the mothers in the sample. We use BMI of sisters,
but exclude that of brothers due to the lack of agreement regarding the comparability of
men’s and women’s BMI values. Identification is obtained as in Cawley (2004), who explains
11

that on average half of any individual’s genetic material is shared with siblings of the same
parents. Thus, a sister’s BMI should be a good predictor of an individual’s BMI. This
identification strategy is threatened if shared family environment is a significant predictor
of obesity. We address this in a few ways. First, we include HOME score in our models to
control for the quality of the home environment. In our OLS models, we found no association
between HOME score and childhood obesity. Secondly, we refer to the literature, which has
shown little to no observable effect of shared family environment on obesity (e.g., Grilo and
Pogue-Geile 1991, Wardle et al., 2008). Finally, although previous literature cannot entirely
rule out that family environment has some effect, we rely on the fact that sisters no longer
live together and thus any effects of shared family environment would be less important
in adulthood. Sister obesity status (or aunt obesity, from the perspective of the child) is
plausibly exogenous to child obesity; as long as the aunt is not the child’s primary caretaker,
aunt obesity should influence the child’s obesity only through the genetics that are shared
between sisters and shared between mothers and children. The model we estimate is given
by:
Oimt = γ +Bimtζ +Ximtφ+ Zmξ + Ttθ + µimt (3.3)
yimt = α + Oimtβ +Ximtφ+ Zmξ + Ttθ + εimt (3.4)
where Bim is the average BMI of any sisters interviewed in the year of mth mother’s birth.
y is now the ith child’s (child of the mth mother) obesity status in year t. The variable of
interest, mother’s weight status, O, remains as defined in 3.1. We use the predicted values
of O, O in the second stage. As before, Tt is a vector of year fixed effects.9
Using the average BMI of all sisters interviewed as an instrument is plausibly more
exogenous than a mother’s own BMI, which might be correlated with exercise and eating
habits that are also practiced by children. Because we only have one instrument, in this
12

specification we measure mother’s pre-pregnancy BMI as a continuous variable as opposed
to the categories used in earlier regressions. We note that our genetic instrument, however,
is most likely to be informative about the genetic channels of inter-generational transmission
of obesity.
4 Results
4.1 Descriptive Statistics and OLS
Table 1 presents descriptive statistics for the outcome variables by the mother’s pre-pregnancy
BMI category. The unadjusted means reveal that the average BMI percentile scores increase
as a mother’s BMI category increases indicating a positive correlation between a mother’s
BMI and her child’s BMI. We also see that the proportion of children who are overweight or
obese increases as a mother’s BMI increases.
Tables 3 and 4 show four OLS specifications starting from the most parsimonious, and
then progressively adding relevant controls. Table 3 shows these specification for the de-
pendent variable measured as overweight (BMI percentile>85) and Table 4 for obese (BMI
percentile>95). The first column of each table presents results from a model that only in-
cludes the mother’s pre-pregnancy BMI categories, her GWG and a set of binary indicators
for child’s age in months. These unadjusted regressions reveal that mothers who begin their
pregnancies obese have preschoolers who are 9.5 percentage points more likely to be over-
weight and 7.3 percentage points more likely to be obese. Both effects are large with the 9.5
percentage point increase in the probability of being overweight translating to a 36.8% in-
crease in the probability of a child falling into the overweight category ((9.5/25.41)*100=38.7)
and the 7.3 percentage point increase in the probability of obesity translating into a 48.8%
((7.3/14.95)*100=48.8) increase in the probability of preschool obesity.
13
In column 2, we add in the child’s birth weight as a covariate. Previous researchers
have found that child birth weight attenuates the effect of mother’s pregnancy weight gain
on childhood obesity (e.g. Ludwig et al., 2013). Birth weight in pounds is positively and
significantly related to both the probability of being overweight and obese as a preschooler.
An additional pound at birth translates into a 2.1 percentage point (8.6 percent) increase in
the probability of being overweight and a 1.2 percentage point (8.1 percent) increase in the
probability of obesity. Consistent with previous literature, adding this variable only slightly
attenuates the coefficients on a mother’s pre-pregnancy BMI.
In column 3 we add a set of year dummy variables (coefficients not shown in the table).
The coefficients on these year dummies reveal that children born in the later years of our
sample are more likely to be overweight or obese which is consistent with the upward trend in
childhood obesity seen in the U.S. Including these year fixed effects reduces the magnitude of
the coefficients on both the pre-pregnancy overweight and obese variables, but they remain
statistically significant and still exert a sizeable effect.
In column 4 we add the full set of covariates shown in Table 2 although due to space
limitations we only show some of the coefficients. There are several notable findings. First,
the addition of these covariates further attenuates the effect of maternal pre-pregnancy obe-
sity on a preschooler’s likelihood of being overweight or obese but these coefficients are still
statistically significant.10 In particular, our findings indicate that women who begin their
pregnancies obese are 4.6 percentage points more likely to have an obese preschooler than
those who begin their pregnancies in the recommended BMI range. Second, children of
married mothers and those who were breastfed are less likely to be overweight or obese.
However, children born via c-section are more likely to be overweight and obese. Third, we
observe mixed results on race/ethnicity: Hispanic children are more likely to be overweight
14

and obese but we see no effect for black children relative to white children. We also find
that birth order is negatively related to obesity but not to overweight status. Lastly, we find
that the HOME environment is not a significant predictor of preschool obesity or overweight
status.
4.2 Maternal Fixed Effects
While our OLS results establish a clear correlation between pre-pregnancy BMI and preschool
overweight and obesity even after controlling for a rich set of covariates, they do not necessar-
ily establish a causal relationship. As noted in the introduction, there are some unmeasured
factors that could be correlated with mother’s pre-pregnancy obesity and her child’s obesity.
As one example, we have no information on shared family mealtimes, some aspects of which
have been linked to obesity outcomes (Fiese et al., 2012). We are also unable to observe diet
and exercise habits. To move closer to potentially causal effects, we turn to the results of our
maternal fixed-effects models, which are shown in Table 5. We show the FE results in two
panels: the top panel has the overweight outcome and the bottom panel the obese outcome.
All models include the full set of covariates shown in Table 2 and in the last column of Tables
3 and 4.
In each panel, the first column presents the OLS results to facilitate comparisons across
models. The second column presents the FE model that is identical in specification to
the OLS model. This model is identified off of those mothers whose pre-pregnancy BMI
category changed across pregnancies, for instance, a mother who is in the recommended
weight category before her first pregnancy and is in the overweight category before her
second would be in this sample as would a mother who moved from the overweight to
the underweight category between pregnancies. However, women who lose weight between
pregnancies might be quite different than those who gain weight. Thus, in the third column
15
of this table we present the FE model for only those who gained weight between pregnancies,
a group which constitutes the majority of the changers. Finally, because mothers with more
than two children might be quite different from mothers with two children (the majority
of women in our sample with more than one child have two children) the last column (5)
limits the sample to mothers with only two children who gained weight between their first
and second pregnancy. The results from these specifications reveal that regardless of the
sample, we find no effect of pre-pregnancy BMI on preschool overweight or obesity. Finally,
we also performed a similar set of regressions excluding first-born children. In consideration
of space, we do not show these results, but similar to the other specifications, they show no
measurable relationship between pre-pregnancy BMI and preschool obesity status.11
Overall, the maternal fixed-effects results indicate no statistically significant effect of
pre-pregnancy BMI on our outcomes of interest.12 The point estimates are often smaller
than the OLS estimates and occasionally switch signs. As expected, the standard errors
are larger. These estimates indicate that once we have controlled for time-invariant, family-
specific factors, there is no effect of maternal pre-pregnancy BMI on preschool overweight or
obesity.
In order for the maternal fixed-effects approach to be valid as we noted above, any
change in maternal BMI between two pregnancies should be exogenous and unrelated to
all the potential confounders that might induce a spurious positive relationship between
maternal and child BMI. However many of these confounders are precisely those that are
likely to change following a pregnancy. These include health habits such as smoking, diet
and exercise, stress, and the home environment more generally. These are all potentially
altered by the birth of a child, especially the first child. Because of this, we also run our
models on the subsample of second and later born children. For brevity, we do not show the
16
results, but they are consistent with other models: We find no significant effect of maternal
pre-pregnancy obesity on preschool obesity in the sample consisting of second born and later
born children. We do caution that the sample sizes become smaller and hence our estimates
are less precise.
4.3 Instrumental Variables
In Table 6, we present the results of our IV regressions. We also show OLS and FE models
in this table to facilitate comparisons. Columns 1 and 2 are the IV model on the relevant
sample. Because the IV model is estimated on a smaller sample size (only on those women
who have a sister in the NLSY) we limit our OLS and FE results to that sample to facilitate
comparisons. Columns 3 and 4 are the OLS model on the full sample and columns 5 and 6
are the FE models. All models include the full set of covariates (though some of these drop
out in the FE models). We also do not include GWG in these models as we only have one
instrument and GWG is likely endogenous.13 Our first stage F-statistic is 86.79 indicating
a strong instrument, predictive of mother’s BMI. In these models, we see no evidence of an
impact of a mother’s predicted pre-pregnancy BMI on the probability that her preschooler is
overweight or obese. As expected, the IV standard errors are larger than the OLS standard
errors although comparable to those of the FE model when using the same sample.
We have focused our attention on overweight and obese as categories since these are the
conditions associated with health concerns. In appendix 1, we also examine the continuous
variable of child’s BMI percentile as an outcome. We show IV, OLS, and FE models. The
same pattern holds in these models: our OLS results indicate a strong positive effect of
mother’s pre-pregnancy BMI on her child’s preschool BMI percentile which disappears in
FE and IV models.
17

5 Discussion and Conclusions
Evidence from numerous studies establishes a strong relationship between maternal obesity
and childhood obesity. However, the extent to which such findings represent more than a
correlation is unclear. Studies based solely on a single cross section of data cannot definitively
address correlation as a third factor that causes both the maternal obesity and the childhood
obesity might be responsible for the positive correlation. Here, we examine a snapshot
of obesity before the mother becomes pregnant and attempt to determine whether these
correlations stand up to stricter identification strategies including one depending on within-
family variation and another on an IV strategy. We consider childhood obesity before the
child enters school, thus eliminating estimation problems that might arise from heterogeneous
content and quality of schooling.
This paper contributes to the literature in the following ways. Our study is novel in
that we use both maternal fixed-effects (FE) and instrumental variable (IV) estimation
in an attempt to ascertain whether the well-established correlation between material pre-
pregnancy obesity and childhood obesity is potentially causal. Our study also allows for
assessment of both GWG and pre-pregnancy BMI, whereas much of the literature (e.g.,
Ludwig et al., 2013) can only account for GWG. Other papers have used maternal fixed-
effects models to examine these questions using data from only one U.S. state (e.g. Ludwig
et al., 2013), or use older national-level data (e.g. Branum et al., 2011). We use more recent,
national-level, U.S. data. As far as we know, we are also the first to apply the IV method
to address this research question using U.S. data.
We find, as in other studies, that there is a positive and significant relationship between
a mother’s obesity status before she becomes pregnant and her child’s obesity during the
preschool years. These correlations, however, disappear in maternal fixed-effects and IV
18

models. These results suggest that other time-invariant, mother-specific characteristics, such
as exercise habits and healthy eating, might be just as or more important than GWG or pre-
pregnancy BMI for determining healthy child outcomes. A threat to our estimation strategy
arises if mothers who changed weight categories from one pregnancy to the next were, for
instance, aware of the dangers associated with weight gain and engaged in compensatory
behavior to counteract the potential adverse effects of their pre-pregnancy weight status. In
the case that these changes are correlated with lower probability of obesity, we might not
see an effect on the probability of being an overweight or obese preschooler. However, our
IV results reinforce the maternal fixed-effects results in that they also indicate no effect of
maternal BMI on child obesity. Our results indicate that focussing too much attention on
the role of maternal obesity in fostering early childhood obesity might be misguided and
that physicians and policymakers should consider other factors when providing guidance to
families regarding healthy weight gain for children.
19

References
[1] Abrams, Barbara, Sarah L. Altman, & Kate E. Pickett. (2000). “Pregnancy weight gain:
still controversial.” American Journal of Clinical Nutrition, 71 (supply), pp. 1233S–41S.
[2] Almond, Douglas. (2006). “Is the 1918 influenza pandemic over? Long-term effects
of in utero influenza exposure in the post-1940 U.S. population.” Journal of Political
Economy, 114 (4), pp. 672-712.
[3] Almond, Douglas, & Janet Currie. (2011). “Killing Me Softly: The Fetal Origins Hy-
pothesis.” Journal of Economic Perspectives, 25 (3), pp. 153-72.
[4] Almond, Douglas, and Bhashkar Mazumder. (2011). “Health Capital and the Prena-
tal Environment: The Effect of Ramadan Observance during Pregnancy.” American
Economic Journal: Applied Economics, 3 (4), pp. 56-85.
[5] Almond, Douglas, Bhashkar Mazumder, & Reyn van Ewijk. (2001). “Fasting During
Pregnancy and Children’s Academic Performance.” NBER Working Paper No. 17713.
[6] Averett, Susan L., & Erin K. Fletcher. (2015). “Pre-pregnancy Weight and Gestational
Weight Gain: The relationship between maternal weight and infant health.” IZA Dis-
cussion Paper No. 9052. Forthcoming: Maternal and Child Health Journal.
[7] Averett, Susan L., & David C. Stifel. (2010). Race and gender differences in the cognitive
effects of childhood overweight. Applied Economics Letters, 17(17), 1673-1679.
[8] Baker, Paula, Canada Keck, Frank Mott, & Stephan Quinlan. (1993). “NLSY child
handbook: A guide to the NLSY child data.” Columbus: Center for Human Resource
Research, Ohio State University.
20
[9] Bureau of Labor Statistics (BLS). (2012). U.S. Department of Labor. National Longitu-
dinal Survey of Youth 1979 cohort, 1979-2010 (rounds 1-24). Produced and distributed
by the Center for Human Resource Research, The Ohio State University. Columbus,
OH.
[10] Boney, Charlotte M., Anila Verma, Richard Tucker, & Betty R. Vohr. (2005).
“Metabolic Syndrome in Childhood: Association with Birth Weight, Maternal Obe-
sity, and Gestational Diabetes Mellitus.” Pediatrics, 115 (290).
[11] Branum, A. M., Parker, J. D., Keim, S. A., & Schempf, A. H. (2011). “Prepregnancy
body mass index and gestational weight gain in relation to child body mass index among
siblings.” American Journal of Epidemiology, kwr250.
[12] Catalano, Patrick. M. (2003). “Obesity and Pregnancy—the Propagation of a Viscous
Cycle?” The Journal of Clinical Endocrinology and Metabolism, 88 (8).
[13] Cawley, John., & Meyerhoefer, C. (2012). “The medical care costs of obesity: an in-
strumental variables approach.” Journal of health economics, 31 (1), 219-230.
[14] Cawley, John. (2004). “The Impact of Obesity on Wages.” Journal of Human Resources,
31 (2), pp. 451-474.
[15] Centers for Disease Control. 2000. http://www.cdc.gov/nccdphp/dnpao/
growthcharts/resources/sas.htm (last accessed June 16, 2014).
[16] Cunningham, S. A., Kramer, M. R., & Narayan, K. V. (2014). Incidence of Childhood
Obesity in the United States. New England Journal of Medicine, 370 (5), pp. 403-411.
[17] Currie, Janet, and Douglas Almond. (2011). ”Human capital development before age
five.” Handbook of labor economics. 4: 1315-1486.
21

[18] Dahl, Gordon, Brian Duncan, Hani Mansour, and Daniel I. Rees. (2012) “Emotional
Cues and Low Birth Weight: Evidence from the Super Bowl.” Unpublished manuscript.
[19] Fiese, B. H., Hammons, A., & Grigsby-Toussaint, D. (2012). Family mealtimes: A
contextual approach to understanding childhood obesity. Economics & Human Biology,
10(4), 365-374.
[20] Fisher, S. C., Kim, S. Y., Sharma, A. J., Rochat, R., & Morrow, B. (2013). Is obesity
still increasing among pregnant women? “Prepregnancy obesity trends in 20 states,
2003–2009.” Preventive medicine, 56 (6), 372-378.
[21] Freedman DS, Kettel L, Serdula MK, Dietz WH, Srinivasan SR, Berenson GS. (2005)
“The relation of childhood BMI to adult adiposity: the Bogalusa Heart Study.” Pedi-
atrics, 115, pp.22–27.
[22] Griffiths, L. J., Dezateux, C., & Hill, A. (2011). “Is obesity associated with emotional
and behavioural problems in children? Findings from the Millennium Cohort Study.”
International Journal of Pediatric Obesity, 6 (2Part2), e423-e432.
[23] Grilo, C. M., & Pogue-Geile, M. F. (1991). The nature of environmental influences on
weight and obesity: a behavior genetic analysis. Psychological Bulletin, 110(3), 520.
[24] Institute of Medicine (US) and National Research Council (US) Committee to Re-
examine IOM Pregnancy Weight Guidelines; Rasmussen KM, Yaktine AL, editors.
Weight Gain During Pregnancy: Reexamining the Guidelines. Washington (DC): Na-
tional Academies Press (US); (2009.) Summary.
Available from: http://www.ncbi.nlm.nih.gov/books/NBK32799/
22

[25] Jaaskelainen, A., Pussinen, J., Nuutinen, O., Schwab, U., Pirkola, J., Kolehmainen, M.,
... & Laitinen, J. (2011). “Intergenerational transmission of overweight among Finnish
adolescents and their parents: a 16-year follow-up study.” International Journal of
Obesity, 35 (10), 1289-1294.
[26] James-Burdumy, S. (2005). “The effect of maternal labor force participation on child
development.” Journal of Labor Economics, 23:1, 177-211.
[27] Kaestner, R., & Grossman, M. (2009). Effects of weight on children’s educational
achievement. Economics of Education Review, 28 (6), 651-661.
[28] Kuczmarski RJ, Ogden CL, Grummer-Strawn LM, Flegal KM, Guo SS, Wei R et al.,
CDC Growth Charts: United States. National Center for Health Statistics: Hyattsville,
Maryland, Dec 4, 2000.
[29] Lau, E. Y., Liu, J., Archer, E., McDonald, S. M., & Liu, J. (2014). Maternal Weight
Gain in Pregnancy and Risk of Obesity among Offspring: A Systematic Review. Journal
of obesity, 2014.
[30] Lawlor, D. A., Timpson, N. J., Harbord, R. M., Leary, S., Ness, A., McCarthy, M. I.,
... & Smith, G. D. (2008). “Exploring the developmental overnutrition hypothesis using
parental–offspring associations and FTO as an instrumental variable.” PLoS Medicine,
5 (3), e33.
[31] Lawlor, Debbie A., Paul Lichtenstein, Abigail Fraser, & Niklas Langstrom, N. (2011).
“Does maternal weight gain in pregnancy have long-term effects on offspring adiposity?
A sibling study in a prospective cohort of 146,894 men from 136,050 families.” The
American journal of clinical nutrition, 94(1), 142-148.
23

[32] Ludwig, D. S., Rouse, H. L., & Currie, J. (2013). “Pregnancy weight gain and childhood
body weight: a within-family comparison.
PLoS medicine, 10 (10), e1001521.
[33] Millimet, D. L., & Tchernis, R. (2014). Persistence in body mass index in a recent
cohort of US children. Economics & Human Biology.
[34] Norton, E. C., and E. Han. (2008). ”Genetic information, obesity, and labor market
outcomes.” Health Economics, 17(9).
[35] Ogden CL, Carroll MD, Kit BK, Flegal KM. (2014) “Prevalence of childhood and adult
obesity in the United States, 2011-2012.” Journal of the American Medical Association,
311 (8), pp. 806-814.
[36] Oken, E., & Gillman, M. W. (2003). “Fetal origins of obesity.” Obesity research, 11 (4),
496-506.
[37] Oken, E. (2009). “Maternal and child obesity: the causal link.” Obstetrics and gynecol-
ogy clinics of North America, 36 (2), 361-377.
[38] Oken, E., Taveras, E. M., Kleinman, K. P., Rich-Edwards, J. W., & Gillman, M. W.
(2007). “Gestational weight gain and child adiposity at age 3 years.” American journal
of obstetrics and gynecology, 196 (4), 322-e1.
[39] Pan, L., Blanck, H. M., Sherry, B., Dalenius, K., & Grummer-Strawn, L. M. (2012).
“Trends in the prevalence of extreme obesity among US preschool-aged children living in
low-income families, 1998-2010.” Journal of the American Medical Association, 308 (24),
pp. 2563-2565.
24

[40] Prentice AM, Prentice A, Lamb WH, Lunn PG, Austin S, (1983). “Metabolic conse-
quences of fasting during Ramadan in pregnant and lactating women.” Human Nutri-
tion. Clinical Nutrition, 37(4), 283-94.
[41] Ravelli GP, ZA Stein, & MW Susser. (1976). “Obesity in young men after famine
exposure in utero and early infancy.” The New England Journal of Medicine 295:7. 349-
[42] Reilly, J. J., Armstrong, J., Dorosty, A. R., Emmett, P. M., Ness, A., Rogers, I., ... &
Sherriff, A. (2005). Early life risk factors for obesity in childhood: cohort study. British
Medical Journal. Chicago
[43] Roseboom, Tessa J., et al., (2011). “Hungry in the womb: what are the consequences?
Lessons from the Dutch famine.” Maturitas 70 (2), pp. 141-145.
[44] Salsberry, P. J., & Reagan, P. B. (2007). “Taking the long view: the prenatal environ-
ment and early adolescent overweight.” Research in nursing & health, 30 (3), 297-307.
[45] Schulz, Laura C. (2010). “The Dutch Hunger Winter and the developmental origins of
health and disease.” PNAS 107:39.
[46] Stein A. D., Ravelli, A. C., & Lumey, L. H. (1995). “Famine, third-trimester pregnancy
weight gain, and intrauterine growth: the Dutch Famine Birth Cohort Study.” Human
Biology, 135-150.
[47] Strauss, R. S., & Knight, J. (1999). Influence of the home environment on the develop-
ment of obesity in children. Pediatrics, 103(6), e85-e85.
[48] Wardle, Jane, et al. ”Evidence for a strong genetic influence on childhood adiposity
despite the force of the obesogenic environment.” The American journal of clinical
nutrition 87.2 (2008): 398-404.
25

[49] Whitaker, Robert C. (2004). “Predicting Child Obesity at Birth: The Role of Maternal
Obesity in Early Pregnancy.” Pediatrics, 114 (29).
[50] Wu, Lawrence L., & Jui-Chung Allen Li. (2005). “Children of the NLSY79: a unique
data resource.” Monthly Lab. Rev. 128, pp. 59-62.
[51] Yan, Ji. (2015). “Maternal pre-pregnancy BMI, gestational weight gain, and infant birth
weight: A within-family analysis in the United States.” Economics and Human Biology,
18, July, pp. 1-12.
[52] Yu Zhangbin, Shuping Han, Jingai Zhu, Xiaofan Sun, Chenbo Ji, & Xirong Guo.
(2013). “Pre-Pregnancy Body Mass Index in Relation to Infant Birth Weight and
Offspring Overweight/Obesity: A Systematic Review and Meta-Analysis.” PLoS ONE
8(4): e61627. doi:10.1371/journal.pone.0061627
[53] Zavodny, M. (2013). “Does weight affect children’s test scores and teacher assessments
differently?” Economics of education review, 34, 135-145.
26

6 Tables
Table 1: Sample outcome means and proportions on children’s obesity status by mother’spre-pregnancy BMI.
Sample Means (proportions) of outcome variables by Mother’s Pre-pregnancy BMIMom’s Pre-Pregnancy BMI
All Children BMI<18.5 18.5−24.9 25−29.9 BMI>30BMI percentile>95 .150 .115 .139 .171 .210(obese) (.357) (.320) (.346) (.377) (.408)BMI percentile>85 .254 .224 .237 .291 .325(overweight) (.435) (.418) (.425) (.455) (.469)BMI percentile 50.897 45.523 49.613 54.686 56.597
(35.481) (35.604) (35.252) (35.199) (36.300)Observations 4435 330 2873 817 415
Standard errors for continuous variables in parentheses
27

Table 2: Sample means and proportions for control variables
Means of Control VariablesMom’s Pre-Pregnancy BMI
All <18.5 18.5<BMI<24.9 25<BMI<29.9 >30Underweight Recommended Overweight Obese
GWG 31.919 34.094 32.589 31.681 26.017(13.816) (14.422) (12.782) (14.859) (16.388)
Child’s age 39.472 40.570 39.645 39.132 38.072(months) (9.375) (9.473) (9.443) (9.258) (8.890)Hispanic .192 .158 .188 .246 .140Black .257 .206 .238 .289 .369Child is male .509 .488 .509 .528 .494Mom’s age 22.702 21.488 22.688 22.965 23.246at first birth (4.810) (4.073) (4.793) (4.854) (5.215)Mom’s age 26.196 24.227 25.957 26.983 27.875at observed birth (4.727) (4.4674) (4.6463) (4.67) (4.812)Birth order 2.005 1.812 1.953 2.143 2.243
(1.096) (1.084) (1.054) (1.162) (1.196)HOME score 44.723 44.846 46.907 39.744 39.301
(30.390) (30.878) (30.379) (29.649) (29.790)Education years 12.728 12.385 12.777 12.764 12.591
(2.353) (2.180) (2.359) (2.497) (2.114)Married .706 .609 .716 .728 .668Sep./Div./Wid. .143 .212 .140 .125 .142Income missing .138 .142 .141 .129 .135Low Income .295 .388 .285 .285 .308Middle Income .292 .255 .287 .312 .325Urban residence .748 .718 .7466 .758 .757Month 1st prenatal 2.552 2.539 2.552 2.512 2.644
(1.668) (1.623) (1.644) (1.677) (1.841)Prenatal vitamins? .945 .946 .950 .935 .933Breastfed .527 .473 .551 .499 .468C-section .223 .146 .200 .286 .318Alcohol Use During PregnancyUnknown .001 0 0 .001 0<1/month .240 .264 .248 .222 .202Monthly .040 .052 .04 .040 .029Weekly .041 .018 .047 .027 .046Cigarette Use During PregnancyUnknown .003 .006 .004 .002 0Smoked at all .261 .361 .273 .209 .202Observations 4435 330 2873 817 415Standard deviations for continuous variables in parentheses
28
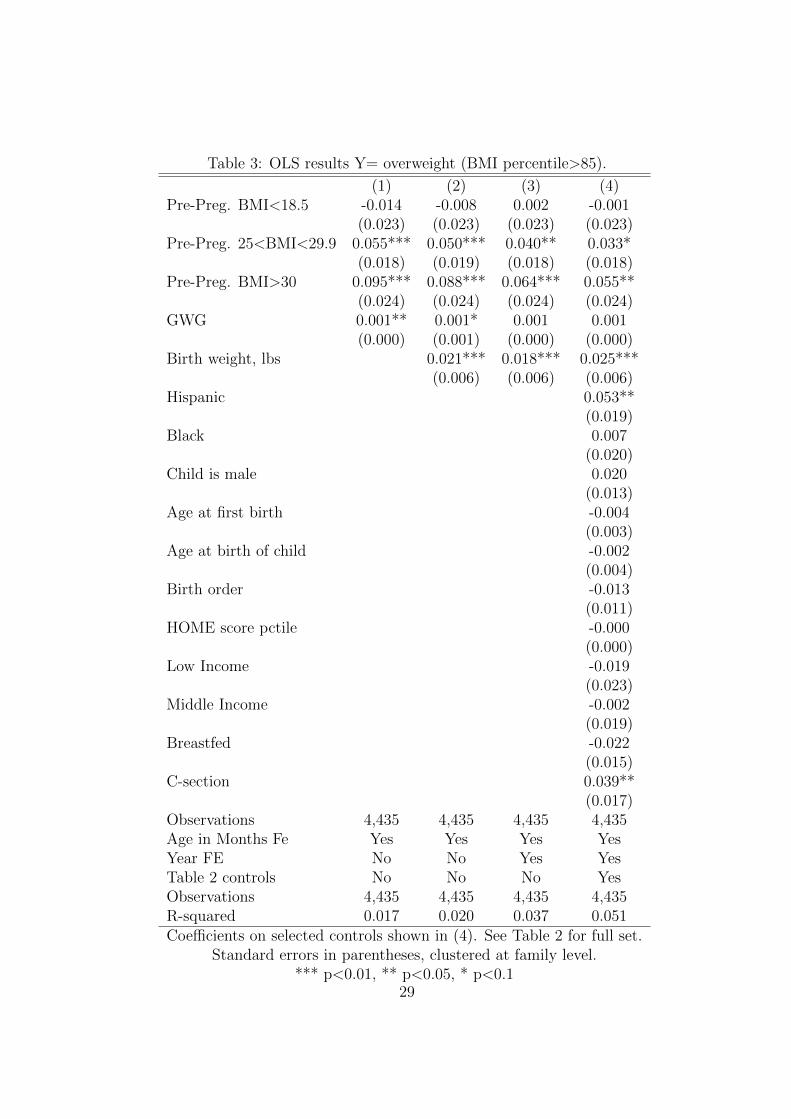
Table 3: OLS results Y= overweight (BMI percentile>85).
(1) (2) (3) (4)Pre-Preg. BMI<18.5 -0.014 -0.008 0.002 -0.001
(0.023) (0.023) (0.023) (0.023)Pre-Preg. 25<BMI<29.9 0.055*** 0.050*** 0.040** 0.033*
(0.018) (0.019) (0.018) (0.018)Pre-Preg. BMI>30 0.095*** 0.088*** 0.064*** 0.055**
(0.024) (0.024) (0.024) (0.024)GWG 0.001** 0.001* 0.001 0.001
(0.000) (0.001) (0.000) (0.000)Birth weight, lbs 0.021*** 0.018*** 0.025***
(0.006) (0.006) (0.006)Hispanic 0.053**
(0.019)Black 0.007
(0.020)Child is male 0.020
(0.013)Age at first birth -0.004
(0.003)Age at birth of child -0.002
(0.004)Birth order -0.013
(0.011)HOME score pctile -0.000
(0.000)Low Income -0.019
(0.023)Middle Income -0.002
(0.019)Breastfed -0.022
(0.015)C-section 0.039**
(0.017)Observations 4,435 4,435 4,435 4,435Age in Months Fe Yes Yes Yes YesYear FE No No Yes YesTable 2 controls No No No YesObservations 4,435 4,435 4,435 4,435R-squared 0.017 0.020 0.037 0.051Coefficients on selected controls shown in (4). See Table 2 for full set.
Standard errors in parentheses, clustered at family level.*** p<0.01, ** p<0.05, * p<0.1
29

Table 4: OLS results Y= obese (BMI percentile>95).
(1) (2) (3) (4)Pre-Preg. BMI<18.5 -0.023 -0.020 -0.011 -0.011
(0.018) (0.018) (0.018) (0.018)Pre-Preg. 25<BMI<29.9 0.032** 0.029* 0.021 0.013
(0.015) (0.015) (0.015) (0.015)Pre-Preg. BMI>30 0.073*** 0.069*** 0.049** 0.041*
(0.022) (0.022) (0.021) (0.022)GWG 0.001** 0.001 0.001 0.000
(0.000) (0.000) (0.000) (0.000)Birth weight, lbs 0.012** 0.009* 0.015**
(0.005) (0.005) (0.005)Hispanic 0.058***
(0.016)Black 0.016
(0.016)Child is male 0.016
(0.011)Mom’s age at first birth -0.005*
(0.003)Mom’s age at birth of child 0.001
(0.003)Birth order -0.019**
(0.009)HOME score pctile -0.000
(0.000)Low Income -0.026
(0.018)Middle Income -0.003
(0.015)Breastfed -0.020
(0.012)C-section 0.026*
(0.014)Age in Months Fe Yes Yes Yes YesYear FE No No Yes YesTable 2 controls No No No YesObservations 4,435 4,435 4,435 4,435R-squared 0.013 0.015 0.027 0.044
Coefficients on selected controls shown in (4). See Table 2 for full set.Standard errors in parentheses, clustered at family level
*** p<0.01, ** p<0.05, * p<0.130

Table 5: Fixed Effects results on child overweight and obese statusOLS Maternal FE
OverweightSample All All Gainers 2 Kids Gainers/2 Kids
(1) (2) (3) (4) (5)Pre-Preg. BMI<18.5 -0.001 0.040 0.040 0.029 0.066
(0.023) (0.062) (0.071) (0.083) (0.099)Pre-Preg. 25<BMI<29.9 0.033* -0.076* -0.084* -0.069 -0.096
(0.018) (0.042) (0.050) (0.057) (0.065)Pre-Preg. BMI>30 0.055** -0.038 -0.049 0.040 -0.036
(0.024) (0.067) (0.076) (0.100) (0.105)GWG 0.001 -0.001 -0.001 -0.001 -0.002
(0.000) (0.001) (0.001) (0.001) (0.002)Table 2 controls Yes Yes Yes Yes YesObservations 4,435 2,691 2,478 1,758 1,672R-squared 0.051 0.066 0.070 0.097 0.110Number of CASEID 1,166 1,085 879 836
ObeseSample All All Gainers 2 Kids Gainers/2 Kids
(1) (2) (3) (4) (5)Pre-Preg. BMI<18.5 -0.011 0.034 0.062 0.089 0.144**
(0.018) (0.047) (0.047) (0.069) (0.071)Pre-Preg. 25<BMI<29.9 0.013 -0.059 -0.079** -0.008 -0.040
(0.015) (0.036) (0.040) (0.053) (0.059)Pre-Preg. BMI>30 0.041* 0.007 -0.018 0.047 -0.008
(0.022) (0.061) (0.072) (0.096) (0.103)GWG 0.000 -0.002** -0.002** -0.002 -0.003*
(0.000) (0.001) (0.001) (0.001) (0.001)Table 2 controls Yes Yes Yes Yes YesObservations 4,435 2,691 2,478 1,758 1,672R-squared 0.050 0.075 0.083 0.112 0.124Number of CASEID 1,166 1,085 879 836
All models contain full set of controls as shown in Table 2.Standard errors in parentheses, clustered at family level.
*** p<0.01, ** p<0.05, * p<0.1
31
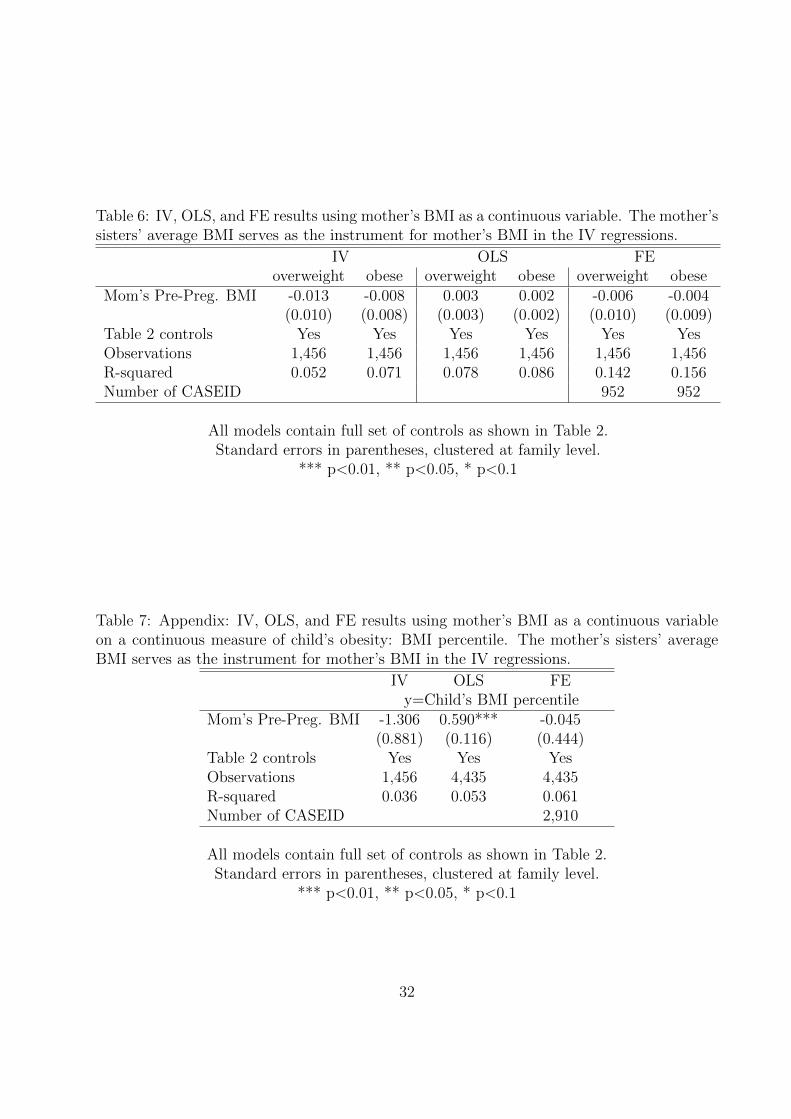
Table 6: IV, OLS, and FE results using mother’s BMI as a continuous variable. The mother’ssisters’ average BMI serves as the instrument for mother’s BMI in the IV regressions.
IV OLS FEoverweight obese overweight obese overweight obese
Mom’s Pre-Preg. BMI -0.013 -0.008 0.003 0.002 -0.006 -0.004(0.010) (0.008) (0.003) (0.002) (0.010) (0.009)
Table 2 controls Yes Yes Yes Yes Yes YesObservations 1,456 1,456 1,456 1,456 1,456 1,456R-squared 0.052 0.071 0.078 0.086 0.142 0.156Number of CASEID 952 952
All models contain full set of controls as shown in Table 2.Standard errors in parentheses, clustered at family level.
*** p<0.01, ** p<0.05, * p<0.1
Table 7: Appendix: IV, OLS, and FE results using mother’s BMI as a continuous variableon a continuous measure of child’s obesity: BMI percentile. The mother’s sisters’ averageBMI serves as the instrument for mother’s BMI in the IV regressions.
IV OLS FEy=Child’s BMI percentile
Mom’s Pre-Preg. BMI -1.306 0.590*** -0.045(0.881) (0.116) (0.444)
Table 2 controls Yes Yes YesObservations 1,456 4,435 4,435R-squared 0.036 0.053 0.061Number of CASEID 2,910
All models contain full set of controls as shown in Table 2.Standard errors in parentheses, clustered at family level.
*** p<0.01, ** p<0.05, * p<0.1
32

Notes
1In this paper, we include gestational weight gain as an independent variable, but do notfocus on healthy weight gain.
2A large, related literature uses natural experiments to determine the effect of intrauterineenvironment on child health (e.g., Almond, 2006; Almond and Muzumder, 2011; Schulz, 2010;Stein et al., 1995; Prentice, 1983; Ravelli, 1976).
3Animal studies confirm the detrimental effects of maternal obesity on offspring. Forexample, Samuelsson, et al., (2007) show that diet-induced obesity in pregnant mice resultsin higher rates of insulin resistance and adiposity in their offspring.
4Other scholars (e.g. Norton and Han, 2008) have used genetic information from biomark-ers as instruments for obesity when examining the effect of obesity on labor market outcomes.These scholars argue that genes that change the propensity of a person to be obese providenatural variation, as long as those genes are not correlated with other behavioral factorsand hence instrumental variables created from this genetic information allow researchersto control for the endogeneity of obesity and obtain consistent estimates of the causal ef-fect of obesity on labor market outcomes. Unfortunately, the NLSY does not contain suchinformation
5These data are compiled from the NHANES I, II, and III surveys.
6These are similar to the sample inclusion criteria used by Ludwig et al., 2013. Wecannot distinguish gestational diabetes from other types of diabetes in the data, so we dropall women with any diabetes diagnosis in the year of pregnancy.
7As is common in survey data, a significant number of women do not report their income.Rather than delete them, we measure income categorically including a category for miss-ing. These categories are adjusted for inflation. Our results are not sensitive to includingcontinuous measure of income in place of the categories.
8A general discussion of this measure can be found at: https://www.nlsinfo.org/content/cohorts/nlsy79-children/topical-guide/assessments/home-home-observation-measurement, accessed 05/01/2015.A complete list of questions used to construct the HOME z-scores can be found at https://www.nlsinfo.org/content/cohorts/nlsy79-children/other-documentation/codebook-supplement/appendix-home-sf-scales (accessed 05/01/2015).The HOME score measures the quality of the home environment provided by a child’s familyand includes questions regarding the cleanliness of the home, whether the play environmentin the home is safe for children, whether regular meals are eaten, whether television timeis limited, what type of discipline is used, how often parents read to the child and whetherparents assist with homework among other questions
33
9Cawley, 2004 adjusts the instrument for age. Because we use the average of the sisters’BMI we have not made an age adjustment. Fixed effects are not used in the IV regressions.
10This suggests that there might selection on unobservables, which underscores the im-portance of pursuing other estimation strategies.
11The fixed-effects sample is naturally smaller than the OLS sample given that only moth-ers with more than one child are in this sample. To be sure that our FE results are not drivenby this difference in sample composition, we ran our OLS models on this smaller sample andfind qualitatively the same results which we do not show here. This gives us confidence thatour FE results are not an artifact of a smaller sample.
12Some FE specifications yield negative and significant results where they are unexpected.We cannot provide an intuitive explanation for these, but they are not robust and disappearin our preferred specification.
13We also performed these regressions excluding GWG for comparison purposes. Theresults are qualitatively the same and are available upon request.
34