the relationship between classroom climate and … · the relationship between classroom climate...
TRANSCRIPT
THE RELATIONSHIP BETWEEN CLASSROOM CLIMATE
AND STUDENT ACHIEVEMENT
Jan Bennett, B.M.E., M.E.
Dissertation Prepared for the Degree of
DOCTOR OF EDUCATION
UNIVERSITY OF NORTH TEXAS
December 2001
APPROVED:
William Camp, Major ProfessorJames Laney, Minor ProfessorMillie Gore, Committee MemberJane Huffman, Committee MemberJean Keller, Dean of the College of EducationSandra Terrell, Dean of the Robert B.
Toulouse School of Graduate Studies

Bennett, Jan, The Relationship Between Classroom Climate and Student
Achievement. Doctor of Education (Educational Administration), December 2001, 121
pp., 12 tables, references, 133 titles.
The purpose of this study was to determine the relationship between sixth grade
students’ academic achievement levels in math and their perceptions of school climate.
Student characteristics of socioeconomic status and gender were used to identify groups
for the purpose of data analysis. Data was gathered using the five independent variables
of the My Class Inventory (satisfaction, friction, competitiveness, difficulty, and
cohesiveness) and the dependent variable of the Stanford Achievement Total Math
scores. The results of the data collection were tested using a Pearson product-moment
analysis and a backward multiple regression analysis. A univariate analysis of variance
was also used to compare the five independent variables of the My Class Inventory as
well as to compare socioeconomic status and gender with the Stanford Achievement
Total Math scores. The schools selected for this study were from a city in Texas with a
population of approximately 100,000. The sample consisted of 262 sixth grade
mathematics students.
The findings of this study are as follows: (a) The Pearson product-moment
correlation analysis revealed little, if any, correlation for any of the five subscale
predictor variables; (b) the multiple regression analysis revealed that all five classroom
climate indicators combined together could explain only 10.5% of the variance in
mathematics achievement; (c) the univariate analysis of variance revealed that there is a
significant relationship between the climate factors of friction and difficulty when
compared to mathematics achievement; and (d) the univariate analysis of variance also
ii

revealed that mathematics achievement scores vary significantly as a function of
economic category membership, but there appears to be no relationship to gender.
iii

iv
ACKNOWLEDGMENTS
I express my appreciation to all who were instrumental in the realization of this
study. This research was not a singular effort, and to all who contributed, I am grateful.
I thank Dr. William Camp, my committee chairman, for his encouragement,
assistance, wise counsel, and ability to push me to a higher level of excellence. I also thank
Dr. Millie Gore and Dr. James Laney for their expertise, positive attitudes, and guidance.
Without these professors’ efforts, this dissertation would never have been completed.
To my husband, Wayne Bennett, a source of strength and encouragement, I am
deeply grateful. He is a constant sounding board, cheerleader, data collector, and
proofreader. I also thank my mother, Dorothy Moore, who believes I can do anything and
who assisted in scoring and organizing the data. I am especially grateful to my children
Kristen and Ryan. As I have worked to become a role model for them, I have challenged
myself. I acknowledge my sisters, Joanna Hagemann and Jill Hulsey, and Phyllis Litteken,
my dearest friend, who are always close by with words of support and encouragement.
Thank you to Steven Coats, my tutor assistant in statistics and analysis.
Dr. Connie Welsh and Dr. Peggy Gordon, superintendent and assistant superintendent,
encouraged my study and supported my efforts. The West Foundation provided financial
support, and the staff members in my school were very supportive. I owe a special thanks
to Tracey Edwards, who assisted with technology support. Finally, to Cohort One I am
deeply grateful. I honestly do not think that I could have made it without you.

v
TABLE OF CONTENTS
Page
LIST OF TABLES ............................................................................................................vii
Chapter
1. RATIONALE, PURPOSE, AND PROBLEMS ....................................................... 1
RationaleLearning Environment TheoryClimate
Purpose, Problems, and QuestionsResearch HypothesesAssumptionsBenefits of the StudyLimitations of the StudyDefinition of Terms
2. RELATED LITERATURE .................................................................................... 13
Socioeconomic Status Testing
ClimateStress
CommunicationTeacher ImpactClassroom ManagementExpectationsInstructionTrustCohesivenessFrictionSatisfactionCompetitivenessDifficultySummary
3. METHODOLOGY ................................................................................................. 54
MethodsStudent Perceptual MeasuresResearch DesignAssessing the Learning Environment

vi
Development and use of the My Class InventoryDevelopment of the Stanford Achievement TestResearch Design of Current StudySample
4. RESULTS............................................................................................................... 70
Pearson Product-Moment CorrelationMultiple Regression AnalysisUnivariate Analysis of Variance (ANOVA)My Class InventoryResearch Questions
Research Question OneResearch Question TwoResearch Question ThreeResearch Question FourResearch Question FiveResearch Question SixResearch Question Seven
Summary
5. CONCLUSIONS, IMPLICATIONS, RECOMMENDATIONS, ANDSUMMARY............................................................................................................ 87
ConclusionsPurpose and DesignImplications
RecommendationsSummary
APPENDICES ........................................................................................................ 97
REFERENCES ..................................................................................................... 111

vii
LIST OF TABLES
Page
1. Descriptive Statistics of the Stanford Achievement Mathematical Test and MyClass Inventory Subscales........................................................................................ 71
2. Pearson Product-Moment Correlations Between Satisfaction, Friction,Competitiveness, Difficulty, Cohesiveness, and Stanford AchievementMathematical Test Scores ..................................................................................... 71
3. Model Summary – Multiple Regression Analysis ................................................... 72
4. Backward Solution Model Summary – Multiple Regression Analysis.................... 73
5. ANOVA – Descriptive Statistics: My Class Inventory Subscales........................... 75
6. ANOVA: My Class Inventory Subscales................................................................. 76
7. ANOVA: Friction..................................................................................................... 79
8. Post Hoc Test: Friction – Tukey Honestly Significant Difference (HSD)............... 79
9. ANOVA: Difficulty.................................................................................................. 82
10. Post Hoc Test: Difficulty – Tukey Honestly Significant Difference (HSD)............ 82
11. Descriptive Statistics: Socioeconomic Status and Gender....................................... 84
12. ANOVA: Socioeconomic Status and Gender...........................................................85

1
CHAPTER 1
RATIONALE, PURPOSE, AND PROBLEMS
Rationale
The Civil Rights Act of 1964 mandated the Commissioner of the United States
Department of Health, Education, and Welfare to conduct a survey and make a report to
the President and the Congress regarding the lack of availability of equal educational
opportunities for individuals by reason of race, color, religion, or national origin in public
educational institutions at all levels in the United States. The Commissioner, in turn,
commissioned James E. Coleman of Johns Hopkins University to be responsible for the
design, administration, and analysis of the survey. The resulting report, entitled Equality
of Educational Opportunity, was commonly referred to as the “Coleman Report”
(Coleman et al., 1966). This report suggested the family background of the student was
the primary contributor to success, and the public school did not make a significant
difference in that success. The report further suggested that students from poverty,
lacking the prime conditions or values to support education, could not learn. Coleman’s
message was that the schools had little or no effect. Ronald Edmonds disagreed. He,
along with Edmonds, et al. (1977) and Edmonds and Frederiksen (1979), refused to
accept Coleman’s report as conclusive, and they set out to find schools where students
from low-income families were highly successful. Their intention was to demonstrate that
schools could and do make a difference.

2
Edmonds’ group of researchers investigated achievement data from schools in
several major cities across the country whose students came from backgrounds of
poverty. Though their findings contradicted Coleman’s conclusions, they were left
wondering why certain schools made a difference and others did not. They began
comparing successful schools with similar schools where students were not learning or
were learning at a low level (Association for Effective Schools, Inc.,1996).
One report by Edmonds, et al. (1977) documented the availability of equal
educational opportunities for minority groups as compared with opportunities for
Caucasian students. Both regional and national comparisons were made. Edmonds was
particularly interested in the relationship between students’ achievement levels and the
kinds of schools they attended. One conclusion was that unique characteristics are
common to schools where all students are learning, regardless of their background.
Learning Environment Theory
The concept of school effectiveness has been of significance since the 1970s. A
commonly held conclusion of such studies was that the school a child attended did affect
achievement. Effective school correlates were identified, and one of these correlates was
a safe and orderly climate (Bolender, 1997). The concept of a learning environment has
taken root since the 1930s. Lewin (as cited in Fraser, 1981) and Murray (as cited in
Fraser, 1981) presented theoretical points of view recognizing both the environment and
its interaction with personal characteristics of the individual as determinants of human
behavior. Conceptualization of classroom climate was derived from a social psychology
literature and was rooted in Murray’s (1938) model, Getzels and Thelen’s (1960) notion
of classroom as a social system, and Walberg’s (1971) model of classroom environments.
3
Demands, sanctions, and expectations within an environment (environmental
press) gave a social system its own climate in Murray’s model (as cited in Fraser, 1981).
The learning environment was conceptualized as a complex of environmental press,
thought to be related to a corresponding complex of personal needs. Murray introduced
the term “alpha press” to describe the environment as assessed by a detached observer,
and the term “beta press” to describe the environment as perceived by milieu inhabitants.
According to Murray, personal needs referred to motivational personality characteristics
representing tendencies to move in the direction of certain goals, while environmental
press provided an external situational counterpart which supported or frustrated the
expression of internalized personality needs other words, personal needs referred to
motivational personality characteristics representing tendencies to move in the direction
of certain goals, while environmental press provided an external situational counterpart
which supported or frustrated the expression of internalized needs. Stern’s (1970) Person-
Environment Congruence Theory, based on Murray’s model, proposed that more
congruence between personal needs and environmental press lead to enhanced outcomes.
Also following Murray’s model, Getzels and Thelen’s (1960) model suggested
that within school classes, personality needs, role expectations, and classroom climates
interacted and predicted group behaviors, including learning. Climate developed as a
result of the teacher’s transactional style or the way in which role requirements and
personality needs were balanced (Deng, 1992). The class was conceived as a social
system with characteristic institutions, roles, and expectations for behavior. The class as a
social system was related to the school as a social system, which in turn was related to the
community as a social system, and so on. Ideally, the goal-behaviors of one social system
were geared in to the goal-behaviors of the other related social systems. Within the class

4
itself, goal-behavior was achieved through the integration of institutions, the definition of
roles, and the setting of expectations for the performance of relevant tasks. In performing
the role-behaviors expected, the teacher taught; in performing the role-behaviors
expected, the student learned (Getzels & Thelen, 1960).
In Walberg’s (1971) model, environments were linked with students’ aptitudes
and the type of instruction in predicting learning outcomes. Walberg argued that most of
the variance in student performance was attributed to the aptitude of learners and learning
environments, with only a minor part accounted for by other variables. According to
Nielsen and Kirk (1974), Murray’s model (1938), Getzel and Thelen’s model (1960), and
Walberg’s model (1971) have provided operational definitions of climate and have
helped to generate theories about the relationships of climate to both antecedent and
outcome variables. Through use of these theoretical models, classroom climate research
has focused primarily on what is termed the “psychosocial environment” (Deng, 1992).
Walberg (as cited in Deng, 1992) defined psychosocial environment as “the atmosphere
of the class as a social group that potentially influences what students learn” (p. 4).
Climate
Both school effectiveness research and earlier quality of school life studies
employed the concept of social climate to explain the student outcome-environment
relationship. According to research (MacIntosh, 1991), effective schools appeared to
have a critical mass of positive characteristics which, when found together, accounted for
the differences in student achievement. The combined effect was more powerful than any
individual factor, and the variables were subject to manipulation. The resulting
institutional phenomenon was referred to as ethos or school climate. The notion of

5
climate stimulated renewed interest in the psycho-sociological dimensions of schools
among a growing number of researchers interested in creating effective schools.
Kowalski and Reitzug (as cited in Dietrich & Bailey, 1996) took a more specific
approach in the definition of climate. They defined climate as “a comprehensive structure
made up of culture, physical plant, organizational structure, social relationships, and
individual behaviors” (p. 16). This definition implied that climate was fluctuating rather
than static, influenced by changes in outside forces as well as by the emotions of the staff
and students. To create a positive climate, teachers had to be aware of changes and also
had to be flexible in dealing with them (Dietrich & Bailey, 1996).
Over the past several decades, research has firmly established classroom learning
environments as a thriving field of study (Deng, 1992; Edmonds & Frederiksen, 1979;
Fraser, 1981; Walberg, 1979). Climate could positively influence the health of the
learning environment, or it could significantly impede learning. Thus, feedback about
climate could play an important role in reform (Freiberg, 1998). The benefits derived
from information regarding climate and academic achievement could lead to
identification of strategies that schools could take in designing effective interventions to
produce improved academic performance in students. Considering the potential
significance of information regarding classroom climate, attention should be given to its
continued investigation. Examination of the relationship between classroom climate and
academic achievement has proven to be vital, yet there has been very little current
research in this area. Goodlad (1979) stated:
[T]oo many researchers are preoccupied with research on single instructionalvariables that rarely account for more than 5% of the variance in studentoutcomes. Too few [researchers] study the complex phenomena of schooling intheir natural environment, developing the needed new methodologies instead ofseeking to adapt to the old. (p. 347)
6
Goodlad’s words are still true today. Therefore, this study has been an attempt to
examine the complex phenomena of the classroom environment and to reinforce research
indicating a relationship between classroom climate and academic achievement.
Purpose, Problems, and Questions
The purpose of the study was to investigate specific factors that contribute to the
establishment of a positive climate in the classroom and to determine the relationship
between these classroom climate factors and mathematics achievement in sixth grade. In
order to fulfill the purpose of the study, three problems with resulting questions were
offered.
The first problem was to identify students’ perceptions of classroom climate as
they pertain to mathematics achievement. Arising from this problem was the question:
What is the relationship between students’ perceptions of the classroom climate and
mathematics achievement?
Problem two was to identify students’ perceptions of specific classroom
climate factors and their relationships to mathematics achievement. Five questions were
asked to address this problem: (a) What is the relationship between students’ perceptions
of cohesiveness and mathematics achievement? (b) What is the relationship between
students’ perceptions of friction and mathematics achievement? (c) What is the
relationship between students’ perceptions of satisfaction and mathematics achievement?
(d) What is the relationship between students’ perceptions of competitiveness and student
achievement? and (e) What is the relationship between students’ perceptions of difficulty
and mathematics achievement?
The final problem was to identify students’ socioeconomic status and its
relationship to mathematics achievement. To answer this problem, the question was

7
asked: What is the relationship between students’ socioeconomic status and mathematics
achievement?
Research Hypotheses
The following null hypotheses were proposed for this study:
1. There is a no relationship between students’ perceptions of the classroom climate and
mathematics achievement.
2. There is no relationship between students’ perceptions of cohesiveness and
mathematics achievement.
3. There is no relationship between students’ perceptions of friction and mathematics
achievement.
4. There is no relationship between students’ perceptions of satisfaction and
mathematics achievement.
5. There is no relationship between students’ perceptions of competitiveness and
mathematics achievement.
6. There is no relationship between students’ perceptions of difficulty and mathematics
achievement.
7. There is no relationship between students’ socioeconomic status and mathematics
achievement.
Assumptions
1. It was assumed that the My Class Inventory was a way of determining a student’s
perception of his or her classroom climate.
2. It was assumed that the students’ responses corresponded to the reality of
perceptions of the classroom climate.

8
3. It was assumed that the students were honest in responding to the My Class
Inventory, having been assured of their anonymity.
4. It was assumed that the students and parents responded honestly regarding
socioeconomic status.
5. It was assumed that no major change in the students’ perceptions of the class, as
measured by the five scales of the My Class Inventory, had occurred between the
administration of the Stanford Achievement Test and the administration of the
My Class Inventory.
Benefits of the Study
The results of this study can only be generalized to this one particular school district.
However, the results provide valuable information to educators involved in the study, as
well as to the global education community. The findings also heighten teacher awareness
of the importance of classroom climate.
Limitations of the Study
The ability to generalize this study is limited to students from a city similar to the one
sampled in the study and may not be relevant to schools larger or smaller than those in
the study, nor to populations which are more rural or urban than those in the study. The
sample was voluntary, which could have resulted in a biased selection factor, and it was
limited to sixth grade mathematics classrooms in a specific school district. Students in the
sample were not necessarily representative of all sixth grade math students.
In addition, self-report instruments were subject to human error due to perceptions
respondents may have had on a particular day. Students may or may not have accurately
depicted a true perception of classroom climate.

9
Finally, there were no control factors that would account for prior student
achievement. There was no pre or post testing of students to determine the appropriate
levels of mathematics achievement. Correlational research failed to control for all other
possible causes of variation in outcomes.
Definition of Terms
1. Alpha Press is the environment as assessed by a detached observer.
2. Academic achievement refers to students scoring at or above the minimum level of
proficiency as defined by standardized tests.
3. Backwards solution is a regression model in which all predictor (independent)
variables are initially entered into the model and then deleted if they do not make a
contribution to the regression model (Hinkle, Wiersma, & Jurs, 1998).
4. Beta press is the environment as perceived by its inhabitants.
5. Case study is an in-depth study of a phenomenon in its natural setting.
6. Canonical is defined as authorized, recognized, or accepted.
7. Classroom climate is the perceived atmosphere, both positive and negative,
resulting from the physical and social environment.
8. Classroom community is the sense of connection and belonging among the
students and teacher.
9. Classroom management encompasses all the planned or spontaneous activities and
interactions that occur within the classroom.
10. Cohesiveness refers to the extent to which students are friendly and helpful toward
each other.
11. Communication is defined as the interchange of thoughts, opinions, or information.

10
12. Competitive goal structure refers to students competing with one another for
achievement goals.
13. Competitiveness is the emphasis on students as rivals.
14. Cooperative goal structure refers to students perceiving that their personal
achievement goals depend on how well other students achieve their personal goals.
15. Correlation coefficient is the mathematical representation of the direction and
magnitude of the relationship between two measured variables (Gall, Borg, & Gall, 1996).
16. Correlational research identifies possible causes and effects of important
educational phenomena, such as academic achievement (Gall et al., 1996).
17. A curriculum is a course of study.
18. Curvilinear consists of straight lines which do not fit a scatterplot and curved lines
do fit the plot (Hinkle et al., 1998).
19. Dependent variables (criterion variables) are dependent on independent variables.
20. Difficulty is the extent to which students have trouble with the work in class.
21. Environment includes the physical, social, and intellectual conditions, forces, and
external stimuli in a setting.
22. Effective school correlates are the indicators to be the most important predictors of
school success.
23. Effort attribution is the result of trying or attempting.
24. Ethnography pertains to the scientific description of a culture.
25. Expectations are those things which are anticipated or hoped for.
26. Friction is the amount of tension among students and staff.
27. Heterogeneous means dissimilar or not of the same composition.
28. High inference measures are the subjective ratings of perceived behavior.

11
29. Homogeneous means to be of the same composition, alike, or similar.
30. Independent variables (predictor variables) are independent of the outcome but are
believed to influence the outcome.
31. Interaction analysis is the process of observing and classifying events in a
classroom.
32. Low inference measures are ratings involving specific teacher behaviors.
33. Multiple linear regression is a method for measuring the effects of several factors
concurrently.
34. A one-way univariate analysis of variance (ANOVA) compares one independent
variable with two or more levels. Changes in the dependent variable are presumed to be
the result of changes in the independent variable (Hinkle et al., 1998).
35. A Pearson product-moment correlation is the average cross-product of the standard
scores of two variables (Hinkle et al., 1998).
36. Post hoc multiple comparison tests determine which pairs or combinations of
means are not equal after the researcher rejects a null hypothesis (Hinkle et al., 1998).
37. Psychosocial is relating to both psychological and social factors.
38. Psychosocial environment is the atmosphere of the class as a social group.
39. A qualitative study generates data by subjective judgment. Typical examples are
research involving attitudes or opinions of human subjects which involve the judgment
of an observer (Isaac & Michael, 1995).
40. A quantitative study assumes the features of the social environment constitute an
objective reality that is relatively constant across time and settings. The dominant
methodology is to describe and explain this reality by collecting numerical data on
observable behaviors and to subject these data to statistical analysis (Gall et al., 1996).

12
41. Reliability is the extent to which other researchers would arrive at similar results if
they studied the same case using exactly the same procedures as the first research. In
classical test theory, reliability is the amount of measurement error in the scores yielded
by a test (Gall et al., 1996).
42. Satisfaction is the extent to which one enjoys a class.
43. Simple linear regression refers to variations in the dependent variable which are
attributed to changes in only a single independent variable (Schroeder, Sjoquist, &
Stephan, 1986).
44. Stress is defined as mental, physical, or emotional strain or tension.
45. Threat is any indication or warning of possible danger.
46. Trust is the belief or confidence in and reliance on a person or thing.
47. Tukey/Kramer is a type of post hoc multiple-comparison test used when sample
sizes are unequal (Gall et al., 1996).
48. Validity is the appropriateness and usefulness of specific inferences made from test
scores (Gall et al., 1996).
13
CHAPTER 2
RELATED LITERATURE
Socioeconomic Status
The Coleman Report (Coleman et al., 1966) was a comprehensive assessment of
school achievement throughout the United States. It encompassed approximately
600,000 students in 4,000 elementary and secondary schools in the country. One of its
objectives was to document how much students learned as measured by performance on
standardized achievement tests. Coleman’s report revealed that as low socioeconomic
status (SES) students proceeded through school, they continued to perform below the
national average at all grade levels on all measures. He further estimated that the
percentage of school influence on student achievement accounted for only 10% to 20% of
the total variance.
Since Coleman’s (1966) historic report, other researchers have attempted to determine the
relationship between a student’s SES and academic achievement. Kaspi (1973) examined
a random sample of 700 subjects who participated in a longitudinal study of educational
achievement in an Israeli school system. A multivariate analysis confirmed the
achievement gap between the socioeconomic status and academic achievement to be
significant among all grade levels involved. A univariate t-test, performed by a
multivariate procedure, substantiated the achievement gap between SES groups to be
quite significant.
Conway (1976) investigated the patterns of intellectual growth and achievement
levels of students who experienced similar elementary school education but differed in

14
cultural group membership and socioeconomic status. The subjects of this study were
271 junior high students in the Lincoln, Nebraska, public schools who had been in
continuous attendance in the school system during elementary school. The evidence in
this study indicated that low SES students did not perform as well academically as high
SES students. Furthermore, the study revealed that ascending socioeconomic levels were
accompanied by gains in IQ for all students.
One study by Morgan, Hofstra, Black, and Skinner (1979) obtained and analyzed
information on the characteristics of children entering school for the first time. A sample
of 209 children from different areas was studied in Ontario, Canada, including rural,
urban, inner city, and metropolitan areas. Information was gathered by means of
questionnaires, interviews, classroom observations, and direct testing. Findings of this
study revealed that the socioeconomic status and educational levels of both parents were
significantly related to a child’s educational progress.
A 1981 study by Shakiba-Nejad and Yellin examined the socioeconomic status,
parent participation, teacher awareness, and academic achievement of 76 elementary
school students. The students were selected from a population of 148 fourth, fifth, and
sixth graders. The California Achievement Test was used to assess academic
achievement. The data was analyzed using Point Biserial Correlation, Fisher’s Exact
Probability Test, and the two-way Chi-Square. A strong positive correlation was found
between a student’s SES and academic achievement. However, these researchers
presented evidence that the low levels of achievement could also be explained by the fact
that lower SES students also had poor attendance records.
In the summer of 1984, the Governor and State Superintendent of Public
Instruction of the State of Wisconsin appointed a commission to study the public schools

15
in 22 districts in the Milwaukee area. The study included 60,000 students from 15 of the
districts. Data was obtained in the form of survey questionnaires, interviews, case
studies, and telephone interviews. This data was compared to the socioeconomic status
and academic performance of students. The analysis revealed that more than half of the
variance in academic achievement could be explainable by SES, and that the relationship
between achievement and SES was curvilinear (Walsh, 1986).
The purpose of a 1996 study by Alspaugh was to estimate the size of the
achievement gap and its longitudinal effects upon cohort groups of high and low
socioeconomic students as they progressed from grades two through six. Data was
obtained from a Midwest urban school district with 40 elementary schools. Reading and
math achievement scores were taken from the Missouri Mastery and Achievement Test
(MMAT). Within the set of SES measures, the percentage of students on free or reduced
lunch showed the largest negative correlation with student achievement. The correlation
between reading achievement and SES indicators were consistently higher than the
correlation for achievement in mathematics. A multiple regression analysis of the SES
measures with reading achievement yielded a correlation of 0.84. Likewise, the
multiple R for mathematics was 0.79. The coefficients of determination from the
regression analysis indicated that socioeconomic status accounted for 62% to 71% of the
variance, depending on the grade level.
Most recently, Marcon (1999) studied 222 urban early adolescents with a median
age of 149 months. She examined differences in motivation that might affect academic
achievement and perceptions of competence. Socioeconomic status was found to be an
important factor in academic performance, noting that lower income students had poorer
academic performance. Economically advantaged students had a significantly higher

16
grade point average and higher grades in all subjects except art, health, and physical
education. Furthermore, higher Comprehensive Test of Basic Skills (CTBS) scores were
found for higher SES students in overall battery and all subareas except spelling.
Testing
Testing was first introduced in China in 210 B.C., and assessments have since
been based on the same basic technology (Madaus & O’Dwyer, 1999). The performance
on a sample has been used to make references about a person’s probable performance
relative to the entire domain. Based on the inference, the researcher has been able to
classify, describe, or make decisions about the individual. The dawning of the modern
period in testing began near the end of the 19th century. The movement was brought to
fruition in 1905 by Alfred Binet’s introduction of the first successful intelligence test.
The advent of the psychological testing movement changed testing forever, eventually to
include the use of statistical criteria to select questions for inclusion on achievement tests.
A major step in testing came in 1914 when multiple-choice item tests were introduced,
and the use of efficient essay exams gained in popularity. It was this multiple-choice
option that greatly facilitated the development of the ubiquitous national norm-referenced
standardized commercial tests. One particular technological development in the modern
era made multiple-choice tests even more efficient and cost effective. This was the 1995
invention by Everet Lindquist of a high-speed optical scanner. Compared to essay exams,
multiple-choice tests were now scored in a fraction of the time and at a fraction of the
cost. Objectivity and reliability were also increased, and the use of testing as a political,
administrative, and accountability technique become especially popular.
Few issues in U.S. education have been considered more controversial than
testing. Some have viewed testing as the precursor of serious reform and school

17
improvement. Others have viewed it as a menace to quality teaching and learning, but the
public’s view has been made clear. Most Americans have indicated that they favor
student testing for purposes of information, accountability, and incentives. Critics of
testing have been relentless, and many educators and testing experts have objected to the
use of standardized testing. They have considered testing as a practice that is counter
productive – one that distorts the curriculum, discourages higher-order thinking skills,
and depresses student achievement (Phelps, 1999).
In addition to the development of norm-referenced achievement tests,
psychologist and researchers have sought ways to develop measures of the perception of
the environment. Moos (1973) indicated six major methods by which characteristics of
environments have been related to indexes of human functioning. These included
(a) ecological dimensions, which encompass geographical, meteorological, and
architectural design variables; (b) behavior settings; (c) dimensions of organizational
structure; (d) dimensions identifying the collective personal and/or behavioral
characteristics of the milieu inhabitants; (e) dimensions related to psychosocial
characteristics and organizational climates; and (f) variables relevant to the functional or
reinforcement analyses of environments. These six categories were considered to be
nonexclusive, overlapping, and mutually interrelated.
Education has been considered to be an applied science, and variables have been
studied to learn whether or how they should be manipulated to enhance productivity.
There have been two positions offered regarding variables characterizing learning
environments. On the one hand, a positive learning environment has been viewed as a
means to an end. On the other hand, a positive learning environment has been viewed as
an end in itself. These two views have led to distinct approaches to learning environment

18
measures in educational research. If the environment was seen as an outcome, its
measures appeared in the role of the dependent variables. If environment was seen as a
means to the end, its measures were employed in correlational studies, often in order to
predict achievement. Research on learning environments has spanned a wide range of
settings within and beyond the classroom, and this type of research has addressed a
variety of issues. Learning environment assessments have become convenient, practical,
and inexpensive. They have demonstrated predictive validity and reliability, and research
information from them proves interesting, meaningful, and suggestive to educational
policy-makers and practitioners. As a result, learning environment assessments have been
used in a wide variety of evaluation and research projects in many countries (Walberg &
Haertel, 1980).
Climate
Comparing schools to determine the factors that make one school more effective
than another has been a staple of educational research since Rice’s (1893/1966)
pioneering work at the turn of the century. Rice concluded, rather reluctantly, that testing
was the best way to compare schools, and researchers have been using test results to
compare schools ever since. In addition to comparing socioeconomic status of students
with academic achievement, researchers have also compared classroom climate indicators
with academic achievement. This comparison has been particularly difficult because of
the very nature of climate.
School climate has been ever changing. The elements of climate have been
complex, ranging from the quality of interactions to the physical comfort levels of the
individuals. No single factor has determined climate; however, the interaction of various
factors have created a fabric of support that may have affected learning at optimum

19
levels. Making even small changes in the classroom has been thought to lead to
significant improvements in climate (Bolender, 1997), but determining the specific
changes impacting climate and resulting in improved student achievement has been
difficult to determine.
Stress
When promoting positive classroom environments, educators have needed to be
aware of the impact of stress upon students. Excessive stress has been considered to be
one of the greatest contributors to impaired academic learning, and teachers have needed
to understand the many potential threats for students and the brain’s response to stress
(Jensen, 1998).
The anthropological literature has identified several of the major threats to human
survival: starvation, disease, and human predation. A well-developed brain has been
shown to provide an advantage in responding to those threats. Education has been
considered an elaborate, adaptive mechanism to save students from the three threats
restricting the ability to survive. While these threats to human survival may have
appeared archaic, they have been considered root issues underlying the process of
learning (Embry, 1997).
Threats have long served as weapons to regulate human behavior. When school
attendance was not mandatory, threats were less relevant; a student who was upset could
simply leave. In the year 2000, however, students have had to endure threats because law
has mandated school attendance.
According to Jensen (1998), when students have felt threatened or become
stressed, their bodies have responded through physical reactions, including depression of
the immune system, tensing of the large muscles, blood clotting, and increasing blood

20
pressure. This type of reaction has lead to problems in school. Chronic stress has been
shown to impair a student’s ability to determine what is or is not important. Gazzaniga
(1988) and Jacobs and Nadel (1985) suggested that the brain’s short-term memory and
ability to form long-term memories have been inhibited by stress. Students under stress
have also been more susceptible to illness, which has helped to explain a vicious
academic cycle. More academic stress has meant more sickness, which has meant poor
health and missed classes. This has resulted in lower academic achievement (Jensen,
1998).
A typical day at school may have been filled with expectations and
disappointments. Projects may not have worked out, grades may have been lower than
expected, and classmates may not have respond as predicted. All of these irritations have
been sources of stress, and the brain has reacted to these as threats. Students have
perceived and responded to potential threats in different ways. Some may have dismissed
them, while others may have consider them as a challenge and risen to the occasion.
Unfortunately for others, threats may have been devastating. Students who have had early
and repeated exposure to threats and high stress, particularly those who have come from
families of violence, may have had problems with focusing their attention. Vision may
have shifted constantly as they scanned the room for potential predators. Their brain’s
receptor sites may have adapted to a survival mode. These behaviors may have resulted
in frustrated teachers, but such behaviors have made perfect sense to the student whose
life has depended upon them (Jensen, 1998).
The list of perceived threats for students has been endless. Threats may have
included situations such as family violence, loss of privileges at home or at school, a
boyfriend or girlfriend who threatened to break up, or a school bully. A rude classmate or

21
a teacher who humiliated or embarrassed a student in front of peers may have been
perceived as a threat (Jensen, 1998). Even seemingly minor things, such as negative
comments, sarcasm, criticism, and put-downs, have been shown to increase abnormalities
in heart rates (Atkins, 1999). Threats, resulting in stress, has put the brain on alert, which
has activated defense mechanisms increasing survival but interfering with learning
(Jensen, 1998). On the other hand, when environments have been positive and joyful, the
body has released endorphins elevating good feelings. Learners have been more likely to
experience better learning, memory, and feelings of self-esteem (Atkins, 1999).
The brain has reacted to stress and threats emotionally. Such emotions have
influenced attention, event interpretation, motivation, prediction, recall, decision making,
problem solving, and learning. Classroom teachers who have understood the impact of
stress and have attempted to eliminate it from the classroom have helped to promote a
more positive environment for learning (Atkins, 1999).
Communication
Classroom dynamics have encompassed a broad array of group processes and
interactions that have affected the nature and amount of learning. Components have
included how members of the class communicate, members’ expectations of each other,
the degree to which members have liked and respected one another, and grouping
practices. These components have affected such learning outcomes as attitudes,
achievement, self-concept, and social perspective taking (Paradise, 1994). One way to
examine patterns of interaction has been to focus on communication, on which all levels
of education have depended. The importance of communication in creating a positive
classroom climate has not been over emphasized. In addition to verbal communication,
other factors of communication such as facial expressions, gestures, and bodily posture

22
have been important. Nonverbal messages have often been inconsistent with verbal
content, and these inconsistencies have been expressed continually in the classroom.
Facial expressions have communicated such basic emotions as happiness, anger, disgust,
sadness, and fear (Holden, 1994). Across cultures people have identified the signs of
these basic emotions. Individuals have differed in facial expressiveness and the ability to
interpret facial expressions, but females have shown a slight and consistent edge over
males. Facial expressions have played an important role in relationships, because they
have provided accurate information to others about the occurrence of pleasant and
unpleasant emotional states. Holden reported that students learned more from teachers
who showed positive rather than negative emotional expressions.
Communication has helped to build relationships, and the extent to which students
have liked and respected one another has been shown to impact the level of academic
performance. Students who have been accepted by their peers and liked them in return,
have felt better about being in the classroom. Most friendships have begun because of
proximity and appearance. Students who have sat close to one another have become
friends, as have students who have seen attractive physical characteristics in one another.
Communication has developed among these students and relationships have begun.
Interpersonal attraction among students has been most positive when patterns of
friendship have been diverse. Teachers have been most effective when students have
been encouraged and rewarded for developing many friendships in class (Paradise, 1994).
Grouping practices, such as the physical setting of the classroom and in particular
seating arrangements, have impacted communication. A circle pattern has resulted in the
greatest amount of classroom participation, and students directly facing the instructor
have participated more than those to the side of the instructor. When the arrangement has

23
been in rows, students on the periphery have tended to participate less, resulting in a lack
of involvement and satisfaction. Arrangements based on ability levels have also affected
communication. If students were grouped by achievement level, the contact between high
and low-achievement students was lessened. The division has encouraged status
differences and made it more difficult to have trusting, open, and honest communication
(Paradise, 1994).
Teacher Impact
Of all the factors that have contributed to the social environment in which
students are educated, the teacher has been the most decisive (Smith, Neisworth, &
Greer, 1978). The teacher’s attitude toward students and education has determined to a
very real degree how students have perceived school, themselves, and one another.
Teachers have made learning pleasant or punishing; they have created motivation or fear;
they have produced excited anticipation or dread. A teacher's personal style and
approach, more than anything else, has created the climate and mood characterizing the
classroom. In this classroom, where the interaction between teacher and students is so
complex, personal biases and emotions have often overshadowed the subtle variables that
affect all levels of human interaction. Teachers may have been quick to assume that a
child’s inappropriate behavior was the result of problems at home or due to immaturity.
Teachers have needed to realize that these behaviors may have been, at least partially, a
consequence of the actions of the teacher. If students have experienced the classroom as a
caring, supportive place where everyone is valued and respected, they have tended to
participate more in learning (Lumsden, 1994). The teacher has played an instrumental
role in providing a safe and orderly climate – a climate in which stress has been reduced
and relationships have been nurtured.

24
According to recent teacher-role appraisals, the teacher was the organizer of
optimum learning situations. The teacher determined the classroom climate depending on
that teacher’s decisions, style, practices, and interaction with students. Moos (1979)
suggested that the teacher was of greater importance than the characteristics of the students
in creating the classroom climate. Teachers who were committed to students were likely to
spend the extra time and effort necessary to motivate and nurture their students. Committed
teachers were likely to stay after school to tutor or counsel students, and they were willing
to give of themselves on behalf of their students (Hoy & Hannum, 1997).
School has been more than programming and pedagogy, and the best curriculum
in the world has had no effect in the hands of teachers who did not believe in, respect,
and relate to their students. The foundation of any learning experience has resided in the
nature of teacher-student relationships and the quality of the classroom climate. Although
all teachers have acknowledged the importance of such relationships, some have not
made the effort. In an attempt to make it through the curriculum, they have sacrificed
relationships in order to cover the content (McCombs & Whisler, 1997). An elementary
teacher has often had over 500 exchanges with individual students in a single day, and
teachers have publicly evaluated pupil conduct with either praise or reprimands on the
average of 15.89 times per hour, or 87 times a day (Doyle, 1986). In most cases teachers
have had little leisure time to reflect before they reacted. Therefore, teachers have been
wise to plan actions and activities that promote positive attitudes and perceptions,
resulting in quality relationships and a positive climate. Greeting students, interacting
with them about things outside of class, and caring for and treating them as human beings
have been the kinds of things that learner-centered teachers have done. These same
teachers have also monitored their own attitudes about their students, especially the more
25
difficult students. Teachers have even interacted with difficult students as if the students
were the opposite of what they seemed (i.e., not difficult students). These teachers have
also attempted to connect with each student, and they have been better able to respond to
their students’ unique capabilities and needs. They have been sensitive to cultural issues,
as well as to different learning styles, values, perspectives, roles, and customs. They have
come to know their students and their backgrounds and have incorporated a variety of
ways for students to learn and ways to demonstrate or express that learning (McCombs &
Whisler, 1997).
Classroom Management
One major aspect of the classroom climate that has fallen under the control of the
teacher is that of classroom management and discipline. Classroom management has
referred to all the planned or spontaneous activities and interactions that have occurred
within a classroom. In recent years, a growing interest has emerged in the area of
classroom management. Approaches have drawn primarily on principles of learning
theory and behavior modification. Contingency management techniques and the judicious
use of rewards and incentives have been used to stimulate interest and motivate the
students (Wickens, 1994), but overuse of rewards and punishments has kept students
externally rather than internally focused (Anderman et al.,1993). Anderman has also
suggested that the use of rewards or prizes for participation, performance, or achievement
may have improved students’ perceptions of classroom climate. An effective teacher has
long understood that the middle road to motivating students to manage their own
behavior keeps rewards and punishments as subtle and informative feedback
mechanisms, rather than controlling and coercion. Research has suggested that when
students have reported a classroom as having a caring environment, students also

26
reported greater liking for school, concern for others, more sophisticated conflict
resolution skill, less feelings of loneliness, and fewer discipline problems (Meece &
McColskey, 1997).
Some teachers have taken a proactive approach to discipline and management, but
certain prevention structures and routines have tended to increase threats and hostility.
Some solutions to aggressive behaviors, in fact, increased their frequency. For example,
many schools have hired people to become monitors on the playground and hallways.
The basic job description for these monitors has been to notice improper behavior. This
type of prevention has increased the focus and attention on improper behavior and has
actually increased the frequency of such undesirable behavior. In a similar vein, emphasis
on competitive games during recess has actually increased aggressive behavior, whereas
structured, cooperative games have decreased aggression. Reliance on negative phone
calls and negative notes to parents has tended to increase abusive behavior of high-risk
families as well as aggressive behavior of the child toward the school – precisely the
opposite of the intended effect (Embry, 1997).
Common intervention strategies have also fostered negative behavior. For
example, some school staff members referred students to the principal or counselor for
almost any disruption. Such referrals operated as a positive reinforcer or as an escape
from a negative situation, in which case the child may have continued to engage in
disruptions that resulted in ongoing referrals. Likewise, time-out may have been used for
punishment, but what may not have been apparent to the teacher is that time-out was an
effective way of escaping a situation that was aversive, such as experiencing frequent
reprimands for poor academic work (Embry, 1997).

27
The sociological studies of Rutter (as cited in Embry, 1997) showed that schools
have been able to reduce juvenile delinquency and other indices of developmental
psychopathology. For example, Rutter found that praise for good work or behavior at
assemblies led to improvement in student behavior. Increased decorations in the
classroom and hallways promoted better behavior. Improved behavior and work occurred
when greater proportions of students had the opportunity to hold positions of
responsibility. Frequent homework was associated with good behavior and achievement.
Widely publicized and implemented standards of behavior were effective in maintaining
a positive school climate. Finally, high rates of interaction between students and teachers
regarding academics also fostered positive behavior and achievement (Embry, 1997).
One constructive piece of advice for dealing with human relations in the
classroom came from William Glasser (1965) who advised teachers to pay personal
attention to difficult students when they were not in trouble. Getting to know students as
individuals may have appeared to be time-consuming, but it has paid off in the long run
(Gunter, Estes, & Schwab, 1990).
Teachers have also enhanced the orderly environment of the classroom through
their skills in instruction and classroom management. The use of time has been important.
Teachers who maximized their allocated time by beginning lessons promptly have had
fewer discipline problems. Teachers who gave homework and provided rewards or
reinforcement for actual achievement have also had fewer discipline problems. Effective
teachers have modeled appropriate behavior. In classrooms with few behavior problems,
teachers have used consequences but have avoided humiliation and violence toward
students. Positive rewards and praise have generally outnumbered negative
reinforcements (Squires, Huitt, & Segars, n.d.).

28
The implicit and explicit system of rules and organization has also been found to
relate to student achievement. Moos (1979) reported that primary grade students made
the greatest gains in reading and mathematics in classes that were perceived as systematic
and orderly. Similarly, gains in learning were found by Haertel, Walberg, and Haertel
(1981) to be negatively associated with disorganization, speed, and diversity.
Expectations
Since the 1968 landmark study by Rosenthal and Jacobson, Pygmalion in the
Classroom, hundreds of studies have examined the idea that teachers’ expectations affect
the way they treat students, which affects what students learn. Expectations have
affected the way people behave, and the way people behave has affected how others
respond. Teachers have formed expectations based on information received from test
scores, siblings’ performances, behavior of the student, gender, social class background,
teacher comments, and other sources. These expectations have been communicated by
interacting differentially with students, depending on the expectation level. Differential
behaviors have been evident in areas such as seating arrangements, the amount of time
the teacher waits for a response from students, attention, amounts of praise, criticism,
feedback, the type of questions asked, and demands made upon students.
Contextual factors, such as class size and variance in student achievement levels,
have also affected teacher expectations. Teachers in larger classes have used expectations
as a clue to behavior, because it has been so difficult to get to know students individually.
Teachers have often depended on stereotypes in guiding their behaviors. Similarly,
teachers have frequently developed expectations for diverse student groups to more easily
shift expectation levels from one group to another (Paradise, 1994).

29
Student motivation to learn has been greatly affected by the expectations of
teachers, because these expectations have functioned as self-fulfilling prophecies. In
general, high expectation students have received more opportunities for learning and
more corrective feedback and attention from teachers (Meece & McColskey, 1997).
Brophy (1987) offered examples of differences found between teachers with low and
high expectations for students. In cases where students were viewed with high
expectations by their teachers, the teachers (a) were friendlier with the students, (b) gave
more difficult and varied assignments, (c) called on these students more often,
(d) provided more clues or rephrased questions more often, (e) waited longer for
responses, (f) gave more detailed and accurate feedback, (g) praised these students more
frequently for correct responses, (h) gave these students special privileges, and
(i) allowed these students to suggest activities. For students who were viewed by their
teacher with lower expectations, the teachers (a) criticized these students more often,
(b) praised these students for marginal or incorrect responses, (c) made fewer personal
contacts with these students, (d) watched low achievers more closely, and (e) asked other
students to help low achievers.
Instruction
Another important aspect of classroom climate has dealt with instruction.
Lecturing has had a place, but students have been found to attend more with opportunities
for discussion, conversation, asking questions, joking, and hands-on experiences
(Ponticell, 1997). The use of individualized instruction, such as seatwork, was related to
lower levels of perceived classroom climate (Anderman et al., 1993). Problem-solving
and self-learning were more engaging. Teachers have needed to use a variety of teaching
strategies with an emphasis on support and success. Instruction has needed to include

30
flexibility and spontaneity, as well as responding to and building on students’ energies
and intentions. Humor and fun have also been needed in the classroom. Students have
needed teachers with good attitudes who smiled a lot, chatted with students, and who
valued a good honest laugh (Ponticell, 1997). Tasks needed to be challenging, yet
achievable. Relevance was also important in helping students to understand how skills
could be applied in the real world (Lumsden, 1994). Students needed a stimulating pace.
Curriculum needed to be student-centered, and instructions needed to be brisk and
engaging. If a concept was missed, the teacher needed to approach it again, but from a
different, equally interesting perspective. Students needed to be actively involved in
instruction as much as possible, and they needed to be encouraged to pursue their own
personal interests beyond the classroom (Wilmore, 1992).
Feedback and rewards provided impetus for promoting a positive classroom
climate. Sweeney (1992) found that even champions required feedback, and feedback
needed to be specific and frequent. Even when providing feedback that was not positive,
it was advisable to keep the voice light and to keep a smile on the face. Positive feedback
such as achievement newsletters, academic trophy cases, and multiple and varied award
programs helped to develop and perpetuate key beliefs and a winning attitude.
If instruction failed to engage and challenge students, classroom climate and
intellectual development has suffered. Teachers have spent a great deal of time
demanding attentiveness or simply trying to maintain order. Teacher burnout and student
disciplinary/attendance problems have been likely. For this reason, the teacher has
needed to be certain that the curriculum was designed in such a way that it would be of
interest to the students, since students were more likely to learn material that they found
stimulating (Rossi, 1999).

31
Trust
One of the key beliefs in creating a nurturing and caring classroom climate has
been that of trust. Trust has been the glue that held the class together. In the emotion-
laden environment of the school, trust has been the prerequisite to any kind of positive
action. Trust has revolved around the belief that people would interact in a fair and honest
manner; that they would maintain confidentiality; that they would be fair and consistent
in how they dealt with people; and that they would be honest, capable, and supportive
(Sweeney, 1992).
The classroom of the 21st century student has become more diverse, and teachers
have had to view and interact with these diverse students as people, not problems. They
have had to personalize and individualize the curriculum and environment as much as
possible, just as a parent would. Cooperation and collaboration have been valued, and
competition has been de-emphasized. Many students have shared in creating classroom
communities where everyone is committed to helping everyone else learn and feel valued
for his or her own special qualities. Recognition has often been utilized more than
rewards, prizes, or high grades. Recognition has frequently come in the form of a note
from a teacher or the opportunity to present student work to real audiences in the
classroom, school, and community. Many students have felt valued when asked for their
opinions. Because the classroom environment has often fostered personal growth,
academic learning, and trust. It has enriched the lives of many students, and it may have
given those students who have had the least support outside school their only chance at a
bright future (Dodd, 1997).

32
Cohesiveness
As early as 1962, Maslow posited a psychological hierarchy in which the need for
belonging took precedence over needs for knowledge and understanding. According to
Slavin (1981), students who worked together liked school more than students who were
not allowed to do so. They were more likely to say that they wanted their classmates to
do well in school and that they felt their classmates also wanted them to do well. By
participating in social-climate setting activities, both students and teachers came to better
understand each other’s value systems and began to create a cohesive environment. This
enabled them to work together toward the common goal of social and academic
achievement (Moos & Moos, 1973). Cohesion within the classroom was of great
importance and was another aspect that needed to be examined before a positive social
climate could be established (Vacha, 1977). Shapiro (1993) described cohesion as “the
sum of group members’ feelings about their group as a whole” (p. 95). In cohesive
classrooms students valued their classmates, were involved with and cared about each
other, tried to help one another, and were proud of their membership in the group (Vacha,
1977). They wanted to be competent doers and producers, and wanted to be known by
others for their accomplishments. Educators who recognized that it was normal for
students to yearn for success and recognition created learning experiences that helped to
establish equilibrium and ensured success for all students (George, Stevenson,
Thomason, & Beane, 1992). If a classroom developed norms that supported academic
achievement, high cohesiveness enhanced education by providing a strong “we” feeling,
which promoted conformity to the norms of the class. A cohesive classroom was one in
which a wide variety of individual interests and needs were satisfied. A positive climate

33
supported diversity, differences, and likenesses, and it provided social support and
encouragement of participation by all members (Shapiro, 1993).
Anderson (1970) studied a group of 800 students selected at random from
113 classes distributed throughout 27 states and Canada. The Learning Environment
Inventory (LEI) was used to determine perceptions of climate. Scores were compared
with four criterion instruments, including the Physics Achievement Test, the Test on
Understanding Science, the Welch Science Process Inventory, and the Pupil Activity
Inventory. A step-wise multiple regression analysis was used. Anderson found that
significant relationships occurred between climate dimensions such as class cohesiveness,
cliqueness and friction, and learning outcomes. Group cohesiveness was found to affect
individuals differentially by sex and mental ability. Anderson’s findings suggested
classroom social climates have significant affects on individual learning, and wide
differences exist based on student ability and sex.
Lott and Lott (1966) examined four elementary schools. Three were
predominantly white, and one had a population of entirely African-American students. A
total of 206 students participated in the study, 97 boys and 109 girls. The students were
selected on the basis of sociometric and IQ score considerations. Their regular teacher
gave members of the eight participating classes a sociometric test. This consisted of a
Friendship Book in which each child was asked to rate all other same-sex students in the
class. High-cohesive and low-cohesive same-sex groups of three or four students were
formed on the basis of similar mutual ratings. In addition to the sociometric ratings, IQ
scores were also taken into account in placing students into groups. The California Short-
Form Test of Mental Maturity (CTMM) was used to determine IQ. An analysis of
variance was utilized. The results on all the learning tests indicated that the high-IQ

34
students who were in high-cohesive groups did better than high-IQ students who were in
low-cohesive groups. For low-IQ students, however, cohesiveness made no difference.
The study also suggested that group intimacy affected girls more than boys, and that
cohesiveness increased learning for the highly intelligent and decreased learning for the
less intelligent. Other researchers were also interested in cohesiveness. Moos (1974)
found that achievement in high school mathematics was related to high levels of class
cohesion. In another study by Anderson and Walberg (1974), cohesiveness was found to
be positively associated with student learning.
In order to create a positive classroom climate, teachers needed to provide
students with cohesiveness through a sense of classroom community – a classroom with a
sense of connection, a feeling that they were valued, and a feeling that they had influence
with their classmates and teacher. Students with a strong sense of community felt
personally known and respected. They believed that they had a voice in decision making
and problem solving, and they believed that their fellow students cared about them and
cared about learning (Schaps, Lewis, & Watson, 1997).
A strong sense of classroom community contributed to positive student outcomes.
Students who experienced it simply did better than those who did not, and teachers who
were successful at creating classroom communities were better at helping their students
to grow ethically, socially, and academically. In a 1995 study by Battistich, Solomon,
Watson, and Schaps students’ sense of the school as a community was assessed with a
38-item scale. Schools in this study served populations across many socioeconomic
levels. Measures of reading and mathematics achievement were obtained using
standardized achievement tests, including the Iowa Test of Basic Skills, the California
Test of Basic Skills, and the Stanford Achievement Test. Findings indicated that students

35
with a high sense of community showed significantly greater academic motivation and
performance, a liking for school, empathy and motivation to help others, and conflict
resolution skills. A high sense of community was also linked to greater enjoyment of
class, a stronger learning motivation, stronger commitment to democratic values, a higher
sense of efficacy, and more frequent altruistic behavior. This same study even suggested
that creating a high sense of community may help greatly to “level the playing field” for
students of low socioeconomic status (Schaps, Lewis, & Watson, 1997).
Lewis (1995) found that Japanese elementary teachers believed that building a
sense of classroom community was essential to support instruction, and they devoted a
great deal of time and energy to building friendships and involving students in classroom
management. Unfortunately, many methods that American schools had traditionally used
to promote hard work and learning, such as competition, awards, and achievement-based
grouping, were all likely to undermine a sense of classroom community. When students
worked in isolation, they were unlikely to see each other as helpful. If they were in
competition with one another, they were unlikely to see classmates as caring about each
other’s work (Schaps et al., 1997).
The good news about creating cohesiveness through classroom communities was
that many things could be done with a modest investment of time and energy (Schaps
et al., 1997). Martin (1992), recalling the success that Montessori had with the street
urchins of Rome in the school she began, suggested that educators could serve the great
needs of students by creating what she called a “school home” where the students would
learn not only the three Rs, but also the three Cs: care, concern, and connection. The
concept of the school home was essentially the same as that of the classroom community.

36
A limited number of studies have been conducted to date that clearly show a
relationship between sense of community and student motivation, commitment, and
school performance, but the findings were generally encouraging. Goodenow (1993)
studied 353 sixth, seventh, and eighth grade students in a suburban New England middle
school. A large majority (93%) were white and of European-American ancestry. The
School Opinion Questionnaire was administered during regular English classes. The
Class Belonging and Support Scale was also utilized. Goodenow found positive
relationships between urban middle school students’ feelings of belonging and their
academic motivation and effort. Bryk and Driscoll (1988) found positive relationships
between a communal school organization and high school students’ motivation, academic
interest, and performance. Solomon, Watson, Battish, Schaps, and Delucchi (1992) found
numerous positive associations between a sense of the classroom as a community and
students’ academic and interpersonal attitudes and motivations. These studies supported
the idea that cohesiveness and a feeling of classroom community went hand-in-hand and
could be essential in creating a positive classroom climate.
Montoya and Brown (1990) were involved with one of the more recent studies
regarding the relationship between cohesiveness and academic achievement. Participants
were members of eight sixth grade classes. Four of the classes were in elementary
settings, and four were in middle school settings. Classes were matched as closely as
possible according to economic status and ethnic composition. The math, reading, and
overall scores on the California Test of Basic Skills were correlated. The School Climate
Inventory Instrument measured school climate perception scores. Findings revealed that
elementary and middle school students perceived school climate at essentially the same

37
levels. Students’ perceptions of cohesiveness and total battery scores were significantly
and positively correlated.
Friction
Friction, the amount of tension among students and staff, was another area of
interest involving the environment. Researchers tried to determine whether or not a
relationship existed between friction and academic achievement. Chavez and Cardenas
(1980) studied a group of sixth grade classrooms in schools having both English bilingual
bicultural education programs and non-bilingual education programs. The participating
schools were located in northern and southern New Mexico. Data collected included age,
sex, ethnicity, type of classroom (bilingual or nonbilingual), and third and fifth grade
California Test of Basic Skills achievement scores in language arts, reading, and the
battery total. Four elementary schools from two school districts were included. A total of
157 students were involved in the study. The instrument used to obtain the climate scores
for the study was a modified version of the My Class Inventory. The modified instrument
used all climate scales except that of difficulty. A step-wise regression was utilized.
Chavez and Cardenas found that the lower the degree of friction perceived, the higher the
students’ levels of achievement would be.
A 1981 study by Haertel, et al., began with a search including Dissertation
Abstracts, the Education Index, Psychological Abstracts, and the Social Science Citation
Index. On-going, unpublished studies known by the authors were also considered for
inclusion. All studies involved naturalistic classroom settings in kindergarten through
twelfth grade that reported both simple and partial correlations between students’
perceptions of the climate of their classes compared with end-of-course learning. The
search yielded 12 investigations of 10 data sets that reported 734 correlations calculated

38
from a total of 17,805 students in 823 classes. Environmental measures had internal
consistency reliabilities between 0.41 and 0.86. Outcome measures included
standardized achievement tasks as well as affective and behavioral measures. Ten of the
12 included some cognitive measure of achievement. Most of the investigations
employed the Learning Environment Inventory (LEI) in original, simplified, or shortened
form. In the analyses, the directions of LEI scale-learning outcome correlations were
summarized for each independent study, and all studies were given equal weight. In the
regressions, however, each of the 734 correlation coefficients was treated as a separate
observation. Special procedures were developed for the regressions to give each data set
equal weight, and jacked-knifed estimates of the regression coefficients were employed
to afford statistical independence for significance tests. Regression equations revealed 10
of the 18 coefficients to be significant at the 0.05. The researchers determined that low
friction in the classroom resulted in a positive correlation with student achievement.
In a study by Deng (1992), results indicated that increased friction in the
classroom resulted in academic differences between male and female students. In
addition, higher levels of class friction were associated with increased inequality of
achievement for students of different racial groups. However, in classrooms with reduced
friction, there appeared to be a more equal distribution of academic achievement among
students regardless of gender and race. High levels of student satisfaction were associated
with a reduction of achievement differences between high socioeconomic status and low
socioeconomic status students. That is, students’ positive perceptions toward their classes
were related to a more equitable social distribution of achievement. It should be noted,
however, that when comparing means of the entire sample, no significant relationship
could be found to exist between friction and student achievement.

39
A study in Thailand by Chatiyanonda (1978) examined a sample of 989 twelfth
grade physics students in thirty-one classes in Bangkok or nearby provinces. The learning
environment was measured with a Thai version of 10 of the scales of the Learning
Environment Inventory (LEI), which was used to predict three attitudinal outcomes.
Simple correlational analysis revealed that half of the correlations between an LEI scale
and a post-test score on an attitude scale were significantly different at the 0.05 level of
confidence. It was found that more favorable attitudes to physics learning were expressed
in classes perceived as having less friction, as well as other factors.
Walberg and Anderson (1968) used a group of five cognitive and affective
pretests administered at the beginning of the school year to predict classroom
environment during the year. The sample consisted of 76 high school physics classes, and
the classroom environment was measured by the Classroom Climate Questionnaire.
Results were compared with five predictor instruments: the Test on Understanding
Science, a Physics Achievement Test, the Science Process Inventory, the Pupil Activity
Inventory, and a Semantic Differential. The method of analysis was that of canonical
correlation. Results revealed one significant correlation: the “achieving” class appeared
to have a friendly, democratic, goal-directed character, while the other class seemed to
have more friction among members.
Students’ perceptions of the learning environment have been explored in a variety
of settings. One study by Eash and Rasher (1978) examined 15 inner city schools in a
large public school system and seven nationally distributed comparison schools. The My
Class Inventory (MCI) was administered to fourth grade students in all schools on a pre-
and post-test basis in order to examine changes over a one-year period. The Cognitive
Abilities Rating Scale was also used to determine perceptions of climate. The relationship

40
between achievement and student perceived learning environment was examined using
the school as the unit of analysis. To examine the relationship between achievement and
student perceived learning environment, five sets of seven regression analyses were
performed. Results indicated that when using grade equivalent scores, there was
confirmation of a relationship between the learning environment and achievement for the
19 schools for which achievement data were available. Results further indicated that
increased friction was found to be negatively correlated with higher academic
achievement.
Anderson’s study (1970) yielded surprising results regarding friction. He found
that either extreme of friction was positively related to gains in understanding. These
results were totally unanticipated. He suggested that in classes with high friction, pupils
might have been forced to withdraw from the peer group influence, escape from the
conflict associated with classmates, and turn their hostilities into their work. The effect
might have been recognized as competition. If extremely high friction was similar to
competition (and this was merely speculation), it could have been that extremely low
friction was just another term for cooperation. High friction appeared to be best for high
ability females, while females of low ability required low friction to be successful.
Simmons (1989) sought to investigate the relationship between students’
perceptions of the learning environment and reading achievement. The sample included
177 kindergarten students and 123 primary grade students from 21 elementary schools in
north central Florida. Both rural and urban schools were included in the study. The My
Class Inventory was used to determine students’ perceptions of the learning environment.
These scores were compared with the California Achievement Test scores using Pearson
correlation procedures and multiple regression. The alpha levels for the tests of

41
significance were set at .01. Results of the study revealed that friction was negatively
related to achievement. In other words, classrooms with greater friction resulted in a
decrease in student achievement.
Dunn and Harris (1998) studied a group of 230 fourth grade students in the
southeastern part of the United States. Their purpose was to examine selected factors
associated with classroom climate as perceived by elementary school students and to
explore the relationships between those factors and academic achievement. The sampled
classrooms were fairly evenly divided along gender lines. These students were
administered the short form of the My Class Inventory, and they also took the state
mandated achievement exam. The dependent variable areas included reading, math, and
language. A stepwise multiple regression analysis was performed at the .05 alpha level of
significance. Results of this particular study indicated that cohesiveness appeared to have
no significant relationship to student achievement.
Satisfaction
An effective school climate has been described by White (1986) as a school
environment in which the staff, students, and patrons attain high levels of satisfaction and
productivity. Kelley (as cited in White, 1986) stated that climate consists of two major
dimensions – satisfaction and productivity. He described satisfaction as the sense of
fulfillment of needs an individual experiences, along with enjoyment and happiness, as a
result of the environment.
Since the 1950s the literature has consistently reported that the relationship
between satisfaction and productivity is neither predictive nor causal. This lack of
predictive link between satisfaction and productivity led most researchers and theorists to
conclude by the 1960s that morale studies were important only if measures of satisfaction

42
were sought, but such studies were relatively meaningless for use in making inferences
about productivity (Anderson, 1982). This stimulated a number of studies based on the
assumption that a direct and casual link between human satisfaction and human
productivity exists (Wren, 1992).
Even before there was an interest in school social climate emanating from
effective schools’ literature, theorists and researchers were exploring the notion of quality
of school life as an outcome process of schooling. To these investigators, school
satisfaction for students was comparable to job satisfaction for adults. Assessing the
environment was important to determine the impact of the school setting on student
attitudes and behavior. General satisfaction was seen as important to students in school as
it was to adults at work in terms of daily mental health. Furthermore, positive reactions
to school could increase the likelihood that students would stay in school longer, develop
a lasting commitment to learning, and use education to the students’ advantage. This idea
was supported by researchers who believed that positive social environments and positive
learning outcomes went hand in hand (MacIntosh, 1991).
A central element of classroom learning has been the design of activities and
tasks. Students’ perceptions of these not only influenced how they approach learning;
these perceptions also had important consequences for how they used available time
(Good, 1983). Embedded in tasks was information that students used to make judgments
about their ability, their willingness to apply effort, and their feelings of satisfaction.
Tasks that involved variety and diversity were more likely to facilitate an interest in
learning (Rosenholtz & Simpson, 1984), and students were more likely to approach and
engage in learning when they perceived meaning in an activity (Brophy, 1987).
43
Cullen (1969) studied a sample of eighth graders. All 372 students, except slow
learners (who were not accessible), were tested in a large northeastern Ohio city. The
Junior High School Student Opinion Poll was used to assess attitudes of these students.
The achievement and attitude marks received by each student while in grades seven and
eight were obtained from school records or report cards. The Ohio Survey Tests were
used as measures of academic achievement, and the investigator developed self-attitude
scales. The components of school satisfaction were determined by a factor analysis for
the responses of the total group to the Student Opinion Poll. These scores were then
correlated with other variables at a significance level of .05. Results indicated that
satisfaction was significantly correlated with achievement. The study further suggested
that school satisfaction could be improved if teachers would place greater emphasis on
reducing student fear of the difficulty of the subject.
White (1986) wanted to measure the relationship between school climate (as
defined by teacher satisfaction), classroom climate (as defined by student satisfaction), and
student achievement. He used the Work Environment Scale (WES), Classroom
Environment Scale (CES), and Comprehensive Test of Basic Skills (CTBS) in a study
involving about 800 seventh though eleventh grade students and 39 teachers in southwest
Florida. Approximately two-thirds of the students lived in suburban areas, and the
remaining third lived in urban areas. White used an ex-post-facto correlational design.
Pearson product-moment correlation coefficients were computed at an alpha level of 0.05.
The statistical software package used for analysis purposes was Statistical Package
Software System (SPSS) version 2.1. Mean scores for the three major dimensions and nine
subscales of the WES and CES were computed. In addition, the mean scores for the
teacher and student total battery on the WES and CES and mean scores for the student total
44
battery on the CTBS were computed. White found a positive and significant relationship
between classroom climate and student achievement (r = 0.57). His research also suggested
that the higher the student satisfaction with the classroom environment, the higher the
achievement would be.
Fraser and Fisher (1983) agreed that satisfaction, in addition to other factors, was
highly correlated with learning. In their study, a total of 29 variables were used in
exploring relationships between achievement and environmental perceptions. Student
achievement was measured at the beginning of the school year and again at the end of the
same school year, using six affective and three cognitive outcome measures. The sample
consisted of a representative group of 116 eighth and ninth grade science classes in
33 schools in Tasmania, Australia. Both suburban and rural schools were included. Data
was obtained from about 1,000 students. The Individualized Classroom Environment
Questionnaire (ICEQ) was used to determine perceptions of the classroom environment.
Cognitive outcomes were measured by the Test of Enquiry Skills, including
Comprehension of Science Reading, Design of Experimental Procedures, and
Conclusions and Generalisations (sic). The first set of analyses for each outcome post-test
involved performing a hierarchical regression analysis utilizing sets of student
background characteristics, actual environment variables, and actual preferred
interactions. These researchers determined that when students were satisfied with their
classroom, they learned more content, and they liked school and the subjects being
taught.
Cullen and Katzenmeyer (1970) examined the relationship between achievement
and perceived attitudes among eighth grade students. The component of school
satisfaction was measured by the Student Opinion Poll, and the relationship of this

45
component was compared with various achievement and ability scores through factor
analysis. Four components of school satisfaction were examined: teacher student
relationships, student peer relationships, subject matter difficulty, and subject matter
interest. They found that certain components of school satisfaction were significantly
related to achievement, and these components significantly increase the multiple
correlation between ability and achievement. It was felt, however, that further research
was needed to better define the nature of the school satisfaction components.
Chavez and Cardenas (1980) agreed with the importance of satisfaction in the
learning environment. These researchers found that Chicano and non-Chicano students
achieved at higher levels in language arts, reading, and total battery achievement when
the students’ perceptions of satisfaction was high. Also, Chicano students needed to
perceive twice the amount of satisfaction to experience the same achievement level in
reading and total battery as non-Chicanos.
Wren (1992) was involved with a study to determine the relationship between the
achievement level of 257 students enrolled in sixth grade reading classes and the
students’ perceptions of school climate and school satisfaction. Subjects in the study were
from a junior high school in northwest Mississippi town with a population of about 6,400.
Approximately 45% of the population was male, and 55% was female. The community
was predominantly rural and agrarian. Two groups of subscales from the National
Association of Secondary School Principles (NASSP) School Climate Survey identifying
students’ perceptions of climate and satisfaction were tested to determine which
subscales would predict student outcomes in terms of academic achievement as measured
by the total reading battery score of the Stanford Achievement Test. The results of data
collection were tested using a Pearson product-moment analysis and a stepwise multiple

46
regression analysis. The significance of each predictor variable was measured by an F-
test at 0.05 level. Based on the data analyzed, a significant correlation was found between
student satisfaction and student achievement.
Although there has been a body of research suggesting that there is a relationship
between satisfaction and student achievement, other studies were not so conclusive. A
study by Deng (1992) examined 875 fourth grade students. His purpose was to construct
a multilevel analytic model to specify relationships between classroom climate factors
and mathematics achievement of students in Tennessee. He compared means of the
Tennessee Classroom Climate Inventory and the Tennessee Comprehensive Assessment
Program. A multi-level analysis of the data was conducted using the HLM computer
program. Analysis included three steps: (a) apportioning variations between and within
classes using a one-way ANOVA and chi-square analysis, (b) assessing the homogeneity
of the regression assumption, and (c) assessing the effects of class climate factors.
Surprisingly, results of this study indicated no significant relationship between
satisfaction and class mean achievement (t = -1.87). Likewise, Anderson’s (1970) study
found no significant relationship between satisfaction and learning. Research by Dunn
and Harris (1998) indicated the same results. They, too, found no relationship between
satisfaction and student achievement.
Competitiveness
One extremely important consideration in the development of classroom climate
was that of cooperation verses competition. A cooperative goal structure existed when
students perceived that their own achievement goals were dependent on how well other
students achieved their goals. Cooperative goal structures resulted in the most accurate
communication between students, constructive conflict management, a decreased fear of

47
failure, increased levels of trust, greater peer acceptance, and improved support and
emotional involvement in learning (Paradise, 1994).
Competitive goal structures existed when students competed with each other for
achievement goals. When competing cliques evolved, students were more likely to focus
on negative attributes of others and were more likely to become social isolates, rejected
by others (Paradise, 1994). Ames (1984) reported that social comparison in the public
classroom was extensive, including announcement of high and low scores, charts of
students’ progress, ability grouping, and displays of selected papers and achievements.
The impact of this type of competition on students when they compared unfavorably
could be seen in the students’ of their own ability, avoidance of risk taking, use of less
effective learning strategies, and negative affect directed toward self. Students’
self-evaluations of their ability were more negative when the students were focused on
winning than when they were focused on improving their performance. In classrooms
characterized by public evaluation, students became more focused on their ability and the
distribution of ability in the classroom group. Many students not only came to believe
that they lacked ability, but this perception became evident among peers. Because
performance oriented or competitively oriented environments encouraged a focus on
ability, they did not support the use of strategies that required sustained effort over time.
Consequently, conceptual learning might have been negatively affected when evaluation
was perceived as having direct consequences for oneself (Garner, 1990). It was not the
mere availability of social comparison information that was problematic, however; when
this type of information was emphasized the link between effort, outcome, and affect
became undermined (Jagacinski & Nicholls, 1987). As students progressed through
school, evaluation became more formal and more closely tied to performance criteria

48
than simply to assignment completion. When evaluation was normative, emphasized
social comparison, was highly differentiated, and was perceived as threatening, it
contributed to a negative motivational climate. Moreover, this type of evaluation
contributed to avoiding and accepting failure (Covington & Omelich, 1985).
According to Ames (1992), an important goal for teachers was to develop an
environment that accepted individual differences and allowed all students to develop a
feeling of belonging. Competition fostered cautious, defensive interaction and misleading
and threatening communication. Individualistic goal structures were formed to separate
students, reduce interaction, and allow independent learning experiences. In
individualistic settings, students worked by themselves without interacting with one
another (Paradise, 1994). In order to avoid such isolation the teacher may have chosen to
incorporate varied groupings. Ames (1992) found that a diversity of grouping
arrangements providing opportunities for peer cooperation and cooperative learning
minimized individual fears of failure and competition. The use of cooperative groups was
also found to be more effective in creating a positive atmosphere (Paradise, 1994).
Compared with traditional methods, cooperative learning was found to promote better
relationships among different ethnic groups and greater acceptance of students who had
disabilities (Slavin, 1981). When students’ psychosocial needs were met, they performed
academically. Interpersonal student relationships were important to meeting psychosocial
needs. In classes where students disliked one another, factors such as hostility,
competitiveness, distrust, insecurity, and aggression developed, preventing students from
performing well (Paradise, 1994). Therefore, the use of varied grouping arrangements
may have been used to help counteract these factors.

49
Talmage and Walberg (1978) used the subscale of competition along with several
other variables as part of an evaluation study to select a basal reading series for adoption
in a large school district and to explore other factors possibly related to reading
achievement. Four reading series were pilot tested in 12 schools in grades one, two, three,
and six. A fifth series, the schools’ current adoption, provided baseline data. A total of
60 classes participated, with both pre and post tests administered, including the
Metropolitan Reading Readiness Test and the Scholastic Reading Achievement Test.
Data were analyzed using a step-wise multiple regression. Most of the variables
incorporated in the study did not account for significant differences. Nevertheless,
competitiveness in the learning environment proved to be the only variable which
predicted post-test reading scores after pre-test effects were removed. As students
perceived higher levels of competitiveness, reading achievement scores dropped. The
higher the competitiveness perceived by students, the lower the reading achievement
scores. Talmage and Walberg concluded that competitiveness was the crucial variable for
reading progress in the study. They confirmed that if they had not used it as a variable,
valuable information about aspects of the natural setting affecting reading achievement
would have gone undetected.
Fisher and Fraser (1980) explored the relationship between competition and
academic achievement. They examined the predictive validity of a modified version of
the My Class Inventory (MCI) among a sample of 2,305 twelve-year-old students in
100 classrooms in Tasmania, Australia. Multiple regression analysis was used to estimate
the amount of variance accounted for by MCI dimensions before and after controlling for
the parallel pretest and general ability. The researchers found that the MCI scales

50
accounted for a significant amount of learning outcome variance at the 0.05 alpha level,
indicating that there was a strong connection between competition and achievement.
Moos and Moos (1978) studied 19 classes from one high school in which students
were almost exclusively in a college preparatory curriculum. The subject matter included
math and algebra, foreign languages, biology, English, art, and accounting. The classes
were all about the same size, and student absenteeism records were kept for students in
each class. Students’ final grades were obtained at the end of the semester. Information
concerning the dimensions on which classroom social environments differed was
obtained for the Classroom Environment Scale, which was given to the students in each
class in the middle of the semester. A correlational analysis was used with an alpha level
of 0.05. Results indicated that students may have learned more in classrooms that
emphasized competition and difficulty, but they apparently also were absent more often
from these classrooms. Since absenteeism was related to poorer grades and/or later
dropping out, an emphasis on competition may have encouraged cognitive growth among
some students but at a great personal cost to others.
Slonaker (1979) investigated the relationship between students’ perceptions of the
classroom climate and reading gains of sixth grade students. Her sample included
269 students randomly selected from sixth grade classrooms. Instruments included the
My Class Inventory, the Otis-Lennon Mental Ability Test, and the Science Research
Associates Assessment Survey. Data was analyzed using the Pearson product-moment
correlation and multiple regression with an alpha level of 0.05. Slonaker’s findings did
not reach statistical significance in the area of competition.

51
Difficulty
A final component in determining classroom climate was that of difficulty.
Lepper and Hodell (1989) stated challenge was a factor incorporated in the design and
structure of a learning task. They argued for tasks that offered personal challenges to
students. According to their study, when tasks were enriched with such a motivational
embellishment, the tasks were more likely to create an intrinsic purpose in learning.
Burkman and Brezin (1981) reported that students tended to try to meet
established performance standards as long as they were perceived to be achievable. When
standards were set too high and learning tasks became too difficult, however, the results
were discouragement and diminished performance. The subjects for this study were
1,089 students enrolled in the first segment of a physical science course. Students were in
32 classes taught by 12 teachers. Fifty-seven percent of the students were boys, and
forty-three percent were girls. The study was part of the 1978-1979 national field test for
16 instructional modules being developed by the Individual Science Instructional System.
Schunk (1981) tested the hypothesis that student effort based on prior student
achievement was effective in promoting subsequent achievement behaviors. Forty
students lacking in subtraction skills were selected from two elementary. The 26 males
and 14 females were predominantly middle class. Teachers initially identified students
who lacked subtraction skills. Those students received training and opportunities to solve
subtraction problems. Self-efficacy was measured using ranges from 10 to 100.
Significant F ratios were analyzed using the Newman-Keuls Multiple Comparison Test.
Results showed that attribution for prior achievement led to more rapid training progress,
greater skill development, higher precepts of self-efficacy, and more accurate
self-appraisal of capabilities. In contrast, attribution for future achievement did not
52
influence students’ achievement outcomes. Effort attribution was most effective with
tasks perceived as intermediate in difficulty.
Walberg (1969) used the Learning Environment Inventory in a random sample of
physics classes throughout the nation. Six cognitive and noncognitive variables were also
used, including the Test on Understanding Science, the Welch Science Process Inventory,
the Physics Achievement Test, the Academic Interest Measure, the Pupil Activity
Inventory, and the Henmon-Nelson Test of Mental Ability. Data were collected from
classes in a sample of 75 teachers. Class means were calculated on all variables, and
these became the units of analysis. Canonical correlations were tested for significance.
Results indicated that students in classes seen as more difficult achieved greater physics
and science understanding.
Walberg and Greenberg (1997) indicated that students who rated their classrooms
high on challenge using the Learning Environment Inventory achieved more
academically, had better attitudes toward the subject matter, and engaged more often in
non-required activities related to the subject matter. A similar study by Haertel, et al.,
(1981) also revealed a positive correlation with the subscale of challenge. Anderson
(1970) found a positive relationship between difficulty and achievement gains for low
ability girls. However, high ability students showed no significant relationship between
subject difficulty and achievement gains. Anderson’s findings suggested students
performed best when challenged. The study also suggested that students only worked
hard enough to achieve a certain level; but when the work was perceived as difficult,
students probably prolonged their efforts before assuming they had reached their personal
goal. Stated in another way, students applied themselves out of a fear of failure, and they
continued to work hard as long as their fear existed.

53
Limited research was available in the area of subject difficulty, and the results
were inconclusive. While some studies suggested that a challenging curriculum was
essential in developing a positive classroom climate, others indicated that when the
subject matter became too difficult, academic achievement was threatened.
Summary
The quality of education has been reflected not only in the subjects taught and
achievement levels reached, but also in the learning environment. The environment has
both reflected and influenced the behavior of students, and it has been affected by events
within and outside of the school (Condition of Education, 1998). Most educators and
researchers have agreed that the total environment should be comfortable, pleasant, and
psychologically uplifting; should provide a physical setting that students find
educationally stimulating; should produce a feeling of well being among its occupants;
and should support the academic process. These goals, while lofty, have been considered
to be achievable through the cooperative efforts of imaginative educators (Castaldi,
1987). It has been educators’ responsibility to use research findings to implement any and
all climate factors conducive to creating an environment that may result in increased
student achievement, but these specific environmental factors have still been considered
to be rather ambiguous.
One of the strongest traditions of classroom environmental research has involved
investigation of the predictability of students’ cognitive and affective learning outcomes
from perceptions of their classroom environment. The studies reviewed here did not
provide consistent and convincing support for the predictive validity of students’
perception in accounting for appreciable amounts of variance in leaning outcomes.

54
CHAPTER 3
METHODOLOGY
Methods
Three distinct methodologies for assessing and studying classroom psychosocial
environments can be clearly delineated. The first approach involves observation and
classification of classroom interaction. The technique of observing and classifying events
in the classroom environment is known as interaction analysis. This technique involves
the coding of classroom communication (primarily verbal) according to some category
system. This task of classification can be performed directly by an observer or can be
recorded on audiotape or videotape for later classification (Fraser, 1981; Fraser &
Walberg, 1981).
In the second methodology, the classroom environment can be studied and
measured using techniques referred to as naturalistic inquiry, ethnography, or the case
study approach. This approach would be considered a qualitative study. Comparatively
few studies of classroom environments have systematically applied the techniques of
naturalistic inquiry and case study (Fraser, 1981).
The third method focuses on students’ and teachers’ perceptions of the
classroom environment. Students spend a vast amount of time, approximately
15,000 hours, in school classrooms (Rutter, Maughan, Mortimore, Ouston, & Smith,
1979). Consequently, the quality of life in these classrooms is of great importance, and
students’ reactions to and perceptions of their school experiences are significant.
55
Student Perceptual Measures
Several advantages to the use of student perceptual measures in preference to
classroom interaction techniques are offered. First, perceptual measures are more
economical than classroom interaction techniques that involve the expense of trained
observers and large amounts of hand coding. Second, perceptual measures are based on
students’ experiences over many lessons, while interaction data usually are restricted to a
small number of lessons. Third, perceptual measures involve the pooled judgements of all
students in a class, whereas interaction techniques typically involve only a single
observer. Fourth, students’ perceptions, because they determine student behavior, can be
more important than observed behaviors. Fifth, perceptual measures of the environment
typically have been found to account for considerably more variance in student learning
outcomes. Finally, students seem quite able to perceive and weigh classroom stimuli and
render valid judgements about psychosocial characteristics of their classrooms (Fraser &
Walberg, 1981). This final method, students’ perceptions, will be utilized for this study
through the use of a survey.
According to Taylor (1989), climate had to be a first step any educator considered
in an attempt to improve student achievement. For schools to be effective, a humane and
healthy school climate affecting the life and activities of students and staff was a
necessity. Because climate influenced the affective domain, it was difficult to isolate
from skills, knowledge, and attitudes that students gained during their academic studies.
Nonetheless, experience suggested that more efficient learning occurred in a wholesome
environment. Taylor believed that six distinct components had to be present in order to
develop a healthy and humane climate: respect, involvement (empowerment), social and
academic growth, high morale, and collegiality. Keefe, Kelly, and Miller (1985) agreed,

56
concluding that climate assessment should be the first step in any school improvement
proposal. They explained that this view was a common recommendation of both
researchers and practitioners who had studied school environments. The benefits derived
from a comprehensive understanding of the effects of students’ perceptions of climate
could lead to identification of various measures school faculties could take in developing
effective interventions to produce improved academic performance of students.
A milestone in the historical development of the field of learning environments
occurred when Herbert Walberg and Rudolf Moos began seminal independent research.
Walberg (1979) developed the Learning Environment Inventory (LEI) as part of the
researcher and evaluation activities of the Harvard Physics Project. Moos (1979), of
Stanford University, developed social climate scales for various human environments
including the Classroom Environment Scale (CES). Walberg and Moos’s pioneering
work built on earlier foundations of Lewin (as cited in Fraser, 1981) and Murray (as cited
in Fraser, 1981). The work of Walberg and Moos was important because they provided a
foundation upon which later predictive validity studies have been built, and because they
demonstrated the use of a variety of important methodological techniques. These
techniques included the use of interaction and curvilinear environment terms, various
multivariate data analysis techniques (e.g., multiple regression and canonical analysis),
and a system of data collection in which testing time could be reduced by having
different random subsamples of students within a given class responding simultaneously
to different parts of a whole test battery. Generally, their studies involved the prediction
of learning outcomes measured at the end of a school year from students’ perceptions of
the classroom environment, most often with statistical control for performance on
corresponding beginning-of-year learning outcome measures.

57
Research Design
Primary to the purpose of relationship studies is identifying possible causes and
effects of important educational phenomena, such as academic achievement. This type of
correlational research is especially useful for exploratory studies in areas where little is
known. The first step in examining a relationship is to identify specific variables that
show promise of being important determinants of the characteristic or behavior pattern
under investigation. A review of existing research and theory is usually helpful in
identifying these variables, since although relationship studies are exploratory, they
should be guided by such research and theory in order to increase the likelihood of
finding variables that cause the behavior pattern of interest (Gall et al., 1996).
The next step in correlational research is to select research participants who can
be measured on the variables that are being investigated. These participants must be
reasonably homogeneous; otherwise relationships between variables might be obscured
by the diversity of the group. Data for correlational research can be obtained by various
methods including standardized tests, questionnaires, interviews, or observational
techniques; but the data must be quantifiable. In a simple relationship study, the data are
analyzed by correlating scores on a measured variable that represents the phenomenon of
interest with scores on a measured variable thought to be related to that phenomenon.
The results of the comparison will be expressed in terms of a correlation coefficient,
which can be either positive or negative. Gall et al., (1996) defined a correlation
coefficient as “a mathematical expression of the direction and magnitude of the
relationship between two measured variables" (p. 756). It must be understood that
correlations obtained in a relationship study cannot establish cause and effect between
variables. Results can only be expressed in terms of a relationship.

58
In a correlational study there are two types of variables. The independent
variables, also known as predictor variables, are so called because they are independent
of the outcome, yet they are assumed to influence the outcome. The dependent variables,
also known as criterion variables, are so called because they are dependent on the
independent variables. In other words, the outcome presumably depends on how the input
variables are manipulated (Isaac & Michael, 1995). When variations in the dependent
variable are attributed to changes in only a single independent variable, this is known as
simple linear regression; yet, theories frequently suggest that several factors
simultaneously affect a dependent variable. Multiple linear regression analysis is a
method for measuring the effects of several factors concurrently. The concept of multiple
regression analysis is identical to that of simple regression analysis except that two or
more independent variables are used simultaneously to explain variations in the
dependent variable. More generally, the estimated coefficient for any independent
variable estimates the effect of that variable while holding the other independent
variables constant. For this reason, multiple linear regression analysis results come closer
to indicating a pure effect (Schroeder et al., 1986).
A univariate analysis of variance (ANOVA) consists of two kinds of variables:
independent and dependent. In a one-way ANOVA only one independent variable is
considered, but there can be any number of levels of the independent variable. The
dependent variable is presumed to be the result of manipulating the independent variable.
The procedure for testing a null hypothesis against an alternative hypothesis is the
analysis of variance. The variation of the scores within groups is compared with the
variation of the scores between the group means and the mean of the total group (Hinkle
et al., 1998).

59
In developing a good research design it is extremely important to consider
reliability and validity. According to Isaac and Michael (1995) reliability refers to the
“accuracy (consistency and stability) of measurement by a test. This is determined by
retesting an individual with the same test” (p. 32). Validity indicates “the degree to which
the test is capable of achieving certain aims” (p. 32). In other words, does the test
measure what it intends to measure? Both reliability and validity are vital to an effective
research design.
Assessing the Learning Environment
Classroom environment research has investigated the association between students’
cognitive and affective learning outcomes and their perceptions of psychosocial
characteristics of their classrooms (Diamantes, 1994). Research on the socio-psychological
environment of the classroom emphasizes perceptual and judgmental variables, particularly
those that are rated rather than counted. These perceptions and judgments have not been
those of outside observers. Rather, investigators of the learning environment often ask
students to judge their own classroom environment. As the primary consumers of
education, students stand at a good vantage point for making such judgments. Compared
with a short-term observer, students can weigh in their judgments not only how the class
is presently, but also how it has been since the beginning of the year. They are able to
compare the child-client point of view of their class with those in past grades and with
other classes they are currently taking. Students form a group of about 20 sensitive, well-
informed judges of the class, whereas an outside observer is a single judge who has far
less data and may be insensitive to what is important in a particular class (Walberg &
Haertel, 1980).

60
Investigators of learning environments tend to use general ratings of the
environment, rather than counts of specific teacher or student acts. These subjective
ratings of perceived behavior are referred to as high inference measures. Low inference
measures, on the other hand, involve specific teacher behaviors. Low-inference scales
have the advantage that, if valid, they directly suggest changes in specific teacher
behavior. However, they are generally substantially less valid in predicting learning
outcomes than are high-inference measures (Walberg, 1971).
Development and Use of the My Class Inventory
According to Walberg (1969), the Getzels and Thelen (1960) theory of the class
as a social system had proven successful in research. This theory suggested that in
classrooms personalities, needs, and role expectations interacted to form a climate in
which group behavior, including learning, could be predicted. The Getzels-Thelen theory
was used as a guide for constructing a climate survey known as the Learning
Environment Inventory (LEI). This instrument was used to measure the social climate of
learning in the classroom as perceived by students. The original form of the LEI
contained 14 scales, but in 1969, a 15th subscale was added. The climate dimensions, or
scales, included cohesivenss, diversity, formality, speed, environment, friction, goal
direction, favoritism, cliqueness, satisfaction, disorganization, difficulty, apathy,
democraticness, and competitiveness. In selecting these 15 climate dimensions, an
attempt was made to construct the scales with only the concepts previously identified as
good predictors of learning (Chavez, 1984).
Many researchers over the years have worked to identify which aspects of the
classroom that have the greatest impact on student learning. These attempts have resulted
in classroom climate inventories for use in varied learning settings (Chavez, 1984). One

61
of these instruments, which was developed for elementary students and used with success
from kindergarten through junior high school, is the My Class Inventory (Fraser &
Frisher, 1983).
The My Class Inventory (MCI) was developed as a simplification of the widely
used Learning Environment Inventory (Diamantes, 1994). The MCI differs from the
Learning Environment Inventory (LEI) in four ways. First, in order to minimize fatigue
among younger students during its administration, the MCI has been shortened. Second,
the wording of the many original LEI items has been simplified to enhance readability for
younger students. Third, the LEI’s four-point response format has been changed in the
MCI to a two-point response format (Yes, No) in order to make responding easier for 8 to
12-year-olds. Fourth, responses to the MCI are provided on the same sheets as the
questions, rather than on a separate response sheet, in order to reduce errors in the
recording of answers (Fraser & Fisher, 1982). The MCI is also more economical in the
fact that it measures five different dimensions, yet contains only 25 items (Fraser, 1981).
The My Class Inventory asks students questions about how satisfied they are with
their classroom and how difficult they think the work is. Students are also asked about the
friction, competition, and cohesion they think exists in their classroom. These five
dimensions – cohesiveness, friction, satisfaction, difficulty, and competitiveness – were
selected because climate research indicated a high correlation with learning (Fisher &
Fraser, 1982; Fraser & Fisher, 1982; Fraser & Fisher, 1983).
The short form of the MCI is the most appropriate climate instrument for young
students. It consists of 25 statements, with five statements addressing each of the five
dimensions. The student reads each statement and circle “Yes” if the statement read
describes his/her own classroom or "No” if it does not. After all students in a class have

62
responded to the inventory, scores for each scale are averaged to provide a classroom
climate profile for that classroom (Fuqua, 1989).
According to Arter (1987), the MCI was designed to measure students’
perceptions of five dimensions of classroom social climate and was intended for use with
students ages 8 though 12. Internal consistency reliabilities for individuals ranged from
.62 - .78 (N = 2,305). Interclass correlations for groups ranged from .73 to .88 (N =
100 classrooms). Reliabilities were too low for profiling individual students, but group
profiling appeared to be justified. Reliabilities, however, were based only on seventh
grade students.
The short form of the MCI has 25 questions in a yes or no format (see
Appendix B). Students answer on the test form itself rather than a separate answer sheet.
To use the instrument, the researcher must photocopy the questions from an appendix in
the test manual after obtaining the author’s approval. The test is considered to be easy to
administer and score (Arter, 1987). Questions are arranged in cyclic order and in blocks
of five to enable ready hand scoring. The first question in each block assesses
satisfaction, the second question in each block assesses friction, the third question
assesses competitiveness; the fourth question assesses difficulty; and the last question in
each block assesses cohesiveness. Upon examining the content of the questions, it
becomes apparent that each question relates to one of the five environmental subscales.
Thus the meaning of each scale can be clarified simply by examining the questions
contained in each block (Fraser, 1989).
In order to score most items, a score of 3 is given for the “Yes” response, and a
score of 1 is given for the “No” response. But, for the items with “R” in the “For
Teacher’s Use” column, reverse scoring is used so that 3 is given for No, and 1 is given

63
for Yes (see Appendix B). This system is used to allow for consistent scoring in positive
and negative statements. Omitted or incorrectly answered items are given a score of 2.
The score for each of the 25 individual items are written in the For Teacher’s Use column
(Fraser, 1989).
The total score for a particular scale is the sum of the scores for the five items
belonging to that scale. For example, the satisfaction scale total is obtained by adding the
scores given to items 1, 6, 11, 16, and 21, while the cohesiveness total is the sum of the
scores obtained for the last item in each block. The bottom of the survey provides spaces
where the teacher can record the student’s total score for each scale (Fraser, 1989).
Development of the Stanford Achievement Test
Norm-referenced achievement tests span a broad range of designs. Many are
large-scale, corporately-constructed tests of complex design that are administered
nationally to representative samples of students in order to assess our country’s
educational health. One particular, the Stanford Achievement Test (SAT-9), consists of
13 levels designed for use from kindergarten to high school. It is similar to the
Metropolitan Achievement Test, although a little broader in coverage. The content of
each subtest was chosen in order to provide representative and balanced coverage of a
nationally agreed upon curriculum. It was designed to cover the concepts and skills most
commonly taught in U. S. schools. The development process began with careful analyses
of the most recent editions of major textbook series in every subject area. It also included
the most recent state and district curricula and educational objectives, as well as the most
important trends and directions in education according to many national professional
organizations. Test specifications were created for every subtest, and these specifications
delineated the proportion of the test content to be devoted to each objective in order to

64
provide representative and balanced coverage of this “national consensus curriculum”
(Stanford, 1996, p. 8). Curriculum specialists and content area experts reviewed the tests
for breadth, depth, and sequence of tested objectives.
A National Item Analysis Program was conducted in order to determine the
appropriateness of each test item, including the difficulty and sensitivity of the items, the
grade progression in difficulty, the effectiveness of the options, appropriate
administration times, differential group performance, and the reactions of students and
teachers to the clarity, format, and test content. The national item tryout took place in
February, 1993. Each tryout booklet was administered to about 500 students per grade
level across 39 states and the District of Columbia. The entire sample included
approximately 140,000 students. School districts were selected according to a stratified
random sampling technique, representative of the national school population in terms of
socioeconomic status, enrollment, and geographic region. Test results guided the
construction of the final form of the Stanford series. Regarding bias, every effort was
made to counterbalance any items that favored one group or another. Testing for spring
standardization took place in April 1995, with approximately 250,000 students from
1,000 school districts participating. Fall standardization took place in October 1995, with
approximately 200,000 students participating (Stanford, 1996).
The Stanford Achievement Test is a nationally normed achievement test series
that is widely used throughout the United States as a valid measure of students’ academic
achievement levels. The basic battery consists of reading, mathematics, language,
spelling, study skills, and listening tests. Science and Social Science are optional and
complete the battery. Testing time ranges from 2¼ hours in kindergarten to almost
5½ hours at the upper elementary level. The content of the ninth edition is said to

65
emphasize thinking skills more so than previous versions. The content is also said to be
aligned with the National Assessment of Educational Progress (NAEP) in reading and
with the National Council of Teachers of Mathematics (NCTM) standards in math
(Cizek, 1998).
As stated before, the MCI items are a simplified version of those on the Learning
Environment Inventory, which was revised because of low subscale reliabilities. The
authors of the current edition of the MCI examined the ability of the subscales to
differentiate between classes and how well the test predicts student outcomes (Fraser,
Anderson, & Walberg, 1982). Two reviewers in Buros of Highland Park, New Jersey, felt
the instrument has promise but needs more validation work for grades lower than the
seventh grade (Fraser & Fisher, 1983). Since the current study involved only sixth grade
students, the need for additional validation had to be taken into consideration. For that
reason, the Stanford Achievement Test was used to provide the empirical data necessary
to discuss the inclusion or exclusion of subscales as predictors of student academic
achievement in mathematics.
According to the Stanford Achievement Test, Ninth Edition, there is data to
support that the reliability of the Stanford Achievement Test is acceptable for the
purposes of this researcher’s study (Stanford, 1996). For the Total Math portion,
R = 0.94. The Stanford Achievement Test was selected for use in this study because of its
high level of reliability and because the district uses it annually to assess academic
achievement for comparison purposes. Use of this particular test produced reliable
achievement test data results that could be easily obtained without additional cost or loss
of instructional time to the district.

66
Research Design of Current Study
The purpose of this study was to construct a quantitative model to specify
relationships existing between climate factors and mathematics achievement of sixth
grade students in selected elementary schools in an suburban district using the My Class
Inventory. Permission from the author of this test was obtained through e-mail. The
rationale for selecting mathematics achievement scores as the outcome measure for this
study was based on research indicating that learning in math tends to be restricted to the
school context, while reading and verbal skills are learned both in school and at home.
Research suggested that differences in classroom climate had a greater impact on
mathematics than on reading achievement (Murane, 1975).
This research study investigated relationships between the selected criterion
variable of sixth grade math students’ academic achievement levels as measured by the
total math score of the Stanford Achievement Test and the predictor variables of school
climate perceptions of students as measured by the My Class Inventory. The five
predictor variables in the My Class Inventory were cohesiveness, friction, satisfaction,
competitiveness, and difficulty. A multiple regression analysis was used to identify the
predictor variables that were related to the criterion variable at the 0.01 level of
significance. A backward solution was also utilized in order to determine the purest form
of the regression model. In addition to the multiple regression analysis, a univariate
analysis of variance was used to establish a correlation with the predictor variables as
well as gender and socioeconomic factors. After significant F ratios were indicated, post
hoc multiple comparison tests were completed with the independent variables of
difficulty and friction using the Tukey/Kramer method (Gall et al., 1996). This procedure
was used to identify which pairs of means were the most significant.

67
Sample
The data for this research was extracted from a school district in Texas. The city
had a population of approximately 100,000 citizens, with approximately 15,000 students.
Schools consisted of 26 sixth grade math classes for a total of 262 students (N = 262).
Ten schools were selected for participation because they were all on the regular school
calendar, rather than the extended year calendar. While the principals of all 10 schools
gave permission for participation, teachers from only eight of the schools agreed to be
included. Participation by female students (N = 146) was slightly higher than
participation by male students (N = 116). Intact classes, not random individuals, were the
primary sampling unit. Other factors influencing school selection included accessibility
to the researcher and the general acceptance of each principal and teacher toward school
research. Meetings were held with the superintendent and each principal to explain the
research. Teachers were contacted through letters, e-mails, and face-to-face conferences.
Results remained completely confidential. A coding system was implemented to preserve
anonymity. The researcher was unaware of the specific results of individuals, teachers, or
schools. Each teacher was given the option of requesting his/her own results of the MCI.
Principals only received results relating to student achievement of the entire study, not by
classroom or teacher. The MCI was administered by teachers of mathematics during
regularly scheduled math classes. A copy of the inventory can be found in Appendix A.
The researcher used a correlational research design to determine the effect of classroom
climate on student achievement. The correlation between each of the five dimensions of
the MCI as they related to student achievement were studied through a multiple
regression analysis at a significance level of .01 (p = .01). A backwards solution was
utilized to determine the purest statistical form of the regression model.

68
Results were correlated with socioeconomic status of students as indicated on the
Parent Permission Form (see Appendix C). Parents were asked to indicate the family’s
total yearly income. Categories were less than $20,000, $20,000 - $39,000, $40,000 -
$59,000, $60,000 - $79,000, $80,000 - $99,000, $100,000 - $150,000, and over $150,000.
A one-way ANOVA was completed to determine whether or not a relationship existed
between Stanford Achievement math scores and the five independent variables of the
MCI. The results of the Stanford Achievement mathematics scores were also compared
with the socioeconomic status and gender of students to confirm or refute results of
earlier studies by Coleman, et al. (1966) and Edmonds, et al. (1977).
A correlation coefficient describes the extent to which two sets of data are related.
It measures the relationship between two variables and is denoted as r. The Pearson
product-moment correlation is defined as “the average cross-product of the standard
scores of two variables” (Hinkle et al., 1998, p. 111). It was selected as the correlation
coefficient for this study because variables were continuous (ratio). These variables had
an absolute zero and were equal-interval. In order to test the hypothesis, a Pearson
product-moment correlation (r) was obtained between each of the My Class Inventory
scales and the Stanford Achievement mathematics scores. Correlations were also
obtained between Stanford scores and gender/socioeconomic status. A correlated t-test
was utilized to determine the significance of each at .01 significance level (p = .01).
After completing the multiple regression analysis, a univariate analysis of
variance was utilized at the significance level of .01 (p = .01) in order to determine if
there was a significant difference among the level means of the independent variables.
Post hoc comparison tests were completed on the independent variables of friction and
difficulty. A post hoc test is completed whenever the null hypothesis is rejected as the

69
result of the F ratio exceeding the critical value, indicating some difference among the
means. After rejecting the hypothesis, the researcher still needs to determine which
combinations of means are not equal, so a post hoc multiple comparison test is used. In
this particular study, the Tukey/Kramer (as cited in Gall et al., 1996) method was
employed. This method, also called the honestly significant difference (HSD), is designed
to make all pairwise comparisons while maintaining the error rate at the pre-established
alpha level (.01). The Tukey/Kramer method is also used when comparing groups of
unequal numbers (Hinkle et al., 1998). The ANOVA, along with post hoc multiple
comparison tests, was completed in order to examine whether or not there was a
significant difference among the level means of the independent variables. My Class
Inventory scores of 1 through 5 were classified as Group 1 and were considered to be in
the low range. Scores of 6 through 10 were classified as Group 2, defining the middle
range. Scores of 11 through 15 were classified as Group 3 and were determined to
comprise the high range.

70
CHAPTER 4
RESULTS
Pearson Product-Moment Correlations
In order to investigate relationships between classroom environment perceptions
and learning outcomes, the My Class Inventory (MCI) and the Stanford Achievement
Test were administered to sixth grade mathematics students. Several steps were taken to
analyze the data. The first step involved finding Pearson product-moment correlations
between the variables studied and Stanford Achievement math scores. The means of the
MCI’s five subscales, including satisfaction, friction, competitiveness, difficulty, and
cohesiveness, were compared to the means of the total math scores on the Stanford
Achievement Test. Descriptive statistics can be found in Table 1.
The MCI allows a maximum of 15 points for each of the five independent
variables. Table 1 indicates that students in this study rated satisfaction and
competitiveness quite high (11.0 and 11.01), whereas the difficulty level was the lowest
response with a mean of 6.42. The national average for the Stanford Achievement
Mathematics Test was 50. The results of this study indicated a mean of 62.61. Clearly,
this sample of students performed above average on the Stanford Achievement
Mathematics Test.
The results in Table 2 indicate that none of the classroom climate scales in this
study showed a moderate or high correlation to Stanford Achievement Mathematics

71
Table 1
Descriptive Statistics of the Stanford Achievement Mathematics Test and My Class
Inventory Subscales
Test/Subscale Mean Standard Deviation
Stanford Achievement
Mathematics Test
Satisfaction Subscale
Friction Subscale
Competitiveness Subscale
Difficulty Subscale
Cohesiveness Subscale
62.61
11.0
9.07
11.01
6.42
9.64
23.89
2.92
2.92
2.82
2.14
3.37
Table 2
Pearson Product-Moment Correlations Between Satisfaction, Friction,
Competitiveness, Difficulty,Cohesiveness, and Stanford Achievement Mathematics Test
Scores
Stanford Satisfaction Friction Competitiveness Difficulty Cohesiveness
Stanford 1.0 .058 -.186 -.026 -.246 -.050
Test scores at the sixth grade level. Friction, competitiveness, difficulty, and
cohesiveness scores all indicated negative relationships, but they were at a low levels of
correlation. These results suggest that friction, competitiveness, difficulty, and

72
cohesiveness have a low negative impact on classroom climate. Friction and difficulty
showed the strongest relationship (r = -.186 and -.246 respectively), but again, results
indicated low negative correlation to mathematics achievement. The only positive
correlation was that of satisfaction (r = .058), but this scale also indicated low correlation
to mathematics achievement, suggesting that there is a low positive impact on
mathematics achievement.
Multiple Regression Analysis
The second step in the data analysis involved the use of multiple regression
analysis to investigate whether a combination of classroom environment factors would
have predictive power for mathematics achievement. Table 3 shows the R2 value was
.105. This indicates that all five classroom climate indicators combined together
explained only 10.5% of the variance in the Stanford Achievement Mathematics Test
scores. The table also indicates a low positive correlation between combined factors and
Stanford math scores.
Table 3
Model Summary – Multiple Regression Analysis
Model R R2 Adjusted R2
Standard Error
of the Estimate
1 .324 .105 .087 22.83

73
A backward solution was utilized to determine the purest form of the regression
model. In this approach, all predictor variables are initially entered into the regression
model, and they are deleted if they do not make a significant contribution to the
regression. In this study, the variables of satisfaction and competitiveness were removed,
leaving the predictor variables of cohesiveness, difficulty, and friction. This resulted in an
R2 value of .103, indicating that only 10.3% of the variance in Stanford Achievement
Mathematics Test scores could be explained by the remaining climate indicators
combined together (see Table 4).
Table 4
Backward Solution Model Summary – Multiple Regression Analysis
Model R R2 Adjusted R2
Standard Error
of the Estimate
3 .322 .103 .093 22.75
Note. Predictors: Cohesiveness, Difficulty, Friction. Dependent Variable: Stanford
Achievement Mathematics Test Scores.
Univariate Analysis of Variance (ANOVA): My Class Inventory
The results of the multiple regression analysis were unexpected and did not
always support past research. Some of the past studies, however, incorporated other
statistical measures. Therefore, a univariate analysis of variance was completed in order
to determine whether or not there was a significant difference among the level means of

74
the independent variables. Responses were divided into three groups. My Class Inventory
scores of 1 through 5 were classified as Group 1. These scores were considered to be in
the low range. Scores of 6 through 10 were classified as Group 2, considered to be in the
middle range. Scores of 11 through 15 were classified as Group 3, comprising the high
range. An ANOVA was utilized to examine the deeper level of specificity in describing
significant differences among the levels of the independent variable and the dependent
variable (see Table 5).
Table 6 indicates the results of the univariate analysis of variance. The
independent variables of satisfaction, competitiveness, and cohesiveness did not appear to
be significant. Friction (sig. = .006) and difficulty (sig. = .002), however, appeared to be
significant at the alpha level of .01. Results from this table indicate statistically
significant differences exist between the three levels of friction and the independent
variable of the Stanford Achievement Mathematics Test for sixth grade students and
between the three levels of difficulty and the independent variable of the Stanford
Achievement Mathematics Test for sixth grade students.
Research Questions
Research Question One
What is the relationship between students’ perceptions of the classroom climate
and mathematics achievement? As stated in the null hypothesis, there is no relationship
between students’ perceptions of the classroom climate and mathematics achievement.
According to the correlation coefficient analysis results, the five subscales of the My
Class Inventory revealed low correlations between the MCI subscales and mathematics
achievement, as measured by the Stanford Achievement Mathematics Test (Table 2).

75
Table 5
ANOVA – Descriptive Statistics: My Class Inventory Subscales
Subscale Mean Standard Deviation NSatisfaction
Group 1
Group 2
Group 3
Total
Friction
Group 1
Group 2
Group 3
Total
Competitiveness
Group 1
Group 2
Group 3
Total
Difficulty
Group 1
Group 2
Group 3
Total
Cohesiveness
Group 1
Group 2
Group 3
Total
62.28
60.04
63.72
62.61
66.03
65.61
55.35
62.61
66.60
62.13
62.46
62.61
66.61
57.86
51.48
62.61
61.45
65.74
59.93
62.61
22.25
24.83
23.71
23.89
20.62
23.00
25.57
23.89
19.51
24.82
23.95
23.89
21.86
25.87
24.72
23.89
22.78
22.62
25.28
23.89
18
72
172
262
35
149
78
262
15
69
178
262
159
80
23
262
38
111
113
262
Note. Dependent Variable: Stanford Achievement Mathematics Test Scores

76
Furthermore, according to the multiple regression analysis, the combination of the
five subscales of the MCI had a low positive correlation with mathematics achievement
(r = .324) and accounted for only 10.5% of the variance between the independent
variables and the dependent variable. The ANOVA, however, revealed a couple of
statistically significant findings and relationships (Table 6). The subscales of friction and
difficulty indicated significance levels of .006 and .002. According to the results of the
ANOVA, there appears to be a statistically significant relationship between students’
perceptions of the classroom climate, as measured by the friction and difficulty subscales
of the My Class Inventory, and mathematics achievement, as measured by the Stanford
Achievement Mathematics Test. Therefore, the null hypothesis must be rejected for these
two subscales of classroom climate
Table 6
ANOVA: My Class Inventory Subscales
Independent Variable Sum of Squares Df Mean Square F Sig.
Satisfaction 689.199 2 344.600 .602 .549
Friction 5866.242 2 2933.121 5.308 .006
Competitiveness 258.639 2 129.320 .225 .798
Difficulty 7197.240 2 3598.620 6.574 .002
Cohesiveness 1950.038 2 975.019 1.718 .182
Note. Dependent Variable: Stanford Achievement Mathematics Test Scores

77
Research Question Two
What is the relationship between student’s perceptions of cohesiveness and
mathematics achievement? As stated in the null hypothesis, there is no relationship
between students’ perceptions of cohesiveness and mathematics achievement. Table 2
revealed a correlation of -.026 between the My Class Inventory scale of cohesiveness and
the Stanford Achievement Mathematics Test scores. A correlation of -.026 represented a
very low negative relationship between the two variables. The ANOVA revealed an F
value of 1.718 (Table 6). This value was not significant at the .01 level. Therefore, this
study indicates that there is no statistically significant relationship between students’
perceptions of cohesiveness, as measured by the My Class Inventory, and mathematics
achievement, as measured by the Stanford Achievement Mathematics Test. The null
hypothesis must be accepted.
Anderson’s (1970) findings contradicted these results, however. His study
suggested that the classroom climate does have a significant affect on learning. Moos
(1974) also showed results that would indicate a relationship between cohesiveness and
academic achievement. Montoya and Brown (1990) examined this same subscale of the
MCI. Their findings revealed that elementary and middle school perceptions of
cohesiveness and total battery achievement test scores were significantly and positively
correlated, but a later study by Deng (1992) produced results that indicated that no such
correlation exists.
Research Question Three
What is the relationship between student’s perceptions of friction and mathematics
achievement? According to the null hypothesis, there is no relationship between students’
78
perceptions of friction and mathematics achievement. Table 2 revealed a correlation of
-.186 between the My Class Inventory scale of friction and the Stanford Achievement
Mathematics Test scores. A correlation of -.186 represented a low negative relationship
between the two variables. After completing the ANOVA, however, findings revealed an F
value of 5.308 (Table 7). This value was significant at the alpha level of .01. Based on post
hoc multiple comparison tests, results indicated a statistically significant level (.005)
between Group 2 and Group 3 of the subscale of friction using the Tukey/Kramer (Gall
et al., 1996) method (Table 8). In other words, significance was found between moderate
levels of friction and high levels of friction. Students who perceived the classroom climate
as moderate in the area of friction scored significantly higher on the Stanford
Achievement Mathematics Test than students who perceived the classroom climate as high
in the area of friction. Therefore, this study indicates there is a statistically significant
relationship between students’ perceptions of friction, as measured by the My Class
Inventory, and mathematics achievement, as measured by the Stanford Achievement
Mathematics Test. The null hypothesis must be rejected. Fraser, et al. (1982) found the
amount of friction in a classroom has a significant impact on the classroom climate. Chavez
and Cardenas (1980) found the lower degree of friction perceived, the higher the student’s
level of achievement. Other researchers agreed (Walberg & Haertel, 1980). International
studies also confirmed a relationship between friction and student achievement
(Chatiyanonda, 1978). Anderson’s research (1970), however, indicated a positive, rather
than a negative, relationship between extremes of friction and achievement gains.

79
Table 7
ANOVA: Friction
Independent Variable Sum of Squares Df Mean Square F Sig.
Friction 5866.242 2 2933.121 5.308 .006
Note. Dependent Variable: Stanford Achievement Mathematics Test Scores
Table 8
Post Hoc Test: Friction – Tukey Honestly Significant Difference (HSD)
Friction
(I)
Friction
(J)
Mean
Difference (I-J) Std. Error Sig.
Lower
Bounda
Upper
Bounda
Group 1 Group 2
Group 3
.42
10.68
4.42
4.78
.995
.066
-12.45
-3.25
13.28
24.62
Group 2 Group 1
Group 3
-.42
10.26
4.42
3.29
.995
.005
-13.28
.69
12.45
19.84
Group 3 Group 1
Group 2
-10.68
-10.26
4.78
3.29
.066
.005
-24.62
-19.84
3.25
-.69
a99% Confidence Interval
Research Question Four
What is the relationship between students’ perceptions of satisfaction and
mathematics achievement? As stated in the null hypothesis, there is no relationship
between students’ perceptions of satisfaction and mathematics achievement. The
correlation coefficients analysis in Table 2 included a positive correlation of .058

80
between the My Class Inventory scale of satisfaction and the Stanford Achievement
Mathematics Test scores. A correlation of .058 represented a very low positive
relationship between the two variables. Results of the ANOVA revealed an F value of
.602 (Table 6). This value was not significant at the .01 level. Therefore, this study
indicates there is no statistically significant relationship between students’ perceptions of
satisfaction, as measured by the My Class Inventory, and mathematics achievement, as
measured by the Stanford Achievement Mathematics Test. This researcher must accept
the null hypothesis, but others would disagree. MacIntosh (1991) felt that positive social
climates and learning outcomes went hand in hand. White (1968), Fraser and Fisher
(1983), and Wren (1992) all confirmed a significant relationship between satisfaction and
student achievement, but Anderson (1970) and Slonaker (1979) found no significant
relationship in this area.
Research Question Five
What is the relationship between student’s perceptions of competitiveness and
mathematics achievement? According to the null hypothesis, there is no relationship
between students’ perceptions of competitiveness and mathematics achievement. Table 2
revealed a negative correlation of -.026 between the My Class Inventory scale of
competitiveness and the Stanford Achievement Mathematics Test scores. A correlation
of -.026 represented a very low negative relationship between the two variables. Results
of the ANOVA revealed an F value of .225 (Table 6). This value was not significant at
the .01 level. Therefore, this study indicates there is no statistically significant
relationship between students’ perceptions of competitiveness, as measured by the My
Class Inventory, and mathematics achievement, as measured by the Stanford

81
Achievement Mathematics Test. The null hypothesis must be accepted. Paradise (1994)
reported differing results. His study found that when students’ psychosocial needs were
met, they performed better academically, and in competitive classrooms students were
prevented from performing well. Talmage and Walberg (1978) found that the higher the
competitiveness perceived by students, the lower the students’ achievement scores. Fisher
and Fraser (1980) confirmed these findings. Using the My Class Inventory among a
sample of 2,305 twelve year olds in Australia, competition accounted for a significant
amount of learning outcome variance.
Slonaker (1979) investigated the relationship between the classroom environment
and reading achievement of sixth grade students using the Otis-Lennon Mental Ability
Test, the Science Research Associates Assessment Survey, and the My Class Inventory.
Results of her study indicated that competitiveness was not a statistically significant
predictor of reading gains.
Research Question Six
What is the relationship between students’ perceptions of difficulty and
mathematics achievement? As stated in the null hypothesis, there is no relationship
between student’s perceptions of difficulty and mathematics achievement. As a result of
the correlation coefficient analysis, Table 2 revealed a low negative correlation of -.246
between the My Class Inventory scale of difficulty and the Stanford Achievement
Mathematics Test scores. A correlation of -.246 represented a low negative relationship
between the two variables. The ANOVA, however, revealed an F value of 6.574
(Table 9). This was significant at the .01 level. Based on post hoc multiple comparison
tests, results indicated a statistically significant level at .01 between Group 1 and Group 3

82
of difficulty using the Tukey/Kramer (Gall et al., 1996) method (Table 10). In other
words, significance was found between low levels of difficulty and high levels of
Table 9
ANOVA: Difficulty
Independent Variable Sum of Squares Df Mean Square F Sig.
Difficulty 7197.240 2 3598.620 6.574 .002
Note. Dependent Variable: Stanford Achievement Mathematics Test Scores
Table 10
Post Hoc Test: Difficulty – Tukey Honestly Significant Difference (HSD)
Difficulty
(I)
Difficulty
(J)
Mean
Difference (I-J) Std. Error Sig.
Lower
Bounda
Upper
Bounda
Group 1 Group 2
Group 3
8.75
15.13
3.21
5.22
.018
.010
-.60
-7.50E-02
18.09
30.34
Group 2 Group 1
Group 3
-8.75
6.38
3.21
5.54
.018
.481
-18.09
-9.74
.60
22.51
Group 3 Group 1
Group 2
-15.13
-6.38
5.22
5.54
.010
.481
-30.34
-22.51
7.50E-02
9.74
a99% Confidence Interval
difficulty. Students who perceived the classroom climate as having low levels of
difficulty scored significantly higher on the mathematics test than students who perceived
the classroom climate as having high levels of difficulty. Therefore, this study indicates

83
there is a relationship between students’ perceptions of difficulty, as measured by the My
Class Inventory, and mathematics achievement, as measured by the Stanford
Achievement Mathematics Test. Consequently, the null hypothesis must be rejected.
Research in the subscale of difficulty has been somewhat limited. Lepper and Hodell
(1989) described challenge as a factor that should be embedded in the structure and
design of all learning tasks. Walberg and Greenberg (1997) reported that students who
rated their classrooms high on challenge achieved more academically. Slonaker (1979)
disagreed. Her study indicated a negative relationship between the climate factor of
difficulty as it related to achievement levels, and Anderson (1970) found no significant
relationship. Research results in the area of difficulty remain inconclusive.
Research Question Seven
What is the relationship between students’ socioeconomic status and mathematics
achievement? As stated in the null hypothesis, there is no relationship between student
socioeconomic status and mathematics achievement. To examine this relationship, a
univariate analysis of variance was used to compare the dependent variable of Stanford
Achievement Mathematics Test scores to socioeconomic status and gender. Post hoc tests
were not performed for economic status because at least one group had fewer than two
cases. Descriptive statistics may be viewed in Table 11. This table illustrates that
generally, as socioeconomic status rose, Stanford Achievement Mathematics Test scores
also rose. A dramatic increase was indicated between economic categories one and two
and also between categories five and six. It should be noted, however, that the response in
category six was limited to only one student. Results in Table 12 indicated significant
differences (p < .01) in Stanford Achievement Mathematics Test scores between

84
Table 11
Descriptive Statistics: Socioeconomic Status and Gender
Socioeconomic Level Gender Mean Standard Deviation N
Below $20,000
$20,000 to $39,000
$40,000 to $59,000
$60,000 to $79,000
$80,000 to $99,000
$100,000 to $150,000
Over $150,000
Total
male
female
Total
male
female
Total
male
female
Total
male
female
Total
male
female
Total
male
female
Total
male
female
Total
male
female
Total
49.38
46.83
48.03
65.63
65.82
65.75
60.76
61.08
60.95
67.71
69.54
68.59
65.14
63.43
64.29
75.0
89.0
82.0
81.00
-
81.00
61.73
61.84
61.80
28.49
23.35
25.52
22.63
22.80
22.54
25.67
23.09
23.86
23.08
18.54
20.63
27.19
27.37
26.23
-
-
9.9
-
-
-
25.25
23.57
24.22
16
18
34
19
38
57
17
25
42
14
13
27
7
7
14
1
1
2
1
0
1
75
102
177
Note. Dependent Variable: Stanford Achievement Mathematics Test Scores

85
Table 12
ANOVA: Socioeconomic Status and Gender
Source
Type III
Sum of Squares
Degrees
of Freedom Mean Square F Sig.
Economic 9724.677 6 1620.779 2.852 .01
Gender 53.346 1 53.346 .094 .760
Dependent Variable: Stanford Achievement Mathematics Test Scores
economic groups. This table indicated an F value of 2.852 (p < .01) between
socioeconomic status and student achievement. As a result, the null hypothesis must be
rejected. Edmonds, et al. (1977) would disagree, but the results of this study tend to
confirm some of the earlier findings of Coleman, et al. (1966). Regarding gender, further
results from the current study indicated no significant relationship was found (F = .094;
p > .01) between this independent variable and mathematics achievement in this
particular sample.
Summary
Classroom climate factors were hypothesized to correlate with student
achievement in mathematics. The data presented in this chapter supported such a
correlation for the subscales of friction and difficulty. Results also indicated that Stanford
Achievement math scores varied significantly as a function of economic category
membership. The above data analyses presented evidence on which to accept or reject the
stated null hypotheses as related to the full group model and each independent variable.
Additionally, a summary of a backward solution analysis presented evidence to establish
the best predictor variables for the full group model and each independent variable.

86
Finally, the results of a univariate analysis of variance presented evidence on which to
accept or reject the stated null hypothesis regarding mathematics achievement, including
the five subscales of the My Class Inventory, socioeconomic status, and gender.

87
CHAPTER 5
CONCLUSIONS, RECOMMENDATIONS, AND SUMMARY
Conclusions
Purpose and Design
The purpose of the study was to measure the relationship between classroom
climate and student achievement. The concept of personal variables interacting with
environmental variables in influencing behavior originated with Murray (1938). Since
that time investigation has continued contributing to the knowledge in this area. This
particular study was an attempt to provide more specific information regarding classroom
climate and student achievement. In this study, perception of the classroom climate was
determined by the My Class Inventory (MCI) and its five subscales of satisfaction,
friction, cohesiveness, difficulty, and competitiveness. The total mathematics score of the
Stanford Achievement Test was used as the dependent variable. The researcher also
looked at the independent variables of socioeconomic status and gender.
The sample consisted of 11 teachers and 262 students in sixth grade mathematics
classes. This study used a volunteer sample from a suburban community in Texas with a
population of approximately 100,000 residents. The study was a quantitative correlational
design. A Pearson product-moment correlation coefficient was used to analyze data
related to the research questions. The researcher used a multiple regression analysis,
including a backward solution. A univariate analysis of variance was also used to
determine whether or not changes in mathematics achievement were presumed to be the

88
result of the My Class Inventory subscales, socioeconomic status, or gender. The analysis
used the Statistical Package Software System (SPSS).
Implications
The results of this study have potential implications for all schools, classrooms,
and educators. Determining which climates are the most suitable for a positive impact on
student achievement is critical. Research on the classroom environment for the past three
decades confirms that the environment may affect student outcomes, but many questions
about how climate affects students remain unanswered. The purpose of this study was to
increase what is known about classroom climate by investigating the relationship
between students’ perceptions of the classroom climate and its impact on student
achievement. The results of this study indicated that:
1. Classroom climate, as measured by the My Class Inventory (MCI) – including
cohesiveness, friction, satisfaction, competitiveness, and difficulty – showed a
significant relationship to mathematics achievement as measured by the total
mathematics scores on the Stanford Achievement Mathematics Test under
Analysis of Variance (ANOVA) in the classroom climate subscale areas of
friction and difficulty.
2. Both positive and negative results were indicated among the subscales of the
MCI according to Pearson product-moment correlation coefficient analysis,
but these occurred with only low levels of correlation. The multiple regression
analysis indicated a low positive correlation (r = .324), and combined
indicators accounted for 10.5% of variance. The univariate analysis of
variance indicated significant relationships in the areas of friction (p < .01)
and difficulty (p < .01). The other three subscales of the MCI indicated little,

89
if any, relationship between these classroom climate subscales and
mathematics achievement.
3. There was a positive relationship between students’ socioeconomic status, as
indicated on the student survey form, and mathematics achievement, as
indicated by the total mathematics scores on the Stanford Achievement Test.
This study produced some surprising results compared to previous research. There
was a failure of all of the My Class Inventory subscales to show a moderate or large
positive relationship between classroom climate and Stanford math scores through
Pearson product-moment correlation coefficient and regression analyses. The subscales
of the MCI indicated only 10.5% of the variance resulted from the multiple regression
analysis. The remaining 89.5% could possibly be attributed to other factors such as
innovative teaching, experience of the teacher, selection of the curriculum, length of
class, time on task, importance placed on the Stanford Achievement Mathematics Test
and MCI, and prior knowledge. The univariate analysis of variance, however, indicated
significant relationships in both friction and difficulty at a significance level of .01.
Why do some of the results of this study contradict and some results support the
findings of many other researchers? One possible rationalization deals with the unusual
nature of the sample in this study. Student achievement results revealed a sample with an
above-average mean score of 62.6%, while the average mean on the Stanford
Achievement Mathematics Test was 50%. Researchers from the Center for Research on
the Context of Secondary School Teaching offered one possible explanation (Phelan,
Davidson, & Hanh, 1992). Working with a sample of 54 students, mostly in their first
year of high school, these researchers followed the students for a 2-year period. The team
conducted intensive interviews, classroom observations, and analyses of student records.

90
Their research findings indicated that high-achieving students so thoroughly internalized
goals for themselves that they overlooked, ignored, or rationalized classroom
circumstances that were not optimal. Working toward these internalized goals took
precedence over any discomfort they may have felt in a particular class. In other words,
perhaps the high-achievers in the sample from this study were not as easily affected by
classroom climate. Perhaps they, too, were driven by their own goals rather than
responding to their own environment.
Another possibility for contradictory results between researchers involves
high-stakes testing. Brandt (1989) defines high-stakes testing as “standardized
achievement tests, used as direct measures of accountability for students, educators,
schools, or school districts with significant sanctions or rewards attached to test results”
(p. 26). The single greatest criticism of high-stakes tests is that they inevitably lead to
teaching to the test. In addition, gains in scores may be attributed merely to test-taking
skills. While this may improve performance, it may also inflate the estimate of
achievement (Gordon & Reese, 1997).
Texas is a state with a considerable amount of high-stakes testing. The Texas
Assessment of Acdemic Skills (TAAS) is a classic example. Based primarily on the
percentage of students passing each of the subjects tested, schools are placed into one of
four categories: exemplary, recognized, acceptable, or low performing. Schools rated as
exemplary or recognized automatically qualify for monetary awards. Campuses which
are rated academically acceptable and have shown significant gains on TAAS are also
eligible for cash awards. Schools rated as low performing for 2 consecutive years face
sanctions and interventions from the Texas Education Agency (Gordon & Reese, 1997).

91
Perhaps the surprisingly high Stanford scores from the sample in this study were
the result of high-stakes testing. Koretz (1991) examined third graders from a
high-poverty urban district with an enrollment of 90% minority students. The district
used unmodified commercial achievement tests for its testing program, which was
perceived as high-stakes. Results of Koretz’s study indicated that performance on
conventional high-stakes tests did not generalize well to other tests. His research offered
one possible explanation why the Stanford scores in this district of high-stakes testing
may not have generalized well when compared to the scores of the My Class Inventory in
this particular study.
Herrick’s (1999) study used state-level scores from the National Assessment of
Educational Progress (NAEP) to evaluate whether state level performance assessments
have shown evidence of having a positive impact on classrooms, resulting in higher
levels of student achievement. Tests included fourth grade reading and math and eighth
grade math. Comparisons of NAEP state scores between performance assessment states
and other states – including Indiana, Kansas, Kentucky, Maine, Maryland, New
Hampshire, North Carolina, Rhode Island, and Vermont – were investigated using several
statistical methods. According to Herrick’s findings, higher achievement levels were
associated with state-level performance assessment. Perhaps it is true that the high
Stanford Achievement Mathematics Test scores of the sample are a result of the
extremely high-stakes testing in Texas. If Stanford Achievement Mathematics Test scores
are skewed, perhaps the results of this entire study are also affected.
There is yet another possible explanation regarding the surprising results of this
study. Some researchers question the validity of the entire effective schools movement,
including the correlate of climate. Lee, et al. (1996) stated much of the effective schools

92
research is weak in its theoretical base. Anderson’s (1982) thorough review of the school
climate literature was also quite critical. She contended that such research has used a
variety of causal models (often inconsistent with one another or even internally
inconsistent), inadequate research designs, and improper statistical analysis, often
resulting in misinterpretation.
Makedon’s 1992 study examined the effectiveness of schools in closing the
academic achievement gap between low and middle socioeconomic status (SES) students
in grades K-12. He argued that the schools which had been identified as effective did not
close the gap without lowering the average academic achievement of mid-SES students.
He further reported that according to Good and Brophy (as cited in Makedon, 1992),
there has been a relative instability of effective schools (only 5% remained effective over
a period of 3 years). Makedon’s study indicated that schools identified as effective did
not overcome the influence of student social class, let alone close the academic
achievement gap between low and mid-SES students.
Sabatella uncovered rather surprising results during his 1992 study involving
correlates, climate, and achievement. He investigated 140 New York State public
elementary and secondary schools to determine the extent to which teachers’ perceptions
of the existence of effective schools correlates were associated with student achievement
when student background variables were used as controls. Eleven effective school
correlates were identified, including school climate. Findings suggested that all
11 correlates measured a constant defined as school ethos or climate, but no significant
relationship could be found between the correlates and student achievement above
predictions based on student background. Sabatella suggested that climate or ethos was
the wrong phenomenon to be considered in the school improvement process.

93
If the effective schools movement did, in fact, fail to identify effective schools,
much less determine effective school correlates, then climate also comes into question.
What, then, is the importance of climate and its relationship with academic achievement?
If effective schools research has a weak theoretical basis, as suggested by Lee, et al.
(1996), then educational research in the area of classroom climate is of great importance.
Yet, after completing the multiple regression analysis in this study, the researcher was
surprised that results indicated there was only a low positive correlation between
classroom climate (all subscales combined) and student achievement. After completing
this study, the researcher contacted the author of the My Class Inventory, Dr. Barry
Fraser, and asked for help in understanding and interpreting the unanticipated results.
Dr. Fraser’s e-mail response confirmed what has been suggested earlier in this chapter:
To get correlations of a decent size, you need variability – high and low achieversand classrooms with positive and negative climates. Relative uniformity couldexplain your small correlations. The signs of your correlations look to be in theanticipated direction mostly. Your sample is not big. A bigger sample is likely togive you more variability and to allow you to calculate correlations using the classmean as the unit of analysis. Both would lead to higher correlations. (Personalcommunication, July 11, 2001)
It was interesting to note that the two subscales with significant results, friction and
difficulty, had more variability in scores, just as Dr. Fraser had suggested.
In addition to Dr. Fraser’s interpretation of the findings of this study, the
importance of the analysis of variance cannot be overemphasized. Most of the research
mentioned in previous studies employed a multiple regression analysis, but the results of
the multiple regression analysis in this study showed only a low positive correlation
between classroom climate and mathematics achievement with only 10.5% of the
variance on math achievement accounted for by classroom climate. The analysis of
variance revealed a significant positive correlation between the climate of the classroom

94
and that of mathematics achievement. This study is important to educational research
because results suggested the amount of friction and the degree of difficulty are, in fact,
related to mathematics achievement. The results further suggested that educators pay
careful attention to the degree of difficulty and the amount of friction in their classrooms.
In classrooms with high levels of friction, results of this study indicated that
learning is significantly impeded. The same holds true for the classroom climate subscale
of difficulty. When learning became too difficult, achievement was negatively impacted.
This has important implications for the classroom. Educators must be cognizant of the
amount of friction and the degree of difficulty their students are experiencing. They must
be sensitive to the climate factors of friction and difficulty, and they must be keenly
aware of the impact these two climate factors have on the ability of their students to
learn. Educators must constantly strive to lower the levels of tension in the classroom.
This tension could be the result of teacher-to-student, student-to-teacher, or student-to-
student interactions. Educators must also be aware of the performance level of each
student, and they must work to provide learning experiences for each student that will
include a reasonable degree of difficulty. As soon as the level of difficulty appears to be
excessive for the student, the teacher must adjust the educational experience
appropriately if learning is to continue.
Recommendations
Several recommendations may prove useful in future research attempting to
determine a link between the classroom environment and student achievement.
1. Longitudinal research should be conducted to determine students’ perceptions of
classroom climate. Perhaps a snapshot of classroom climate early in the year does not
offer enough accurate data to compare with achievement test scores.

95
2. Random samples should be incorporated in similar studies. A larger sample with
more variability would also be preferred.
3. Pre and posttests would be beneficial in future studies.
4. Similar studies should be conducted using multiple measures of climate and/or
achievement.
5. Further research is needed to determine whether there is similarity between the actual
environment and that preferred by the students. In addition to quantitative methods,
qualitative approaches should be implemented to determine climate perceptions. This
study may have been more substantial if both quantitative and qualitative measures of
climate had been incorporated.
6. Both multiple regression analysis and univariate analysis of variance need to be
incorporated into further research. Many studies incorporate one or the other, but not
both. Therefore, results may vary.
Summary
Many teachers devote a great deal of time and attention to the establishment of an
appropriate climate in their classrooms. The findings of this study indicate some
subscales of the environment play a relatively minor role in influencing student
achievement, while other subscales, such as friction and difficulty, appear to be major
contributors. Certain findings of this study may appear to differ somewhat from those of
earlier researchers, so one is left with gaps in the knowledge of the environment and its
impact on achievement. The exact mechanisms by which individual and group variables
interact are yet unclear, even though a large body of research still suggests a plausible
relationship. According to this study, friction, difficulty, and socioeconomic status do
appear to show a strong link with achievement. They continue to be factors that should

96
not be underestimated by educators. It should be noted, regarding levels of friction and
difficulty in the classroom, that one of the oldest principles in psychology appears to
apply and agree with results of this study. The Yerkes-Dodson law states:
on tasks of moderate difficulty, increasing levels of arousal will increaseperformance up to a point, and then further arousal will have a detrimental effectof responding. By comparison, simple tasks can accommodate much higherlevels of arousal before performance begins to fall off, and more difficult tasksrequire much lower levels of arousal for optimal performances. (Ludy, Hopkins,& Nation, 1990, p. 354)
In other words, a little friction and difficulty are good to a point in learning, but when
friction and difficulty become excessive, learning is impaired.
Some of the results of this study have been surprising and somewhat contradictory
to that of previous research, although results do support research by Anderson (1970),
Slonaker (1979), and Sabatella (1992). The results of this study suggest, however, that
the classroom climate factors of friction and difficulty show a significant relationship to
student achievement as measured by the Stanford Achievement Mathematics test.
Socioeconomic factors continue to show significance, as well. Since academic
achievement is a major concern in education, clearly more investigation is warranted in
the area of the classroom environment and its relationship with student achievement.
There are many possible assessments and environmental variables at work in today’s
educational setting. It is not yet clear how the many environmental variables relate to
student achievement, yet educators are expected to design physical and social systems
that will facilitate learning and maximize educational growth. Further conceptualization
and knowledge about environmental dimensions are essential determine the factors that
have the greatest impact on student achievement.

97
APPENDICES

98
APPENDIX A
PERMISSION FOR THE USE OF THE MY CLASS INVENTORY
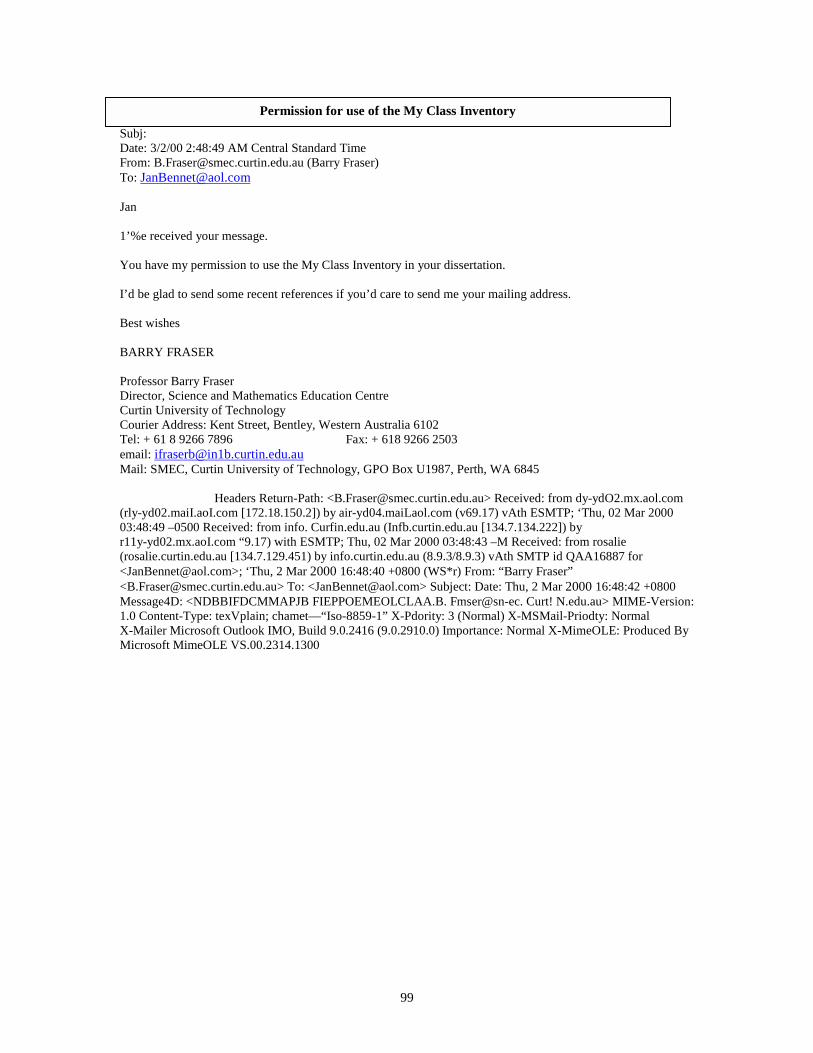
99
Subj:Date: 3/2/00 2:48:49 AM Central Standard TimeFrom: [email protected] (Barry Fraser)To: [email protected]
Jan
1’%e received your message.
You have my permission to use the My Class Inventory in your dissertation.
I’d be glad to send some recent references if you’d care to send me your mailing address.
Best wishes
BARRY FRASER
Professor Barry FraserDirector, Science and Mathematics Education CentreCurtin University of TechnologyCourier Address: Kent Street, Bentley, Western Australia 6102Tel: + 61 8 9266 7896 Fax: + 618 9266 2503email: [email protected]: SMEC, Curtin University of Technology, GPO Box U1987, Perth, WA 6845
Headers Return-Path: <[email protected]> Received: from dy-ydO2.mx.aol.com(rly-yd02.maiI.aoI.com [172.18.150.2]) by air-yd04.maiLaol.com (v69.17) vAth ESMTP; ‘Thu, 02 Mar 200003:48:49 –0500 Received: from info. Curfin.edu.au (Infb.curtin.edu.au [134.7.134.222]) byr11y-yd02.mx.aoI.com “9.17) with ESMTP; Thu, 02 Mar 2000 03:48:43 –M Received: from rosalie(rosalie.curtin.edu.au [134.7.129.451) by info.curtin.edu.au (8.9.3/8.9.3) vAth SMTP id QAA16887 for<[email protected]>; ‘Thu, 2 Mar 2000 16:48:40 +0800 (WS*r) From: “Barry Fraser”<[email protected]> To: <[email protected]> Subject: Date: Thu, 2 Mar 2000 16:48:42 +0800Message4D: <NDBBIFDCMMAPJB FIEPPOEMEOLCLAA.B. Fmser@sn-ec. Curt! N.edu.au> MIME-Version:1.0 Content-Type: texVplain; chamet—“Iso-8859-1” X-Pdority: 3 (Normal) X-MSMail-Priodty: NormalX-Mailer Microsoft Outlook IMO, Build 9.0.2416 (9.0.2910.0) Importance: Normal X-MimeOLE: Produced ByMicrosoft MimeOLE VS.00.2314.1300
Permission for use of the My Class Inventory

100
APPENDIX B
MY CLASS INVENTORY
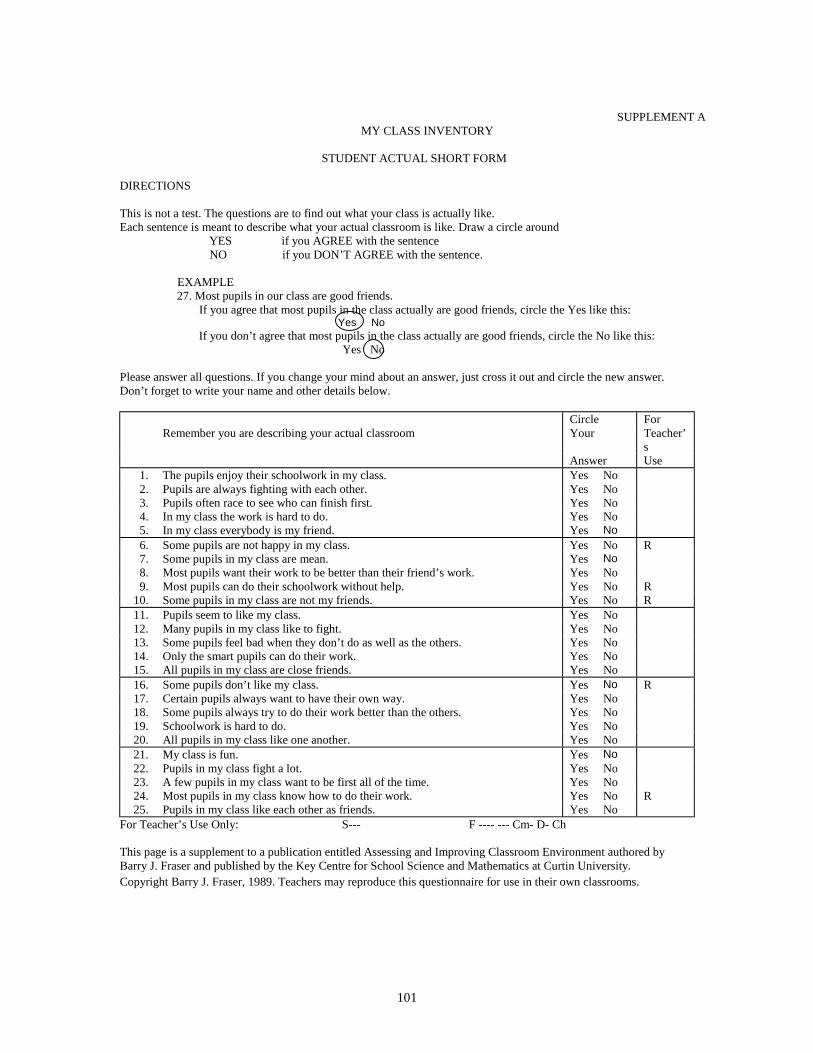
101
SUPPLEMENT AMY CLASS INVENTORY
STUDENT ACTUAL SHORT FORM
DIRECTIONS
This is not a test. The questions are to find out what your class is actually like.Each sentence is meant to describe what your actual classroom is like. Draw a circle around
YES if you AGREE with the sentenceNO if you DON’T AGREE with the sentence.
EXAMPLE27. Most pupils in our class are good friends.
If you agree that most pupils in the class actually are good friends, circle the Yes like this:Yes No
If you don’t agree that most pupils in the class actually are good friends, circle the No like this:Yes No
Please answer all questions. If you change your mind about an answer, just cross it out and circle the new answer.Don’t forget to write your name and other details below.
Circle ForRemember you are describing your actual classroom Your Teacher’
sAnswer Use
1. The pupils enjoy their schoolwork in my class. Yes No2. Pupils are always fighting with each other. Yes No3. Pupils often race to see who can finish first. Yes No4. In my class the work is hard to do. Yes No5. In my class everybody is my friend. Yes No6. Some pupils are not happy in my class. Yes No R7. Some pupils in my class are mean. Yes No8. Most pupils want their work to be better than their friend’s work. Yes No9. Most pupils can do their schoolwork without help. Yes No R
10. Some pupils in my class are not my friends. Yes No R11. Pupils seem to like my class. Yes No12. Many pupils in my class like to fight. Yes No13. Some pupils feel bad when they don’t do as well as the others. Yes No14. Only the smart pupils can do their work. Yes No15. All pupils in my class are close friends. Yes No16. Some pupils don’t like my class. Yes No R17. Certain pupils always want to have their own way. Yes No18. Some pupils always try to do their work better than the others. Yes No19. Schoolwork is hard to do. Yes No20. All pupils in my class like one another. Yes No21. My class is fun. Yes No22. Pupils in my class fight a lot. Yes No23. A few pupils in my class want to be first all of the time. Yes No24. Most pupils in my class know how to do their work. Yes No R25. Pupils in my class like each other as friends. Yes No
For Teacher’s Use Only: S--- F ---- --- Cm- D- Ch
This page is a supplement to a publication entitled Assessing and Improving Classroom Environment authored byBarry J. Fraser and published by the Key Centre for School Science and Mathematics at Curtin University.Copyright Barry J. Fraser, 1989. Teachers may reproduce this questionnaire for use in their own classrooms.

102
APPENDIX C
PARENT PERMISSION FORM

103
Parent/Guardian Consent
I, ________________________________________ (your name), related to the subject as______parent ______guardian agree to the participation of _______________________(your child’s name) in this study. I have read and understand the risks and benefits ofthis study. I understand that my child or I may later refuse to participate, and that mychild through his/her own action or mine, may withdraw from this study at any time. Ihave received a copy of this consent form for my own records, and I understand that noone will know my child’s individual results from this study.
________________________________________ ________________________Parent’s/Guardian’s Signature Date
_______________________________________ ________________________Investigator’s Signature Date
As one component of the survey, it would be helpful if you could provide the followinginformation regarding family income. This information is entirely optional.
Please check the box that best indicates your family’s total yearly income:
_____ less than $20,000 _____ $20,000 to $39,000_____ $40,000 to $59,000 _____ $60,000 to $79,000_____ $80,000 to $99,000 _____ $100,000 to $150,000_____ over $150,000
Student Assent Form
I, _________________________ (your name), agree to participate in this study. I haveread and understand what it is about. I understand that I may change my mind and laterrefuse to participate. I have received a copy of this assent form, and I understand that noone but Jan Bennett will know the answers to my questions.
________________________________________ ________________________Student Signature Date
________________________________________ ________________________Investigator’s Signature Date

104
APPENDIX D
RAW DATA BY INDIVIDUAL STUDENTS, CLASSES, AND VARIABLES

105
Raw Data By Individual Students, Classes, and Variables
STUDENT SATIS. FRICT. COMPET. DIFFIC. COHES. ECON. STANFORD GENDER
C1 9 11 9 9 5 81 MC2 15 11 11 7 9 2 71 FC3 15 7 13 5 15 4 78 FC4 15 9 9 7 7 4 83 MC5 15 5 13 5 15 49 MC6 11 9 11 9 7 2 FC7 15 7 11 5 13 5 71 MC8 13 7 11 7 7 3 80 MC9 15 9 9 5 9 2 52 FC10 13 7 11 7 13 3 85 FC11 11 9 15 11 7 4 57 FC12 11 7 13 5 7 3 86 FC13 9 11 9 7 5 2 77 FC14 14 7 13 5 7 7 81 MC15 13 7 9 5 7 6 89 FC16 15 7 7 5 13 2 75 FC17 9 7 11 5 5 2 98 FC18 11 7 15 9 9 4 61 FC19 13 9 9 7 7 83 MC20 13 11 13 5 7 3 97 FC21 15 5 5 7 15 74 MC22 15 9 15 5 15 5 91 FC23 15 9 15 5 15 5 91 FC24 15 7 11 5 15 6 75 MC25 13 9 13 5 11 4 97 MC26 15 7 13 5 15 1 93 MC27 11 15 11 5 9 1 FC28 13 9 11 7 11 2 88 FC29 15 9 13 7 9 2 50 MC30 13 5 9 5 11 78 FC31 15 9 9 5 15 2 97 FD1 9 9 9 5 13 1 FD2 13 9 11 5 7 2 46 MD3 9 7 9 13 11 3 3 MD4 11 7 15 5 7 91 FD5 11 15 13 5 6 3 46 FD6 15 7 11 7 15 2 38 FD7 11 7 13 5 11 29 MD8 11 7 13 5 9 2 17 MD9 13 13 15 5 15 3 44 FD10 11 7 11 5 7 1 47 FD11 9 9 15 5 9 1 15 FD12 11 15 15 5 9 44 MD13 13 9 11 5 7 1 71 FD14 13 9 11 5 7 2 49 FD15 15 7 11 5 13 44 FD16 11 9 15 5 5 44 F

106
D17 13 7 11 5 15 2 76 FE1 9 9 13 9 5 2 19 FE2 15 7 11 7 15 1 58 FE3 9 9 15 9 9 1 69 ME4 11 7 11 5 11 3 92 ME5 9 9 15 7 7 53 FE6 8 11 13 11 9 1 69 ME7 11 11 11 7 5 1 26 FE8 7 9 13 7 9 1 FE9 13 5 15 5 11 3 71 ME10 11 9 13 7 5 4 62 FE11 11 9 13 5 15 4 84 FE12 11 9 15 5 7 69 FE13 9 15 15 9 11 1 13 FE14 13 9 11 7 11 66 FE15 13 15 13 7 11 5 20 ME16 9 11 15 5 7 3 66 FE17 11 15 15 9 9 2 88 ME18 7 15 15 11 7 31 ME19 7 15 13 7 11 1 59 ME20 15 11 13 5 7 1 90 FE21 7 13 13 7 11 FE22 5 15 7 13 7 1 67 FE23 5 15 11 5 7 96 ME24 7 15 13 7 9 FE25 11 13 9 5 9 1 71 FE26 13 11 7 7 7 3 ME27 13 15 13 5 7 1 10 FE28 5 15 9 11 5 71 ME29 13 11 11 5 7 3 64 ME30 5 5 9 13 5 ME31 7 9 11 9 5 3 69 FE32 11 13 9 11 7 62 FE33 7 13 11 5 9 48 FE34 9 15 15 7 5 2 91 MF1 15 11 11 5 15 4 57 FF2 13 7 11 5 15 FF3 11 13 7 9 15 2 19 MF4 15 9 13 9 11 4 54 FF5 7 5 11 5 13 2 35 FF6 7 11 13 9 5 2 71 FF7 7 11 13 5 11 15 FF8 9 7 11 5 5 62 MF9 13 7 13 5 11 59 FF10 9 9 11 5 7 2 89 FF11 11 9 11 5 13 MF12 15 9 13 5 7 2 81 FF13 5 9 11 11 5 2 56 FF14 11 9 7 5 11 2 21 FF15 11 7 13 7 5 6 MF16 5 9 13 5 7 3 22 M

107
F17 13 9 11 5 7 5 48 MF18 7 11 11 9 11 3 44 MF19 9 10 13 7 8 5 68 FF20 13 7 11 5 11 5 77 FF21 9 11 15 13 5 12 FF22 11 9 13 5 13 5 64 MF23 7 9 13 7 7 74 MF24 5 7 13 13 9 4 41 MF25 7 9 7 5 7 3 52 FF26 7 11 11 9 11 2 10 FF27 13 7 11 5 9 4 70 FF28 15 7 9 9 15 5 14 FF29 9 9 6 5 5 56 MF30 9 9 11 5 9 2 74 FF31 9 11 15 5 5 FF32 10 7 13 7 11 2 53 MF33 15 5 7 5 15 2 FF34 10 8 14 6 12 FF35 5 7 15 5 5 4 74 MF36 13 7 13 5 9 3 39 MF37 7 7 15 6 10 3 83 MF38 9 15 13 9 11 3 31 FF39 5 9 9 5 7 62 FF40 15 5 7 7 10 3 61 MF41 9 6 11 7 8 2 84 FF42 11 9 15 7 7 1 MF43 10 9 13 5 8 4 90 MF44 8 9 11 7 6 2 78 FF45 13 5 9 5 15 2 76 FF46 9 7 9 5 15 1 45 MF47 7 9 11 9 11 3 MF48 6 7 15 7 5 3 67 MF49 13 9 12 7 15 3 8 FG1 9 7 13 5 9 2 64 MG2 9 9 13 5 9 50 MG3 7 15 15 11 9 1 6 MG4 13 7 9 5 7 1 24 MG5 13 5 13 9 7 3 FG6 15 9 9 5 7 3 95G7 15 5 5 9 15 MG8 13 7 11 5 5 79 FG9 13 9 15 5 9 84 FG10 15 7 7 9 5 3 28 MG11 7 11 13 9 5 2 87 MG12 13 5 5 11 13 1 72 MG13 5 7 11 11 7 93 MG14 11 5 11 5 7 81 MG15 11 7 5 5 5 83 MG16 15 5 11 5 7 74 MG17 11 9 11 11 7 82 MG18 11 7 11 5 9 4 95 M
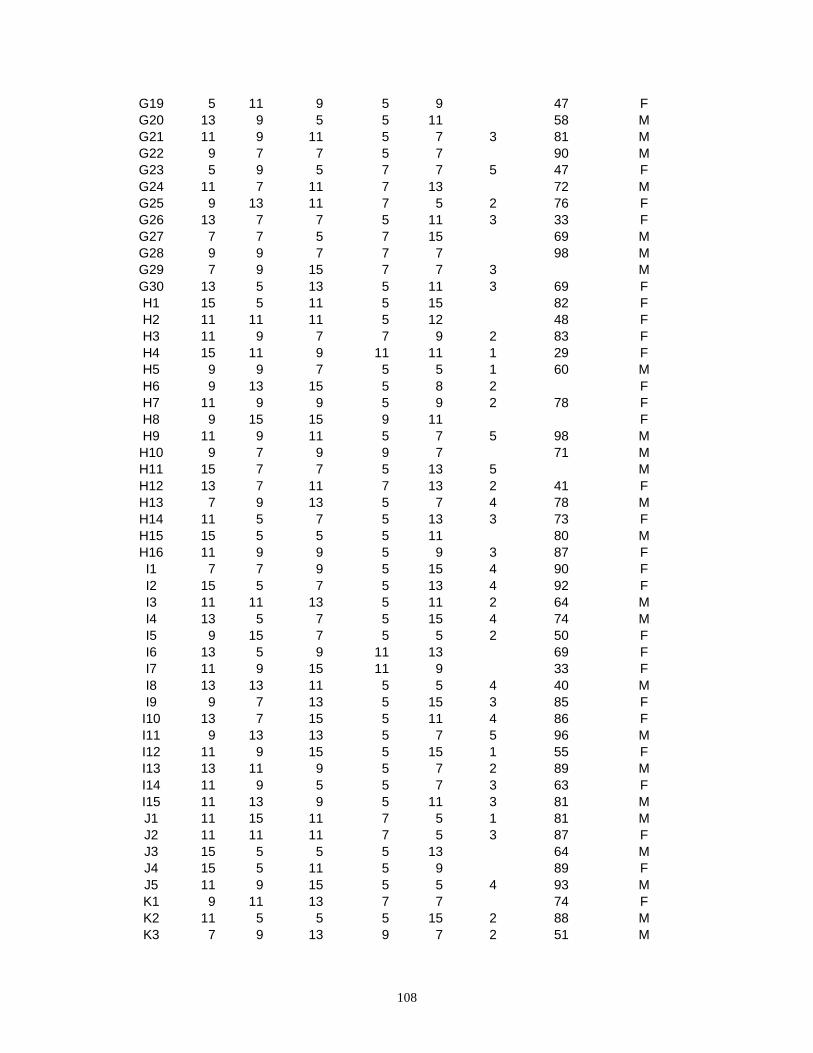
108
G19 5 11 9 5 9 47 FG20 13 9 5 5 11 58 MG21 11 9 11 5 7 3 81 MG22 9 7 7 5 7 90 MG23 5 9 5 7 7 5 47 FG24 11 7 11 7 13 72 MG25 9 13 11 7 5 2 76 FG26 13 7 7 5 11 3 33 FG27 7 7 5 7 15 69 MG28 9 9 7 7 7 98 MG29 7 9 15 7 7 3 MG30 13 5 13 5 11 3 69 FH1 15 5 11 5 15 82 FH2 11 11 11 5 12 48 FH3 11 9 7 7 9 2 83 FH4 15 11 9 11 11 1 29 FH5 9 9 7 5 5 1 60 MH6 9 13 15 5 8 2 FH7 11 9 9 5 9 2 78 FH8 9 15 15 9 11 FH9 11 9 11 5 7 5 98 MH10 9 7 9 9 7 71 MH11 15 7 7 5 13 5 MH12 13 7 11 7 13 2 41 FH13 7 9 13 5 7 4 78 MH14 11 5 7 5 13 3 73 FH15 15 5 5 5 11 80 MH16 11 9 9 5 9 3 87 FI1 7 7 9 5 15 4 90 FI2 15 5 7 5 13 4 92 FI3 11 11 13 5 11 2 64 MI4 13 5 7 5 15 4 74 MI5 9 15 7 5 5 2 50 FI6 13 5 9 11 13 69 FI7 11 9 15 11 9 33 FI8 13 13 11 5 5 4 40 MI9 9 7 13 5 15 3 85 FI10 13 7 15 5 11 4 86 FI11 9 13 13 5 7 5 96 MI12 11 9 15 5 15 1 55 FI13 13 11 9 5 7 2 89 MI14 11 9 5 5 7 3 63 FI15 11 13 9 5 11 3 81 MJ1 11 15 11 7 5 1 81 MJ2 11 11 11 7 5 3 87 FJ3 15 5 5 5 13 64 MJ4 15 5 11 5 9 89 FJ5 11 9 15 5 5 4 93 MK1 9 11 13 7 7 74 FK2 11 5 5 5 15 2 88 MK3 7 9 13 9 7 2 51 M

109
K4 11 9 11 5 9 3 75 MK5 13 15 13 7 5 3 26 FK6 11 7 7 5 11 56 MK7 15 11 11 7 13 5 MK8 9 11 15 11 5 65 FK9 13 7 7 13 2 66 MK10 7 9 15 11 7 5 56 FK11 11 5 11 5 7 2 80 FK12 11 7 13 5 13 3 89 MK13 15 7 13 9 13 3 53 FK14 9 5 13 5 11 92 MK15 7 9 13 9 7 2 47 FK16 9 11 11 5 7 56 MK17 11 9 15 5 11 2 59 MK18 13 11 11 5 13 2 67 MK19 13 5 11 7 13 2 78 MK20 9 15 11 5 5 73 FK21 11 11 11 9 13 1 8 MK22 9 11 13 5 9 57 MK23 11 13 15 9 13 2 77 FK24 13 5 11 7 13 3 53 MK25 7 13 9 5 13 2 85 FK26 9 11 11 9 9 2 34 FK27 13 7 13 5 7 2 92 FK28 13 5 9 7 11 14 MK29 11 5 15 5 13 96 FL1 15 7 11 5 15 1 86 ML2 13 7 13 5 15 3 79 FL3 13 7 9 5 13 2 93 FL4 7 7 15 15 5 2 69 FL5 15 7 5 5 15 96 FL6 13 5 7 5 15 58 FL7 15 7 5 5 15 2 79 ML8 13 7 7 5 15 80 FL9 15 7 7 5 15 4 85 FL10 11 9 7 7 13 86 ML11 11 13 11 5 9 2 50 FL12 11 5 9 5 11 2 FL13 15 7 7 5 15 3 35 FL14 7 7 11 5 11 1 49 FL15 11 13 13 5 7 64 ML16 13 13 15 9 13 1 FL17 13 7 5 5 13 16 ML18 13 15 9 5 13 4 38 ML19 11 15 10 5 5 60 FL20 13 5 9 5 15 3 46 FL21 13 9 9 5 7 80 FL22 13 9 9 5 11 2 75 FL23 13 9 11 5 15 1 63 FL24 13 9 13 5 15 79 FL25 13 5 11 5 11 3 66 F

110
L26 15 9 11 5 15 0 60 FL27 9 5 13 5 9 76 ML28 11 5 7 5 15 48 FM1 15 9 9 7 11 63 FM2 13 7 11 5 15 1 19 FM3 13 9 7 5 9 84 FM4 11 9 9 7 13 29 FM5 15 7 9 5 11 95 FM6 9 9 11 5 5 64 MM7 11 15 13 9 9 91 MM8 13 11 11 5 15 1 10 MM9 15 5 11 7 15 4 35 MM10 13 5 5 5 13 4 57 MM11 11 9 13 7 11 4 28 FM12 5 9 15 9 7 87 FM13 15 7 15 5 13 51 MM14 11 5 5 5 7 4 53 MM15 7 9 13 5 7 2 91 MM16 11 15 15 5 11 1 65 FM17 15 5 7 9 9 FM18 5 9 15 11 7 2 56 FM19 5 13 13 5 7 1 47 FM20 11 15 15 11 5 18 MM21 7 15 13 11 7 63 FM22 5 9 13 9 9 96 MM23 9 11 13 9 9 3 82 FM24 9 5 7 9 7 8 FM25 8 15 15 13 5 33 FM26 5 9 9 5 9 1 31 MM27 13 9 9 5 7 1 33 MM28 5 13 11 9 5 80 FM29 11 13 15 5 5 3 59 FM30 13 13 7 7 9 5 59 MM31 7 15 13 7 11 69 FM32 7 15 11 5 5 1 48 FM33 13 13 7 7 7 1 44 M

111
REFERENCES
Alspaugh, J. (1996). The longitudinal effects of socioeconomic status on elementaryschool achievement (Report No. OE-38001). (ERIC Document ReproductionService No. ED 397 120)
Ames, C. (1984). Achievement attributions and self-instructions under competitive andindividualistic goal structures. Journal of Educational Psychology, 76, 478-487.
Ames, C. (1992). Classrooms: Goals, structures and student motivation. Journal ofEducational Psychology, 84(3), 261-271.
Anderman, E., et al. (1993). Perceptions of mathematics classroom climate: A multilevelstudy (Clearinghouse No. SE054800). Toronto, Canada: American PsychologicalAssociation. (ERIC Document Reproduction Service No. ED 374 965)
Anderson, C. (1982). The search for school climate: A review of the research. Review ofEducational Research, 52, 368-420.
Anderson, G. (1970). Effects of classroom social climate on individual learning.American Educational Research Journal, 7(2), 175-80.
Anderson, G., & Walberg, H. (1974). Evaluating educational performance. In H. J.Walberg (Ed.), Evaluating educational performance: A sourcebook of methods,instruments, and examples (pp. 81-98). Berkley, CA: McCutchan.
Arter, J. (1987). Assessing school and classroom climate (Clearinghouse No. EA020049).Portland, OR: Northwest Regional Educational Lab. (ERIC DocumentReproduction Service No. ED 295 301)
Association for Effective Schools, Inc. (1996). What is effective schools research?[On-line]. Available: http://www.mes.org/esr.html
Atkins, D. (1999, April). Brain and developmental research: Implications for childdevelopment and early education. Presentation – Annotated Outline.
Battistich, V., Solomon, D., Watson, M., & Schaps, E. (1995). Schools as communities,poverty levels of student populations, and students’ attitudes, motives, and

112
performance: A multilevel analysis. American Educational Research Journal,32(3), 627-658.
Bolender, M. (1997). A study of the evolving image of a new school within the context ofschool effectiveness. [On-line]. Available:http://www.ssta.sk.ca/research/school_improvement/97-08.htm
Brandt, R. (1989). On misuse of testing: A conversation with George Madaus.Educational Leadership, 46(7), 26-29.
Brophy, J. (1987). Synthesis of research on strategies for motivating students to learn.Educational Leadership, 44, 40-48.
Burkman, E., & Brezin, M. (1981). Effects of expectation level on achievement in highschool physical science courses (ISIS) employing a quasi mastery teachingmethod. Journal of Educational Research, 75(2), 121-126.
Bryk, A., & Driscoll, M. (1988). The school as community: Theoretical foundations,contextual influences, and consequences for students and teachers. Madison, WI:University of Wisconsin, National Center on Effective Secondary Schools.
Castaldi, B. (1987). Educational facilities: Planning, modernization and management.Boston: Allyn and Bacon.
Chavez, R. (1984). The use of high-inference measures to study classroom climates: Areview. Review of Educational Research, 54(2), 237-261.
Chavez, R., & Cardenas, M. (1980). The affective dimension in a bilingual biculturalclassroom: What’s the status? In Ethnoperspectives in bilingual educationresearch: Theory in bilingual education (Vol. 2). Ypsilanti, MI: Eastern MichiganPress.
Chatiyanonda, S. (1978). An evaluation of the IPST physics curriculum in Thailand.Unpublished doctoral dissertation, Monash University, Melobourne, Australia.
Cizek, G. (1998). Filling in the blanks: Putting standardized tests to the test. FordhamReport, 2(11), 1-59.
Coleman, J., Campbell, E., Hobson, C., McPartland, J., Mood, A., Weinfeld, F., & York,R. (1966). Equality of educational opportunity (Clearinghouse No. UD002122).Washington, D.C.: National Center for Educational Statistics (DHEW/OE).(ERIC Document Reproduction Service No. ED 012 275)

113
Condition of Education. (1998). Climate and diversity of educational institutions.[On-line]. Available: http://nces.ed.gov/pubs98/condition98/c98sece.html
Conway, P. (1976). A longitudinal analysis of intellectual ability and educationalachievement of children from different social class and cultural groups.Dissertation Abstracts International, 37(07). (University Microfilms No. AAC7700917)
Covington, M., & Omelich, C. (1985). Ability and effort evaluation among failure-avoiding and failure-accepting students. Journal of Educational Psychology, 77,446-459.
Cullen, R. (1969). Achievement, ability, and self-attitude correlates of components ofschool satisfaction among eighth grade students. Dissertation AbstractsInternational, 70(16), 533.
Cullen, R., & Katzenmeyer, C. (1970). Achievement and ability correlates of componentsof school attitude among eighth grade students (Clearinghouse No. TM000083).Minneapolis, MN: American Educational Research Association. (ERICDocument Reproduction Service No. ED 042 807)
Deng, B. (1992). A multilevel analysis of classroom climate effects on mathematicsachievement of fourth-grade students (Clearinghouse No. SE052843). Memphis,TN: Memphis State University. (ERIC Document Reproduction Service No. Ed348 222)
Diamantes, T. (1994). Reducing differences between student actual and preferredclassroom environments in science classrooms. Morehead, KY: Morehead StateUniversity. (ERIC Document Reproduction Service No. ED 378 036)
Dietrich, A., & Bailey, E. (1996). School climate: Common-sense solutions tocomplicated problems. Bulletin, 16-17.
Dodd, A. (1997). Creating a climate for learning: Making the classroom more like anideal home. Bulletin, 10-16.
Doyle, W. (1986). Handbook of research on teaching. New York: Macmillan Publishing.
Dunn, R. & Harris, L. (1998). Organizational dimensions of climate and the impact onschool achievement. Journal of Educational Psychology, 25(2), 100-114.
Eash, M., & Rasher, S. (1978). Student perceived learning environment in the inner city(Clearinghouse No. UD018103). Toronto, Canada. (ERIC DocumentReproduction Service No. ED 152 914)

114
Edmonds, R., & Frederiksen, J. (1979). Search for effective schools: The identificationand analysis of city schools that are instructionally effective for poor children(Clearinghouse No. UD019304). Detroit, MI: Geographic Source. (ERICDocument Reproduction Service No. ED 170 396)
Edmonds, R., et al. (1977). Search for effective schools; the identification and analysis ofcity schools that are instructionally effective for poor children (Clearinghouse No.UD 017093). Detroit, MI. (ERIC Document Reproduction Service No. ED 142610)
Embry, D. (1997). Does your school have a peaceful environment? Intervention inSchool and Clinic, 217-222.
Fisher, D., & Fraser, B. (1980). Validity and use of the My Class Inventory. ScienceEducation, 64, 145-156.
Fisher, D., & Fraser, B. (1982). Use of classroom environment scale in investigatingrelationships between achievement and environment. Journal of Science andMathematics Education in Southeast Asia, 5(2), 5-9.
Fraser, B. (1981). Learning environment in curriculum evaluation: A review. Evaluationin Education: An International Review Series, 5(1), 3-93.
Fraser, B. (1989). Twenty years of classroom climate work: Progress and prospect.Journal of Curriculum Studies, 21(4), 307-327.
Fraser, B., Anderson, G., & Walberg, H. (1982). My class inventory. Perth, Australia:Western Australian Institute of Technology.
Fraser, B., & Fisher, D. (1982). Effects of classroom psychosocial environment onstudent learning. British Journal of Educational Psychology, 52(3), 374-377.
Fraser, B., & Fisher, D. (1983). Assessment of classroom psychosocial environment(Clearinghouse No. TM830216). Perth, Australia: Western Australian Institute ofTechnology. (ERIC Document Reproduction Service No. ED 228 296)
Fraser, B., & Walberg, H. (1981). Psychosocial learning environment in scienceclassrooms: A review of research. Studies in Science Education, 8, 67-92.
Freiberg, J. (1998). Measuring school climate. Educational Leadership, 22-26.
Fuqua, J. (1989). How are we doing? Why not ask the kids: Measuring climate inkindergarten and primary (Clearinghouse No. PS018443). Richmond, VA:
115
Southern Association on Children Under Six. (ERIC Document ReproductionService No. ED 313 162)
Gall, M., Borg, W., & Gall, J. (1996). Educational research. White Plains, NY: Longman.
Garner, R. (1990). When children and adults do not use learning strategies. Review ofEducational Research, 60, 517-530.
Gazzaniga, M. (1988). Mind matters: How mind and brain interact to create ourconscious lives. Boston: Houghton-Mifflin/MIT Press.
George, P., Stevenson, C., Thomason, J., & Beane, J. (1992). The middle school andbeyond. Alexandria, VA: Association for Supervision and CurriculumDevelopment.
Getzels, J., & Thelen, H. (1960). The classroom as a unique social system. NationalSociety for the Study of Education Yearbook, 59, 53-81.
Glasser, W. (1965). Reality therapy: A new approach to psychiatry. New York: Harperand Row.
Good, T. (1983). Classroom research: A decade of progress. Educational Psychologist,18, 127-144.
Good, T., & Brophy, J. (1986). School effects. In M. C. Wittrock (Ed.), Handbook ofresearch on teaching (3rd ed.). New York: MacMillan.
Goodenow, C. (1993). Classroom belonging among early adolescent students:Relationships to motivation and achievement. Journal of Early Adolescence, 13,21-43.
Goodlad, J. (1979). Can our schools get better? Phi Delta Kappa, 60(5), 342-346.
Gordon, R., & Reese, S. (1997). High-stakes testing: Worth the price? Journal of SchoolLeadership, 7(4), 345-68.
Gunter, M., Estes, T., & Schwab, J. (1990). Instruction. Needham Heights, MA: Allynand Bacon.
Haertel, E., Walberg, H., & Haertel, G. (1981). Sociopsychological environments andlearning: A quantitative synthesis. British Educational Research Journal, 7, 27-36.
Herrick, M. (1999). State-level performance assessments and consequential validity.Unpublished doctoral dissertation, University of Maryland, College Park, USA.

116
Hinkle, D., Wiersma, W., & Jurs, S. (1998). Applied statistics for the behavioral sciences.Boston: Houghton Mifflin.
Holden, R. (1994). Facial expressions. In R. Corsini (Ed.), Encyclopedia of Psychology,Vol. 1 (2nd ed.). Canada: John Wiley & Sons.
Hoy, W., & Hannum, J. (1997). Middle school climate: An empirical assessment oforganizational health and student achievement. Educational AdministrationQuarterly, 33(3), 290-311.
Isaac, S., & Michael, W. (1995). Handbook in research and evaluation. San Diego, CA:Educational and Industrial Testing Services.
Jacobs, W. J., & Nadel, L. (1985). Stress-induced recovery of fears and phobias.Psychological Review 92(4), 512-531.
Jagacinski, C., & Nicholls, J. (1987). Competence and affect in task involvement and egoinvolvement: The impact of social comparison information. Journal ofEducational Psychology, 79, 107-114.
Jenson, E. (1998). Teaching with the brain in mind. Alexandria, VA: ASCD.
Kaspi, M. (1973). Consistency of results in measuring growth patterns of schoolachievement in longitudinal studies. Doctoral Dissertation, University ofPittsburgh, Pennsylvania. (University Microfilms No. 74-1541)
Keefe, J., Kelley, E., & Miller, S. (1985). School climate: Clear definitions and a modelfor a longer setting. NASSP Bulletin, 69, 70-77.
Koretz, D. (1991). The effects of high-stakes testing on achievement: Preliminaryfindings about generalization across tests. (ERIC Document Reproduction ServiceNo. ED 340 730)
Lee, V., et al. (1996). The influence of school climate on gender differences in theachievement and engagement of young adolescents. (ERIC DocumentReproduction Service No. ED 407 077)
Lepper, M., & Hodell, M. (1989). Intrinsic motivation in the classroom. Research onMotivation in Education, 3, 73-105.
Lewis, C. (1995). Educating hearts and minds: Reflections on Japanese preschool andelementary education. (Clearinghouse No. PS023278). New York, NY:Cambridge University Press. (ERIC Document Reproduction Service No. ED 382383)

117
Lott, A., & Lott, B. (1966). Group cohesiveness and individual learning. Journal ofEducational Psychology, 57, 61-73.
Ludy, B., Hopkins, J., & Nation, J. (1990). Psychology. New York: McMillan.
Lumsden, L. (1994). Student motivation to learn. ERIC Digest, 92, 2.
MacIntosh, J. (1991). Dimensions and determinants of school social climate in schoolsenrolling middle years students. [On-line]. Available:http://www.ssta.sk.ca/research/school_improvement/91-04.htm#k
Madaus, G., & O’Dwyer, L. (1999). A short history of performance assessment. PhiDelta Kappa, 80(9), 688-695.
Makedon, A. (1992). Is Alice’s world too middle class? Recommendations for effectiveschools research. (ERIC Document Reproduction Service No. ED 346 612)
Marcon, R. (1999). Demographic and educational influences on academic motivation,competence, and achievement in minority urban students (ISBN 0-674-79265-3).Cambridge, MA: Harvard University Press. (ERIC Document ReproductionService No. ED 430 061)
Martin, J. (1992). The school home. Rethinking schools for changing families(Clearinghouse No. UD028927). Cambridge, MA: Harvard University Press.(ERIC Document Reproduction Service No. ED 351 417)
Maslow, A. (1962). Toward a psychology of being. Princeton, NJ: Van Nostrand.
McCombs, B., & Whisler, J. (1997). The learner-centered classroom and school. SanFrancisco: Jossey-Bass.
Meece, J., & McColskey, W. (1997). Improving student motivation. A guide for teachersand school improvement teams (Clearinghouse No. SP037454). Tallahassee, FL:Southeastern Regional Vision for Education. (ERIC Document ReproductionService No. ED 410 197)
Montoya, A., & Brown, N. (1990). Perceptions of school climate and studentachievement in middle and elementary school (Clearinghouse No. PS019076).PA: U. S. Department of Education. (ERIC Document Reproduction Service No.ED 324 111)
Moos, R. (1973). Conceptualizations of human environments. American Psychologist,28, 652-664.

118
Moos, R. (1974). The social climate scales: An overview. Palo Alto, CA: ConsultingPsychologists Press.
Moos, R. (1979). Evaluating educational environments: Procedures, measures, findings,and policy implications. San Francisco: Jossey-Bass.
Moos, R., & Moos, B. (1978). Classroom social climate and student absences and grades.Journal of Educational Psychology, 70, 263-269.
Morgan, G., Hofstra, G., Black, E., & Skinner, L. (1979). Children’s characteristics onschool entry: Junior kindergarten, senior kindergarten and grade 1 (Report No.0N01659). Toronto, Canada: Ontario Institute for Studies in EducationPublication Sales. (ERIC Document Reproduction Service No. ED 186 117).
Murane, R. (1975). The impact of school resources of inner-city school children.Cambridge, MA: Balinger.
Murray, H. (1938). Explorations in personality. New York: Oxford University Press.
Nielsen, H., & Kirk, D. (1974). Classroom climate. In H. J. Walberg (Ed.), Evaluatingeducational performance: A source book of methods, instruments, and examples.Berkeley, CA: McCutchan.
Paradise, L. (1994). Classroom dynamics. In R. Corsini (Ed.), Encyclopedia ofPsychology, Vol. 1 (2nd ed.). Canada: John Wiley & Sons.
Phelan, P., Davidson, A., & Hanh, T. (1992). Speaking up: Students’ perspectives onschool. Phi Delta Kappa, 73, 695-704.
Phelps, R. (1999). Why testing experts hate testing. Fordham Report, 3(1), 1-13.
Ponticell, J. (1997). Making school more rewarding: A study of at-risk high schoolstudents’ perspectives. Washington, D.C.: Association of Teacher Educators.
Rice, J. (1893/1969). The public school system of these United States. New York: Arno.
Rosenholtz, S., & Simpson, C. (1984). The formation of ability conceptions:Developmental trend or social construction? Review of Educational Research, 54,31-63.
Rosenthal, R. & Jacobson, L. (1968). Pygmalion in the classroom. New York: Holt,Rinehart & Winston.

119
Rossi, R. (1999). Chapter 3: School environment. [On-line]. Available:http://www.ed.gov/pubs/EdReformStudies/EdReforms/chap3a.html
Rutter, M., Maughan, B., Mortimore, P., Ouston, J. & Smith, A. (1979). Fifteen thousandhours: Secondary schools and their effects on children. Cambridge, MA: HarvardUniversity Press.
Sabatella, J. (1992). Using teacher perceptions as a fulcrum for school improvement: TheNew York state effective schools process. (ERIC Document Reproduction ServiceNo. ED 343 204)
Schaps, E., Lewis, C., & Watson, M. (1997). Building classroom communities.Educational Leadership, 14-17.
Schroeder, L. Sjoquist, D., & Stephan, P. (1986). Understanding regression analysis.Newbury Park, CA: Sage.
Schunk, D. (1981). Effort attribution: The direction makes a difference (ClearinghouseNo. TM810193). Los Angeles: Meeting of the American Educational ResearchAssociation. (ERIC Document Reproduction Service No. ED 199 284)
Shakiba-Nejad, H., & Yellin, D. (1981). Socioeconomic status, academic achievementand teacher response. Stillwater, OK: Oklahoma State University. (ERICDocument Reproduction Service No. ED 231 754)
Shapiro, S. (1993). Strategies that create a positive classroom climate. The ClearingHouse, 67, 91-96.
Simmons, R. (1989). Primary students’ perceptions of the learning environment as relatedto teacher training and student achievement. Dissertation Abstracts International,51(03). (University Microfilms No. AA902195)
Slavin, R. (1981, May). Synthesis of research on cooperative learning. EducationalLeadership, 655-658.
Slonaker, M (1979). A study of the relationship between sixth grade students’ perceptionsof the classroom climate and progress in reading (Doctoral dissertation, IndianaState University, 1979). Dissertation Abstracts International, 44(07A), 2099.
Smith, R., Neisworth, J., & Greer, J. (1978). Evaluating Educational Environments.Columbus, OH: Bell and Howell.
Solomon, D., Watson, M., Battish, V., Schaps, E., & Delucchi, K. (1992). Creating acaring community: Educational practices that promote children’s prosocial

120
development. In F. K. Oser, A. Dick, & J. L. Patry (Eds.), Effective andresponsible teaching: The new synthesis (pp. 383-390). San Francisco: Josey-Bass.
Squires, D., Huitt, W., & Segars, J. (n.d.). Effective schools and classrooms: A research-based perspective. Alexandria, VA: ASCD.
Stanford achievement test series (9th ed.). (1996). San Antonio, TX: Harcourt/Brace.
Stern, G. (1970). People in context: Measuring person-environment congruence ineducation and industry. New York: Wiley.
Sweeney, J. (1992). School climate: The key to excellence. NASSP Bulletin, 69-73.
Talmage, H., & Walberg, H. (1978). Naturalistic, decision-oriented evaluation of adistrict reading program. Journal of Reading Behavior, 10(2), 185-195.
Taylor, E. (1989). A plan for improving school climate. NASSP Bulletin, 73, 103-108.
Vacha, E. (1977). Improving the classroom social climate. Orcutt, CA: Holt, Rinehart &Winston.
Walberg, H. (1969). Social environment as a mediator of classroom learning. Journal ofEducational Psychology, 60(6), 443-448.
Walberg, H. (1971). Models of optimizing and individualizing school learning.Interchange, 3, 15-27.
Walberg, H. (1979). Educational environments and effects; evaluation, policy, andproductivity. Berkeley, CA: McCutchan.
Walberg, H. (1987). Psychological environments. The International Encyclopedia ofTeaching and Teacher Education. Oxford, England: Pergamon Press.
Walberg, H., & Anderson, G. (1968). The achievement-creativity dimensions ofclassroom climate. Journal of Creative Behavior, 2, 281-291.
Walberg, H., & Greenberg, R. (1997). Using the learning environment inventory.Educational Leadership, 54(8), 45-47.
Walberg, H., & Haertel, G. (1980). Evaluation reflections. Studies in EducationalEvaluation, 6, 225-238.

121
Walsh, D. (1986). SES, academic achievement, and reorganization of metropolitan areaschools: Preliminary implication of the Milwaukee Area Study. MetropolitanEducation, 1, 78-91.
White, D. (1986). Relationships between school climate and classroom climate, betweenschool climate and student achievement, and between classroom climate andstudent achievement. Unpublished doctoral dissertation, University of SouthFlorida, Tampa, FL.
Wickens, D. (1994). Classroom discipline. In R. Corsini (Ed.), Encyclopedia ofPsychology, Vol. 1 (2nd ed.). Canada: John Wiley & Sons.
Wilmore, E. (1992). The “affective” middle school: Keys to a nurturing school climate.Schools in the Middle, 31-34.
Wren, T. (1992). School climate/satisfaction perceptions as predictors of student readingachievement. Unpublished doctoral dissertation, University of Mississippi,Oxford, MS.