the real exchange rate and economic growth - brookings institution
TRANSCRIPT

365
DANI RODRIKHarvard University
The Real Exchange Rate and Economic Growth
ABSTRACT I show that undervaluation of the currency (a high realexchange rate) stimulates economic growth. This is true particularly for devel-oping countries. This finding is robust to using different measures of the realexchange rate and different estimation techniques. I also provide some evi-dence that the operative channel is the size of the tradable sector (especiallyindustry). These results suggest that tradables suffer disproportionately fromthe government or market failures that keep poor countries from convergingtoward countries with higher incomes. I present two categories of explanationsfor why this may be so, the first focusing on institutional weaknesses, and thesecond on product-market failures. A formal model elucidates the linkagesbetween the real exchange rate and the rate of economic growth.
Economists have long known that poorly managed exchange rates canbe disastrous for economic growth. Avoiding significant overvaluation
of the currency is one of the most robust imperatives that can be gleanedfrom the diverse experience with economic growth around the world, andone that appears to be strongly supported by cross-country statistical evi-dence.1 The results reported in the well-known papers by David Dollar andby Jeffrey Sachs and Andrew Warner on the relationship between outwardorientation and economic growth are largely based on indices that capturethe degree of overvaluation.2 Much of the literature that derives policy rec-ommendations from cross-national regressions is now in disrepute,3 but it
1. Razin and Collins (1997); Johnson, Ostry, and Subramanian (2007); Rajan and Sub-ramanian (2006).
2. Dollar (1992); Sachs and Warner (1995); Rodriguez and Rodrik (2001).3. Easterly (2005); Rodrik (2005).
11472-07_Rodrik_rev2.qxd 3/6/09 1:20 PM Page 365

is probably fair to say that the admonishment against overvaluationremains as strong as ever. In his pessimistic survey of the cross-nationalgrowth literature,4 William Easterly agrees that large overvaluations havean adverse effect on growth (although he remains skeptical that moderatemovements have determinate effects).
Why overvaluation is so consistently associated with slow growth is notalways theorized explicitly, but most accounts link it to macroeconomicinstability.5 Overvalued currencies are associated with foreign currencyshortages, rent seeking and corruption, unsustainably large current accountdeficits, balance of payments crises, and stop-and-go macroeconomic cycles,all of which are damaging to growth.
I will argue that this is not the whole story. Just as overvaluation hurtsgrowth, so undervaluation facilitates it. For most countries, periods of rapidgrowth are associated with undervaluation. In fact, there is little evidenceof nonlinearity in the relationship between a country’s real exchange rateand its economic growth: an increase in undervaluation boosts economicgrowth just as powerfully as a decrease in overvaluation. But this relation-ship holds only for developing countries; it disappears when the sample isrestricted to richer countries, and it gets stronger the poorer the country.These findings suggest that more than macroeconomic stability is at stake.The relative price of tradable goods to nontradable goods (that is, the realexchange rate) seems to play a more fundamental role in the convergenceof developing country with developed country incomes.6
I attempt to make the point as directly as possible in figure 1, whichdepicts the experience of seven developing countries during 1950–2004:China, India, South Korea, Taiwan, Uganda, Tanzania, and Mexico. Ineach case I have graphed side by side my measure of real undervaluation(defined in the next section) against the country’s economic growth rate inthe same period. Each point represents an average for a five-year window.
To begin with the most fascinating (and globally significant) case, thedegree to which economic growth in China tracks the movements in myindex of undervaluation is uncanny. The rapid increase in annual growth ofGDP per capita starting in the second half of the 1970s closely parallelsthe increase in the undervaluation index (from an overvaluation of close to
366 Brookings Papers on Economic Activity, Fall 2008
4. Easterly (2005).5. See, for example, Fischer (1993).6. Recently, Bhalla (forthcoming), Gala (2007), and Gluzmann, Levy-Yeyati, and
Sturzenegger (2007) have made similar arguments.
11472-07_Rodrik_rev2.qxd 3/6/09 1:20 PM Page 366

DANI RODRIK 367
Figure 1. Undervaluation and Economic Growth in Selected Developing Countries,1950–2004
China
0
4
2
6
8
–0.50–0.75–1.00
0
Log units Percent a year
0.25
–0.25
1960 1970 1980 1990
ln UNDERVAL (left scale)
Growth in GDPper capita (right scale)
India
2
3
0
0.4
0.6
Log units Percent a year
0.2
1960 1970 1980 1990
ln UNDERVALGrowth in
GDP per capita
South Korea
0
Log units
0.2
–0.2
4
2
6
Percent a year
1960 1970 1980 1990
ln UNDERVAL
Growth inGDP percapita
Taiwan
5
4
6
7
8
–0.4–0.3
–0.5
0
Log units Percent a year
–0.2–0.1
1960 1970 1980 1990
ln UNDERVAL
Growth in GDPper capita
(continued)
11472-07_Rodrik_rev2.qxd 3/6/09 1:20 PM Page 367

100 percent to an undervaluation of around 50 percent7), and both under-valuation and the growth rate plateau in the 1990s. Analysts who focus onglobal imbalances have, of course, noticed in recent years that the yuan isundervalued, as evidenced by China’s large current account surplus. Theyhave paid less attention to the role that undervaluation seems to haveplayed in driving the country’s economic growth.
368 Brookings Papers on Economic Activity, Fall 2008
Figure 1. Undervaluation and Economic Growth in Selected Developing Countries,1950–2004 (Continued)
Sources: Penn World Tables version 6.2, and author’s calculations.
UgandaLog units Percent a year
1960 1970 1980 1990
TanzaniaLog units Percent a year
1960 1970 1980 1990
MexicoLog units Percent a year
1960 1970 1980 1990
–4
–2
0
24
–0.50
0
0.500.25
–0.25
–0.75ln
UNDERVAL
Growth in GDP per capita
2
0
4
–0.8
–0.4
–0.2–0.3
–0.5
–0.7–0.6
Growth in GDP per capita
ln UNDERVAL
0–1
123
–0.2
0.2
0
–0.4Growth in GDP per capita
ln UNDERVAL
7. Recent revisions in purchasing power parity indices are likely to make a big differ-ence to the levels of these undervaluation measures, without greatly affecting their trendsover time. See the discussion below.
11472-07_Rodrik_rev2.qxd 3/6/09 1:20 PM Page 368

For India, the other growth superstar of recent years, the picture is lessclear-cut, but the basic message is the same as that for China. India’sgrowth in GDP per capita has steadily climbed from slightly above 1 per-cent a year in the 1950s to 4 percent by the early 2000s, while its realexchange rate has moved from a small overvaluation to an undervaluationof around 60 percent. In the case of the two East Asian tigers depicted infigure 1, South Korea and Taiwan, what is interesting is that the growthslowdowns in recent years were in each case preceded or accompanied byincreased overvaluation or reduced undervaluation. In other words, bothgrowth and undervaluation exhibit an inverse-U shape over time.
These regularities are hardly specific to Asian countries. The next twopanels in figure 1 depict two African experiences, those of Uganda andTanzania, and here the undervaluation index captures the turning points ineconomic growth exceptionally well. A slowdown in growth is accompa-nied by increasing overvaluation, and a pickup in growth is accompaniedby a rise in undervaluation. Finally, the last panel of figure 1 shows asomewhat anomalous Latin American case, that of Mexico. Here the twoseries seem quite a bit out of sync, especially since 1981, when the correla-tion between growth and undervaluation turns negative rather than posi-tive. Those familiar with the recent economic history of Mexico willrecognize this to be a reflection of the cyclical role of capital inflows ininducing growth in that country. Periods of capital inflows in Mexico areassociated with consumption-led growth booms and currency apprecia-tion; when the capital flows reverse, the economy tanks and the currencydepreciates. The Mexican experience is a useful reminder that there is noreason a priori to expect a positive relationship between growth and under-valuation. It also suggests the need to go beyond individual cases andundertake a more systematic empirical analysis.
In the next section I do just that. First, I construct a time-varying indexof real undervaluation, based on data from the Penn World Tables on pricelevels in individual countries. My index of undervaluation is essentially areal exchange rate adjusted for the Balassa-Samuelson effect: this measureof the real exchange rate adjusts the relative price of tradables to nontrad-ables for the fact that as countries grow rich, the relative prices of nontrad-ables as a group tend to rise (because of higher productivity in tradables).I next show, in regressions using a variety of fixed-effects panel specifica-tions, that there is a systematic positive relationship between growth andundervaluation, especially in developing countries. This indicates that theAsian experience is not an anomaly. I subject these baseline results to aseries of robustness tests, employing different data sources, a range of alter-
DANI RODRIK 369
11472-07_Rodrik_rev2.qxd 3/6/09 1:20 PM Page 369

native undervaluation indices, and different estimation methods. Althoughascertaining causality is always difficult, I argue that in this instance causal-ity is likely to run from undervaluation to growth rather than the other wayaround. I also present evidence that undervaluation works through its pos-itive impact on the share of tradables in the economy, especially industry.Hence developing countries achieve more rapid growth when they are ableto increase the relative profitability of their tradables.
These results suggest strongly that there is something “special” abouttradables in countries with low to medium incomes. In the rest of the paperI examine the reasons behind this regularity. What is the precise mecha-nism through which an increase in the relative price of tradables (andtherefore the sector’s relative size) increases growth? I present two classesof theories that would account for the stylized facts. In one, tradables are“special” because they suffer disproportionately (that is, compared withnontradables) from the institutional weakness and inability to completelyspecify contracts that characterize lower-income environments. In theother, tradables are “special” because they suffer disproportionately fromthe market failures (information and coordination externalities) that blockstructural transformation and economic diversification. In both cases, anincrease in the relative price of tradables acts as a second-best mechanismto partly alleviate the relevant distortion, foster desirable structural change,and spur growth. Although I cannot discriminate sharply between the twotheories and come down in favor of one or the other, I present some evi-dence that suggests that these two sets of distortions do affect tradableactivities more than they do nontradables. This is a necessary condition formy explanations to make sense.
In the penultimate section of the paper, I develop a simple growth modelto elucidate how the mechanisms I have in mind might work. The model isthat of a small, open economy in which the tradable and nontradable sectorsboth suffer from an economic distortion. For the purposes of the model,whether the distortion is of the institutional and contracting kind or of theconventional market failure kind is of no importance. The crux is the rela-tive magnitude of the distortions in the two sectors. I show that when thedistortion in tradables is larger, the tradable sector is too small in equilib-rium. A policy or other exogenous shock that can induce a real deprecia-tion will then have a growth-promoting effect. For example, an outwardtransfer, which would normally reduce domestic welfare, can have thereverse effect because it increases the equilibrium relative price of trad-ables and can thereby increase economic growth. The model clarifies howchanges in relative prices can produce growth effects in the presence of
370 Brookings Papers on Economic Activity, Fall 2008
11472-07_Rodrik_rev2.qxd 3/6/09 1:20 PM Page 370

distortions that affect the two sectors differently. It also clarifies the sensein which the real exchange rate is a “policy” variable: changing its levelrequires complementary policies (here the size of the inward or outwardtransfer).
I summarize my findings and discuss some policy issues in the conclud-ing section of the paper.
Undervaluation and Growth: The Evidence
I will use a number of different indices in what follows, but my preferredindex of under- or overvaluation is a measure of the domestic price leveladjusted for the Balassa-Samuelson effect. This index has the advantagethat it is comparable across countries as well as over time. I compute thisindex in three steps. First, I use data on exchange rates (XRAT) and pur-chasing power parity conversion factors (PPP) from the Penn WorldTables version 6.2 to calculate a “real” exchange rate (RER):8
where i indexes countries and t indexes five-year time periods. (Unlessspecified otherwise, all observations are simple averages across years.)XRAT and PPP are expressed as national currency units per U.S. dollar.9
Values of RER greater than one indicate that the value of the currency islower (more depreciated) than indicated by purchasing power parity. How-ever, in practice nontradable goods are also cheaper in poorer countries(through the Balassa-Samuelson effect), which requires an adjustment. Soin the second step I account for this effect by regressing RER on GDP percapita (RGDPCH):
where ft is a fixed effect for time period and u is the error term. This regres-sion yields an estimate of β (β) of −0.24 (with a very high t statistic ofaround 20), suggesting a strong and precisely estimated Balassa-Samuelsoneffect: when incomes rise by 10 percent, the real exchange rate falls byaround 2.4 percent. Finally, to arrive at my index of undervaluation, I takethe difference between the actual real exchange rate and the Balassa-Samuelson-adjusted rate:
( ) ln ln ,1 RER RGDPCH f uit it t it= + + +α β
ln ln ,RER XRAT PPPit it it= ( )
DANI RODRIK 371
8. The Penn World Tables data are from Heston, Summers, and Aten (2006).9. The variable p in the Penn World Tables (called the “price level of GDP”) is equiva-
lent to RER. I have used p here as this series is more complete than XRAT and PPP.
11472-07_Rodrik_rev2.qxd 3/6/09 1:20 PM Page 371

10. Johnson, Ostry, and Subramanian (2007).11. See Aguirre and Calderón (2005), Razin and Collins (1997), and Elbadawi (1994)
for some illustrations.12. International Comparison Program (2007).
where ln is the predicted value from equation 1.Defined in this way, UNDERVAL is comparable across countries and
over time. Whenever UNDERVAL exceeds unity, it indicates that theexchange rate is set such that goods produced at home are relatively cheapin dollar terms: the currency is undervalued. When UNDERVAL is belowunity, the currency is overvalued. In what follows I will typically use thelogarithmic transform of this variable, ln UNDERVAL, which is centeredat zero and has a standard deviation of 0.48 (figure 2). This is also the mea-sure used in figure 1.
My procedure is fairly close to that followed in recent work by SimonJohnson, Jonathan Ostry, and Arvind Subramanian.10 The main differenceis that these authors estimate a different cross section for equation 1 foreach year, whereas I estimate a single panel (with time dummies). Mymethod seems preferable for purposes of comparability over time. Iemphasize that my definition of undervaluation is based on price compar-isons and differs substantially from an alternative definition that relates tothe external balance. The latter is typically operationalized by specifying asmall-scale macro model and estimating the level of the real exchange ratethat would achieve balance of payments equilibrium.11
One issue of great significance for my calculations is that the WorldBank’s International Comparison Program has recently published revisedPPP conversion factors for a single benchmark year, 2005.12 In someimportant instances, these new estimates differ greatly from those previ-ously available and on which I have relied here. For example, price levelsin both China and India are now estimated to be around 40 percent abovethe previous estimates for 2005, indicating that these countries’ currencieswere not nearly as undervalued in that year as the old numbers suggested(15 to 20 percent as opposed to 50 to 60 percent). This is not as damagingto my results as it may seem at first sight, however. Virtually all my regres-sions are based on panel data and include a full set of country and timefixed effects. In other words, as I did implicitly in figure 1, I identify thegrowth effects of undervaluation from changes within countries, not fromdifferences in levels across a cross section of countries. So my results
RERit
�
ln ln ln ,UNDERVAL RER RERit it it= − �
372 Brookings Papers on Economic Activity, Fall 2008
11472-07_Rodrik_rev2.qxd 3/6/09 1:20 PM Page 372

should remain unaffected if the revisions to the PPP factors turn out to con-sist of largely one-time adjustments to the estimated price levels of indi-vidual countries, without greatly altering their time trends. Even thoughthe time series of revised PPP estimates are not yet available, preliminaryindications suggest that this will be the case.
In fact, the revised data yield a cross-sectional estimate of β for 2005that is virtually the same as the one presented above (−0.22, with a t statis-tic of 11). In other words, the magnitude of the Balassa-Samuelson effectis nearly identical whether estimated with the new data or the old.
The Baseline Panel Evidence
My dataset covers a maximum of 188 countries and 11 five-year periodsfrom 1950–54 through 2000–04. My baseline specification for estimatingthe relationship between undervaluation and growth takes the followingform:
where the dependent variable is annual growth in GDP per capita. Theequation thus includes the standard convergence term (initial income percapita, RGDPCHi,t−1) and a full set of country and time dummies (fi and ft).
( ) ln ln,2 1growth RGDPCH UNDERVALit i t it= + + +−α β δ ff f ui t it+ + ,
DANI RODRIK 373
Figure 2. Distribution of the Undervaluation Measure
Source: Author’s calculations.
0.2
0.4
0.6
0.8
1.0
Density
–2 0 2
UNDERVAL
11472-07_Rodrik_rev2.qxd 3/6/09 1:20 PM Page 373

My primary interest is in the value of δ. Given the fixed-effects frame-work, what I am estimating is the “within” effect of undervaluation,namely, the impact of changes in under- or overvaluation on changes ingrowth rates within countries. I present regressions with additional covari-ates, as well as cross-sectional specifications, in a later subsection.
Table 1 presents the results. When estimated for the panel as a whole(column 1-1), the regression yields a highly significant δ of 0.017. However,as columns 1-2 and 1-3 reveal, this effect operates only for developingcountries. In the richer countries in the sample, δ is small and statisticallyindistinguishable from zero, whereas in the developing countries δ rises to0.026 and is highly significant. The latter estimate suggests that a 50 percentundervaluation—which corresponds roughly to one standard deviation inUNDERVAL—is associated with a boost in annual growth of real incomeper capita during the same five-year period of 1.3 percentage points (0.50 ×0.026). This is a sizable effect. I will discuss the plausibility of this esti-mate later, following my discussion of robustness tests and theoreticalexplanations.
The results in column 1-4 confirm further that the growth impact ofundervaluation depends heavily on a country’s level of development.When UNDERVAL is interacted with initial income, the estimated coeffi-cient on the interaction term is negative and highly significant. The esti-mated coefficients in column 1-4 indicate that the growth effects of a 50 percent undervaluation for Brazil, China, India, and Ethiopia at theircurrent levels of income are 0.47, 0.60, 0.82, and 1.46 percentage points,respectively. The estimates also imply that the growth effect disappears atan income per capita of $19,635, roughly the level of Bahrain, Spain, orTaiwan.
Interestingly, the estimated impact of undervaluation seems to be inde-pendent of the time period under consideration. When I split the develop-ing country data into pre- and post-1980 subperiods (columns 1-5 and 1-6),the value of δ remains basically unaffected. This indicates that the channelor channels through which undervaluation works have little to do with theglobal economic environment; the estimated impact is, if anything, smallerin the post-1980 era of globalization, when markets in rich countries wereconsiderably more open. So the explanation cannot be a simple export-ledgrowth story.
Robustness: Sensitivity to Outliers
As noted in the introduction, the literature on the relationship betweenexchange rate policy and growth has focused to date largely on the delete-
374 Brookings Papers on Economic Activity, Fall 2008
11472-07_Rodrik_rev2.qxd 3/6/09 1:20 PM Page 374

Tabl
e 1.
Bas
elin
e Pa
nel R
egre
ssio
ns o
f Eco
nom
ic G
row
th o
n th
e U
nder
valu
atio
n M
easu
rea
Sam
ple
All
D
evel
oped
Dev
elop
ing
All
D
evel
opin
gD
evel
opin
gco
untr
ies,
co
untr
ies,
bco
untr
ies,
coun
trie
s,co
untr
ies,
coun
trie
s,19
50–2
004
1950
–200
419
50–2
004
1950
–200
419
50–7
919
80–2
004
Inde
pend
ent v
aria
ble
1-1
1-2
1-3
1-4
1-5
1-6
ln in
itia
l inc
ome
−0.0
31**
*−0
.055
***
−0.0
39**
*−0
.032
***
−0.0
62**
*−0
.065
***
(−6.
67)
(−6.
91)
(−5.
30)
(−7.
09)
(−3.
90)
(−4.
64)
ln U
ND
ER
VA
L0.
017*
**0.
003
0.02
6***
0.08
6***
0.02
9***
0.02
4***
(5.2
1)(0
.49)
(5.8
4)(4
.05)
(4.2
0)(3
.23)
ln in
itia
l inc
ome
×ln
−0
.008
7***
UN
DE
RV
AL
(−3.
39)
No.
of
obse
rvat
ions
1,30
351
379
01,
303
321
469
Sour
ce: A
utho
r’s
regr
essi
ons.
a. T
he d
epen
dent
var
iabl
e is
ann
ual
grow
th i
n G
DP
per
capi
ta,
in p
erce
nt.
Obs
erva
tions
are
five
-yea
r av
erag
es.
All
regr
essi
ons
incl
ude
time
and
coun
try
fixed
eff
ects
.C
ount
ries
with
ext
rem
e ob
serv
atio
ns f
or U
ND
ER
VA
L(I
raq,
Lao
s, a
nd N
orth
Kor
ea)
have
bee
n ex
clud
ed f
rom
the
sam
ples
. Rob
ust t
stat
istic
s ar
e in
par
enth
eses
. Ast
eris
ksin
dica
te s
tatis
tical
sig
nific
ance
at t
he *
10 p
erce
nt, *
*5 p
erce
nt, o
r **
*1 p
erce
nt le
vel.
b. D
evel
oped
cou
ntry
obs
erva
tions
are
thos
e w
ith r
eal G
DP
per
capi
ta e
xcee
ding
$6,
000.
11472-07_Rodrik_rev2.qxd 3/6/09 1:20 PM Page 375

rious consequences of large overvaluations. In his survey of the cross-national growth literature, Easterly warns against extrapolating from largeblack market premiums for foreign currency, for which he can find evi-dence of harmful effects on growth, to more moderate misalignments ineither direction, for which he does not.13 However, the evidence stronglysuggests that the relationship I have estimated does not rely on outliers: itis driven at least as much by the positive growth effect of undervaluationas by the negative effect of overvaluation. Furthermore, there is little evi-dence of nonlinearity in either direction.
Figure 3 presents a scatterplot of the data used in column 1-3 of table 1(that is, developing countries over the entire sample period). Inspectionsuggests a linear relationship over the entire range of UNDERVAL and noobvious outliers. To investigate this more systematically, I ran the regres-sion for successively narrower ranges of UNDERVAL. The results areshown in table 2, where the first column reproduces the baseline resultsfrom table 1, the second excludes all observations with UNDERVAL < −1.50 (that is, overvaluations greater than 150 percent), the third excludesobservations with UNDERVAL < −1.00, and so on. The final column
376 Brookings Papers on Economic Activity, Fall 2008
13. Easterly (2005).
Sources: Penn World Tables version 6.2, and author’s calculations.
–0.2
–0.1
0
Component plus residual
–1 0 1
ln UNDERVAL (log units)
MNG75ROM65 MNG80
YEM90
MNG85
NGA80
GHA80
SYR85
ZAR75
BRA55
ROM70
NGA75
SYR65SUR90
MOZ65
CHN60
SYR80
NGA95UGA75SYR90
MOZ70
COG100
CHN65
CHN55IRN85
TUR55
GHA75BTN75
UGA80
GNQ65
TZA80YUG95CHN70
SYR75
GNB80
GNB70
ZAR80IRN90
SDN85SYR70
SYR95NGA70SDN90GNB65
SYR100TZA75BRA65JAM100YEM100
YUG100
NGA85YEM95LBR95
BRA70
AFG90BRA60
LBN100UGA85
GNB75
TZA70
SDN75
TON75
SOM80
MAR55
ZMB80
SDN80
SUR85
CHN75
GNQ70
TZA85COG65MWI60
LBR100
TZA65MOZ75
LBR90
ETH85ZAR100MNG90
SUR80COG75
CAF90
MWI65ZMB100GHA65
SUR75COG70TUR75ZMB75
MRT80
LBN95
ZMB95
EGY85
PAN55
GRD95MWI55TUR65GMB75FSM100
PAN60
TUR60
TON80
COG95
KIR95
TWN55
JAM95COG85ETH55ETH65
LKA55TGO100
ETH60MWI70
BTN80PAK65GNB85BTN85
GHA60
NGA100GRD90
MRT85LKA60
KIR80
COG90SEN90TON90CMR75STP85TON95BEN75
KIR100CAF85TUR90
ETH70
VUT75BEN60PAN65
TZA95
MRT75
PAK60HND100
BWA80
HND85
PER95
MRT90ISR55
STP75
CIV75BOL55STP80TUR100PER100KIR90DOM55
ZMB70
TGO65
COL55TGO90BEN90UGA70
ZAR95
IND60
MDG100
TUR95
SDN100FSM95
GHA70
CHN80
CMR90
URY65TCD75
CMR85
NGA65
TGO95
ZMB90
CIV65FJI80GMB80WSM95TUR70BTN100SLV100
GNB90MOZ80
MLI90
LKA65GMB90
WSM100
COG80
IND55BEN80
GNQ90
JAM65CAF95
BWA90
GMB85
SOM95
TZA100
MYS60BIH100
GNB95KEN75
CMR80
TZA90JOR100SUR95
CAF100
VUT100
SEN85BEN65
NER75
WSM90
GNQ95
MDG80
CAF75
TGO85
SOM100CIV90BFA65BWA75WSM75
BFA75KOR55
MDV95HND65
BFA60
GTM100JAM70
KIR75
PER90
TCD65
BIH95
KEN80IRN95VUT95
MOZ85
DZA85
PAK55
BFA90
IND65PAN70
JAM75
MAR60
TGO75
JAM60
MYS65FSM80
FSM90KIR85
TON100
ZAR85
MDG95FJI75TCD70
BDI80
CIV80
TCD80
NER90BEN100
TWN60
DOM60
KEN70KEN100
GMB100CUB100SEN75
GHA85
IRL60
ETH75
FSM75COL60GRD85
ZMB65
MWI75LBR85
BEN95HND80
FJI85FJI95NGA90HND70
DOM65
CHL55
JOR80SLE80
CPV75
BFA70SEN65MDV100
SLE100
PHL55
ZWE100HND60MWI90MDG75
THA55
SEN70ZAR90GNB100
ETH90
RWA85
IRN80
SEN95
JAM55
NER85
SLB100
KEN85ETH80
JAM80
BOL80
VUT90
BEN85MLI85
TUR80CMR70
BFA85NPL65BEN70
ERI100
NER80
SDN95ZMB85
CIV85MLI95
GMB95TGO80CIV95
MYS70MDG90LKA70
UGA95
JOR75
TWN65MEX65THA60KHM85
BLZ95MEX70PAN75
DOM70NAM95HND55DOM75
DOM80
AFG100
HND95
NER70
CPV70GHA90BFA80MWI80
SLB95BWA85TGO70CRI55JOR95STP90BTN90
CUB75JOR85
VUT80SOM85
SLV95
ECU100IRL55FJI100
CIV70GTM95
BLZ90KOR80FJI90MLI100FSM85BTN95CAF80
CHL60
NAM90MDG85TUR85TWN70
MKD95IND70
DOM95
GMB70THA65
MDV90GRC60
MNG100
VUT85MEX60
NGA60
KHM80
SLE75
GNQ85
BOL95SEN100ECU95COL65
GMB65
CUB95ZMB60MLI80
TWN75
GRC55CMR65
LSO90SEN80
DJI90
NIC85BDI65NGA55PAK70MRT95HND75CHL65MAR65
LBR80
TON85KHM100
MYS80MYS75
GHA95
BDI85
MWI85CRI60
TCD90
MAR70CIV100
JOR90
LBR75
BOL100DZA75
KOR75NER65
WSM80NAM75
DZA80RWA75
CUB80MDG65
BLZ85
DZA90CPV90GTM55NAM100COL80RWA95
MNG95
MKD100SGP65MLI75GTM60UGA90
COM100
TCD85
CMR95KEN95ZWE65
KEN60KEN65HKG65MAR75
PRY80
SOM75JPN60MDG70KHM95
BDI75IDN75MDV85
LCA85
BFA95PNG90
CPV95
MYS85
BOL85
PHL60
RWA80
DJI95
ROM100WSM85ESP55NPL70
KHM75
JAM85GTM80CRI70
SLB90
VCT85
TCD100
COM90
LSO95
NER100ZWE60CPV65
JAM90
NAM80
ALB100BOL90BDI70
LSO65CRI65
VCT90
EGY55
MWI95KEN55POL80
KOR60
MAR95
RWA90
SLB80DJI85
ROM75
NER95LCA80DOM90HND90DZA70GTM65UGA100ERI95
THA70TTO55
SLB85
TCD95MAR100
KOR70
LSO70
PRT65
MDV75
EGY60PHL95
GTM85IDN80PAK75DZA100CMR100COL70PRT60SLV90TUN75
THA90
JPN55
EGY80
PNG75
SLV85EGY75
DJI100
BDI90BOL75LSO80SLB75
ATG75DZA95GRD80PRT55MEX55
IND75STP95
IDN70
PHL65GTM75STP100IND80PRY95
IDN65BDI95
EGY95CPV100KHM90
MRT100
ZWE55BFA100
GTM90MAR90DZA65
CHL75
PAK80
MDV80BOL60KEN90COL75
DMA85
CHN85
SLE95
TUN70
PER85ZAF60
COM95LCA75
HTI100
ROM95THA75CPV80MLI70EGY65
CPV85
COL85THA80HTI95LSO75KOR65
TUN90RWA70BOL65
ZWE70
GTM70LSO100ECU80ZAF55COL90
ZWE85
RWA100
UGA65
CUB90MLI65
MAR80EGY100
ALB95
IND85
PNG80GIN70
JOR70
ZWE75EGY70
PRY75
MOZ95
THA85JOR55VCT80NAM85DJI80GRD75
ZWE80
SLE90
GHA100ESP60PRY90
MWI100
PNG85PRY85PHL90UGA60
COM85
PRY65PRY55
TUN65
UGA55TUN80ECU90
EGY90BLZ80
PRY60BOL70
PER65
LSO85PRY70MAR85BLZ75ECU85
VCT75
ETH95PER70PHL100PAK90NIC100
ECU65
JOR60
TUN85NPL75
BGD95PAK95
SLV80
GIN65LKA75
CHN95
ROM90
CHN100
PAK85
GNQ75
NIC90
IDN90
AFG95
NIC95RWA65
IDN85PNG95
PRY100
DMA80JOR65BGD100ECU70
ECU75
KNA75
CHN90
NPL80
MOZ90
BGD75
MOZ100
SLV60GIN75PAK100
BDI100
KNA80PER60
GIN60
BGD85SLV55GIN90
HTI85
COM75NPL85PHL80BGD80
BGD90
GIN85ECU60
AZE100
SLE85
DOM85
ZWE90
PHL85
ETH100VNM100
HTI90ZWE95
PHL75
GNQ80
PER80
LKA95
IND90COM80SLV65GIN95
NIC80GIN80PHL70
IDN95LKA100
PER75
AZE95
VNM95LKA90IND95IND100SOM90ECU55
NPL90NPL100IDN100IRN60NPL95
DMA75
GEO95
LKA80IRN65
UZB95SWZ80
PER55
SLV70
LKA85SWZ75
SLV75
AFG85
MUS60
HTI80ARM100
PNG100
MUS65MDA100MUS55
HTI75
UKR95
MDA95
NIC60NIC55
GEO100MUS70
AFG75
GIN100COM65
UKR100
COM70
TJK95
AFG80
KGZ95
TJK100
VNM90
UZB100KGZ100
Figure 3. Growth and Undervaluation in the Developing Country Sample
11472-07_Rodrik_rev2.qxd 3/6/09 1:20 PM Page 376

DANI RODRIK 377
Table 2. Impact of Excluding Extreme Observations of the Undervaluation Measurea
Range of UNDERVAL included in sample
Greater Greater Greater Greater Betweenthan than than than 50% and
Baseline −150% −100% −50% −25% −50%
Coefficient on 0.026 0.029 0.034 0.034 0.028 0.030ln UNDERVAL
t statistic (5.84) (6.31) (7.28) (5.46) (4.32) (3.72)No. of observations 790 786 773 726 653 619
Source: Author’s regressions.a. See table 1 for details of the specification. All estimated coefficients are statistically significant at the
1 percent level.
restricts the range to undervaluations or overvaluations that are smallerthan 50 percent. The remarkable finding is that these sample truncationsaffect the estimated coefficient on ln UNDERVAL very little. The coeffi-cient obtained when I eliminate all overvaluations greater than 25 percentis nearly identical to that for the entire sample, and the coefficient obtainedwhen I eliminate all under- and overvaluations above 50 percent is stillhighly significant. Unlike Álvaro Aguirre and César Calderón, and OfairRazin and Susan Collins, I find little evidence of nonlinearity in the rela-tionship between undervaluation and economic growth.14
Robustness: Different Real Exchange Rate Measures
There are some potential concerns with relying exclusively on UNDER-VAL as a measure of under- or overvaluation. One issue is the uncertainreliability of the price-level measures in the Penn World Tables. As I men-tioned above, the most recent revisions have revealed the estimates to beproblematic in quite a few countries (even though the implications forchanges over time within countries may not be as severe). This suggeststhe need to check the validity of my results using real exchange rate seriesconstructed from other data sources.
Another worry relates to my adjustment for the Balassa-Samuelsoneffect. Although this adjustment is proper and introduces no bias whenthere is a direct feedback from incomes to price levels as indicated in equa-tion 1, it may be problematic under some other circumstances. For example,
14. Aguirre and Calderón (2005); Razin and Collins (1997). I have also tried enteringthe square of UNDERVAL, distinguishing between positive and negative values of UNDER-VAL. I find some evidence that extreme overvaluations (large negative values of UNDER-VAL) are proportionately more damaging to growth, but the effect is not that strong, and themain coefficient of interest remains unaffected.
11472-07_Rodrik_rev2.qxd 3/6/09 1:20 PM Page 377

if the Balassa-Samuelson effect is created by a third variable (“productiv-ity”) that affects both income per capita and the price level, the coefficientestimates on UNDERVAL may be biased upward (as discussed by MichaelWoodford in his comment on this paper). This suggests the need to employalternative measures of the real exchange rate that do not incorporate theBalassa-Samuelson adjustment. Even though estimates from regressionsthat use such alternative measures are in turn likely to be biased downward(in the presence of Balassa-Samuelson effects that operate over timewithin countries), such estimates are still useful insofar as they provide alower bound on the growth effects of undervaluation.
I therefore use four additional real exchange rate indices in the regres-sions that follow, to complement the results obtained with UNDERVALabove. First, I simply use the inverse of the index of the price level fromthe Penn World Tables, without the Balassa-Samuelson adjustment:
This measure has all the problems of the Penn World Tables, since it isconstructed from that source, but for purposes of robustness testing it hasthe virtue that it is not subject to the sort of bias just mentioned. Next I usethe real effective exchange rate index of the International Monetary Fund(IMF), ln REERIMF, which is a measure of the value of home currencyagainst a weighted average of the currencies of major trade partnersdivided by a price deflator or index of costs. This is a multilateral measureof competitiveness and is available for a large number of industrial anddeveloping countries, although the coverage is not nearly as complete asthat of the Penn World Tables. The third index is a simple bilateral mea-sure of the real exchange rate with the United States, constructed usingwholesale price indices:
where E is the home country’s nominal exchange rate against the U.S. dol-lar (in units of home currency per dollar), PPIUS is the producer price indexfor the United States, and WPI is the home country’s wholesale priceindex. All of the data are from the IMF’s International Financial Statistics(IFS). Since the IFS does not report wholesale price indices for manycountries, I use as my final index a bilateral real exchange rate constructedusing consumer prices:
ln ln ,RERE PPI
WPIWPI
US=×⎛
⎝⎜⎞⎠⎟
ln ln .RERXRAT
PPPPWT = ⎛⎝⎜
⎞⎠⎟
378 Brookings Papers on Economic Activity, Fall 2008
11472-07_Rodrik_rev2.qxd 3/6/09 1:20 PM Page 378

where CPI is the home country’s consumer price index. Note that the lev-els of the last three measures are not comparable across countries, but thisis of no consequence for the panel regressions, which track the effects ofchanges in real exchange rates within countries.
Table 3 reports the results, for the full sample and the developing coun-try sample separately, of rerunning the baseline specification from table 1(columns 1-1 and 1-3), substituting in turn each of the above measures forUNDERVAL. The numbers tell a remarkably consistent story, despite thedifferences in data sources and in the construction of the index. When theregression is run on the full sample, the growth impact of a real deprecia-tion is small and often statistically insignificant. But when the sample isrestricted to developing countries (again defined as those with real GDPper capita below $6,000), the estimated effect is strong and statisticallysignificant in all cases. (Only the estimate using REERIMF misses the 5 per-cent significance threshold, and that narrowly.) The coefficient estimatesrange between 0.012 and 0.029 (using RERCPI and RERWPI, respectively)and bracket the estimate with UNDERVAL reported earlier (0.026). Notein particular that the coefficient estimate with RERPWT is highly significantand, as expected, smaller than the estimate with UNDERVAL (0.016 versus0.026). It is hard to say how much of this difference is due to the lack ofcorrection for the Balassa-Samuelson effect (and hence a downward biasin the estimation when using RERPWT) and how much to the correction of aprevious bias in the estimation with UNDERVAL. Even if the “correct”estimate is the lower one of 0.016, it still establishes a strong enough rela-tionship between real undervaluation and economic growth to commandattention: a 50 percent undervaluation would boost annual growth of incomeper capita by 0.8 percentage point.
Robustness: Additional Covariates
The specifications reported thus far are rather sparse, including only aconvergence factor, fixed effects, and the undervaluation measure itself.Of course, the fixed effects serve to absorb any growth determinants thatare time-invariant and country-specific, or time-specific and country-invariant. But it is still possible that some time-varying country-specificdeterminants correlated with UNDERVAL have been left out. The regres-sions reported in table 4 therefore augment the baseline specification withadditional covariates. I include measures of institutional quality (“rule of
ln ln ,RERE PPI
CPICPI
US=×⎛
⎝⎜⎞⎠⎟
DANI RODRIK 379
11472-07_Rodrik_rev2.qxd 3/6/09 1:20 PM Page 379

Tabl
e 3.
Pane
l Reg
ress
ions
of E
cono
mic
Gro
wth
on
Und
erva
luat
ion
Usi
ng A
ltern
ativ
e R
eal E
xcha
nge
Rat
e M
easu
resa
Rea
l exc
hang
e ra
te m
easu
re a
nd s
ampl
e
ln R
ER
PW
Tb
ln R
EE
RIM
Fc
ln R
ER
WP
Iln
RE
RC
PI
All
D
evel
opin
gA
ll
Dev
elop
ing
All
D
evel
opin
gA
ll
Dev
elop
ing
Inde
pend
ent v
aria
ble
coun
trie
sdco
untr
iese
coun
trie
sco
untr
ies
coun
trie
sdco
untr
ies
coun
trie
sdco
untr
ies
ln in
itia
l inc
ome
−0.0
29**
*−0
.033
***
−0.0
41**
*−0
.049
**−0
.041
***
−0.0
31−0
.033
***
−0.0
33**
*(−
6.02
)(−
4.43
)(−
3.63
)(−
2.51
)(−
5.32
)(−
1.63
)(−
7.37
)(−
4.81
)ln
UN
DE
RV
AL
0.00
6**
0.01
6***
0.00
50.
015*
0.00
30.
029*
**0.
003*
0.01
2***
(1.9
7)(3
.74)
(0.9
4)(1
.92)
(1.5
4)(2
.95)
(1.7
2)(2
.83)
No.
of
obse
rvat
ions
1,29
379
047
620
644
016
298
755
7
Sour
ce: A
utho
r’s
regr
essi
ons.
a. T
he d
epen
dent
var
iabl
e is
ann
ual g
row
th in
GD
P pe
r ca
pita
, in
perc
ent.
Obs
erva
tions
are
ave
rage
s ov
er fi
ve-y
ear
peri
ods.
All
regr
essi
ons
incl
ude
time
and
coun
try
fixed
effe
cts.
Rob
ust t
stat
istic
s ar
e in
par
enth
eses
. Ast
eris
ks in
dica
te s
tatis
tical
sig
nific
ance
at t
he *
10 p
erce
nt, *
*5 p
erce
nt, o
r **
*1 p
erce
nt le
vel.
b. S
ampl
e ex
clud
es I
raq,
Lao
s, a
nd N
orth
Kor
ea, w
hich
hav
e ex
trem
e ob
serv
atio
ns f
or U
ND
ER
VA
L.
c. S
ampl
e ex
clud
es N
icar
agua
, whi
ch h
as e
xtre
me
obse
rvat
ions
for
UN
DE
RV
AL
.d.
Sam
ple
excl
udes
the
Uni
ted
Stat
es, a
s it
is th
e ba
se c
ount
ry w
ith a
n in
vari
ant r
eal e
xcha
nge
rate
inde
x.e.
Dev
elop
ed c
ount
ry o
bser
vatio
ns a
re th
ose
with
rea
l GD
P pe
r ca
pita
exc
eedi
ng $
6,00
0.
11472-07_Rodrik_rev2.qxd 3/6/09 1:20 PM Page 380

Tabl
e 4.
Pane
l Reg
ress
ions
of E
cono
mic
Gro
wth
on
Und
erva
luat
ion
and
Addi
tiona
l Cov
aria
tes,
Dev
elop
ing
Coun
trie
s O
nlya
Reg
ress
ion
Inde
pend
ent v
aria
ble
4-1b
4-2
4-3
4-4
4-5
4-6
4-7
ln in
itia
l inc
ome
−0.0
39**
*−0
.015
***
−0.0
37**
*−0
.033
***
−0.0
36**
*−0
.045
***
−0.0
46**
*(−
5.30
)(−
6.40
)(−
5.17
)(−
4.51
)(−
5.06
)(−
6.65
)(−
4.33
)ln
UN
DE
RV
AL
0.02
6***
0.06
3***
0.02
5***
0.02
1***
0.01
8***
0.01
9***
0.01
6***
(5.8
4)(3
.33)
(4.5
1)(4
.01)
(3.6
6)(4
.06)
(2.8
7)R
ule
of la
wc
0.00
7(0
.010
)G
over
nmen
t con
sum
ptio
n−0
.076
**−0
.042
as p
erce
nt o
f G
DP
d(−
2.00
)(−
1.32
)ln
term
s of
trad
ed0.
013*
0.00
5(1
.93)
(0.7
1)ln
(1
+in
flat
ion
rate
d )−0
.030
***
−0.0
27**
*−0
.023
***
(−3.
23)
(−3.
34)
(−3.
16)
Gro
ss d
omes
tic
savi
ng
0.09
9***
0.12
4***
as p
erce
nt o
f G
DP
d(4
.34)
(4.4
0)A
vera
ge y
ears
of
educ
atio
n 0.
030
×10
0e(0
.87)
No.
of
obse
rvat
ions
790
191
626
546
478
529
335
Sour
ce: A
utho
r’s
regr
essi
ons.
a. T
he d
epen
dent
var
iabl
e is
ann
ual g
row
th in
GD
P pe
r ca
pita
, in
perc
ent.
Obs
erva
tions
are
ave
rage
s ov
er fi
ve-y
ear
peri
ods.
All
regr
essi
ons
incl
ude
time
and
coun
try
fixed
effe
cts.
Rob
ust t
stat
istic
s ar
e in
par
enth
eses
. Ast
eris
ks in
dica
te s
tatis
tical
sig
nific
ance
at t
he *
10 p
erce
nt, *
*5 p
erce
nt, o
r **
*1 p
erce
nt le
vel.
b. B
asel
ine
estim
ate
from
tabl
e 1,
col
umn
1-3.
c. F
rom
Kau
fman
n, K
raay
, and
Mas
truz
zi (
2008
). H
ighe
r va
lues
indi
cate
str
onge
r ru
le o
f la
w.
d. F
rom
Wor
ld B
ank,
Wor
ld D
evel
opm
ent I
ndic
ator
s.e.
Fro
m B
arro
and
Lee
(20
00).
11472-07_Rodrik_rev2.qxd 3/6/09 1:20 PM Page 381

382 Brookings Papers on Economic Activity, Fall 2008
law”), government consumption, the external terms of trade, inflation,human capital (average years of education), and saving rates.15 One limita-tion here is that data for many of the standard growth determinants are notavailable over long stretches of time, so that many observations are lost asregressors are added. For example, the “rule of law” index starts only in1996. Therefore, rather than include all the additional regressors simulta-neously, which would reduce the sample size excessively, I tried variouscombinations, dropping those variables that seem to enter insignificantlyor cause too many observations to be lost.
The bottom line is that including these additional regressors does notmake much difference to the coefficient on UNDERVAL. The estimatedcoefficient ranges somewhat widely (from a high of 0.063 to a low of0.016) but remains strongly significant throughout, with the t statisticnever falling below 2.8. The variation in these estimates seems to derive inany case as much from changes in the sample as from the effect of thecovariates. Indeed, given the range of controls considered and the signifi-cant changes in sample size (from a low of 191 to a high of 790), therobustness of the central finding on undervaluation is quite striking. Notein particular that UNDERVAL remains strong even when the regressioncontrols for changes in the terms of trade or government consumption (orboth together), or for saving rates, three variables that are among the maindrivers of the real exchange rate (see below).
Robustness: Cross-Sectional Regressions
As a final robustness check, I ran cross-sectional regressions using thefull sample in an attempt to identify the growth effects of undervaluationsolely through differences across countries. The dependent variable here isthe growth rate of each country averaged over a twenty-five-year period(1980–2004). Undervaluation is similarly averaged over the same quartercentury, and initial income is GDP per capita in 1980. Regressors includeall the covariates considered in table 4 (except for the terms of trade) alongwith dummies for developing country regions as defined by the World Bank.
The results (table 5) are quite consistent with those in the vast empiricalliterature on cross-national growth. Economic growth over long timehorizons tends to increase with human capital, quality of institutions, and
15. The data source for most of these variables is the World Bank’s World DevelopmentIndicators. Data for the “rule of law” come from the World Bank governance dataset (Kauf-mann, Kraay, and Mastruzzi, 2008), and those for human capital (years of education) fromBarro and Lee (2000).
11472-07_Rodrik_rev2.qxd 3/6/09 1:20 PM Page 382

Tabl
e 5.
Cros
s-Se
ctio
nal R
egre
ssio
ns o
f Eco
nom
ic G
row
th o
n U
nder
valu
atio
n an
d O
ther
Var
iabl
esa
Reg
ress
ion
Inde
pend
ent v
aria
ble
5-1
5-2
5-3
5-4
5-5
5-6
5-7
ln in
itia
l inc
omeb
−0.0
14**
*−0
.013
***
−0.0
13**
*−0
.016
***
−0.0
18**
*−0
.017
***
−0.0
13**
*(−
4.20
)(−
3.59
)(−
3.51
)(−
6.18
)(−
6.00
)(−
7.74
)(−
6.80
)ln
UN
DE
RV
AL
0.02
2***
0.02
1***
0.02
0***
0.02
2***
0.02
1***
0.02
0***
0.01
9***
(5.9
5)(4
.45)
(4.3
2)(5
.31)
(4.9
3)(5
.12)
(5.3
2)A
vera
ge y
ears
of
educ
atio
n ×
100
0.25
0**
0.21
0*0.
224*
0.14
30.
114
(2.0
6)(1
.67)
(1.7
5)(1
.57)
(1.1
8)R
ule
of la
w0.
019*
**0.
021*
**0.
020*
**0.
020*
**0.
020*
**0.
020*
**0.
021*
**(8
.19)
(8.0
9)(6
.40)
(8.2
8)(6
.91)
(7.3
4)(7
.90)
Gov
ernm
ent c
onsu
mpt
ion
as p
erce
nt o
f G
DP
−0.0
60*
−0.0
63*
(−1.
82)
(−1.
89)
ln (
1 +
infl
atio
n ra
te)
−0.0
08(−
0.92
)G
ross
dom
esti
c sa
ving
as
perc
ent o
f G
DP
0.07
2***
0.07
0***
0.05
3***
(3.5
2)(3
.12)
(3.9
3)S
ub−S
ahar
an A
fric
a du
mm
y−0
.004
−0.0
14**
*−0
.009
**(−
0.87
)(−
3.28
)(−
2.08
)L
atin
Am
eric
a du
mm
y0.
002
−0.0
06−0
.002
(0.3
5)(−
0.16
)(−
0.43
)A
sia
dum
myc
0.00
0−0
.009
**−0
.001
(0.0
6)(−
2.22
)(0
.16)
R2
0.57
0.56
0.57
0.68
0.69
0.55
0.48
No.
of
obse
rvat
ions
104
102
102
102
104
147
155
Sour
ce: A
utho
r’s
regr
essi
ons.
a. T
he d
epen
dent
var
iabl
e is
ave
rage
ann
ual g
row
th in
inco
me
per
capi
ta o
ver
1980
–200
4. W
orld
reg
ions
are
as
defin
ed b
y th
e W
orld
Ban
k. R
obus
t tst
atis
tics
are
in p
aren
-th
eses
. Ast
eris
ks in
dica
te s
tatis
tical
sig
nific
ance
at t
he *
10 p
erce
nt, *
*5 p
erce
nt, o
r **
*1 p
erce
nt le
vel.
b. I
nitia
l inc
ome
is G
DP
per
capi
ta in
198
0.c.
“A
sia”
is E
ast A
sia
and
Sout
h A
sia.
11472-07_Rodrik_rev2.qxd 3/6/09 1:20 PM Page 383

saving, and to decrease with government consumption and inflation. TheAfrica dummy tends to be negative and statistically significant. Interest-ingly, the Asia dummy is negative and significant in one regression thatcontrols for saving rates (column 5-6) and not in the otherwise identicalregression that does not (column 5-7). Most important for purposes of thispaper, the estimated coefficient on UNDERVAL is highly significant andvirtually unchanged in all these specifications, fluctuating between 0.019and 0.022. It is interesting—and comforting—that these coefficient esti-mates and those obtained from the panel regressions are so similar.
Given the difficulty of controlling for all the country-specific determi-nants of growth, there are good reasons to distrust estimates from cross-sectional regressions of this kind. That is why panels with fixed effects aremy preferred specification. Nevertheless, the results in table 5 represent auseful and encouraging robustness check.
Causality
Another possible objection to these results is that the relationship theycapture is not truly causal. The real exchange rate is the relative price oftradables to nontradables in an economy and as such is an endogenousvariable. Does it then make sense to put it (or some transformation) on theright-hand side of a regression equation and talk about its effect on growth?Perhaps it would not in a world where governments did not care about thereal exchange rate and left it to be determined purely by market forces. Butwe do not live in such a world: except in a handful of developed countries,most governments pursue a variety of policies with the explicit goal ofaffecting the real exchange rate. Fiscal policies, saving incentives (or dis-incentives), capital account policies, and interventions in currency marketsare part of the array of such policies. In principle, moving the real exchangerate requires changes in real quantities, but economists have long knownthat even policies that affect only nominal magnitudes can do the trick—for a while. One of the key findings of the open-economy macroeconomicliterature is that except in highly inflationary environments, nominalexchange rates and real exchange rates move quite closely together. EduardoLevy-Yeyati and Federico Sturzenegger have recently shown that steril-ized interventions can and do affect the real exchange rate in the short tomedium term.16 Therefore, interpreting the above results as saying some-thing about the growth effects of different exchange rate managementstrategies seems plausible.
384 Brookings Papers on Economic Activity, Fall 2008
16. Levy-Yeyati and Sturzenegger (2007).
11472-07_Rodrik_rev2.qxd 3/6/09 1:20 PM Page 384

Of course, one still has to worry about the possibility of reverse causa-tion and about omitted variables bias. The real exchange rate may respondto a variety of shocks besides policy shocks, and these may confound theinterpretation of δ. The inclusion of some of the covariates considered intables 4 and 5 serves to diminish concern on this score. For example, anautonomous reduction in government consumption or an increase in domes-tic saving will both tend to produce a real depreciation, ceteris paribus. Tothe extent that such policies are designed to move the real exchange rate inthe first place, they are part of what I have in mind when I talk of “a policyof undervaluation.” But to the extent they are not, the results in tables 4and 5 indicate that undervaluation is associated with faster economicgrowth even when those policies are controlled for.
A more direct approach is to treat UNDERVAL explicitly as an endoge-nous regressor; this is done in table 6. Note first that a conventional instru-mental variables approach is essentially ruled out here, because it isdifficult to think of exogenous regressors that influence the real exchangerate without plausibly also having an independent effect on growth. I willreport results of regressions on the determinants of UNDERVAL in table10; all of the regressors used there have been used as independent variablesin growth regressions. Here I adopt instead a dynamic panel approach usingthe generalized method of moments (GMM) as the estimation method.17
These models use lagged values of regressors (in levels and in differences)as instruments for right-hand-side variables and allow lagged endogenous(left-hand-side) variables as regressors in short panels.18 Table 6 presentsresults for both the “difference” and the “system” versions of GMM. Asbefore, the estimated coefficients on UNDERVAL are positive and statisti-cally significant for the developing countries (if somewhat at the lower endof the range reported earlier). They are not significant for the developedcountries. Hence, when UNDERVAL is allowed to be endogenous, theresulting pattern of estimated coefficients is quite in line with the resultsreported above, which is reassuring.
It is worth reflecting on the sources of endogeneity bias a bit more.Many of the plausible sources of bias that one can think of would induce anegative relationship between undervaluation and growth, not the positiverelationship I have documented. So to the extent that endogenous mecha-nisms are at work, it is not clear that they generally create a bias that works
DANI RODRIK 385
17. I follow here the technique of Arellano and Bond (1991) and Blundell and Bond(1998).
18. See Roodman (2006) for an accessible user’s guide.
11472-07_Rodrik_rev2.qxd 3/6/09 1:20 PM Page 385

Tabl
e 6.
Gen
eral
ized
Met
hod
of M
omen
ts E
stim
ates
of t
he E
ffec
t of U
nder
valu
atio
n on
Gro
wth
a
Ful
l sam
ple
Dev
elop
ed e
cono
mie
s on
lyD
evel
opin
g ec
onom
ies
only
Tw
o-st
epT
wo-
step
Tw
o-st
epT
wo-
step
Tw
o-st
epT
wo-
step
Inde
pend
ent v
aria
ble
diff
eren
cesy
stem
diff
eren
cesy
stem
diff
eren
cesy
stem
Lag
ged
grow
th0.
187*
**0.
308*
**0.
273*
**0.
271*
**0.
200*
**0.
293*
**(4
.39)
(5.4
5)(5
.34)
(4.4
8)(3
.95)
(4.5
5)ln
init
ial i
ncom
e−0
.038
***
0.00
1−0
.043
***
−0.0
16**
*−0
.037
***
−0.0
06**
(−4.
86)
(1.1
7)(−
5.21
)(−
4.11
)(−
4.72
)(−
2.34
)ln
UN
DE
RV
AL
0.01
10.
011*
*0.
017
0.00
50.
014*
*0.
013*
*(1
.74)
(2.1
4)(1
.55)
(0.6
0)(2
.28)
(2.2
6)N
o. o
f co
untr
ies
156
179
7989
112
125
Ave
rage
no.
of
6.04
6.27
6.22
5.18
6.07
5.29
obse
rvat
ions
pe
r co
untr
yH
anse
n te
st o
f 0.
067
0.10
10.
893
0.76
20.
332
0.25
3ov
erid
enti
fyin
g re
stri
ctio
ns, p
> χ
2
Sour
ce: A
utho
r’s
regr
essi
ons.
a. T
he d
epen
dent
var
iabl
e is
ann
ual g
row
th in
GD
P pe
r ca
pita
, in
perc
ent.
Obs
erva
tions
are
ave
rage
s ov
er fi
ve-y
ear
peri
ods.
Res
ults
are
gen
erat
ed u
sing
the
xtab
ond2
com
-m
and
in S
tata
, with
sm
all s
ampl
e ad
just
men
t for
sta
ndar
d er
rors
, for
war
d or
thog
onal
dev
iatio
ns, a
nd a
ssum
ing
exog
enei
ty o
f ini
tial i
ncom
e an
d tim
e du
mm
ies
(see
Roo
dman
2005
). A
ll re
gres
sion
s in
clud
e tim
e fix
ed e
ffec
ts. E
xtre
me
obse
rvat
ions
are
exc
lude
d as
not
ed i
n ta
ble
1. R
obus
t t
stat
istic
s ar
e in
par
enth
eses
. Ast
eris
ks i
ndic
ate
stat
istic
alsi
gnifi
canc
e at
the
*10
perc
ent,
**5
perc
ent,
or *
**1
perc
ent l
evel
.
11472-07_Rodrik_rev2.qxd 3/6/09 1:20 PM Page 386

DANI RODRIK 387
against my findings. Economic growth is expected to cause a real appreci-ation on standard Balassa-Samuelson grounds (which I control for byusing UNDERVAL). Shocks that cause a real depreciation tend to be shocksthat are bad for growth on conventional grounds—a reversal in capitalinflows or a terms of trade deterioration, for example. Good news about thegrowth prospects of an economy is likely to attract capital inflows and thusbring about a real appreciation. So, on balance, it is unlikely that the posi-tive coefficients reported here result from the reverse effect of growth onthe real exchange rate.
Evidence from Growth Accelerations
A different way to look at the cross-national evidence is to examinecountries that have experienced noticeable growth accelerations and askwhat happened to UNDERVAL before, during, and after these episodes.This way of parsing the data throws out a lot of information but has thevirtue that it focuses attention on a key question: have those countries thatmanaged to engineer sharp increases in economic growth done so on theback of undervalued currencies?19
Ricardo Hausmann, Lant Pritchett, and I identified 83 distinct instancesof growth acceleration in which annual growth in GDP per capita rose by 2 percentage points or more and the spurt was sustained for at least eightyears.20 Figure 4 shows the average values of UNDERVAL in each of theseepisodes for a 21-year window centered on the year of the acceleration(the 10-year periods before and after the acceleration plus the year of theacceleration). The figure shows some interesting patterns in the trend ofUNDERVAL but is especially telling with respect to the experience of dif-ferent subgroups.
For the full sample of growth accelerations, a noticeable, if moderate,decline in overvaluation occurs in the decade before the onset of the growthspurt. The increase in UNDERVAL is on the order of 10 percentage pointsand is sustained into the first five years or so of the episode. Since thesegrowth accelerations include quite a few rich countries in the 1950s and1960s, figure 4 also shows results for only those growth accelerations inthe sample that occurred after 1970. There is a much more distinct trend inUNDERVAL for this subsample: the growth spurt takes place after a decadeof steady increase in UNDERVAL and immediately after the index reachesits peak value (at an undervaluation of 10 percent). Finally, figure 4 also
19. A similar exercise was carried out for a few, mostly Asian, countries by Hausmann(2006).
20. Hausmann, Pritchett, and Rodrik (2005).
11472-07_Rodrik_rev2.qxd 3/6/09 1:20 PM Page 387

shows results for the Asian and Sub-Saharan African countries separately.The Asian countries reveal the most pronounced trend, with an averageundervaluation of more than 20 percent at the start of the growth accelera-tion. Moreover, the undervaluation is sustained into the growth episode,and in fact it increases further by the end of the decade. In the Africangrowth accelerations, in contrast, the image is virtually the mirror oppo-site. Here the typical growth acceleration takes place after a decade ofincreased overvaluation, and its timing coincides with the peak of the over-valuation. As is well known, the Asian growth accelerations have provedsignificantly more impressive and lasting than African ones. The contrast-ing behavior of the real exchange rate may offer an important clue as to thesources of the difference.
Size of the Tradable Sector as the Operative Channel
The real exchange rate is a relative price, the price of tradable goods interms of nontradable goods:
An increase in RER enhances the relative profitability of the tradablesector and causes it to expand (at the expense of the nontradable sector).
RER P PT N= .
388 Brookings Papers on Economic Activity, Fall 2008
Source: Author’s calculations.
–20
–10
10
Mean undervaluation (percent)
Asia
Post-1970 only
Full sample
Sub-Saharan Africa
–6 0 5
Years before or after growth acceleration
20
0
–9 –8 –7 –5 –4 –3 –2 –1 1 2 3 4 6 7 8 9
Figure 4. Relative Timing of Undervaluations and Growth Accelerations
11472-07_Rodrik_rev2.qxd 3/6/09 1:20 PM Page 388

I now provide some evidence that these compositional changes in thestructure of economic activity are an important driving force behind theempirical regularity I have identified. I show two things in particular. First,undervaluation has a positive effect on the relative size of the tradable sector, and especially of industrial economic activities. Second, the effectsof the real exchange rate on growth operate, at least in part, through theassociated change in the relative size of tradables. Countries where under-valuation induces resources to move toward tradables (again, mainlyindustry) grow more rapidly.
The first four columns in table 7 report standard panel regressionswhere five-year-average sectoral shares (in real terms) are regressed onincome, a complete set of fixed effects, and my measure of undervaluation.I initially lumped agriculture and industry together in constructing thedependent variable, since both are nominally tradable, but as these regres-sions show, they have quite a different relationship with real exchangerates. Whether measured by its share in GDP or its share in employment,the relative size of industry depends strongly and positively on the degreeof undervaluation as shown in the first two columns.21 Simply put, under-valuation boosts industrial activities. Agriculture, on the other hand, doesnot have a positive relationship with undervaluation. Its GDP share actu-ally depends negatively on the undervaluation measure (third column).This difference may reflect the prevalence of quantitative restrictions inagricultural trade, which typically turn many agricultural commodities intonontradables at the margin.
The last two columns of table 7 report results of two-stage panel growthregressions (with, as before, a full set of fixed effects) that test whether theeffect of undervaluation on growth operates through its impact on the rela-tive size of industry. The strategy consists of identifying whether the com-ponent of industrial shares directly “caused” by undervaluation—that is,industrial shares as instrumented by undervaluation—enters positively andsignificantly in the growth regressions. The answer is affirmative. Theseresults indicate that undervaluation causes resources to move toward indus-try and that this shift in resources in turn promotes economic growth.22
DANI RODRIK 389
21. Blomberg, Frieden, and Stein (2005) report some evidence that countries with largermanufacturing sectors have greater difficulty in sustaining currency pegs. But it is not imme-diately evident which way this potential reverse causality cuts.
22. See also the supporting evidence in Rajan and Subramanian (2006), who find thatreal appreciations induced by aid inflows have adverse effects on the relative growth rate ofexporting industries as well as on the growth rate of the manufacturing sector as a whole.Rajan and Subramanian argue that this is one of the more important reasons why aid fails to
11472-07_Rodrik_rev2.qxd 3/6/09 1:20 PM Page 389

Tabl
e 7.
Pane
l Reg
ress
ions
Est
imat
ing
the
Effe
ct o
f Und
erva
luat
ion
on T
rada
bles
a
Dep
ende
nt v
aria
ble
Agr
icul
ture
Indu
stry
sha
reIn
dust
ry s
hare
inA
gric
ultu
resh
are
inG
row
thG
row
thIn
depe
nden
t var
iabl
ein
GD
Pem
ploy
men
tsh
are
in G
DP
empl
oym
ent
(TSL
S es
tim
atio
n)b
(TSL
S es
tim
atio
n)b
ln c
urre
nt in
com
e0.
079*
**0.
025
−0.1
10**
*−0
.128
***
(9.9
9)(1
.51)
(−12
.50)
(−4.
94)
ln in
itia
l inc
ome
−0.1
34**
*−0
.071
***
(−8.
33)
(−4.
39)
ln U
ND
ER
VA
L0.
024*
**0.
042*
**−0
.016
**−0
.010
(3.6
2)(4
.87)
(−2.
25)
(−0.
48)
Indu
stry
sha
re in
GD
P1.
716*
**(7
.59)
Indu
stry
sha
re in
em
ploy
men
t1.
076*
**(6
.15)
No.
of
obse
rvat
ions
985
469
985
469
938
459
Sour
ce: A
utho
r’s
regr
essi
ons.
a. O
bser
vatio
ns o
f th
e de
pend
ent
vari
able
are
five
-yea
r av
erag
es. A
ll re
gres
sion
s in
clud
e tim
e an
d co
untr
y fix
ed e
ffec
ts. R
obus
t t
stat
istic
s ar
e in
par
enth
eses
. Ast
eris
ksin
dica
te s
tatis
tical
sig
nific
ance
at t
he *
10 p
erce
nt, *
*5 p
erce
nt, o
r **
*1 p
erce
nt le
vel.
b. I
ndus
try
shar
es, i
n co
nsta
nt lo
cal c
urre
ncy
units
, are
reg
ress
ed o
n ln
UN
DE
RV
AL
,ln
inco
me,
and
lagg
ed ln
inco
me
in th
e fir
st s
tage
of
a tw
o-st
age
leas
t squ
ares
(T
SLS)
regr
essi
on.
11472-07_Rodrik_rev2.qxd 3/6/09 1:20 PM Page 390

The estimates in table 7 also provide a useful check on the quantitativemagnitudes involved. They break the undervaluation-growth relationshipinto two separate links, one from undervaluation to the size of tradables(that is, industry) and the other from the size of industry to economic growth.If undervaluation has a potent effect on growth, that is because each ofthese two links is estimated to be quite strong. A 50 percent undervalua-tion is estimated to increase the share of industry in total employment by2.1 percentage points (0.042 × 0.50), which is quite large given that thetypical share of industry in total employment in developing countries isaround 20 percent. An increase in the industrial employment share is inturn estimated to raise growth roughly one for one.
Understanding the Importance of the Real Exchange Rate
Why might an increase in the relative price of tradables and the associatedexpansion of tradable economic activities have a causal impact on eco-nomic growth, as my results suggest? There is no generally accepted the-ory that would explain these regularities in the data.23 Any such theorywould have to explain why tradables are “special” from the standpoint ofgrowth. That is the sense in which my results open an important windowon the mechanisms behind the growth process. If the role that tradablesplay in driving growth can be understood, it may be possible to identifypolicies that will promote (and those that will hamper) growth.
Although any of a large number of stories might account for the role oftradables, two clusters of explanations deserve attention in particular. Onefocuses on weaknesses in the contracting environment, and the other onmarket failures in modern industrial production. Both types of explanationhave been common in the growth and development literature, but in thepresent context something more is needed. One has to argue that tradables
DANI RODRIK 391
induce growth in recipient countries. Gluzmann, Levy-Yeyati, and Sturzenegger (2007), bycontrast, find little role for the tradables channel and argue that real undervaluations promotegrowth through redistributions of income that raise domestic saving (and ultimately invest-ment). However, their argument seems to require that the current account be invariant to thereal exchange rate, which is contradicted by considerable evidence. See also Galvarriato andWilliamson (2008) on the role played by favorable relative prices in the rapid industrializa-tion of Latin American countries such as Brazil and Mexico after 1870, and Freund andPierola (2008) on the significance of currency undervaluation in stimulating export surges.
23. In Rodrik (1986) I argued that manipulating the real exchange rate could play awelfare-enhancing role if this served to improve the internal terms of trade of sectors subjectto dynamic learning externalities. Gala (2007) suggests that undervaluation is good forgrowth because activities subject to increasing returns tend to be located in the tradablerather than the nontradable sector.
11472-07_Rodrik_rev2.qxd 3/6/09 1:20 PM Page 391

392 Brookings Papers on Economic Activity, Fall 2008
24. North (1990); Acemoglu, Johnson, and Robinson (2001).
suffer disproportionately from these shortcomings, so that absent a com-pensating policy, developing economies devote too few of their resourcesto tradables and thus grow less rapidly than they should. Real undervalua-tion can then act as a second-best mechanism for spurring growth oftradables and for generating more rapid overall economic growth.
The two clusters of explanations are represented schematically in fig-ures 5 and 6. I discuss them in turn in the rest of this section. The mechan-ics of how changes in relative prices can generate growth in the presenceof sectorally differentiated distortions is discussed in the following section.
Explanation 1: Bad Institutions “Tax” Tradables More
The idea that poor institutions keep incomes low and explain, at least inpart, the absence of economic convergence is by now widely accepted.24
Weak institutions reduce the ability of private investors to appropriate thereturns on their investment through a variety of mechanisms: contractual
Figure 5. Undervaluation as a Second-Best Mechanism for Alleviating Institutional Weakness
Source: Author’s model described in the text.
AND
Increase in price oftradables relative to
nontradables
Increase in output oftradables relative to
nontradables
Increase in economicgrowth because…
…tradables are morecomplex and moredemanding of thecontracting environment
…the contractingenvironment is poor,depressing investmentand productivity
11472-07_Rodrik_rev2.qxd 3/6/09 1:20 PM Page 392

DANI RODRIK 393
Figure 6. Undervaluation as a Second-Best Mechanism for Alleviating Market Failure
Source: Author’s model described in the text.
AND
Increase in price oftradables relative to
nontradables
Increase in output oftradables relative to
nontradables
Increase in economicgrowth because…
…tradables are moresubject to these marketimperfections
…information and co-ordination externalitiesare rampant
incompleteness, hold-up problems, corruption, lack of property rights, andpoor contract enforcement. The resulting wedge between private and socialreturns in turn blunts the incentives for capital accumulation and techno-logical progress alike.
Now suppose that this problem is more severe in tradables than in non-tradables. This is a plausible supposition since production systems tend tobe more complex and roundabout in tradables, placing a greater premiumon the ability to specify contracts and on reliable third-party enforcementof contracts. A barber needs to rely on little more than a few tools, a chair,and his skill and ingenuity to sell his services. A manufacturing firm needsthe cooperation of multitudes of suppliers and customers, plus financialand legal support. When the institutions that foster these relationships areweak, the result is to impose a higher “tax” on tradables—especially mod-ern tradables. This results in both a static misallocation of resources thatpenalizes tradables, and a dynamic distortion in the form of investment intradables that is lower than socially optimal. An increase in the relativeprice of tradables can improve static efficiency and enhance growth insecond-best fashion by eliciting more investment in tradables at the margin(as I will show in the following section).
11472-07_Rodrik_rev2.qxd 3/6/09 1:20 PM Page 393

A fair amount of empirical work, both across countries and acrossindustries, presents suggestive evidence on the disproportionate cost borneby tradables—as a whole or in part—in the presence of weak institutions:
—Across countries, lower quality of institutions (as measured byindices of the rule of law, contract enforcement, or control of corruption)is associated with lower ratios of trade to GDP (“openness”).25
—Across different categories of tradable goods, more “institution-intensive” tradables are prone to larger effects. Pierre-Guillaume Méonand Khalid Sekkat find that the relationship they identify holds for manu-factured exports but not for nonmanufactured exports; Priya Ranjan andJae Young Lee find that the effect is stronger for differentiated goods thanfor homogeneous goods.26
—Institutional weakness interacts with the contract intensity of goodsto play a role in determining comparative advantage. Andrei Levchenko;Daniel Berkowitz, Johannes Moenius, and Katharina Pistor; and NathanNunn find that countries with poor institutions have comparative disad-vantage in products that are more institutions-intensive, more complex, ormore relationship-intensive.27
To provide more direct evidence, I used unpublished data kindly pro-vided by Nathan Nunn to compare directly the contract-intensiveness oftradables and nontradables. Nunn investigated whether differences in insti-tutional quality across countries help determine patterns of comparativeadvantage.28 He reasoned that relationship-specific intermediate inputs,defined as inputs that are not sold on exchanges or do not have referenceprices,29 are more demanding of the contractual environment. Nunn usedmeasures of relationship specificity for tradables alone, since his main con-cern was with comparative advantage. But he collected similar data for ser-vices as well, which are what I use to carry out the tradables-nontradablescomparison.
The top panel of table 8 shows the shares of intermediate goods that arerelationship-specific in tradables and nontradables industries. (These num-bers are based on the U.S. input-output tables.) At first sight, these numbersseem to conflict with what my argument requires, in that they show that the
394 Brookings Papers on Economic Activity, Fall 2008
25. See, for example, Anderson and Mercouiller (2002), Rodrik, Subramanian, andTrebbi (2004), Rigobon and Rodrik (2005), Méon and Sekkat (2006), Berkowitz, Moenius,and Pistor (2006), and Ranjan and Lee (2004).
26. Méon and Sekkat (2006); Ranjan and Lee (2004).27. Levchenko (2004); Berkowitz, Moenius, and Pistor (2006); Nunn (2007).28. Nunn (2007).29. As in Rauch (1999).
11472-07_Rodrik_rev2.qxd 3/6/09 1:20 PM Page 394

inputs used in tradables are less relationship-specific, and hence less demand-ing of the institutional environment. But this is misleading because it over-looks the fact that tradables tend to have much higher intermediate inputshares in gross output. This is shown in the middle panel of the table (thistime relying on Brazil’s input-output tables). Putting the two piecestogether yields the results in the bottom panel of table 8, which show that,on balance, tradable goods rely on relationship-specific inputs to a muchgreater extent. The numbers for the two sets of goods differ by a factor ofbetween two and three.
Hence the evidence that institutional and contracting shortcomings, thebane of every developing society, impose a higher “tax” on the tradablesector than on the nontradable sector is fairly compelling. But if this storyis correct, its implications should also be evident in the growth regressions.Specifically, the growth impact of undervaluation should be greater inthose countries where this “taxation” is greatest, namely, the countries
DANI RODRIK 395
Table 8. Illustrative Calculations on the Importance of Relationship Specificity ofInputs for Traded and Nontraded GoodsPercent
Tradables Nontradables
Tradables use intermediate goods that tend to be less relationship specific . . .
Share of intermediates not sold on exchanges 49.6 75.1and not reference-priceda
Share of intermediates not sold on exchangesa 87.3 96.4
. . . but tradables rely more on intermediate inputs . . .
Share of intermediates in total outputb 64.3 35.1Share of interindustry sales in total outputb 58.4 29.4
. . . so, on balance, relationship-specific intermediate goods account for a muchlarger share of output in tradables.
Share in gross output of intermediates not 17.9 7.5sold on exchanges and not reference-pricedc
Share in gross output of intermediates 31.5 9.7not sold on exchangesc
Source: Author’s calculations.a. Unweighted averages, from the U.S. input-output tables, calculated using data provided by Nathan
Nunn, based on Nunn (2007).b. From the Brazilian input-output tables for 1996, available on the website of the OECD Directorate
for Science, Technology, and Industry (www.oecd.org/sti).c. Sums of the products of the underlying data in the top two panels weighted by U.S. value-added shares.
11472-07_Rodrik_rev2.qxd 3/6/09 1:20 PM Page 395

396 Brookings Papers on Economic Activity, Fall 2008
30. For the latest version of these indices see Kaufmann, Kraay, and Mastruzzi (2008).
with the weakest institutions. Although GDP per capita does track institu-tional quality closely, it is not a perfect proxy. So the question is whetherone can detect the differential impact in settings with different institutionalenvironments.
To attempt this more direct test, I used the World Bank governanceindices to divide the countries in the full sample into three subgroups basedon their “adjusted” institutional quality (above average, around average,and below average).30 The exercise was conducted as follows. For eachcountry I took a simple average of the World Bank’s rule of law, govern-ment effectiveness, regulatory quality, and corruption indices over 1996–2004 (starting from the earliest year for which these indices are available).I then regressed these indices on log GDP per capita, generating a pre-dicted value based on this cross section. Taking the difference betweenactual and predicted values, I ranked countries according to their “adjusted”levels of institutional quality. I then divided the sample into three sub-groups of equal size.
The middle three columns of table 9 show the results of my benchmarkspecification when the regression is run for each subgroup separately. (Forcomparison, the first column repeats the baseline results from column 1-1of table 1.) The results are broadly consistent with the theoretical expecta-tion. The positive effect of undervaluation is strongest in the below-averagegroup and virtually nil in the above-average group. In other words, wheninitial income is taken into account, undervaluation works most potently inthose countries where institutions perform the least well. In the last columnin table 9, I instead interact dummies for the subgroups with UNDERVAL(taking the above-average group as the omitted category), and the resultsare very similar.
The analytics of how institutional weakness interacts with undervalua-tion to influence growth will be developed further in the next section. Butfirst I turn to the second category of explanations.
Explanation 2: Market Failures Predominate in Tradables
The second hypothesis for why the real exchange rate matters is thattradables are particularly prone to the market failures with which develop-ment economists have long been preoccupied. A short list of such marketfailures would include
—learning externalities: valuable technological, marketing, and otherinformation spills over to other firms and industries;
11472-07_Rodrik_rev2.qxd 3/6/09 1:20 PM Page 396

—coordination externalities: getting new industries off the groundrequires lumpy and coordinated investments upstream, downstream, orsideways;
—credit market imperfections: entrepreneurs cannot finance worth-while projects because of limited liability and asymmetric information;
—wage premiums: monitoring, turnover, and other costs keep wagesabove market-clearing levels, and employment remains low.
These and similar problems can plague all kinds of economic activity indeveloping countries, but arguably their effects are felt much more acutelyin tradables. If so, output and investment in tradables will be suboptimal.A real depreciation would promote capacity expansion in tradables andincrease growth. Note that once again this is a second-best argument forundervaluation. First-best policy would consist of identifying distinct mar-ket failures and applying the appropriate Pigovian remedies. Undervalua-tion is in effect a substitute for industrial policy.
What is the evidence? By their very nature, the types of market failureslisted above are difficult to identify, and so it is practically impossible toprovide direct evidence that some kinds of goods are more prone to thesemarket failures than others. But the basic hypothesis is quite plausible, anda close look at the processes behind economic development yields plenty
DANI RODRIK 397
Table 9. Institutional Quality and the Impact of Undervaluation on Growtha
Countries where institutional quality is
Above Around Below Independent variable average average average
ln initial income −0.031*** −0.036*** −0.017** −0.060*** −0.031***(−6.67) (−5.59) (−2.32) (−4.73) (−6.90)
ln UNDERVAL 0.017*** 0.004 0.022*** 0.028*** 0.005(5.21) (1.17) (3.98) (4.42) (1.45)
ln UNDERVAL × 0.019***around-average (2.86)institutions
ln UNDERVAL × 0.019**below-average (2.36)institutions
No. of observations 1,303 513 434 356 1,303
Source: Author’s regressions.a. The dependent variable is annual growth in GDP per capita, in percent. Observations are five-year averages.
All regressions include time and country fixed effects. Robust t statistics are in parentheses. Asterisks indicatestatistical significance at the *10 percent, **5 percent, or ***1 percent level.
Baseline (all
countries)
Interactionswith groupdummies
(allcountries)
11472-07_Rodrik_rev2.qxd 3/6/09 1:20 PM Page 397

of indirect and suggestive evidence. Economic development consists ofstructural change, investment in new activities, and the acquisition of newproductive capabilities. As countries grow, the range of tradable goods thatthey produce expands.31 Rich countries are rich not just because they pro-duce traditional goods in greater abundance, but also because they producedifferent goods.32 The market failures listed above are likely to be muchmore severe in new lines of production—those needed to increase economy-wide productivity—than in traditional ones. New industries require “costdiscovery,”33 learning-by-doing, and complementary economic activities toget established. They are necessarily risky and lack track records. Thesefeatures make them fertile ground for learning and coordination externali-ties. The recent findings of Caroline Freund and Martha Pierola are partic-ularly suggestive in this connection: currency undervaluation appears toplay a very important role in inducing producers from developing coun-tries to enter new product lines and new markets, and this seems to be theprimary mechanism through which they generate export surges.34
Discussion
Unfortunately, it is not easy to distinguish empirically between thetwo broad hypotheses I have outlined. In principle, if one could identifythe goods that are most affected by each of these two categories ofimperfections—contractual and market failures—one could run a horserace between the two hypotheses by asking which goods among them aremore strongly associated with economic growth. Nunn’s data are a usefulbeginning for ranking goods by degree of contract intensity.35 Perhaps ananalogous set of rankings could be developed for market failures using thecommodity categorization in Hausmann and Rodrik,36 which are looselybased on the prevalence of learning externalities. But ultimately I doubtthat one can make a sufficiently fine and reliable distinction among goodsto allow discrimination between the two stories in a credible manner. Richcountries differ from poor countries both because they have better institu-tions and because they have learned how to deal with market imperfec-tions. Producers of tradable goods in developing economies suffer on bothcounts.
398 Brookings Papers on Economic Activity, Fall 2008
31. Imbs and Wacziarg (2003).32. Hausmann, Hwang, and Rodrik (2007).33. Hausmann and Rodrik (2003).34. Freund and Pierola (2008).35. Nunn (2007).36. Hausmann and Rodrik (2003).
11472-07_Rodrik_rev2.qxd 3/6/09 1:20 PM Page 398

A Simple Model of Real Exchange Rates and Growth
I argued in the previous section that when tradables are affected dispropor-tionately by preexisting distortions, a real depreciation can be good forgrowth. I now develop a simple model to illustrate the mechanics behindthis hypothesis. I will consider an economy in which there exist “taxes” onboth the tradable and the nontradable sectors that drive a wedge betweenthe private and the social marginal benefits. When the tax on tradables islarger (in ad valorem terms) than the tax on nontradables, the economy’sresources will be misallocated, the tradable sector will be too small, andgrowth will be suboptimal. Under these circumstances a real depreciationcan promote growth.
Consumption and Growth
In the model, consumers consume a single final good, which as shownbelow is produced using a combination of tradable and nontradable inputs.Their intertemporal utility function is time-separable and logarithmic andtakes the form
where ct is consumption at time t and ρ is the discount rate. Maximizingutility subject to an intertemporal budget constraint yields the familiargrowth equation
where r is the real interest rate (or the marginal product of capital). Theeconomy’s growth is increasing in r, and this is the feature that I willexploit in the rest of this section.
Production
I assume that the economy produces the single final good using tradableand nontradable goods (yT and yN, respectively) as the sole inputs. Produc-tion of the final good (y) is a Cobb-Douglas aggregate of these two inputs.In addition, to allow for endogenous growth (while maintaining perfectcompetition throughout), I assume that capital produces external economiesin the production of the final good. With these assumptions, the productionfunction of the representative final-good producer can be written as follows:
( ) ,4 1 1y k y yT N= − −ϕ α α
( ) ,3 �c c rt t t= − ρ
u c e dtt t= −∫ ln ,ρ
DANI RODRIK 399
11472-07_Rodrik_rev2.qxd 3/6/09 1:20 PM Page 399

where k is the economy’s capital stock at any point in time (treated asexogenous by each final-goods producer), and α and 1 − α are the shares oftradable and nontradable goods, respectively, in the production costs of thefinal good (0 < α < 1). For convenience, I choose the exponent on k to be a parameter (1 − ϕ) that will make aggregate output linear in capital—as will be shown shortly—and which therefore considerably simplifies thecomparative dynamics of the model. I also omit time subscripts to simplifythe notation.
Tradables and nontradables are in turn produced using capital alone andsubject to decreasing returns to scale. These production functions take thefollowing simple form:
where kT and kN denote the capital stock employed in the tradables and thenontradables sectors, respectively; θT is the share of total capital employedin tradables and 0 < θT < 1; and 0 < ϕ < 1. To justify decreasing returns tocapital in the sectoral production functions (that is, ϕ < 1), one can supposethat there are other, sector-specific factors of production employed in eachsector that are fixed in supply.
By definition, nontradables that are used as inputs in the final-goodssector can only be sourced domestically. And since nontradables do notenter consumption directly,
With respect to tradables, I allow the economy to receive a transfer fromthe rest of the world (or to make a transfer to it). Let b stand for the magni-tude of the inward transfer. Then the material-balances equation in trad-ables is given by
It will be more convenient to express b as a share γ of total domesticdemand for tradables. That is, b = γyT. The equality between demand andsupply in tradables then becomes
( ) .81
1 −=
γq yT T
q b yT T+ = .
( ) .7 q yN N=
( ) ,6 1q A k A kN N N N T= = −( )[ ]ϕϕθ
( )5 q A k A kT T T T T= = ( )ϕϕθ
400 Brookings Papers on Economic Activity, Fall 2008
11472-07_Rodrik_rev2.qxd 3/6/09 1:20 PM Page 400

When the economy makes an outward transfer, γ will be negative. I willuse γ as a shifter that alters the equilibrium value of the real exchange rate.
Using equations 4 through 8, one can express the aggregate productionfunction as
Net output y differs from gross output insofar as the economy makes a pay-ment to the rest of the world for the transfer b (or receives a payment fromit if b is negative). I express this payment in general form, assuming thatit is a share σ of the transfer’s contribution to gross output; that is, σ ×(∂y/∂b) × b = σ × (∂y/∂yT) × γyT = σ × (α/yT)y × γ yT = σαγy. Net output yequals y − σαγy = (1 − σαγ)y. Therefore, using equation 9,
This way of expressing the payment for the transfer allows a wide varietyof scenarios. The transfer’s contribution to net output is maximized whenσ = 0, that is, when b is a pure transfer (a grant). The contribution becomessmaller as σ increases.
Note that the production function ends up being of the Ak type, that is,linear in capital. This results in an endogenous growth model with no tran-sitional dynamics. The (net) marginal product of capital r is ∂y/∂−
k, or
which is independent of the capital stock but depends on the allocation ofcapital between tradables and nontradables, θT, as well as on the net valueof the transfer from abroad.
Since the economy’s growth rate will depend on r, it is important toknow precisely how r depends on θT. Log-differentiating equation 11 withrespect to θT yields
with
In other words, the return to capital is maximized when the share of thecapital stock that the economy allocates to tradables (θT) is exactly equal to
d r
d T
T
ln.
θθ α= ⇔ =0
d r
d T T T
ln,
θαθ
αθ
∝ ⎛⎝⎜
⎞⎠⎟
− −−
⎛⎝⎜
⎞⎠⎟
⎡⎣⎢
⎤⎦⎥
1
1
( )11 1 1 111
r A AT N T T= −( ) −( ) −( )−−
−( )σαγ γ θ θαα α αϕ
α ϕϕ,
( )10 1 1 111�y A AT N T T= −( ) −( ) −( )−
−−(σαγ γ θ θα
α α αϕα))ϕ
k .
( ) .9 1 111
y A A kT N T T= −( ) −( )−−
−( )γ θ θαα α αϕ
α ϕ
DANI RODRIK 401
11472-07_Rodrik_rev2.qxd 3/6/09 1:20 PM Page 401

the input share of tradables in final production (α). This rate of return, andultimately the economy’s growth rate, will be suboptimal when tradablesreceive a smaller share of capital. I next analyze the circumstances underwhich such inefficiencies obtain.
Sectoral Allocation of Capital
The allocation of capital between the tradable and the nontradable sec-tors will depend both on the relative demand for the two goods and on therelative profitability of producing them. Consider the latter first. In equilib-rium, capital will be allocated such that its (private) value marginal productis equalized in the two sectors. As discussed previously, I presume thateach sector faces an “appropriability” problem, arising from either institu-tional weaknesses or market failures or both. I model this by assuming thatprivate producers can retain only a share 1 − τi of the value of producingeach good i = T, N. In other words, τT and τN are the effective “tax” ratesfaced by producers in their sector. Let the relative price of tradables pT /pN
be denoted by R. This is my index of the “real exchange rate.” The equalitybetween the value marginal product of capital in the two sectors can thenbe expressed as
which simplifies to
This is a supply-side relationship which says that the share of capital allo-cated to tradables increases with the relative profitability of the tradablesector. This relative profitability in turn increases with R, τN, and AT anddecreases with τT and AN (remember that ϕ − 1 < 0). The SS schedule ispositively sloped between θT and R, as is shown in figure 7.
Now turn to the demand side. In view of the Cobb-Douglas form of theproduction function for the final good, the demands for the two intermediategoods are given by
Taking the ratios of these two expressions and rearranging terms,
αγ γ
θ ϕy p y p q p A kT T T T T T T= =
−⎛⎝⎜
⎞⎠⎟
=−
⎛⎝⎜
⎞⎠⎟ ( )1
1
1
1
11 1−( ) = = = −( )[ ]α θ ϕy p y p q p A kN N N N N N T .
( ) .121
1
1
11
θθ
ττ
ϕ
T
T
N
T
N
TR
A
A−⎛⎝⎜
⎞⎠⎟
=−−
⎛⎝⎜
⎞⎠⎟
−
1 1 11 1−( ) ( ) = −( ) −( )[ ]− −τ ϕ θ τ ϕ θϕ ϕ
T T T N N TR A k A k ,
402 Brookings Papers on Economic Activity, Fall 2008
11472-07_Rodrik_rev2.qxd 3/6/09 1:20 PM Page 402
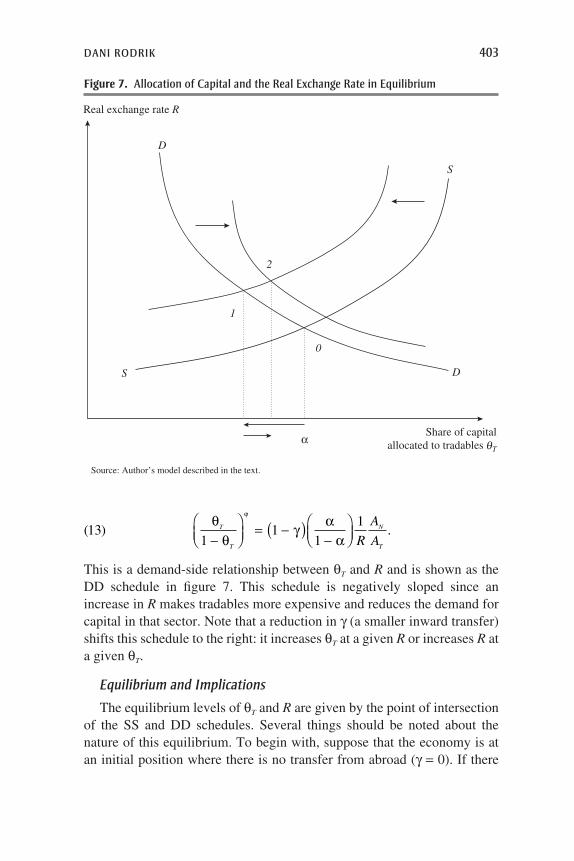
This is a demand-side relationship between θT and R and is shown as theDD schedule in figure 7. This schedule is negatively sloped since anincrease in R makes tradables more expensive and reduces the demand forcapital in that sector. Note that a reduction in γ (a smaller inward transfer)shifts this schedule to the right: it increases θT at a given R or increases R ata given θT.
Equilibrium and Implications
The equilibrium levels of θT and R are given by the point of intersectionof the SS and DD schedules. Several things should be noted about thenature of this equilibrium. To begin with, suppose that the economy is atan initial position where there is no transfer from abroad (γ = 0). If there
( ) .131
11
1θθ
γ αα
ϕ
T
T
N
TR
A
A−⎛⎝⎜
⎞⎠⎟
= −( )−
⎛⎝⎜
⎞⎠⎟
DANI RODRIK 403
Real exchange rate R
Source: Author’s model described in the text.
Share of capitalallocated to tradables T
D
DS
S
1
2
0
α θ
Figure 7. Allocation of Capital and the Real Exchange Rate in Equilibrium
11472-07_Rodrik_rev2.qxd 3/6/09 1:20 PM Page 403

are no appropriability problems in either of the intermediate-goods sectors,such that τT = τN = 0, then it is relatively easy to confirm that the equilib-rium is one where θT = α (point 0 in figure 7). This ensures that the returnsto capital and growth are maximized. Now suppose that τT and τN are posi-tive but that their magnitude is identical (τT = τN > 0). One can see fromequation 11 that the equilibrium remains unaffected. As long as the distor-tion affects tradables and nontradables equally, θT remains at its growth-maximizing level.
Things are different when τT ≠ τN. Suppose that τT > τN, which I haveargued is the more likely situation. Relative to the previous equilibrium,this entails a leftward shift in the SS schedule. In the new equilibrium(point 1 in figure 7), θT is lower (and R is higher). Because θT < α, theeconomy pays a growth penalty as a result of the tradable sector being toosmall. Note that the endogenous real depreciation plays a compensatoryrole, but only a partial one.
Starting from this new equilibrium (where τT > τN and θT < α), it isentirely possible that a negative transfer would improve the economy’sgrowth. That is because a reduction in γ leads to an increase in the equilib-rium level of the real exchange rate and moves θT closer to α. In terms offigure 7, a fall in γ shifts the DD schedule to the right and causes both Rand θT to rise (point 2). Whether growth also increases ultimately remainsuncertain, because the reduction in γ also has a direct negative effect ongrowth (see equation 11). But if σ is sufficiently high, one can always gen-erate cases where this is on balance growth promoting. In such cases, thereal depreciation generated by the negative external transfer becomes asecond-best instrument to offset the growth costs of the differential distor-tion of tradables.
Policy Implications
The main point of this paper can be stated succinctly. Tradable economicactivities are “special” in developing countries. These activities suffer dis-proportionately from the institutional and market failures that keep coun-tries poor. A sustained real depreciation increases the relative profitabilityof investing in tradables and acts in second-best fashion to alleviate theeconomic cost of these distortions. It speeds up structural change in thedirection that promotes growth. That is why episodes of undervaluation arestrongly associated with more rapid economic growth.
Are my quantitative estimates of the growth effects of undervaluationplausible? For developing countries my estimates of δ range from 0.063
404 Brookings Papers on Economic Activity, Fall 2008
11472-07_Rodrik_rev2.qxd 3/6/09 1:20 PM Page 404

(albeit in a highly reduced sample, in column 4-2 of table 4) to 0.012 (inthe last column of table 3) and cluster around 0.020. If one takes the lastnumber as a central estimate, the implication is that an undervaluation of,say, 20 percent boosts annual growth by 0.4 percentage point. Can thechannel I have focused on deliver effects of this magnitude? Rememberthat the mechanism that generates growth here is structural change. So theanswer obviously depends on the size of the gaps between social marginalproducts in tradable (especially industrial) and nontradable sectors. I havealready given some reasons for why these gaps can be quite large. A longtradition of thought on economic dualism in developing countries takes thepersistence of large differences between marginal products in the advanced,“formal” parts of the economy (such as industry) and marginal productselsewhere as the very essence of underdevelopment. Detailed industry stud-ies carried out recently by the McKinsey Global Institute provide somestriking, if indirect, evidence on the magnitude of these gaps.37 They findthat productivity levels in the most advanced firms and sectors of develop-ing economies are not too distant from the frontier in the rich economies.Since average productivity in these developing economies is a fraction ofthat prevailing in the rich economies, the implied intersectoral differenceswithin developing economies are quite large. This paper’s distinctionbetween tradable and nontradable sectors maps directly onto this dualisticstructure, since most (nonagricultural) tradable activities in a typical devel-oping country are formal whereas most nontradable activities (except forpublic services) are informal.38
There is an obvious parallel between the argument I have developedhere and the results presented in a recent paper by Eswar Prasad, RaghuramRajan, and Arvind Subramanian,39 who note that fast-growing developingcountries have tended to run current account surpluses rather than deficits.
DANI RODRIK 405
37. See, for example, McKinsey Global Institute (2001, 2003).38. A simple finger exercise can be helpful here. Denote the productivity premium in
industry by ψ and the share of employment in industry by λI. Some straightforward algebracan establish that the growth effect of reallocating labor to industry in the amount dλI isgiven by growth impact = [ψ/(1+ψλI)]dλI. A reasonable assumption on the industrial pre-mium (at the margin) would be that ψ = 50 percent, and a typical industrial share of labor isλI = 0.20. Note from the second column of table 7 that a 20 percent undervaluation would beassociated with an increase of 0.84 percentage point in industry’s share of total employment(dλI = 0.042 × 0.2 = 0.0084). Applying the formula, an increase in the industrial labor shareof 0.84 percentage point would be expected to generate additional growth equal to 0.38 per-centage point, which is virtually identical to the result obtained using the coefficient esti-mates from the growth regressions (0.4 percentage point).
39. Prasad, Rajan, and Subramanian (2007).
11472-07_Rodrik_rev2.qxd 3/6/09 1:20 PM Page 405

This runs counter to the view that developing countries are constrained byexternal finance, and to the presumption that capital inflows supplementdomestic saving and enable more rapid growth.40 One of the explanationsthat Prasad and his coauthors advance is that capital inflows cause a realappreciation and hurt growth through reduced investment incentives inmanufactures. They also provide some evidence on this particular channel.Even though these authors focus on the costs of overvaluation rather thanthe benefits of undervaluation, their concern with the real exchange raterenders their paper complementary to this one.
A maintained hypothesis in this paper thus far has been that the realexchange rate is a policy variable. Strictly speaking, this is not true, as thereal exchange rate is a relative price and is determined in general equilib-rium along with all other relative prices. But governments have a variety ofinstruments at their disposal to influence the real exchange rate, and theevidence is that they use them. Maintaining a real undervaluation requireseither higher saving relative to investment or lower expenditure relative toincome. This can be achieved through fiscal policy (a large structural sur-plus), incomes policy (redistribution of income to high savers through realwage compression), saving policy (compulsory saving schemes and pen-sion reform), capital account management (taxation of capital accountinflows, liberalization of capital outflows), or currency intervention (build-ing up foreign exchange reserves). Experience in East Asia as well as else-where (for example, Tunisia) shows that countries that target the realexchange rate (that is, follow a policy of “competitiveness”) can have afair amount of success.
Table 10 presents some systematic evidence on how policy choices feedinto the real exchange rate and undervaluation. The table shows the resultsof regressing UNDERVAL on a series of independent variables in a panelwith fixed effects. The baseline specification (column 10-1) includes thefollowing regressors: the terms of trade, government consumption (as apercent of GDP), an index of capital account liberalization (KAOPEN), anda set of dummy variables capturing the exchange rate regime in force.KAOPEN comes from Menzie Chinn and Hiro Ito and is a continuousvariable designed to capture the extent and intensity of capital controls.41 Itincreases as a country’s capital account regime becomes more liberal.The exchange rate regime indicators come from Ethan Ilzetzki, CarmenReinhart, and Kenneth Rogoff and are entered as separate dummy vari-
406 Brookings Papers on Economic Activity, Fall 2008
40. Rodrik and Subramanian (forthcoming).41. Chinn and Ito (2006).
11472-07_Rodrik_rev2.qxd 3/6/09 1:20 PM Page 406

ables identifying distinct regimes.42 So, for example, the “Crawl or man-aged float” dummy takes the value of one when the country is classified ashaving a currency regime with a preannounced crawl, a de facto crawl, or amanaged float and is zero otherwise. The excluded category is the set ofobservations with a rigid exchange rate (a fixed peg, a currency board, or acurrency union).43 The remaining columns in the table augment the base-
DANI RODRIK 407
42. Ilzetzki, Reinhart, and Rogoff (2008). The data for the indicators are available atwww.economics.harvard.edu/faculty/rogoff/files/ERA_Background_Material.htm.
43. “Crawl or managed float” corresponds to categories 2 and 3 in Ilzetzki, Reinhart,and Rogoff’s (2008) “coarse” classification, and “rigid” corresponds to their category 1.
Table 10. Panel Regressions of Undervaluation on Selected Policy and Other Variablesa
Regression
Independent variable 10-1 10-2 10-3 10-4
ln terms of trade −0.139*** −0.164*** −0.167*** −0.115***(−3.52) (−4.14) (−4.09) (−2.86)
Government consumption −0.793*** −0.680*** −0.519*** −0.045as share of GDP (−4.35) (−3.53) (−2.61) (−0.23)
Capital account openness −0.031*** −0.029*** −0.026*** −0.031***(KAOPEN)b (−5.70) (−5.39) (−4.56) (−5.98)
Exchange rate regime dummies:c
Crawl or managed float 0.068*** 0.065*** 0.065*** 0.071***(4.86) (4.64) (4.47) (4.87)
Float 0.027 0.028 0.058* 0.026(0.85) (0.89) (1.83) (0.82)
Currency in free fall 0.161*** 0.158*** 0.172*** 0.162***(4.97) (4.86) (5.21) (4.80)
Dual market with missing 0.065 0.067 0.063 0.021parallel market data (1.12) (1.19) (1.17) (0.39)
Gross domestic saving as 0.310*** 0.355*** 0.492***share of GDP (3.55) (3.80) (5.10)
FDI inflows as share of GDP −0.376*** −0.382***(−3.11) (−3.04)
ln (1 + inflation rate) 0.039(1.10)
No. of observations 3,153 3,147 2,994 2,757
Source: Author’s regressions.a. The dependent variable is ln UNDERVAL. All regressions include time and country fixed effects.
See the text for definitions and sources of capital account openness and classifications of exchange rateregimes. Extreme observations are excluded as noted in table 1. Robust t statistics are in parentheses.Asterisks indicate statistical significance at the *10 percent, **5 percent, or ***1 percent level.
b. From Chinn and Ito (2006). Higher values indicate greater openness.c. Classification of exchange rate regimes is from Ilzetzki, Reinhart, and Rogoff (2008). Countries with
a rigid exchange rate regime are the excluded category.
11472-07_Rodrik_rev2.qxd 3/6/09 1:20 PM Page 407

408 Brookings Papers on Economic Activity, Fall 2008
44. Ilzetzki, Reinhart, and Rogoff (2008). It is worth noting that the growth effects ofundervaluation, as detailed earlier in the paper, do not seem to depend on the type ofexchange rate regime the country happens to have at the time. In particular, the resultsremain unchanged when the countries whose currencies are in a “free fall” are excludedfrom the sample.
line specification by adding domestic saving, inflation, and foreign directinvestment (FDI) inflows as regressors. Among the variables considered,government consumption, capital account openness, the exchange rateregime, and inflation can be considered direct policy variables, whereasdomestic saving and FDI inflows are indirectly affected by policy. Theterms of trade are exogenous for most countries but are expected to have adeterminate effect on the real exchange rate.
The results in table 10 are quite strong. As expected, positive terms oftrade shocks are bad for undervaluation. More important for the presentdiscussion, fiscal policies, capital account policies, and the choice ofexchange rate regime all have quite significant effects on undervaluation.Increases in government consumption tend to produce a real appreciation,as do policies that liberalize the capital account. The coefficient on KAOPENimplies that going from the Chinese level of capital account restrictions in2006 (KAOPEN = −1.13) to the Mexican level (KAOPEN = 1.19) is asso-ciated with a decrease in UNDERVAL of around 7 percent. (Note that theseeffects are identified in these regressions from the variation within coun-tries, not across countries, and are therefore more credible.) The operativechannel, presumably, is that opening up the capital account invites inflows,which in turn cause the real appreciation.
The coefficients on the exchange rate regime dummies are also quiteinteresting The central finding here is that regimes in which the exchangerate is actively managed—crawling pegs or managed floats—producelarger undervaluations than do fixed-rate regimes, with a difference ofaround 7 percent. Unsurprisingly, periods in which the currency is in a“free fall” as defined by Ilzetzki, Reinhart, and Rogoff are also good forundervaluation.44 A pure float, by contrast, does not seem to generate sig-nificantly different levels of undervaluation.
The results in table 10 also show that high saving is good for underval-uation, whereas FDI inflows are bad. Both of these findings are in line withtheoretical expectations. Finally, the level of inflation does not have astrong association with undervaluation, indicating that undervaluationneed not come at the cost of inflation. In short, policy choices, particularlyon the fiscal and external fronts, matter, and they do so in the manner sug-gested by straightforward economic logic.
11472-07_Rodrik_rev2.qxd 3/6/09 1:20 PM Page 408

It is worth emphasizing once again that real exchange rate policy is onlysecond-best in the context of the economic distortions discussed here. Oneof the side effects of maintaining a real overvaluation is a surplus on thecurrent account (or a smaller deficit). This obviously has effects on othercountries. Were all developing countries to follow this strategy, the devel-oped countries would have to accept living with the corresponding deficits.This is a major issue of contention in U.S.-China economic relations atpresent. Moreover, when some developing countries (for example, theAsian economies) follow this strategy while others do not, the growthpenalty incurred by the latter becomes larger as their tradable sector shrinkseven further under the weight of Asian competition.
Conceptually, the first-best strategy is clear, if fraught with practicaldifficulties: eliminating the institutional and market failures in questionwould do away with the policy dilemmas. But recommending this strategyamounts to telling developing countries that the way to get rich is to getrich. A more practical approach is to subsidize tradables productiondirectly, rather than indirectly through the real exchange rate. Real under-valuation is equivalent to a production subsidy plus a consumption tax ontradables. The direct strategy of subsidizing production of tradablesachieves the first without the second. Hence it avoids the spillovers toother countries. A production subsidy on tradables boosts exports andimports simultaneously (provided the exchange rate, or wages, or both areallowed to adjust to equilibrate the current account balance) and thereforeneed not come with a trade surplus.
However, it goes without saying that production subsidies have theirown problems. Fine-tuning them to address the perceived distortionswould amount to a highly intricate form of industrial policy, with all theattendant informational and rent-seeking difficulties. Even if that were nota problem, the strategy would come into conflict with existing WorldTrade Organization rules that prohibit export subsidies. There is, it appears,no easy alternative to exchange rate policy.
ACKNOWLEDGMENTS I thank the Center for International Develop-ment for partial financial support, and David Mericle, Olga Rostapshova, andAndres Zahler for expert research assistance. I also thank Nathan Nunn forsharing his unpublished data with me. The paper has greatly benefited from thecomments of Ricardo Hausmann, Arvind Subramanian, John Williamson,Michael Woodford, Peter Henry, and other Brookings panelists.
DANI RODRIK 409
11472-07_Rodrik_rev2.qxd 3/6/09 1:20 PM Page 409

References
Acemoglu, Daron, Simon Johnson, and James A. Robinson. 2001. “The ColonialOrigins of Comparative Development: An Empirical Investigation.” AmericanEconomic Review 91, no. 5 (December): 1369–1401.
Aguirre, Álvaro, and César Calderón. 2005. “Real Exchange Rate Misalignmentsand Economic Performance.” Working Paper 315. Santiago: Central Bank ofChile, Economic Research Division (April).
Anderson, James E., and Douglas Mercouiller. 2002. “Insecurity and the Pattern ofTrade: An Empirical Investigation.” Review of Economics and Statistics 84,no. 2: 342–52.
Arellano, Manuel, and Stephen Bond. 1991. “Some Tests of Specification for PanelData: Monte Carlo Evidence and an Application to Employment Equations.”Review of Economic Studies 58, no. 2: 277–97.
Barro, Robert J., and Jong-Wha Lee. 2000. “International Data on EducationalAttainment: Updates and Implications.” CID Working Paper 42. Center forInternational Development, Harvard University (April).
Berkowitz, Daniel, Johannes Moenius, and Katharina Pistor. 2006. “Trade, Law, andProduct Complexity.” Review of Economics and Statistics 88, no. 2: 363–73.
Bhalla, Surjit S. Forthcoming. “Second among Equals: The Middle Class King-doms of India and China.” Washington: Peterson Institute for InternationalEconomics.
Blomberg, S. Brock, Jeffry Frieden, and Ernesto Stein. 2005. “Sustaining FixedRates: The Political Economy of Currency Pegs in Latin America.” Journal ofApplied Economics 8, no. 2 (November): 203–25.
Blundell, Richard, and Stephen Bond. 1998. “Initial Conditions and MomentRestrictions in Dynamic Panel Data Models.” Journal of Econometrics 87,no. 1: 115–43.
Chinn, Menzie, and Hiro Ito. 2006. “What Matters for Financial Development?Capital Controls, Institutions, and Interactions.” Journal of DevelopmentEconomics 81, no. 1 (October): 163–92.
Dollar, David. 1992. “Outward-Oriented Developing Economies Really Do GrowMore Rapidly: Evidence from 95 LDCs, 1976–1985.” Economic Developmentand Cultural Change 40, no. 3: 523–44.
Easterly, William. 2005. “National Policies and Economic Growth: A Re-appraisal.” In Handbook of Economic Growth, edited by Philippe Aghion andSteven Durlauf. Amsterdam: Elsevier.
Elbadawi, Ibrahim. 1994. “Estimating Long-Run Equilibrium Real ExchangeRates.” In Estimating Equilibrium Exchange Rates, edited by John Williamson.Washington: Institute for International Economics.
Fischer, Stanley. 1993. “The Role of Macroeconomic Factors in Growth.” Journalof Monetary Economics 32, no. 3: 485–512.
Freund, Caroline, and Martha Denisse Pierola. 2008. “Export Surges: The Powerof a Competitive Currency.” World Bank, Washington (October).
410 Brookings Papers on Economic Activity, Fall 2008
11472-07_Rodrik_rev2.qxd 3/6/09 1:20 PM Page 410

Gala, Paulo. 2007. “Real Exchange Rate Levels and Economic Development: The-oretical Analysis and Econometric Evidence.” Cambridge Journal of Econom-ics 32, no. 2: 273–88.
Galvarriato, Aurora Gómez, and Jeffrey G. Williamson. 2008. “Was It Prices, Pro-ductivity or Policy? The Timing and Pace of Latin American Industrializationafter 1870.” NBER Working Paper 13990. Cambridge, Mass.: National Bureauof Economic Research (May).
Gluzmann, Pablo, Eduardo Levy-Yeyati, and Federico Sturzenegger. 2007.“Exchange Rate Undervaluation and Economic Growth: Díaz Alejandro (1965)Revisited.” Kennedy School of Government, Harvard University.
Hausmann, Ricardo. 2006. “Economic Growth: Shared Beliefs, Shared Dis-appointments?” Speech at the G-20 Seminar on Economic Growth in Pretoria,South Africa, August 2005. CID Working Paper 125. Center for InternationalDevelopment, Harvard University (June).
Hausmann, Ricardo, and Dani Rodrik. 2003. “Economic Development as Self-Discovery.” Journal of Development Economics 72, no. 2 (December): 603–33.
Hausmann, Ricardo, Jason Hwang, and Dani Rodrik. 2007. “What You ExportMatters.” Journal of Economic Growth 12, no. 1: 1–25.
Hausmann, Ricardo, Lant Pritchett, and Dani Rodrik. 2005. “Growth Accelera-tions.” Journal of Economic Growth 10, no. 4: 303–29.
Heston, Alan, Robert Summers, and Bettina Aten. 2006. “Penn World Table Ver-sion 6.2.” Center for International Comparisons of Production, Income andPrices at the University of Pennsylvania (September). pwt.econ.upenn.edu/php_site/pwt_index.php.
Ilzetzki, Ethan O., Carmen M. Reinhart, and Kenneth Rogoff. 2008. “ExchangeRate Arrangements Entering the 21st Century: Which Anchor Will Hold?”University of Maryland and Harvard University.
Imbs, Jean, and Romain Wacziarg. 2003. “Stages of Diversification.” AmericanEconomic Review 93, no. 1 (March): 63–86.
International Comparison Program. 2007. “2005 International Comparison Pro-gram Preliminary Results.” World Bank, Washington (December 17).
Johnson, Simon, Jonathan Ostry, and Arvind Subramanian. 2007. “The Prospectsfor Sustained Growth in Africa: Benchmarking the Constraints.” IMF WorkingPaper 07/52. Washington: International Monetary Fund (March).
Kaufmann, Daniel, Aart Kraay, and Massimo Mastruzzi. 2008. “Governance Mat-ters VII: Aggregate and Individual Governance Indicators, 1996–2007.” WorldBank Policy Research Working Paper 4654. Washington: World Bank (June 24).
Levchenko, Andrei. 2004. “Institutional Quality and International Trade.” IMFWorking Paper 04/231. Washington: International Monetary Fund.
Levy-Yeyati, Eduardo, and Federico Sturzenegger. 2007. “Fear of Floating inReverse: Exchange Rate Policy in the 2000s.” World Bank, Harvard University,and Universidad Torcuato di Tella.
McKinsey Global Institute. 2001. India: The Growth Imperative. San Francisco:McKinsey & Co.
DANI RODRIK 411
11472-07_Rodrik_rev2.qxd 3/6/09 1:20 PM Page 411

———. 2003. Turkey: Making the Productivity and Growth Breakthrough. Istan-bul: McKinsey & Co.
Méon, Pierre-Guillaume, and Khalid Sekkat. 2006. “Institutional Quality andTrade: Which Institutions? Which Trade?” Working Paper DULBEA 06-06.RS.Brussels: Université Libre de Bruxelles, Department of Applied Economics.
North, Douglass C. 1990. Institutions, Institutional Change and Economic Perfor-mance. Cambridge University Press.
Nunn, Nathan. 2007. “Relationship-Specificity, Incomplete Contracts and thePattern of Trade.” Quarterly Journal of Economics 122, no. 2 (May): 569–600.
Prasad, Eswar, Raghuram G. Rajan, and Arvind Subramanian. 2007. “ForeignCapital and Economic Growth.” BPEA, no. 1: 153–209.
Rajan, Raghuram G., and Arvind Subramanian. 2006. “Aid, Dutch Disease, andManufacturing Growth.” Peterson Institute for International Economics,Washington (August).
Ranjan, Priya, and Jae Young Lee. 2004. “Contract Enforcement and the Volumeof International Trade in Different Types of Goods.” University of California,Irvine.
Rauch, James E. 1999. “Networks versus Markets in International Trade.” Journalof International Economics 48, no. 1: 7–35.
Razin, Ofair, and Susan M. Collins. 1997. “Real Exchange Rate Misalignmentsand Growth.” Georgetown University.
Rigobon, Roberto, and Dani Rodrik. 2005. “Rule of Law, Democracy, Opennessand Income: Estimating the Interrelationships.” Economics of Transition 13,no. 3 (July): 533–64.
Rodriguez, Francisco, and Dani Rodrik. 2001. “Trade Policy and EconomicGrowth: A Skeptic’s Guide to the Cross-National Evidence.” NBER Macro-economics Annual 2000 15:261–325.
Rodrik, Dani. 1986. “ ‘Disequilibrium’ Exchange Rates as IndustrializationPolicy.” Journal of Development Economics 23, no. 1 (September): 89–106.
———. 2005. “Why We Learn Nothing from Regressing Economic Growth onPolicies.” Kennedy School of Government, Harvard University (March).ksghome.harvard.edu/∼drodrik/policy%20regressions.pdf.
Rodrik, Dani, and Arvind Subramanian. Forthcoming. “Why Did Financial Glob-alization Disappoint?” International Monetary Fund Staff Papers.
Rodrik, Dani, Arvind Subramanian, and Francesco Trebbi. 2004. “InstitutionsRule: The Primacy of Institutions over Geography and Integration in EconomicDevelopment.” Journal of Economic Growth 9, no. 2 (June): 131–65.
Roodman, David. 2005. “xtabond2: Stata Module to Extend Xtabond DynamicPanel Data Estimator.” Center for Global Development, Washington. econpapers.repec.org/software/bocbocode/s435901.htm.
———. 2006. “How to Do xtabond2: An Introduction to ‘Difference’ and ‘Sys-tem’ Gmm in Stata.” Working Paper 103. Center for Global Development,Washington (December).
Sachs, Jeffrey, and Andrew Warner. 1995. “Economic Reform and the Process ofGlobal Integration.” BPEA, no. 1: 1–95.
412 Brookings Papers on Economic Activity, Fall 2008
11472-07_Rodrik_rev2.qxd 3/6/09 1:20 PM Page 412

413
Comments and Discussion
COMMENT BYPETER BLAIR HENRY The real exchange rate is one of the mostimportant prices in open-economy macroeconomics. In this paper DaniRodrik provides a provocative analysis that links this key variable to theall-important issue of economic growth. In the process of doing so, thepaper delivers at least two central messages. The first is empirical: realexchange rates exert a significant impact on economic growth, and devel-oping countries that systematically undervalue their currencies in realterms grow faster than their counterparts that do not. The second messageprovides a theoretical explanation for the first: developing countries thatsystematically undervalue grow faster because undervaluation raises therate of return to capital employed in the production of tradable goods byan amount sufficient to overcome the wide range of institutional problemsthat disproportionately affect that sector of the economy.
The paper contains a lot of fertile ground for a discussant: measure-ment issues, modeling assumptions, and implications of undervaluation forinflation and monetary policy, to name a few. My comment will focus pri-marily on the persuasiveness of the main results, their interpretation, andtheir policy implications.
Regarding the results, let me first offer a general statement about thepaper’s empirical contribution. In their article on exchange rate regimesand growth, Eduardo Levy Yeyati and Federico Sturzenegger demonstratethat developing countries with fixed nominal exchange rate regimes grow,on average, 0.7 percentage point per year more slowly than other coun-tries.1 In theory, a fixed nominal exchange rate need not translate into a
1. Eduardo Levy Yeyati and Federico Sturzenegger, “To Float or to Fix: Evidence onthe Impact of Exchange Rate Regimes on Growth,” American Economic Review 93, no. 4(2003): 1173–93.
11472-07b_Rodrik Comments_rev.qxd 3/6/09 1:21 PM Page 413

real overvaluation, but with rare exceptions that is the reality, so Rodrik’sdocumentation that countries with overvalued currencies grow moreslowly is not particularly novel.
What is new about the Rodrik paper is the demonstration that coun-tries with undervalued currencies systematically grow faster. A 50 per-cent undervaluation is associated with a five-year growth rate that is about1.3 percentage points above the country-specific mean.
The paper tries hard to disentangle causation from correlation. Buildingon his previous work with Ricardo Hausmann and Lant Pritchett,2 Rodrikexamines the relationship between growth accelerations and undervalua-tion, asking the following question: Conditional on experiencing a growthacceleration, have countries done so with the help of an undervalued cur-rency? In general, I applaud the use of an episodic approach to the data, butthe problem with the question being asked is that it selects episodes onthe basis of the desired outcome. Cutting the data in this way throws outimportant information about the number of times that large real deprecia-tions occurred without any growth acceleration following in due course.
Instead of picking growth acceleration episodes and examining under-valuation relative to the beginning of those episodes, why not turn theanalysis on its head? Using an appropriate definition, one could identifyepisodes of large sustained real depreciations and examine the time pathof economic growth and the allocation of real resources after the onset ofthe depreciation. If the real exchange rate does indeed exert a causal effect,one should observe faster growth and a shift of resources from the non-tradable to the tradable sector.
Cutting the data on episodes of large real depreciations would alsofocus attention on the important issue of levels versus changes. It is onething to say that countries grow faster when the real exchange rate is atan undervalued level. But such a statement reveals nothing about theoptimal way to change the real exchange rate to reach a level at whichrobust growth can occur. It would be useful to know if the way in whicha country’s currency becomes undervalued seems to matter for subsequentgrowth outcomes.
For instance, the words “nominal devaluation” do not appear anywherein the paper. Yet a large nominal devaluation is one of the quickest waysof achieving a real depreciation. In fact, Ilan Goldfajn and Rodrigo Valdeshave shown that most countries exit episodes of overvaluation not through
414 Brookings Papers on Economic Activity, Fall 2008
2. Ricardo Hausmann, Lant Pritchett, and Dani Rodrik, “Growth Accelerations,”Journal of Economic Growth 10, no. 4 (2005): 303–29.
11472-07b_Rodrik Comments_rev.qxd 3/6/09 1:21 PM Page 414

adjustments in the price level, but through large nominal devaluations ofthe currency.3 Of course, wage and price compression can do the job with-out a devaluation. Disinflation reduces the domestic price level relative tothe international price level, but this process can take a long time and exacta heavy cost in terms of lost output and higher unemployment.
The issue of how to change the real exchange rate raises the question ofwhy undervaluation produces faster growth in the first place. One’s nat-ural inclination is to think that a competitive real exchange rate generatesgrowth through an improvement in the trade balance. But Rodrik arguesthat the statistical relationship he uncovers between undervaluation andgrowth is not simply a story of export-led growth. To explain why under-valuation has an impact on growth, he therefore introduces an intermediategoods version of the dependent economy model. The logic of the modelis straightforward. Absent any frictions, the real exchange rate settles ata level that equalizes the marginal return of resource allocation in the trad-able and the nontradable sectors, thereby maximizing their contributionto growth. Associated with this optimality condition are the fractions ofresources that get devoted to the production of tradable and nontradablegoods.
The story changes in the presence of distortions, and the paper intro-duces two of them: a tax that reduces producers’ rate of return to capitalin the tradable sector, and another tax that reduces the return to capital innontradables. We are told to think of these taxes as proxies for poor insti-tutions. When the institutional tax on tradable and nontradable returns is the same, no real consequences ensue, as the fraction of resourcesdevoted to the tradable sector remains at its growth-maximizing level. Thekey to the model, then, is that the institutional tax on returns in each sectornot be the same. For Rodrik’s story to work, one has to believe that poorinstitutions are much more costly for the producers of traded goods.
It is not clear that this is true across the board. Although it is easy tobelieve that a poor contracting environment hurts manufacturers morethan barbers, the comparison between manufacturing and construction,for example, is less obvious. A major builder relies on many of the samefactors as a manufacturer: suppliers, subcontractors, customers, and finan-cial and legal support. Even if one accepts Rodrik’s story that poor insti-tutions have a disproportionately large negative effect on tradable goods,the analysis comes up flat, because the paper does not provide a way of
COMMENTS and DISCUSSION 415
3. Ilan Goldfajn and Rodrigo Valdes, “The Aftermath of Appreciations,” QuarterlyJournal of Economics 114, no. 1 (1999): 229–62.
11472-07b_Rodrik Comments_rev.qxd 3/6/09 1:21 PM Page 415

quantifying just how important (or trivial) the distortion is for produc-tion over all.
Without a means of quantifying the negative impact of distortions in thecontracting environment (or the positive impact of undervaluation), it isnot clear what policy conclusions to draw from the paper’s results. Moregenerally, although Rodrik demonstrates that temporarily faster growth isone benefit of undervaluation, the paper does not provide a welfare analy-sis. This is important, because undervaluation has costs as well as benefits.To draw reliable policy conclusions, one needs to know more about thecosts of undervaluation and how they compare with the benefits of fastergrowth. There are at least two potential costs of real undervaluation.
First, undervaluation subsidizes producers in the tradable goods sectorat the expense of consumers. In the context of this model, which, as men-tioned, never really discusses the nominal exchange rate, one can thinkof undervaluation as roughly equivalent to a policy of forced saving.Therefore, the critical question is whether one can conclude that fastergrowth in this context is welfare enhancing. In other words, given thepopulation’s rate of time preference, are people made better off by con-suming less today than they would otherwise choose? The answer is farfrom clear, and I would add that this is more than a theoretical consider-ation. If one is considering the impact on growth of a policy change suchas trade liberalization or the removal of capital controls, it is possible towrite down models in which strange, counterintuitive things happen andaggregate welfare falls. But one has to try very hard to do that, becausewhen one moves from a scenario in which people have fewer choices(closed markets) to one where they have more choices (open markets),people are usually made better off. Introducing distortions, on the otherhand, generally reduces utility. In this case the distortion is that real under-valuation interferes with the price signal that drives the relative produc-tion and consumption of tradable and nontradable goods. Although it istrue that the distortion occurs in a second-best world, I do not think onecan conclude that welfare improves. Again, to make that case, one needsto know just how great the benefits of undervaluation are relative to thecosts it imposes.
A second, well-known cost of a real undervaluation is that it gener-ates destabilizing pressure on the balance of payments and attendantinflationary pressure. Suppose that Mexico chooses to undervalue thepeso vis-à-vis the dollar. With Mexico’s nominal exchange rate, in termsof pesos per dollar, set higher than the market clearing rate, Mexico willrun a chronic surplus in tradable goods. Those surpluses will generate a
416 Brookings Papers on Economic Activity, Fall 2008
11472-07b_Rodrik Comments_rev.qxd 3/6/09 1:21 PM Page 416

commensurately large inflow of dollars to the central bank. Since theexchange rate is not allowed to adjust, the quantity of currency in circu-lation will rise in concert with the excess demand for Mexican tradables.If there is no adjustment in the exchange rate, over time the imbalance getsreflected in rising reserves and inflation, unless the central bank is able tosuccessfully sterilize the inflow.
Some of Rodrik’s other research actually highlights the potentially largewelfare cost associated with accumulating excess foreign reserves.4 Sincea policy of undervaluation is isomorphic to a policy of excess reserve accu-mulation, I am surprised that the paper does not try to reconcile the appar-ent inconsistency between the arguments in favor of undervaluation in thispaper with Rodrik’s earlier stance that emerging economies are overaccu-mulating reserves.
It is also worth emphasizing that although small, open economies maysafely ignore the worldwide externalities of their policy choices, thesame cannot be said for large countries. For example, if Barbados wereto choose a policy of grossly undervaluing its currency, it could safelyassume that its policy choice would have a negligible impact on the worldbalance of trade. The same assumption would be invalid for a large coun-try. Furthermore, policies that are benign when implemented by a singlecountry may be harmful if pursued by many countries simultaneously.From an individual country’s point of view, a policy of undervaluationpromotes export growth. But we all know very well the terrible externali-ties associated with a world in which everyone tries to undervalue at once.Whether this is done through a cascading series of competitive devalua-tions or through tighter fiscal policy, the consequences are largely thesame. Rodrik likes to argue that countries need policy space. Such space isoften appropriate and beneficial, but negative externalities of the type justmentioned are precisely the reason we have international organizationsthat try to encourage mutually beneficial exchange rate policies.
Turning from costs back to benefits, one implication of the model is thatan outward transfer depreciates the currency. This real depreciation raisesthe rate of return to capital in the nontradable sector, improves resourceallocation, and therefore acts as a second-best strategy for alleviating theimplicit tax associated with poor institutions. Rodrik justifies this policyprescription on the grounds that foreign capital inflows do not contributeto growth. The support for such a claim comes, in part, from the paper by
COMMENTS and DISCUSSION 417
4. Dani Rodrik, “The Social Cost of Foreign Exchange Reserves,” International Eco-nomic Journal 20, no. 3 (2006): 253–66.
11472-07b_Rodrik Comments_rev.qxd 3/6/09 1:21 PM Page 417

Eswar Prasad, Raghuram Rajan, and Arvind Subramanian that I discussedin these pages about eighteen months ago.5 There I outlined several rea-sons why the data did not support the authors’ claims about the impact offoreign capital on growth.
I will not repeat that discussion today. But I will say that the assertionthat capital inflows do nothing but fuel consumption booms does notstand up to scrutiny. An article I published in the December 2007 issueof the Journal of Economic Literature documents the mounting body ofevidence that foreign resource flows into developing countries reducetheir cost of capital, stimulate investment, and raise GDP per capita.6
Similarly, in a recent working paper, Diego Sasson and I document thelarge, positive impact of capital account liberalization on real wages andproductivity.7
None of this is to say that capital account liberalization is the secret tofaster growth. In fact, I agree that the impact of capital inflows on the realexchange rate can be a major source of concern for small, open economies.Thailand’s struggle with the real appreciation of the baht—roughly 20 per-cent against the dollar in 2006–07—provides an important case in point.Furthermore, I agree with the argument that Rodrik has made elsewhere,that emerging economies tend to rely too heavily on short-term debt. Butif the problem is an overreliance on short-term debt, the real exchange rateis a rather indirect and blunt instrument for dealing with it. The principle ofpolicy targeting suggests that it is much more efficient to address directlythe imperfections in the international financial system that give marketparticipants the incentive to accumulate large quantities of short-term debtthat are privately optimal but carry large negative consequences for thegeneral public.
Rodrik acknowledges that eliminating the institutional and market fail-ures in question would be preferable to adopting policies that drive the realexchange rate away from its equilibrium value. He argues, however, thatencouraging developing countries to improve their institutions amounts totelling them that the way to get rich is to get rich.
418 Brookings Papers on Economic Activity, Fall 2008
5. Eswar Prasad, Raghuram G. Rajan, and Arvind Subramanian, “Foreign Capitaland Economic Growth.” BPEA, no. 1 (2007): 153–209; Peter Blair Henry, “Comment [onPrasad, Rajan, and Subramanian],” BPEA, no. 1 (2007): 217–23.
6. Peter Blair Henry, “Capital Account Liberalization: Theory, Evidence and Specula-tion,” Journal of Economic Literature 45, no. 4 (2007): 887–935.
7. Peter Blair Henry and Diego Sasson, “Capital Account Liberalization, Real Wages,and Productivity,” Working Paper 13880 (Cambridge, Mass.: National Bureau of Eco-nomic Research, 2008).
11472-07b_Rodrik Comments_rev.qxd 3/6/09 1:21 PM Page 418

This line of argument feels paternalistic. A few years ago, economistsengaged in much hand wringing over the problem of “original sin,” withsome claiming that elaborate financial engineering schemes were neededto help developing countries avoid the problem of accumulating dollar-denominated debt.8 Developing countries, it was said, would need decadesto achieve the level of institutional development necessary to enablethem to issue debt denominated in their own currency. I argued that thisview not only was far too pessimistic but implicitly assumed that devel-oping countries are incapable of helping themselves. I also said that oncedeveloping country governments demonstrated a sustained commitmentto sound policies, they would have no trouble issuing local currency-denominated debt.9
Time has been kind to my prediction. A recent report by the Bank forInternational Settlements (BIS) demonstrates just how much progress hasbeen made on the development of local-currency bond markets.10 Accord-ing to the BIS, in 2000 the total stock of international emerging marketbonds outstanding was $498 billion; by 2005 that stock was $618 billion.Subtracting the first number from the second gives a rough estimate of thecumulative amount of new international debt issued by emerging marketsfrom 2000 to 2005: $120 billion.
To gauge just how much the world has changed since 2000, consider theanalogous figures for local-currency-denominated emerging market bonds.The BIS report tells us that at the end of 2000 the total stock of interna-tionally issued emerging market bonds denominated in local currency was$20 billion. By 2006 that stock had grown to $102 billion, which impliesthat emerging markets issued $82 billion in such bonds between 2000 and2006. In other words, almost 70 percent ($82 billion divided by $120 bil-lion) of the internationally issued bonds of emerging market countriesbetween 2000 and 2005 were denominated in local currency. This is aremarkable increase given that the market for such instruments was pre-viously nonexistent.
A big reason behind the shift is the improved macroeconomic environ-ment in emerging markets. In the words of the Committee on the Global
COMMENTS and DISCUSSION 419
8. See, for example, Barry Eichengreen, “Financial Instability,” in Global Crises,Global Solutions, edited by Bjørn Lomborg (Cambridge University Press, 2004).
9. Peter Blair Henry, “Perspective Paper on Financial Instability,” in Global Crises,Global Solutions, edited by Bjørn Lomborg (Cambridge University Press, 2004).
10. Committee on the Global Financial System, “Financial Stability and Local Cur-rency Bond Markets,” CGFS Papers 28 (Basel: Bank for International Settlements, 2007).www.bis.org/publ/cgfs28.htm.
11472-07b_Rodrik Comments_rev.qxd 3/6/09 1:21 PM Page 419

Financial System, “With the support of better domestic macroecono-mic policies, reliance on foreign currency debt has indeed been reducedin almost all emerging market economies. . . . Issuance of local cur-rency bonds has expanded substantially and domestic bond marketshave deepened.”11
Policies matter. There is no inherent conflict between persuading coun-tries not to overvalue their currencies and encouraging them to enhancetheir institutional environments. Improving the material existence of mil-lions of people around the world inevitably requires that governmentsdo both.
COMMENT BYMICHAEL WOODFORD In this paper Dani Rodrik offers a provoca-tive argument for policies that seek to maintain an “undervalued” cur-rency in order to promote economic growth. The key to his argument isthe empirical evidence that he presents, indicating the correlation of hismeasure of undervaluation with economic growth in cross-country panelregressions.
Rodrik does not really discuss the measures that should be under-taken to maintain an undervalued currency or whether it is likely that a country that pursues undervaluation as a growth strategy should beable to maintain that undervaluation over time. For example, he remarks(as justification for interest in the question of a causal effect of under-valuation on growth) that “one of the key findings of the open-economymacroeconomic literature is that . . . nominal exchange rates and realexchange rates move quite closely together.” But although this is true,and although it is widely interpreted as indicating that monetary policycan affect real exchange rates (since it can obviously move nominalrates), it hardly follows that monetary policy alone can maintain a weakreal exchange rate for long enough to serve as part of a long-run growthstrategy.
Indeed, conventional theoretical models with short-run price stickinessthat are perfectly consistent with the observed short-run effects of mone-tary policy on real exchange rates also imply that monetary policy shouldnot have long-run effects. Rodrik also cites evidence showing that steril-ized interventions in the foreign exchange market can affect real exchangerates. But economic theory suggests that interventions not associated with
420 Brookings Papers on Economic Activity, Fall 2008
11. Committee on the Global Financial System, p. 89.
11472-07b_Rodrik Comments_rev.qxd 3/6/09 1:21 PM Page 420

any change in current or subsequent monetary policy should have evenmore transitory effects. And the experiences of countries that have soughtto use devaluation to boost economic growth have often found that the realexchange rate effect of a nominal devaluation is not long-lasting. The caseof South Korea, discussed below, is an example.
Nonetheless, the point of Rodrik’s paper is to provide evidence thatundervaluation favors growth, on the assumption that policies to maintainundervaluation are available, and it is that central contention that I shallexamine here. I find the evidence less persuasive than the paper suggests,for two reasons. First, I believe that the paper exaggerates the strength androbustness of the association between the real exchange rate and growthin the cross-country evidence. And second, even granting the existenceof such a correlation, a causal effect of real exchange rates on growth ishardly the only possible interpretation.
HOW STRONG IS THE ASSOCIATION OF UNDERVALUATION WITH ECONOMIC
GROWTH? Rodrik’s key result is the panel regression reported in his table1, in which the coefficient in a regression of growth on his UNDERVALmeasure is found to be significantly positive and substantial in magnitude.The relationship, he argues, is in fact confined to developing countries, asthe coefficient is near zero when the sample is restricted to countries withGDP per capita greater than $6,000 a year; for the sample consisting onlyof countries with incomes less than $6,000 a year, the coefficient is bothlarger and has an even larger t statistic.
However, it is quite possible that Rodrik’s measure of undervaluationexaggerates this association. Apart from the constant and fixed-effectterms, his measure of undervaluation is equal to
But since lagged income per capita is also included as a regressor inRodrik’s table 1 regressions, and since t refers to a five-year period in theseregressions, so that
his specification is equivalent to a regression of the growth rate (foreach country-date pair) on the variable ln RERit + 1.2 growthit and laggedincome per capita, and δ (the estimated coefficient on ln UNDERVAL in hisregression) would be the coefficient on the “growth-adjusted real exchangerate” in the alternative specification. This way of viewing Rodrik’s regres-sion specification makes it evident that a positive estimate of δ need not
growth RGDPCH RGDPCHit it i t≡( ) −⎡⎣ ⎤⎦−1 5 1ln ln ,,
( ) ln ln . ln .1 0 24UNDERVAL RER RGDPCHit it it= +
COMMENTS and DISCUSSION 421
11472-07b_Rodrik Comments_rev.qxd 3/6/09 1:21 PM Page 421

indicate any association between real exchange rates and growth at all—it may simply reflect the positive correlation between the growth rate anditself.
Rodrik defends the use of his constructed measure UNDERVAL onthe ground that it is necessary to correct for the Balassa-Samuelson effect.One should expect a lower real exchange rate (more-expensive nontradedgoods) for higher-income countries, owing to this effect; Rodrik thendefines “undervaluation” as the degree to which a country’s real exchangerate is higher than expected given the country’s income per capita. Thelatter prediction is made by regressing ln RERit on ln RGDPCHit in apanel regression with time effects but no country fixed effects, so that thecorrelation between countries’ average real exchange rates and their aver-age incomes can be used to estimate the relationship. The coefficient onincome per capita in this first-stage regression is (the negative of) the 0.24appearing in equation 1 above.
However, two objections must be raised to this argument. First,Rodrik’s panel regressions in his table 1 already include country fixedeffects. Hence, average differences in the level of the real exchange rateassociated with particular countries (for example, the developing coun-tries with low real exchange rates, for the reason explained by Balassaand Samuelson) would have no consequences for the regression coeffi-cient δ, even in the absence of Rodrik’s proposed “adjustment” of thereal exchange rate measure. A further adjustment is needed only if theBalassa-Samuelson effect is expected to create a higher-frequency correla-tion between income and the real exchange rate as well—that is, if the five-year periods in which a country’s income per capita is relatively higher areones in which it should correspondingly have a relatively lower exchangerate. The fact that the Balassa-Samuelson effect is well established as afactor explaining long-run average differences between countries does notmake it obvious that such a high-frequency effect should be important. (Asa theoretical matter, this should be true only to the extent that it is also trueat higher frequencies that variations in the rate of productivity growth inthe production of tradables are an important source of variation in bothaggregate output growth, on the one hand, and the relative price of trad-ables, on the other.)
Second, even supposing that the high-frequency Balassa-Samuelsoneffect exists, the proposed correction will not necessarily be the correctone and will generally introduce an upward bias in the estimated coeffi-cient δ. The reason is that the Balassa-Samuelson effect is not a direct
422 Brookings Papers on Economic Activity, Fall 2008
11472-07b_Rodrik Comments_rev.qxd 3/6/09 1:21 PM Page 422

causal effect of income on the real exchange rate (or equivalently, on therelative price of tradables). Instead, it is a mechanism according to whichboth income and the relative price of tradables are affected by a third vari-able (the rate of productivity growth in the tradable sector), which createsa negative correlation between the two variables (to the extent that otherfactors do not also simultaneously affect both variables).
The correction proposed by Rodrik would be appropriate if onebelieved that income and the real exchange rate were determined by astructural model of the form
where I now simply write E for the log of the real exchange rate and Y forthe log of income per capita, P is a policy variable (treated as exoge-nous), and u and v are additional exogenous disturbances. Here equation 2is a structural model of real exchange rate determination, in which theterm −βY represents the (high-frequency) “Balassa-Samuelson effect”for which Rodrik apparently wishes to correct, and the term P indicates thekind of policy that can influence the degree of undervaluation, the effectsof which upon growth Rodrik wishes to determine. Equation 3 is a struc-tural model of income determination, in which the term dE represents thegrowth effect of the real exchange rate as such (that is, independent ofwhat has caused the exchange rate to vary) hypothesized by Rodrik.Although no such model is spelled out or defended, something of this formis implicit in Rodrik’s empirical strategy.
Suppose that equations 2 and 3 are a correct model, and suppose furtherthat one has a strategy that allows one to identify the correct value of β (say, from the countries’ long-run differences in incomes and in realexchange rates, on the supposition that there are no long-run cross-countrydifferences in the terms P or u).1 Under these assumptions, the “adjusted”real exchange rate
( )4 �E E Y≡ + β
( ) ,3 Y dE v= +
( )2 E Y P u= − + +β
COMMENTS and DISCUSSION 423
1. To simplify the discussion, I shall abstract from the problems created by the use of agenerated regressor and treat the true value of β as known with certainty.
11472-07b_Rodrik Comments_rev.qxd 3/6/09 1:21 PM Page 423

will provide a measure of the composite disturbance u ≡ u + P. Under thefurther simplifying assumption that v is orthogonal to u, the coefficient δfrom a regression of Y on E will be a consistent estimator of
This is precisely the interpretation that Rodrik wishes to give to his esti-mate of δ.
But among the several assumptions required for this approach to yield aconsistent estimate of ∂Y / ∂P, note that the “Balassa-Samuelson effect” istreated as a direct effect of Y on E in equation 2. In fact, this is not thenature of the Balassa-Samuelson theory. Even if one considers the theoryas referring to purely instantaneous and static effects (which thereforehave the same quantitative form at all frequencies), the model shouldinstead be one of the form
where T is a measure of productivity in the tradable sector and, accord-ing to the Balassa-Samuelson theory, the coefficients a and c are bothpositive. Here P is again a policy that is hypothesized to directly affectthe exchange rate, and dE again indicates the hypothesized effect ofexchange rate variations (from whatever source) on national income. Ishall suppose that T is an exogenous disturbance, independent of all of thefactors P, u, and v.
Suppose now that the true structural model is of the form in equations 6and 7, but that one is able to correctly estimate the elasticity of the realexchange rate with respect to variations in income per capita due purely tovariations in productivity of the tradable sector, which is what one needsfor the Balassa-Samuelson adjustment proposed by Rodrik. That is, sup-pose that one has a correct estimate of the coefficient
(This could be estimated by a cross-country regression of long-run aver-age real exchange rates on long-run average levels of income per capita,under the assumption that there are no cross-country differences in thelong-run average values of either u or v.) And again suppose that one
β ≡ − ∂ ∂∂ ∂
=−
E T
Y T
a
c ad.
( ) ,7 Y cT dE v= + +
( )6 E aT P u= − + +
( ) .51
δβ
≡+
= ∂∂
d
d
Y
P
424 Brookings Papers on Economic Activity, Fall 2008
11472-07b_Rodrik Comments_rev.qxd 3/6/09 1:21 PM Page 424

constructs an “adjusted” real exchange rate, defined as in equation 4.What will be the economic interpretation of the coefficient δ obtainedby regressing Y on E? In particular, will it provide a consistent estimateof ∂Y / ∂P?
Under the assumption that β is correctly estimated, E will be a measureof “undervaluation” that has been purged of any effects of variations in theproductivity of the tradable sector; specifically,
In this sense one has controlled for variations in the real exchange rate dueto the Balassa-Samuelson effect. But this does not suffice to make δδ a con-sistent estimate of ∂Y / ∂P. Even under the assumption (for simplicity) thatv is orthogonal to u, δ is in this case a consistent estimate of
where δ is again defined as in equation 5 and σ2 is the variance. But thisquantity is not equal to
for two distinct reasons. Even if σ2v = 0, expression 8 will equal δ rather
than d, but because the Balassa-Samuelson effect is not a direct effect ofincome on the exchange rate (as represented in equation 2), the policy-relevant elasticity is d rather than δ. But, likely more important, if σ2
v > 0,the second term in expression 8 represents an upward bias in δ. Onewould find a positive estimate for δ even if the true policy elasticity dwere equal to zero.
Not only is the coefficient obtained from a regression on E likely tobe biased; it is far from obvious that this should be a more reliable esti-mate than would be obtained by simply regressing on the unadjusted realexchange rate. Assuming again that v is orthogonal to u, my simple modelimplies that the coefficient d obtained by regressing Y on E should be aconsistent estimator of the quantity
d a
au T
u T
σ β σσ σ
�
�
2 1 2 2
2 2 2
−+
−
.
∂∂
=Y
Pd ,
( ) ,81
2
2
22 2
δβ
σσ σ
+( )
( ) +a c
c av
u v�
� �Ec
c adu
a
c adv=
−+
−.
COMMENTS and DISCUSSION 425
11472-07b_Rodrik Comments_rev.qxd 3/6/09 1:21 PM Page 425

This will be an underestimate of the true policy elasticity d (if β > 0 andσ 2
T > 0), owing to the failure to correct for the Balassa-Samuelson effect.But the bias will be relatively small as long as
which is to say, as long as productivity growth in the tradable sectoraccounts for a relatively small share of total high-frequency variation inthe exchange rate. This last assumption seems a fairly reasonable one,except over quite long periods.
How dependent are Rodrik’s results on the use of the UNDERVAL mea-sure? His table 3 presents results for corresponding panel regressions usinga variety of simple real exchange rate measures instead of his “adjusted”measure. In most cases the measure of undervaluation is no longer a sig-nificant explanatory factor when the entire sample of countries is used.Rodrik instead stresses that when one restricts attention to the sample ofdeveloping countries, the coefficient on the measure of undervaluationremains significantly (at the 5 percent level or better) positive in threeout of the four cases (albeit substantially smaller than when UNDERVALis used).
These results indicate that within the sample of lower-income coun-tries, there is a positive association between the level of the real exchangerate and growth, after one controls for country effects and time effects;Rodrik’s basic finding is not purely an artifact of the way in which his pre-ferred measure of undervaluation is constructed. Nonetheless, if one wereto emphasize the results using the real exchange rate (as I would prefer),one would not only obtain a smaller estimated effect, but have more reasonfor concern for the robustness of the finding as well.
For example, when one uses the real exchange rate as the measure ofundervaluation, it becomes more important to restrict attention to the sam-ple of “developing” countries in order to find evidence of the associationbetween undervaluation and growth. But this in turn leads to questionsabout what should define the sample of countries that are included. Table 1illustrates the consequences for the value of the estimated coefficient δ ofalternative choices of the set of countries included in the sample. Here themeasure of undervaluation used is the real exchange rate measure fromthe Penn World Tables (the one used in the first two columns of Rodrik’stable 3).2 The first line of the table essentially replicates the result in
a T u2 2 2σ σ<< � ,
426 Brookings Papers on Economic Activity, Fall 2008
2. Note that among the real exchange rate measures that Rodrik considers in table 3, thisis the one that results in the most significant positive value for δwhen the sample is restrictedto countries with income per capita less than $6,000.
11472-07b_Rodrik Comments_rev.qxd 3/6/09 1:21 PM Page 426

Rodrik’s table 3.3 The second line shows, however, that the estimated coef-ficient is reduced by one-third if the income cutoff is raised from $6,000 to$8,000.4 It is not obvious that only countries with income per capita lessthan $6,000 should be regarded as developing countries; in particular, ifthe justification for expecting to observe the hypothesized relationshiponly in lower-income countries is that these countries have weaker institu-tions, it is not obvious that countries with incomes per capita between$6,000 and $8,000 do not also suffer from many of the institutional weak-nesses that are common in the developing world.5 But the evidence for apositive association between the real exchange rate and growth is con-siderably weaker when these additional countries are included in the setof “developing” countries. Moreover, the evidence becomes weaker stillif the lowest-income countries (those with income per capita less than$1,000) are excluded from the sample. (One is surely not much interestedin using the experiences of these desperate countries as illustrations of asuccessful growth strategy.) When these countries are dropped from thesample (third line of table 1), the estimated effect is only about half aslarge as for the “developing” sample used by Rodrik and no longer signifi-cant at the 5 percent level.
DOES THE CORRELATION INDICATE CAUSALITY? Even granting the existenceof a positive correlation between a country’s real exchange rate and itsgrowth rate, is it legitimate to interpret this as evidence of a causal effectof the exchange rate on growth? In particular, is it evidence of a causalmechanism that can be relied upon in predicting the effects of a policy ofseeking to maintain a depreciated currency?
COMMENTS and DISCUSSION 427
Table 1. Estimates of the Coefficient on Rodrik’s Undervaluation Measure for Different Samples
Sample limited to countries with income per capita Coefficient Standard error t statistic
Less than $6,000 0.0144 0.0038 3.77Less than $8,000 0.0091 0.0037 2.50Between $1,000 and $8,000 0.0077 0.0040 1.91
Source: Author’s calculations.
3. Rodrik reports a slightly larger coefficient (0.016) and a t statistic of 3.74.4. As in Rodrik’s regressions, the income level used in this classification is average real
income per capita over the period 1950–2004, where real GDP per capita is taken from thePenn World Tables.
5. The countries in this set are Bulgaria, Chile, Kazakhstan, Mauritius, Poland, SouthAfrica, South Korea, Swaziland, Taiwan, Turkmenistan, Uruguay, and Venezuela.
11472-07b_Rodrik Comments_rev.qxd 3/6/09 1:21 PM Page 427

I should begin by admitting that I suspect that at least some of the posi-tive association found in the data does reflect episodes in which policiesthat manipulate the exchange rate have had significant consequences forgrowth—specifically, examples of a familiar sort, in which policies thatmaintain an overvalued currency create distortions that stifle economicactivity. But Rodrik stresses that this well-known lesson is not the onlyconnection between exchange rate policy and growth; the declared pur-pose of his paper is to establish that policies leading to undervaluationare beneficial to growth. Yet much of the evidence that he presents (andthe only evidence using unadjusted measures of the real exchange rate)consists of correlations that might largely reflect cases of overvaluation.Beneficial effects of undervaluation on growth can hardly be establishedmerely by observing that countries are able to reduce their growth rates byintervening to maintain an overvalued currency. For example, the policiesused to maintain a severe overvaluation typically involve rationing ofaccess to foreign exchange, and one may suppose that it is these controls,rather than the level of the exchange rate as such, that account for much ofthe reduction in economic performance; but if so, one can hardly argue onthis ground that other types of interference with free convertibility willinstead increase efficiency, as long as the controls keep the currencyundervalued rather than overvalued. One might instead expect growth tobe favored by a policy that does not create distortions of either sign.
Rodrik offers several comments on the issue of causality. The first is anassertion that although an inference of causality from real exchange ratedepreciation to growth would be problematic “in a world where govern-ments did not care about the real exchange rate and left it to be determinedpurely by market forces,” in fact “most governments pursue a variety ofpolicies with the explicit goal of affecting the real exchange rate.” Butthere is a great leap between the observation that real exchange rates areaffected by policy and an assumption that the real exchange rate is purelydetermined by policy, and by policies that are exogenous with respect tothe state of the economy at that. Yet only under the assumption that the realexchange rate is an exogenous policy choice can one sidestep the issue ofcausality.
In fact, Rodrik admits that endogeneity of the real exchange rate is anissue, and he proposes two ways of dealing with it. One is an extensionof his regression model to include additional explanatory variables, suchas the inflation rate, government consumption as a share of GDP, andgross domestic saving as a share of GDP. Inclusion of additional vari-ables lowers the coefficient δδ on the UNDERVAL variable, but the coeffi-
428 Brookings Papers on Economic Activity, Fall 2008
11472-07b_Rodrik Comments_rev.qxd 3/6/09 1:21 PM Page 428

cient remains significantly positive;6 this is taken to suggest that under-valuation does indeed have a positive effect on growth, even after onehas controlled for possible sources of endogenous variation in the realexchange rate. In fact, Rodrik suggests that some of the endogenous varia-tion in the exchange rate that has been controlled for ought really to becounted as policy-induced variation: “To the extent that [policies thatreduce government consumption or increase saving] are designed to movethe real exchange rate in the first place, they are part of what I have in mindwhen I talk of ‘a policy of undervaluation.’” This last point, however, ishardly convincing: if it is shown that policies that increase saving, forexample, increase economic growth even when policymakers adopt thembecause of their anticipated consequences for the real exchange rate, itwould hardly follow that policymakers should therefore be advised toattempt to depreciate by whatever means possible, for the growth effect ofthe increased saving might occur through other channels than the effect onthe real exchange rate. Moreover, the mere fact that one has controlled forsome possible kinds of endogeneity of the real exchange rate is hardly aproof that the remaining variation is exogenous.
Rodrik’s final argument is an assertion that “many of the plausiblesources of bias . . . would induce a negative relationship between under-valuation and growth, not the positive relationship I have documented.”This, in his view, makes an interpretation of the positive value of δ asreflecting omitted-variable bias implausible. Accordingly, it is perhapsworth discussing a simple example of how endogeneity of the realexchange rate could result in a positive correlation between the realexchange rate and growth, even under circumstances where devaluationwould not stimulate economic activity at all.
I shall illustrate my point using a purposely oversimplified model ofequilibrium real exchange rate determination.7 Consider a two-period (t =1, 2) small, open economy model with two sectors ( j = T, N) producingtradables and nontradables, respectively. I assume a competitive worldmarket for the T good (which will also be the numeraire) and a world real
COMMENTS and DISCUSSION 429
6. Of course, this robustness of the significantly positive coefficient may reflect the biasresulting from use of the UNDERVAL measure, discussed above.
7. In particular, my use here of a model in which monetary policy cannot affect the realexchange rate does not mean that I believe that, in reality, monetary policy cannot influencethe real exchange rate, at least for a time. My point is simply to show that a positive empiri-cal correlation between the real exchange rate and real activity need not imply anythingabout the magnitude of the growth effects of exchange rate policy, and that point is mademost simply with a model in which there is no scope at all for monetary policy to affect realvariables, even in the short run.
11472-07b_Rodrik Comments_rev.qxd 3/6/09 1:21 PM Page 429

interest rate r > 0 (in terms of the T good, between periods 1 and 2) that isunaffected by the net capital flows of the small country. Let the productiontechnology in each sector j and each period t be of the Cobb-Douglas form,
where Kjt is the capital stock in sector j, Hjt is hours of labor in that sector,and the coefficient 0 < αj < 1 may be sector specific. The initial capitalstocks Kj1 of both sectors are given as parameters, and I assume that KN2,the capital stock of the N sector in the second period, is given exogenouslyas well. (To simplify, I shall assume a constant exogenous value, KNt = KN,for both periods t.) The second-period capital stock of the tradable sectorinstead depends on investment spending I, according to the law of motion
where 0 < δ < 1 is the rate of depreciation of capital in the T sector.I assume that the representative household in the small economy seeks
to maximize
where the contribution to utility U in period t is of the form
in which expression Cjt is consumption in period t of the sector j good, Ht
is hours worked, and the preference parameters satisfy λ, v > 0 and 0 < β,γ < 1. For simplicity I assume competitive domestic spot markets eachperiod for both labor and the N good, neither of which is traded inter-nationally. Finally, the government sets the nominal exchange rate eachperiod, which then determines the domestic-currency price of the T goodin that period (by the law of one price). I shall suppose that the govern-ment also imposes a proportional tax τ on savings in period 1, so that thereal return received by domestic savers is (1 − τ)(1 + r). I abstract fromgovernment consumption; the government revenue raised by the tax isassumed to be simply rebated as a lump sum to households.
In any period t, given values for (KTt, YTt), one can solve uniquely forequilibrium values of HTt, HNt, YNt = CNt, CTt, wt, and PNt, where both thewage wt and the price of nontradables PNt are quoted in units of the T good.(Thus, wt is a real wage and PNt is actually the relative price of nontrad-
U C Cv
Ht Nt Tt tv= + −( ) −
++γ γ λ
log log ,11
1
U U U= +1 2β ,
K I KT T2 11= + −( )δ ,
Y K Hjt jt
a
jt
aj j= −1 ,
430 Brookings Papers on Economic Activity, Fall 2008
11472-07b_Rodrik Comments_rev.qxd 3/6/09 1:21 PM Page 430

ables.) One can easily show that there is a unique, differentiable solutionfor each of these variables and that the solution functions satisfy (amongother properties)
Using these solution functions, an intertemporal equilibrium can then bedescribed as a set of values for the endogenous variables (YT1, KT2, YT2) thatsatisfy the following three equilibrium conditions:
given values of the exogenous parameters (KT1, r, β), where β ≡ β(1 − r).Here equation 9 is the requirement that there be intertemporal balance
in the country’s capital account (assuming zero net foreign assets at thebeginning of period 1); equation 10 is the Euler equation for an optimalsaving decision by the representative household; and equation 11 is thefirst-order condition for profit-maximizing investment demand, stating thatthe anticipated marginal product of capital in period 2 must equal 1 plusthe required real rate of return.8 One can again show that there is a uniquesolution to these three equations for the endogenous variables as differen-tiable functions of the exogenous parameters.
Consider now the consequences of an exogenous increase in the com-posite parameter β, which implies an increase in domestic households’
( ) ,11 1 12 2−( ) = +( )αT T TY r K
( ) ,10 12 2 1C K Y r C YT T T T T( ) = +( ) ( )�β
( ) ,,
9 111 1 2 1
2 2C K Y K KC K Y
T T T T T
T T T( ) + − −( )[ ] +( )
+δ
rrY
Y
rTT= ++1
2
1
∂∂
< < ∂∂
< − ∂∂
∂∂
C
Y
C
K
C
Y
Y
Y
T
T
T
t
T
T
N
0 0,log
log
log
log,
TT
N
T
N
T
T
Y
K
Y
Y
GDP
Y
< <∂∂
< −∂∂
∂∂
≡
0 0
1
,log
log
log
log,
++∂∂
>
∂∂
< <∂∂
= −∂
PY
Y
P
Y
P
K
Y
N
N
T
N
T
N
T
N
0
0 0,log
log
log
∂∂ log.
YT
COMMENTS and DISCUSSION 431
8. Note that since period 2 is the last period of the model, there is effectively 100 percentdepreciation of capital in this period.
11472-07b_Rodrik Comments_rev.qxd 3/6/09 1:21 PM Page 431

willingness to save, as a result of either a change in preferences (anincrease in β) or a change in policy that increases incentives for saving (areduction in τ). Total differentiation of the system of equations 9, 10, and11 reveals that
which implies in turn that
Hence an increase in the willingness to save in period 1 (whether due tochanging attitudes or to changing incentives) will simultaneously increasethe production of tradables (YT1), the small country’s exports (YT1 − CT1),and its real GDP (GDP1), while reducing the relative price of nontradables(PN1) and hence increasing the real exchange rate.
Note that this equilibrium scenario resembles the phenomenon ofteninterpreted as “export-led growth”: a real depreciation coincides with anincrease in exports and an increase in total GDP (hence an increase inthe growth rate). Moreover, if one were to compare a panel of small,open economies, to each of which the above model applies, with identicalparameter values except for cross-country variation in the value of β, onewould observe a positive correlation between a country’s real exchangerate in period 1 and its growth rate in that period.9 Yet the high-growthcountries would not be in this situation because of their exchange rate poli-cies; their higher growth rates would be due to other factors (factors thatfavor a higher saving rate) that happen to lead both to a lower equilibriumreal exchange rate and to higher GDP growth. Moreover, the model is onein which if a country were to use monetary policy to depreciate its cur-rency in nominal terms, this would not affect growth (or any other realvariables, including the real exchange rate); it would only raise the nomi-nal domestic prices of both tradables and nontradables (without affectingtheir relative price).
It is true that there is a policy intervention, in the simple model, thatwould depreciate in real terms, namely, a reduction in the tax rate on sav-
∂∂
>∂∂
<∂ −( )
∂>GDP P Y C
N T T1 1 1 10 0 0� � �β β β, , .
∂∂
>YT 1 0�β,
432 Brookings Papers on Economic Activity, Fall 2008
9. The exogenous parameters taking identical values for the different countries areassumed to include GDP in the period immediately before period 1, with respect to whichthe period 1 growth rate is calculated.
11472-07b_Rodrik Comments_rev.qxd 3/6/09 1:21 PM Page 432

ings τ, which is one of the factors determining the value of β. And such apolicy change would increase GDP (through its effect on saving) in thesame way that an increase in households’ patience would. But it does notreally make sense to call this a demonstration that a deliberate policy ofexchange rate depreciation can be used to stimulate growth, since themost obvious example of a policy with that intent would be completelyineffective.10
The example shows that it is certainly possible for an omitted variableto move both the real exchange rate and GDP in the same direction, so thatthis is a potential interpretation of a positive coefficient δ in Rodrik’s panelregression. But is this theoretical possibility likely to be of practical rele-vance? Here it is worth noting that the regressions reported in Rodrik’stable 10 show that a country’s ratio of gross domestic saving to GDP hasa significant positive effect on his UNDERVAL measure; and of course,a higher saving rate is also correlated with higher growth, as many authorshave noted, and as Rodrik’s panel regressions in tables 4 and 5 show. (Thelatter regressions show that the saving rate is a significant variable inexplaining differences in growth across country-time pairs, even when theundervaluation measure is also included in the regression, and that inclu-sion of the saving rate as an explanatory variable reduces the estimatedcoefficient on the undervaluation measure.)
Rodrik notes that the inclusion of the saving rate in the growth regres-sions does not completely eliminate the significance of UNDERVAL as anexplanatory variable, and he concludes from this that endogeneity result-ing from factors of the kind illustrated in the simple example do not fullyaccount for the association between undervaluation and growth. But thefact that inclusion of a single proxy for factors of the kind representedby the simple example eliminates only part of the association betweenUNDERVAL and growth hardly establishes that endogenous mechanismsof this kind are not responsible for the correlation—in particular, for thecases in which undervaluation coincides with strong growth, as opposed tothe cases in which overvaluation coincides with weak growth.11
COMMENTS and DISCUSSION 433
10. Moreover, some other policies that would result in a real depreciation as a byproductwould lower rather than raise GDP growth.
11. Again, it is only the association of UNDERVAL with growth that is shown to berobust to inclusion of the saving rate in the regression, not the association between simplemeasures of the real exchange rate and growth. One should not expect the associationbetween UNDERVAL and growth to be completely eliminated by the inclusion of any num-ber of regressors representing determinants of the real exchange rate, because UNDERVALalso reflects the economy’s growth rate, as explained above.
11472-07b_Rodrik Comments_rev.qxd 3/6/09 1:21 PM Page 433

The simple example also illustrates another important point. The mereexistence of a positive correlation between the real exchange rate andgrowth (across some class of developing countries) need not be evidenceof any greater distortions in the tradable sector that can in turn justifypolicies that essentially subsidize that sector. Ultimately, this is Rodrik’sargument for the pursuit of undervaluation: one would like to subsidize theproduction of tradables, but for political economy reasons it may be mostpractical to do so by manipulating the exchange rate rather than throughindustrial policy. The main evidence Rodrik offers for the hypothesis ofan inefficiently small relative size of the tradable sector in developingeconomies is the evidence for a stimulative effect of a real depreciation.Yet in the simple model, a positive correlation exists between the realexchange rate and growth—and faster growth is associated with a shift ofresources from the nontradable to the tradable sector—but this does notmean that the equilibrium production of tradables is suboptimal. In thecase that τ = 0, the intertemporal equilibrium maximizes the welfare of therepresentative household (subject to the constraint that trade with the restof the world must satisfy intertemporal balance of the capital account), andthe introduction of a subsidy for the production of tradables would reducewelfare, relative to that optimum. Similarly, the introduction of other sortsof market distortions that represent indirect ways of subsidizing the trad-able sector would most likely reduce welfare, whether or not they wouldincrease GDP.
A CASE STUDY: SOUTH KOREA. Ultimately, the issue of causality is un-likely to be settled using panel regressions of the kind that constituteRodrik’s main results, owing to a lack of suitable instruments for exoge-nous changes in exchange rate policy. Case studies can often be more illu-minating in this regard. Here I consider only one, that of South Korea,which is one of the countries Rodrik cites to illustrate the association ofgrowth with undervaluation (see his figure 1). One can obtain a morecomplete picture of the degree to which the Korean case supports Rodrik’sthesis by looking at higher-frequency data (his figure 1 uses five-yearaverages) and at additional variables.
My figure 1 plots annual data for both the (official) nominal won-dollar exchange rate and the implied real exchange rate, as well asKorean prices relative to U.S. prices.12 The figure shows the severallarge won devaluations of the 1950s and 1960s—in particular, those
434 Brookings Papers on Economic Activity, Fall 2008
12. The data are from the Penn World Tables and are the same data used by Rodrik inconstructing the UNDERVAL measure that he plots.
11472-07b_Rodrik Comments_rev.qxd 3/6/09 1:21 PM Page 434

of 1955, 1960, 1961, and 1964.13 Each of these did result (at least tem-porarily) in a substantial real depreciation, providing clear evidence thatat least some of the relatively high frequency variation in the realexchange rate in South Korea represents effects of exchange rate policy.But the figure also makes clear that devaluations need not have anylong-lasting effect on the real exchange rate: much of the effect of the1955 and 1961 devaluations had already been undone by increased infla-tion two years later. Indeed, this fact explains why the Korean govern-ment found additional large devaluations to be necessary so soon after theprevious ones.
The 1964 devaluation might appear to have been more successful: forthe next decade, Korea maintained a real exchange rate that was substan-tially weaker than it had been during most of the 1950s. Of course, this wasalso the decade over which Korea’s real GDP growth accelerated to a rateof 6 to 8 percent a year (figure 2), which Rodrik interprets as supportingthe view that an undervalued currency was the key to the Korean growth
COMMENTS and DISCUSSION 435
Figure 1. South Korea: Exchange Rates and Relative Prices, 1953–2004a
13. A 30 percent devaluation in February 1960 was followed by another 100 percentdevaluation in February 1961; the annual data are not of high enough frequency to show thisas two distinct episodes.
Source: Penn World Tables.a. Exchange rates are against the dollar; a rise indicates a depreciation of the won.b. Korean prices relative to U.S. prices.
0.2
0.6
1.0
Log units
Real exchange rate (left scale)
Nominal exchange rate (right scale)
Relative pricesb (right scale)
Log units
1.2
0.8
0.4
2
4
6
7
5
3
1955 1960 1965 1970 1975 1980 1985 1990 1995 2000
11472-07b_Rodrik Comments_rev.qxd 3/6/09 1:21 PM Page 435

“miracle.” But in order to attribute the sustained real depreciation to the1964 devaluation, one must explain why earlier devaluations did not havesimilarly long-lasting effects.
An obvious interpretation would be as follows: the earlier devaluationswere not associated with any change in the equilibrium real exchangerate, and therefore monetary policy could weaken the real exchange rateonly temporarily; in contrast, the 1964 devaluation coincided with aweakening of the equilibrium real rate, so that the devaluation, rather thanresulting in a true undervaluation, facilitated a shift in the real exchangerate that would have had to occur in any event. Why might the equili-brium real exchange rate have weakened? A clue is provided by the fact that gross domestic saving surged after the early 1960s, as figure 2also shows.
Before 1965, ceilings on bank deposit rates in South Korea depressedhousehold saving, since (under the high inflation of the time) the impliedreal interest rates on deposits were negative. Instead, households lentfunds to the informal financial sector, where interest rates were quite high.By raising interest rate ceilings in 1965 and at the same time reducinginflation, the government brought household savings back into the bank-ing system, and so reduced the cost of capital for businesses through more
436 Brookings Papers on Economic Activity, Fall 2008
Figure 2. South Korea: Exchange Rates, Saving, and Economic Growth, 1953–2004
Source: Penn World Tables.a. Logarithm of the real exchange rate from figure 1, divided by 10.b. Five-year moving average.
2
6
10
Percent
Real exchange ratea (left scale)
Gross domestic saving (right scale)
Growth in real GDP per capitab (left scale)
Percent of GDP
12
8
4
10
25
35
40
45
30
20
5
15
1955 1960 1965 1970 1975 1980 1985 1990 1995 2000
11472-07b_Rodrik Comments_rev.qxd 3/6/09 1:21 PM Page 436

efficient intermediation.14 In addition, tighter fiscal policy increased pub-lic saving, further contributing to the sharp increase in overall domesticsaving.
This increase in saving, which coincided fairly closely with theacceleration of economic growth, was likely an important cause of thegrowth miracle. Moreover, the simple model presented above shows thatincreased incentives for saving can also increase the equilibrium realexchange rate. This may be one of the reasons that Korea’s equilibriumreal exchange rate was higher in the late 1960s and early 1970s than ear-lier, so that the effects of the 1964 devaluation on the real exchange ratewere not quickly reversed. Indeed, Kwang Suk Kim argues that Korea’spersistent current account deficit and buildup of external debt in the decadeafter 1965 point to overvaluation, not undervaluation, of the won in thisperiod (providing, incidentally, a further reason to doubt the accuracy ofRodrik’s UNDERVAL measure).15
Of course, my interpretation of the Korean case does not imply thatexchange rate policy is completely irrelevant to a country’s developmentstrategy. Overly tight regulation of financial flows can be an importantimpediment to growth, as seems to have been the case in Korea before the1960s, and policies that seek to maintain an overvalued currency will oftenrequire extensive controls. Hence the creation of conditions conducive togrowth will mean, among other things, refraining from attempts to main-tain a seriously overvalued currency. Moreover, the Korean case showsthat the process of development may involve a reduction in the equilib-rium real exchange rate (that is, that which would result from fully flex-ible wages and prices and an absence of impediments to capital flows). Insuch a case, a nominal devaluation can be valuable as a way of allowingthe necessary real depreciation to occur without the more painful processof forcing wages and prices down in response to insufficient aggregatedemand. But such a policy is not correctly described as the pursuit of an“undervalued” currency; rather, it is again an example of the wisdom ofavoiding overvaluation, with the important proviso that the equilibriumexchange rate, with respect to which overvaluation must be defined, caneasily change as the economic structure changes.
COMMENTS and DISCUSSION 437
14. Kim, Kwang Suk, “The 1964–65 Exchange Rate Reform, Export-Promotion Mea-sures, and Import-Liberalization Program.” In Economic Development in the Republic ofKorea: A Policy Perspective, edited by Lee-Jay Cho and Yoon Hyung Kim (Honolulu: East-West Center, 1991, p. 137).
15. Kim, “The 1964–65 Exchange Rate Reform,” p. 132.
11472-07b_Rodrik Comments_rev.qxd 3/6/09 1:21 PM Page 437

GENERAL DISCUSSION Lawrence Summers commented that if thefindings of the paper are correct, the implications are striking: mercantil-ism is the right economic strategy for developing countries seeking fastergrowth. According to the paper, certain sectors of the economy are likelyto generate externalities and contribute to growth in ways different fromother sectors, and therefore policies that support those sectors are likely tobe preferred. This argument is directly at odds with economists’ traditionalopposition to most forms of industrial policy. But Summers raised twoproblems that prevented him from being persuaded by the paper’s results.First, he questioned whether the externalities in the tradable goods sectorcould be so large relative to those in the nontradable goods sector as toaccount for the estimated growth effect. Second, he doubted that all thebenefits of such externalities would be realized within just five years, asthe paper’s empirical approach implied. Summers also criticized Rodrik’suse of both time fixed effects and five-year measurement periods, on thegrounds that they would likely obscure the longer-term impact. He arguedthat omitting the country fixed effects would allow a closer examination ofpermanent differences in the structure of national economies.
Richard Cooper broadly agreed with Rodrik’s conclusion but observedthat it was not a new idea: many of the Asian countries had adopted it inthe second half of the twentieth century. Those countries followed a policyof currency undervaluation for two reasons: to promote reliable demandfor their exports, and to encourage capital imports. Cooper disagreedwith Summers that such a policy constituted mercantilism: mercanti-lism focuses on restricting imports, whereas this policy acts primarily onexports. On a more technical note, Cooper expressed reservations aboutthe use of purchasing power parity–adjusted prices in determining over-or undervaluation, given that those numbers are subject to significantrevision.
Linda Goldberg commended the paper for attempting to grapple withthe distortions limiting growth in developing countries, particularly thosefalling disproportionately on the industrial sector. However, she objectedto the paper’s exclusive focus on the real exchange rate as the mechanismfor dealing with those distortions, since the real exchange rate is correlatedwith other policies and macroeconomic variables. She suggested look-ing instead at natural experiments directly related to industrial policy andfocusing specifically on the sectors most affected by the distortions.
Pierre-Olivier Gourinchas cautioned against the use of the Penn WorldTables as the main data source. Given the large changes in the most recentrevision of the data, he suggested, as a robustness test, rerunning the
438 Brookings Papers on Economic Activity, Fall 2008
11472-07b_Rodrik Comments_rev.qxd 3/6/09 1:21 PM Page 438

paper’s regressions using earlier versions of the Penn tables. Gourinchasalso questioned the practice of defining the real exchange rate as the rela-tive price of goods in the tradable and the nontradable sectors, since otherliterature has shown that movement in the real exchange rate is not drivenby movements in these relative prices. He added that he would like to seemore empirical evidence in support of the paper’s main argument.
Kathryn Dominguez agreed with previous speakers about the role ofundervaluation in overcoming distortions but added that maintaining a realundervaluation is a costly policy. She requested that Rodrik provide anexplanation of how undervaluation should be achieved so that it is actuallybeneficial.
Frederic Mishkin discussed other possible mechanisms for encouraginggrowth, focusing primarily on improvements in institutions. A shift in out-put toward tradable goods creates incentives to improve institutions, par-ticularly in the financial sector, to meet the need for additional capital.Such improvement leads to growth in other sectors as well, as previous lit-erature has shown.
COMMENTS and DISCUSSION 439
11472-07b_Rodrik Comments_rev.qxd 3/6/09 1:21 PM Page 439

11472-07b_Rodrik Comments_rev.qxd 3/6/09 1:21 PM Page 440