the question of sustainability for microfinance institutions
TRANSCRIPT
POLLINGER, OUTHWAITE, AND CORDERO-GUZMÁN 23
Journal of Small Business Management 2007 45(1), pp. 23–41
The Question of Sustainability forMicrofinance Institutions*by J. Jordan Pollinger, John Outhwaite, and Hector Cordero-Guzmán
Microentrepreneurs have considerable difficulty accessing capital from main-stream financial institutions. One key reason is that the costs of information about thecharacteristics and risk levels of borrowers are high. Relationship-based financing hasbeen promoted as a potential solution to information asymmetry problems in the dis-tribution of credit to small businesses. In this paper, we seek to better understand theimplications for providers of “microfinance” in pursuing such a strategy. We discussrelationship-based financing as practiced by microfinance institutions (MFIs) in theUnited States, analyze their lending process, and present a model for determining thebreak-even price of a microcredit product. Comparing the model’s results with actualprices offered by existing institutions reveals that credit is generally being offered at arange of subsidized rates to microentrepreneurs. This means that MFIs have to raiseadditional resources from grants or other funds each year to sustain their operationsas few are able to survive on the income generated from their lending and related oper-ations. Such subsidization of credit has implications for the long-term sustainabilityof institutions serving this market and can help explain why mainstream financialinstitutions have not directly funded microenterprises. We conclude with a discussionof the role of nonprofit organizations in small business credit markets, the impact ofpricing on their potential sustainability and self-sufficiency, and the implications forstrategies to better structure the credit market for microbusinesses.
*The authors would like to thank Dr. Larry Wall and Dr. William E. Jackson III from the Federal
Reserve Bank of Atlanta and Dr. Elijah Brewer III from the Federal Reserve Bank of Chicago
for their insightful comments.
J. Jordan Pollinger was vice president of operations at ACCION New York until December
2005 and holds an MBA from the University of Cape Town in South Africa.
John Outhwaite received his undergraduate degree and Ph.D. in physics from The Univer-
sity of Durham in the United Kingdom.
Hector Cordero-Guzmán is an Associate Professor and the Chair of the Black and Hispanic
Studies Department at Baruch College of the City University of New York. He received his
M.A. and Ph.D. degrees from The University of Chicago and is on the Board of Directors of
ACCION New York and the Upper Manhattan Empowerment Zone (UMEZ).
Address correspondence to: J. Jordan Pollinger, c/o ACCION New York, 115 E. 23rd Street,
7th floor, New York, NY 10010. Tel: (917) 517-7894. E-mail: jordanpollinger.gmail.com.

IntroductionThe United Nations declared 2005
the International Year of Microcredit,highlighting the current popularity ofmicroenterprises as asset building andeconomic development tools. Small,medium, and large businesses utilizedebt financing for a range of reasonsfrom securing working capital to makinglonger-term investments. For microbusi-nesses—small entities with less than fiveemployees—this is no less true. Yet dueto a combination of factors including thesmaller scale of operations, the productand demographic markets that theyserve, their often semiformal nature,their lower capital borrowing needs, andthe reluctance of formal lenders andfinancial institutions to work in thesemarkets, microbusinesses do not haveaccess to traditional sources of businessfinancing.
In the late 1980s and 1990s, micro-finance institutions (MFI) developed inthe United States to serve capital marketsin low-income and predominantly ethnicminority communities, stimulating whatServon (1999) calls “Bootstrap Capital.”Most MFIs have some degree of“mission” component that shapes thetypes of borrowers that participate in theprograms. Many organizations focustheir lending activity on entrepreneurswhose income falls below the federallydesignated poverty line, or who reside orwork in particular ethnic minority and/orlow-income neighborhoods, or smallbusiness owners that do not have accessto mainstream sources of credit or arenear bankable (Servon 1997). Microfi-nance typically targets borrowers who do
not have access to formal or mainstreamfinancial markets (Von Pischke 2002).Individual lending mandates for eachMFI typically dictate the specific distri-bution of loan types and populationtargets. In most cases, the mission andprogram selection criteria for MFI guar-antee that they will have some significantpercentage of higher risk otherwise non-bankable borrowers (and businesses) inthe lending portfolio.
At present, there are more than 500organizations in the United States thatprovide support to microbusinessowners, with approximately 200 lendingcapital, and the majority less than 10years old.1 Microfinance in the U.S.context is defined as the extension ofcredit up to $35,000.2 For the purposesof the paper, we refer to microfinanceorganizations and programs that lendcapital in the United States as “MFIs” andthe businesses they serve as “microbusi-nesses,” and it is important to note thatfor regulatory and related reasons, MFIsin the United States are not depositoryinstitutions.
Three key processes have fueled thegrowth in MFIs. First, changes in socialwelfare policies and a focus on economicdevelopment and job creation at themacro level. Second, a focus inducingemployment, including self-employment,as a strategy for improving the lives ofthe poor (Servon 1999; Gonzalez-Vega1998). Third, increases in the proportionof Latin American and Asian immigrantswho come from societies where microen-terprises are prevalent. These factorshave created particular incentives andgenerated public and private subsidiesfor microlending activity in the United
24 JOURNAL OF SMALL BUSINESS MANAGEMENT
1The 2002 Directory of U.S. Microenterprise Programs (FIELD 2002) lists 650 “microenterprise
programs” of which 554 are “practitioners” that provide loans, training, or technical assistance
to microentrepreneurs. There were 108 programs in the 1992 Directory. Elaine Edgcomb
(2004) of the FIELD program at the Aspen Institute quotes 554 MFIs of which 230 are lenders.2The FIELD program of the Aspen Institute sets the upper bounds of microfinance at $35,000.
States where most MFIs are structured asnonprofit organizations (Servon 1997).
However, despite the interest in thesector and the subsidies that have flowedinto mission-oriented MFIs, it appearschallenging to make an MFI viable overthe long term. One survey found that 30percent of domestic microfinance pro-grams operating in 1996 were either nolonger in operation or were no longerlending capital two years later (Bhatt,Painter, and Tang 2002). Furthermore,U.S. microfinance programs report diffi-culty in covering expenses without con-tinued reliance on grants, externalfundraising, or other subsidies.3
International counterparts appear tohave fared better, but it is quite difficultto compare the different sets of marketconditions. Developing nations typicallyhave a strictly tiered banking system, ahigher proportion of microbusinesses intheir economy, high demand formicroloans, less access to formal banking
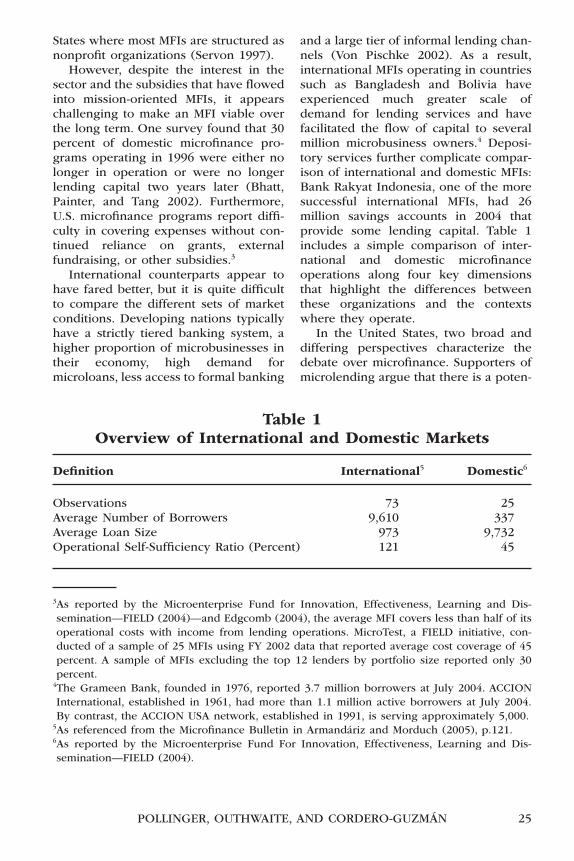
and a large tier of informal lending chan-nels (Von Pischke 2002). As a result,international MFIs operating in countriessuch as Bangladesh and Bolivia haveexperienced much greater scale ofdemand for lending services and havefacilitated the flow of capital to severalmillion microbusiness owners.4 Deposi-tory services further complicate compar-ison of international and domestic MFIs:Bank Rakyat Indonesia, one of the moresuccessful international MFIs, had 26million savings accounts in 2004 thatprovide some lending capital. Table 1includes a simple comparison of inter-national and domestic microfinanceoperations along four key dimensionsthat highlight the differences betweenthese organizations and the contextswhere they operate.
In the United States, two broad anddiffering perspectives characterize thedebate over microfinance. Supporters ofmicrolending argue that there is a poten-
POLLINGER, OUTHWAITE, AND CORDERO-GUZMÁN 25
3As reported by the Microenterprise Fund for Innovation, Effectiveness, Learning and Dis-
semination—FIELD (2004)—and Edgcomb (2004), the average MFI covers less than half of its
operational costs with income from lending operations. MicroTest, a FIELD initiative, con-
ducted of a sample of 25 MFIs using FY 2002 data that reported average cost coverage of 45
percent. A sample of MFIs excluding the top 12 lenders by portfolio size reported only 30
percent.4The Grameen Bank, founded in 1976, reported 3.7 million borrowers at July 2004. ACCION
International, established in 1961, had more than 1.1 million active borrowers at July 2004.
By contrast, the ACCION USA network, established in 1991, is serving approximately 5,000.5As referenced from the Microfinance Bulletin in Armandáriz and Morduch (2005), p.121.6As reported by the Microenterprise Fund For Innovation, Effectiveness, Learning and Dis-
semination—FIELD (2004).
Table 1Overview of International and Domestic Markets
Definition International5 Domestic6
Observations 73 25Average Number of Borrowers 9,610 337Average Loan Size 973 9,732Operational Self-Sufficiency Ratio (Percent) 121 45
tial profit to be realized from microlend-ing but, for various reasons (for example,discrimination, ignorance, etc.), formalfinancial institutions do not see or seekout these opportunities particularly inlow-income and predominantly ethnicminority communities. Skeptics arguethat due to the high cost of information,high-risk borrowers, low returns oninvestment, and related reasons, there isno money to be made on most of thesetypes of small loans and that microfi-nance will always need some form ofstate (or private) subsidy that should bejustified on social equity, public benefit,cost effectiveness, or other grounds.
Any progress toward a potential reso-lution in this debate depends on a betterunderstanding of the actual costsinvolved in the process of microlending,a better assessment of the profiles of bor-rowers and the risks involved, and thedevelopment of a lending model withconcrete parameters that can then beadjusted and calibrated to local condi-tions, borrower characteristics, and riskprofiles. Once we have a realistic esti-mate of the transaction costs of microfi-nance and the interest rates that mayneed to be charged for an MFI to coverits costs of lending, we can better under-stand their effectiveness, evaluate theirneeds and the levels of private andpublic subsidies that may be needed, and
analyze why private banks and relatedfinancial actors have or have not enteredthese markets.
The remainder of the paper is organ-ized into three broad sections. First, wepresent the elements of a microlendingmodel and estimate the value-neutralprices needed to cover the costs of uti-lizing such a methodology. Second, weprovide an analysis of data from a surveyof real-world practices of MFIs. And,lastly, we discuss the implications ofcurrent pricing practices for MFIs and for other actors in the microlendingsector.
The MFI Lending Modelin the United States
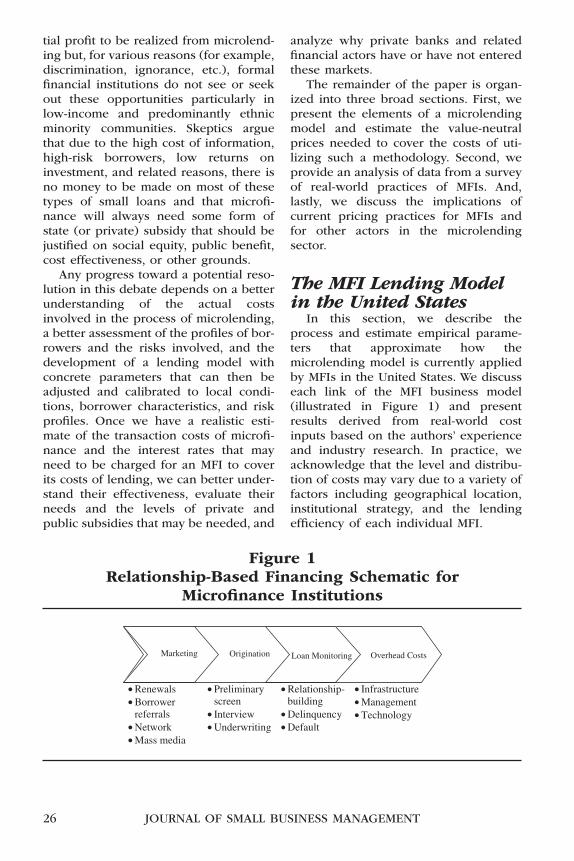
In this section, we describe theprocess and estimate empirical parame-ters that approximate how themicrolending model is currently appliedby MFIs in the United States. We discusseach link of the MFI business model(illustrated in Figure 1) and presentresults derived from real-world costinputs based on the authors’ experienceand industry research. In practice, weacknowledge that the level and distribu-tion of costs may vary due to a variety offactors including geographical location,institutional strategy, and the lendingefficiency of each individual MFI.
26 JOURNAL OF SMALL BUSINESS MANAGEMENT
• Renewals• Borrower
referrals • Network• Mass media
• Preliminary screen
• Interview • Underwriting
• Relationship-building
• Delinquency • Default
• Infrastructure • Management • Technology
Marketing Origination Loan Monitoring Overhead Costs
Figure 1Relationship-Based Financing Schematic for
Microfinance Institutions
MarketingMarketing drives the business model
in terms of the volume of potential bor-rowers that an MFI is able to access andthe pool of loans it can develop. Giventhat MFIs do not accept deposits andhave no formal prior insight into a freshpotential customer base, they must investin attracting new borrowers. Marketingleads are generated from a variety ofsources: soliciting loan renewals fromexisting borrowers, marketing to existingclients for referrals, “grassroots” net-working with institutions possessing acomplimentary footprint in the targetenvironment, and the mass media.
At the outset of operations, before aborrower base is developed, portfoliogrowth is determined by the effectivenessof marketing through network and massmedia channels. Once a borrower pool isestablished, marketing efforts can beshifted toward lower-cost marketing to ex-isting borrowers and their peer networks.Even so, loans will likely attrite from aportfolio at a faster rate than renewals andborrower referrals can replenish it—newleads must continue to be generatedthrough other, less effective channels.
Other sources of clients for MFIsinclude banks who may refer loan appli-cants on the grounds that MFI lendingfeeds successful borrowers back to theformal sector; community-based organi-zations, such as churches and businessimprovement offices that offer an alter-native conduit into tight-knit communi-ties; and Small Business DevelopmentCenters that provide services to bothnascent and established businesses. Up-front investment of labor is required toestablish relationships, referral expecta-tions and procedures but is worthwhilebecause costly loan origination can effec-tively be outsourced to third parties withminimal maintenance.
The Loan Application ProcessIn economic terms, the loan applica-
tion process represents an investment at
origination with the aim of minimizingcredit losses in the future. All else beingequal, a greater investment in the creditapplication process will result in lowersubsequent rates of delinquency anddefault; conversely, a less stringentprocess would result in greater rates ofcredit loss in the future. Setting the appro-priate level of rigor in a credit applicationprocess is an exercise in analyzing loanapplicant characteristics and forecastedfuture behaviors while being cognizant ofthe cost of performing these analyses.
Three steps characterize the loanapplication process.
Preliminary Screen. The applicant isasked a short set of questions to estab-lish the applicant’s eligibility for creditunder the MFI’s guidelines. This is suffi-cient to determine the likely strength ofan application and whether an offer ofcredit could, in principle, be extended.
Interview. At the interview stage, duediligence is performed to ensure that theloan purpose is legitimate and that theborrower’s business has sufficient capac-ity and prospects to make consistentrepayments. Cash-flow analysis is thecore of the MFI due diligence procedureand for microfinance borrowers the datais often insufficiently formal, hinderingeasy examination of cash flow stabilityand loan payment coverage. As a result,this is a less standardized, more time-consuming task than its equivalent in theformal lending markets.
MFI agents frequently performprimary technical assistance concurrentlywith the loan origination, helping theborrower to structure financial state-ments, for example. This lies within thebroader social mandate of many MFIsbut acts as a drag on the efficiency ofcore lending activities. Conversely, largerbusinesses may not require this type oftechnical help, but this is offset by theincreased complexity of their businesses.
Microfinance borrowers often lackconventional collateral assets, in lieu of
POLLINGER, OUTHWAITE, AND CORDERO-GUZMÁN 27

which MFIs require high risk loans to besecured through guarantees by cosign-ers. This can be waived for low riskloans, as arranging for a cosigner pres-ents a significant hurdle to the timelyexecution of the loan application. In theevent of delinquency, the cosigner gen-erates an economic benefit in excess ofthe cost of their recruitment by applyingpressure on the borrower to repay.
The relationship can be further deep-ened through a site visit during whichthe applicant’s business operations canbe observed. This facilitates the accrualof information but is more time inten-sive. Loan officers in the field know theirlending area, its markets, and the partic-ular occupation/industry niches.
Underwriting and Approval. If a loan isrecommended by an officer following theinterview the application is then stress-tested by an underwriter, who validatesthe cash flow and performs auxiliaryanalysis to ensure that the loan repre-sents a positive addition to the lendingportfolio.
The dynamics of loan origination illus-trate the trade-offs to be made to ensurean efficient credit process. Improved rigorcould lead to a higher rate of declinedapplicants, and so higher subsequentportfolio quality, but at the expense ofincreased processing costs. For mediumand larger loans, as application costsincrease past an optimal point, the mar-ginal benefit of improved portfolio qualityis outweighed by the marginal expense ofthe credit application itself. However, forsmall loans there exists no such balancepoint—the optimal application cost is theleast that can be reasonably achieved.This motivates a less intensive creditapplication process, administered when aloan request falls beneath a certainthreshold, typically a principal less than$5,000. MFIs can disburse such loansmore quickly and cheaply by fast-track-ing them through a transaction-basedprocess and context learning.
Loan MonitoringPost-loan monitoring is critical toward
minimizing loss. In contrast to the creditapplication process, which attempts topreempt the onset of borrower delin-quency by declining high risk loans,monitoring efforts minimize the eco-nomic impact of delinquency once a bor-rower has fallen into arrears. In additionto the explicit risk to institutional equitythrough default, managing delinquentborrowers is an intensive and costlyprocess.
When dealing with repeat clients,there exists the opportunity to leverageinformation captured through monitor-ing on previous loans, enabling the MFIto shorten the full credit applicationwithout materially impacting the riskfilter. In short, there is an opportunity toreduce operational costs without a cor-responding increase in future loss rates.Repeat borrowers enable the informationaccrued during the relationship to beleveraged to mutual benefit of MFI andborrower. In this case, much of theinformation required to validate a loanapplication has been gathered during theprevious lending relationship. An MFIwill also possess the borrower’s paymenthistory, a more accurate indicator offuture performance than an isolatedfinancial snapshot taken during the stan-dard application process. The challenge,however, is that for many MFI, a part oftheir mission is to graduate customersinto mainstream commercial banking,which would not allow the MFI to collectadditional interest payments from thosecustomers.
Overhead CostsFor an MFI to sustain itself, each out-
standing balance must contribute a pro-portional amount to institutional costs.Institutional costs are driven primarily by the size of the portfolio being maintained. The necessary staff, tools,technology, work environment, and
28 JOURNAL OF SMALL BUSINESS MANAGEMENT

management are functions of portfolioscale.7
We outline in Table 2 the institutional-level costs of five MFIs with varying port-folio sizes to identify the proportionalcost loading necessary to guarantee thatcentral costs are compensated for. Thetable shows that institutional costsincrease at a slower rate than the rate atwhich the loan portfolio grows, so thatthe overhead allocation declines as anMFI achieves scale. We find that an MFIwith a $500,000 portfolio will incur indi-rect costs of 26 percent, while an MFIwith a $20 million portfolio will experi-ence a much lower indirect cost loadingof 6 percent. In the United States, thelargest institution engaging solely inmicrofinance presently has a portfolio of$15 million.
Pricing MethodologyGiven that efficient pricing is a desir-
able condition, a mechanism to deter-mine the break-even price of a loan thatincorporates accurate intrinsic economiccosts is needed.
MFIs generate revenue through netinterest income on loans—the ratecharged to borrowers less the MFI costof funding—and associated fees, includ-ing both one-off fees and those levied atregular intervals throughout the loanterm. An objective measure of the valueof a loan to the MFI at disbursal, V0, isthe discounted sum of probabilistic cashflows, which can be represented:
V
P
P
P
CT
Active
Maint. Del Del
Def Rec
Def. Inst
D
0 0 0
1
1=
⋅ −( ) ⋅ + −[] − ⋅ −⋅ −( ) ⋅ +[
] − ⋅
+( )−=∑ t
t I F t t
t t t
t t
t t
t
r r v f
c c
r v
c r v
r
,
, ., .,
., .
, .
where V0 is the net present value of aloan; rI the interest rate charged to theborrower; and rF the interest rate paid bythe MFI; on a balance outstanding; vt attime t. The loan’s scheduled cash flowsat time t, the interest income, rI ·vt, inter-est expense, rF ·vt, flat fees, ft, and main-tenance costs cMaint.,t, are weighted bytheir statistical likelihood of being real-ized, PActive,t and added to the statisticalcosts of delinquency PDel,t ·cDel.,t anddefault PDef,t · (vt[1 − rRec]). These quanti-ties are discounted to determine the eco-nomic value at origination. All else beingequal, the value of a loan is a functionof the interest rate charged, rI.
Under these assumptions, high ratesensure that economic value is large andpositive, while low rates result in valuedestruction. Somewhere in between,there exists a value-neutral rate that sat-isfies the condition that the fees andinterest payable on the loan are exactlysufficient to cover all expenses incurredthroughout its term. The appropriatelevel of value for a nonprofit entity todraw from a client, when all costs havebeen compensated, must be identicallyzero. This can also be a source of competitive advantage for nonprofitorganizations operating in these neigh-borhood-based capital markets.
Direct Costs. Direct costs are tied to theproduction of an individual loan andexclude centralized costs, not associatedwith any particular loan, such as man-agement and occupancy. An interest ratethat compensates for direct costs onlycan be considered as the minimum eco-nomically permissible; given sunkeninfrastructure costs, accepting a loan atthis marginal rate will not destroy addi-tional value.
POLLINGER, OUTHWAITE, AND CORDERO-GUZMÁN 29
7Scale refers to the achievement of sufficient portfolio size that centralized expenditure are
small compared to total lending assets.

30 JOURNAL OF SMALL BUSINESS MANAGEMENT
Table 2Institutional Cost Base Required to Sustain
a Loan Portfolio
Institution Size 500K 1MM 5MM 10MM 20MM
Loan Portfolio Size ($million) 0.5 1 5 10 20
Number of Loans in Portfolio8 65 125 625 1,250 2,500
New Originations Needed per 5 10 50 100 200
Month
Renewal Spend Hours per Month — 10 50 80 150
Referral Spend Hours per Month — 10 80 120 400
Network Spend Hours per Month 50 50 200 300 500
Mass Media Spend per Month 500 1,500 8,000 10,000 10,000
Loan Consultants 1 2 7 10 20
Underwriters 1 1 2 2 4
Back-Office Staff 1 1 2 4 8
Collections Staff9 — — 1 3 5
Annualized Direct Staff Spend ($) 110,000 145,000 435,000 690,000 1,345,000
Staff per Manager 5.0 5.5 6.0 6.5 6.5
Managers Required 1 1 2 3 6
Annualized Indirect Staff Spend10 75,000 80,000 175,000 265,000 530,000
($)
Occupancy Space11 (Square Feet) 600 750 2,100 3,300 6,450
Annual Occupancy Cost ($) 10,000 15,000 40,000 65,000 130,000
Annual IT Costs12 ($) 10,000 10,000 30,000 45,000 85,000
Annual Consumable Spend13 ($) 10,000 15,000 35,000 55,000 110,000
Annual Running Costs14 ($) 20,000 25,000 70,000 110,000 215,000
Annual Marketing Spend ($) 5,000 20,000 95,000 120,000 120,000
Total Annual Indirect Costs ($) 130,000 165,000 445,000 660,000 1,190,000
Overhead Allocation, rInst. (Percent) 26.0 16.5 8.9 6.6 6.0
8The number of loans within the portfolio is estimated using an average loan balance of $8,000.9Assuming delinquency rates of 8 percent across the portfolio, and an average of 4 hours per
case per month.10Indirect staff costs include management and loan agent training and administration at 10
percent of their time and time spent originating loans that do not lead to disbursal.11Assuming 150 square feet per employee are required at a cost of $20 per square foot.12Assuming an $2,000 IT spend per employee per year, with a minimum of $10,000.13Assuming that consumables, paper, printing, meal allowance, etc. amount to $2,500 per
employee per year.14Assuming that running costs, utilities, depreciation, and so on amount to $5,000 per employee
per year.
Indirect Costs. Indirect costs representexpenditure associated with generaloperations and not directly associatedwith any single loan type. A price deter-
mined at this loading level ensures thetransaction is fully self-sufficient—it con-tributes its origination, running costs anda proportional amount to infrastructure.
For purposes of this paper, borrowersare grouped into two risk categories, lowand high with differing expectations ofpayment profiles, and five loan sizesspanning the microloan product space—under $2,000, to $5,000, to $10,000, to$20,000, and to $35,000—which drivesbehavior as a proxy of business size. Ahigh risk, sub-$2,000 loan can be viewedas a mission-mandated loan, for indi-viduals with either no or highly damagedcredit. Conversely, a low risk borrowerwith a large loan can be said to be onthe threshold of formal banking status.
The ability to offset interest incomewith fee income (and vice versa) yieldsa diverse set of pricing schemes availableto MFIs. To facilitate comparison, wedefine the annualized percentage rate(APR) as the total income in lending,taking into account all interest rates,points, and flat charges converted into anequivalent compounding interest rate.We present our results as a margin abovethe relevant funding rate.
On Funding. MFI funds are usuallydrawn from many sources, with varyingcosts. MFIs may receive grants, with noexpectation of repayment, although theirdeployment may be restricted to certainborrower types at particular terms. Inthis case, the cost of funds is close to 0percent. The Small Business Administra-tion or other governmental agencies may
partner with MFIs to channel federalfunds to microentrepreneurs. Such agen-cies may also restrict the terms that canbe offered by an MFI15 as a condition ofpartnership. In October 2004 for a typicalMFI, SBA funding is available at 1.3percent. Nongovernmental institutions,such as banks and for-profits, motivatedby the Community Reinvestment Act,have also been a significant source ofsubsidized funding to MFIs.16 AroundOctober 2004, MFI were able to securefunding from these sources at a cost ofapproximately 3 percent. Credit unionsproviding microfinance loans will haveaccess to demand deposits whose cost isthe (usually negligible) interest paid; forsimplicity, we take the cost of such fundsas 0 percent. As a last resort, an MFI canbuy funds on the open market—the mostexpensive funding source, as the marketwill demand a significant risk premium.We estimate this at 10.3 percent, byadding a credit-risk premium of 7percent, equivalent to that of B-rated U.S.corporate bonds of appropriate maturity(Amato and Remolona 2003) to the risk-free cost of borrowing, the five-year T-note rate,17 in October 2004 at 3.3percent, as noted by Board of Governorsof the Federal Reserve System (2004a).
On Interest Income. The borrowerpayment schedule for a basic amortizingloan can be readily calculated and, at
POLLINGER, OUTHWAITE, AND CORDERO-GUZMÁN 31
15The U.S. Small Business Administration (SBA) intermediary’s cost of funds is broadly calcu-
lated after their first year of operation as the five-year T-note less 1.25 or 2 percent depend-
ing on the underlying portfolio. In extending a loan of less than $10,000, the intermediary
may charge up to 8.5 percent over its cost of funds, otherwise, it may charge up to 7.75
percent over its cost of funds (SBA 2004).16The Community Reinvestment Act (CRA), enacted by Congress in 1977 (12 U.S.C. 2901) and
strengthened in 1995 encourages depository institutions to help meet the credit needs of the
communities in which they operate. Typically, banks lend capital through MFIs at favorable
rates to be on-lent to borrowers in communities in which bank branches are not located.
The CRA requires that each insured depository institution’s record in helping meet the credit
needs of its entire community be evaluated periodically (Board of Governors of the Federal
Reserve 2004b; Federal Financial Institutions Council 2004).17Five years is taken as typical of the funding horizon for MFIs.
each payment period, the MFI effectivelyearns the interest paid by the borrowerless their own interest expense on theoutstanding amount. To make explicit theimpact of funding subsidies, we chargethe MFI the market rate for funds, beforecrediting back the market rate less therealized (subsidized) cost of funds. Forexample, an SBA-funded MFI can obtainfunding at two percent beneath the five-year T-note rate, where the market wouldcharge 7 percent over it, for credit risk,amounting to a subsidy of 9 percent. AnMFI that has to go to the capital marketsexperiences a dramatic increase in thecost of funds compared to one that candraw on subsidized funding.
Fee Income. We include any flat feesand points charged by the lender at orig-ination. Fees arising from third partycharges in origination that are passedonto the borrower, such as uniform commercial code (UCC) filing fees, areexcluded.
Other Key Assumptions. We identify the loan products available to micro-finance borrowers, as characterized bytheir loan request, borrower risk, andborrower type. Implementing a two-foldcredit application process, all loansbeneath $5,000, irrespective of borrowerrisk and type, go through a less cost-intensive transactional-based financingarrangement. Above this threshold, newborrowers are served by a relationship-based financing approach (See Bergerand Frame 2007, for a discussion of relationship- and transaction-basedfinancing).
Restricting the loan term of smallerloans allows the MFI to both control riskand limit the maintenance costs incurred.In our analysis, loans of $2,000 areissued with a term of 12 months; loansof $5,000 are given 18 months; $10,000,24 months; $20,000, 36 months; and$35,000 loans, 48 months. This scheme ismoderated such that high risk borrowers
are capped at a loan size of $10,000—their potential default with larger balances represents too significant a concentration of credit risk for most MFIportfolios.
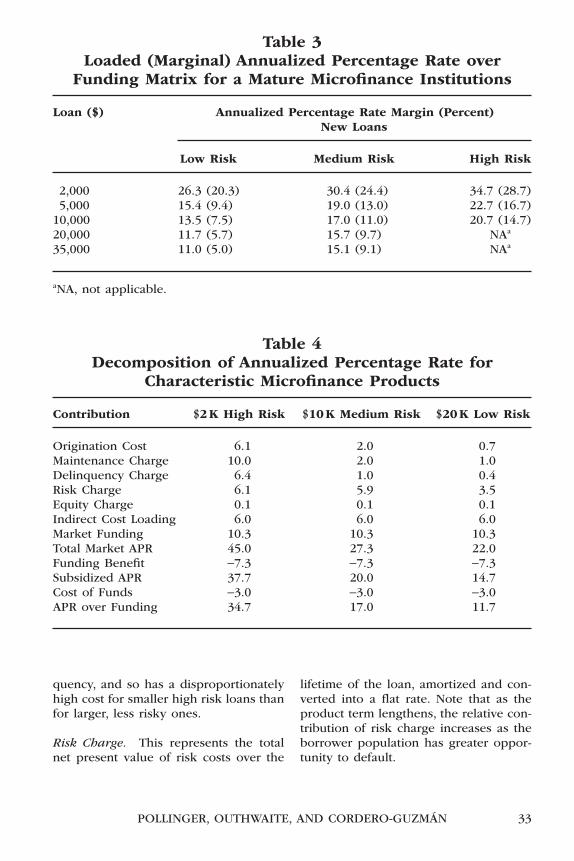
Pricing ResultsWe use the model to calculate the
value-neutral APR margins over fundingfor the product space detailed in the pre-vious section. Product-specific directcosts are taken as outlined in the quan-titative cost model section, and weinclude indirect costs as a proportionalcontribution from each loan as appro-priate for an MFI having achieved a scaleof $20 million in loan assets. We presentthe fully loaded value-neutral APRs overfunding in Table 3. The APR marginsexclusive of indirect costs are shown inbrackets. For an organization with $20million in loan assets, a $2,000 low riskloan should generate an APR of 34.7percent over funding to ensure that itcontributes suitably to institutional self-sufficiency.
It is instructive to decompose the ratesfor three characteristic microfinanceproducts into their component parts toidentify the most significant contribu-tions to value-neutral price. The resultsare shown in Table 4.
Origination Charge. Though the origi-nation charge is a significant proportionof the total APR for the $2,000 loanproduct, this would be significantlygreater had we not applied a transaction-based process.
Maintenance Charge. Maintenance costsare fixed,and so comprise a significant pro-portion of the small loan APR.For each $10of flat monthly cost incurred, the rate on a12-month $2,000 loan must increase byfully 10 percent. By comparison, the sameextra cost on a 36-month $20,000 loan,yields a rate increase of just 1 percent.
Delinquency Charge. This is a fixedcost per instance of borrower delin-
32 JOURNAL OF SMALL BUSINESS MANAGEMENT
POLLINGER, OUTHWAITE, AND CORDERO-GUZMÁN 33
Table 3Loaded (Marginal) Annualized Percentage Rate over
Funding Matrix for a Mature Microfinance Institutions
Loan ($) Annualized Percentage Rate Margin (Percent)New Loans
Low Risk Medium Risk High Risk
2,000 26.3 (20.3) 30.4 (24.4) 34.7 (28.7)5,000 15.4 (9.4) 19.0 (13.0) 22.7 (16.7)
10,000 13.5 (7.5) 17.0 (11.0) 20.7 (14.7)20,000 11.7 (5.7) 15.7 (9.7) NAa
35,000 11.0 (5.0) 15.1 (9.1) NAa
aNA, not applicable.
Table 4 Decomposition of Annualized Percentage Rate for
Characteristic Microfinance Products
Contribution $2K High Risk $10K Medium Risk $20K Low Risk
Origination Cost 6.1 2.0 0.7Maintenance Charge 10.0 2.0 1.0Delinquency Charge 6.4 1.0 0.4Risk Charge 6.1 5.9 3.5Equity Charge 0.1 0.1 0.1Indirect Cost Loading 6.0 6.0 6.0Market Funding 10.3 10.3 10.3Total Market APR 45.0 27.3 22.0Funding Benefit −7.3 −7.3 −7.3Subsidized APR 37.7 20.0 14.7Cost of Funds −3.0 −3.0 −3.0APR over Funding 34.7 17.0 11.7
quency, and so has a disproportionatelyhigh cost for smaller high risk loans thanfor larger, less risky ones.
Risk Charge. This represents the totalnet present value of risk costs over the
lifetime of the loan, amortized and con-verted into a flat rate. Note that as theproduct term lengthens, the relative con-tribution of risk charge increases as theborrower population has greater oppor-tunity to default.
Equity Charge. All MFIs maintain apool of equity as a reserve to protectagainst insolvency. This is charged at theinstitution’s cost of capital net of the risk-free rate and has a negligible effect.
Indirect Cost Loading. Note that theindirect cost loading of 6 percent is cal-culated for an institution achieving sig-nificant scale of operations. For smallerinstitutions, the proportional allocationfrom indirect costs to each individualloan must be higher: 26.0, 16.5, 8.9, and6.6 percent for institutions with $.5million, $1 million, $5 million, and $10million lending asset bases, respectively.
Market Funding, Funding Benefit, andFunding Cost. As discussed in the pre-vious section, we calculate the subsidyon borrowed funds using a compositecost of MFI funds of 3 percent.
Subsidized APR. The model calculatesvalue-neutral APRs above funding for amature MFI, which would guarantee self-sufficiency. For the three characteristicproducts, these are 34.7 percent for the$2,000 high risk product, 17 percent forthe $10,000 medium risk product, and11.7 percent for the $20,000 low riskproduct.
We have shown how, in principle, riskand cost can be factored into a value-neutral product price, which results inhigh APRs for small products. MFI prac-titioners may be reluctant to charge suchAPRs for fear of overburdening the bor-rower with exorbitant costs of debt. Weemphasize that, for small loans, highAPRs translate to modest absolutemonthly payments. For example, thehigh risk APR (including funding costs at3 percent) of 37.7 percent on a 12-month$2,000 loan corresponds to a monthlypayment of $203, with the interest-freemonthly payments alone amounting to$167. An individual incapable of repay-ing $203 will most likely experiencesimilar difficulty maintaining interest-
free repayments of $167, and a micro-finance program is probably not the most appropriate option for such an individual.
We have so far considered microfi-nance pricing only from a supply-sideperspective. Although the near-bankablesegment of the population may be pricesensitive, studies have shown that riskierborrowers are less sensitive to price. Ina survey of borrowers who have takenloans from both MFIs and loan sharks,Gurski (2003) suggests that high riskmicrofinance borrowers are largelyinsensitive to interest rates. This is sup-ported by the broad spread of APRscharged to such individuals by existingpractitioners, discussed in the nextsection.
Industry Pricing SurveyWe surveyed current microfinance
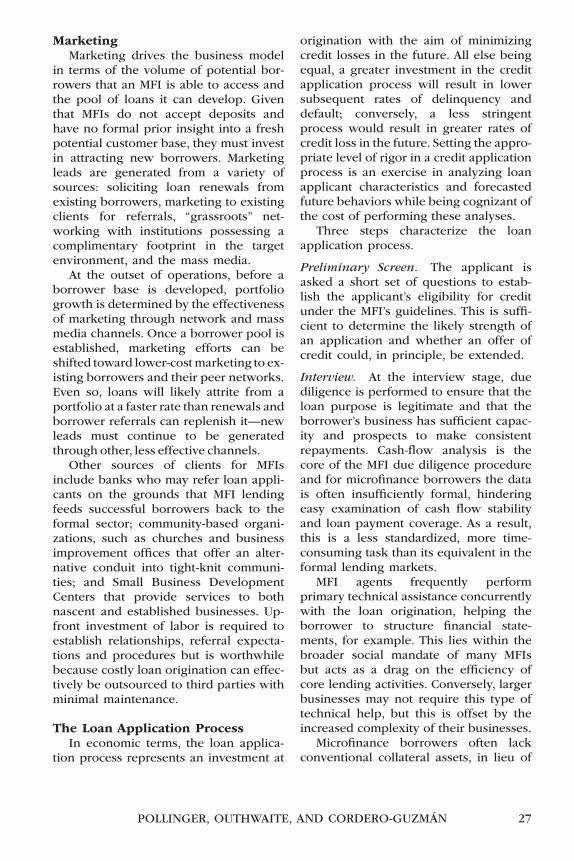
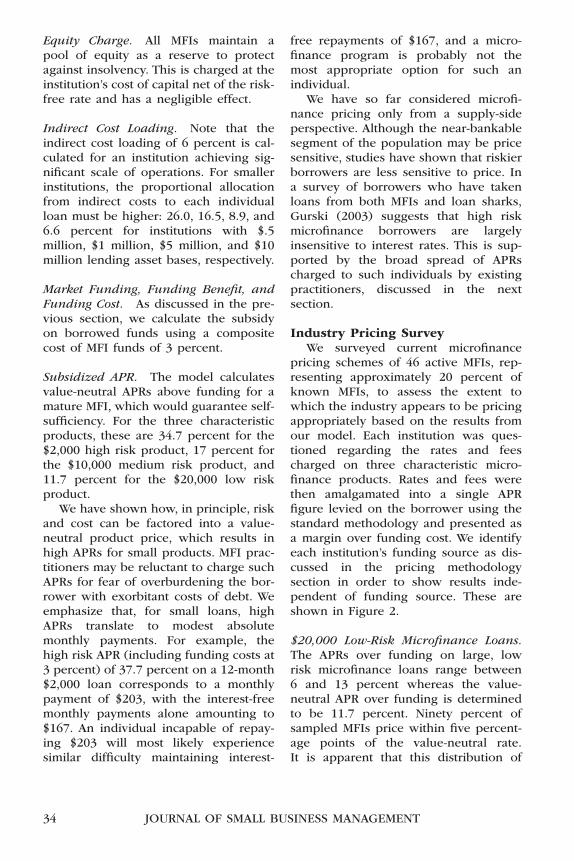
pricing schemes of 46 active MFIs, rep-resenting approximately 20 percent ofknown MFIs, to assess the extent towhich the industry appears to be pricingappropriately based on the results fromour model. Each institution was ques-tioned regarding the rates and feescharged on three characteristic micro-finance products. Rates and fees werethen amalgamated into a single APRfigure levied on the borrower using thestandard methodology and presented asa margin over funding cost. We identifyeach institution’s funding source as dis-cussed in the pricing methodologysection in order to show results inde-pendent of funding source. These areshown in Figure 2.
$20,000 Low-Risk Microfinance Loans.The APRs over funding on large, low risk microfinance loans range between 6 and 13 percent whereas the value-neutral APR over funding is determinedto be 11.7 percent. Ninety percent ofsampled MFIs price within five percent-age points of the value-neutral rate.It is apparent that this distribution of
34 JOURNAL OF SMALL BUSINESS MANAGEMENT

pricing is rather narrow—we hypothe-size that this is a result of pricing pressure from the formal banking sectorfor loans that may be considered near-bankable.
$10,000 Medium-Risk MicrofinanceLoans. The APRs over funding onmedium sized, moderate risk loans rangebetween 7 and 16 percent whereas thevalue-neutral APR over funding is deter-mined to be 17 percent. Seventy percentof sampled MFIs price five percentagepoints or more beneath the value-neutralrate; none priced at the value-neutralAPR.
$2,000 High-Risk Microfinance Loans.The APRs over funding on small high riskloans range between 4 and 38 percentwhereas the value-neutral APR overfunding is determined to be 34.7 percent.Ninety percent of sampled MFIs price fivepercentage points or more beneath thevalue-neutral rate.
The pricing on small loans is verydiffuse, with APRs spanning nearly 35points, which we believe is attributableto the following reasons:
• Restrictions placed by funders onproduct pricing. Note that thisimpacts all products but is most
POLLINGER, OUTHWAITE, AND CORDERO-GUZMÁN 35
$20,000 Low Risk Loans N = 40
Value-neutral APR over Funding = 11.7%
01020304050
4 6 8 10 12 14 16 18 20 22 24 26 28 30 32 34 36 38 40
Res
pond
ents
[per
cent
]
$10,000 Mid Risk Loans N = 43
Value-neutral APR over Funding = 17%
01020304050
4 6 8 10 12 14 16 18 20 22 24 26 28 30 32 34 36 38 40
Res
pond
ents
[per
cent
]
$2,000 High Risk Loans N = 44
Value-neutral APR over Funding = 34.7%
01020304050
4 6 8 10 12 14 16 18 20 22 24 26 28 30 32 34 36 38 40APR over Funding [percent]
Res
pond
ents
[per
cent
]
Figure 2Survey of Microfinance Pricing
significant for small loans becausethe value-neutral APR is muchhigher. However, the majority ofprograms surveyed are not limitedby such restrictions.
• Reluctance to charge high rates.MFIs may feel social and ethicalpressure to maintain low rates forthe poorest borrowers who tend tobe the riskiest.
• Lack of competitive pressure. Thelack of cohesion among APRscharged on small loans in thesample suggests a lack of marketpricing pressure.
• The leveraged impact of fees. Thereis a spread of flat fees charged,which manifest as a far greater vari-ation in APR on small products thanon large products. For example,origination fees varying from $50 to$100 on a 12-month $2,000 loanadd between 4.6 and 9.1 percent tothe value-neutral APR. The samefees on a 36-month $20,000 loanadd between 0.2 and 0.3 percent.
Finally, the data suggest that for thoseinstitutions pricing above value-neutral-ity on large loans, a certain degree ofintraportfolio subsidization may beoccurring. Such a pricing strategy couldbe potentially dangerous because if theyhave the option, lower risk borrowersbeing charged a premium might ulti-mately migrate to an institution pricingappropriately. Simultaneously, undercut-ting the rate for poorer-quality borrow-ers could lead to a net influx of riskierloans. In such a scenario, the portfoliobecomes increasingly weighted to lower-quality loans, the capacity for internalsubsidization diminishes with time, andthe institution becomes increasinglyreliant on external subsidies.
Sustainability and Self-SufficiencyNonprofit organizations and MFI have
been increasingly pressured to adaptmore “business” practices and to become
more self-sufficient (Ledgerwood 1999;Christen 1998) but there is a lack of pre-cision as to what this means. Financialself-sufficiency is often defined in prac-tice as income derived from operationsdivided by the operating expensesincurred, thus excluding revenue fromsubsidies (Vinelli 2002). We would definesustainability as the ability to coverannual budgets including grants, dona-tions, and other fundraising.
In fact, we suggest that MFIs generallyoperate in one of three different modes:survival, sustainability, or self-sufficiency.In survival mode, organizations barelycover their monthly expenses and manyprograms have faced a lingering decay ascapital that was lent out in earlier yearsdid not return as expected to coverfuture operations. Many of these organi-zations and programs eventually beginthe process of dissolution and explainthe high organization and program mor-tality in the sector. Most organizationsseem to operate between survival andsustainability—or the ability of organiza-tions to cover their annual budgetthrough donations and other grants inaddition to earned income from theirlending operations. In our definition,self-sufficiency refers to organizationsthat can survive and add to their assetbase wholly on the basis of incomederived from their lending and relatedoperations.
The quest for sustainability and even-tual self-sufficiency is widely regarded asa best practice in the microfinance indus-try. Vinelli (2002) offers five supportingarguments that explain why. First, sus-tainability helps ensure organization sur-vival and the continuing provision of afinancial service that is desired by manymicrobusiness owners. Further, defaultsmay increase if borrowers believe that alender is not permanent or if they believethe lender will not punish them(Schreiner and Morduch 2002; Bhatt andTang 2001; Gonzalez-Vega 1998; Bates1995). Second, MFIs that price their prod-
36 JOURNAL OF SMALL BUSINESS MANAGEMENT

ucts at market levels will be able toattract the target population of non-bankable (but potentially viable) bor-rowers who do not have access tocheaper products. Third, traditionallenders may be deterred from competingwith organizations that enjoy large sub-sidies. Fourth, sustainability facilitatesthe ability to raise capital from a varietyof sources. And, lastly, a focus on self-sufficiency could prompt MFIs to controlcosts. This may run up against other MFIgoals, such as serving higher risk bor-rowers, the lending to which may lead tohigher costs, but philanthropic donorsshould be more likely to respond to pro-grams that understand their pricing andconsciously manage costs.
Brewer et al.’s (1996) research into theperformance of Small Business Invest-ment Companies (SBICs) between 1958and 1996 highlighted the potentialdangers of subsidized funding. Many ofthe institutions that failed during thisperiod had used SBA guarantees, whichallowed SBICs to issue debentures atsubsidized rates. By contrast, SBICs thatused little or no SBA funding comprisedthe most successful segment of theindustry.
In terms of increasing self-sufficiency,by targeting different segments of themicrobusiness population, it is easier togenerate value by lending to individualswith better credit records, due to theirincreased ability to handle debt andlower associated default rates. However,in doing so, an MFI must be careful not
to subvert its mission. Vinelli (2002) sug-gests that mission drift can occur whena lender seeks profit not by workingharder to make better and less expensiveproducts but rather by searching for bor-rowers who are easier and cheaper toserve (Schreiner and Morduch 2002;Vinelli 2002).
Regarding pricing and self-sufficiency,Gulli (1998) suggests that institutionsmust charge sufficient interest rates tocover their costs. Bhatt, Painter, and Tang(2002) suggest that one reason for con-tinued institutional dependence on sub-sidies is an unwillingness to charge themaximum legally allowable interest ratesand fees that would allow programs tocover as much expense and risk cost aspossible from operations. Bhatt, Painterand Tang’s survey revealed that theaverage MFI interest rates in California of11 percent were significantly beneathlegal and regulatory constraints, whichvary from state to state.18
Self-sufficiency is seen as an appro-priate mechanism for achieving the long-term viability of the microfinance sector.First, available resources and subsidiesare too small to provide microfinance toall who might benefit from it. Second, afocus on self-sufficiency can lead todecreased costs through increased effi-ciency. Third, leverage is more easilyattained by organizations that generatethe means to repay debt. Finally, relianceon subsidies might alter a firm’s incen-tive structure in ways that could increasethe likelihood of a negative event.
POLLINGER, OUTHWAITE, AND CORDERO-GUZMÁN 37
18An informal survey of banking departments of states where MFIs operate reveals a wide
range of usurious lending rate caps. For example, New York and Michigan lenders may charge
up to 25 percent annual percentage rate (APR), exclusive of fees, while Colorado lenders
may charge up to 45 percent inclusive of fees. Georgia has a limit of 16 percent on loans up
to $3,000, but no explicit caps on loans greater than $3,000 (Georgia General Assembly 2004).
Such laxity is mirrored by the credit card industry: less than half of all U.S. states cap credit
card interest rates and, not surprisingly, most credit card issuers are based in states without
usury laws and without interest rate caps (Bankrate 2004). With regards to lending usury
caps, California is one of more lenient, providing exemptions for financial institutions as per
Article 15 of their state Constitution (California Legislative 2004).

The Impact of PricingInefficiencies
The MFIs surveyed in this paper arenot charging sufficient APRs to covertheir costs in providing microfinanceloans. To examine the impacts, we usethe institutional-level costs presented inTable 2 and investigate the influence thata “pricing gap”—pricing beneath thevalue-neutral APR—can have on organi-zational self-sufficiency. We model twocompeting dynamics: economies of scale,which have a positive impact on institu-tional self-sufficiency, and the pricinggap, which has a negative impact. We usethe best-case indirect cost loading, thatof the $20 million portfolio, and apply itto all institutions, regardless of size. Wethen calculate the income shortfall foreach portfolio size, using aggregateannual pricing gaps of 1, 2, 5, and 10percent.
The results are illustrated in Figure 3.We find that self-sufficiency is extremelysensitive to pricing gaps. A 1 percentpricing gap on a $20 million portfolioamounts to a shortfall of $200,000 inabsolute terms. This represents some 10percent of annual institutional operatingcosts and thus corresponds to a self-suf-ficiency level of 90 percent. A 5 percentpricing gap leads to a self-sufficiency rate
that increases slowly with portfolio sizeto a maximum of 60 percent. A 10 percentpricing gap actually leads to decliningself-sufficiency with increasing portfoliosize, as the absolute operating costsincrease more quickly than the absoluterevenues generated through such aheavily subsidized pricing scheme.
Discussion andConclusions
We have discussed the key elementsof the relationship-based financingmodel that is used by most MFIs in theUnited States. Quantifying the parame-ters of this model enables us to derivepricing that would theoretically coverboth the direct and indirect costs of pro-viding various microfinance products.Comparing these results with actualprices offered by existing institutionsreveals that credit is generally beingoffered at subsidized rates to microbusi-nesses. The majority of MFIs do not covertheir costs and it appears that cost-basedpricing is a lever that MFIs are not fullyutilizing. There are various possibleexplanations for this:
First, as previously discussed, certainfunding institutions provide capital toMFIs with restrictions on the interest
38 JOURNAL OF SMALL BUSINESS MANAGEMENT
Figure 3Impact of Portfolio Pricing Deficits on
Institutional Self-Sufficiency
1% Pricing Deficit
5% Pricing Deficit
2% Pricing Deficit
10% Pricing Deficit
0
10
20
30
40
50
60
70
80
90
100
0.0 2.0 4.0 6.0 8.0 10.0 12.0 14.0 16.0 18.0 20.0
Portfolio Size [$MM]
Self
-Suf
fici
ency
[pe
rcen
t]
rates and fees that can be charged.However, this alone cannot explain thelow APRs in the survey, as the majorityof programs surveyed are not limited bysuch restrictions. Second, lending by tra-ditional institutions such as banks maycreate downward pressure on prices. Ifsuch pressure exists, it appears to affectonly the near-bankable segment of themicrofinance market. Third, there may besome price sensitivity on the part of bor-rowers, although the survey we havepresented suggests that this may not bethe case for all segments of the popula-tion. More research is needed to betterunderstand microfinance pricing policiesin the United States. Fourth, MFIs maynot fully appreciate the true operationalcosts underlying their lending products.Organizations receiving subsidies maynot be incentivized to understand theirtrue costs and maximize their efficiencyof credit delivery. MFIs must be con-scious of the possibility that pricingproducts below market levels may leadto the misdirection of funds to morecredit-worthy borrowers who would oth-erwise seek bank financing and, in doingso, perpetuates some degree of creditmarket misallocation.
Continued subsidization of credit alsohas implications for the long-term sustain-ability of MFIs. Our high-level analysis ofprojected self-sufficiency levels of variousMFI sizes shows the importance of pricingappropriately. Even a modest deviationfrom the value-neutral price has a signifi-cant impact on the amount of subsidiesneeded to sustain the institution.As a con-sequence, it is imperative that MFIs rigor-ously analyze the true costs and reviewtheir pricing structures accordingly.
It has yet to be demonstrated thatmicrofinance can be performed prof-itably in the United States. Nondeposi-tory MFIs may not have betterinformation and/or technology to iden-tify and serve less risky microbusinessesthan formal institutions. It would there-fore appear that formal institutions are
acting rationally in choosing not to servethis market at present. However, MFIshave succeeded in channeling capital tomicrobusinesses. Still, MFIs often operatewith certain public and/or private subsi-dies. Ultimately, more research is neededto ascertain whether the provision ofmicrofinance offers a societal benefit inexcess of economic costs. This paper isone of the first to document a very widedispersion in the difference betweenvalue-neutral and actual pricing for asample of MFIs. This suggests a wide dispersion in the economic subsidiesinferred by these MFIs. More specifically,these subsidies are not being allocatedon a consistent basis.
If subsidies are required to serve themarket at palatable interest rates forlenders and borrowers, it is incumbenton the microfinance industry to demon-strate that theirs is an efficient mecha-nism for delivering such subsidies. Oncea subsidy is justified, institutions must bemotivated to improve their operationalefficiency so that they may offer microfi-nance borrowers the lowest possibleequitable prices while not jeopardizinginstitutional viability.
ReferencesACCION (2004). http://www.accion.org/
about_key_stats.asp (accessed Octo-ber 3, 2004).
Amato, Jeffery D., and Eli M. Remolona(2003). “The Credit Spread Puzzle,”BIS Quarterly Review December 2003,51–63.
Armandáriz de Aghion, Beatrice andJonathan Morduch (2005). The Eco-nomics of Microfinance. Cambridge,MA: MIT Press.
Bankrate.com (2004). http://www.bankrate.com/brm/news/cc/20020320a.asp (accessed October 18,2004).
Bates, Timothy (1995). “Why Do Minor-ity Business Development ProgramsGenerate So Little Minority Business
POLLINGER, OUTHWAITE, AND CORDERO-GUZMÁN 39

Development?” Economic Develop-ment Quarterly 9(1), 3–14.
Berger, Allen N., and W. Scott Frame(2007). “Small Business Credit Scoringand Credit Availability,” Journal ofSmall Business Management 47(1),5–22.
Bhatt, Nitin and Shui-Yan Tang (2001).“Making Microcredit Work in theUnited States: Social, Financial, andAdministrative Dimensions,” Eco-nomic Development Quarterly 15(3),229–241.
Bhatt, Nitin, Gary Painter, and Shui-YanTang (2002). “The Challenges of Out-reach and Sustainability,” in Replicat-ing Microfinance in the United States.Carr. Eds. J. H. Carr and Z. Y. Tong.Washington, DC: Woodrow WilsonCenter Press, 191–221.
Board of Governors of the Federal Reserve System (2004a). http://www.federalreserve.gov/releases/h15/update/ (accessed October 18, 2004).
——— (2004b). http://www.federalreserve.gov/dcca/cra/(accessed October 19, 2004).
Brewer, Elijah III, Hesna Genay, WilliamE. Jackson III, and Paula R. Worthing-ton (1996). “Performance and Accessto Government Guarantees: The Caseof Small Business Investment Compa-nies,” Economic Perspectives 20(5):16–32.
California Legislative Information (2004).http://www.leginfo.ca.gov/.const/.article_15 (accessed October 19,2004).
Christen, Robert C. (1998). “Keys toFinancial Sustainability,” in StrategicIssues in Microfinance. Eds. M. S.Kimenyi. R. C. Wieland, and J. D. VonPischke. Brookfield, VT: Ashgate,183–196.
Edgcomb, Elaine (2004). “Scale Up in theU.S. Microenterprise Industry,” inter-nal presentation for FIELD (Micro-enterprise Fund For Innovation,Effectiveness, Learning and Dissemi-
nation) of the Aspen Institute, April28, Washington, DC.
Federal Financial Institutions Examina-tion Council (2004). http://www.ffiec.gov/cra (accessed October 19,2004.
FIELD (Microenterprise Fund For Innovation, Effectiveness, Learningand Dissemination) of the Aspen Institute (2004). “Microtest MemberMeeting,” paper presented at the Association for Enterprise Opportu-nity Conference, May 24, Philadelphia,PA.
——— (2002). 2002 Directory of U.S.Microenterprise Programs. Washing-ton, DC: Aspen Institute.
Georgia General Assembly (2004).http://www.legis.state.ga.us/cgi-bin/gl_codes_detail.pl?code=7-4-2(accessed October 18, 2004).
Gonzalez-Vega, Claudio. (1998). “DoFinancial Institutions Have a Role in Assisting the Poor?” Strategic Issues in Microfinance. Eds. M. S.Kimenyi, R. C. Wieland, and J. D. VonPischke. Brookfield, VT: Ashgate,11–26.
Grameen Bank (2004). http://www.grameen-info.org/bank/index.html(accessed October 3, 2004).
Gulli, Hege (1998). Microfinance andPoverty: Questioning the Conven-tional Wisdom. Washington, DC: Inter-American Development Bank.
Gurski, Brian (2003). “Informal LendingStudy,” internal presentation forACCION, November 10, New York.
Ledgerwood, Joanna (1999). Micro-finance Handbook: An Institutionaland Financial Perspective; Sustain-able Banking with the Poor. Washing-ton, DC: World Bank.
Schreiner, Mark and Jonathan Morduch(2002). “Opportunities and Chal-lenges,” in Replicating Microfinancein the United States. Eds. J. H. Carr andZ. Y. Tong. Washington, DC: WoodrowWilson Center Press 19–61.
40 JOURNAL OF SMALL BUSINESS MANAGEMENT
Servon, Lisa (1999). Bootstrap Capital:Microenterprises and the AmericanPoor. Washington, DC: BrookingsInstitution.
——— (1997). “Microenterprise Pro-grams in U.S. Inner Cities: EconomicDevelopment or Social Welfare?” Eco-nomic Development Quarterly 11(2),166–180.
U.S. Small Business Administration (SBA)(2004). http://www.sba.gov (accessedOctober 16, 2004).
Vinelli, Andres (2002). “Financial Sus-tainability in U.S. Organizations,” inReplicating Microfinance in theUnited States. Eds. J. H. Carr. and Z. Y.Tong. Washington, DC: WoodrowWilson Center Press, 137–165.
Von Pischke, J. D. (2002). “Microfinancein Developing Countries,” in Replicat-ing Microfinance in the United States.Eds. J. H. Carr and Z. Y. Tong. Wash-ington, DC: Woodrow Wilson CenterPress, 65–96.
POLLINGER, OUTHWAITE, AND CORDERO-GUZMÁN 41