managing microfinance institutions: linking performance
TRANSCRIPT
HAL Id: tel-00911726https://tel.archives-ouvertes.fr/tel-00911726
Submitted on 29 Nov 2013
HAL is a multi-disciplinary open accessarchive for the deposit and dissemination of sci-entific research documents, whether they are pub-lished or not. The documents may come fromteaching and research institutions in France orabroad, or from public or private research centers.
L’archive ouverte pluridisciplinaire HAL, estdestinée au dépôt et à la diffusion de documentsscientifiques de niveau recherche, publiés ou non,émanant des établissements d’enseignement et derecherche français ou étrangers, des laboratoirespublics ou privés.
Managing microfinance institutions : linkingperformance with service and capital portfolios
Knar Khachatryan
To cite this version:Knar Khachatryan. Managing microfinance institutions : linking performance with service and cap-ital portfolios. Economics and Finance. Université Nice Sophia Antipolis, 2013. English. �NNT :2013NICE0015�. �tel-00911726�
UNIVERSITE DE NICE SOPHIA-ANTIPOLIS
Ecole Doctorale Droit et Sciences Politiques, Economiques et de Gestion (DESPEG)
MANAGING MICROFINANCE INSTITUTIONS: LINKING
PERFORMANCE WITH SERVICE AND CAPITAL
PORTFOLIOS
Thèse pour le Doctorat en Sciences Economiques
Présentée et soutenue publiquement par
Knar KHACHATRYAN
Le 18 Juin 2013
Membres du Jury :
Flora BELLONE, directrice de thèse
Professeur à l'Université de Nice Sophia-Antipolis
Olivier BRUNO, Co-directeur de thèse
Maître de Conférences à l'Université de Nice Sophia-Antipolis
Pascal GRANDIN,
Professeur à l'Université de Lille 2 et à SKEMA Business School, Directeur de la
recherche à SKEMA Business School
Valentina HARTARSKA,
Professeur à l'Université d'Auburn (USA)
Marc LABIE, Rapporteur
Professeur à l'Université de Mons, Faculté Warocqué d'Economie et de Gestion
(Belgique)
Laurent WEILL, Rapporteur
Professeur à l'Université de Strasbourg

ii
DEDICATED TO MY FATHER

iii
ACKNOWLEDGMENTS
First of all, I wish to thank my advisers, Flora Bellone and Olivier Bruno, for their continuous
intellectual support, guidance and patience. I feel delighted to have worked under their
supervision and to have had the chance of enriched discussions with them on theory,
economics and development. I have always appreciated much their availability and
dedication.
Professor Olivier Bruno gave me the opportunity to continue working under his supervision
after my Master thesis and has always supported me with valuable advice and constructive
criticism, which were essential for the successful completion of this dissertation. Talking to
him is always a source of positive inspiration and motivation. I owe to him for his support in
drawing a mathematical model that helped me shape my theoretical essay. I feel truly
indebted.
Special thanks go to Ludovic Dibiaggio, the Director of the KTO Research Group at
SKEMA Business School. I am extremely thankful to him for giving me the opportunity to
pursue this goal of my life and for his academic and personal support, not only in completing
this dissertation, but also during all these years of professional growth at SKEMA. He has a
priceless input in developing rigorous researcher skills and competences for each PhD student
at SKEMA.
My doctoral studies were mainly funded by SKEMA Business School through
Research fellowship and Teaching Assistantship contracts. The KTO PhD programme has
been encouraging to and assisting in attending external seminars and conferences and
experiencing a visiting PhD in universities abroad. I am grateful for this support.
I am also very grateful to Marc Labie who kindly welcomed me as a visiting scholar in
the Centre of European Research on Microfinance (CERMi) for one month. I would like to
thank him for his considerable support, numerous comments on the first essay of this
dissertation and for making me benefit from his deep knowledge of microfinance. My time at
CERMi’s dynamic and encouraging research environment enriched my knowledge and
understanding of microfinance not only through formal exchanges but also through various
social interactions.
I would also like to thank Valentina Hartarska, co-author of my second and third
essays. Thanks to her I had experienced two months of very fruitful and productive research

iv
period as a visiting scholar in the US. I am obliged to her for the time and dedication she
spent on helping me with the econometric work and on structuring academic papers. My
dream of writing a paper with her became true, and I learnt much from her always challenging
and rewarding comments. Her relentless intellectual curiosity and knowledge never stop
inspiring me.
I would like to acknowledge Xuan Shen, my co-author, who contributed in a valuable
way to the method development and econometric analysis of the second essay of this
dissertation.
In the process of data collocation for the empirical essays of this dissertation Justyna
Pytkowska, Research Manager of the Microfinance Centre in Poland, has shown valuable
support and kind willingness of cooperation.
Throughout my PhD studies at SKEMA I was very lucky to work alongside
distinguished faculty and brilliant students from whom I have learnt a lot. I am thankful to my
professors, the KTO Research Group members and my fellow colleagues who have always
shown willingness to help me with ideas, encouragement and challenges. Our PhD group and
my friends leaving in the French Riviera have made my social life more pleasant full of fun,
joy and warm moments.
I am endlessly thankful to my dear family. This dissertation would not have been
possible without their extremely valuable support and encouragement. They have always been
my reason to persevere.
Finally and above all, I thank my love. Vova’s emotional and professional support has
been a source of self-motivation and strength to overcome the great amount of work that a
PhD thesis represents. Words are very poor to express my gratitude for his belief in me, his
encouragement and for his love, which has no substitute.

v
SUMMARY
DEDICATION ......................................................................................................................... ii
ACKNOWLEDGMENTS ........................................................................................................ iii
SUMMARY .............................................................................................................................. v
LIST OF TABLES .................................................................................................................. VI
LIST OF FIGURES ................................................................................................................. VI
INTRODUCTION (en Français) ............................................................................................... 8
INTRODUCTION (in English) ............................................................................................... 17
CHAPTER 1. COMPULSORY VERSUS VOLUNTARY SAVINGS AS INCENTIVE
MECHANISM IN MICROLENDING CONTRACTS ........................................................... 25
CHAPTER 2. EFFICIENCY AND OUTREACH OF MICROFINANCE INSTITUTIONS:
DOES SERVICE DIVERSIFICATION MATTER? .............................................................. 67
CHAPTER 3. PERFORMANCE AND CAPITAL STRUCTURE OF MICROFINANCE
INSTITUTIONS IN EASTERN EUROPE AND CENTRAL ASIA ................................... 109
CONCLUSION ..................................................................................................................... 143
BIBLIOGRAPHY ................................................................................................................. 151
TABLE OF CONTENTS ...................................................................................................... 160
vi
LIST OF TABLES AND APPENDICES
Table 1. MFI performance analysis ....................................................................................... 75
Table 2a. Summary Statistics_For profit MFIs ....................................................................... 92
Table 2b. Summary Statistics_For non-profit MFIs ............................................................... 94
Table 3. Determinants of Providing Deposit Service _Propensity Score Calculation ............ 98
Table 4. Average Treatment Effect on the Treated (ATT) .................................................... 102
Table 5 Table 1: Sources of Funding Instruments and MFI Efficiency ................................ 119
Table 6. MFI Summary Statistics .......................................................................................... 129
Table 7. Results of the SUR Model ....................................................................................... 133
Table 8. Results of the SUR Model Using ROE ................................................................... 135
Table 9: Select Summary Statistics by MFI Type ................................................................. 137
Table 10: Return-on-Asset Regression by MFI Type ........................................................... 137
Appendix A. Summary of the Advantages and Challenges of Saving Providers ................... 58
Appendix B. Types of Savings Services ................................................................................. 59
Appendix C. Voluntary product types from the client’s and MFI’s perspectives .................... 61
Appendix D. Proof of Proposition 1 ........................................................................................ 62
Appendix E. Proof of Lemma 4 .............................................................................................. 63
Appendix F. Proof of Proposition 3 ........................................................................................ 63
Appendix G. Proof of Proposition 4 ........................................................................................ 65
Appendix H. The performance indicators of Microfinance institutions ............................... 105
Appendix I. Dimensions of social performance .................................................................... 106
Appendix J. Description of Variables Used in Analysis ....................................................... 107
Appendix K. Description of Variables Used in Analysis ...................................................... 140
Appendix L. The Breusch-Pagan Test for Independence ..................................................... 141
Appendix M. Correlation Table: MFI Type and MFI Characteristic Variables .................... 142
vii
LIST OF FIGURES
Figure 1. Possible payoffs of an investment and the corresponding probabilities .................. 42
Figure 2. Possible cases and the respective payoff for the micro-entrepreneurs .................... 44
Figure 3. Comparative typology of financing sources .......................................................... 121
8
INTRODUCTION
Au cours des trois dernières décennies, le rôle de la finance dans le développement
économique a fait l'objet d'études approfondies. En particulier, de nombreuses contributions
ont cherché à comprendre quels outils et politiques économiques pouvaient aider les plus
pauvres à améliorer leur niveau de vie et contribuer ainsi au bien-être de la société. Le
développement financier a été présenté, aussi bien par les théoriciens que par les praticiens,
comme un vecteur puissant de lutte contre la pauvreté. Les contributions théoriques portant
sur l'architecture optimale des structures financières (la nature des technologies et des produits
financiers à mettre en œuvre) ont ainsi permis de mieux comprendre le rôle de la finance dans
le développement économique (Gonzalez-Vega, 1994).
Aussi, la notion de "finance du développement" trouve une place à part entière dans le
cadre des approches financières avec asymétries d'information et marchés incomplets
(Stiglitz, 1990 ou encore Stiglitz et Weiss, 1981 et 1983) afin de comprendre les modalités de
fournitures de services financiers à une clientèle marginale constituée de ménages pauvres, de
petits fermiers ou de micro-entrepreneurs. De nombreuses études soulignent que ces agents
"marginaux", souvent les plus productifs des économies en développement, sont généralement
exclus des canaux traditionnels de financement. Ils sont en effet particulièrement vulnérables
(sans emploi, sans antécédents documentés de crédit, ne disposant pas de garanties)1 et ont
des difficultés à accéder aux services financiers formels offerts par les institutions financières
traditionnelles.
Par conséquent, il a été nécessaire de proposer de nouvelles modalités de financement
afin de lutter contre les asymétries d'information et les défauts d'exécution des contrats qui
conditionnent la viabilité des établissements de crédits qui s'adressent à cette catégorie
spécifique de la population. On peut par exemple souligner la mise en œuvre de mécanismes
originaux fondés sur des prêts de groupes ou sur la mise en place d'incitations dynamiques2.
Certains travaux (Adams, Von Pischke et Graham, 1984) ont également cherché à élaborer
une structure d'établissements de crédits, de contrats financiers et de gammes de services 1 La solution retenue par les banques et les institutions de crédit traditionnelles afin de limiter les problèmes d'asymétries d'information repose sur l'exigence de garanties (Barro, 1976; Benjamin, 1978). Cette exigence de garanties a pour objectif de créer des incitations à l'effort pour les emprunteurs tout en limitant le risque de non remboursement. 2 D'une manière générale, les incitations dynamiques constituent une incitation future (par exemple des prêts plus importants ou des taux d'intérêt plus faibles dans le futur) en échange d'un changement de comportement présent (par exemple un effort ou un engagement plus important).
9
financiers adaptés aux pays en développement, où la plupart des agents économiques
échangent des services financiers sur des marchés informels (Gonzalez-Vega, 1993).
A cet égard, une attention considérable a été portée aux institutions de microfinance
(par la suite IMF) qui, en mettant en œuvre ces nouvelles "pratiques" financières, ont permis
de financer plus de 150 millions de micro-entrepreneurs à travers le monde (Chaia et al.,
2009). Ainsi, la finance du développement proposée par McKinnon (1973) et Shaw (1973) est
aujourd'hui considérée comme une composante essentielle de la stratégie de développement
économique. Elle a prouvé son succès dans un grand nombre des pays en transition ou en
développement en Europe de l'Est, en Amérique Latine, en Asie ou en Afrique.
Alors que la microfinance a été longtemps dominée par des programmes offrant
uniquement des crédits, les développements actuels encouragent les IMF à fournir un éventail
plus large de services financiers au sein d'un portefeuille multiservices comprenant de la
micro-épargne, de la micro-assurance, des services bancaires mobiles, etc…. Ces
changements font qu'à présent "le terme de microfinance recouvre généralement de très petits
prêts, à des fins d'auto-emploi, à des clients à faible revenu, associés le plus souvent à une
collecte simultanée de petits montants d'épargne" (Karlan et Goldberg, 2010 p.20). Cette
orientation est le signe d'une généralisation de l'offre de services de microfinance combinés,
c'est-à-dire de prêts couplés à de l'épargne ou de l'assurance.
L'une des caractéristiques de cette tendance s'exprime par la volonté des IMF de
développer le marché de l'épargne afin d'atteindre les clients les plus pauvres mais également
d'attirer des dépôts à moindre coûts. Ces services couplés sont donc adaptés afin de répondre
au mieux aux besoins des plus pauvres, mais visent également à établir des relations plus
étroites et de long terme avec les clients afin de renforcer la stabilité financière des IMF.
L'évolution rapide de la microfinance a également engendré un processus de
commercialisation qui implique l'ouverture du secteur aux pratiques marchandes et qui se
concrétise par un changement des modes de financement des IMF. On assiste en particulier à
une augmentation du financement commercial (investisseurs institutionnels tels que les fonds
d'investissement en microfinance, financement par des particuliers ou des banques) au
détriment d'un financement plus traditionnel par des donateurs (ONG, fondations) ou des
subventions publiques (Christen et Drake, 2002: 4). Ces transformations institutionnelles ont
permis aux IMF de gagner un accès à deux sources importantes de capital : les fonds privés

10
(private equity) et les dépôts bancaires. Elles ont également remodelé le secteur de la
microfinance qui est devenu considérablement hétérogène non seulement en termes de
structure légale (ONG, institutions financières non bancaires, coopératives de crédit, banques
de microfinance, etc …) qu'en termes de taille des établissements, du type de clientèle visé et
de fournisseur de fonds.
Ces transformations ne sont pas neutres sur les différentes dimensions de la
performance des IMF. Ainsi, un certain nombre de travaux ont cherché à identifier l'impact
des changements que nous venons de décrire (à savoir la généralisation de services financiers
combinés et le processus d'ouverture commerciale) sur la performance des IMF (Rossel-
Cambier, 2010; Bogan, 2011; Kyereboah-Coleman, 2007). Étant donné que la spécificité des
IMF réside dans leur capacité à combiner viabilité financière et réalisation d'objectifs sociaux,
leur performance doit être mesurée à la fois par des indicateurs financiers et sociaux.
Afin de poursuivre sa mission et atteindre son autosuffisance, une IMF se doit en effet
d'être financièrement viable. Cette viabilité se définit en référence à la capacité de l'IMF à
couvrir ses coûts à l'aide des revenus qu'elle perçoit et mesure son degré d'autosuffisance
financière. Traditionnellement, les IMF ont été soutenues par divers types de subventions,
implicites ou explicites, qui leur ont permis d'assurer leurs activités. Cette dépendance aux
subventions est bien évidemment antinomique de la viabilité financière qui ne peut être
réalisée que lorsque le rendement des capitaux propres, net de toute subvention reçue, est égal
ou supérieur au coût d'opportunité des fonds (Yaron, 1992). Ledgerwood (1999) souligne que
la rentabilité et l'efficacité sont les facteurs clés qui façonnent la viabilité financière des IMF
(cf. annexe 1) alors que Yaron (1992) définit quant à lui la performance financière comme la
mesure dans laquelle le coût total des prestations de services est directement payé par les
utilisateurs de ces services.
La viabilité financière des IMF nécessite donc, au minimum, que les conditions
suivantes soient réalisées : obtenir le remboursement des prêts en temps voulu, dégager une
marge d'intérêt suffisante et contrôler les coûts afin de garantir une utilisation efficace des
ressources (de Crombrugghe, Tenikue et Sureda, 2008). Parmi les indicateurs standards de ces
trois conditions, utilisés dans la littérature, nous pouvons citer le montant des prêts non
performants (Portfolio-at-risk ou PAR), l'autosuffisance opérationnelle (qui se mesure comme
le rapport entre le revenu opérationnel et les dépenses administratives et financières) ou
encore le coût par emprunteur (qui est le rapport entre les dépenses opérationnelles et le
nombre d'emprunteurs actifs) (Armendariz et Morduch, 2005).
11
En plus de leur performance financière, l'efficacité des IMF se mesure à l'aide de leur
performance sociale. Selon la Social Performance Task Force3, cette performance sociale peut
se définir comme le "transfert effectif des objectifs sociaux d'une institution en pratiques
conformes aux valeurs sociales acceptées" (Sinha, 2006: 5). Autrement dit, elle mesure la
capacité des IMF à fournir des services appropriés qui répondent aux besoins de leur clientèle
cible et à contribuer efficacement à la réduction de la pauvreté. Cette performance sociale est
généralement mesurée par un indice hybride comprenant trois d'indicateurs principaux : le
nombre de personnes utilisant les services proposés par l'IMF sur une période donnée ; la
situation sociale des clients au début de la période et pour finir le bénéfice net associé aux
services fournis par l'IMF (qui comprend également les avantages indirects aux ménagères et
aux non-membres du ménage au cours de la période considérée).
Soulignons également les initiatives récentes (CERISE, Imp-Act Consortium, le
Réseau SEEP/Argidius Fondation, le CGAP/CERISE, l'USAID et ACCION) cherchant à
intégrer l'évaluation de la performance sociale dans les systèmes de gestion des opérations
quotidiennes des IMF et qui ont servi de fondement à la recherche académique. Ces initiatives
considèrent en particulier que la performance sociale ne doit pas être uniquement mesurée par
le biais des résultats finaux mais également par la manière dont ces résultats ont été obtenus
(notamment le processus de mise en œuvre des pratiques).
Le domaine de la microfinance est donc sujet à de nombreuses modifications qui
touchent aussi bien les pratiques des IMF, que leur organisation ou leur mode de financement.
L'objectif de cette thèse est alors de contribuer à la compréhension de l'impact de ces
modifications sur le développement et l'efficacité des sociétés de microfinance. Pour se faire,
nous nous proposons d'explorer trois thèmes particuliers, correspondant aux trois chapitres de
la thèse. Premièrement, nous chercherons à identifier des mécanismes originaux d'incitations
relatifs aux nouvelles pratiques des IMF (en particulier l'offre couplée de services financiers)
et permettant d'assurer l'exécution des contrats de financement. Deuxièmement, nous
tenterons d'évaluer la performance des IMF offrant des services de microfinance couplés
(crédit plus épargne) par rapport aux IMF traditionnelles. Enfin, nous étudierons l'impact des
3 Les IMF ont créé un réseau spécial appelé le Social Performance Task Force dans le but de coordonner leurs
différentes initiatives et de mettre en place un format commun pour leurs rapports d'activités.
12
nouvelles modalités de financement des IMF sur leurs performances à la fois financières et
sociales.
Les méthodes de recherche retenues dans les différents chapitres sont adaptées à
chacune des questions envisagées. Dans le premier chapitre nous retiendrons une approche
théorique, sous forme de modélisation, alors que les deux autres chapitres proposeront une
approche économétrique. Plus précisément, nous utiliserons deux méthodes particulières,
encore peu usitées dans les travaux relatifs à la microfinance, à savoir la Seemingly Unrelated
Regression (SUR) dans le chapitre 3 et le Propensity Score Matching (PSM) dans le
chapitre 2. Enfin, les données utilisées dans les parties économétriques proviennent de
diverses sociétés de microfinance : les bases de données en ligne de la Microfinance
Information Exchange (MIX) ainsi que le Centre de Microfinance pour l'Europe Centrale et
Orientale et les Nouveaux États Indépendants (MFC). Cette base de données originale a été
construite par nos soins.
Dans le premier chapitre, nous proposons un mécanisme orignal d'incitation au
remboursement et à la révélation des caractéristiques des emprunteurs en présence
d'asymétries d'information. L'objectif de ce chapitre est d'éclairer théoriquement comment
l'usage de la micro-épargne associé à des contrats de prêt peut servir de moyen d'incitation au
remboursement des emprunteurs et permettre, dans certains cas, aux IMF d'évaluer les
caractéristiques des demandeurs de prêts. A cet effet, nous retenons un cadre théorique
traditionnel avec asymétries d'information entre les préteurs (les IMF) et les emprunteurs
(micro entrepreneurs)4. Plus précisément, nous supposerons l'existence d'asymétries ex-ante
liées à la difficulté à déterminer le niveau de risque et la qualité des emprunteurs potentiels, le
niveau de risque des projets financés ou encore le niveau exact des compétences des
emprunteurs, etc…. La société de microfinance est également soumise à une asymétrie ex-
post, les emprunteurs pouvant dissimuler la réalité des résultats des projets entrepris et ne pas
rembourser en prétextant un échec du projet. Ces deux types d'asymétries engendrent des
4 Les sociétés de microfinance sont soumises, au même titre que les autres institutions financières, aux problèmes d'asymétries d'information et d'exécution des contrats. En particulier, il est difficile pour les prêteurs d'observer les caractéristiques des emprunteurs potentiels ainsi que de connaître la probabilité de succès de leurs activités. De même, les emprunteurs rencontrent des difficultés à trouver des informations sur l'existence de préteurs potentiels et sont soumis à des politiques de rationnement du crédit (Stiglitz et Weiss, 1981). Enfin, afin de couvrir leurs coûts opérationnels, les prêteurs ont besoin de mécanismes juridiques qui obligent les emprunteurs à les rembourser.
13
problèmes traditionnels de sélection adverse et d'aléa de moralité 5. Nous proposons alors un
mécanisme original d'incitation au remboursement et à la révélation des caractéristiques des
emprunteurs fondé sur l'existence de micro-épargne. Plus précisément, nous montrons qu'un
contrat de prêt offrant du micro crédit avec de l'épargne obligatoire créé des incitations au
remboursement et permet de limiter l'aléa de moralité. L'introduction d'un contrat de prêt avec
épargne volontaire permet quant à lui de révéler les caractéristiques des emprunteurs et de
réduire la sélection adverse.
Dans le deuxième chapitre, nous cherchons à évaluer l'impact de l'offre couplée de
services financiers (en particulier le micro crédit associé à de la micro épargne) sur la
performance financière et sociale des IMF. Nous avons souligné que le secteur de la
microfinance était sujet à différents bouleversements et qu'un enjeu important résidait dans la
capacité des IMF à répondre à la variété des besoins de leurs clients en leur offrant une large
gamme de produits financiers. Cette transformation des IMF en organisations multiservices
devrait également modifier leur capacité à répondre à leur double objectif de performance
financière et sociale. Notre objectif dans le deuxième chapitre de la thèse est donc de
comparer les IMF qui acceptent des dépôts avec les IMF qui ne mobilisent pas les dépôts afin
d'établir l'existence ou non d'une relation entre la performance (au sens large) et l’offre
couplée de services financiers (services d'épargne en plus du crédit).
En fondant nos arguments sur l'existence d'économies de gamme (voir par exemple
Rossel-Cambier, 2012) nous montrons à l'aide d'un modèle de Propensity Score Matching
(PSM) que la prestation de crédit associée à la collecte de dépôts peut contribuer à
l’augmentation de la rentabilité et à la performance sociale des organisations de microcrédit.
Nos résultats montrent en outre que ce sont les IMF les plus matures qui offrent ce type de
services couplés. Ce résultat peut s'expliquer par le fait que les IMF matures ont déjà un
certain niveau de préparation organisationnelle et disposent des ressources humaines,
financières et organisationnelles nécessaires pour faire face à la complexité de la prestation de
plusieurs services financiers. Nous montrons également que le contexte macro-économique
5 La sélection adverse apparaît lorsque le prêteur est incapable de distinguer le type de risque, et plus largement,
la qualité des emprunteurs. Cette situation peut conduire à la formation d'un groupe de clientèle composée uniquement d'emprunteurs à haut risque. L'aléa moral se pose lorsque les actions de l'une des parties prenante à une transaction affectent l'évaluation de la transaction par la seconde partie qui est alors incapable de cerner parfaitement les actions de la première partie.
14
(par exemple le niveau de la population rurale) influent directement sur la performance
économique globale des IMF dans un pays donné. Ce deuxième chapitre est étroitement lié
avec le premier et démontre l'importance des services d'épargne dans l'évaluation de la
performance globale des sociétés de microfinance.
Enfin, dans le troisième chapitre de la thèse nous cherchons à évaluer l'impact de la
structure financière des IMF sur leur performance financière et sociale. De ce point de vue, ce
chapitre complète et étend le travail déjà réalisé dans le chapitre 2. Nous tentons en particulier
de combler une lacune de la littérature sur le sujet en étudiant l'effet simultané de la structure
du capital des IMF sur leur performance financière et sociale.
Les études empiriques qui relient la structure du capital à la performance des IMF
reposent généralement sur l'estimation d'une fonction de production ou de coûts (Cull et al.,
2007, Hartarska 2005). Ces travaux évaluent alors les effets de la structure du capital sur la
performance sociale indépendamment de ses effets sur la performance financière. Néanmoins,
la littérature empirique fournit la preuve d'un arbitrage possible entre la dimension sociale et
financière de la performance et suggère que le succès financier peut parfois se réaliser au
détriment de la performance sociale, en particulier en réduisant l'offre de services financiers
aux clients les plus pauvres (Cull et al. 2007 et 2009, Hermès , Lensink et Meesters, 2011).
Ces liens entre les différentes dimensions de la performance suggèrent la nécessité de retenir
une approche empirique totalement différente afin de saisir cette interdépendance. C'est
l'objectif de ce chapitre.
Nous cherchons alors à estimer l'impact marginal des diverses sources de capital sur
trois dimensions de la performance des IMF en utilisant un modèle SUR (Seemingly
Unrelated Regression). Nos résultats suggèrent que chaque forme de capital a un impact
différencié sur la performance des IMF. Parmi les résultats marquant de notre étude, nous
pouvons noter que l'utilisation de subventions permet aux IMF d'améliorer leurs performances
financières ainsi que leurs performances sociales. De même, les prêts concessionnels et les
fonds d'investissement spécifiques en microfinance permettent d'améliorer la performance
sociale sans affecter les résultats financiers. A l'inverse, nous trouvons que ni les prêts
bancaires, ni l'épargne ne sont liés à la performance sociale ou financière des IMF. Ce résultat
confirme l'idée que l'épargne est un instrument permettant de répondre aux besoins des plus
pauvres et éventuellement de créer des incitations, mais qu'elle n'est pas un moyen efficace
d'abaisser le coût du capital des IMF.
15
Réaliser des travaux théoriques ou économétriques sur un sujet aussi vaste que la
microfinance nécessite d'effectuer des choix méthodologiques qui ne sont pas exempts de
limites. Cette thèse ne fait pas figure d'exception.
Dans le cadre de l'approche théorique développée dans le chapitre 1, nous avons supposé que
les IMF étaient capables de mobiliser à la fois une épargne obligatoire et volontaire. D'un
point de vue pratique, nous savons que l'offre d'épargne implique une gestion appropriée des
risques et de la liquidité nécessitant des mécanismes performants de contrôle interne. Cette
collecte d'épargne est également soumise à l'existence de contraintes réglementaires propres à
chaque pays. Le modèle théorique du premier chapitre repose sur une l'hypothèse générale
selon laquelle la structure juridique de l'IMF permet la collecte et la gestion des dépôts des
clients.
Les travaux empiriques sur les sociétés de microfinance souffrent pour la majorité de
l'absence des données complètes et lorsqu'elles existent, de la mauvaise qualité des données
disponibles. À cet égard, cette thèse n'est pas non plus une exception. Les deuxième et
troisième chapitres utilisent des données sur les éléments de structure du capital collectées et
compilés à partir du centre de microfinance pour les pays d'Europe Centrale et d'Europe de
l'Est. Ces données étaient disponibles uniquement pour les IMF d'Europe de l'Est et en Asie
centrale pour une période de cinq ans (2005 et 2009).

16

17
INTRODUCTION
In the past three decades the role of finance in economic development has gained much
attention for development economists who seek to understand what economic policies and
tools can help the poor to improve their lives and the welfare of society. Finance has been
viewed by both scholars and practitioners as a powerful tool to alleviate poverty, in particular,
theoretical contributions on the optimal design of financial policies, technologies and products
have aided in better understanding the role of finance in the broader context of economic
development. Financial services do indeed have a role in indirectly improving the situation of
the poor; however, they can achieve this result only when these services do what finance is
supposed to do: facilitate payments and liquidity management, intermediate funds, in order to
allow intertemporal reallocations of resources and bridge differences in marginal rates of
return among deficit and surplus units, and offer instruments to deal with risk (Gonzalez-
Vega, 1994).
Thus, the notion of development finance is embedded in the study of financial
transactions in incomplete market settings and in the provision of financial services to
marginal clienteles, such as poor households, small farmers and microentrepreneurs. In this
respect microfinance has gained considerable attention serving over 150 million micro-
entrepreneurs across the world (Chaia et al., 2009).
In today’s society the development finance, which was pioneered by McKinnon
(1973) and Shaw (1973), is considered to be an essential component of any economic
development strategy. Further theoretical contributions came from Stiglitz (1990) and others
(Stiglitz and Weiss, 1981 and 1983) who incorporated information asymmetries and agency
theory in the study of financial contracts. The studies outline the importance of development
finance by showing that the most marginally productive agents in developing economies are
excluded from formal financial intermediations. Other researchers (Adams, Von Pischke and
Graham, 1984) have also brought their contributions on the optimal design of lending
institutions, financial contracts, methodologies and range of services. More recent studies (for
instance, Gonzalez-Vega, 1993) stressed further the importance of financial technology,
organizational design and dynamic incentives6 when dealing with marginal clienteles,
particularly in developing countries where most economic agents transact financial services in 6 As a general point, dynamic incentives provide a future incentive (e.g. larger or cheaper loans) in exchange for
a change in behavior now (e.g. lower moral hazard, self-commitment).
18
informal markets. Indeed, these clienteles are even more vulnerable (and typically
unemployed, lacking documented credit histories and pledgeable collateral) 7 and less reached
by formal financial services in developing countries.
In the last decades, new lending technologies have been developed to tackle
information asymmetries and contract enforcement, which condition the success of lending
institutions. The new technologies have been implemented by specialized Microfinance
Institutions (MFIs). They have proved to work successfully in many transition or developing
countries in the Eastern Europe, Latin America, Asia, and Africa.
Despite various views on the optimal mechanism of addressing information opacity
and repayment issues in microfinance it has been commonly acknowledged that in order to
reach the target clienteles with loans at attractive terms and conditions, an appropriate
technology for delivering financial services must be developed. This technology must be
complemented with the right set of incentives both for the borrowers and the lender. These
incentives are needed on one hand, to induce the lender’s provision of financial products that
respond to legitimate demands as well as to enable lenders to ascertain the riskiness of
projects; on the other hand to induce high borrower repayment rates.
Next to this, current developments in microfinance industry encourage MFIs to offer
wide-ranging services within a multiservice portfolio including microsavings, microinsurance,
remittances, mobile banking etc. Over a very long period microfinance scene has been largely
dominated by credit-only programmes, however in its current state of evolution “the term
microfinance microfinance usually implies small loans to low-income clients for self-
employment, often with the simultaneous collection of small amounts of savings” (Karlan et
Goldberg, 2010 p.20). This recent approach is favoring combined microfinance services,
which imply joint-lending, for instance loan plus savings or insurance services. One of the
main pillars of this trend has become MFIs increasing interest in the expansion into the
savings market to reach more poor clients as well as to lower costs by attracting presumably
cheaper deposits. Joint services are tailored to better meet needs of the poor and aim at
7 The common solution in dealing with problems of information asymmetries has been based on the use of collateral (Barro, 1976; Benjamin, 1978) in traditional banks and credit institutions. The objective of requiring collateral is to provide incentives for borrowers to make efforts and perform well at the same time to repay the loan once the returns are realized. One of the specific features of microfinance lies in the fact that MFIs require non-traditional assets as collateral - borrower’s TV, refrigerator, cow etc.- or social collateral - guarantee letter of the head of community (Conning, 1999; Gonzalez-Vega et al., 1996).
19
building sustainable financial systems and establishing closer and long-term relationship with
clients.
Furthermore, the rapid evolution of microfinance has generated another essential and
closely related trend: commercialization. Commercialization process implies opening up the
microfinance industry to application of market-based principles and to moving from donor-
dependant and subsidized operations to commercial debt financing (Christen and Drake,
2002: 4). Consequently, the microfinance sector has become considerably heterogeneous not
only in terms of ownership structure (NGOs/NBFIs, credit unions, microfinance banks and
downscaling bank) but also in terms of institution size, targeted clientele, diversified capital
suppliers. In order to finance their activities MFIs have been financed initially by donor
grants. However, the commercialization has brought different capital suppliers (institutional
investors such as Microfinance investment funds, Development agencies, or private donors
(foundations and NGOs), private individuals, banks, international organizations, states. With
the institutional transformation MFIs gain access to two important sources of capital – private
equity and public deposits. All these groups are likely to have differential impact on the
different dimensions of MFI performance. In this respect there is an academic interest in
studying intensely the issue of optimal capital structure for any firm, which boils down to a
trade-off between risk and return to maximize shareholder wealth (Berger and Bonaccorsi di
Patti, 2006).
Currently, the academic interest in studying whether the abovementioned trends -
combined microfinance services and commercialization - contribute to MFIs performance is
increasing (Rossel-Cambier, 2010; Bogan, 2011; Kyereboah-Coleman, 2007).
Existing research has explored different factors influencing MFIs organizational
performance, which are reflected by variables such as governance (Mersland and Strøm,
2009; Hartarska and Mersland, 2009), loan delivery (Cull et al., 2007), tradeoff (Hermes,
Lensink and Meesters, 2011), the maturity of MFIs (Caudill et al., 2009), financial regulation
(Hatarska and Nadolnyak, 2007), the organizational structure (Tucker, 2001), the internal
management skills (Hudon, 2007), the macroeconomic context (Ahlin, Lin and Maio, 2010)
and product delivery mechanisms (McCord, Buczkowski and Saksena, 2006).
Given that the real power and distinctiveness of microfinance lies in its potential to
combine financial sustainability with meeting social goals, in other words achieving the
“double bottom line” the MFIs performance is measured both through financial and social
indicators.
20
In pursuing its mission and achieving its self-sustainability the MFI is expected to be
financially viable, which refers to the ability of a microfinance institution to cover its costs
with earned revenue. In this vein, Ledgerwood (1999) points out that profitability and
efficiency are key factors shaping the MFI financial viability (operational and financial self-
sufficiency) (cf. appendix1). Yaron (1992) defines financial performance as the extent to
which the full cost of providing services is directly paid for by service users.
Traditionally, MFIs based their activities on and were mainly sustained by various
types of implicit or explicit subsidies. In the literature subsidy dependence is viewed as the
inverse of self-sustainability, which can be achieved when the return on equity, net of any
subsidy received, equals or exceeds the opportunity cost of the equity funds (Yaron, 1992).
Such sustainability can be attained basically through fulfillment of the following conditions:
ensuring loan repayments on time, earning enough interest revenue and controlling costs to
guarantee efficient use of resources (de Crombrugghe, Tenikue and Sureda, 2008). Standard
indicators of these three components of operational performance used in the literature are
portfolio-at-risk (PAR), operational self-sufficiency (OSS) and cost per borrower
(Armendariz and Morduch, 2005). The literature highlights that in achieving the self-
sustainability the MFI has to put cost efficiency as its primary concern (Khandker, 1998).
Aside from efficiency, in the literature the MFI performance measurement boils down
as well to the investigation of its outreach. In the microfinance literature the contribution of
MFIs to poverty alleviation mainly is related to the social performance assessment. According
to the Social Performance Task Force8 social performance is the “effective translation of an
institution's social goals into practice in line with accepted social values” (Sinha, 2006: 5). In
other words, social performance is measured by the way it provides appropriate services that
respond to client needs. In general, in microfinance literature social performance is measured
by hybrid index comprising three sets of widely used indicators: the number of people using
services in a given period (breadth of outreach); their social (including poverty) status at the
beginning of the period (depth of outreach); and net benefit to each including indirect benefits
to other household and even non-household members during the period (quality of outreach or
impact).
8 MFIs have created a special network called the Social Performance Task Force with the intent to coordinate different initiatives and set up a common reporting format.

21
Recent initiatives (CERISE, Imp-Act Consortium, the SEEP Network/Argidius
Foundation, CGAP/CERISE, USAID and ACCIÓN) attempting to integrate the assessment of
social performance into regular management systems and day-to-day operations of MFIs
served as a breakthrough in academic research on MFIs social performance in the last few
years. These initiatives view social performance not exclusively through the end-result but
also through the process of achieving it. This goes in line with arguments of Copestake (2007)
who views social performance indicators as complement rather than substitute for more
flexible qualitative management.
The focus of this dissertation is on three emerging issues associated with the development of
microfinance sector: incentive mechanisms to address contract enforcement and screening
problems, performance of MFIs though the lenses of combined microfinance services (credit
plus savings), and performance of MFIs though the lenses of capital structure. The essays in
the dissertation vary in research methodology: one essay is theoretical and two are empirical.
Moreover, the data come from diverse microfinance units: Microfinance Information
Exchange (MIX) online database and Microfinance Centre for Central & Eastern Europe and
the New Independent States (MFC). As far as methods are concerned the empirical essays use
less frequently applied methodologies in microfinance studies: seemingly unrelated regression
(SUR) and propensity score matching (PSM).
In the first essay, the focus is on repayment enforcement and screening mechanisms in
microlending technologies in the context of information asymmetries. The objective is to
theoretically illuminate how employing microsavings into lending contracts can serve as a
tool for repayment enforcement by inducing ‘good behaviour’ of borrowers and allowing
MFIs to ascertain abilities of loan applicants under particular circumstances.
We claim that given that MFIs operate within a variety of principal-agent relations,
most financial institutions likewise, they have to face key concepts of the imperfect
information paradigm which are applied to credit markets.9 These problems are: a) adverse
9 Being a part of credit markets Microfinance faces information and contract enforcement problems as well.
Both lenders and borrowers are constrained with imperfect information: it is difficult for the first ones to observe
the characteristics of potential borrowers and the probability of success of their activities; and the latter ones face
difficulties in finding out information on the existence of potential lenders and their particular credit rationing
behavior (Stiglitz and Weiss, 1981). In addition to this, in order to cover their operational costs, lenders need
legal mechanisms, which will enforce repayments.
22
selection (ascertaining the quality riskiness of potential borrowers, for instance risk level of
projects, competences of borrowers, repayment etc.),10 b) moral hazard (making sure that
once the loan endorsement is given the borrower will utilize the loan properly and will be able
to repay it).11 In this respect the mechanism of enforcement comes to deal with designing
methods, which guarantee the repayment; and the mechanism of screening addresses the issue
of ascertaining borrower’s quality. As compare to the existing mechanism we offer a new
incentive system, which is based on microsavings. We built our arguments on the empirical
evidence showing that savings is being increasingly practiced by the poor. Indeed, we show
also the interest of mobilizing savings both for borrowers and MFIs. The essay builds on a
mathematical model to show that the lending contract with compulsory and voluntary savings
comes to address both the repayment and screening issues.
The second essay responds to the recent interest in offering combined microfinance
services to the poor. It investigates whether the service diversification matters for the financial
and social performance of MFIs. The goal is to compare MFIs, which take deposits with those
MFIs, which do not mobilize deposits, and to establish a relationship between the institution’s
performance and offering saving services in addition to credit. Worldwide, the supply
challenge in the microfinance industry has become not only to make loan products accessible,
but also to respond to a wider variety of clients’ needs by offering more inclusive and flexible
financial products. We claim that in their gradual transformation process MFIs become multi-
servicing organizations.
We base our arguments on the theory of economies of scope and employ a PMS model
to investigate the extent to which MFIs financial and social performance is affected by
combining microcredit with savings products. Our findings suggest that the simultaneous
delivery of credit and deposits can contribute to higher productivity of microcredit
organizations. The existing evidence shows that this can be due to the economies of scope,
which can be achieved in various fields when combining credit with savings or insurance (see
e.g. Rossel-Cambier, 2012). Cost-effectiveness in loan delivery, reduced transaction costs and
enhanced communication channels can result from the spreading of fixed costs and cost
10 Adverse selection emerges when the principal is unable to distinguish the risk type and more broadly speaking, the quality of the agents, and this situation leads to forming a pool of clients composed mainly of high-risk agents. 11 Moral hazard arises when the actions undertaken by one party in a transaction, the agent, affect the valuation of the transaction by the second party, the principal, who is unable to perfectly observe the actions of the first party.

23
complementarities when offering multiple services. We further find that within the unmatched
sample for-profit MFIs with deposit are reaching more borrowers. Similarly, with matched
sample, non-profit MFIs reach more clients if they mobilize deposits. These results as well
come to support the argument that savings should be encouraged as a better instrument to
tailor better microfinance services for the needs of the poor. Here again there is a convergence
between the results of the second chapter and the findings of the first chapter of this thesis.
The second essay is closely related to the first essay in demonstrating the importance
of saving services in the entire mindset of microfinance. First, we demonstrate theoretically
how savings could become incorporated into an incentive mechanism to face repayment and
screening problems, afterwards we use empirical data to show that MFIs, which take savings,
have better productivity and breadth of outreach.
The third essay continues looking at the performance of MFIs. It is interested in
exploring how observed changes in MFIs capital structure are likely to affect the ability of
MFIs to achieve their double bottom-line of outreach and sustainability. We build on the
arguments that recent trends in microfinance -commercialization and deposit mobilization-
affect the capital structure of the organization but little is known on how such changes would
affect all aspects of MFIs performance. We fill in a gap in the literature by studying the
simultaneous effect of capital structure on sustainability and on two dimensions of outreach of
MFIs in Central and Eastern Europe and Central Asia (ECA) during the period 2005-2009.
Empirical studies linking capital inputs to MFIs performance include production or
cost function estimation (Cull et al., 2007, Hartarska 2005). Kyereboah-Coleman (2007) used
panel data to estimate the impact of capital structure on MFIs performance within the sub-
Saharan region. Our third essay is the closest to Bogan (2011) who uses an instrumental
variable (IV) approach to estimate the effects of capital structure on operational and financial
self-sufficiency of worldwide sample of MFIs.
In all previous work we are aware of the effect of capital structure on outreach is
estimated independently of that on self-sufficiency. However, the empirical literature provides
evidence for a trade-off between the outreach and the sustainability dimensions of MFIs’
performance, suggesting that financial success may come at the expense of serving fewer and
less poor clients (Cull et al. 2007 & 2009, Hermes, Lensink and Meesters, 2011). The links
between different dimensions of performance suggest an entirely different empirical approach
to capture this dependence.

24
The contribution of this paper is to estimate the marginal impact of various sources of
capital on three dimensions of performance by employing the seemingly unrelated regression
(SUR). The results suggest that the type of capital is associated with the preferences of the
stakeholder it represents. Use of grants allows the MFI improve financial performance and
breadth of outreach. Concessional loans and special microfinance investment are useful in
improving outreach without affecting financial results. We find that neither bank loans nor
savings are linked to performance. This seems to support the idea that savings should be
encouraged as a better instrument to serve the needs of the poor but not necessarily as a way
to lower the cost of capital and increase the profitability of MFIs. This result confirms
findings of the second chapter, which suggest that the presence of deposits does not affect the
financial performance of MFIs.
The three essays attempt to demonstrate the vital necessity of favoring innovative
mechanisms in lending technologies and funding capital, which may lead to expanding the
frontier of finance for the poor.
25
CHAPTER 1. COMPULSORY VERSUS VOLUNTARY SAVINGS AS INCENTIVE
MECHANISM IN MICROLENDING CONTRACTS
1.1. Introduction
Microfinance is seen as one of various segments of the financial system. Microfinance
programmes have twofold objectives: to fill the gap left by (larger) conventional institutions
in the provision of financial services to disadvantaged sections of society, and to contribute to
their social inclusion. Nowadays, microfinance institutions (MFIs) offer more inclusive range
of financial services – loans, savings, insurance, remittances and joint-lending, which are
tailored to better meet needs of the poor. In doing so, one of the main challenges the MFIs
face is the vulnerability of their clientele who typically is unemployed, lacks documented
credit histories and pledgeable collateral. Given that MFIs operate within a variety of
principal-agent relations, most financial institutions likewise, they have to face key concepts
of the imperfect information paradigm which are applied to credit markets: adverse selection
and moral hazard. How to make those borrowers exhibit responsible behavior (and repay their
loan) and how to acquire information absent when the loan endorsement is given?
Drawing on the major success stories, researchers are attempting to unfold different
mechanisms of repayment enforcement and screening. Numerous studies tackle information
asymmetry problems for both group lending and individual microfinance programmes in
diverse context throughout different techniques of dynamic incentives. As a general point,
dynamic incentives provide a future incentive (e.g. larger or cheaper loans) in exchange for a
change in behavior now (e.g. lower moral hazard, self-commitment). Dynamic incentives aim
to induce as high borrower repayment rates as well as provision of services by lenders in
response to exiting demand. Almost all MFIs reply on dynamic incentives. However, terms
and conditions of contracts actually observed in microfinance vary according to behavior and
performance of MFIs, which make the types of these contracts quite complex and diversified
(Vigenina and Kritikos, 2004). Existing mechanisms have mainly been based on joint liability
in group lending (see the seminal papers of Stiglitz (1990), Varian (1990), Morduch (1999a)
and Ghatak (1999, 2000)) or on the use of social sanctions, collaterals and progressive lending
to individuals (Armendáriz and Morduch, 2000; Egli, 2004; Tedeschi, 2006 or Bhole and
Ogden, 2010).
The main objective of this paper goes in line with the above mentioned literature as we
want to address both issues of repayment enforcement and borrowers’ screening.
26
However, we suggest another answer to the key questions of how to frame and time
the incentives in microlending contracts so as to be socially optimal and revealing by studying
the role of microsavings in the incentive mechanism.
Over the years, the empirical evidence has witnessed the significant role of
microsavings in the service portfolio of the development finance. The large demand for
financial savings, particularly in developing countries, has been empirically demonstrated
(Vogel, 1984; Martin, Hulme and Rutherford, 2002; Robinson, 2001; Dowla and Alamgir,
2003). This argument is raised from the evidence that the poor know the value of saving and
that many households already use (informally or formally) a variety of financial and non-
financial savings mechanisms (Glisovic, El-Zoghbi, and Forster, 2010). The possibility to
save gives options to the poor to have a longer vision on their activity planning, to acquire
certain stability and risk protection, to increase their working productivity (Ledgerwood,
1999; Wright, 2003; Deshpande and Glisovic-Mezieres, 2007). This saving behavior
traditionally is viewed as an opportunity for MFIs to develop convenient and appropriate
savings services in order to meet the existing demand and fulfill their social mission. For
MFIs, deposit-taking can, indeed, be the most stable and affordable funding source that also
strengthens their self-sufficiency and reduces their dependency on external funds in long-term
(Mata, 2009, Gadway and O’Donnell, 1996; Otero, 1989; Jackelen and Rhyne, 1991).
In this paper, we aim to demonstrate that attracting microsavings into joint-lending
contracts can also serve as a tool for repayment enforcement by inducing ‘good behaviour’ of
borrowers and allowing MFIs to better screen loan applicants.
On the whole, microsavings are grouped into two main types: compulsory and
voluntary. Compulsory savings (also known as forced savings) is defined as the minimum
amount of savings, which conditions borrowers’ access to loans, and can be seen as a
collateral substitute imposing a positive inducement for repayment. The regulation of MFIs
typically does not allow to withdraw and use those savings until the loan is repaid. Voluntary
savings (also known as flexible savings) allows borrowers as well as non-borrowers to deposit
or withdraw according to their needs (Montgomery, 1996). Voluntary savings assumes that
savings and credit are integral components of financial intermediation and that savers already
know why and how to save (Robinson, 1994).
Consequently, compulsory savings perceives savings as an integral part of loans;
savers learn financial discipline and qualify for credit by a convincing savings record. The
main objective of mobilizing compulsory savings is the belief that a process of small, regular

27
payments will contribute to repayment performance by borrowers (Wisniwski, 1999;
Ledgerwood, 1999; Armendariz and Morduch, 2005). As stated by Fiebig, Hannig and
Wisniwski (1999) many microcredit programmes have used forced savings as part of their
financial technology. However, the other key challenge of MFIs, which consists in
discriminating abilities of loan applicants, stays uncovered by the compulsory savings
mechanism. Several authors have argued that this mechanism, in fact, does not serve as an
indicator about borrower’s "quality" and potential of successfully undertaking the project. The
core argument of our study boils down to investigating whether the introduction of voluntary
savings into individual microlending contracts can serve as a screening device and selection
criterion revealing information about borrowers’ abilities. It is an important matter for MFIs
as in general the probability of project success depends on borrower's ability.
Our contribution is thus related to the literature on repayment enforcement and
incentive mechanism. We, particularly, built on arguments of Armendáriz and Morduch
(2000), which are in favor of turning to savings as deposit mobilization in addressing adverse
selection and moral hazard problems.
We develop a model of asymmetric information with hidden information where
microlending is joined with microsavings. We consider two classes of agents – micro-
entrepreneurs and a Microfinance Institution (hereafter MFI) and assume that the population
of micro-entrepreneurs is divided into two types: "high-ability" and "low-ability" with two
different success probabilities (high and low). Micro-entrepreneurs need external funds in
order to invest in a risky project but because of their poor characteristics, they do not have
access to the capital market and/or bank loans and must demand financing to the MFI. We
assume that the MFI faces two informational problems in its relationships with micro-
entrepreneurs. On the one hand, the MFI is not capable of discriminating between "high" and
"low" ability micro-entrepreneurs. On the other hand, we assume that micro-entrepreneurs
have better information on the profitability of their projects and they can divert a part of the
cash from the MFI.
First, we construct an equilibrium contract between micro-entrepreneurs and the MFI,
where the repayment incentive is based on the requirement of a compulsory savings. We show
that this kind of contract allows the financing of projects with positive social value but is not
optimal since it does not allow to discriminate between "high" and "low-ability" micro-
entrepreneurs.

28
Second, we show that the introduction of voluntary savings in our framework allows
the MFI to discriminate between "high" and "low-ability" micro-entrepreneurs and restore
optimality. We construct a separating equilibrium in which all "high-ability" micro-
entrepreneurs will choose a financing contract with voluntary savings whereas "low-ability"
micro-entrepreneurs will choose a financing contract with compulsory savings only.
This complete enforcement and revealing mechanism can be seen as a new approach
as compared to the existing incentive methods designed to face enforcement and screening
issues in individual lending microfinance contracts.
Part 2 summarized the existing models dealing with information asymmetries in
microfinance. Part 3 describes the emerging importance of microsavings. A basic three-period
lending model designed for joint-lending contract is specified in Part 4. In Part 5 we derive
the equilibrium contract employing compulsory savings as enforcement to reimburse whereas
Part 6 deals with the selection enforcement created by voluntary savings. Part 7 presents
concluding remarks. Technical details involving the proofs of all propositions are presented in
the Appendix.
1.2. What are the existing methods offering?
In microfinance literature several theoretical models have been developed aiming to show
how joint liability group lending can overcome problems of screening, monitoring and
enforcement among group members. For example, models by Ghatak (1999; 2000) and van
Tassel (1999) deal with adverse selection and screening, whereas some others (Stiglitz (1990)
and Varian (1990), Armendariz de Aghion (1999) and Chowdury (2005)) focus on moral
hazard and monitoring problems in their models by demonstrating how joint liability may
help to solve these problems. A certain number of models (cf. Besley and Coate (1995) and
Wydick (2001)) are built on arguments emphasizing the role of social ties within group
lending in improving repayment performance of groups.
The joint-liability lending mechanism requires formation of a group of three to ten
persons each of whom is considered mutually responsible for all credits of the group until the
last group member has fully repaid his loan. Thus, terms of a single borrower who cannot
offer any collateral is conditional on the repayment performance of other borrowers in a pre-
specified and self-selected group of borrowers. Under the group contract loans are given to
individuals within a group and the group formation plays the role of collateral.

29
The models of Ghatak (1999) and Van Tassel (1999) are addressing adverse selection
problems in a group lending contracts.12 In general, group lending contracts in this context
either deal with the process of formation of the group (this process determines whether groups
are risk-homogeneous or risk-heterogeneous) or with problems of private information about
the type of group (the contract must take into account whether the group is high-risk or low-
risk).
Van Tassel (1999) examines joint liability loan contracts as part of a screening
mechanism for group lending schemes. He considers the possibility of generating a separating
equilibrium by offering both individual and group lending contracts, provided that groups are
homogenous. The study emphasizes the role that joint liability can have in helping lenders to
identify heterogeneous borrower types in a context where borrowers have better information
on each other’s risks than lenders do.
There are two types of agents: high-ability and low-ability. Lenders offer loan
contracts described by ( , )r s , where r is the interest rate and s is the joint liability parameter,
which represents the portion of an unsuccessful member’s loan for which the signing member
is responsible. When 0s = , the contract supposes individual liability, and any positive value
of s defines the degree of payment by a non-defaulting member of the defaulting member’s
loan. Borrowers aim to maximize their expected income and they do a repayment only if their
production projects are successful.
In these conditions, a one-period game model composed of three stages analyzes the
type of optimal loan contracts under imperfect information. The sequence of stages follows in
this way: firstly, lenders announce their offers, which means that there can be numerous
contracts as there are different types of borrowers; secondly, agents choose their contract (in
case of choosing individual liability contracts the choice is awarded and in case of choosing a
joint liability contract it is awarded if, in turn, the chosen partner selects the same contract);
and thirdly, the state of nature takes place, which means borrowers’ production projects are
successful and the loan repayment is done.
Van Tassel demonstrates that under complete information, each type of agents is given
an individual liability contract with ( ) /i i i
r p pg= - , where g is the opportunity cost of the
funds and i
p is the probability of success. The reason of not offering a joint liability contracts
12 We have decided to focus on these two models, because both they are the pioneers and represent classic approaches to deal with information asymmetries in lending contracts.

30
is explained by the fact that the interest rate must be lowered in order to offer this type of
contract without making borrowers worse off. If the lender’s expected profits are to be
positive this is not possible as the interest rate is bounded from below. As stated in the study,
the added expected costs of joint liability outweigh the expected gains from lower interest
rates in a competitive market, hence borrowers always prefer less joint liability among the
lender’s marketable loan contracts. Under these conditions, lenders will simply use individual
liability contracts.
Thus, in the context of asymmetric information when individual characteristics are
known to group members but unknown to the lender, the type of contract described above
cannot be implemented. The reason is that high-ability agents will tend to group together,
whereas low-ability agents will not show any interest in grouping together, and also high-
ability agents will not be motivated to group with low-ability agents.
Therefore, as the results show the existence of the imperfect information brings to a
separating equilibrium in which high-ability agents choose a joint liability contract and low-
ability agents choose an individual liability contract. Under certain conditions, joint liability
may be utilized as part of a screening mechanism to help a lender distinguish heterogeneous
borrowers.
The author has shown that: (a) agents will always form groups with agents of the same
type; (b) agent types can be distinguished according to the rate at which they are willing to
trade increased joint-liability commitments for lower interest rates. These findings lead to
arguing that by offering an appropriate set of loan contracts, the lender can guarantee that
only high-ability agents will accept group loan contracts in equilibrium. In this manner,
joint liability contracts offer a means of screening borrowers, not through a reliance on
collateral or credit history, but on the information endowments held among the borrowers
themselves.
The conclusion of the endogenous formation of homogeneous groups is also reached
by Ghatak, who explains the same argument as Van Tassel in his study. Ghatak (1999)
provides a theory, which is based on two criteria of group lending programmes where
borrowers are not required to put in any collateral: firstly, the implementation of joint liability
(any single borrower’s terms of repayment is conditional on the repayment performance of
other borrowers) and secondly, the selection of group members by borrowers themselves.
Ghatak (1999), similar to van Tassel (1999), argues that borrowers if allowed to form their
own groups will sort themselves into relatively homogenous groups (safe and risky). This
31
implies that risky borrowers are less willing than safe borrowers to accept an increase in the
extent of joint liability. The model shows that group formation will display positive
‘assortative matching’ under a joint-liability contract.
Ghatak’s model is designed in a way that everyone lives for one period and there is no
moral hazard. In their simple adverse selection model borrowers have information on each
other and know the probability of success of their projects, but the lender does not possess this
information. By using group contracts, the lender takes advantage of the better information
members have about each other. If there are two types of contracts offered by the bank: one
with high joint liability and low interest rates and the other with low joint liability and high
interest rate, safe borrowers will select the former contract and risky borrowers the latter. The
results come to demonstrate that the presented screening mechanism in joint liability lending,
which is based on the assumption that borrowers have information about each other, can allow
repayment rate and efficiency to be higher as compared to individual-liability contracts. In
explaining this result Ghatak argues that with homogeneous groups, for the same decrease in
the interest rate, riskier borrowers are less willing to accept an increase in joint liability. This
effect is named peerselection effect by Ghatak.
Although a vast number of MFIs have adopted group lending as their technology, in recent
years, many MFIs have experienced a shift to individual liability lending technology (for
instance, ASA and Grameen Bank (Grameen II programme) in Bangladesh, BancoSol in
Bolivia etc). This shift questioned the effectives and sustainability of group lending (Navajas,
Conning, and Gonzalez-Vega, 2003). The individual liability loan trend has been accelerated
as the microfinance community learns about some of the pitfalls of group liability lending:
good clients dislike the “free ride” off by bad clients, also clients that are good risks consider
group liability more costly, and finally as groups mature, clients typically diverge in their
demand for credit resulting in tension among group members. The individual lending trend
has gained an increasing academic interest as well (Armendáriz and Morduch, 2000, Bhole
and Ogden, 2010; Tedeschi, 2006; Egli, 2004).
Tedeschi (2006) develops a model, which uses dynamic incentives in the form of
access to additional loans and encouragement to skip from strategic default and to repay a
loan once a positive outcome is realized or to skip from the unwillingness to repay a loan. She
considers that borrowers can be induced to repay their loans by the threat of cancellation of
32
future financing. In her model, the lender and the borrower maintain a financial relationship
over several or an infinite number of periods.
A similar study is done by Egli (2004), who claims that the splitting up of loan
contracts is considered very important for enabling financing with high uncertainty about the
repayments. After having studied three different scenarios Egli (2004) concludes that the fact
that only the more profitable project will be moved to the second period reinforces the
pressure to repay even further. The author’s model focuses on progressive lending as an
enforcement mechanism, which means that only after the repayment at the end of the first
period is done the borrower can shift to the second-period project.
Another study done by Armendáriz and Morduch (2000) shows the clear trend within
the microfinance movement of turning toward individual contracts in Eastern Europe and
Russia. They claim that the success of 'group' contracts to a certain extent is driven by
mechanisms that underlie individual lending programmes such as non-conventional assets as a
collateral, dynamic incentives and a screening procedure. The authors argue that there is an
emphasis on deposit-taking in new programmes of individual-base lending which require
borrowers to put up collateral or find a third-party guarantor. They argue that even if MFIs
succeed in successfully collecting information on their clients and manage well screening and
loan monitoring, they have still to deal with problems of loan repayment. For the authors
dynamic incentives, which enforce the repayment, are expressed by the use of non-
refinancing threats and regular repayment schedules. These mechanisms complement
collateral requirements (for instance, in Russia and Albania) and social sanctions (for
instance, in China).
We will further demonstrate in details the model and argumentation of Armendáriz
and Morduch (2000). We retain this study particularly, given that it represents a more
complete approach towards explaining a set of different incentive mechanism in microfinance
lending. Indeed, this study will come to serve as one of the theoretical basis for our model.
First, in order to capture a non-refinancing threat Armendáriz and Morduch (2000)
design a model based on a simple two-period individual debt contract between two sets of
agents: a bank and a borrower. They assume that the borrower has no other source of income,
and is turning to the bank for a microloan. At the beginning of each period ( 1,2t = ) a loan of
one unit can be endorsed and in each period, the borrower uses the current loan to invest in a
project. The project can yield a total return, Π, with probability, p , and zero with

33
complementary probability, ( )1 p- . First, they assume that this probability is exogenous.
Thus, the only moral hazard problem arises at the repayment stage once the borrower has first
and second-period investment returns.
In order to prevent the borrower from taking the money and running in period 1, the
bank can threaten not to extend a new loan. This means the borrower cannot finance the
second-period investment. The scenario is as follows: In period t=1, a loan of one unit is
extended to the borrower. The borrower invests that one unit and obtains a first-period
investment return. The borrower then decides whether or not to default on the first-period debt
obligation. In period t=2, the bank decides whether or not to refinance the borrower. If the
bank does extend a new loan, the borrower invests and obtains a second-period return.
Under this threat of not being refinanced, if the borrower defaults he will get:
vp g p+ (1)
where g is the discount factor, and v ( 0 1v£ £ ) is the probability of being refinanced by
the bank. Thus, the borrower will only default strategically when her return realization is high.
Assuming the return realization is high in both periods the maximum the borrower can pocket
is p in the first period and gp in the second period (conditional upon the lender extending a
new loan, which occurs with probabilityv ). The authors make an assumption that the
borrower cannot self-finance a second-period project in the event of default in the first period.
If instead the borrower decides to repay, he gets:
(2)t
rp gp- +
where t
r is the borrower’s debt obligation. This shows that a borrower who decides to repay
in the first period will have to subtract the repayment t
r from the first-period return p .
Consequently, the bank will extend a second-period loan (i.e., will set 1v = ) in order to
reward for the borrower’s ‘good’ behavior (we will show below how the authors claim this to
be an equilibrium strategy for the bank).
Once the borrower gets the second-period return, he might default on the second-
period debt obligation with certainty given that in this model the bank cannot reward the
borrower with a new loan anymore. This means that the borrower’s second period return is
simply gp .
According to the model the borrower will decide to repay if :
(3)t
v rp g p p gp+ £ - + .

34
The equation (3) is the borrower’s incentive compatibility constraint, which says that
the bank should make sure that the borrower’s pay-off is at least as large when he does not
default as when he defaults.
On the one hand, the authors argue that in case the bank can credibly carry out the
threat not to refinance in case of default (i.e., the bank sets 0v = ), the borrower will not
default fearing to lose access to a second-period return realization. And given that the
borrower’s opportunity cost of not repaying her first-period debt obligation is gp it will not
be profitable for him to repay more than that opportunity cost. This means that the maximum
interest rate that the bank can charge is t
r gp= .
On the other hand, the bank maximizes t
r in such a way that total net pay-offs at period 1 and
period 2 are positive:
( ) 0t
p rp gp- + ³ (4).
In this case a ‘non-delinquent’ borrower will be induced to take a loan from the bank.
With the given probability p , a non-delinquent, which could have a high return realization,
will have net payoffs of t
rp - in the first period and gp in the second period. This total net
pay-off must be positive for a non-delinquent borrower to agree to enter into a debt agreement
with the bank.
As for the bank, the optimal solution is to fully carry out the threat not to refinance
delinquent borrowers (i.e., to set 0v = ) and to set t
r gp= . In this way the authors show that
the bank addresses the fear that the borrower will ‘take the money and run’ and thereby
maximizes income.
Caring on the study the authors claim that introduction of additional sanctions, W ,
such as collateral requirement (in the case of Easters Europe and Russia) or social collateral in
group lending practices (in the case of China) could imply better results.
First, the authors take the optimal strategy from the bank’s standpoint, 0v = . If W is
required as an additional sanction, the results show that the bank becomes able to charge a
higher interest rate while not fearing a higher probability of default. In this case the
borrower’s incentive compatibility constraint becomes:
tW rp p gp- £ - + (5).
So, this implies that the bank’s income will be
35
tr Wgp= + (6).
(assuming that this is less than the borrower’s revenue t
R , given that limited liability implies
that the borrower cannot be forced to pay the bank more than the value of his investment).
The model show also that without additional sanctions (i.e., if 0W = ), t
r would be equal to
gp . This means that the presence of social sanctions enables the bank to charge a higher
interest rate, while not fearing a higher probability of default.
Now, it is assumed that W is a positive inducement for repayments. In this case, it is
assumed that the bank can establish the reputation for providing loans of increasing size over
time (‘progressive’ or ‘stepped’ lending) to those borrowers who meet their debt repayment
obligations. The above incentive constraint becomes:
2trp p gp£ - + (7).
where 2
p p> . Then the bank could extract up to: 2 2
( )t
r gp gp g p p= = + - .
As a practiced example of positive inducements to repay the authors refer to BRI’s use
of rebates (equal to one quarter of interest payments) to clients with perfect repayment records
over a six month period; or giving an access to a flow of loans that increase in size over time.
And finally, the variable W is taken as a proxy for the probability of being re-financed
by another lender. Supposing that the borrower can secure refinancing by a second lender
with probability 2
v the above incentive constraint becomes:
2 tv rp g p p gp+ £ - + (8).
The authors show that the greater the likelihood of re-financing by a second lender,
with probability 2
v , the weaker will be incentives to repay the first lender, and therefore the
lower the maximum repayment t
r that can be extracted by the first lender.
Finally, the third incentive mechanism highlighted by Armendáriz and Morduch
(2000) is based on regular repayment schedules. This mechanism also helps screen out
undisciplined borrowers at the same time providing the MFI with a steady flow of information
on client behaviour. According to the authors one of the most interesting implications of
regular repayment schedules is that they make credit contracts look much more like
arrangements for saving. Building on arguments that microfinance credit contracts provide a
way to substitute for imperfect savings vehicles (Rutherford, 2000) Armendáriz and Morduch
(2000) argue that the commitment to making small, regular installments to the MFI allows

36
clients to “get a usefully large amount of money at their disposal, much as would happen
through a regular saving plan”.
In sum, the mentioned two different contract designs- group micro-lending and individual
lending- share certain common features: detailed analysis of borrowers’ characteristics and
potential of projects, credit rationing (Stiglitz and Weiss,1981), regular repayment
schedules,13 dynamic incentives such as rewards (i.e. progressive lending which means
eventually increasing loan sizes as the borrower demonstrates capacity and willingness to
repay over time) and punishments (i.e. termination threat of the lender-borrower
relationship).14
The main argument against the individual contract raised in the literature highlights
that the collateral requirement does not allow to reach the target group of poor people,
because it is in particular those persons who have nothing to pledge as collateral (Khandker,
1998). When it comes to major argument against the group-loan contract it is raised that the
screening, monitoring and enforcement costs which are partly transferred from the lender to
the borrowers’ group are too high for the borrowers (Schmidt and Zeitinger, 1997).
Building on the above said we claim that dynamic incentives are vital in addressing
information asymmetries. More precisely, in this chapter we suggest a novel theoretical model
of dynamic incentives based on savings employment. Further in Part 3 we review the existing
empirical evidence to demonstrate the increasing interest in microsavings both from MFIs and
borrowers perspective.
1.3. Emerging importance of microsavings
Over the years, the empirical evidence has witnessed the significant role of microsavings in
the service portfolio of the development finance. The large demand for financial savings,
particularly in developing countries, has been empirically demonstrated (Vogel, 1984; Martin,
Hulme and Rutherford, 2002; Robinson, 2001; Dowla and Alamgir, 2003). This argument is
13 The requirement that repayments must start almost immediately after disbursement and proceed with regular installments thereafter (cf. Armendáriz and Morduch, 2000). 14 In individual lending methods splitting up of loan contracts is considered very important for enabling financing without collateral (Tedeschi, 2006; Egli, 2004, to name just a few). Progressive lending is put into practice in the form of access to additional loans, encouragement to skip from strategic default and to repay the loan once a positive outcome is realized.
37
raised from the evidence that the poor know the value of saving and that many households
already use (informally or formally) a variety of financial and non-financial savings
mechanisms (Glisovic, El-Zoghbi, and Forster, 2010). The possibility to save gives options to
the poor to have a longer vision on their activity planning, to acquire certain stability and risk
protection, to increase their working productivity (Ledgerwood, 1999; Wright, 2003;
Deshpande and Glisovic-Mezieres, 2007). This saving behavior traditionally is viewed as an
opportunity for MFIs to develop convenient and appropriate savings services in order to meet
the existing demand and fulfill their social mission (see Appendix A). For MFIs, deposit-
taking can indeed be the most stable and affordable funding source that also strengthens their
self-sufficiency and reduces their dependency on external funds in the long-term (Mata, 2009,
Gadway and O’Donnell, 1996; Otero, 1989; Jackelen and Rhyne, 1991).
In the framework of this thesis we use the definition of savings given by Ledgerwood
(2002): Savings deposits allow a certain sum of money to be accessible in future in exchange
for a series of savings made now. On the whole, microsavings are grouped into two main
types: compulsory and voluntary (see Appendix B).
The first type of savings is funds which condition the access to loans through the
mechanism of locking a part of funds in a savings account. Since they are linked to receiving
and repaying loans, compulsory savings (also known as forced savings) can be considered as
a loan product rather than savings (Ledgerwood, 2002). Consequently, borrowers perceive
this service as an additional charge they are required to pay to get access to loans. Indeed, the
regulation of some MFIs does not allow to withdraw those savings while they have a loan
outstanding and to use it until the loan is repaid. The main objective of mobilizing
compulsory savings is the belief that a process of small, regular payments will contribute to
repayment performance. Compulsory savings are used to serve as an additional guarantee
mechanism for MFIs. Moreover, they are useful to demonstrate the quality of borrowers in
terms of managing cash flow and making periodic contributions (Wisniwski, 1999;
Ledgerwood, 1999; Armendariz and Morduch, 2005).
The second type of savings, contrary to compulsory savings, does not condition the
access to microloans. This service allows borrowers as well as non-borrowers to exercise
choice over whether or not to save, and, when a variety of savings schemes are offered, over
the timing and amount of savings and withdrawals. Voluntary savings (also known as flexible
savings) assumes that savings and credit are integral components of financial intermediation
and that savers already know why and how to save (Robinson, 1994).

38
As of today a number of voluntary savings’ forms are being offered by MFIs (see
Appendix C). For instance, regulated MFIs, such as credit unions or savings banks, practice
time/certificate deposit. This savings service allows clients to decide on voluntary basis to
make a single deposit that cannot be withdrawn for a specific period of time. At the appointed
time, the saver can withdraw the saved amount. Next to this, time deposits have also gained
an importance usage. With this service the MFI offers a range of possible terms and usually
pays a higher interest rate than on its passbook or contractual products.
Certain conditions have to be met by MFIs, which want to offer voluntary savings: an
enabling legal and regulatory environment, adequate and effective supervisory capabilities to
protect depositors, and a consistently good management of the MFIs funds (Ledgerwood,
1999). Robinson (2001) shows that in many countries government regulations do not allow
non-governmental organizations (NGOs) and non-bank financial institutions (NBFIs) to
collect savings from the public. For instance, according to CGAP and MIX report (2011
March), in some countries of the Eastern Europe and Central Asia regulations do not allow
deposit-taking by non-bank institutions, so no MFI can collect savings (and does not). The
reason is that policy makers want to prevent quasi-deposit-taking (i.e., borrowing or
investments from clients, the terms of which come close to those of typical retail deposit-
taking). For instance, in Armenia microfinance is dominated by a few key institutions,
organized predominantly as universal credit organizations, and no credit organizations are
allowed to take deposits. Other examples are of MFIs, which cannot collect deposits, are in
Georgia, Kazakhstan and Azerbaijan. 15,16
On the other hand, in other countries, some MFIs, which are registered as deposit-
taking (credit unions), can collect client deposits. But often they do not do so, because of low
capacity to introduce a new product, reorganize the institution and so on, or because of low
demand for deposit products among their clients. Another reason is access (or lack of it) to
funding for credit portfolio - the MFI can decide to start collecting deposits in order to have
funds for credit operations (eg. Kyrgyzstan). 17
Accordingly, compulsory savings perceives savings as an integral part of loans; savers
learn financial discipline and qualify for credit by a convincing savings record. As stated by
15http://lexbox.am/uploads/PDF/Georgia%20Laws/law_of_georgia_on_microfinance_organizations_eng.pdf 16http://www1.ifc.org/wps/wcm/connect/cbc22b004ac3652294e1b72e0921df6a/IFC_Leaflet_Seminar_final_legal.pdf?MOD=AJPERES&CACHEID=cbc22b004ac3652294e1b72e0921df6a 17http://www.bu.edu/bucflp/files/2012/01/Law-No.-124-on-Microfinance-Organizations-in-the-Kyrgyz-Republic-English.pdf

39
Fiebig, Hannig and Wisniwski (1999) many microcredit programmes have used forced
savings as part of their financial technology. However, the other key challenge of MFIs,
which consists in discriminating abilities of loan applicants, stays uncovered by the
compulsory savings mechanism. Several authors have argued that this mechanism, in fact,
does not serve as an indicator about borrower’s "quality" and potential of successfully
undertaking the project. The core argument of our study boils down to investigating whether
the introduction of voluntary savings into individual microlending contracts can serve as a
screening device and selection criterion revealing information about borrowers’ abilities. It is
an important matter for MFIs as in general the probability of project success depends on
borrower's ability.
Different opinions were expressed also on the timing and sequencing of savings
services. The seminal paper of Otero (1989) argues that compulsory savings can be
introduced as a first step which will allow MFIs to gain savings experience. And over their
evolution process MFIs can design voluntary savings products. For Robinson (1994) savings
mobilization should be a gradual process with development of various voluntary savings
products and methodologies.
Literature highlights as well some disadvantages of savings mobilizations: first, its
implication of operational and transaction costs; second, as requirements are higher in the
field of market risks management, mobilizing highly liquid and small voluntary savings
requires more sophisticated management skills (Ledgerwood, 1999; Fiebig, Hannig and
Wisniwski, 1999). Certain scholars (Zeller and Sharma, 2000; Dowla and Alamgir, 2003;
Fiebig, Hannig and Wisniwski, 1999; Schmidt and Zeitinger, 1996) have more skeptical point
of view arguing that savings mobilization costs and risks may lead to high costs and
additional difficulties in risk. As to them deposit taking is considered as an additional service
to customers.
However, the above mentioned empirical evidence has shown the existing and
increasing demand of savings services for the poor. Moreover, the microfinance practice
made it obvious that meeting this demand can be beneficial from two perspectives: borrowers
and MFIs. The main and the most essential expectations for the poor who are willing to save
in a financial institution are convenience (an easy access to savings services), liquidity (an
access to savings whenever needed) and security (safety of the savings and stability of the
institution that collects them) (Ledgerwood, 1999; Wright, 2003; Deshpande and Glisovic-
Mezieres, 2007). From the MFI perspective the main benefits to savings mobilization are:
40
first, financial self-sufficiency of the institution is fortified - savings represent a relatively
stable and cheap source of funds; second, dependency on external borrowing is reduced
(Mata, 2009, Gadway and O’Donnell, 1996; Otero, 1989; Jackelen and Rhyne, 1991).
Our contribution is thus related to the literature on repayment enforcement and
incentive mechanism. We, particularly, built on arguments of Armendáriz and Morduch
(2000), which are in favor of turning to savings as deposit mobilization in addressing adverse
selection and moral hazard problems.
We develop a model of asymmetric information with hidden information where
microlending is joined with microsavings. We consider two classes of agents – micro-
entrepreneurs and a Microfinance Institution (hereafter MFI) and assume that the population
of micro-entrepreneurs is divided into two types: "high-ability" and "low-ability" with two
different success probabilities (high and low). Micro-entrepreneurs need external funds in
order to invest in a risky project but because of their poor characteristics, they do not have
access to the capital market and/or bank loans and must demand financing to the MFI. We
assume that the MFI faces two informational problems in its relationships with micro-
entrepreneurs. On the one hand, the MFI is not capable of discriminating between "high" and
"low" ability micro-entrepreneurs. On the other hand, we assume that micro-entrepreneurs
have better information on the profitability of their projects and they can divert a part of the
cash from the MFI.
First, we construct an equilibrium contract between micro-entrepreneurs and the MFI,
where the repayment incentive is based on the requirement of a compulsory savings. We show
that this kind of contract allows the financing of projects with positive social value but is not
optimal since it does not allow to discriminate between "high" and "low-ability" micro-
entrepreneurs.
Second, we show that the introduction of voluntary savings in our framework allows
the MFI to discriminate between "high" and "low-ability" micro-entrepreneurs and restore
optimality. We construct a separating equilibrium in which all "high-ability" micro-
entrepreneurs will choose a financing contract with voluntary savings whereas "low-ability"
micro-entrepreneurs will choose a financing contract with compulsory savings only.
We aim to show that this incentive mechanism based on the employment of compulsory and
voluntary savings, in which the former faces the repayment problem (contract enforcement),
and the latter deals with ascertaining borrowers’ abilities (screening), can be seen as a new

41
approach as compared to the existing incentive methods in individual lending microfinance
contracts.
1.4. The Model
We consider two classes of agents – micro-entrepreneurs and a Microfinance Institution
(hereafter MFI) – and three periods. In the first period, micro-entrepreneurs need external
funds in order to invest in a risky project. We assume that, because of their poor
characteristics, micro-entrepreneurs do not have access to the capital market and/or bank
loans and must demand financing from the MFI. In this period, financial contracts are signed
between micro-entrepreneurs and the MFI and investment decisions are made. In the two
following periods, payoffs on investment are realized and micro-entrepreneurs have to pay for
their external funds or can be liquidated. We assume that all parties are risk neutral and
protected by limited liability.
1.4.1. Micro-entrepreneurs’ behaviors
At the initial period ( )0t = , micro-entrepreneurs can either choose to borrow one unit of
capital (microcredit) in order to undertake a risky project or to yield income from other
sources of activities (payroll employment). Let us denote tY with 1,2t = the value of the
income generated by these activities at period 1 and 2. We also take for granted that micro-
entrepreneurs have an initial level of income inherited from previous activities and labeled
0 1Y < . They, thus, lack capital in order to invest.
We assume that, if they decide to invest, all micro-entrepreneurs have access to the
same risky project that generates a stochastic payoff equal to 0 (in the case of project failure)
or tR (if the project is successful) with 1,2t = , the two periods of investment. Project
success probability,ip , depends on the "quality" of the micro-entrepreneur who runs it. At
present, the population of micro-entrepreneurs is divided into two types: "high-ability" and
"low-ability" respectively in proportion q and ( )1 q- . If the micro-entrepreneur is of "high-
ability", the success probability of his project is equal to h
p whereas it equals to l
p in case of
"low-ability", with h l
p p> . Finally, we define 1g > as the opportunity cost of the fund
which is defined as the riskless interest rate of the economy plus the initial value of the
investment.
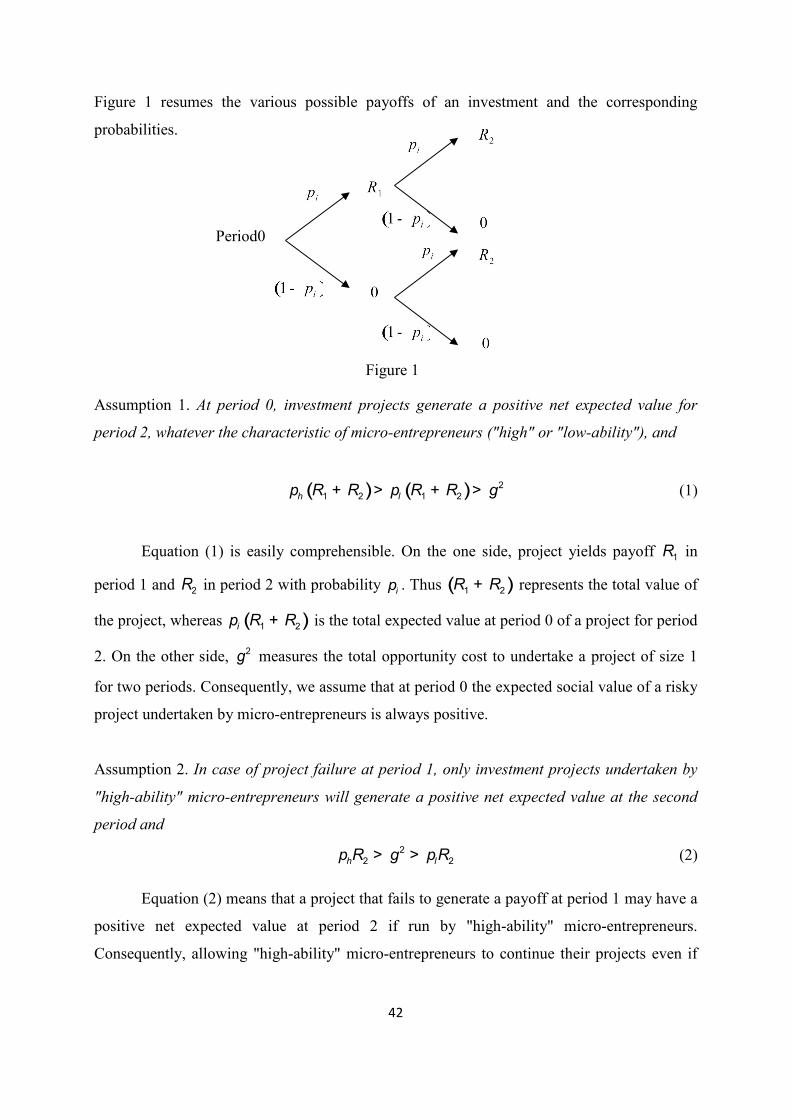
42
Figure 1 resumes the various possible payoffs of an investment and the corresponding
probabilities.
Assumption 1. At period 0, investment projects generate a positive net expected value for
period 2, whatever the characteristic of micro-entrepreneurs ("high" or "low-ability"), and
( ) ( ) 2
1 2 1 2h lp R R p R R g+ > + > (1)
Equation (1) is easily comprehensible. On the one side, project yields payoff 1R in
period 1 and 2R in period 2 with probability ip . Thus ( )1 2R R+ represents the total value of
the project, whereas ( )1 2ip R R+ is the total expected value at period 0 of a project for period
2. On the other side, 2g measures the total opportunity cost to undertake a project of size 1
for two periods. Consequently, we assume that at period 0 the expected social value of a risky
project undertaken by micro-entrepreneurs is always positive.
Assumption 2. In case of project failure at period 1, only investment projects undertaken by
"high-ability" micro-entrepreneurs will generate a positive net expected value at the second
period and
2
2 2h lp R pRg> > (2)
Equation (2) means that a project that fails to generate a payoff at period 1 may have a
positive net expected value at period 2 if run by "high-ability" micro-entrepreneurs.
Consequently, allowing "high-ability" micro-entrepreneurs to continue their projects even if
Period0
Figure 1
43
they failed to generate a positive payoff at period 1 is efficient from the entire society point of
view. This is not the case for projects run by "low-ability" micro-entrepreneurs.
Finally, because of their poor characteristics and their information opacity, micro-
entrepreneurs who decide to invest do not have access to the traditional financial services and
must demand financing from a Microfinance Institution in order to obtain a microcredit.
1.4.2. Microfinance Institution
We assume that the MFI does not have equity capital and have to raise funds at cost g per
period from local or external financial institutions in order to provide small-scale financial
services to micro-entrepreneurs. The MFI requires a payoff t tr R£ with 1,2t = from all
micro-entrepreneurs it is financing.
We assume that the MFI faces two types of informational problems in its relationship
with micro-entrepreneurs.
On the one hand, we assume that the MFI is not capable of discriminating between
"high" and "low" ability micro-entrepreneurs. However, since at period 0 all investment
projects have a positive net expected value for period 2 (Assumption 1), this ex-ante
informational problem does not prevent the MFI to finance micro-entrepreneurs.
Nevertheless, problems may occur at period 1 if the financed project fails to generate a
positive payoff. In that case, indeed, because of Assumption 2, projects run by "low ability"
micro-entrepreneurs must be ended as their net expected value for period 2 is now negative.
However, allowing "high-ability" micro-entrepreneurs to continue their projects even if they
do not generate positive payoff at period 1 is still efficient. Consequently, as the MFI is not
able to discriminate between the two types of micro-entrepreneurs, inefficient situations are
possible.
On the other hand, we retain a Costly State Verification framework as we assume that
micro-entrepreneurs are better informed on the profitability of their projects and they can
divert a part of the cash from the MFI. More precisely, micro-entrepreneurs may announce
0, 1,2tR t= " =% in order not to pay back tr to the MFI, whereas the true value of the payoff
is 0tR > . The literature shows that lenders can conduct costly deterministic audit that
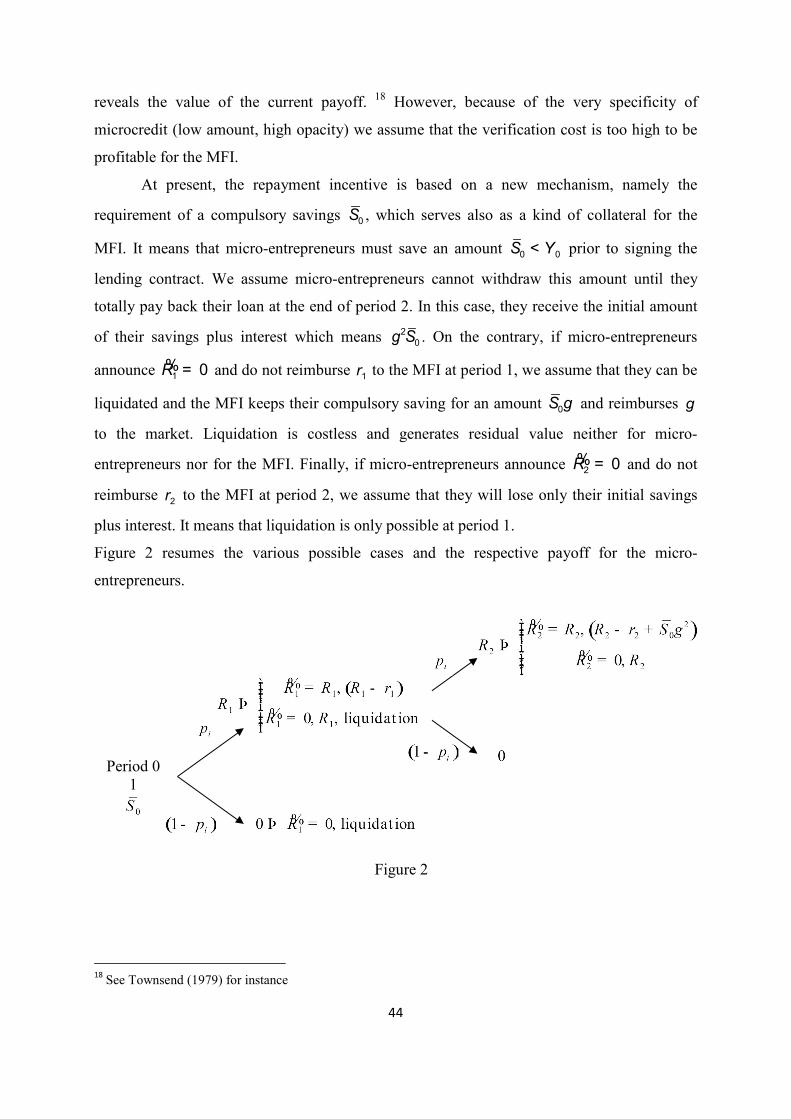
44
reveals the value of the current payoff. 18 However, because of the very specificity of
microcredit (low amount, high opacity) we assume that the verification cost is too high to be
profitable for the MFI.
At present, the repayment incentive is based on a new mechanism, namely the
requirement of a compulsory savings 0S , which serves also as a kind of collateral for the
MFI. It means that micro-entrepreneurs must save an amount 0 0S Y< prior to signing the
lending contract. We assume micro-entrepreneurs cannot withdraw this amount until they
totally pay back their loan at the end of period 2. In this case, they receive the initial amount
of their savings plus interest which means 2
0Sg . On the contrary, if micro-entrepreneurs
announce 1 0R =% and do not reimburse 1r to the MFI at period 1, we assume that they can be
liquidated and the MFI keeps their compulsory saving for an amount 0S g and reimburses g
to the market. Liquidation is costless and generates residual value neither for micro-
entrepreneurs nor for the MFI. Finally, if micro-entrepreneurs announce 2 0R =% and do not
reimburse 2r to the MFI at period 2, we assume that they will lose only their initial savings
plus interest. It means that liquidation is only possible at period 1.
Figure 2 resumes the various possible cases and the respective payoff for the micro-
entrepreneurs.
18
See Townsend (1979) for instance
Figure 2
Period 0 1

45
1.4.3. Incentive mechanisms
We deal with the main incentive conditions that are required in order for the MFI to finance
micro-entrepreneurs and for micro-entrepreneurs to undertake a risky project.
Let us first begin with incentive for micro-entrepreneurs (with "high" or "low-ability") to
announce the true payoff at each period in case they have obtained a loan. We solve for the
incentive constraints using backward induction. Recall that tR% is defined as micro-
entrepreneurs' payoff announcement to the MFI at period 1,2t = , and that this announcement
may be different from the true payoff tR .
Lemma 1. If 20 2
1r
Sg
= < as 2
2r g< , a micro-entrepreneur that succeeded in period 1 and
announced the true payoff 1 1R R=% will also announce the true payoff 2 2R R=% and pay back
2r to the MFI if his project succeeds in period 2 ■
Proof of Lemma 1 is the following. Just recall that micro-entrepreneurs must save an
amount 0S (compulsory saving) prior to obtaining a loan. This savings is invested by the MFI
at rate g and reimbursed at the end of period 2 if micro-entrepreneurs have paid back 1r and
2r . Assume that the project of a micro-entrepreneur succeeded in period 1 and that he
announced the true payoff ( )1 1R R=% and paid 1r to the MFI. In period 2, if his project
succeeds, this micro-entrepreneur has two choices. First, he announces the true payoff
2 2R R=% , reimburses 2r and receives the initial amount of his savings plus interest 2
0Sg .
Second, he announces the false payoff 2 0R =% , retains the total payoff 2R for himself, does
not reimburse 2r and loses the amount of his saving. The micro-entrepreneurs will always
announce the true payoff and reimburse to the MFI at period 2 if ( ) 2
2 2 0 2R r S Rg- + ³ ,
which leads to 20 2
1r
Sg
³ < as 2
2r g< (see Appendix D). Actually, the MFI imposes the
minimum incentive value for the compulsory saving at the initial period and we have
20 2
rS
g= .
According to Lemma 1, a minimum amount 0S of compulsory savings creates an incentive
for micro-entrepreneurs to announce the true payoff at period 2.

46
Lemma 2. If 2 21
ip R Yr
g
-£ with 2 2lpR Y³ , a micro-entrepreneur that succeeds in period 1
declares 1 1R R=% , pays back 1r to the MFI and he is encouraged to continue his project in
period 2 ■
The proof of Lemma 2 is in two parts.
First, assume that a micro-entrepreneur (with "high" or "low-ability") succeeds and
pays back 1r to the MFI. In that case, he can continue to run his project which gives rise to an
expected present value of ( )2
2 2 0 , ,ipR r S i h lg
g- + " = . Note that this value is conditional
on the announcement of the true payoff at period 2 in case of success of the project. It means
that, at the initial period 0t = , the MFI imposes the minimum incentive value for the
compulsory saving 20 2
rS
g= and ( )2
2 2 0 2i ip p
R r S Rgg g
- + = . The micro-entrepreneur can
also drop his project and find a job in order to receive the present value 2Y
g at period 2.
Consequently, he will prefer to continue if 22
ip YR
g g³ or 2 2ip R Y³ . As this value must be
an incentive even for the "low-ability" micro-entrepreneurs, we must have 2 2lpR Y³ since
l hp p< .
Now, we must prove that a micro-entrepreneur that succeeds in period 1 declares
1 1R R=% and pays back 1 1r R< to the MFI. Similar to the previous situation, in period 1, a
micro-entrepreneur that succeeds has two choices. First, he announces the true payoff
1 1R R=% , reimburses 1r and continues his project in order to obtain 2R with a probability
ip
at period 2. The expected present value of this action is given by
( ) ( )2
1 1 2 2 0
1iR r p R r S g
g- + - + (3)
Note that this value is still conditional on the true declaration at period 2 in case of
success of the project. As in the earlier situation we set 20 2
rS
g= and equation (3) becomes
( )1 1 2
1iR r p R
g- + .

47
Second, if the micro-entrepreneur announces the false payoff 1 0R =% , he retains the
total payoff 1R for himself, he does not reimburse 1r , loses the amount of his saving and finds
a job in order to receive 2Y at period 2. The expected present value of this action is given by
21
YR
g+ . Consequently, the micro-entrepreneur will always tend to announce the true payoff
and reimburse the MFI at period 1 if ( ) 21 1 2 1
1i
YR r p R R
g g- + ³ + or 2 2
1ip R Y
rg
-£ .
According to Lemma 2, in order to prevent micro-entrepreneurs to drop the project at
period 1, risky projects must generate in expectation at period 2 a higher payoff that the
payroll employment for the same period.
Finally, we must find the condition under which a micro-entrepreneur, no matter what
his ability is, prefers to invest rather than having payroll employment.
Lemma 3. 0 1 2, ,Y Y Y" , if ( ) 2
1 1 2 1 2 02 2
1 1 1 1l l l
p R r p R Y p Y Sg gg g
- + ³ + + , at period 0, the
micro-entrepreneur prefers to invest in a risky project than to have payroll employment ■
At period 0, the micro-entrepreneur may decide to keep his payroll employment and
the present expected value of this choice is given by 0 1 22
1 1Y Y Y
g g+ + .
He may also decide to undertake a risky project and to borrow a microcredit from the MFI. In
that case, according to the previous incentive conditions, the present expected value of this
choice is given by
( ) ( ) ( ) ( )2
0 0 2 1 1 2 2 0
1 1 1 11 i i iY S p Y p R r p R r S g
g g g g
é ù é ùê ú ê ú- + - + - + - +ê ú ê úë û ë û
(4)
Taking into consideration the fact that according to Lemma 1 we have 20 2
rS
g= , a
micro-entrepreneur decides to undertake a risky project if
( ) 2
1 1 2 1 2 02 2
1 1 1 1l l lp R r p R Y p Y Sg g g g
- + ³ + + .
According to Lemma 3, in order to encourage micro-entrepreneurs to undertake a risky
project at period 0, this project must generate a higher expected payoff at period 0 than the
payroll employment for the same period.

48
In respect to the conditions stated by Lemma 1 to 3, presenting the equilibrium
contract between micro-entrepreneurs and the MFI that allows the financing of their risky
projects is now possible. We show that a contract with compulsory savings only is sub-
optimal for the whole economy as it prevents "high ability" micro-entrepreneurs to continue
their activity in case of project failure at period 1 even if their projects still have a net present
value for the economy at period 2.
1.5. Financial equilibrium contracts with compulsory savings
We assume that the objective of the MFI is to maximize micro-entrepreneurs access to micro-
credit, since all projects have a positive net expected value at period 0. However, the MFI
must also ensure its financial equilibrium. Consequently, we assume that it behaves
competitively and fixes 1r and
2r according to a nonprofit condition. Proposition 1 gives the
main characteristic of the equilibrium contract between micro-entrepreneurs and the MFI.
PROPOSITION 1. Under conditions exposed in lemma 1 to 3 and assuming that
2
2 2
1
2l
R Yp
gæ ö÷ç> + ÷ç ÷÷çè ø, there is an equilibrium contract * * *
0 1 2, ,S r ré ùë û
between micro-entrepreneurs
and the MFI with:
( )( )*
0
11 1 1
2h lS p pq q
æ ö÷ç= - + - <÷ç ÷çè ø, ( )( )* * 2 2
1 2
1, 1 1
2 2h lr r p p
gg q q g
æ ö÷ç= = - + - <÷ç ÷çè ø such that:
a. All micro-entrepreneurs ask for a microcredit at period 0 and are financed;
b. It is always optimal for the MFI to liquidate a project that fails to generate a
positive payoff at period 1, whereas all micro-entrepreneurs have an incentive to
continue;
c. The MFI is at equilibrium and realizes the nonprofit condition ■
Proof: see Appendix D.
Proposition 1 states that compulsory savings can create the incentive condition
required in order to allow all micro-entrepreneurs to be financed by the MFI. Moreover, this
equilibrium contract maximizes the net expected payoff of micro-entrepreneurs since the MFI
just received the minimum payoffs ( )* *
2 1,r r that ensure its financial equilibrium. Nevertheless,
this equilibrium contract cannot solve the ex-ante informational problem faced by the MFI,
and discriminating between "high" and "low-ability" micro-entrepreneurs still remains a
49
challenge for the MFI. Consequently, it is always optimal for the MFI, in order to minimize
its losses, to liquidate a project that fails to generate a positive payoff at period 1.
PROPOSITION 2. The equilibrium contract * * *
0 2 1, ,S r ré ùë û
is socially non optimal since a fraction
( )1 hpq - of positive net expected value projects are liquidated in period 1 whereas their
social value is positive ■
Proof of Proposition 2 is obvious since there is a proportion q of "high-ability" micro-
entrepreneurs that are financed in the initial period and that fails to reimburse *
12
rg
= at
period 1 with a probability ( )1 hp- . According to proposition 1, the projects of these micro-
entrepreneurs are liquidated by the MFI even if their social value is positive. Consequently,
there is a net expected loss of ( )( )2
21 h hp p Rq g- - for the whole society.
Proposition 1 and 2 allow us to derive two main results. Firstly, an equilibrium
contract between micro-entrepreneurs and the MFI provides an equal access to all types of
loan applicants. This contract is based on compulsory saving as an equilibrium solution for
the lender to induce the repayment by the borrower when attributing the loan. This
equilibrium contract also enlarges the number of financed projects emphasizing the social
outreach of micro lending. Secondly, we show that this equilibrium contract is non-optimal
since it cannot prevent the MFI from liquidating an efficient project at period 1.
Consequently, the question is what kind of mechanism could be put into practice to help to
discriminate borrowers’ ability and continue to finance "promising" projects? We further
demonstrate that in order to reestablish optimality we can introduce voluntary savings to
incentivize non-delinquent and "high-ability" micro-entrepreneurs to declare their abilities.
These more complete lending contracts including voluntary savings need an adjustment of
interest rates for the sake of creating a positive social value and not making "high-ability"
micro-entrepreneurs suffer from the burden of "low-ability" borrowers.
1.6. Financial equilibrium contracts with compulsory and voluntary savings
We now consider equilibrium contracts with compulsory and voluntary savings. We assume
that the MFI offers two different contracts to micro-entrepreneurs: one with compulsory
50
savings only (hereafter CSC for Compulsory Savings Contract) and the other with
compulsory and voluntary savings (hereafter VSC for Voluntary Savings Contract).
We built on the arguments in favour of separating contract, which is typically considered as
an optimal contract (Rothschild and Stiglitz, 1976). In the separating contract the principal
offers different contracts to different types of agents and each type finds it optimal to choose
the contract that has been predesigned for his risk type19.
One important question, which arises when considering different characteristics of
voluntary and compulsory savings, is “Can the institution mobilize both compulsory and
voluntary savings at the same time?” As argued by Hirschland (2005, p.146) many MFIs, in
particular credit unions, mobilize large volumes of voluntary deposits as well as mandatory
ones. In fact, those institutions allow clients to make a voluntary deposit along with –and into
the same account as – their mandatory minimum (ASA and VYCCU). For example, in
Guinea, the Yete-Mail cooperative’s required collateral savings represent just 5 percent of
total deposits, and the rest are voluntary. Another well-known example can be seen in the
practice of Grameen II Pension funds. Among the new collection of products that have
replace the classic version of Grameen in all its branches the new savings products are among
the most popular in Grameen II. As claimed by Stuart Rutherford (in Hirschland, 2005, p.143)
members like the new weekly savings, which accepts voluntary in addition to compulsory
deposits and allows almost unlimited withdrawals on demand.
In fact, many different saving mechanisms have evolved directly in the field itself. First,
we retain compulsory savings as the integral part of the credit, which is required as part of
loan terms. Second, following the literature on savings services for the poor (Glisovic, El-
Zoghbi, and Forster, 2010; Hirschland, 2005), we define voluntary savings as time/certificate
deposit practiced, in particular, by regulated MFIs such as credit unions or savings banks.
This savings service allows micro-entrepreneurs to decide on voluntary basis to make a single
deposit that cannot be withdrawn for a specific period of time. At the appointed time, the
micro-entrepreneur can withdraw the saved amount.
19 One should mention that the concept of equilibrium under adverse selection is theoretically complicated. The literature suggests also pooling equilibrium or multiple equilibria depending on the structure of the market and on which agent moves first (Kreps, 1990).
51
1.6.1. Structure of the contracts
The two contracts (CSC and VSC) have the following characteristics:
If a micro-entrepreneur chooses a CSC, he must provide an amount CSCS of
compulsory savings in order to be financed at period 0 and he will be liquidated if he fails to
reimburse to the MFI at period 1. On the contrary, if the micro-entrepreneur pays back at
period 1, he can continue his project for period 2. At that period, he pays back the MFI in case
of success or losses the amount of his savings. This contract is thus similar to the one we have
just described in the previous sections;
If a micro-entrepreneur chooses a VSC, he must provide an amount VSC vS S+ of
savings respectively composed of compulsory and voluntary savings in order to be financed at
period 0. He can continue his project for period 2 no matter if he pays back or not the MFI at
period 1. However, in the case where he does not pay back to the MFI at period 1, the MFI
will retain the voluntary part of his savings ( )vS at period 2. At that period, he pays back to
the MFI in case of success or losses the amount of his compulsory savings.
In order to be optimal for micro-entrepreneurs and for the MFI, contracts are designed
in such a way that CSC will be chosen by "low-ability" micro-entrepreneurs (whose projects
have a negative expected value for period 2 if they fail at period 1) whereas VSC will be
chosen by "high-ability" micro-entrepreneurs (whose projects have a positive expected value
for period 2 even if they fail at period 1).
As seen before, the compulsory part of the savings is used by the MFI in the two
contracts in order to encourage micro-entrepreneurs to reimburse their loan plus interest at the
end of period 2, and the conditions stated in Lemma 1 still hold. Moreover, we assume that
the amount of compulsory savings will be the same between the two contracts, the difference
between contracts being linked with the voluntary part of the savings.
If we name 2,CSCr and 2,VSCr respectively the interest rate charges by the MFI at period 2 on
CSC and VSC, we have 2,
2
CSC
CSC
rS
g= and 2,
2
VSC
VSC
rS
g= the compulsory part of the savings
of the two contracts and at equilibrium we must have 2, 2,
2 2
CSC VSC
CSC VSC
r rS S
g g= = = which
means * *
2, 2,VSC CSCr r= .

52
In the same vein, the MFI will charge the minimum interest rate at period 1 that is
consistent with the incentive constraint to pay back at that period.
For a CSV, this incentive constraint is similar to the one stated by Lemma 2 and we have
*
1,2
CSCrg
= . For a VSC, we must find the incentive value *
1,VSCr that encourages micro-
entrepreneurs to pay back the MFI in case of success at period 1.
Lemma 4. If *
1,VSC l vr pSg= a micro-entrepreneur who succeeds in period 1 declares 1 1R R=% ,
pays back *
1,VSCr to the MFI and he is encouraged to continue his project in period 2 ■
Proof: see Appendix E.
Finally, the voluntary part of the savings will be designed in such a way that only
"high-ability" micro-entrepreneurs will choose a VSC at the initial period. This equilibrium
level of voluntary savings is given by Proposition 3.
PROPOSITION 3. Recall that CSC VSCS S= and assume that 2
22
1h l
YR
p p
g+>
+ -, if the level of
voluntary saving vS is such that:
( )( )
( )( )2 2 2 2
2 21 1h l
h h v l l
R p Y R p Yp p S p p
g g
- -+ - > > + -
"High-ability" micro-entrepreneurs will choose a VSC whereas "low-ability" micro-
entrepreneurs will prefer a CSC ■
Proof of Proposition 3: see Appendix F.
1.6.2. Financial equilibrium contracts with compulsory and voluntary savings
As seen before, we assume that the objective of the MFI is to maximize micro-entrepreneurs’
access to microcredit and that the MFI behaves competitively and fixes the various interest
rates according to a nonprofit condition. Proposition 4 gives the main characteristic of the two
equilibrium contracts between micro-entrepreneurs and the MFI.
PROPOSITION 4. Under conditions exposed in Lemma 1 to 4 and Proposition 3, and assuming
that( )( )
( )( )( )( )( )
22
2 2 2
1 1
2 1 1 2 1 1 1
h h l ll hl h
h l h l h
p p p pp ppR Y p R
p p p p p
gg é ù- - -ë û- < < -- - - - -
, the MFI will offer
two equilibrium contracts:
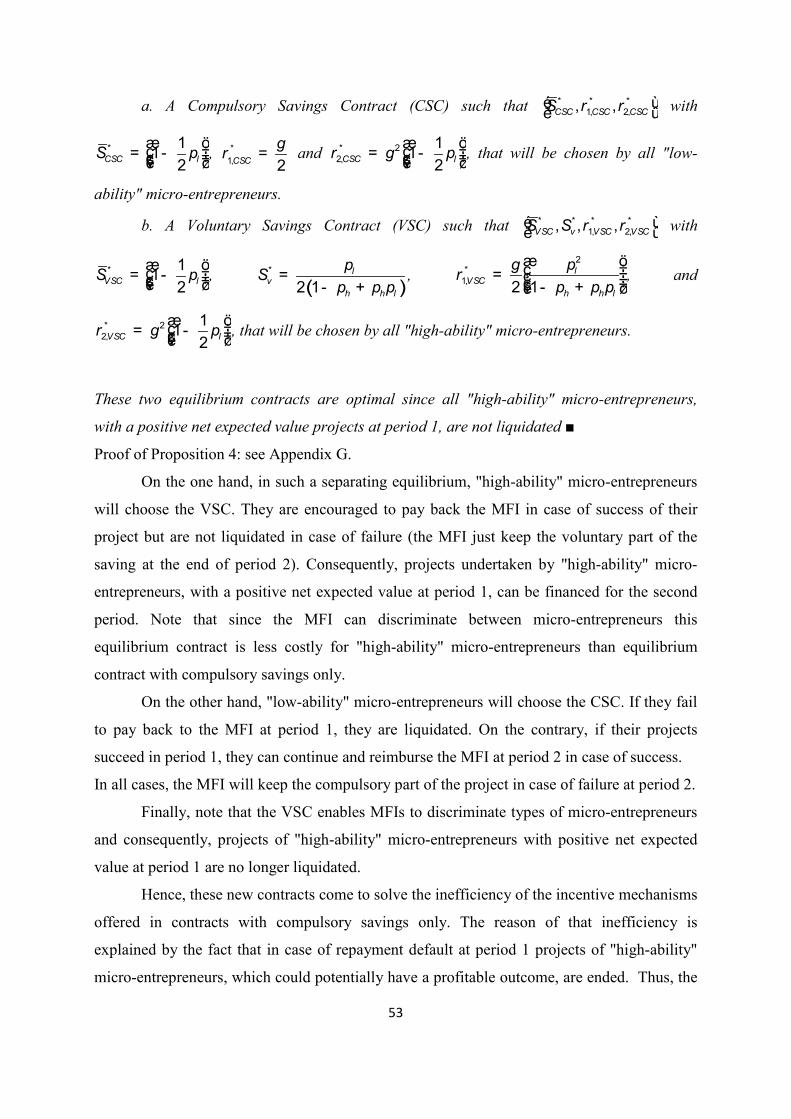
53
a. A Compulsory Savings Contract (CSC) such that * * *
1, 2,, ,CSC CSC CSCS r ré ùë û
with
* 11
2CSC lS p
æ ö÷ç= - ÷ç ÷çè ø, *
1, 2CSCr
g= and * 2
2,
11
2CSC lr pg
æ ö÷ç= - ÷ç ÷çè ø, that will be chosen by all "low-
ability" micro-entrepreneurs.
b. A Voluntary Savings Contract (VSC) such that * * * *
1, 2,, , ,VSC v VSC VSCS S r ré ùë û
with
* 11
2VSC lS p
æ ö÷ç= - ÷ç ÷çè ø,
( )*
2 1l
v
h h l
pS
p p p=
- +,
2*
1,2 1
lVSC
h h l
pr
p p p
g æ ö÷ç ÷= ç ÷ç ÷ç - +è ø, and
* 2
2,
11
2VSC lr pg
æ ö÷ç= - ÷ç ÷çè ø, that will be chosen by all "high-ability" micro-entrepreneurs.
These two equilibrium contracts are optimal since all "high-ability" micro-entrepreneurs,
with a positive net expected value projects at period 1, are not liquidated ■
Proof of Proposition 4: see Appendix G.
On the one hand, in such a separating equilibrium, "high-ability" micro-entrepreneurs
will choose the VSC. They are encouraged to pay back the MFI in case of success of their
project but are not liquidated in case of failure (the MFI just keep the voluntary part of the
saving at the end of period 2). Consequently, projects undertaken by "high-ability" micro-
entrepreneurs, with a positive net expected value at period 1, can be financed for the second
period. Note that since the MFI can discriminate between micro-entrepreneurs this
equilibrium contract is less costly for "high-ability" micro-entrepreneurs than equilibrium
contract with compulsory savings only.
On the other hand, "low-ability" micro-entrepreneurs will choose the CSC. If they fail
to pay back to the MFI at period 1, they are liquidated. On the contrary, if their projects
succeed in period 1, they can continue and reimburse the MFI at period 2 in case of success.
In all cases, the MFI will keep the compulsory part of the project in case of failure at period 2.
Finally, note that the VSC enables MFIs to discriminate types of micro-entrepreneurs
and consequently, projects of "high-ability" micro-entrepreneurs with positive net expected
value at period 1 are no longer liquidated.
Hence, these new contracts come to solve the inefficiency of the incentive mechanisms
offered in contracts with compulsory savings only. The reason of that inefficiency is
explained by the fact that in case of repayment default at period 1 projects of "high-ability"
micro-entrepreneurs, which could potentially have a profitable outcome, are ended. Thus, the
54
results of this section show that the new contracts based on both compulsory and voluntary
microsavings go hand in hand with the twofold mission of MFIs. Firstly, the poor are
provided with an equal access to financial intermediation and secondly, more importantly, the
social value of lending from the entire society point of view is increased.
1.7. Concluding remarks
Microfinance as a tool of development finance has witnessed a growing interest in the last
three decades. Within this field, the role of innovations in microlending technologies in
explaining opportunities for expansion of the frontier of development finance is attracting
increasing attention. These innovations are addressed to the enhancement of financial services
provision in a sustainable manner to marginal clienteles, and are mainly dealing with
resolving dynamic incentive, information, and enforcement problems and decrease of
transaction costs.
Microfinance evolution has led to the establishment of novel lending methods in poor
households and for small-scale entrepreneurs. The types of contracts actually observed in
microfinance are quite complex, with numerous implicit and explicit terms and conditions that
vary according to behavior and performance and sometimes to the state of nature.
Nevertheless, incentive mechanisms in microlending contracts often share the following
common features: group lending technologies mostly reply on joint liability, and individual
lending technologies usually rely on the threat of termination of the lender-borrower
relationship and on the gradual improvement of the terms and conditions of the contract as the
borrower demonstrates capacity and willingness to repay over time.
Both in practice and in academic writing, savings is clearly gaining important interest
in microfinance programmes, hence becoming a significant pillar of MFIs’ service portfolio
(Robinson, 2001; Meyer, 2002; Dowla and Alamgir, 2003; Matin, Hulme and Rutherford,
2002).
This chapter develops a novel mechanism of dynamic incentives to address both the
issues of contract enforcement and screening of borrowers. Our model is based on the
argument that the inceptive mechanism based on compulsory savings as a repayment
guarantee lacks means for ascertaining borrowers’ abilities. Moreover, we argue that the
introduction of voluntary savings combined with compulsory savings will come to create a
more efficient and complete incentive mechanism allowing MFIs to deal with the screening
problem as well. In particular, our model shows that introducing voluntary savings into the
55
incentive mechanism enables to discriminate borrowers’ abilities and to address screening
problems in microfinance programmes. Voluntary savings allows borrowers to have a
possibility of revealing the potential of their projects and to continue undertaking the project,
even if they have not paid at the end of the first period. The ‘beauty’ of our model consists in
giving all borrowers equal chances of obtaining a loan once they agree to invest compulsory
savings in the initial stage. This serves as high certainty about the enforceability of
repayments. The down side consists of bringing this mechanism closer to traditional bank
loans, which require obligatory collateral. However, such model does not allow MFIs to
control for the probability of the projects’ success.
A related question is: what actually is the optimal microlending contract? For instance,
how can the borrower be induced to reveal its ability after the first installment has or has not
been paid? In this model we have shown that an equilibrium contract is feasible when
borrowers are required to invest compulsory savings in order to access their loan. Though, as
mentioned above, this guarantee is not optimal as it does not allow to discriminate borrowers
abilities. As shown, voluntary savings can complete this picture and, together with
compulsory savings, can serve as an effective approach for MFIs to face adverse selection and
moral hazard issues.
By acknowledging certain limits of requiring savings, we argue that it can raise a
number of additional issues such as coping with country regulations, providing both
convenience and security, finding profitable reinvestment opportunities, etc.
(Morduch, 1999b).
To conclude, the theoretical literature on individual lending incentive mechanisms to
which this paper contributes, has proposed many different ways in which those mechanisms
can enable MFIs to solve enforcement and screening issues. Researchers are increasingly
interested in exploring savings as dynamic incentives. However, empirical work testing the
effect of specific instruments, combining compulsory and voluntary savings in a microlending
contract, has lagged behind theoretical work on the topic. Apart from pure academic interest,
such evidence could help us understand how significant and necessary current use of savings
is in developing more enhanced incentive mechanisms that can help achieve the full promise
of microfinance programmes. An interesting implication of our model is that by employing
both compulsory and voluntary savings as an incentive mechanism, MFIs can generate
positive social value even when carrying on projects which do not perform well enough at the
beginning.

56
Future research should investigate what type of MFIs’ ownership structure this
enforcement and screening mechanism will best contribute towards. Since we are not in the
frame of credit-only programmes, further research can collect data that allows careful
quantification of the roles of these two savings in risk and liquidity management issues and
internal control mechanisms of MFIs.

57
APPENDICES OF CHAPTER 1
Appendix A. Summary of the Advantages and Challenges of Different Saving Providers
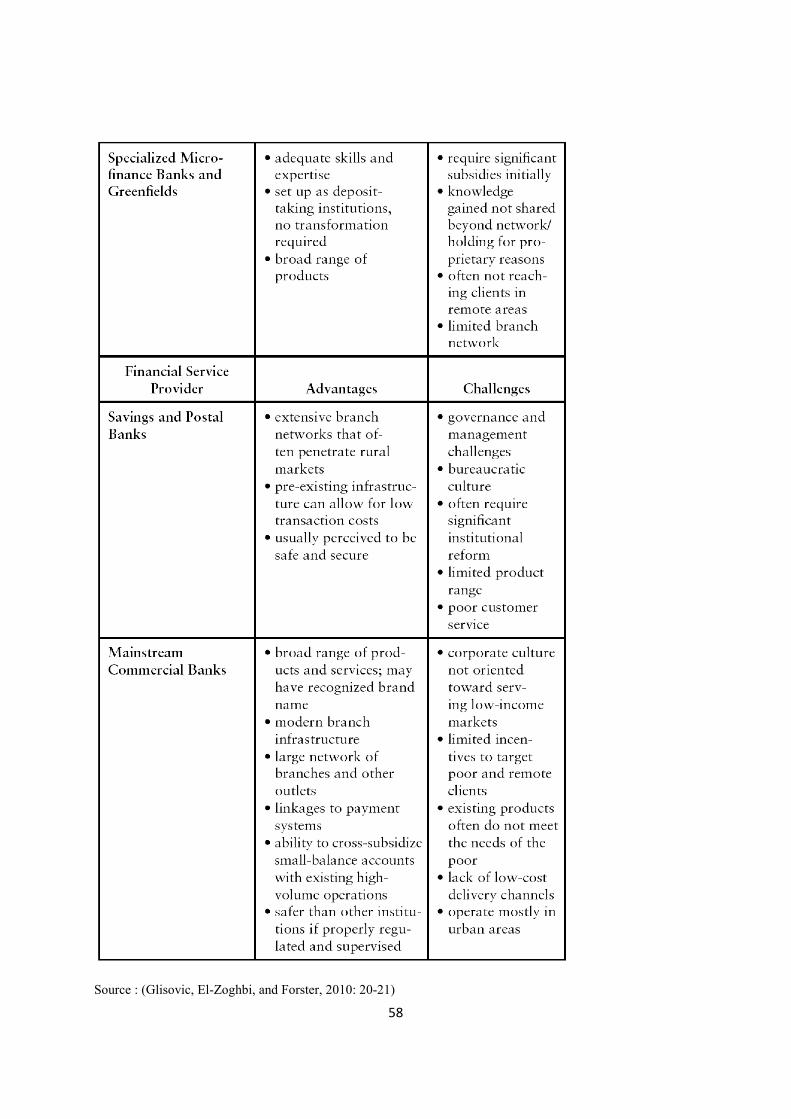
58
Source : (Glisovic, El-Zoghbi, and Forster, 2010: 20-21)
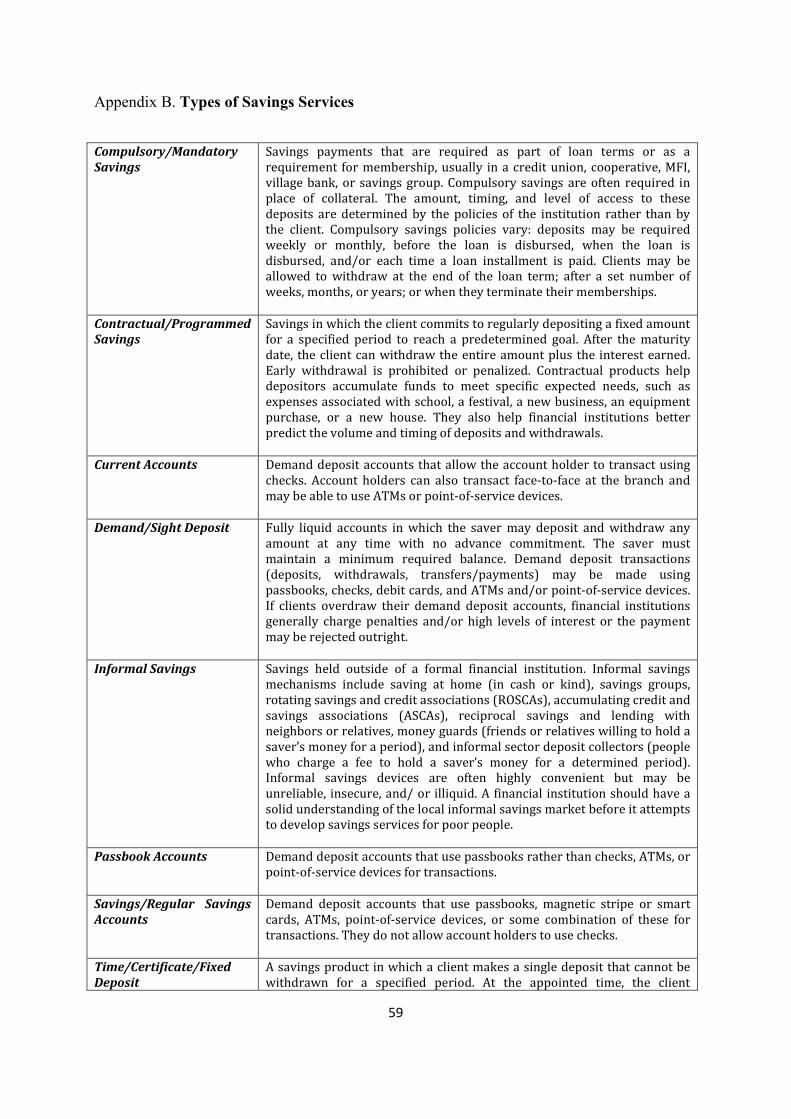
59
Appendix B. Types of Savings Services
Compulsory/Mandatory
Savings
Savings payments that are required as part of loan terms or as a
requirement for membership, usually in a credit union, cooperative, MFI,
village bank, or savings group. Compulsory savings are often required in
place of collateral. The amount, timing, and level of access to these
deposits are determined by the policies of the institution rather than by
the client. Compulsory savings policies vary: deposits may be required
weekly or monthly, before the loan is disbursed, when the loan is
disbursed, and/or each time a loan installment is paid. Clients may be
allowed to withdraw at the end of the loan term; after a set number of
weeks, months, or years; or when they terminate their memberships.
Contractual/Programmed
Savings
Savings in which the client commits to regularly depositing a fixed amount
for a specified period to reach a predetermined goal. After the maturity
date, the client can withdraw the entire amount plus the interest earned.
Early withdrawal is prohibited or penalized. Contractual products help
depositors accumulate funds to meet specific expected needs, such as
expenses associated with school, a festival, a new business, an equipment
purchase, or a new house. They also help financial institutions better
predict the volume and timing of deposits and withdrawals.
Current Accounts
Demand deposit accounts that allow the account holder to transact using
checks. Account holders can also transact face-to-face at the branch and
may be able to use ATMs or point-of-service devices.
Demand/Sight Deposit
Fully liquid accounts in which the saver may deposit and withdraw any
amount at any time with no advance commitment. The saver must
maintain a minimum required balance. Demand deposit transactions
(deposits, withdrawals, transfers/payments) may be made using
passbooks, checks, debit cards, and ATMs and/or point-of-service devices.
If clients overdraw their demand deposit accounts, financial institutions
generally charge penalties and/or high levels of interest or the payment
may be rejected outright.
Informal Savings
Savings held outside of a formal financial institution. Informal savings
mechanisms include saving at home (in cash or kind), savings groups,
rotating savings and credit associations (ROSCAs), accumulating credit and
savings associations (ASCAs), reciprocal savings and lending with
neighbors or relatives, money guards (friends or relatives willing to hold a
saver’s money for a period), and informal sector deposit collectors (people
who charge a fee to hold a saver’s money for a determined period).
Informal savings devices are often highly convenient but may be
unreliable, insecure, and/ or illiquid. A financial institution should have a
solid understanding of the local informal savings market before it attempts
to develop savings services for poor people.
Passbook Accounts Demand deposit accounts that use passbooks rather than checks, ATMs, or
point-of-service devices for transactions.
Savings/Regular Savings
Accounts
Demand deposit accounts that use passbooks, magnetic stripe or smart
cards, ATMs, point-of-service devices, or some combination of these for
transactions. They do not allow account holders to use checks.
Time/Certificate/Fixed
Deposit
A savings product in which a client makes a single deposit that cannot be
withdrawn for a specified period. At the appointed time, the client

60
withdraws the entire amount with interest. The financial institution offers
a range of possible terms and usually pays a higher interest rate than on its
demand deposit or contractual products. Because they tend to be larger
than other types of deposits, have contracted withdrawal times, and
involve fewer transactions, time deposits can provide a significant source
of relatively low-cost funds that facilitate asset–liability management. This
is particularly true if an MFI can attract large institutional depositors.
Source: Glisovic, El-Zoghbi, and Forster (2010: 38-40)
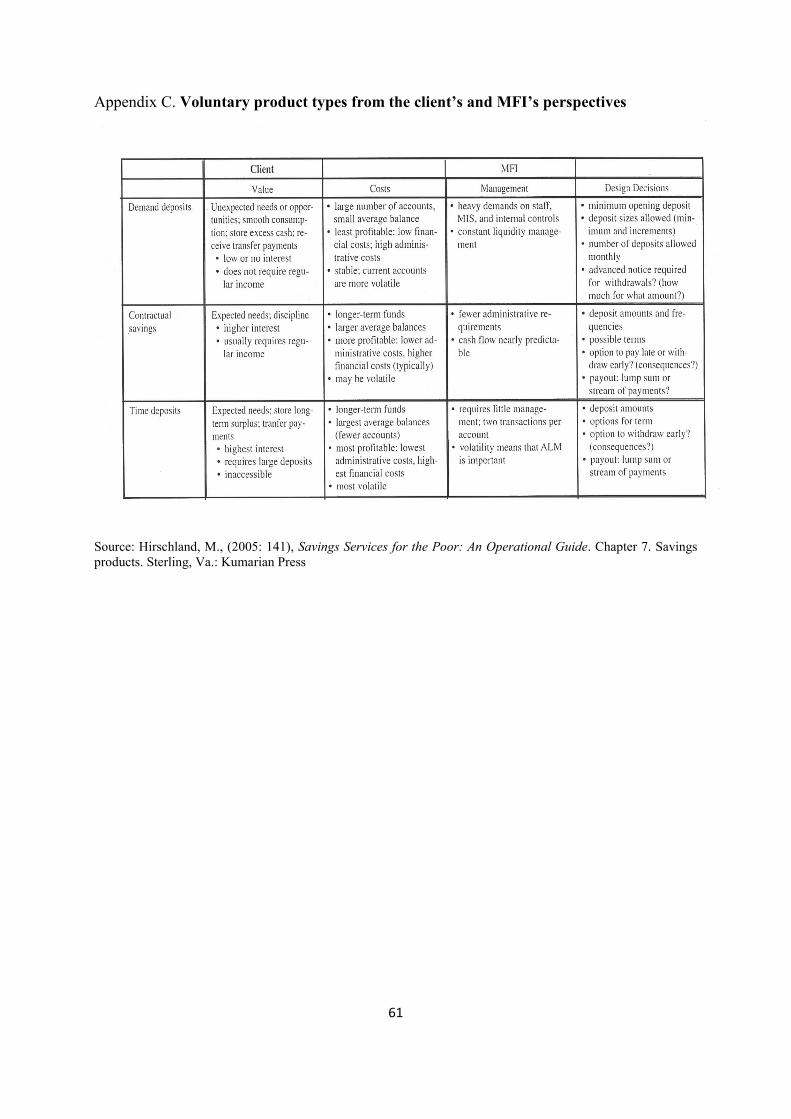
61
Appendix C. Voluntary product types from the client’s and MFI’s perspectives
Source: Hirschland, M., (2005: 141), Savings Services for the Poor: An Operational Guide. Chapter 7. Savings products. Sterling, Va.: Kumarian Press

62
Appendix D. Proof of Proposition 1. Part a. of Proposition 1 is obvious as under incentives conditions state by Lemma 1 to 3, all micro-entrepreneurs decide to ask for a microcredit at period 0. Proof of part b. The net expected value for the MFI to end a project that fails to give a positive payoff at period 1 is given by
*
20 0
rS g g g
g- = - < with
*
20 2
rS
g= and * 2
2r g<
It means that the MFI keeps the savings plus interest of the micro-entrepreneurs and reimburses the fund.
The net expected value for the MFI to continue a project that fails to give a positive payoff at period 1 is given by
( ) ( ) ( )* 2 * 2 2
2 0 2 01 1 1h h l lp r p S pr p Sq g q g gé ù é ù+ - + - + - -ë û ë û
as the MFI cannot make a distinction between "high" and "low" ability micro-entrepreneurs.
Finally, as *
20 2
rS
g= , we obtain
* 2
2 0r g- <
Note that * 2
* 2 22
rr
gg
g
-- > for 1g > and the loss of the MFI is lower in the first case
than in the second one. Consequently, in order to minimize its loss, a MFI will still liquidate a project that fails to give a positive payoff at period 1. Proof of part c. Under the conditions stated by Lemma 1 to 3, the MFI will choose
2r in order to ensure its financial equilibrium (non profit condition). The condition of a zero net expected profit for the MFI is given by
( )( ) ( )
( ) ( )( ) ( )
* 2 * 2
MFI 0 1 0 2
* 2 * 2
0 1 0 2
1 1 11 1
1 1 11 1 1 0
h h h h
l l l l
p S p r p S p r
p S p r p S pr
q g g g gg g g
q g g g gg g g
é ùæ ö÷ç é ùê úP = - - + + - + - +÷ç ÷ë ûê úç ÷è øë û
é ùæ ö÷ç é ùê ú- - - + + - + - =÷ç ÷ë ûê úç ÷è øë û
Substituting *
20 2
rS
g= in the previous equation we obtain after simplification
MFI 0P = for
( )( )* 2 * 2
2 1 1h lr r p pg g q q gé ù= - + - £ë û and *
2 0r >

63
As ( )( )0 1 1h lp pq q< + - < for 1, 0 , 1h lp pq < < <
Note that the optimal value of the reimbursement at period 2 (payoff of the MFI) depends on the value charged by the MFI at period 1. We assume here that the MFI will smooth the total
charge of the funds on the two periods and *
12
rg
= and
( )( )* 2 2
2
11 1
2h lr p pg q q g
é ù= - + - <ê ú
ê úë û. Moreover, according to Lemma 2, we must have
2 21
ip R Yr
g
-£ , which means that
2
2 2
1
2l
R Yp
gæ ö÷ç> + ÷ç ÷÷çè ø. Finally,
( )( )*
20 2
11 1 1
2h l
rS p pq q
g
é ù= = - + - <ê ú
ê úë û.
The proof of Proposition 1 is completed ■ Appendix E. Proof of Lemma 4. If a micro-entrepreneur (with "high" or "low" ability) chooses a VSC, he will be certain to continue his project even if he does not pay back to the MFI at period 1. The expected value of a project at period 1 for a micro-entrepreneur that decides to pay back *
1,VSCr to the MFI if
he succeeds is given by
( ) ( )( )* 2
1 1, 2 2,
1VSC i VSC VSC vR r p R r S Sg
g- + - + + with ,i h l=
On the contrary, the expected value of a project at period 1 for a micro-entrepreneur that decides not to pay back *
1,VSCr to the MFI if he succeeds is given by
( )2
1 2 2,
1i VSC VSCR p R r Sg
g+ - + (Recall that in this case, the MFI will retain the voluntary
part of the savings). Consequently, a micro-entrepreneur will pay back if
( ) ( )( ) ( )* 2 2
1 1, 2 2, 1 2 2,
1 1VSC i VSC VSC v i VSC VSCR r p R r S S R p R r Sg g
g g- + - + + ³ + - +
Using the fact that 2,
2
CSC
CSC
rS
g= and 2,
2
VSC
VSC
rS
g= , means that we must have
*
1,v i VSCS p rg ³ . As this condition must be an incentive for "high" and "low" ability micro-
entrepreneurs we must have *
1,v l VSCS p rg ³ since h lp p> . Consequently, the MFI will choose
the value of *
1,VSC v lr S pg= that creates an incentive for both the "high" and "low-ability"
micro-entrepreneurs ■ Appendix F. Proof of Proposition 3. The net expected value of a project undertaken by "low-ability" micro-entrepreneurs and financed by a VSC is given by

64
( ) ( ) ( )( )
( ) ( )
* 2
0 1 1, 2 2,2
2
2 2,2
1 1
11
VSC v l VSC l VSC VSC v
l l VSC VSC
Y S S p R r p R r S S
p p R r S
gg g
gg
é ùê ú- - + - + - + + +ê úë û
é ùê ú- - +ê úë û
This gives after simplification
( ) ( )* 220 1 1, 2
1VSC v l VSC l l v
RY S S p R r p p S
g g- - + - + +
Similarly, the net expected value of a project undertaken by "low-ability" micro-
entrepreneurs and financed by a CSC is given by (using *
1,2
CSCrg
= )
( ) ( ) ( )2
0 1 2 2, 22 2
1 1 11
2CSC l l CSC CSC lY S p R p R r S p Y
gg
g g g
é ùæ ö÷ê úç- + - + - + + -÷ç ÷ê úè øë û
This gives after simplification
( ) ( )2 20 1 22 2
1 11
2CSC l l l
RY S p R p p Y
g
g g g
æ ö÷ç- + - + + -÷ç ÷è ø
Consequently, a "low-ability" micro-entrepreneur will choose a CSC contract at period
0 if
( ) ( )
( ) ( )
2 20 1 22 2
* 220 1 1, 2
1 11
2
1
CSC l l l
VSC v l VSC l l v
RY S p R p p Y
RY S S p R r p p S
g
g g g
g g
æ ö÷ç- + - + + - >÷ç ÷è ø
- - + - + +
And using the fact that *
1,VSC v lr S pg= , we obtain
( )( )2 2
min 2
11
2
l
v v l l
R p YS S p p
g
-> º + -
Using the same reasoning, we find that a "high-ability" micro-entrepreneur will choose a VSC at period 0 if
( )( )2 2
max 2
11
2
h
v v h h
R p YS S p p
g
-< = + -
Finally, we must have max minv vS S> which is true if
2
2
22
1h l
YR
p p
g+>
+ - and this condition is
always realized when 2
2 2
1
2l
R Yp
gæ ö÷ç> + ÷ç ÷÷çè ø as required in proposition 2.
Consequently, the MFI must fix the level of the voluntary savings such that max minv v vS S S> >

65
Appendix G. Proof of Proposition 4. Let us begin by CSC. The MFI knows that "low-ability" micro-entrepreneurs will choose a
CSC. They will reimburse *
1,2
CSCrg
= in case of success at period 1 or they will be liquidated.
If they are not liquidated, they will continue their project and will pay back *
2,CSCr to the MFI
at the end of period 2 in case of success. Otherwise, in case of failure of the project at period 2, the MFI will retain the level of the compulsory savings. The net expected profit linked with that contract is given by
( )( ) ( )* 2 * 2
MFI,CSC 1, 2,
1 1 11 1l CSC l CSC l CSC l CSCp S p r p S prg g g g
g g g
æ ö÷ç é ùP = - - + + - + - ÷ç ÷ë ûç ÷è ø
The MFI will choose *
2,CSCr such that MFI,CSC 0P = and * 2 2
2,
11
2CSC lr pg g
æ ö÷ç= - <÷ç ÷çè ø.
Consequently, we have *
2,*
2
11
2
CSC
CSC l
rS p
g
æ ö÷ç= = - ÷ç ÷çè ø.
Let us turn our attention to VSC. According to Proposition 3, the MFI will choose a
level of voluntary savings such that max minv v vS S S> > in order to be sure that "high-ability" micro-entrepreneurs will choose this contract whereas "low-ability" micro-entrepreneurs will choose the CSC. We will name this equilibrium value of the voluntary savings *
vS .
The MFI knows that "high-ability" micro-entrepreneurs will choose VSC, and pay back respectively *
1,VSCr and *
2,VSCr if their projects succeed at period 1 and period 2. In that
case, the MFI will give back to micro-entrepreneurs the compulsory and the voluntary part of their savings. However, in case of failure of the project at period 1, the project is not liquidated but the MFI will retain the voluntary part of the savings even if the project succeeds at period 2. Finally, in case of failure of the project at period 2, the MFI will retain the total level of the savings (compulsory plus voluntary). The net expected profit associated with that contract is given by
( )( )
( ) ( ) ( )( )
* * * 2
MFI,VSC 1, 2,
* * 2 * * 2
2,
1 11
1 1 11 1 1
h VSC h VSC h VSC
h h VSC v h VSC v
p r p r p S
p p r S p S S
gg g
g gg g g
é ùê úP = + + - +ê úë û
é ùê ú- + + - + -ê úë û
The MFI will choose *
2,VSCr such that MFI,VSC 0P = and
( )*
1,* 2 * 2
2, 1 1h VSC
VSC v h
p rr S pg g
g
æ ö÷ç ÷= - - - <ç ÷ç ÷÷çè ø.
Note that the equilibrium value of the interest rate at period 2 is still dependent of the value of the rate fixed by the MFI at period 1. Substituting the equilibrium value of *
1,VSCr in *
2,VSCr we obtain
( )( )* 2 * * 2
2, 1 1VSC v h v h lr S p S p pg g= - - - <

66
Consequently, we have ( )*
2,* * *
21 1
VSC
VSC v h v h l
rS S p S p p
g= = - - - . Since the
compulsory part of the savings is identical in the two contracts we must have
( )* * * 11 1 1 1
2VSC v h v h l lS S p S p p p
æ ö÷ç= - - - = - <÷ç ÷çè ø which gives the equilibrium value of the
voluntary part of the savings ( )
* 12 1
lv
h h l
pS
p p p= <
- + for ( )( )1 1 0l hp p- - > which is
always true. Substituting this equilibrium value in *
1,VSCr we obtain
( )
2* *
1, 1,2 1 2
lVSC CSC
h h l
pr r
p p p
g gæ ö÷ç ÷= < =ç ÷ç ÷÷ç - +è ø
The total amount of savings linked with the VSC is given by
* * *11 1
2VSC v l vS S p S
æ ö÷ç+ = - + <÷ç ÷çè ø if ( )1 0h lp p- > which is always true.
Finally, we must have ( )
*
min max2 1
lv v v
h h l
pS S S
p p p< = <
- + which is true if
( )( )
( )( )( )( )( )
22
2 2 2
1 1
2 1 1 2 1 1 1
h h l ll hl h
h l h l h
p p p pp ppR Y p R
p p p p p
gg é ù- - -ë û- < < -- - - - -
The proof is completed ■

67
CHAPTER 2. EFFICIENCY AND OUTREACH OF MICROFINANCE
INSTITUTIONS: DOES SERVICE DIVERSIFICATION MATTER?
The gradual evolution of the microfinance sector generates new trends, one of which is
related to savings mobilization from MFI clients. The previous chapter reviewed the existing
empirical evidence on the use and benefits of savings both from MFI and borrowers
perspective. This created solid bases for our argument that savings can play a significant role
in addressing main challenges of the microfinance - repayment enforcement and borrowers
screening. Thus, we built a theoretical model to demonstrate how the suggested novel
approach can fill the gaps left by the exiting dynamic incentive mechanism. The core
argument of our approach lies in the use of savings as a means of incentivising and
ascertaining borrowers.
After having demonstrated theoretically how savings could become incorporated into an
incentive mechanism to face repayment and screening problems, we now look at the practice
of simultaneous offering of credit and savings and try to measure its impact on the MFI
performance. Apart from the change in the perspective, there is also a different methodology
used in this chapter. We use an empirical method to investigate whether offering combined
microfinance services (credit plus savings) affects MFIs’ outreach and performance. Thus,
this chapter is closely related to the previous essay in demonstrating the importance of saving
services in the entire mindset of microfinance.
This chapter as well responds to the recent interest in offering combined microfinance
services to the poor by investigates whether the service diversification matters for the MFIs’
financial and social performance. In this study we aim at comparing MFIs, which take
deposits with those MFIs, which do not mobilize deposits, and to establish a relationship
between the institution’s performance and offering saving services in addition to credit.
Worldwide, the supply challenge in the microfinance industry has become not only to make
loan products accessible, but also to respond to a wider variety of clients’ needs by offering
more inclusive and flexible financial products. We claim that in their gradual transformation
process MFIs become multi-servicing organizations offering additional financial services,
such as savings, insurance, remittances etc.
In exploring whether combining microcredit with deposits enhances MFIs performance by
increasing their efficiency and outreach we base our arguments on the theory of economies of
scope (see e.g. Rossel-Cambier, 2012), and employ a propensity score matching (PMS) model
68
to show that the delivery of credit and deposits can contribute to higher profitability and
outreach of microcredit organizations.
2.1. Introduction
Having declared the year 2005 as the International Year of Microcredit the United Nations20
defines microfinance as provision of small-scale financial services such as credit, savings,
insurance, remittances combined with non-financial services. These services are provided to
the poor in the face of Microfinance institutions (MFIs). Nowadays, the supply challenge in
the industry is not only about the need to make loan products accessible, but also about
responding to a wider variety of clients’ needs by offering more inclusive and flexible
financial products (Helms, 2006). This argument is in line with the Consultative Group to
Assist the Poor (CGAP, 2003), which states that “poor people need a wide array of flexible
financial services. A demand driven approach will encourage portfolio diversity by offering
the poor savings, insurance and cash transfer services in addition to various loan products”.
The evolving microfinance industry brings new insights on how MFIs are dealing with their
unique challenge in achieving the double bottom line: financial (efficiency) and social
(outreach). As the sector has undergone through the process of commercialization and
institutional transformation over the last decade, the assessment of their financial and social
performance has become even more important.
Institutional transformation, which lies in the core of commercialization process,
implies the shift from a non-profit entity to a regulated institution typically allowed to
mobilize deposits (Christen and Drake, 2002: 4). Consequently, the microfinance sector has
become considerably heterogeneous not only in terms of ownership structure (NGOs/NBFIs,
credit unions, microfinance banks and downscaling bank) but also in terms of institution size,
targeted clientele, diversified capital suppliers. Started since mid-1990s this process has been
claimed to have a positive impact in terms of widened product range (including savings).
(Ledgerwood and White, 2006: xxxii). Over a very long period, microfinance scene has been
largely dominated by credit-only programmes. Currently, the multiservice portfolio includes
microdeposits, microinsurance, remittances, mobile banking etc. It is, therefore, important to
find cost-effective ways of improving standards while at the same time minimizing
restrictions and encouraging innovation allowing MFIs to develop viable financial products
20 United Nations (2005), Microfinance and microcredit: How can $100 change an economy? Web document, Year of Microcredit.
69
relevant to the evolving target markets. Scholars refer to the economies of scope (Hartarska,
Parmeter and Mersland, 2011), which can be achieved in various fields when combining
credit with savings or insurance, in explaining the increase of MFIs efficiency and
productivity. As compared to our theoretical model presented in the first chapter, which
favored the use of voluntary savings as a means of revealing information on the ability of
borrowers, these authors argue that poor savers and borrowers may be different groups and
that scope economies arise from sharing physical infrastructure, not sharing of information
regarding microborrowers and savers to improve product design.
For the MFIs deposits are seen as inputs in the production of various types of loans
and investments. However, Cull, Demirguc-Kunt and Morduch (2009a) argue that unlike
commercial banks, MFIs remain focused on serving marginalized clientele and not on
intermediation. Delivering deposit to the poor in urban slums or remote rural areas implies
high costs, and microdeposits are not the main input used to produce loans (Garmaise and
Natividad, 2010).
In the light of the above mentioned development an important question is whether
diversification in service portfolios and offering combined services affect the MFIs
sustainability (financial performance) and outreach (social performance).
From the theoretical point of view, the impact of product diversification was tackled
from different perspectives. Certain studies come to claim that MFIs can help client
households reducing their financial vulnerability through product diversification (Labie et al,
2006; Morris and Barnes, 2005). Other theoretical studies show that joint lending (loan
coupled with savings or insurance) could be not only financially but socially beneficial both
for borrowers and MFIs (Ledgerwood, 1999; Wisniwski, 1999; Robinson, 2001).
Furthermore, the first chapter of this thesis explores the impact of microsavings employment
in the incentive mechanism in joint lending contracts. The authors demonstrate the efficiency
of this novel mechanism in terms of better facing problems of contract enforcement and
screening.
From the empirical point of view, to our knowledge, most of the previous research is
lacking systematic investigation of this issue, indeed lacking as well a more appropriate
econometric method.
Recent studies (cf. Cull, Demirgüç-Kunt and Morduch, 2007; Hermes, Lensink and Meesters,
2011) address the question of MFI sustainability and outreach with enough exhaustive data
and appropriate analytical methods. However, they do not look on the aspect how the product
70
diversification within MFIs could enhance sustainability and outreach. In addition to this,
while these studies both present overall empirical results from MFIs operating in different
regional context, they do not look on the specificities and types of microfinance services.
One of the few recent studies with regard to the combined microfinance services and
increase in performance is done by Hartarska, Parmeter and Mersland (2011). The authors
provide estimates of scope economies from the joint production of microloans and
microdeposits using semiparametric smooth coefficient model to estimate a generalized cost
function for a dataset from rated MFIs with over 777 annual observations on MFIs from over
50 countries. In their study the authors built two models of scope economies: in the first
model, only variables typically used in a cost function approach are included (total cost,
output values and relative input prices) and in the second one, population density, a measure
of financial sector development, type of market served (urban, rural or both) and the
predominant loan methodology (village banking, solidarity groups and individual loans), as
well as controls for time and region are included in addition to the variables of the first model.
Their findings indicate that scope economies are substantial across both settings and that, for
either model, over 70 percent of the MFIs in the dataset have (or would) experience
reductions in cost by offering both savings and loan services. Since the authors find that not
all MFIs can deliver microsavings in a sustainable manner given the scope diseconomies, they
argue that if delivery of savings is important from policy perspective, it should not be
expected to be financially sustainable in every environment and for every MFI. The results
show as well that economies of scope vary across the type of services and country where the
MFIs operate. This means that the environment in which MFIs operate both on macro and
regional level affects their cost economies. Among important MFI specific factor, lending
methodology affect the scope economies, in particular MFIs using individual lending have
higher scope economies than those using group lending and village banks.
Another recent study exploring the impact of combining multiples financial products
on enhancement of MFIs performance were done by Rossel-Cambier (2010) who reviews
whether combined microfinance services (credit plus savings or insurance) could be an
approach to enhance poverty outreach. Building on observations of 250 MFIs from Latin
America and the Caribbean covering the fiscal year 2006 the findings suggest that
contribution of combined services on the depth of poverty outreach is less evident, both from
an income-related and gender-sensitive lens. Also, the author argues that the presence of
savings is accompanied with a relatively lower participation of poor and female clients.
71
Applying the Hendry/LSE approach, Rossel-Cambier (2010) finds significant results for each
of the poverty outreach dimensions relating to at least one of the variables of interest:
efficiency, productivity, sustainability or portfolio quality indicators. However, the
econometric approach used in this study does not address the issue of the possible endogenous
relation among the regressors, which may bias the OLS estimates.
In this respect, the main purpose of this chapter is to shed light on whether the current
trend towards microfinance service diversification and multi-service approach (microcredit
combined with savings) can contribute to the enhanced financial efficiency and poverty
outreach. We acknowledge that combined microfinance may not always be a winning option
given that providing saving implies additional managerial skills and various financial and
operational risks for MFIs. However, similarly to Hartarska, Parmeter and Mersland (2011)
we claim that joint provision on loans and savings enhances the economies of scope across
MFIs.
Microfinance as a development intervention and poverty alleviation tool grew rapidly
in the Eastern Europe and Central Asia (ECA) during the 1990s mainly supported by
international networks (i.e. FINCA, CARE International) and religious charities (i.e. Catholic
Relief). In parallel with the industry commercialization financial donors and investors
gradually offered more commercial bank loans at the market rate of interest than grants for the
for the establishment of microfinance activity in the ECA. This is one of the main explications
why MFIs in the region are less subsidy-dependent as compared to MFIs in other developing
countries. MFIs in Eastern Europe and Russia put more emphasize on individual lending
techniques rather than group lending, thus targeting more a wide range of clientele who is
well-off (Armendariz and Morduch, 2000).
An interesting evidence characterizing MFIs in the region was revealed by a survey
done by grass-root network Microfinance Centre for Central & Eastern Europe and the New
Independent States (MFC for CEE and NIS) in 2007, which shows that 42 percent of the
surveyed MFIs in the ECA did not know the poverty status of their clients (Hartarska,
Nadolnyak and McAdams, 2012). This speaks about the fact that almost half of these MFIs
rather focused on providing credit to financially excluded entrepreneurs and did not
specifically target low-income clients. Whereas, according to the same survey results the poor
constituted 54 percent of all borrowers among those MFIs that tracked the income levels of
their clients. This allows to say that most clients using MFIs’ services in the region are not
very poor, but are entrepreneurial types, thus being inclined to respond better to improved
72
access to credit since they are much more likely to have had formal education and business
skills.
Previous research demonstrates that MFIs in the ECA region are among the youngest
in the microfinance industry, while their performance ranks among the best (Caudill, Gropper
and Hartarska, 2009). Microbanking Bulletin No. 9 confirms this tendency by showing that in
2003, the average MFI in the ECA region was 5 years old, had gross portfolio yield of 35%
(in real terms), and operational self-sustainability of 131%. Whereas, the averages for the
entire MFI industry are: 9 years old, gross portfolio yield of 29%, and operational self-
sustainability of 123%.
However, the lack of entrepreneurial discipline and the mistrust to entrepreneurs
typical to transition economies have lead government and regulatory authorities to the
tendency of overregulation of entrepreneurial activity rather than creating an enabling
environment. With this respect MFIs in the ECA region have adapted their lending
methodologies and managerial practices in order to meet the best regulatory requirements and
clients demand.
Thus, with respect to the main research question of this part of the thesis we are
interest in investigating the link between the combined microfinance services (credit plus
savongs) and MFIs financial and social performance. In this chapter we use propensity score
matching method (PSM) built on a new panel data on MFIs from 19 countries from the ECA
region. The data is extracted from a grass-root network Microfinance Centre for Central &
Eastern Europe and the New Independent States (MFC for CEE and NIS) and completed by
data from the Microfinance Information Exchange (MIX) online database (2012) covering the
five-year period 2005-2009.
In the literature, it is well recognized that the estimate of a causal effect obtained by
comparing a treatment group with a non-experimental comparison group could be biased
because of problems such as self-selection or some systematic judgment by the researcher in
selecting units to be assigned to the treatment. The motivation for focusing on propensity
score matching methods lies in the fact that, in many applications of interest, the
dimensionality of the observable characteristic is high. With a small number of characteristics
(for example, two binary variables), matching is straightforward (see, Cave and Bos, 1995;
Czajka et al., 1992; Raynor, 1983). However, when there are many variables, it is difficult to
determine along which dimensions to match units or which weighting scheme to adopt.

73
As compared to semiparametric approach (Hartarska, Parmeter and Mersland, 2011)
and Hendry/LSE approach (Rossel-Cambier, 2010), which have been used in studies tackling
similar research question, our approach of using PSM method enables to divide the sample of
MFIs into treatment and control groups (respectively, those MFIs, which offer simultaneously
credit and savings, and MFIs, which offer credit only). The main purpose of a matching
procedure is to correct for sample selection bias due to observable differences between the
treatment and comparison groups, also to estimate counterfactual effects. In our method, we
take into account MFI specific financial (e.g., ROA, ROE, OSS, PAR30) as well as social
indicators (e.g., borrowers per loan officer). Outside of these econometric issues related to
studying to which extent transition to loans and savings could affect MFIs to which we refer
as economies of scope across MFIs, perhaps most important is that the PSM model provides
also a general interface allowing to accommodate impact of the external environment in
which MFIs operate because it may have both direct and indirect effect on cost and scope
economies (Armedariz and Szafarz, 2010; Ahlin, Lin and Maio, 2011).
This study will come to contribute to the existing literature on opportunities for
increasing the sustainability and efficient management of MFIs. It will also speak to the
ongoing debate on whether diversification of microfinance services helps to increase the MFI
outreach and overcome the mission drift issues.
The rest of the chapter is organized as follows. We describe the relevant theoretical
underpinnings that motivate this work in Part 2. The discussion on the role of service
diversification for the MFI performance enhancement is embedded in Part 3. We present the
econometric model and measurements in Part 4. The dataset is discussed in Part 5. The results
of the econometric study are presented in Part 6. Conclusions are presented in Part 7.
2.2. Relevant theoretical underpinnings
Significant empirical evidence on efficiency and scale and scope economies for various
financial institutions has been found for banks in developed countries (Hughes and Mester,
2008), whereas there is a lack of well developed literature on efficiency issues in financial
institutions in developing countries (Berger, Hasan and Zhou, 2009). On the top of this, given
the heterogeneity of microfinance, various industry benchmarks are being used to evaluate
performance and efficiency within MFIs.
In pursuing its mission and achieving its self-sustainability the MFI is expected to be
financially viable, which refers to the ability of a microfinance institution to cover its costs
74
with earned revenue. In this vein, Ledgerwood (1999) points out that profitability and
efficiency are key factors shaping the MFI financial viability (operational and financial self-
sufficiency) (cf. Appendix H). Yaron (1992) defines financial performance as the extent to
which the full cost of providing services is directly paid for by service users. Therefore, in
part the performance measurement has to be based on MFIs financial viability.
Traditionally, MFIs based their activities on and were mainly sustained by various
types of implicit or explicit subsidies. In the literature, subsidy dependence is viewed as the
inverse of self-sustainability, which can be achieved when the return on equity, net of any
subsidy received, equals or exceeds the opportunity cost of the equity funds (Yaron, 1992).
Such sustainability can be attained basically through fulfillment of the following conditions:
ensuring loan repayments on time, earning enough interest revenue and controlling costs to
guarantee efficient use of resources (de Crombrugghe, Tenikue and Sureda, 2008). Standard
indicators of these three components of operational performance used in the literature are
portfolio-at-risk (PAR), operational self-sufficiency (OSS) and cost per borrower
(Armendariz and Morduch, 2005). The literature highlights that in achieving the self-
sustainability the MFI has to put cost efficiency as its primary concern (Khandker, 1998).
Aside from efficiency, in the literature the MFI performance measurement boils down
as well to the investigation of its outreach. In the microfinance literature the contribution of
MFIs to poverty alleviation21 mainly is related to the social performance assessment.
According to the Social Performance Task Force, social performance is the “effective
translation of an institution's social goals into practice in line with accepted social values”
(Sinha, 2006: 5). In other words, social performance is measured by the way it provides
appropriate services that respond to client needs. In general, in microfinance literature, social
performance is measured by hybrid index comprising three sets of widely used indicators: the
number of people using services in a given period (breadth of outreach); their social
(including poverty) status at the beginning of the period (depth of outreach); and net benefit to
each including indirect benefits to other household and even non-household members during
the period (quality of outreach or impact).
Until recently, however, the social dimension of MFIs performance has been neglected
partly because researching and reporting on social performance requires very complex and
careful research by specialists and involves substantial resources and time. Scholars argue that 21. The literature reveals different approaches to define, measure and monitor poverty (UNDP, 2009; Sen, 2000). Various specific tools and survey mechanisms have been put into practice by different development organizations and MFI promoters.
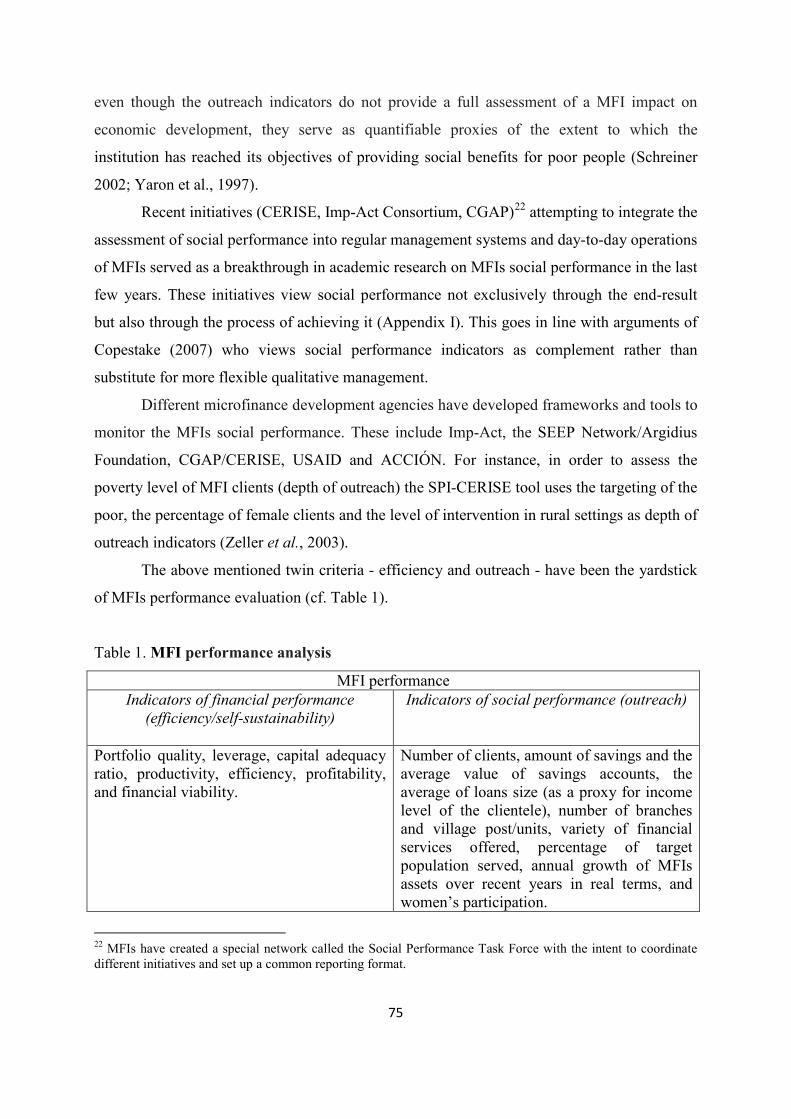
75
even though the outreach indicators do not provide a full assessment of a MFI impact on
economic development, they serve as quantifiable proxies of the extent to which the
institution has reached its objectives of providing social benefits for poor people (Schreiner
2002; Yaron et al., 1997).
Recent initiatives (CERISE, Imp-Act Consortium, CGAP)22 attempting to integrate the
assessment of social performance into regular management systems and day-to-day operations
of MFIs served as a breakthrough in academic research on MFIs social performance in the last
few years. These initiatives view social performance not exclusively through the end-result
but also through the process of achieving it (Appendix I). This goes in line with arguments of
Copestake (2007) who views social performance indicators as complement rather than
substitute for more flexible qualitative management.
Different microfinance development agencies have developed frameworks and tools to
monitor the MFIs social performance. These include Imp-Act, the SEEP Network/Argidius
Foundation, CGAP/CERISE, USAID and ACCIÓN. For instance, in order to assess the
poverty level of MFI clients (depth of outreach) the SPI-CERISE tool uses the targeting of the
poor, the percentage of female clients and the level of intervention in rural settings as depth of
outreach indicators (Zeller et al., 2003).
The above mentioned twin criteria - efficiency and outreach - have been the yardstick
of MFIs performance evaluation (cf. Table 1).
Table 1. MFI performance analysis
MFI performance Indicators of financial performance
(efficiency/self-sustainability)
Indicators of social performance (outreach)
Portfolio quality, leverage, capital adequacy ratio, productivity, efficiency, profitability, and financial viability.
Number of clients, amount of savings and the average value of savings accounts, the average of loans size (as a proxy for income level of the clientele), number of branches and village post/units, variety of financial services offered, percentage of target population served, annual growth of MFIs assets over recent years in real terms, and women’s participation.
22 MFIs have created a special network called the Social Performance Task Force with the intent to coordinate different initiatives and set up a common reporting format.
76
Existing research has explored different factors influencing MFIs organizational performance,
which are reflected by variables such as governance (Mersland and Strøm, 2009; Hartarska
and Mersland, 2009), loan delivery (Cull et al., 2007), tradeoff (Hermes, Lensink and
Meesters, 2011), the maturity of MFIs (Caudill et al., 2009), financial regulation (Hatarska
and Nadolnyak, 2007), the organizational structure (Tucker, 2001), the internal management
skills (Hudon, 2007), the macroeconomic context (Ahlin, Lin and Maio, 2010) and product
delivery mechanisms (McCord, Buczkowski and Saksena, 2006).
In the above mentioned studies, typically, cost rather than profit functions are estimated,
because MFIs minimize costs, and do not necessarily maximize profits. Estimation methods
include stochastic frontiers (Hartarska and Mersland, 2009; Hermes et al., 2011),
semiparametric smooth coefficient approach (Hartarska, Parmeter and Mersland, 2011), data
envelopment analysis (Paxton, 2007; Gutierres-Nieto et al., 2007) as well as a mixture model
of two normal distributions (Caudill et al., 2009).
Often, MFIs in practice tend to extend larger loans in order to reduce transaction costs
and enhance their efficiency. This phenomenon, often linked to "mission drift" (Armendáriz
and Szafarz, 2011) creates new forms of exclusion. Here comes the paradox for MFIs in
managing the double bottom line. At present, when the microfinance industry has entered
into the commercialization phase, the issue of financial sustainability of MFIs gave rise to an
important debate between the financial systems approach and the poverty lending approach
(Robinson, 2001). The financial systems approach emphasizes importance of being able to
cover transaction costs and to reduce operational costs as much as possible. Whereas, the
poverty lending approach stresses on reducing/subsidizing interest rates and using credit to
help overcome poverty, primarily by providing credit with subsidized interest rates.
Therefore, given that lending to poor borrowers can be very costly, there is a trade-off
between outreach and sustainability goals.
Within the increasing interest in MFIs performance assessment, a significant question
of trade-offs between efficiency and outreach is being more and more explored by academics.
However, the literature on this issue is not extensive. One of the recent studies on the trade-
off between outreach to the poor and efficiency of MFIs was done by Hermes, Lensink and
Meesters (2011). Using data for 435 MFI for the period 1997–2007 the study focuses on the
relationship between MFI cost efficiency (as a measure of sustainability measured by using a
stochastic frontier analysis) and the depth of outreach measured by the average loan balance
77
and percentage of women borrowers. Hermes et al. bring convincing evidence that outreach is
negatively related to efficiency of MFIs, in particular MFIs that have a lower average loan
balance (a measure of the depth of outreach) are also less efficient (Hermes, Lensink and
Meesters, 2011). Furthermore, the authors argue that MFIs that have more women borrowers
as clients (again considered as a measure of the depth of outreach) are less efficient.
Cull et al. (2007, 2009) have conducted a series of empirical recent research on
important trade-offs that microfinance practitioners, donors, and regulators navigate. Among
the key findings the authors point out that financial self-sustainability and serving poor
households are not, by definition, incompatible. Already in their most recent study Cull et al.
(2011), using data from the largest 137 MFIs, investigate whether prudential regulation and
supervision affect the performance and outreach of MFIs. Building on Hartarska and
Nadolnyak (2007), they argue that this issue has become increasingly important since several
of the largest MFIs have started to raise increasing amounts of deposits from the public, in
most cases relatively poor people. This means that protection of these deposits has become a
policy relevant issue. Results of the study show that supervision has a negative effect on
outreach, since supervision is positively associated with the average loan balance, whereas it
is negatively associated with the percentage women borrowers.
In the light of the fast evolving trend of broadening product offers in the microfinance
industry we intend to explore the effect of multiple financial products on MFIs efficiency and
outreach and its role in the trade-off of these two measurements. We build on the claim that
product diversification could enhance the lending capacity of MFIs. The existing evidence
claims that combined financial services (both savings and insurance) can help clients in
dealing with expected (such as social events or primary health care) or unexpected (such as
accident, funeral ...) liquidity needs when events arise (ILO STEP, 2005). Another study done
by Fernando (2006) suggests that credit does not reach the poorest of the poor due to the self-
selection of credit-worthy borrowers, determined according to their ability to pay.
2.3. The role of service diversification in the MFI performance
While microfinance is widely acknowledged to represent a possible solution to the financing
problems of poor houselholds and microbusinesses, there is remarkably little examination of
the connection between microfinance and product innovation (Nugroho and Miles, 2009).
When it comes to the firm-specific factors influence on product innovation in MFIs once
should bear in mind that microfinance is a capital-intensive activity, and MFIs require
78
sustained injections of capital for on-lending (Moussa, 2007). The main mission of MFIs is to
reach out as many untapped poor as possible. However, as Alarcon (2008) indicates the most
important constraint for MFIs not to expand their outreach is the limited sources of funds. In
overcoming this challenge of covering the high operational costs and remaining competitive
MFIs diversify their product offerings (Gupta, 2008).
Existing literature offers some elements to formulate hypotheses with relation to the
service portfolio diversification and performance of MFIs (more precisely, the depth of
poverty outreach and the efficiency). A set of measurements have been set up for assessing
the MFIs’ financial performance: self-sustainability, dependence upon donors, return on
investment etc. Moreover, academics refer to various proxies (number of clients serviced, in
particular the number of returning clients (Hermes et al., 2009)) and explanatory variables to
outreach (i.e. income per head, population density, donor support, governance and
commercial bank presence (Armendáriz and VanRoose, 2009)).
Recent studies came to demonstrate the advantages and contributions of joint-lending
services in efficient management of MFIs (enhancement of incentive systems, addressing
information asymmetry problems etc.). The existing empirical findings allow to claim that
offering wider choice of microfinance services contributes to better serving the needs of the
poor and can lead to a higher number of poor persons reached (Labie et al, 2006). This goes in
line with Morris and Barnes (2005) statement. The authors’ argue that MFIs can help client
households reducing their financial vulnerability through product diversification.
Both in practice and in academic writing, savings is clearly gaining important interest
in microfinance programmes, hence becoming a significant pillar of MFIs’ service portfolio
(Robinson, 2001; Hirschland, 2005; Meyer, 2002; Dowla and Alamgir, 2003; Matin, Hulme
and Rutherford, 2002). The demand of microsavings as well as socially and financially
benefits of its mobilization is now commonly acknowledged (Karlan and Morduch, 2010;
Matin, Hulme and Rutherford, 2002, to name just a few). The existing empirical evidence
created solid basis to argue that the ability to mobilize savings combined with credit can
contribute both to meeting demands of the poor and to enhancing MFIs’ long-term
sustainability by also reducing their dependency on subsidies (Ledgerwood, 1999; Robinson,
2001). Building on this, the first chapter of the thesis shows that integrating voluntary and
compulsory savings in the incentive mechanism of joint-lending microfinance contracts
enhances the MFIs ability of better dealing with adverse selection and screening issues.
79
Another recent study carried out by Adjei, Arun and Hossein (2009) demonstrates that
in Ghana, microsavings and microinsurance have improved the clients’ and their families’ life
quality by allowing them to build up their asset base.
This said we acknowledge as well that offering credit and savings simultaneously may
also involve organizational risks, linked to the different nature of loans and savings.
According to (Robinson, 2004) many organizations may feel the demand for savings without
having the necessary resources to respond to it or in certain cases national legislation creates
restricted conditions for a MFI to deliver savings products (Hatarska and Nadolnyak, 2007).
However, combining credit and savings are encouraged when referring to long term
organizational sustainability as savings allow to be less dependent of external loans
(Armendáriz and Morduch, 2005; Robinson, 2004). In this vein, Wisniwsky (1999) claims
that equity is the most expensive funding source and that noninterest bearing deposits
constitute the cheapest source. Indeed, the evidence shows that larger MFIs offering deposits
operate more cost effectively over time (Caudill et al., 2009). While savings could entail
various advantages for MFIs, they have a social mission to provide security and stability to
clients. Building on the above said and arguing that by definition MFIs offering diversified
services give clients the possibility of using a larger choice of financial services, one should
expect that both the financial and social performance of multi-service MFIs is higher than that
of mono-service MFIs (Peachey, 2007). As a complement to credit, savings can yield
economies of scope, which can enable lower financial costs and eventually compensate for
the increased operational costs and risks. Thus, building on Hirschland (2005) and Hartarska,
Parmeter and Mersland (2011) we are interested to explore whether when combining credit
with savings economies of scope23 enables MFIs to achieve efficiency and productivity
advantages.
2.4. Method: Propensity score matching approach
This section discusses the propensity score matching (PSM) methodology and its application
to our specific case of MFIs performance. The PMS idea and methodology can be applied in
23 According to Hartarska, Parmeter, Mersland (2011): “Economies of scope can emerge from two sources: (i)
allocation of fixed costs over an extended product mix and (ii) cost complementarities across categories in
production. Allocating fixed costs over a firm's product mix can contribute to scope economies when excess
capital capacity is reduced by providing both savings and loans rather than individual provision of these
services. Alternatively, cost complementarities result in scope economies when consumer information developed
in the production of either savings or loans is used to reduce the monitoring requirements of the other product.”

80
any evaluation study where it is possible to identify: (i) a treatment; (ii) a group of treated
individuals, and (iii) a group of untreated individuals (Caliendo and Kopeinig, 2005).
Empirical studies using PSM can be found in very diverse fields of research. This
method has become a popular non-parametric approach and is widely applied in estimating
causal treatment effects (e.g., see Dehejia and Wahba, 2002; Heckman, Ichimura and Todd,
1997; etc.). In the finance literature the method applications are in seasoned equity offerings
in Cheng (2003), diversification in Villalonga (2004), and foreign investment in Navaretti and
Castellani (2004). However, this method has not been applied in microfinance studies so far.
In this chapter, we apply PSM to evaluate the causal effect of combining microsavings
with microcredit services (which we call multiservice) on MFI performance with
microsavings considered as the treatment, the microcredit plus microsavings offering MFIs as
the group of treated units, and only microcredit offering MFIs (which we call mono-service)
as the group of untreated units.
To estimate the causal effect of savings, we need to know what would have happened
to the performance of multiservice MFIs banks had they not offered savings combined with
credit. To do so, let S be a variable indicating savings offering and taking value equal to one if
MFI i offers combined microfinance services.
Let ∆��1 be the performance gain achieved by MFI i if it offered microsavings and ∆��0 be the hypothetical performance gain of the same MFI i had it not offered microsavings.
The effect of combining savings with credit on the performance of MFI i, known in the
evaluation literature as the average treatment effect on the treated, can be expressed as
follows: �� = �(∆��1| � = 1) − �(∆��0| � = 1). (1)
In equation (1) �(∆��0| � = 1), which stands for the counterfactual mean or the
hypothetical performance gain that an MFI with deposits would have had it not suggested
deposits, is unobservable. This constitutes the fundamental problem of causal inference in
evaluation studies (Holland, 1986).
To overcome this problem we need to find a proxy for the counterfactual mean �(∆��0| � =
1). Using the mean outcome for credit only MFIs as a proxy would yield estimates of the
combined microfinance services effect plus selection bias (Heckman and Smith, 1995). Here
the selection bias stems from the unit heterogeneity, or the fact that savings plus credit
offering MFIs and credit only MFIs might be systematically different.
81
A key problem that often plagues observational studies, such as using randomized
control trials (RCTs), is the lack of randomization in assigning individuals to either treatment
or control groups. When randomization works, measurable and immeasurable differences
between treatment and control groups are minimized or avoided entirely. However, one
should remember that randomization is not feasible. Therefore, in this chapter we built on
Sarkisyan et al. (2009) to use the matching approach by trying to replicate experimental
studies conditions to estimate the counterfactual mean.
Matching involves pairing treatment and comparison units that are similar in terms of
their observable characteristics. When the relevant differences between any two units are
captured in the observable (pretreatment) covariates, matching methods can yield an unbiased
estimate of the treatment impact. Thus, the main purpose of a matching procedure is to reduce
selection bias by increasing the balance between the treatment and control groups.
The implementation of the matching approach may be complicated when the set of
conditioning covariates X is large. However, as to Rosenbaum and Rubin (1983)
dimensionality can be significantly reduced by using the propensity score, or the probability
of receiving the treatment conditional on the relevant pre-treatment covariates.
Applying this idea to the case of combined microfinance services, we build the control group
from non-deposit MFIs.
Using the propensity score, the equation for the average savings offering effect
becomes: �� = � �∆��1| � = 1,����,�� − ��∆��0| � = 1,�(��)�. (2)
Propensity score is the probability of taking treatment given a vector of observed
variable.
The equation tells that if we take individuals with the same propensity score, and divide them
into two groups (those who were and were not treated) the groups will be approximately
balanced on the variables predicting the propensity score.
For consistent estimates of the savings combined with credit services effect, two key
assumptions must hold: first, the conditional independence assumption and, second, the
overlap assumption.
82
According to Smith and Todd (2005) the conditional independence assumption
requires the mean outcomes to be independent of the treatment after conditioning on a set of
observable covariates and can be formally stated as24:
(∆��0,∆��1) ⊥ � | �� �� (∆��0,∆��1)⊥ � | �(��). (3)
Equation (3) assumes that there are no unobservable differences between MFIs taking
deposits and the ones without deposits after conditioning on �� so that any systematic
differences in outcomes can be attributed to the deposit taking effect (see Sarkisyan et al.,
2009).
Next we present the overlap (the same as common support) assumption. This
assumption requires an overlap in the distribution of covariates between the treated units and
the control group members in order to make matching possible. It can be formally stated as:
0 < Pr(� = 1 | ��) < 1. (4)
This assumption imposes a positive probability of either deposit offering (S=1) or no
deposits (S=0), to ensure the existence of potential matches for each deposit offering MFI
among credit only MFIs.
Thus, according to Smith and Todd (2005) if the two assumptions hold, we can use the mean
outcome for the matched non-deposit offering MFIs as a proxy for the performance gain that
the deposit offering MFIs would have had had they not combined credit with deposits (i.e.,
(∆��0| � = 1) in equation (1)).
In our model the dependent variable, which we call Ddeposit, is the same across the groups.
Dependent variables are all dummy variables meaning that if a MFI takes deposits,
Ddeposit=1 and if a MFI does not take deposits, Ddeposit=0. In other words, our dependent
variable is not continuous variable (e.g. deposit amount by MFIs) but whether MFIs take
deposits or not.
24 Symbol ⊥ stands for orthogonality between two variables.
83
The independent variables are grouped into three groups: MFI performance
(profitability and productivity, the breadth and depth of outreach), MFI characteristics (such
as MFI age, legal status, gender focus, risk characteristics also capital structure elements etc.)
and macro-level data. A detailed description of all of the variables used can be found in
Appendix J.
In our study the financial performance is measured by the return-on-assets ratio (ROA)
and return-on-equity (ROE).25 Earlier studies used operational self-sufficiency to measure
sustainability of the lending operations, because microfinance was funded by subsidized
loans, grants provided by donors (some with special conditions) and funds by (private)
charities.26 The gradual move towards the use of commercial funding shifted the interests
towards MFIs returns-on-assets, because it provides a broader perspective compared to the
alternative indicators as it transcends the core activity of MFIs - providing loans and savings
and tracks income from all operating activities.
Like general lending institutions, financial performance in MFIs can also be measured by
return-on-equity. ROE tells how effectively an organization is taking advantage of its base
equity, or risk-based capital, and as compared to ROA it is not asset-dependent and ignores
return on scale.27
Furthermore, MFI productivity is measured with the number of borrowers per loan
officer. The ratio of the number of borrowers per loan officer is a variable that illustrates the
productivity of the loan officer.28 The main costs of the loan granting activity of MFIs include
the financial costs of accessing funds, the fixed costs of supporting the MFI and the
administrative costs of maintaining a relationship with borrowers for the provision of loans
and other services. Given the loan methodologies in microfinance, the relationship with
borrowers, including the gathering of information, the monitoring of borrowers or the
collection of late payments, is the main component of the cost structure, occupying the bulk of
the staff time and cost. As highlighted by Hudon and Traça (2011), in theory, this cost should
25 ROA reflects the organization’s ability to deploy its assets profitably; it excludes non-operating income and donation. In other words, ROA tell us how effectively an MFI is generating general ledger earnings on its base of assets. 26 Operational self-sufficiency is a ratio indicating whether or not enough revenue has been earned to cover the MFI’s total costs – operational expenses, loan loss provisions and financial costs. 27 Many scholars prefer ROE since equity represents the owners’ interest in the business. 28 As argued by Christen (2000), measuring efficiency using resources per borrower has the additional benefit of neutralizing the effect of loan size. The alternative of using the cost per dollar of loan, institutions serving the low-end market are likely to be, on average, more efficient than broad and high-end programs.
84
depend on the actual number of borrowers, the numbers of loans provided to each, and the
value of each loan. However, experience from microfinance organizations suggests that once
a relationship with a client is established, the marginal costs of providing additional or larger
loans amount only to the financial cost of the funds lent, while the marginal administrative
cost is small. Hence, we use the variable of staff productivity defined in terms of the number
of borrowers per staff to capture the efficiency of an MFI.
Ayayi and Sene (2010) argue that good management through investment in human and
technological resources, together with financial incentive mechanisms, should increase the
quality and profitability of loan officers, lower personnel costs and heighten loan officer
productivity. This means also that MFIs with higher productivity of staff will be more ready
and skilled to implement and manage effectively deposit services. Consequently, we
anticipate a direct relationship between the number of borrowers per loan officer and deposit
taking, which implies that deposit taking MFIs will have better productivity of the loan
officer.
In practice, microfinance often entails distinct trade-offs between maximizing financial
performance and meeting social goals. Several studies confirm the existence of the “mission
drift” (Cull et al., 2007; Augsburg and Fouillet, 2010; Nawaz, 2010), while others suggest that
financial sustainability and social outreach complement and reinforce each other (Gonzalez
and Rosenberg, 2006; Schicks, 2007; Armendáriz and Szafarz, 2011).
We account for the social performance by looking at two dimensions of outreach– depth
of outreach or how poor the clients are relative to the general population, and the number of
poor clients (breadth of outreach). First, we account for the breadth of outreach, or how many
clients (borrowers) the MFIs reach. We use the original value of the total number of active
borrowers. Next, we account for the poverty level of clients, and we use a measure the depth
of outreach. It shows whether a MFI addresses the needs of the poorest or targets better-off
clients (see Quayes, 2012). Depth of outreach can be measured by the average loan balance
with its higher values indicating less depth of outreach, since the MFI is expected to provide
fewer loans to poor borrowers.
We assume that MFIs with deposits will have better profitability and outreach as compared to
those institutions, which do not take deposits.
The other set of control variables is related to MFI specific internal characteristics. For
example, we look at the debt-to-equity ratio to widely used measure of capital adequacy. This
ratio is of particular interest to lenders, because it indicates how much of a safety cushion in
85
the form of equity there is in the institution to absorb losses. We assume that MFIs, which
take deposits, will have higher debt-to-equity ratio, which could positively affect their internal
efficiency: internal control, reduced information opacity, reduced dependency on external
funds etc.
MFI size is measured by total assets, which is adjusted for inflation. The size effect may
be an indicator of the fact that larger MFIs are more cost-effective and they are more
leveraged and with less total equity (Caudill et al., 2009). The empirical evidence shows that
the larger size leads to a possible cost savings due to the advantages afforded by potential
economies of scale, as well as potential scope economies between deposits and loans. Hence,
one may argue that larger MFIs will be inclined to take deposits.
Administrative expenses to asset ratio, which is also called the operating expense ratio, is
the administrative expenses as a percentage of total assets. This ratio takes into account the
amount of inputs and outputs, as well as their price and value. Although the ratio improves as
the average loan size increases, it does not detract from the importance of this indicator.
We believe that the process of mobilizing savings increases administrative expenses, which
makes retail financial intermediaries appear less efficient than credit-only institutions.
However, this trade-off is between marginally higher administrative expenses and a
significantly lower cost of funds. For instance, MicroRate provides evidence on MFIs in Latin
America, which states that mobilizing retail deposits adds approximately two percent to an
institution's administrative expense ratio, all things being equal. But these higher expenses
tend to be more than offset by the lower cost of funds.29 Thus, we believe that the higher the
operation expense ratio the less likely the MFI is to mobilize savings.
We also adjust for asset quality and risk taking in an MFI typically measured by non-
performing loan ratios using portfolio at risk ratio of loans overdue more than 30 days, which
is a standard ratio used by MFIs to measure the risk level of their loan portfolio. This is
needed because lower asset quality (e.g. higher nonperforming loan ratio) requires more
resources to manage the higher risk (Hartarska, Nadolnyak and Shen, 2012). Thus, we also
control for the level of risk.
We also control for gender focus by including the percentage of female borrowers since
lending to women is associated with lending to poorer borrowers. For example, women may
be considered riskier borrowers because of their limited repayment capacity (Hartarska,
29
http://www.wtrc-tmed.org/resources/Efficiency%20in%20MFIs.pdf

86
Nadolnyak and Shen, 2012). On the other hand, evidence from a number of studies indicates
that since women living in developing regions often face restricted opportunities for accessing
financial services they will be more inclined to exhibit higher repayment rates in order to
continue to be further financed (Van Tassel, 2004). Thus, they are less subject to moral
hazard, and larger number of women borrowers could imply better repayment rates thus
having access to larger range of MFI services.
We use a group of dummy variables to capture differences in legal status – regulated and
non-regulated. This is needed, because MFI choice of taking deposits may differ between
types of MFIs due to differences in regulations specific to each status. For example, in some
countries, such as Armenia, once MFIs become regulated and turned into universal credit
organizations (UCO) they are not allowed to mobilize deposits to fund their capital.
MFI age is controlled for to allow for the possibility that older, more experienced MFIs
are more efficient (e.g., see Caudill et al., 2009) thus, have better managerial and financial
skills to mobilize savings. We use three groups of dummies to control for age –New, Young
and Mature. We expect age to be positively linked to MFI taking deposits. So, we take Mature
MFIs as an omitted category. For example, Gonzalez-Vega et al. (1996) point out several
possible benefits of the passage of time on microfinance performance increase: improved
lending technology, accumulated information on clientele, acquired reputation and
connections with international networks, which will ease managing savings mobilization (see
Charlton, 2008).
Target market dummy groups four different categories of MFIs based on the average
balance of loans served: low-end, broad, high-end and small business. For international
comparison, this balance is stated as a percentage of local income levels (GNI per capita).30 In
our model the high-end category of MFIs is the omitted. We assume that MFIs taking deposits
will rather be included into the small business or broad categories.
Within the independent variables we look also at the MFI capital structure elements. The
capital structure is measured by the percentage of capital (scaled by total assets) coming from
each specific source of funds, which are represented as percentage of total assets in our study.
We have categories of equity, grants, savings, retained earnings, concessional loans, bank
30
According to MIX: Depth = Avg. Loan Balance per Borrower/GNI per Capita

87
loans, other sources of funds, which are mainly short term liabilities31 and other commercial
funding, which refers only to liabilities (e.g., that is both private and institutional investor
funding in the region such as BlueOrchard, Oikocredit, IFC etc.). The base group in this
specification serving as a comparison is savings.
Fehr and Hishigsuren (2006) illustrate the evolution of MFI financing moving toward
equity financing, which has become a source of diversification for most of regulated MFIs
seeking to lower their cost of funds and enhance their ability to expand outreach to target
clients. According to Fehr and Hishigsuren (2006) framework most MFIs start out as NGOs,
which do not take deposits. As the MFI matures, mobilizing deposits as well as private debt
capital becomes available. For example, Caudill et al. (2009) show that MFIs becoming more
cost effective over time rely less on subsidies and more heavily on deposits. Furthermore,
Bogan (2011) finds that increased use of grants by large MFIs decreases financial
performance by supporting the profit-incentive view that MFIs should rely less on grants, soft
loans, and other types of donor funds.
The last group of independent variables includes country-level macroeconomic indicators
Existing empirical evidence shows that external factors related to a country’s macroeconomic
environment, level of financial development, population density, etc. affect significantly the
MFIs operations, and need to be incorporated in such studies. For instance, lending to rural
borrowers, which in the ECA region are perceived as borrowers without permanent
employment and regular income or liquid assets, might be associated with higher risk and
further increase of loan default probability in a country where the MFI is located (see
Sheremenko, Escalante and Florkowski, 2012).
We include a measure of the agricultural value added as percentage of GDP to control for
the fact that borrowers engaged in agricultural production may be more reliable since they
have fewer alternative sources of funds. Another possible argument is that MFIs perceive
agriculture-related borrowers as farmers with a consistent history of employment, income, and
marketable asset ownership. GDP growth is other important indicator of a country’s
macroeconomic context, which could affect borrowers’ purchasing power and could be
associated with their risk of default. Finally, the private credit bureaus coverage is important
in terms of credit evaluation and portfolio management by MFIs. The existence of credit
31
The category of "other sources of fund", which we call short-term liabilities, include liabilities - other short term financial liabilities, trade and other payables, provisions for employee benefits, deferred revenue, current tax liabilities, deferred tax liabilities; and equity - other equity interest.
88
registers can reduce the extent of asymmetric information by making a borrower’s credit
history available to MFIs. The higher coverage can be associated with decrease in landing to
high risk individuals, with poor repayment histories, defaults or bankruptcies.
2.5. Data
In investigating whether deposit taking MFIs have better performance as compared to those
MFIs without deposits, we utilize a new panel data extracted from a grass-root network
Microfinance Centre for Central & Eastern Europe and the New Independent States (MFC for
CEE and NIS) covering a five-year period from 2005 to 2009. This dataset for 137 MFIs in 19
countries from the ECA region was complete by the annual data reported by individual MFIs
in Microfinance Information Exchange (MIX) online database (2012).32,33 Specifically, for
the capital structure we employed a unique database provided by the MFC available only for
this period.
The data on country specific socio-economic characteristics is extracted from World
Development Indicators (WDI). All dollar-value figures in the dataset are 2010 dollar based
on U.S. CPI.
We divide the entire sample of MFIs into two groups based on their profit status
indicator identified in the data as a characteristic variable with two categories- profit and non-
profit. As earlier highlighted within each group of MFIs we look at the institutions taking
deposits and those without deposits.
Summary statistics for the unmatched sample for both the for-profit MFIs and non-
profit MFIs are presented in Table 2a and 2b. The tables show the average values of the
performance measurements, capital structure, MFIs’ characteristics and microenvironment
factors used to estimate the model. One can note that the structure of MFIs with and without
deposits is statistically different for most of the characteristics.
32 The sample includes the following countries classified in the ECA region by the MIX Market: Albania, Armenia, Azerbaijan, Bosnia and Herzegovina, Bulgaria, Georgia, Kazakhstan, Kyrgyzstan, Macedonia, Moldova, Mongolia, Montenegro, Poland, Romania, Russia, Serbia, Tajikistan, Ukraine and Uzbekistan. 33 We take into consideration unique industry characteristics of the region: ECA is relatively new to microfinance. “MFIs operating in Eastern Europe and Central Asia are somewhat different from MFIs
operating elsewhere in the world. Compared to MFIs in other regions, the MFIs in the ECA region are among
the youngest in the microfinance industry, while their performance ranks among the best…” (cf. Caudill, Gropper and Hartarska, 2009). Moreover, although MFIs in this region are dominated by NGOs, average loan sizes are high due to the higher income and education levels. Compared with other regions, MFIs have rapidly achieved financial sustainability (Galema, Lensink and Mersland, 2012).
89
The results show that there are 175 unmatched observations for for-profit MFIs, which
mobilize savings; and 31 unmatched observations for MFIs without deposits (see Table 2a).
With regard to the MFI performance indicators the data shows that for the MFIs with
deposits the average staff productivity is 196 borrowers per staff as compared to the MFIs
without deposits, which have on average 146 borrowers per staff.
The average ROA is 0.5 percent for the MFIs with deposits and much higher (2.8
percent) for those without deposits. Next we look at the average ROE for the MFIs with
deposits, which is equal to 2.2 percent as compared to 11.2 percent for the MFIs without
deposits.
The summary statistics on the social performance indicators show that the breadth of
outreach is significantly higher for the non-deposit taking MFIs (on average 32,370 active
borrowers) as compared to the average number of clients served by the deposit taking MFIs
(9,035). However, the depth of outreach is slightly higher for MFIs, which take deposits,
which means indicates less depth of outreach, since the MFI is expected to provide fewer
loans to poor borrowers.
When it comes to the MFI characteristics debt- to-equity ratio is on average larger for
the institutions, which take deposits (5.2 percent) than for those ones without deposits (2.7
percent). The average amount of total assets is also larger for the for-profit MFIs with
deposits (111 million USD) as compared to the MFIs without deposits (18 million USD).
Contrary to this, on average the administrative expense ratio and the percentage of women
borrowers are smaller for the deposit taking MFIs. The portfolio quality is on overage less
risky for the MFIs without deposits (4.3 percent as compared to 5.3 percent for the deposit
taking MFIs). Within the observed MFIs with deposits on average all institutions are
regulated as compared to 84 percent of regulated MFIs without deposits.
In our sample on average higher number of newly aged MFIs does not mobilize
savings, however the picture changes for the young aged MFIs as the results show that young
MFIs with deposits are more numerous than those without deposits.
In their broad target markets MFIs with and without deposits are quite similar,
however MFIs with deposits are not present in the low-end target market. And interestingly,
the focus of those MFIs on small business target is more than two times higher as compared to
the MFIs without deposits.
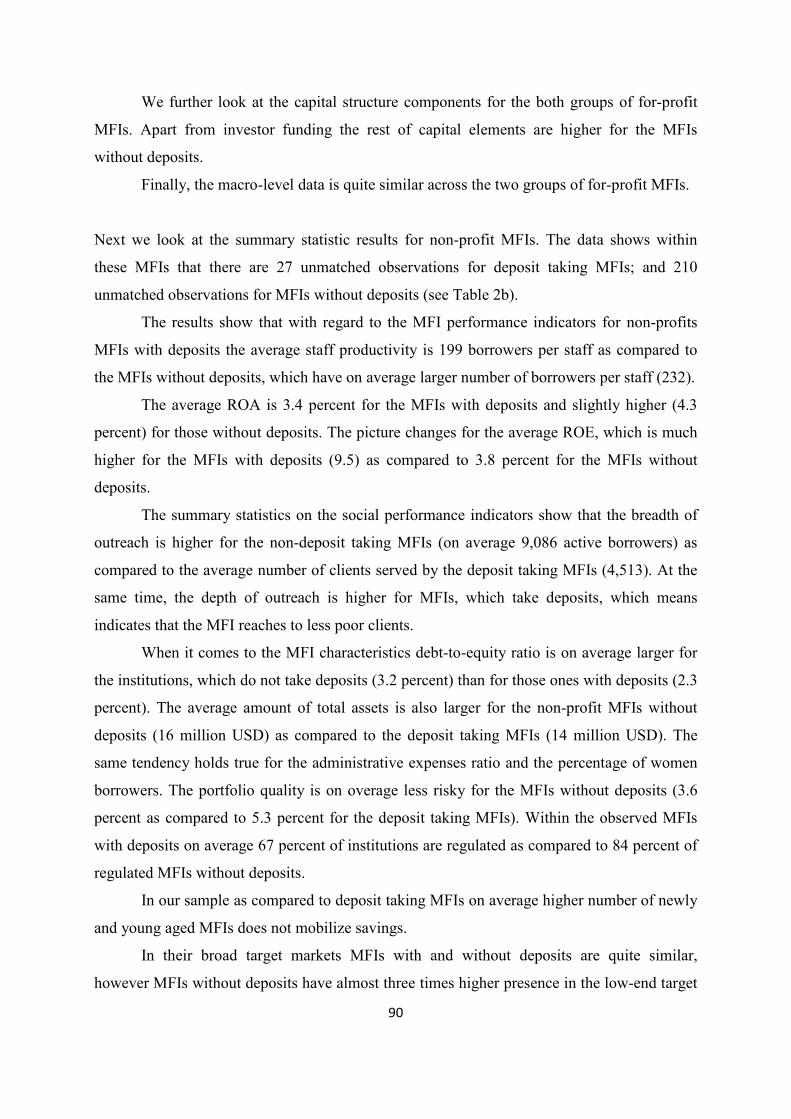
90
We further look at the capital structure components for the both groups of for-profit
MFIs. Apart from investor funding the rest of capital elements are higher for the MFIs
without deposits.
Finally, the macro-level data is quite similar across the two groups of for-profit MFIs.
Next we look at the summary statistic results for non-profit MFIs. The data shows within
these MFIs that there are 27 unmatched observations for deposit taking MFIs; and 210
unmatched observations for MFIs without deposits (see Table 2b).
The results show that with regard to the MFI performance indicators for non-profits
MFIs with deposits the average staff productivity is 199 borrowers per staff as compared to
the MFIs without deposits, which have on average larger number of borrowers per staff (232).
The average ROA is 3.4 percent for the MFIs with deposits and slightly higher (4.3
percent) for those without deposits. The picture changes for the average ROE, which is much
higher for the MFIs with deposits (9.5) as compared to 3.8 percent for the MFIs without
deposits.
The summary statistics on the social performance indicators show that the breadth of
outreach is higher for the non-deposit taking MFIs (on average 9,086 active borrowers) as
compared to the average number of clients served by the deposit taking MFIs (4,513). At the
same time, the depth of outreach is higher for MFIs, which take deposits, which means
indicates that the MFI reaches to less poor clients.
When it comes to the MFI characteristics debt-to-equity ratio is on average larger for
the institutions, which do not take deposits (3.2 percent) than for those ones with deposits (2.3
percent). The average amount of total assets is also larger for the non-profit MFIs without
deposits (16 million USD) as compared to the deposit taking MFIs (14 million USD). The
same tendency holds true for the administrative expenses ratio and the percentage of women
borrowers. The portfolio quality is on overage less risky for the MFIs without deposits (3.6
percent as compared to 5.3 percent for the deposit taking MFIs). Within the observed MFIs
with deposits on average 67 percent of institutions are regulated as compared to 84 percent of
regulated MFIs without deposits.
In our sample as compared to deposit taking MFIs on average higher number of newly
and young aged MFIs does not mobilize savings.
In their broad target markets MFIs with and without deposits are quite similar,
however MFIs without deposits have almost three times higher presence in the low-end target
91
market. And interestingly, the inverse statistics is true on small business target for the MFIs
with deposits, which have three times larger focus on small business target.
We further look at the capital structure components for the both groups of non-profit
MFIs. Apart from equity to total assets and short-term liabilities to total assets the rest of
capital elements are higher for the MFIs without deposits.
Finally, the results on macro-level data show that on average the percentage of rural
population and percentage of agriculture value added of GDP are quite similar across the two
groups of for-profit MFIs. However, the average percentage of private credit bureau coverage
and the average percentage of GDP growth are higher in countries with MFIs without
deposits.
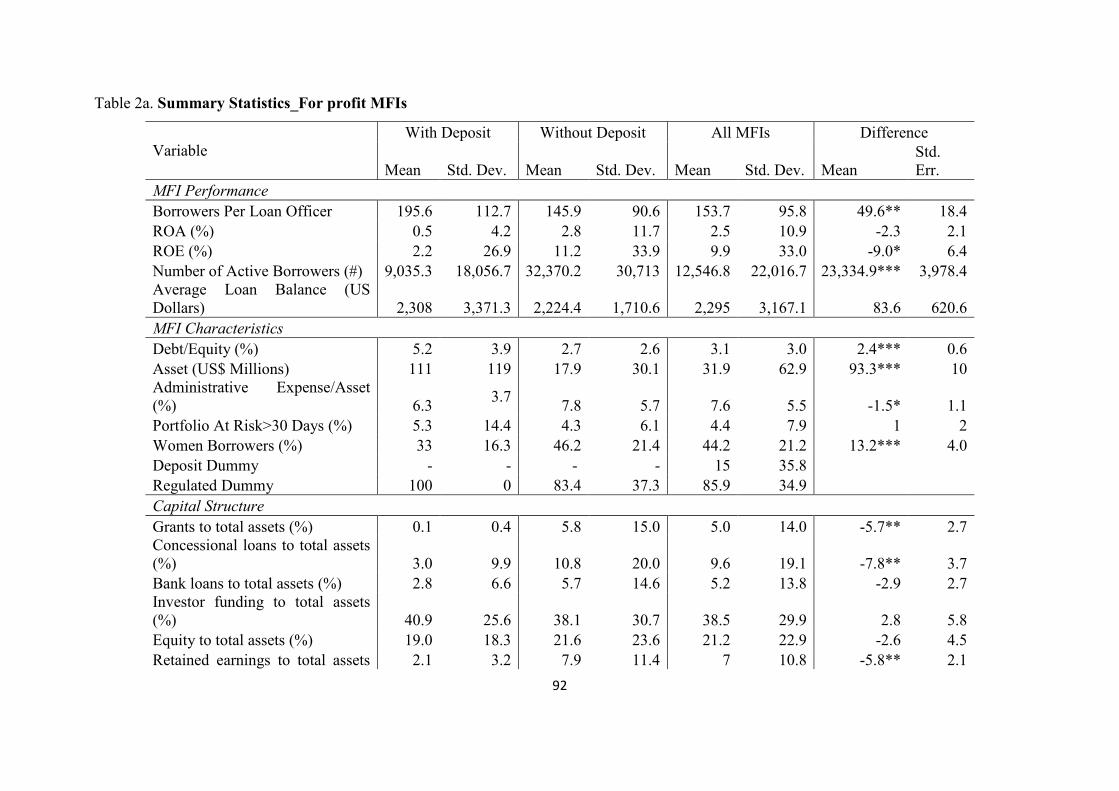
92
Table 2a. Summary Statistics_For profit MFIs
Variable With Deposit Without Deposit All MFIs Difference
Mean Std. Dev. Mean Std. Dev. Mean Std. Dev. Mean Std. Err.
MFI Performance Borrowers Per Loan Officer 195.6 112.7 145.9 90.6 153.7 95.8 49.6** 18.4 ROA (%) 0.5 4.2 2.8 11.7 2.5 10.9 -2.3 2.1 ROE (%) 2.2 26.9 11.2 33.9 9.9 33.0 -9.0* 6.4 Number of Active Borrowers (#) 9,035.3 18,056.7 32,370.2 30,713 12,546.8 22,016.7 23,334.9*** 3,978.4 Average Loan Balance (US Dollars) 2,308 3,371.3 2,224.4 1,710.6 2,295 3,167.1 83.6 620.6 MFI Characteristics
Debt/Equity (%) 5.2 3.9 2.7 2.6 3.1 3.0 2.4*** 0.6 Asset (US$ Millions) 111 119 17.9 30.1 31.9 62.9 93.3*** 10 Administrative Expense/Asset (%) 6.3
3.7 7.8 5.7 7.6 5.5 -1.5* 1.1
Portfolio At Risk>30 Days (%) 5.3 14.4 4.3 6.1 4.4 7.9 1 2 Women Borrowers (%) 33 16.3 46.2 21.4 44.2 21.2 13.2*** 4.0 Deposit Dummy - - - - 15 35.8
Regulated Dummy 100 0 83.4 37.3 85.9 34.9 Capital Structure
Grants to total assets (%) 0.1 0.4 5.8 15.0 5.0 14.0 -5.7** 2.7 Concessional loans to total assets (%) 3.0 9.9 10.8 20.0 9.6 19.1 -7.8** 3.7 Bank loans to total assets (%) 2.8 6.6 5.7 14.6 5.2 13.8 -2.9 2.7 Investor funding to total assets (%) 40.9 25.6 38.1 30.7 38.5 29.9 2.8 5.8 Equity to total assets (%) 19.0 18.3 21.6 23.6 21.2 22.9 -2.6 4.5 Retained earnings to total assets 2.1 3.2 7.9 11.4 7 10.8 -5.8** 2.1

93
(%) Short-term liabilities to total assets (%) 3.2 3.7 4.3 7.0 4.2 6.6 -1.1 1.3 Age Dummy
New 16.1 37.4 29.7 45.8 27.7 44.8 Young 38.7 49.5 29.1 45.6 30.6 46.2 Target Market Dummy
Broad 71.0 46.1 78.9 40.9 77.7 41.7 Low-end 0 0 5.1 22.2 4.4 20.5 Small Business 16.1 37.4 7.4 26.3 8.7 28.3 Macro Level
Rural Population (%) 50.1 14.6 50.3 13.1 50.3 13.3 Agriculture value added of GDP
(%) 15.9 6.9 15.2 8.5 15.3 8.3 Private Credit Bureau Coverage
(%) 9.9 20.3 9.5 14.5 9.6 15.5 GDP Growth (%) 7.8 9.2 6.1 6.5 6.3 7
Number of Observations(Unmatched) 175 - 31 - 206 -
Number of Observations(Matched) 28 - 5 - 33 -
*** p<0.01, ** p<0.05, * p<0.1
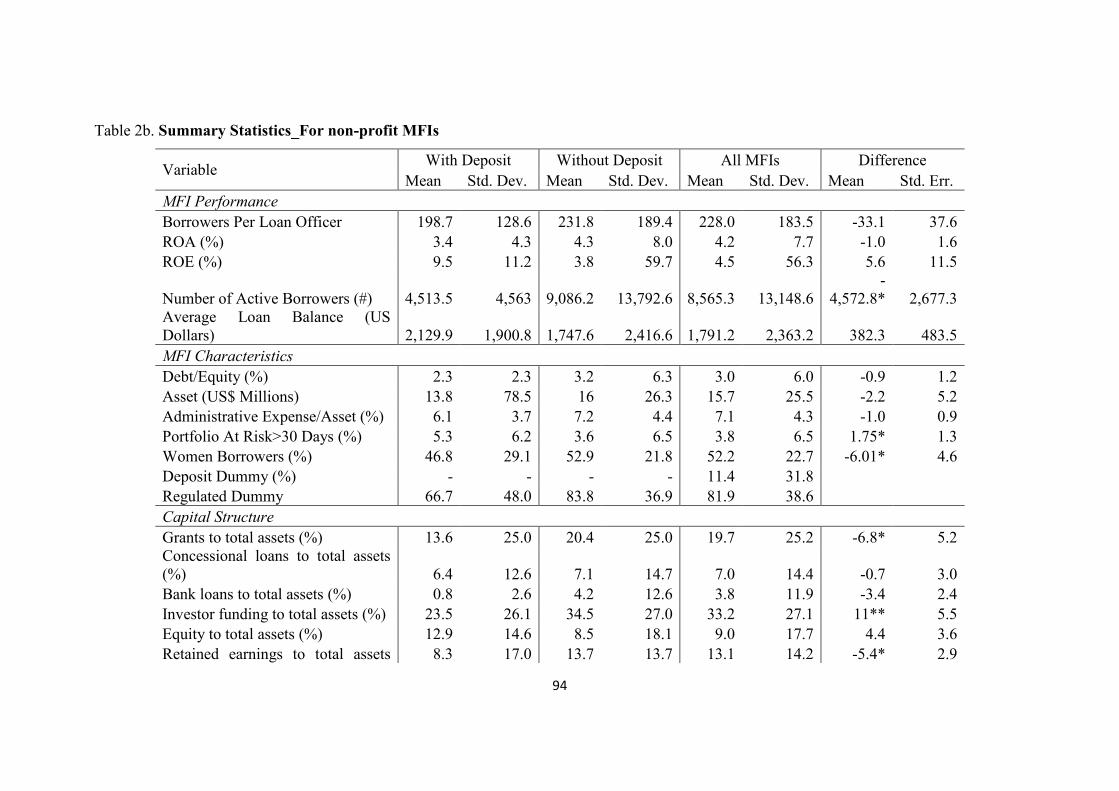
94
Table 2b. Summary Statistics_For non-profit MFIs
Variable With Deposit Without Deposit All MFIs Difference
Mean Std. Dev. Mean Std. Dev. Mean Std. Dev. Mean Std. Err. MFI Performance Borrowers Per Loan Officer 198.7 128.6 231.8 189.4 228.0 183.5 -33.1 37.6 ROA (%) 3.4 4.3 4.3 8.0 4.2 7.7 -1.0 1.6 ROE (%) 9.5 11.2 3.8 59.7 4.5 56.3 5.6 11.5
Number of Active Borrowers (#) 4,513.5 4,563 9,086.2 13,792.6 8,565.3 13,148.6 -
4,572.8* 2,677.3 Average Loan Balance (US Dollars) 2,129.9 1,900.8 1,747.6 2,416.6 1,791.2 2,363.2 382.3 483.5 MFI Characteristics Debt/Equity (%) 2.3 2.3 3.2 6.3 3.0 6.0 -0.9 1.2 Asset (US$ Millions) 13.8 78.5 16 26.3 15.7 25.5 -2.2 5.2 Administrative Expense/Asset (%) 6.1 3.7 7.2 4.4 7.1 4.3 -1.0 0.9 Portfolio At Risk>30 Days (%) 5.3 6.2 3.6 6.5 3.8 6.5 1.75* 1.3 Women Borrowers (%) 46.8 29.1 52.9 21.8 52.2 22.7 -6.01* 4.6 Deposit Dummy (%) - - - - 11.4 31.8
Regulated Dummy 66.7 48.0 83.8 36.9 81.9 38.6 Capital Structure
Grants to total assets (%) 13.6 25.0 20.4 25.0 19.7 25.2 -6.8* 5.2 Concessional loans to total assets (%) 6.4 12.6 7.1 14.7 7.0 14.4 -0.7 3.0 Bank loans to total assets (%) 0.8 2.6 4.2 12.6 3.8 11.9 -3.4 2.4 Investor funding to total assets (%) 23.5 26.1 34.5 27.0 33.2 27.1 11** 5.5 Equity to total assets (%) 12.9 14.6 8.5 18.1 9.0 17.7 4.4 3.6 Retained earnings to total assets 8.3 17.0 13.7 13.7 13.1 14.2 -5.4* 2.9
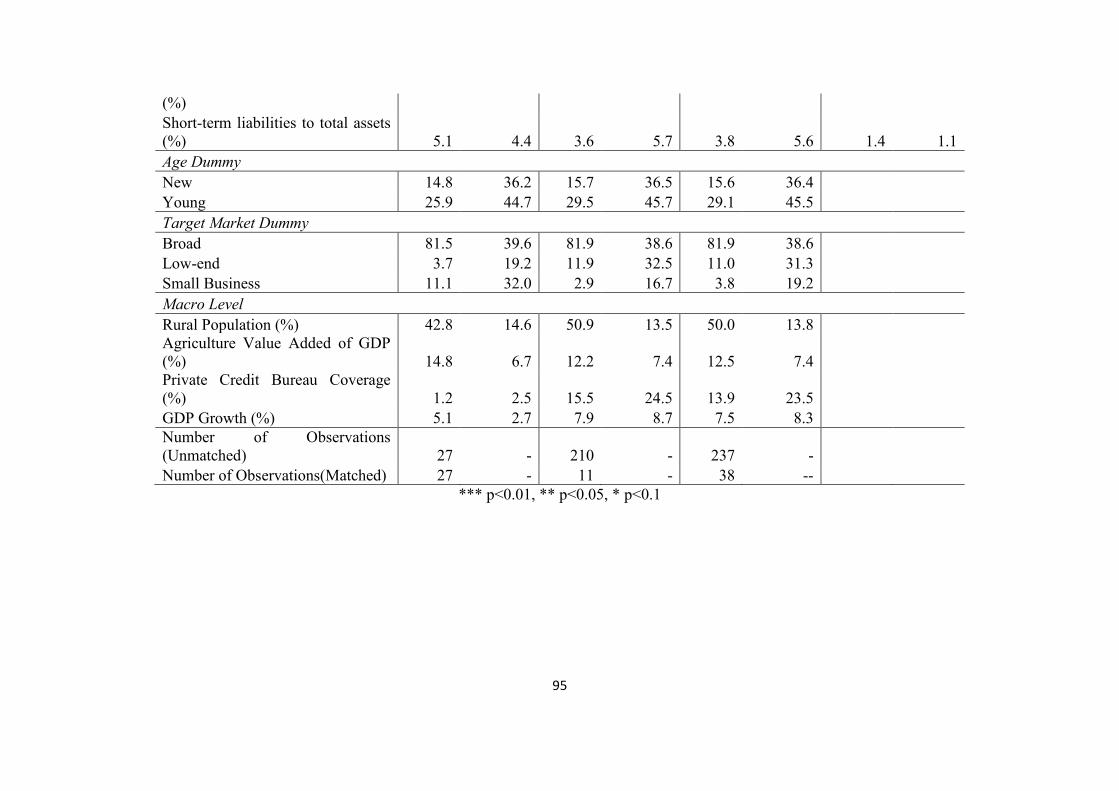
95
(%) Short-term liabilities to total assets (%) 5.1 4.4 3.6 5.7 3.8 5.6 1.4 1.1 Age Dummy New 14.8 36.2 15.7 36.5 15.6 36.4
Young 25.9 44.7 29.5 45.7 29.1 45.5 Target Market Dummy
Broad 81.5 39.6 81.9 38.6 81.9 38.6 Low-end 3.7 19.2 11.9 32.5 11.0 31.3 Small Business 11.1 32.0 2.9 16.7 3.8 19.2 Macro Level
Rural Population (%) 42.8 14.6 50.9 13.5 50.0 13.8 Agriculture Value Added of GDP
(%) 14.8 6.7 12.2 7.4 12.5 7.4 Private Credit Bureau Coverage
(%) 1.2 2.5 15.5 24.5 13.9 23.5 GDP Growth (%) 5.1 2.7 7.9 8.7 7.5 8.3
Number of Observations (Unmatched) 27 - 210 - 237 - Number of Observations(Matched) 27 - 11 - 38 --
*** p<0.01, ** p<0.05, * p<0.1
96
2.6. Propensity score matching analysis
We run separate regressions for the two groups of MFIs- for profit and non profit- given that
these two groups have totally different structure and internal control. We include country
dummies and MFI dummies into the model. The results are shown in Table 3. 34
Results for for-profit MFIs are presented in column (1), which presents results with
both country dummies and MFI dummies included. Further, column (2) shows results with
country dummies only, and column (3) is just pooled regression. In the same vein, results for
the non-profit MFIs group are demonstrated as follows: column (4) shows results with both
country dummies and MFI dummies, column (5) includes country fixed effect regression, and
column (6) is pooled regression.
We have used the regression with MFI and country dummies to compute the
propensity score. Hence, with respect to the objective of this study we fill focus on the results
in columns (1) and (4).
Within the for-profit MFIs subgroup there is a positive and significant relationship between
the debt to equity ratio and MFI probability of taking deposits. More precisely, an increase in
the debt to equity ratio will increase the probability of taking deposits. The confirms our
assumption that higher debt to equity leads to enhanced internal efficiency, which in its turn
will create a better administrative and operational environment within the institution for
deposit taking.
The same type of relationship exists between the total assets and deposits. An increase in asset
is associated with an increase of probability for for-profit MFIs to take deposits.
Next we find that in the capital structure of the for-profit MFIs, an increase of the investor
funding to total assets will decrease the probability for taking deposits. This result comes to
support the objections to using commercial loans is that they may be associated with mission
drift, which very often results in a decrease of the number of borrowers served and of
reaching fewer poor clients.
Further we look at the non-profit MFIs subgroup results. We find that increased
administrative expense ratio decreases deposit taking probability for MFIs within this
subgroup. This relationship has already been evidenced in the microfinance literature. Our
finding also support that deposit taking requires increased expenses in the administrative and
34 Some of the variables are missing from the regression as we have dropped them because of high colinearity, which is explained by the fact that we have many dummies in the model.
97
operational management of MFIs. However, one should also mention that these higher
expenses tend to be more than offset by the lower cost of funds.
The same type of relationship holds true for the increase in the portfolio at risk, which is
associated with less probability of taking deposits. This is explained by the fact that lower
asset quality (e.g. higher nonperforming loan ratio) requires more resources to manage the
higher risk (Hartarska, Nadolnyak and Shen, 2012). Thus, it decreases the MFI probability of
offering savings services.
With regard to the capital structure elements, retained earnings to total assets have a negative
impact on the non-profit MFIs’ probability to take deposits.
The probability of taking deposits is harder in more rural countries and in countries with
higher credit bureau coverage. However, an increase in agriculture value added (as percentage
of GDP) is associated with higher probability of deposits mobilization within non-profit
MFIs.
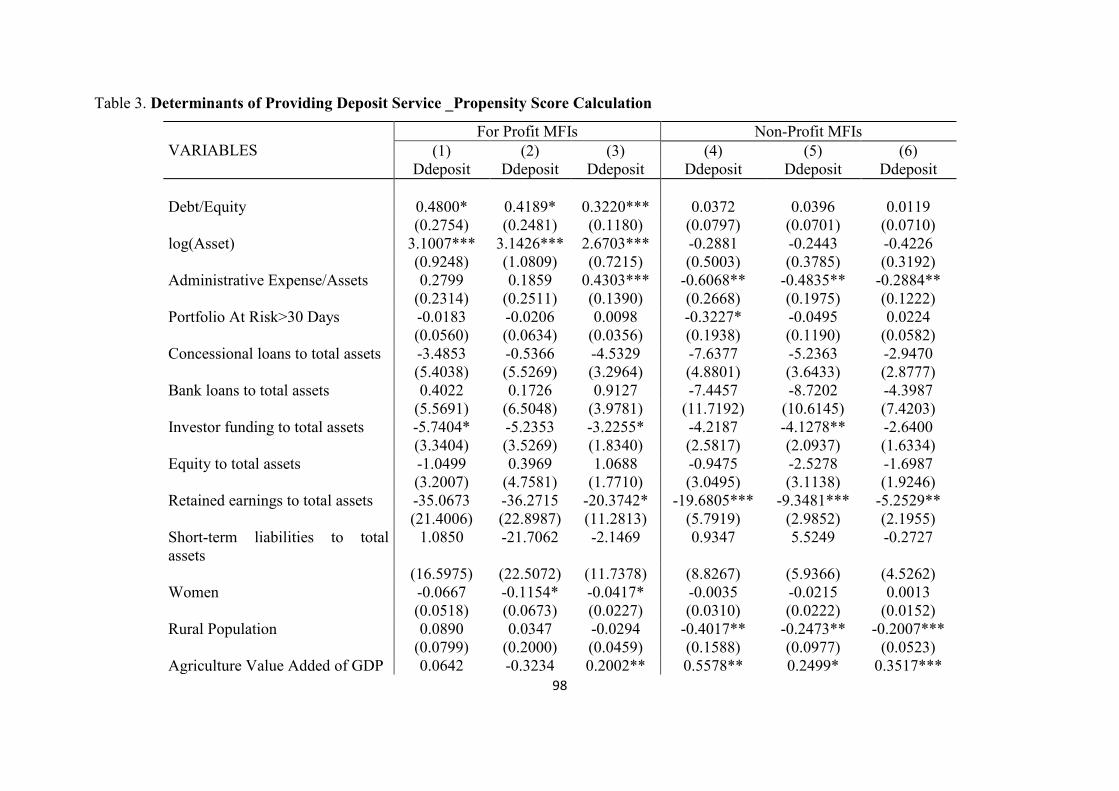
98
Table 3. Determinants of Providing Deposit Service _Propensity Score Calculation
VARIABLES For Profit MFIs Non-Profit MFIs
(1) (2) (3) (4) (5) (6) Ddeposit Ddeposit Ddeposit Ddeposit Ddeposit Ddeposit
Debt/Equity 0.4800* 0.4189* 0.3220*** 0.0372 0.0396 0.0119 (0.2754) (0.2481) (0.1180) (0.0797) (0.0701) (0.0710) log(Asset) 3.1007*** 3.1426*** 2.6703*** -0.2881 -0.2443 -0.4226 (0.9248) (1.0809) (0.7215) (0.5003) (0.3785) (0.3192) Administrative Expense/Assets 0.2799 0.1859 0.4303*** -0.6068** -0.4835** -0.2884** (0.2314) (0.2511) (0.1390) (0.2668) (0.1975) (0.1222) Portfolio At Risk>30 Days -0.0183 -0.0206 0.0098 -0.3227* -0.0495 0.0224 (0.0560) (0.0634) (0.0356) (0.1938) (0.1190) (0.0582) Concessional loans to total assets -3.4853 -0.5366 -4.5329 -7.6377 -5.2363 -2.9470 (5.4038) (5.5269) (3.2964) (4.8801) (3.6433) (2.8777) Bank loans to total assets 0.4022 0.1726 0.9127 -7.4457 -8.7202 -4.3987 (5.5691) (6.5048) (3.9781) (11.7192) (10.6145) (7.4203) Investor funding to total assets -5.7404* -5.2353 -3.2255* -4.2187 -4.1278** -2.6400 (3.3404) (3.5269) (1.8340) (2.5817) (2.0937) (1.6334) Equity to total assets -1.0499 0.3969 1.0688 -0.9475 -2.5278 -1.6987 (3.2007) (4.7581) (1.7710) (3.0495) (3.1138) (1.9246) Retained earnings to total assets -35.0673 -36.2715 -20.3742* -19.6805*** -9.3481*** -5.2529** (21.4006) (22.8987) (11.2813) (5.7919) (2.9852) (2.1955) Short-term liabilities to total assets
1.0850 -21.7062 -2.1469 0.9347 5.5249 -0.2727
(16.5975) (22.5072) (11.7378) (8.8267) (5.9366) (4.5262) Women -0.0667 -0.1154* -0.0417* -0.0035 -0.0215 0.0013 (0.0518) (0.0673) (0.0227) (0.0310) (0.0222) (0.0152) Rural Population 0.0890 0.0347 -0.0294 -0.4017** -0.2473** -0.2007*** (0.0799) (0.2000) (0.0459) (0.1588) (0.0977) (0.0523) Agriculture Value Added of GDP 0.0642 -0.3234 0.2002** 0.5578** 0.2499* 0.3517***

99
VARIABLES For Profit MFIs Non-Profit MFIs
(1) (2) (3) (4) (5) (6) Ddeposit Ddeposit Ddeposit Ddeposit Ddeposit Ddeposit
(0.1682) (0.3719) (0.0892) (0.2171) (0.1286) (0.1001) Private Credit Bureau Coverage -0.0699 -0.0789 -0.0019 -0.4436*** -0.2882*** -0.3781*** (0.0480) (0.1174) (0.0210) (0.1655) (0.1032) (0.1266) GDP Growth -0.0780 -0.0534 -0.0279 -0.1718 -0.1265 -0.1471* (0.0818) (0.1012) (0.0566) (0.1136) (0.0850) (0.0765) Regulate -2.6188 -1.1173 1.5387 (2.4937) (1.8143) (0.9488) New 4.0403 2.4369 2.3522 -3.0578 -0.6189 -1.2753 (2.7648) (3.4074) (1.5148) (2.0999) (1.4570) (0.9954) Young -0.1814 -1.7737 1.6677* -1.9930 -0.9267 -0.9064 (1.7061) (2.1797) (0.9974) (1.3939) (0.9871) (0.7184) Broad -0.1554 1.9905 -1.1347 2.4820 2.0411 2.0238 (1.7562) (2.0765) (1.2511) (2.0981) (1.5525) (1.4126) Low 5.3917 1.5421 1.9867 (3.6274) (2.3516) (1.9436) Small Business 0.8234 1.9884 0.0578 2.7846 -0.8247 0.8728 (2.3158) (2.4140) (1.5205) (3.7268) (2.1605) (1.7427) Constant -56.263*** -50.250** -48.807*** 23.8596** 17.4417** 11.6873* (18.74) (21.133) (13.985) (11.2386) (7.8525) (6.0840) Country Dummy Yes Yes No Yes Yes No MFI Dummy Yes No No Yes No No Observations 144 135 169 237 237 237 Pseudo R2 0.71 0.758 0.625 0.692 0.587 0.479 χ2 100.7 104.5 100.7 116.3 98.61 80.56
Standard errors in parentheses *** p<0.01, ** p<0.05, * p<0.1

100
After having looked at matching based on the propensity score under common support
condition we get the matched sample. As demonstrated in the summary statistics there are 28
matched observations for for-profit MFIs, which mobilize savings; and 5 matched
observations for MFIs without deposits (see Table 2a). Also, non-profit MFIs 27 matched
observations for deposit taking MFIs; and 11 matched observations for MFIs without deposits
(see Table 2b).
Table 4 shows results computed for the average treatment effect on the treated.
For comparing the profitability and outreach indicators of for-profit and non-profit
MFIs performance matched sample results, in which MFIs have similar characteristics apart
from deposits, are the key. The difference for for-profit MFIs is positive and significant.
We find that within the matched sample both for the for-profit and non-profit MFIs the
financial performance measured with ROA and ROE is not affected. Our results confirm
Rossel-Cambier (2012) regression findings, which suggest that the presence of savings or
insurance does not have a significant effect on the financial performance of MFIs, expressed
by ROA, ROE and OSS. This means that deposit are not linked to the MFI profitability,
supporting the notion that savings should be encouraged as a better instrument to serve the
needs of the poor, enhance the information exchange and deal with screening issues, which go
line with the arguments of the first chapter of this thesis, and not necessarily as a way to
increase financial performance.
We further find that the presence of savings services contributes to the improvement
of the MFI productivity. The results show that loan officer in MFIs with deposits reach 80
more borrowers and it is significantly different from non-deposit takers. This result is
consistent with the argument that higher employee productivity is associated with a stronger
probability of MFIs offering deposit services. For instance, Rossel-Cambier (2012) has shown
that microinsurance has a stimulating effect on the productivity of microcredit organizations.
The author claims that a number of economies of scope related with the delivery of insurance
may contribute to a higher productivity of staff, expressed by the number of loan takers per
staff member. We also turn to the economies of scope literature to explain the possible causes
of better productivity for MFIs offering combined services: integrated client administration,
outreach or lower transaction costs (Morduch, 2004), enhanced communication channels
(Churchill, 2005). The delivery of both loans and savings may allow MFIs to reach easier
customers and strengthen client fidelity. The availability of savings may also have stimulating
indirect effects on the financial security of the clients and hence enhance productivity.
101
The literature gives as well another view on the low value of the borrowers per staff
ratio. It has been argued that the low value of this ratio implies that gains in productivity are
not proportionate with the increase in the number of loan officers, or simply that the increase
in the number of borrowers is more proportionate with the increase in the number of loan
officers (e.g. see Ayayi and Sene, 2010). This can indicate also that MFIs are heavily inclined
to grant microcredit to a large number of poor people to significantly increase the client
outreach of their actions.
When it comes to the social measurements, the results the matched sample suggest that
MFIs with deposit are reaching 22,173 more borrowers for for-profit MFIs. Similarly, with
matched sample, non-profit MFIs reach 2,454 more clients if they mobilize deposits as well,
although the results show that non-profit MFIs with deposit reach 4,573 fewer borrowers as
compared to the simple mean of the unmatched sample. These results as well come to support
the argument that savings should be encouraged as a better instrument to tailor better
microfinance services for the needs of the poor. Here again there is a convergence between
the results of the second chapter and the findings of the first chapter of this thesis.
Surprisingly, our results show that offering deposit services does not impact on the
average loan balance of MFIs as the depth of outreach does not show any statistically
significant results for the both groups.

102
Table 4. Average Treatment Effect on the Treated (ATT)
Variable
For Profit MFIs Non-Profit MFIs Unmatched Matched Unmatched Matched
Mean Std. Err. Mean Std. Err. Mean Std. Err. Mean Std. Err.
ROA -2.3 2.1 1.86 10.4 -1.0 1.6 2.08 3.38 ROE -9.0* 6.4 -2.55 18.79 5.6 11.5 8.31 10.70 Borrowers Per Loan Officer 49.6** 18.4 79.61** 31.3 -33.1 37.6 -33.89 74.36
Number of Borrowers (#) 23,334.9*** 3,978.4 22,173.1** 6,928.71 -
4,572.8* 2,677.3 2453.52* 1154.12 Average Loan Balance ($) 83.6 620.6 -913.71 2407.30 382.3 483.5 -239.48 1004.64
Note: ATT is calculated based on the matched groups which satisfy the common support condition; standard error reported in the last column for matched sample is bootstrapped standard error.
103
2.7. Conclusion
The current evolution of microfinance leads the MFIs to diversify their service portfolios in
order to better meet borrowers’ needs as well as benefit from economies of scope. This study
examines the extent to which MFIs performance is affected by combining microcredit with
savings products. A new dataset on MFIs from 19 countries in ECA was analyzed using
propensity score matching method and compared with existing literature on combined
microfinance.
Our findings suggest that the simultaneous delivery of credit and deposits can
contribute to higher productivity of microcredit organizations. The existing evidence shows
that this can be due to the economies of scope, which can be achieved in various fields when
combining credit with savings or insurance (see e.g. Rossel-Cambier, 2012). Cost-
effectiveness in loan delivery, reduced transaction costs and enhanced communication
channels can result from the spreading of fixed costs and cost complementarities when
offering multiple services.
We further find that within the unmatched sample for-profit MFIs with deposit are
reaching more borrowers. Similarly, with matched sample, non-profit MFIs reach more
clients if they mobilize deposits. Still, surprisingly, no significant empirical evidence was
found relating to relate deposit taking and the average loan balance (the depth of outreach).
Hence, one could wonder why the increased productivity and breadth of outreach do not allow
the MFIs to serve a higher number of more poor clients.
We have also looked at the variables, which could affect the MFI probability of taking
or not deposits. The results show that for the for-profit MFIs an increase in the debt to equity
ratio will increase the probability of taking deposits. The same type of relationship exists
between the total assets and deposits. Next we find that in the capital structure an increase of
the investor funding to total assets will decrease the probability for taking deposits. As for the
non-profit MFIs we find that increased administrative expense ratio decreases deposit taking
probability for MFIs. With regard to the capital structure elements, retained earnings to total
assets have a negative impact on the non-profit MFIs’ probability to take deposits. The
probability of taking deposits is harder in more rural countries and in countries with higher
credit bureau coverage. However, an increase in agriculture value added (as percentage of
GDP) is associated with higher probability of deposits mobilization within non-profit MFIs.
We acknowledge that combined microfinance may not always be a winning option.
The dark side of combining microcredit and savings consists in coping with numerous risks
ranging from management complexity, increased subsidy dependency and lack of
104
transparency to the effects of covariance risks on economic performance. Attracting deposits
requires certain conditions in order for MFIs to offer those services: enabling macro-economy
and some political stability, appropriate regulatory environment; public supervision of MFIs;
accountable ownership, effective governance, and consistently good management of its funds
(Robinson, 2001). With regard to the main reasons conditioning the non-offering of deposit
services the following cases could be brought forward: a) In some countries regulations do
not allow deposit-taking by non-bank institutions, so no MFI can collect savings and does not
(for instance, Armenia, Georgia35, Kazakhstan and Azerbaijan36); b) in other countries, some
MFIs, which are registered as deposit-taking, can collect client deposits. But often they do not
do so, because of low capacity to introduce a new product, reorganize the institution and so
on, or because of low demand for deposit products among their clients; c) the third reason is
an access (or lack of it) to funding for credit portfolio - the MFIs can decide to start collecting
deposits in order to have funds for credit operations (e.g. Kyrgyzstan)37; d) in some countries
MFIs can only be registered as deposit-taking (credit union) and no other legal form for non-
bank financial institution is allowed. In this case some institutions will be collecting deposits
while the others will not (e.g. Croatia). 38
Despite the above mentioned impediments, a vast number of empirical studies
evidence that the ability to mobilize savings can contribute both to meeting demands of the
poor and to an improved loan outreach, a reduced dependence on subsidies and a long term
sustainability of MFIs (Ledgerwood, 1999; Robinson, 2001).
Building our arguments on the above said we bring forward the claim that the recent
trend of savings mobilization plays a significant role for the enhancement of MFIs activities.
This chapter has brought forward selected associations that can help illuminate and frame
further debates, while bearing in mind that many other variables may explain MFIs financial
and social performance (for instance, the capital structure of an MFI). While empirically
demonstrating this on a given sample of MFIs we acknowledge that further research should
investigate the issue on a larger sample of institutions from different regions. Also, further
research should recognize the diversity of savings products, which can be provided and
distinguish compulsory and voluntary savings.
35http://lexbox.am/uploads/PDF/Georgia%20Laws/law_of_georgia_on_microfinance_organizations_eng.pdf 36http://www1.ifc.org/wps/wcm/connect/cbc22b004ac3652294e1b72e0921df6a/IFC_Leaflet_Seminar_final_legal.pdf?MOD=AJPERES&CACHEID=cbc22b004ac3652294e1b72e0921df6a 37http://www.bu.edu/bucflp/files/2012/01/Law-No.-124-on-Microfinance-Organizations-in-the-Kyrgyz-Republic-English.pdf 38http://www.cepor.hr/news/mikrofinanciranje/MICROFINANCE%20IN%20CROATIA%20P.%20Korynski.pdf (see page 11)
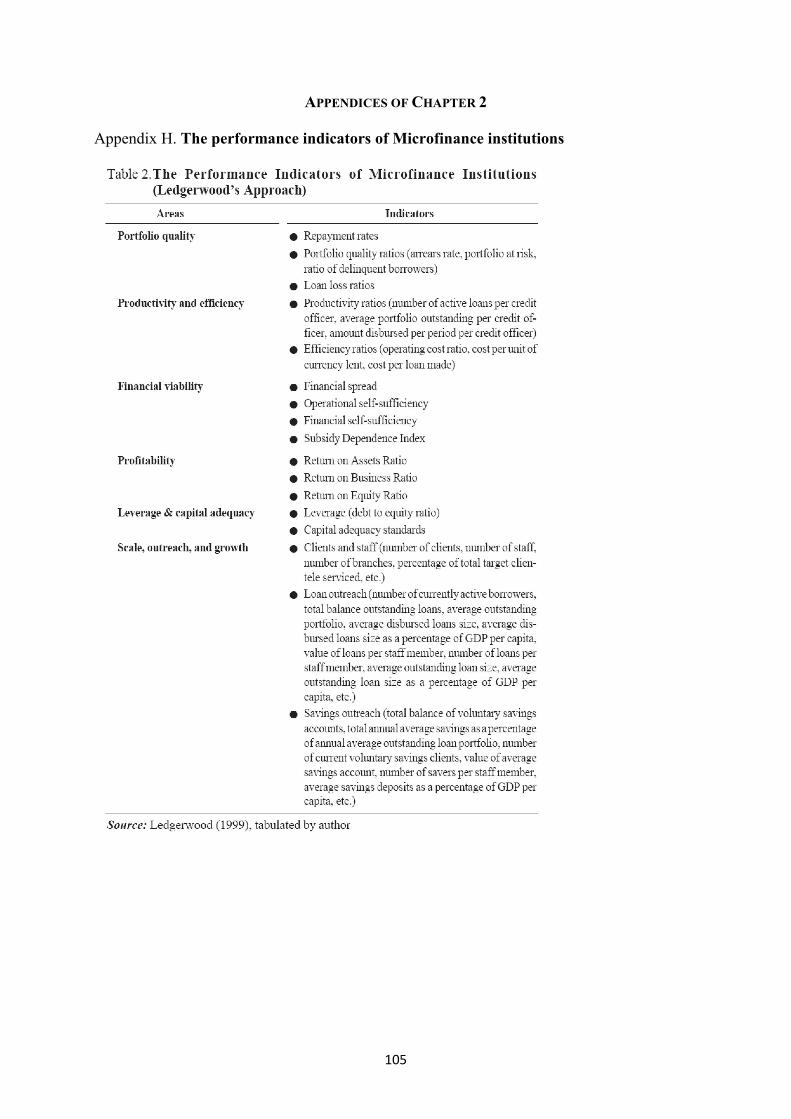
105
APPENDICES OF CHAPTER 2
Appendix H. The performance indicators of Microfinance institutions
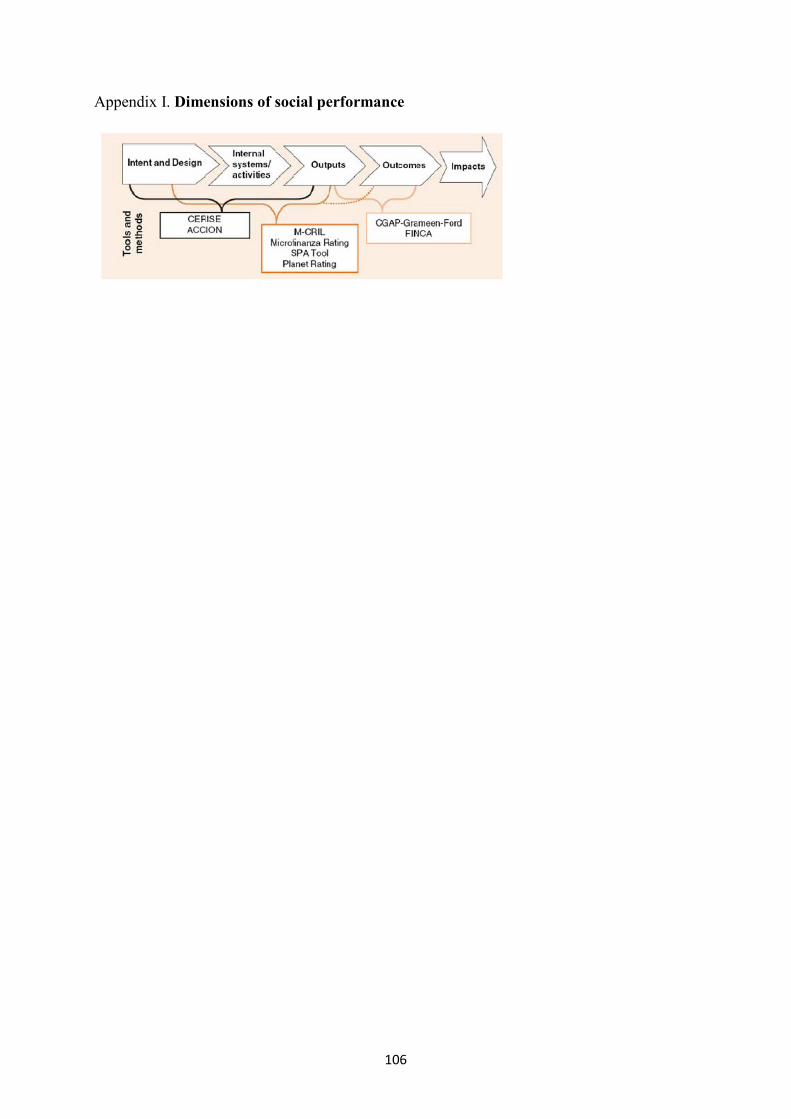
106
Appendix I. Dimensions of social performance
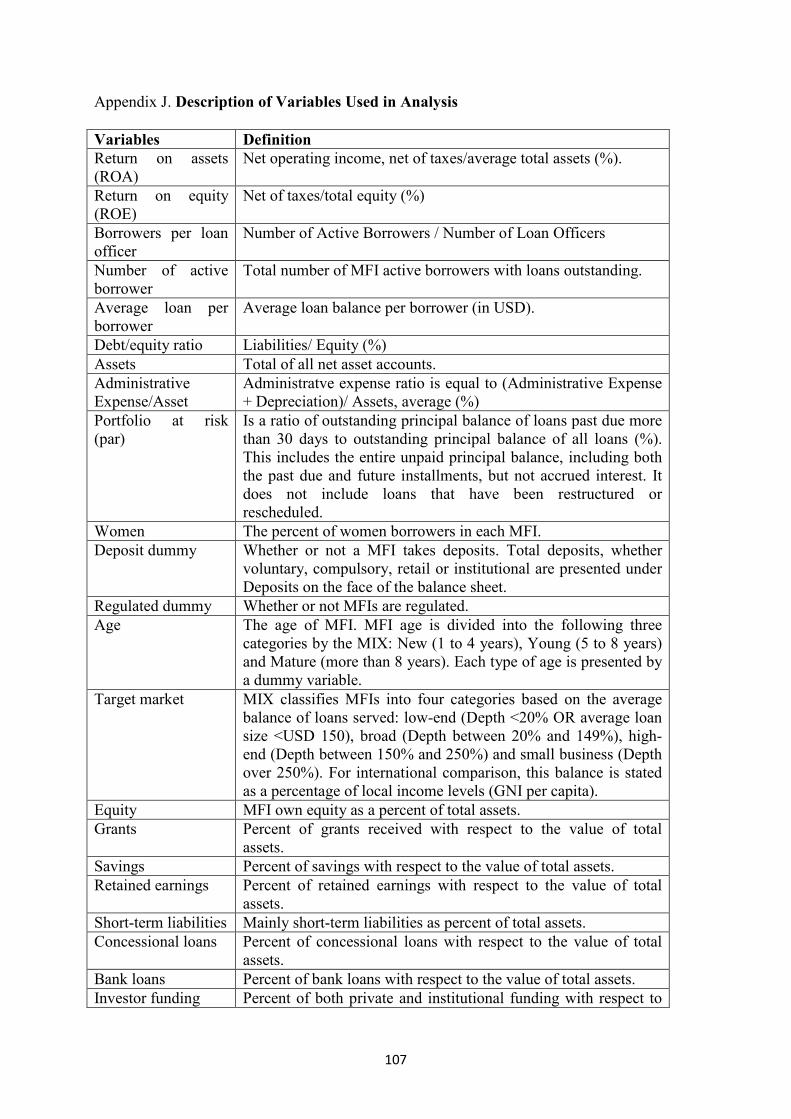
107
Appendix J. Description of Variables Used in Analysis Variables Definition
Return on assets (ROA)
Net operating income, net of taxes/average total assets (%).
Return on equity (ROE)
Net of taxes/total equity (%)
Borrowers per loan officer
Number of Active Borrowers / Number of Loan Officers
Number of active borrower
Total number of MFI active borrowers with loans outstanding.
Average loan per borrower
Average loan balance per borrower (in USD).
Debt/equity ratio Liabilities/ Equity (%) Assets Total of all net asset accounts. Administrative Expense/Asset
Administratve expense ratio is equal to (Administrative Expense + Depreciation)/ Assets, average (%)
Portfolio at risk (par)
Is a ratio of outstanding principal balance of loans past due more than 30 days to outstanding principal balance of all loans (%). This includes the entire unpaid principal balance, including both the past due and future installments, but not accrued interest. It does not include loans that have been restructured or rescheduled.
Women The percent of women borrowers in each MFI. Deposit dummy Whether or not a MFI takes deposits. Total deposits, whether
voluntary, compulsory, retail or institutional are presented under Deposits on the face of the balance sheet.
Regulated dummy Whether or not MFIs are regulated. Age The age of MFI. MFI age is divided into the following three
categories by the MIX: New (1 to 4 years), Young (5 to 8 years) and Mature (more than 8 years). Each type of age is presented by a dummy variable.
Target market
MIX classifies MFIs into four categories based on the average balance of loans served: low-end (Depth <20% OR average loan size <USD 150), broad (Depth between 20% and 149%), high-end (Depth between 150% and 250%) and small business (Depth over 250%). For international comparison, this balance is stated as a percentage of local income levels (GNI per capita).
Equity MFI own equity as a percent of total assets. Grants Percent of grants received with respect to the value of total
assets. Savings Percent of savings with respect to the value of total assets. Retained earnings Percent of retained earnings with respect to the value of total
assets. Short-term liabilities Mainly short-term liabilities as percent of total assets. Concessional loans Percent of concessional loans with respect to the value of total
assets. Bank loans Percent of bank loans with respect to the value of total assets. Investor funding Percent of both private and institutional funding with respect to

108
the value of total assets. MFI dummy Is the dummy of 137 MFIs included into the PSM. Country dummy Is the dummy of 19 countries within the ECA region: Albania,
Armenia, Azerbaijan, Bosnia and Herzegovina, Bulgaria, Croatia, Georgia, Hungary, Kazakhstan, Kosovo, Kyrgyzstan, Macedonia, Moldova, Mongolia, Montenegro, Poland, Romania, Russia, Serbia, Slovakia, Tajikistan, Turkey, Ukraine and Uzbekistan. It includes dummies for each of these countries.
Rural population (rur)
Rural population as percentage of total population in the country in which the MFI is located (%).
Agriculture value added of GDP (agri)
The level of agricultural production as a fraction of the total value added in the region’s economy (total value added is equivalent to regional gross domestic product less net taxes) (%).
Private credit bureau coverage (pcb)
Private credit bureau coverage as percentage of adults (%).
GDP growth (gdpgrowth)
The growth rate of GDP for the country in which the MFI is located (%).
109
CHAPTER 3. PERFORMANCE AND CAPITAL STRUCTURE OF MICROFINANCE
INSTITUTIONS IN EASTERN EUROPE AND CENTRAL ASIA
Previous chapters have demonstrated that recent trends in microfinance, such as
commercialization and deposit mobilization, open an interesting avenues first, for
investigating theoretically the role of MFI enlarged service portfolios (for instance, credit
combined with savings) in the dynamic incentive mechanism addressed to information
asymmetries; and second, for demonstrating empirically the extent to which the combined
microfinance services affect MFI financial and social performance.
These trends bring attention also to the link between sources of funds and MFI
performance. Microfinance industry growth and maturity is associated with increased needs
for funds. In this light, MFIs ability to attract and use large amounts of external capital,
maintain sustainable operations without eroding their original focus on outreach is critical to
the future growth and success of the industry. Thus, in this chapter we claim that it is
important to understand how observed changes in MFIs capital structure are likely to affect
the ability of MFIs to achieve their double bottom-line of outreach and sustainability.
3.1. Introduction
Microfinance or the provision of financial services to clients outside the mainstream financial
system has become visible in the past few decades and has been praised for its potential to be
a profitable instrument for economic development. Microfinance Institutions (MFIs) have
widened their product range from mainly loans, to savings products, insurance and other
financial services. During the period of this study, 10 000 microfinance programs operated
worldwide reaching well over 100 million clients (Cull, Demirgüç-Kunt and Morduch, 2009).
Industry growth and maturity is associated with increased needs for funds. In this light, MFIs
ability to attract and use large amounts of external capital, maintain sustainable operations
without eroding their original focus on outreach is critical to the future growth and success of
the microfinance industry. Thus, it is important to understand how observed changes in MFIs
capital structure are likely to affect the ability of MFIs to achieve their double bottom-line of
outreach and sustainability.
Recent trends in microfinance have included commercialization and deposit
mobilization. The first trend is about transforming NGO-MFIs into regulated institutions
aiming at strengthening the organizations by attracting private investors. The second trend is
toward MFIs expansion into savings to reach more poor clients as well as to lower costs by
110
attracting presumably cheaper deposits. These trends affect the capital structure of the
organization but little is known on how such changes would affect all aspects of MFIs
performance. We fill in a gap in the literature by studying the simultaneous effect of capital
structure on sustainability and on two dimensions of outreach of MFIs in Central and Eastern
Europe and Central Asia (ECA) during the period 2005-2009.
Commercialization led to opening up MFIs to application of market-based principles
and to moving from donor-dependant and subsidized operations to commercial debt financing
(Christen and Drake, 2002: 4). Consequently, the microfinance sector has become
considerably heterogeneous not only in terms of ownership structure (NGOs, NBFIs, credit
unions, microfinance banks) but also in terms of institution size and targeted clientele. MFI
also have numerous stakeholders providing capital such as institutional investors (e.g.
Microfinance Investment Funds), development agencies, individuals, foundations, NGOs,
banks, international organizations, states as well as the newest group of depositors. All these
groups are likely to have differential impact on the different dimensions of MFI performance.
To our knowledge, few studies have estimated the impact of MFIs capital structure on
their social and financial dimensions. Empirical studies linking capital inputs to MFIs
performance include production or cost function estimation (Cull et al., 2007, Hartarska
2005). Kyereboah-Coleman (2007) used panel data to estimate the impact of capital structure
on MFIs performance within the sub-Saharan region. The present study is the closest to
Bogan (2011) who estimates the effects of capital structure on operational and financial self-
sufficiency of worldwide sample of MFIs. The author uses an instrumental variable (IV)
approach to address the possibility that grants may be endogenous.
In all previous work we are aware of, the effect of capital structure on outreach is
estimated independently of that on self-sufficiency. However, the empirical literature provides
evidence for a trade-off between the outreach and the sustainability dimensions of MFIs’
performance, suggesting that financial success may come at the expense of serving fewer and
less poor clients (Cull et al. 2007 & 2009, Hermes, Lensink and Meesters, 2011). The links
between different dimensions of performance suggest an entirely different empirical approach
to capture this dependence.
The contribution of this chapter of the thesis is to estimate the marginal impact of
various sources of capital on three dimensions of performance by employing the Seemingly
Unrelated Regression (SUR). As in the previous chapter, we use new data from MFIs
operating in 24 countries of the ECA region obtained from a grass-root network Microfinance

111
Centre for Central & Eastern Europe and the New Independent States and covering the five-
year period between 2005 and 2009.
We believe that understanding these linkages can make MFI evaluation more accurate
and, further, can help position microfinance in the broader picture of economic development.
This study contributes to literature on opportunities for increasing the sustainability and
growth of MFIs considering their financing sources. It also contributes to the ongoing debate
on whether outreach and sustainability are substitutes or complements in a particular region
(Morduch, 2000; Navajas et al., 2000).
The rest of the chapter is organized as follows. We describe the existing literature that
motivates this work in Part 2. We present the econometric model and measurements deployed
to estimate how the capital structure elements affect the MFI performance in Part 3. The
dataset is discussed in Part 4. The results of the econometric study and robustness checks are
presented in Part 5. Conclusions and directions for future research are contained in Part 6.
3.2. Theoretical considerations: Capital structure theories and MFI performance
In order to relate capital structure and managerial theories to microfinance we first, review
theories of capital structure, such as trade off, agency and pecking order theories, and
afterwards look at managerial theories, such as profit-incentive theory.
3.2.1. The literature on capital structure
The link between firm value and capital structure has attracted the attention of both academics
and practitioners for many decades. The literature provides diverse views on the role of
capital structure in firm performance. The capital structure of a firm covers a mix of debt and
equity, which a firm considers as appropriate to enhance its operations. It is defined as total
debt divided on total assets at book value, which impacts on both the profitability and
riskiness of a firm (Bos and Fetherston, 1993).
With the seminal paper by Modigliani and Miller (1958) a series of debates have lead
the direction of theoretical underpinnings of this crucial concept. The optimal capital structure
of a firm boils down to its choice between debt and equity. Modigliani and Miller (1958) were
among the pioneers to deal with irrelevance of debt in capital structure for determining firm
value. The study included a number of assumptions, one of which was the absence of
corporate tax. Later the authors factored corporate tax in their model, and found that
theoretically the value of a firm should increase with debt because of higher interest tax
shield. Their model shows that monotonic increase of debt for higher tax shield increases
112
bankruptcy cost, especially when profitability of the firm is low and fluctuating. This leads to
‘trade off’ theory of capital structure. The theory suggest an optimum debt level, where the
marginal increase of present value of tax saving is just offset by the same amount of
bankruptcy cost.
When referring to microfinance, the trade-off theory postulated that there is a limit to
debt financing and the target debt may vary from MFI to MFI depending on profitability,
among other factors. This allows to say that profitable MFIs, which have lot of tangible asset
that can be offered as collateral for debt, may have a higher target debt ratio.
The alternative theory of capital structure is known as ‘pecking order’ theory, the
origin of which is asymmetric information where managers know more about a firm’s
prospect than the outside investors. According to Myers (1984) the theory is based on the
premise that successful firms (zero’ debt firms) with high and consistent profitability rarely
use debt financing. The theory states that if the firm issues equity shares to finance a project it
has to issue shares at less than the prevailing market price. This signals that the shares are
overvalued and the management is not confident to serve the debt if the project is financed by
debt. This means that issuing shares is ‘bad’ news. On the other hand, the use of external
borrowing in financing the project signals that the management is confident of the future
prospect of serving debt. The theory suggest that in avoiding controversy the management
may wish to finance project by internal fund generation, such as by retained earnings. Hence,
the financing order goes in this way, first-retained earnings, then-debt and finally, equity
when debt capacity gets exhausted, and explains why profitable firms use less debt.
The other theory of capital structure lies in the agency cost theory, which is built on
the idea that the interests of the firm’s managers and its shareholders are not perfectly aligned.
The importance of the agency costs of equity in corporate finance arises from the separation
of ownership and control of firms whereby managers tend to maximize their own utility rather
than the value of the firm (Jensen and Meckling, 1976). Agency costs can also result from
conflicts between debt and equity investors when there is a risk of default. The literature
provided different solutions to address this issue. For instance, a higher level of leverage may
be used as a disciplinary device to reduce managers’ salaries, reputation, perquisites through
the threat of liquidation (Grossman and Hart, 1982; Williams, 1987) or through pressure to
generate cash flow to pay interest expenses (Jensen, 1986). In these situations, debt will have
a positive effect on the value of the firm and profitability.
More recent research by Berger and Bonaccorsi di Patti (2006) show that high
leverage or low equity/asset ratio reduces agency cost of outside equity, thus increasing firm
113
value by compelling managers to act more in the interest of shareholders. Accordingly, capital
structure is believed to have an impact on a firm performance.
Furthermore, various studies evaluating what factors affect the capital structure of
firms in different businesses demonstrate that industrial or sectorial classification is an
important determinant of capital structure. This allows to argue that firms in different sectors
employ different mix of debt and equity for their operations.39
Bogan (2011) and Kyereboah-Coleman (2007) empirically demonstrate the
implications of the microfinance firm’s capital structure for its operations and impacts on its
performance. Bogan (2011) explores how changes in capital structure could improve the MFIs
efficiency and financial sustainability by looking at the existing sources of funding for MFIs
by geographic region. To investigate the optimal capital structure for MFIs, the author utilizes
panel data on MFIs in Africa, East Asia, Eastern Europe, Latin America, the Middle East and
South Asia for the years 2003 and 2006 collected from individual institutions as reported to
MIX Market. The author argues that the life cycle theory is the most popular explanation of
the link between capital structure, sustainability, efficiency, and outreach. However, the study
shows that various factors other than life cycle stage seem to be associated with MFI
performance. This is why the author turns also to the profit–incentive theory in her paper.
Using an IV analysis Bogan (2011) finds evidence supporting the assertion that increased use
of grants, rather than own capital by large MFIs decreases operational self-sufficiency in
larger firms. This allows the author to argue that the long-term use of grants may be related to
inefficient operations due to lack of competitive pressures associated with attracting market
funding.
Another empirical study on the linkage between the capital structure and MFI
sustainability is Kyereboah-Coleman (2007) who investigates the impact of capital structure
on MFIs performance within the sub-Saharan region. The study uses panel data from Ghana
on 52 microfinance institutions covering the ten-year period 1995-2004. It shows that most of
the MFIs, which have been operating for about 18 years have about 70 percent of their assets
in current form, employ high leverage and finance their operations with long-term debt. The
author uses panel data regressions to demonstrate that highly leveraged MFIs perform better
by reaching out to more clientele and enjoy scale economies, which enables them to better
deal with moral hazard and adverse selection and enhances their ability to deal with risk.
39 For instance, Abor (2005) studied the capital structure and profitability of SMEs in Ghana by showing that short-term debt ratio is positively correlated with return on equity. Similarly, Bonaccorsi di Patti (2006) using data on commercial banks in the USA shows that higher leverage or lower equity capital ratio is related to higher profit efficiency.

114
3.2.2 Aspects of MFI performance
In pursuing its mission and achieving its self-sustainability a MFI is expected to be financially
viable, which refers to the ability of a microfinance institution to cover its costs with earned
revenue. In this vein, Ledgerwood (1999) points out that profitability and efficiency are key
factors shaping the MFI financial viability. Yaron (1992) defines financial performance as the
extent to which the full cost of providing services is directly paid for by service users.
Therefore, one important aspect of performance is MFIs financial viability.
MFIs are a specific group of non-profit and for-profit firms, which cannot fully benefit
from market discipline. Labor markets for MFIs’ managers are weak, and many MFIs do not
face competition. MFIs do not have typical shareholders and the internal governance is also
relatively week. MFIs typically do not offer high-powered incentives to their managers, and
such incentives are not appropriate organizations pursuing multiple objectives (Hartarska,
2005). Furthermore, in MFIs the supervisory boards consist of uncompensated members,
whose reputational concerns serve to align their interests with those of stakeholders (Handy,
1995).
MFIs are also very heterogeneous, can be of organized as several legal forms and may
vary in their pursuit of outreach and profitability. Though raising capital is a critical issue for
MFIs, regardless of whether they operate as NGOs or for-profit banks, specific outreach and
sustainability goals may be relatively easy to meet in one market and impossible to meet in
another. For instance, literature unveils a legitimate concern that board members of NGOs
may not perform their duties well given that either they have the wrong reasons to participate
or they are not sufficiently diligent (Bowen, 1994). The tension between seeking higher
profits to satisfy capital markets and the desire for social impact should be dealt with by
MFIs’ managers who should understand the tradeoffs and effectively balance social and
financial performance. In absence of a well-defined plan for pursuing the double bottom-line
objectives, many MFIs managers tend naturally to shift toward financial performance
(Mersland, 2011). Therefore, donors’ evaluation of MFI performance should capture the
institutional environment, firm specific factors as well as individual contributions of the
manager or the board.
As many MFIs operate as NGOs, or a type of non-profit organizations they must rely
on both diversified activities and fund providers to support their mission-related work.

115
Revenue generation strategies can go from traditional fundraising, which implies attracting
charitable donations from individuals and corporations for socially valued programs or the
pursuit of grants from development agencies and government sources to a more commercial
approach, which involves commercial activities.
Consistent with resource dependence theory, MFIs as a type of non-profits, can be
viewed as seeking sustainability and developing alternative sources of capital by engaging in
commercial activity. The resource dependence theory states that “the key to organizational
survival is the ability to acquire and maintain resources” (Pfeffer and Salancik, 1978: 2). A
problem arises to environmental conditions of scarcity and uncertainty of resources. Katz and
Kahn (1966) paper argues that acquiring and maintaining adequate resources requires an
organization to interact with individuals and groups that control resources. Different type
resources providers, in general, differ in their requirements and views of effectiveness,
creating a need for the nonprofit to cope with and address these issues.
Traditionally, MFIs based their activities on and were mainly sustained by various
types of implicit or explicit subsidies. In the literature subsidy dependence is viewed as the
inverse of self-sustainability, which can be achieved when the return on equity, net of any
subsidy received, equals or exceeds the opportunity cost of the equity funds (Yaron, 1992).
Such sustainability can be attained basically through fulfillment of the following conditions:
ensuring loan repayments on time, earning enough interest revenue and controlling costs to
guarantee efficient use of resources (Crombrugghe, Tenikue and Sureda, 2008). Standard
indicators of these three components of operational performance used in the literature are
portfolio-at-risk (PAR), operational self-sufficiency (OSS) and cost per borrower
(Armendariz and Morduch, 2005). According to Rosenberg (2009) the portfolio quality (loan
repayment) is an important indicator of the MFIs’ performance, because high delinquency
makes financial sustainability less attainable. The standard measure of loan delinquency is
portfolio at risk beyond 30 days. Common profitability measures include the return on assets
(ROA) and return on equity (ROE) indicators.
Ayayi and Sene (2010) also investigate the most relevant factors that promote
financial self-sufficiency of MFIs: a high quality credit portfolio, adequate interest rates, and
effective management. The authors agree with the belief that financial sustainability is crucial
under the conditions of shrinking and inconsistent donor aid, while the client outreach and the
age of MFIs affect it marginally. The main findings state that the portfolio quality as a result
of solid credit risk management is the determining factor of financial sustainability. The
authors emphasize that in achieving and maintaining financial sustainability the application of
116
adequately high interest rates, as a main source of profit, in combination with quality
management ensuring adequate cost control and information systems, and effective banking
practices, are required.
The twin criteria – sustainability and outreach- have been the yardstick of MFIs
performance evaluation. Until recently, however, the social dimension of MFIs performance
has been neglected partly because researching and reporting on social performance requires
very complex and careful research by specialists and involves substantial resources and time.
Recent initiatives (CERISE, Imp-Act Consortium, CGAP)40 attempting to integrate the
assessment of social performance into regular management systems and day-to-day operations
of MFIs served as a breakthrough in academic research on MFIs social performance in the last
few years.
Social performance of MFIs is the “effective translation of an institution's social goals
into practice in line with accepted social values” (Sinha, 2006: 5). Social performance is
measured by hybrid index comprising three sets of widely used indicators: the number of
people using services in a given period including borrowers, depositors, clients receiving
other financial services, and the number of borrowers' accounts; their social (including
poverty) status at the beginning of the period, which is usually defined by a rough proxy of
the average outstanding balance as a percentage of per capita GNI (depth of outreach); and net
benefit to each (including indirect benefits to other household and even non-household
members during the period (quality of outreach or impact).
Outreach indicators are considered as proxies for MFIs social performance and
impacts on economic development (Schreiner 2001). More precisely, scholars argue that even
though outreach indicators do not provide a full assessment of a MFI impact on economic
development, they serve as quantifiable proxies of the extent to which the institution has
reached its objectives of providing social benefits for poor people.
3.2.3. Evolution and types of MFI financing
The literature also provides theoretical and empirical underpinnings on the evolution of
microfinance financing sources and performance measurements.
Financial theory suggests that a major factor in firms’ choice of capital structure is the
reduction of the cost of contracting between firms and their capital providers. The same
40 MFIs have created a special network called the Social Performance Task Force with the intent to coordinate different initiatives and set up a common reporting format.
117
literature highlights a series of firm specific dimensions, such as credit quality, portfolio of
growth opportunities, the profitability of the project, the ability to fund the project through
retained earnings, the liquidation value of the assets, the perceived accuracy of financial
information, the firm’s size and age, and the level of banking competition- determining the
optimal mix of long and short-term debt. Furthermore, in addition to firm specific factors, the
institutional environment (e.g. legal and financial) also plays a significant role in the firm’s
decision of raising a capital.
Myers’ (1977) shows that just as workers possess firm-specific capital, firms’
owner/managers possess future investment opportunities. On the case of emerging market
private equity funds, Leeds and Sunderland (2003) highlight that value created by
management is the most important part of their business.
In general, firms opting for long-term debt chose this means mainly for protecting
themselves from liquidation by imperfectly informed creditors. Whereas, short-term debt
allows to increase efficiency by allowing uneconomic projects to be terminated and gives
manager/owners strong incentives to avoid unexpected default results.
Fehr and Hishigsuren (2006) stress as well that over the progression from start-up
phase through stages of operational self-sufficiency and financial self-sufficiency, the MFI
mangers begin to learn that good governance and management performance are important
prerequisites for ongoing access to the capital market. Table 5 provides detailed elements of
the four primary funding sources by qualitatively summarizing how each source can affect
MFI performance.
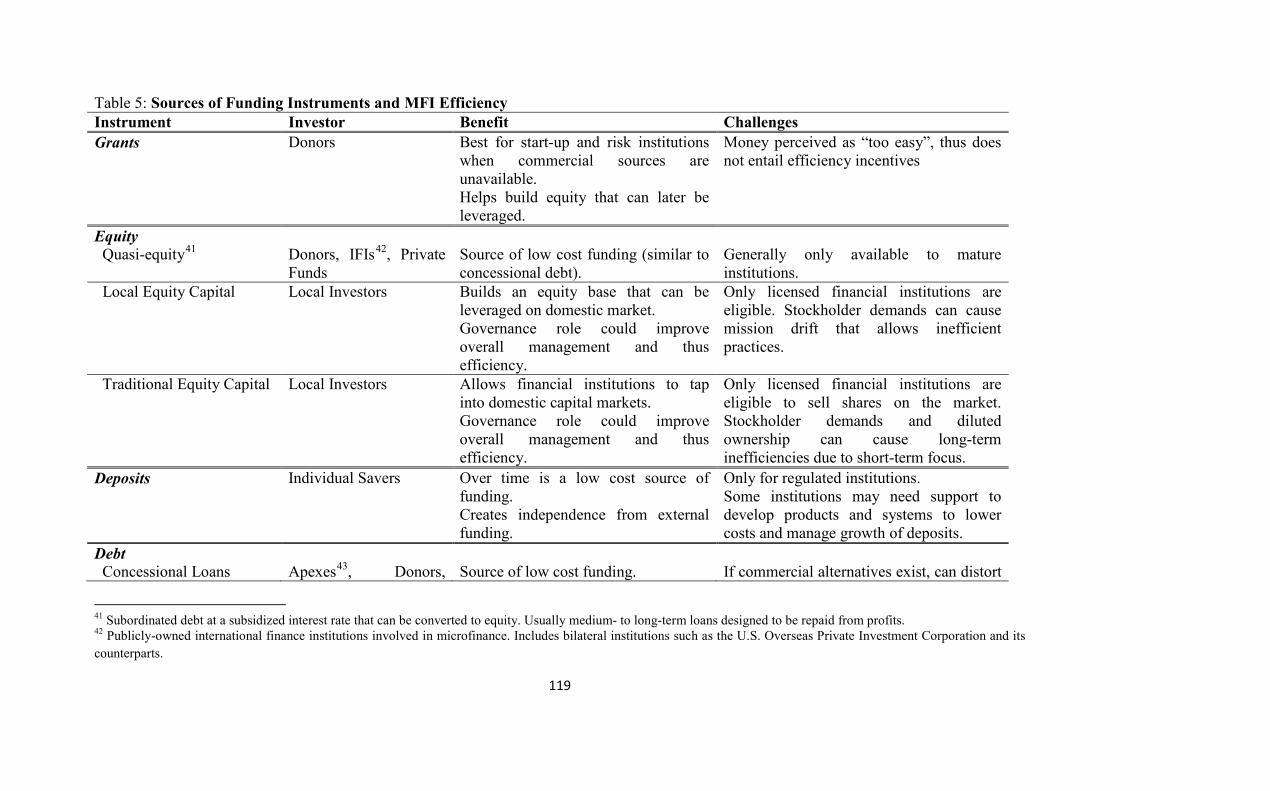
119
Table 5: Sources of Funding Instruments and MFI Efficiency
Instrument Investor Benefit Challenges
Grants Donors Best for start-up and risk institutions when commercial sources are unavailable. Helps build equity that can later be leveraged.
Money perceived as “too easy”, thus does not entail efficiency incentives
Equity Quasi-equity41 Donors, IFIs42, Private
Funds Source of low cost funding (similar to concessional debt).
Generally only available to mature institutions.
Local Equity Capital
Local Investors Builds an equity base that can be leveraged on domestic market. Governance role could improve overall management and thus efficiency.
Only licensed financial institutions are eligible. Stockholder demands can cause mission drift that allows inefficient practices.
Traditional Equity Capital
Local Investors Allows financial institutions to tap into domestic capital markets. Governance role could improve overall management and thus efficiency.
Only licensed financial institutions are eligible to sell shares on the market. Stockholder demands and diluted ownership can cause long-term inefficiencies due to short-term focus.
Deposits
Individual Savers Over time is a low cost source of funding. Creates independence from external funding.
Only for regulated institutions. Some institutions may need support to develop products and systems to lower costs and manage growth of deposits.
Debt Concessional Loans Apexes43, Donors, Source of low cost funding. If commercial alternatives exist, can distort
41 Subordinated debt at a subsidized interest rate that can be converted to equity. Usually medium- to long-term loans designed to be repaid from profits. 42 Publicly-owned international finance institutions involved in microfinance. Includes bilateral institutions such as the U.S. Overseas Private Investment Corporation and its counterparts.
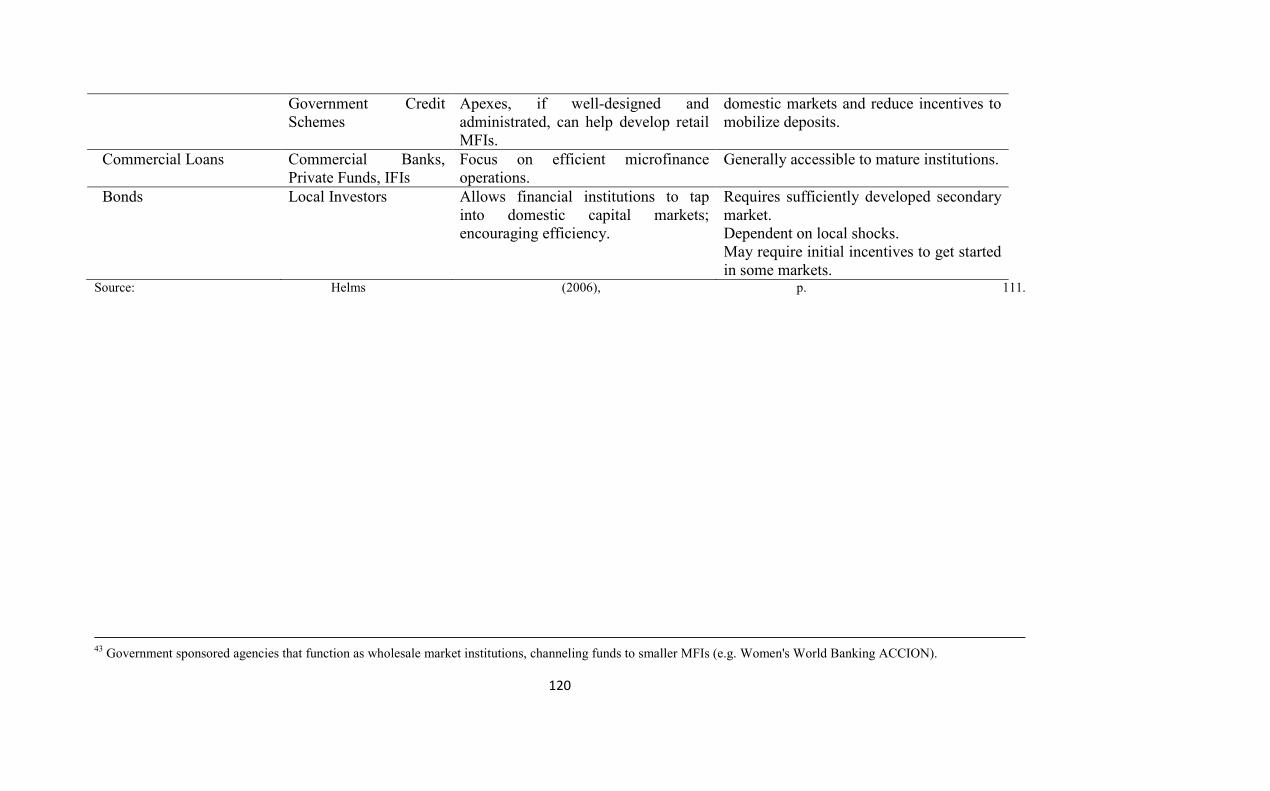
120
Government Credit Schemes
Apexes, if well-designed and administrated, can help develop retail MFIs.
domestic markets and reduce incentives to mobilize deposits.
Commercial Loans Commercial Banks, Private Funds, IFIs
Focus on efficient microfinance operations.
Generally accessible to mature institutions.
Bonds Local Investors Allows financial institutions to tap into domestic capital markets; encouraging efficiency.
Requires sufficiently developed secondary market. Dependent on local shocks. May require initial incentives to get started in some markets.
Source: Helms (2006), p. 111.
43 Government sponsored agencies that function as wholesale market institutions, channeling funds to smaller MFIs (e.g. Women's World Banking ACCION).
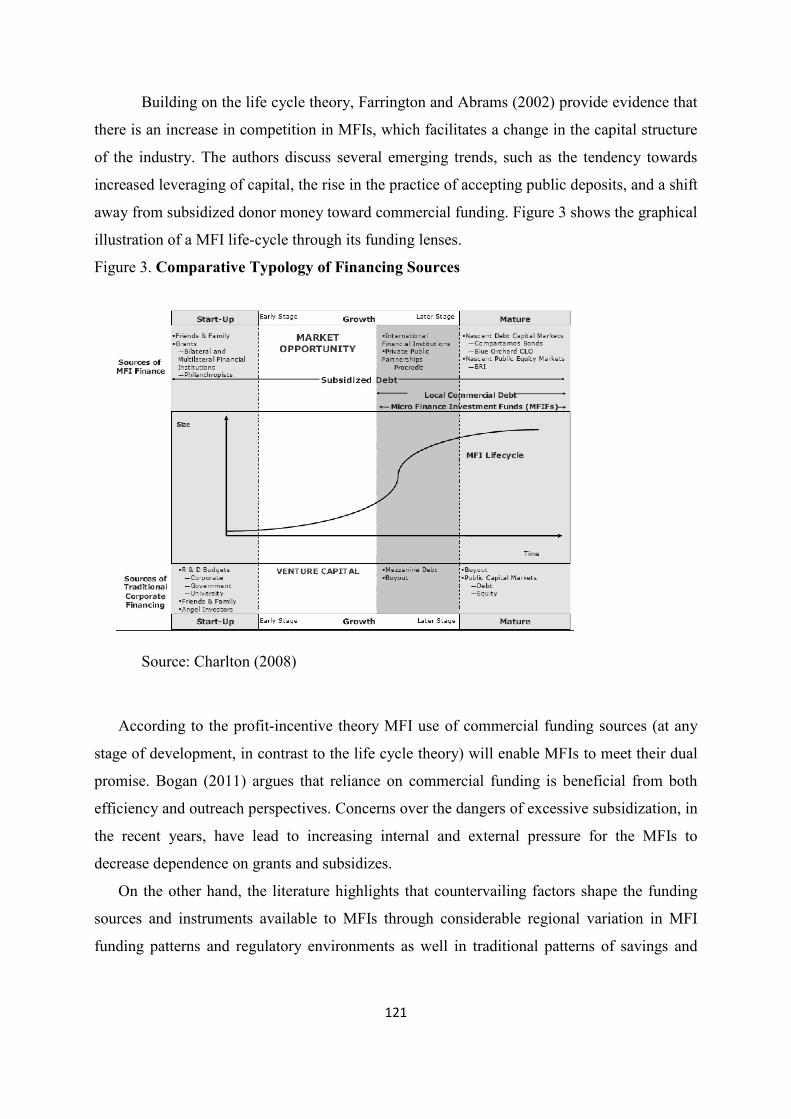
121
Building on the life cycle theory, Farrington and Abrams (2002) provide evidence that
there is an increase in competition in MFIs, which facilitates a change in the capital structure
of the industry. The authors discuss several emerging trends, such as the tendency towards
increased leveraging of capital, the rise in the practice of accepting public deposits, and a shift
away from subsidized donor money toward commercial funding. Figure 3 shows the graphical
illustration of a MFI life-cycle through its funding lenses.
Figure 3. Comparative Typology of Financing Sources
Source: Charlton (2008)
According to the profit-incentive theory MFI use of commercial funding sources (at any
stage of development, in contrast to the life cycle theory) will enable MFIs to meet their dual
promise. Bogan (2011) argues that reliance on commercial funding is beneficial from both
efficiency and outreach perspectives. Concerns over the dangers of excessive subsidization, in
the recent years, have lead to increasing internal and external pressure for the MFIs to
decrease dependence on grants and subsidizes.
On the other hand, the literature highlights that countervailing factors shape the funding
sources and instruments available to MFIs through considerable regional variation in MFI
funding patterns and regulatory environments as well in traditional patterns of savings and
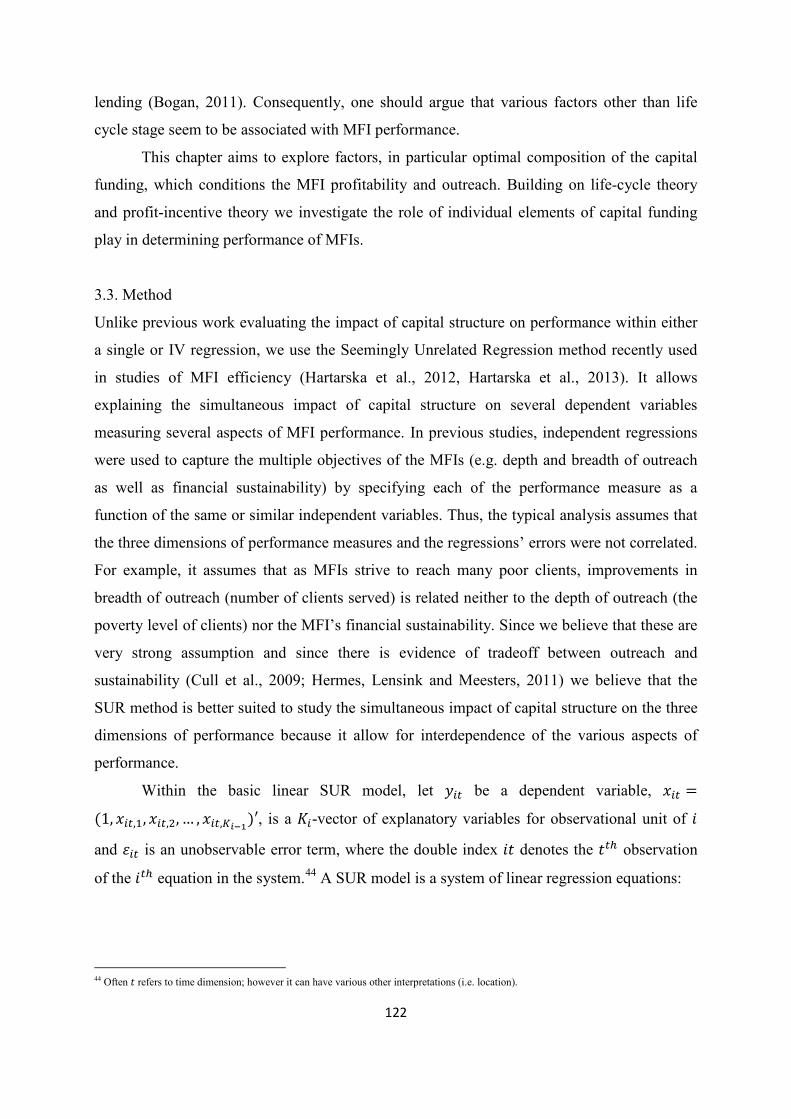
122
lending (Bogan, 2011). Consequently, one should argue that various factors other than life
cycle stage seem to be associated with MFI performance.
This chapter aims to explore factors, in particular optimal composition of the capital
funding, which conditions the MFI profitability and outreach. Building on life-cycle theory
and profit-incentive theory we investigate the role of individual elements of capital funding
play in determining performance of MFIs.
3.3. Method
Unlike previous work evaluating the impact of capital structure on performance within either
a single or IV regression, we use the Seemingly Unrelated Regression method recently used
in studies of MFI efficiency (Hartarska et al., 2012, Hartarska et al., 2013). It allows
explaining the simultaneous impact of capital structure on several dependent variables
measuring several aspects of MFI performance. In previous studies, independent regressions
were used to capture the multiple objectives of the MFIs (e.g. depth and breadth of outreach
as well as financial sustainability) by specifying each of the performance measure as a
function of the same or similar independent variables. Thus, the typical analysis assumes that
the three dimensions of performance measures and the regressions’ errors were not correlated.
For example, it assumes that as MFIs strive to reach many poor clients, improvements in
breadth of outreach (number of clients served) is related neither to the depth of outreach (the
poverty level of clients) nor the MFI’s financial sustainability. Since we believe that these are
very strong assumption and since there is evidence of tradeoff between outreach and
sustainability (Cull et al., 2009; Hermes, Lensink and Meesters, 2011) we believe that the
SUR method is better suited to study the simultaneous impact of capital structure on the three
dimensions of performance because it allow for interdependence of the various aspects of
performance.
Within the basic linear SUR model, let ��� be a dependent variable, ��� =
(1, ���,1, ���,2, … , ���,��−1)′, is a ��-vector of explanatory variables for observational unit of � and ��� is an unobservable error term, where the double index �� denotes the ��ℎ observation
of the ��ℎ equation in the system.44 A SUR model is a system of linear regression equations:
44 Often � refers to time dimension; however it can have various other interpretations (i.e. location).
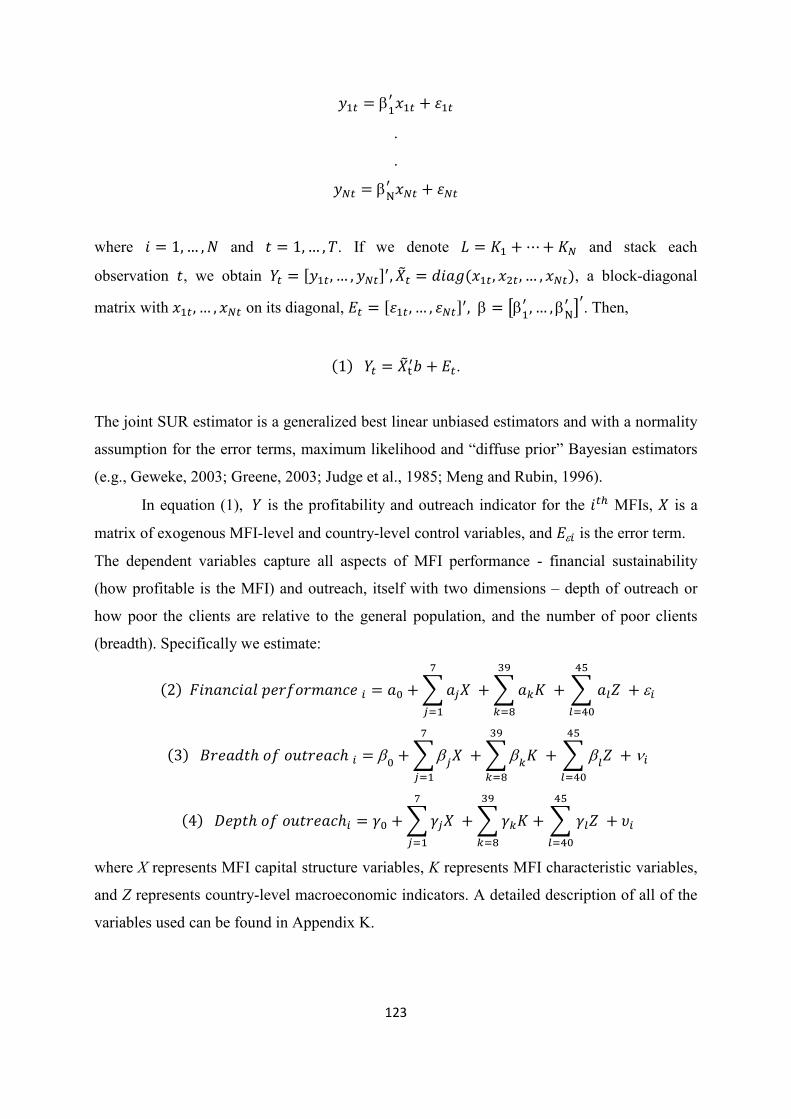
123
�1� = β1′ �1� + �1� .
. ��� = βN′ ��� + ���
where � = 1, … ,� and � = 1, … ,�. If we denote � = �1 + ⋯+ �� and stack each
observation �, we obtain �� = [�1�, … ,���]′,��� = ����(�1�, �2�, … , ���), a block-diagonal
matrix with �1�, … , ��� on its diagonal, �� = [�1�, … , ���]′, β = �β1′ , … , βN′ �′. Then,
(1) �� = ��t′� + ��.
The joint SUR estimator is a generalized best linear unbiased estimators and with a normality
assumption for the error terms, maximum likelihood and “diffuse prior” Bayesian estimators
(e.g., Geweke, 2003; Greene, 2003; Judge et al., 1985; Meng and Rubin, 1996).
In equation (1), � is the profitability and outreach indicator for the ��ℎ MFIs, � is a
matrix of exogenous MFI-level and country-level control variables, and �ε� is the error term.
The dependent variables capture all aspects of MFI performance - financial sustainability
(how profitable is the MFI) and outreach, itself with two dimensions – depth of outreach or
how poor the clients are relative to the general population, and the number of poor clients
(breadth). Specifically we estimate:
(2) ��������� ����������� � = �0 + ����
7�=1 + ����
39�=8 + � ���
45�=40 + ε�
(3) ������ℎ �� �������ℎ � = β0 + �β��
7�=1 + � �
39�=8 + � �
45�=40 + ν�
(4) ����ℎ �� �������ℎ� = �0 + ����
7�=1 + ����39
�=8 + � ���
45�=40 + ��
where X represents MFI capital structure variables, K represents MFI characteristic variables,
and Z represents country-level macroeconomic indicators. A detailed description of all of the
variables used can be found in Appendix K.
124
Financial performance is measured by the return-on-assets ratio (ROA).45 Earlier
studies used operational self-sufficiency to measure sustainability of the lending operations,
because microfinance was funded by subsidized loans, grants provided by donors (some with
special conditions) and funds by (private) charities.46 The gradual move towards the use of
commercial funding shifted the interests towards MFIs returns-on-assets, because it provides
a broader perspective compared to the alternative indicators as it transcends the core activity
of MFIs - providing loans and savings and tracks income from all operating activities.
In practice, microfinance often entails distinct trade-offs between maximizing
financial performance and meeting social goals. Several studies confirm the existence of the
“mission drift” (Cull et al., 2007; Augsburg and Fouillet, 2010; Nawaz, 2010), while others
suggest that financial sustainability and social outreach complement and reinforce each other
(Gonzalez and Rosenberg, 2006; Schicks, 2007; Armendáriz and Szafarz, 2011). Therefore,
our method permits to study the impact of capital structure on that aspect of MFI
performance.
First, we account for the breadth of outreach, or how many clients (borrowers) the
MFIs reach. We use the natural logarithm of the total number of active borrowers (lnab) as
the second dependent variable. 47 Next, we account for the poverty level of clients, and we use
a measure the depth of outreach. It shows whether a MFI addresses the needs of the poorest or
targets better-off clients (see Quayes, 2012). Depth of outreach can be measured by the
average loan balance48 (alb) with higher values of alb indicating less depth of outreach, since
the MFI is expected to provide fewer loans to poor borrowers. We use the ratio of the total
average loan balance per borrower to the gross notational income (GNI) per capita (abb).
Adjusting the average loan size by GNI per capita normalizes the variable for different
income levels found in different countries, thereby controlling for cross-country differences. 45 ROA reflects the organization’s ability to deploy its assets profitably; it excludes non-operating income and donation. In other words, ROA tell us how effectively an MFI is generating general ledger earnings on its base of assets. 46 Operational self-sufficiency is a ratio indicating whether or not enough revenue has been earned to cover the MFI’s total costs – operational expenses, loan loss provisions and financial costs. 47 Using natural logarithms leads to coefficients with appealing interpretations. When � > 0, models using log(�) as the dependent variable often satisfy the classical linear model (CLM) assumptions more closely than models using the level of �. Strictly positive variables often have conditional distributions that are heteroskedastic or skewed; taking the log can mitigate or eliminate both problems. Moreover, taking logs usually narrows the range of the variable and makes estimates less sensitive to outlying observations on the dependent or independent variables. Finally, one of the standard rules of thumb for taking logs is for variables such as population, total number of employees, a positive dollar amount (Wooldridge, 2009: 191). Given that our dependent variable - the number of MFI active borrowers - does not take zero or negative values there is not any limitation of the log. 48
Average loan balance is the average amount of the credit lent out to borrowers by the MFI.
125
The vector of variables in X is of most interest in our analysis. It contains the capital
structure measured by the percentage of capital (scaled by total assets) coming from each
specific source of funds, which are represented as percentage of total assets in our study. We
have categories of equity, grants, savings, retained earnings, concessional loans, bank loans,
other sources of funds, which are mainly short term liabilities49 and other commercial
funding, which refers only to liabilities (e.g., that is both private and institutional investor
funding in the region such as BlueOrchard, Oikocredit, IFC etc.). The base group in this
specification serving as a comparison is the retained earnings.
Existing research looks at the evolution of MFI funding sources through the lenses of an
institutional life cycle theory of MFI development (Bogan, 2011). As previously noted, the
life cycle theory posits that the sources of financing are linked to the stages of MFI
development. Fehr and Hishigsuren (2006) illustrate the evolution of MFI financing moving
toward equity financing, which has become a source of diversification for most of regulated
MFIs seeking to lower their cost of funds and enhance their ability to expand outreach to
target clients. According to Fehr and Hishigsuren (2006) framework most MFIs start out as
NGOs with grants and concessional loans funding from donors and international financial
institutions. Thus, donor grants and soft loans are considered the main funding sources in the
formative stages of MFIs.
As the MFI matures, private debt capital becomes available, and in the last stage of MFI
evolution, the institutions gain access to traditional equity financing. For example, Caudill et
al. (2009) show that MFIs becoming more cost effective over time rely less on subsidies and
more heavily on deposits. Furthermore, Bogan (2011) finds that increased use of grants by
large MFIs decreases financial performance by supporting the profit-incentive view that MFIs
should rely less on grants, soft loans, and other types of donor funds.
The vector of variables K includes control related to MFI specific internal characteristics,
such as organizational types, MFI age, gender focus and risk characteristics. For example, we
use a group of dummy variables to capture differences in organizational status - Bank, Non-
bank Financial Institution (NBFI), Non-Governmental Organization (NGO)50. This is needed
49
The category of "other sources of fund", which we call short-term liabilities, include liabilities - other short term financial liabilities, trade and other payables, provisions for employee benefits, deferred revenue, current tax liabilities, deferred tax liabilities; and equity - other equity interest.
50 “Other status” such as Government fund or NBFI-depository institution, of which we only have 7 observations, were excluded from the analysis.

126
because MFI performance may differ between types of MFIs due to differences in the level of
various sources of capital that each organization is able to use. For example NGOs cannot use
deposits. Also, NGO/NBFI-based MFIs place greater emphasis on outreach and rely relatively
heavily on donated funds to subsidize those efforts, whereas banks are more profit focused
and less subsidy dependent.
MFI age is controlled for to allow for the possibility that older, more experienced MFIs
are more efficient (e.g., see Caudill et al., 2009). We use three groups of dummies to control
for age –New, Young and Mature. We expect age to be positively linked to MFI profitability,
because it reflects how well established the MFI is. So, we take Mature MFIs as an omitted
category. For example, Gonzalez-Vega et al. (1996) point out several possible benefits of the
passage of time on microfinance performance increase: improved lending technology,
accumulated information on clientele, acquired reputation and connections with international
networks, which will ease access to capital funding (see Figure 3, which links MFI evolution
over time to its capital funding).
Two measures of MFI size are used: total assets and gross loan portfolio, both adjusted for
inflation. The size effect may be an indicator of larger MFIs are more cost-effective and they
are more leveraged, with less total equity and lower adjusted capital asset ratios (Caudill et
al., 2009). The empirical evidence shows that the larger size leads to a possible cost savings
due to the advantages afforded by potential economies of scale, as well as potential scope
economies between deposits and loans. Hence, one may argue that larger MFIs will be
inclined to use more savings and commercial loans to fund their capital than grants.
We also retain the same type of variables as used in the Chapter 2 of this thesis. For
instance, we also include the percentage of female borrowers to control for gender focus since
lending to women is associated with lending to poorer borrowers. For example, as mentioned
earlier women may be considered riskier borrowers because of their limited repayment
capacity (Hartarska, Nadolnyak and Shen, 2012). On the other hand, evidence from a number
of studies indicates that since women living in developing regions often face restricted
opportunities for accessing financial services they will be more inclined to exhibit higher
repayment rates in order to continue to be further financed (Van Tassel, 2004). Thus, they are
less subject to moral hazard, and larger number of women borrowers could imply better
repayment rates.
We also adjust for asset quality and risk taking in an MFI typically measured by non-
performing loan ratios using portfolio at risk ratio of loans overdue more than 30 days, which
127
is a standard ratio used by MFIs to measure the risk level of their loan portfolio. This is
needed because lower asset quality (e.g. higher nonperforming loan ratio) requires more
resources to manage the higher risk (Hartarska, Nadolnyak and Shen, 2012). Thus, we also
control for the level of risk.
The last group of independent variables represented by the vector of Z variables includes
country-level macroeconomic indicators. Existing empirical evidence shows that external
factors related to a country’s macroeconomic environment, level of financial development,
population density, etc. affect significantly the MFIs efficiency, and need to be incorporated
in such studies. For instance, lending to rural borrowers, which in the ECA region are
perceived as borrowers without permanent employment and regular income or liquid assets,
might be associated with higher risk to MFIs (see Sheremenko, Escalante and Florkowski,
2012). Therefore, we include the percentage of rural population to total population. Similarly,
increase in the unemployment level could lead to further increase of the risk associated with
the loan default in a country where the MFI is located, so we include the level of
unemployment in the country as another independent variable.
Similar to Chapter 2, we include a measure of the agricultural value added as percentage
of GDP to control for the fact that borrowers engaged in agricultural production may be more
reliable since they have fewer alternative sources of funds. One could also argue that MFIs
perceive agriculture-related borrowers as farmers with a consistent history of employment,
income, and marketable asset ownership. GDP per capita and GDP growth are other
important indicators of a country’s macroeconomic context, which could affect borrowers’
purchasing power and could be associated with their risk of default. Finally, we control the
private credit bureaus coverage in a given country by claiming that it is an important indicator
for credit evaluation and portfolio management by MFIs. The role of credit registers boils
down to possible reduction of the extent of asymmetric information by making a borrower’s
credit history available to MFIs. The higher coverage can be associated with decrease in
lending to high risk individuals, with poor repayment histories, defaults or bankruptcies.
In order to test if the errors across equations in the SUR model are contemporaneously
correlated, we run the Breusch-Pagan specification test of independent errors (see Appendix
L) typically used for SUR models. The null hypothesis is no contemporaneous correlation of
the error term. Thus, a rejection of the null will indicate that SUR is the more appropriate
method to study the impact of capital structure on performance in MFIs.
128
3.4. Data
Similar to chapter 2, data for this chapter comes from a grass-root network Microfinance
Centre for Central & Eastern Europe and the New Independent States (MFC for CEE and
NIS). As compared to the second chapter, here the data includes MFIs from 24 countries from
the ECA region and as in chapter 2, it covers a five-year period from 2005 to 2009.51 These
data were complemented by the annual data reported by individual MFIs in Microfinance
Information Exchange (MIX) online database (2012). Specifically, for the capital structure we
employed a unique database provided by the MFC available only for this period. Credit
unions (CUs) are not included into the sample given their size and the tendency to lend to
members and to larger businesses. Consequently, the countries, which have only CUs
functioning as MFIs, are eliminated from the sample.52
The data on country specific socio-economic characteristics is exactly the same used in
the chapter 2, which is extracted from World Development Indicators (WDI). And all dollar-
value figures in the dataset are 2010 dollar based on U.S. CPI.
Summary statistics are presented in Table 6. The table shows the average values of the
performance measurements, capital structure, MFIs’ characteristics and microenvironment
factors used to estimate the model.
The data shows that for 348 observed MFIs the average ROA is near 3 percent. The
average number of active borrowers is 10,198 per MFI and varies from only 19 in the smallest
MFI to 108,103 for the largest MFI. For the MFIs in the sample, the average loan balance per
borrower/GNI per capita is 110.14 percent and it varies widely from 3.15 to more than 3,450.
The capital structure components as percent of total assets in general range from 0 to
100 percent. For example, equity funding as percent of total assets are on average 14.13
percent. Grants as percent of total assets are on average 12.58 percent and range from 0 to
88.1 percent, which is due to the rounding error. Savings as percent of total assets, as
compared to other capital structure components in the sample, have the smallest average of
2.97 percent for the observed MFIs. The average of retained earnings as percent of total assets
is 9.57 percent and it varies from -5.05 percent to 75.19 percent. The averages of funding
from short-term liabilities and bank loans as percent of total assets are 4.01 and 4.58
51
The sample includes the following countries classified in the ECA region by the MIX Market: Albania, Armenia, Azerbaijan, Bosnia and Herzegovina, Bulgaria, Croatia, Georgia, Hungary, Kazakhstan, Kosovo, Kyrgyzstan, Macedonia, Moldova, Mongolia, Montenegro, Poland, Romania, Russia, Serbia, Slovakia, Tajikistan, Turkey, Ukraine and Uzbekistan. 52 The eliminated countries include Belarus, the Baltic countries (Estonia, Latvia, and Lithuania), Slovenia and Czech Republic.
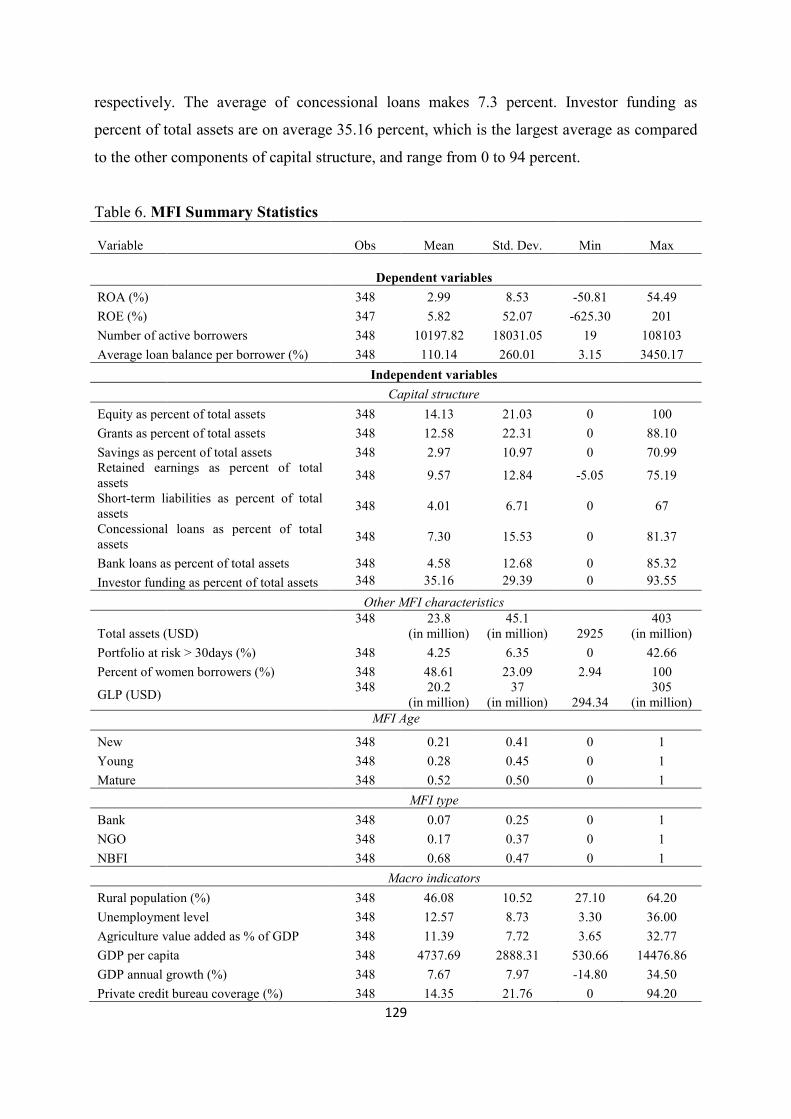
129
respectively. The average of concessional loans makes 7.3 percent. Investor funding as
percent of total assets are on average 35.16 percent, which is the largest average as compared
to the other components of capital structure, and range from 0 to 94 percent.
Table 6. MFI Summary Statistics
Variable Obs Mean Std. Dev. Min Max
Dependent variables
ROA (%) 348 2.99 8.53 -50.81 54.49
ROE (%) 347 5.82 52.07 -625.30 201
Number of active borrowers 348 10197.82 18031.05 19 108103
Average loan balance per borrower (%) 348 110.14 260.01 3.15 3450.17 Independent variables
Capital structure
Equity as percent of total assets 348 14.13 21.03 0 100
Grants as percent of total assets 348 12.58 22.31 0 88.10
Savings as percent of total assets 348 2.97 10.97 0 70.99 Retained earnings as percent of total assets
348 9.57 12.84 -5.05 75.19
Short-term liabilities as percent of total assets
348 4.01 6.71 0 67
Concessional loans as percent of total assets
348 7.30 15.53 0 81.37
Bank loans as percent of total assets 348 4.58 12.68 0 85.32
Investor funding as percent of total assets 348 35.16 29.39 0 93.55 Other MFI characteristics
Total assets (USD) 348 23.8
(in million) 45.1
(in million) 2925 403
(in million)
Portfolio at risk > 30days (%) 348 4.25 6.35 0 42.66
Percent of women borrowers (%) 348 48.61 23.09 2.94 100
GLP (USD) 348 20.2
(in million) 37
(in million) 294.34 305
(in million) MFI Age
New 348 0.21 0.41 0 1
Young 348 0.28 0.45 0 1
Mature 348 0.52 0.50 0 1 MFI type
Bank 348 0.07 0.25 0 1
NGO 348 0.17 0.37 0 1
NBFI 348 0.68 0.47 0 1 Macro indicators
Rural population (%) 348 46.08 10.52 27.10 64.20
Unemployment level 348 12.57 8.73 3.30 36.00
Agriculture value added as % of GDP 348 11.39 7.72 3.65 32.77
GDP per capita 348 4737.69 2888.31 530.66 14476.86
GDP annual growth (%) 348 7.67 7.97 -14.80 34.50
Private credit bureau coverage (%) 348 14.35 21.76 0 94.20
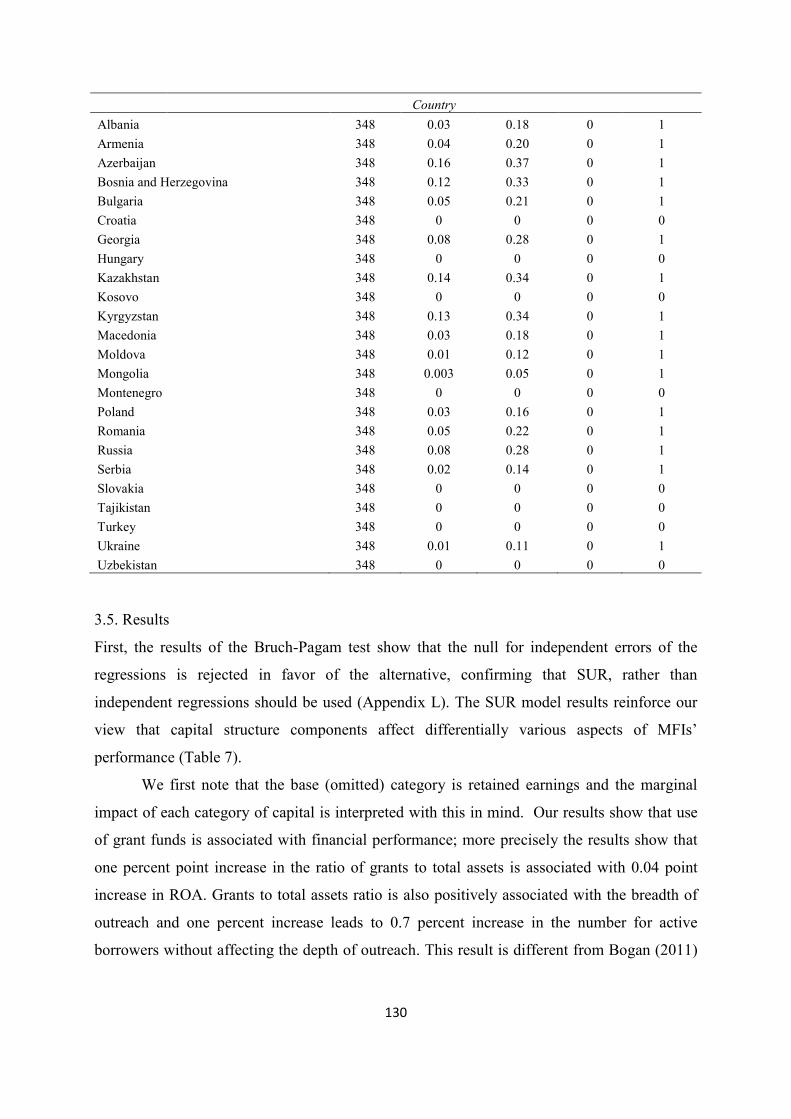
130
Country
Albania 348 0.03 0.18 0 1
Armenia 348 0.04 0.20 0 1
Azerbaijan 348 0.16 0.37 0 1
Bosnia and Herzegovina 348 0.12 0.33 0 1
Bulgaria 348 0.05 0.21 0 1
Croatia 348 0 0 0 0
Georgia 348 0.08 0.28 0 1
Hungary 348 0 0 0 0
Kazakhstan 348 0.14 0.34 0 1
Kosovo 348 0 0 0 0
Kyrgyzstan 348 0.13 0.34 0 1
Macedonia 348 0.03 0.18 0 1
Moldova 348 0.01 0.12 0 1
Mongolia 348 0.003 0.05 0 1
Montenegro 348 0 0 0 0
Poland 348 0.03 0.16 0 1
Romania 348 0.05 0.22 0 1
Russia 348 0.08 0.28 0 1
Serbia 348 0.02 0.14 0 1
Slovakia 348 0 0 0 0
Tajikistan 348 0 0 0 0
Turkey 348 0 0 0 0
Ukraine 348 0.01 0.11 0 1
Uzbekistan 348 0 0 0 0
3.5. Results
First, the results of the Bruch-Pagam test show that the null for independent errors of the
regressions is rejected in favor of the alternative, confirming that SUR, rather than
independent regressions should be used (Appendix L). The SUR model results reinforce our
view that capital structure components affect differentially various aspects of MFIs’
performance (Table 7).
We first note that the base (omitted) category is retained earnings and the marginal
impact of each category of capital is interpreted with this in mind. Our results show that use
of grant funds is associated with financial performance; more precisely the results show that
one percent point increase in the ratio of grants to total assets is associated with 0.04 point
increase in ROA. Grants to total assets ratio is also positively associated with the breadth of
outreach and one percent increase leads to 0.7 percent increase in the number for active
borrowers without affecting the depth of outreach. This result is different from Bogan (2011)
131
who found evidence that compared to use of retained earnings, use of grants was associated
with lower self-sufficiency in larger MFIs.
One of the most interesting results is that using savings as capital source is not
associated with impact on any aspects of the performance of MFIs relative to use of retained
earnings. This is interesting because it suggest that deposit mobilization at least in ECA
region for the study period is neither associated with a mission drift nor with improved
financial results. The justifications for deposit mobilization seems to be a way to expand the
range of financial product and offer savings, which the literature argues are a better
instrument to serve the needs of the poor. We do not find evidence for the justification of
promoting deposit mobilization as a way to attract cheaper capital and thus, improve financial
results or outreach.
These findings go in line with the results of chapter 2. We have seen that the presence
of deposit services is not affecting the financial performance of MFIs expressed by ROA and
ROE. However, as highlighted in the second chapter, our findings suggest that the
simultaneous delivery of credit and deposits can contribute to higher productivity of
microcredit organizations due to the economies of scope: integrated client administration,
outreach or lower transaction costs, enhanced communication channels. Hence, we claim that
the delivery of both loans and savings may allow MFIs to reach easier customers and
strengthen client fidelity. The findings of the second chapter have shown also that the
presence of savings allows MFIs to reach more borrowers. This comes to support the
argument raised both in the first and second chapters that savings should be encouraged as a
better instrument to tailor enhanced microfinance services for the needs of the poor. And this
is what our results show in this chapter.
Next, we find that loans at concessional rates (subsidized loans or loans at an interest
rate lower than the market rates) do not affect the return to assets. It seems, however, that
these loans are used for their purpose and they have positive effect on outreach. The results
show that one percent increase in the ratio of concessional loans to total assets is associated
with about one percent increase in the number of borrowers served and with almost 2 times
higher coefficient measuring depth of outreach. The results suggest that poorer clients are
being reached when concessional loans are being mobilized as a source of funds.
Loans from commercial banks have become another important source of capital for
MFIs once the industry opened up to the commercial market. Our results show that the use of
funding from commercial banks does not affect either measurements of MFI performance.
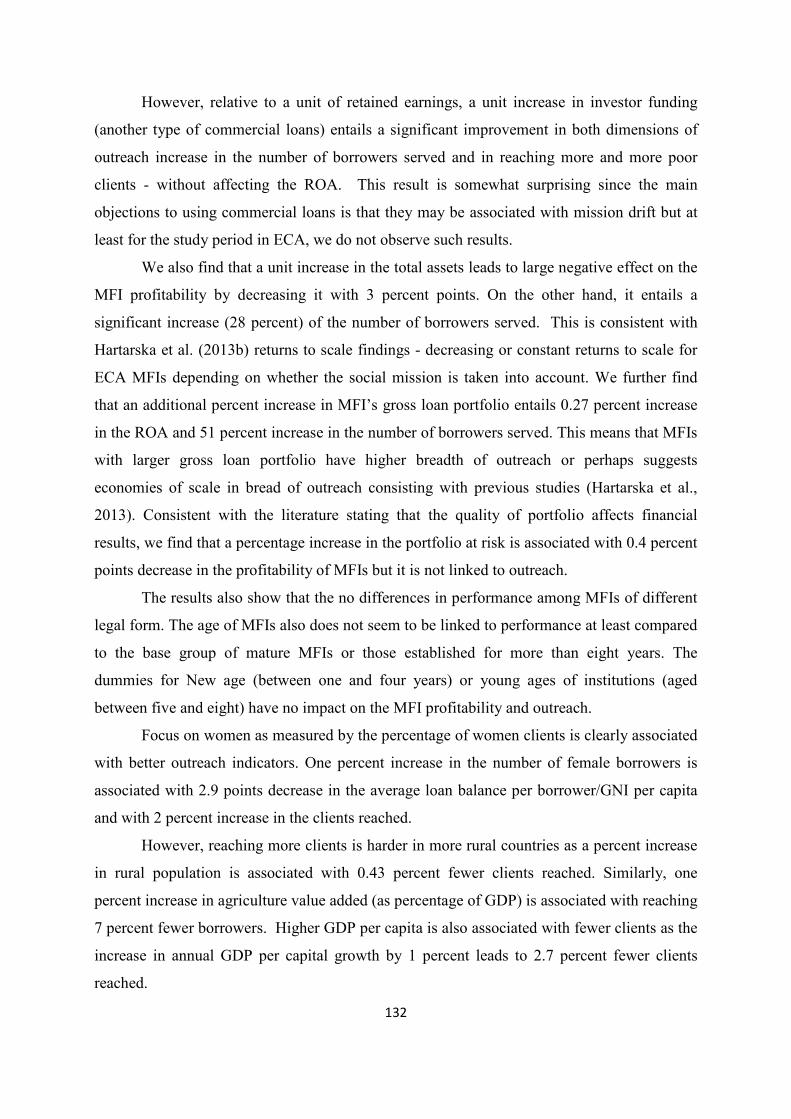
132
However, relative to a unit of retained earnings, a unit increase in investor funding
(another type of commercial loans) entails a significant improvement in both dimensions of
outreach increase in the number of borrowers served and in reaching more and more poor
clients - without affecting the ROA. This result is somewhat surprising since the main
objections to using commercial loans is that they may be associated with mission drift but at
least for the study period in ECA, we do not observe such results.
We also find that a unit increase in the total assets leads to large negative effect on the
MFI profitability by decreasing it with 3 percent points. On the other hand, it entails a
significant increase (28 percent) of the number of borrowers served. This is consistent with
Hartarska et al. (2013b) returns to scale findings - decreasing or constant returns to scale for
ECA MFIs depending on whether the social mission is taken into account. We further find
that an additional percent increase in MFI’s gross loan portfolio entails 0.27 percent increase
in the ROA and 51 percent increase in the number of borrowers served. This means that MFIs
with larger gross loan portfolio have higher breadth of outreach or perhaps suggests
economies of scale in bread of outreach consisting with previous studies (Hartarska et al.,
2013). Consistent with the literature stating that the quality of portfolio affects financial
results, we find that a percentage increase in the portfolio at risk is associated with 0.4 percent
points decrease in the profitability of MFIs but it is not linked to outreach.
The results also show that the no differences in performance among MFIs of different
legal form. The age of MFIs also does not seem to be linked to performance at least compared
to the base group of mature MFIs or those established for more than eight years. The
dummies for New age (between one and four years) or young ages of institutions (aged
between five and eight) have no impact on the MFI profitability and outreach.
Focus on women as measured by the percentage of women clients is clearly associated
with better outreach indicators. One percent increase in the number of female borrowers is
associated with 2.9 points decrease in the average loan balance per borrower/GNI per capita
and with 2 percent increase in the clients reached.
However, reaching more clients is harder in more rural countries as a percent increase
in rural population is associated with 0.43 percent fewer clients reached. Similarly, one
percent increase in agriculture value added (as percentage of GDP) is associated with reaching
7 percent fewer borrowers. Higher GDP per capita is also associated with fewer clients as the
increase in annual GDP per capital growth by 1 percent leads to 2.7 percent fewer clients
reached.
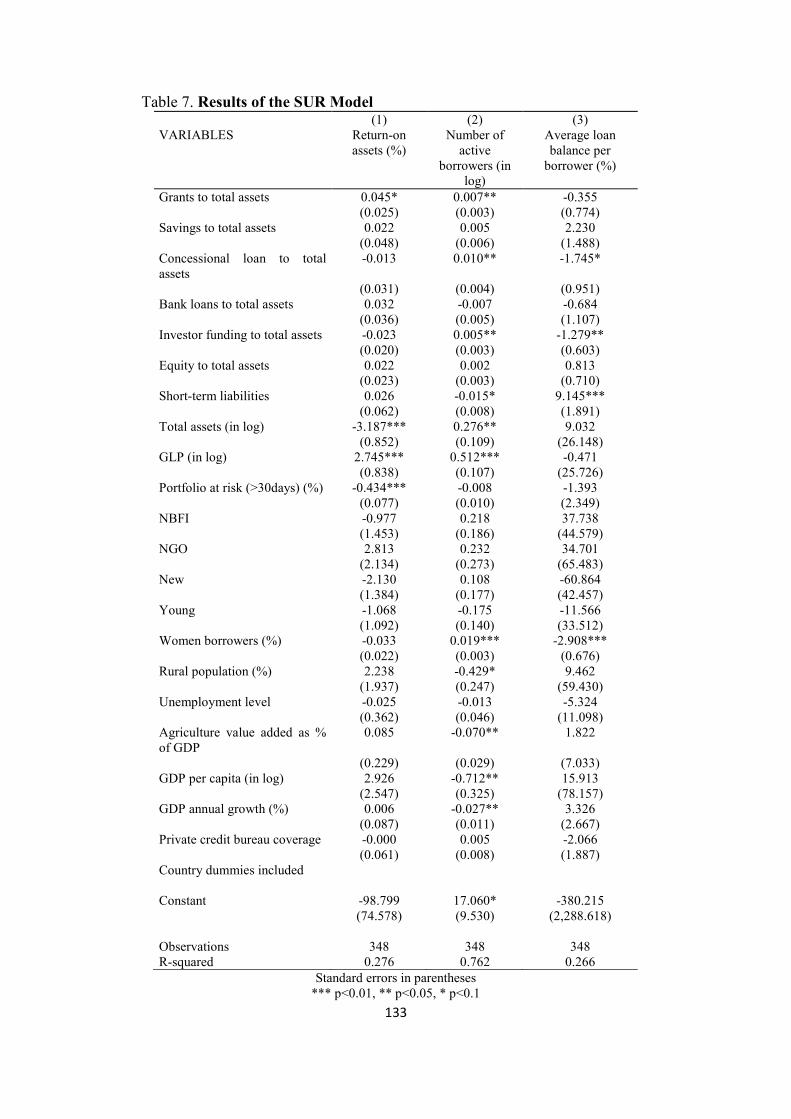
133
Table 7. Results of the SUR Model (1) (2) (3) VARIABLES Return-on
assets (%) Number of
active borrowers (in
log)
Average loan balance per
borrower (%)
Grants to total assets 0.045* 0.007** -0.355 (0.025) (0.003) (0.774) Savings to total assets 0.022 0.005 2.230 (0.048) (0.006) (1.488) Concessional loan to total assets
-0.013 0.010** -1.745*
(0.031) (0.004) (0.951) Bank loans to total assets 0.032 -0.007 -0.684 (0.036) (0.005) (1.107) Investor funding to total assets -0.023 0.005** -1.279** (0.020) (0.003) (0.603) Equity to total assets 0.022 0.002 0.813 (0.023) (0.003) (0.710) Short-term liabilities 0.026 -0.015* 9.145*** (0.062) (0.008) (1.891) Total assets (in log) -3.187*** 0.276** 9.032 (0.852) (0.109) (26.148) GLP (in log) 2.745*** 0.512*** -0.471 (0.838) (0.107) (25.726) Portfolio at risk (>30days) (%) -0.434*** -0.008 -1.393 (0.077) (0.010) (2.349) NBFI -0.977 0.218 37.738 (1.453) (0.186) (44.579) NGO 2.813 0.232 34.701 (2.134) (0.273) (65.483) New -2.130 0.108 -60.864 (1.384) (0.177) (42.457) Young -1.068 -0.175 -11.566 (1.092) (0.140) (33.512) Women borrowers (%) -0.033 0.019*** -2.908*** (0.022) (0.003) (0.676) Rural population (%) 2.238 -0.429* 9.462 (1.937) (0.247) (59.430) Unemployment level -0.025 -0.013 -5.324 (0.362) (0.046) (11.098) Agriculture value added as % of GDP
0.085 -0.070** 1.822
(0.229) (0.029) (7.033) GDP per capita (in log) 2.926 -0.712** 15.913 (2.547) (0.325) (78.157) GDP annual growth (%) 0.006 -0.027** 3.326 (0.087) (0.011) (2.667) Private credit bureau coverage -0.000 0.005 -2.066 (0.061) (0.008) (1.887) Country dummies included Constant -98.799 17.060* -380.215 (74.578) (9.530) (2,288.618) Observations 348 348 348 R-squared 0.276 0.762 0.266
Standard errors in parentheses *** p<0.01, ** p<0.05, * p<0.1
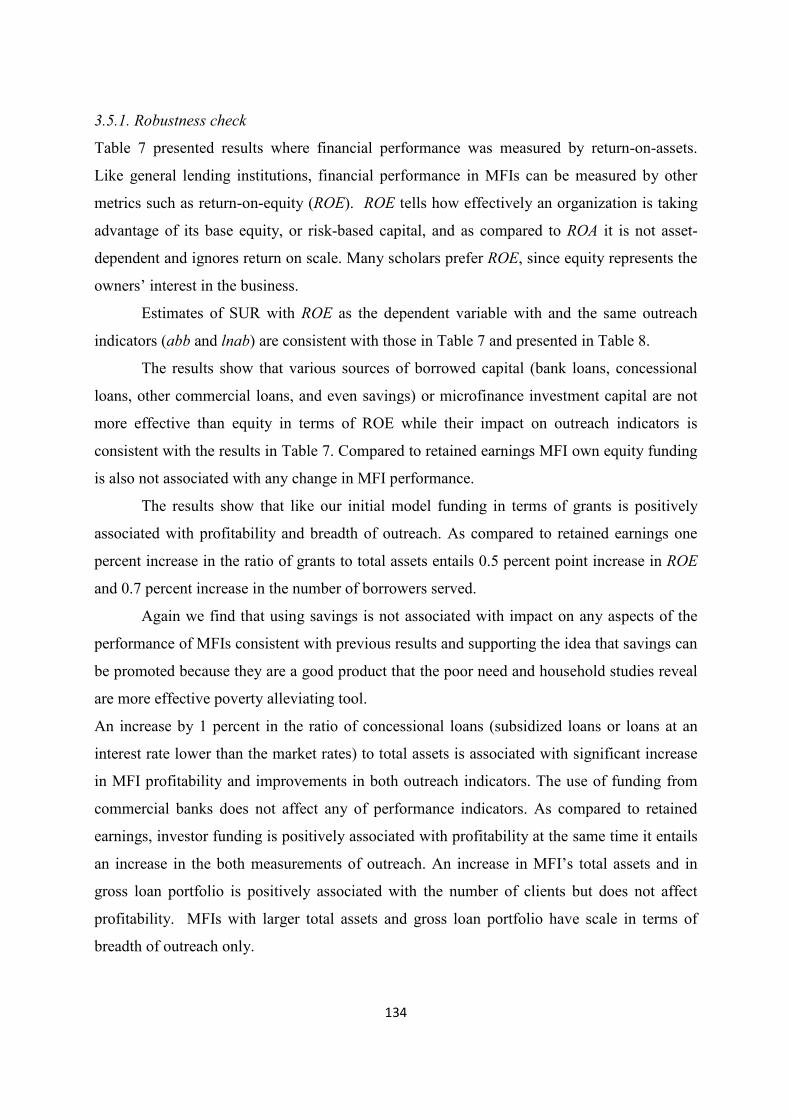
134
3.5.1. Robustness check
Table 7 presented results where financial performance was measured by return-on-assets.
Like general lending institutions, financial performance in MFIs can be measured by other
metrics such as return-on-equity (ROE). ROE tells how effectively an organization is taking
advantage of its base equity, or risk-based capital, and as compared to ROA it is not asset-
dependent and ignores return on scale. Many scholars prefer ROE, since equity represents the
owners’ interest in the business.
Estimates of SUR with ROE as the dependent variable with and the same outreach
indicators (abb and lnab) are consistent with those in Table 7 and presented in Table 8.
The results show that various sources of borrowed capital (bank loans, concessional
loans, other commercial loans, and even savings) or microfinance investment capital are not
more effective than equity in terms of ROE while their impact on outreach indicators is
consistent with the results in Table 7. Compared to retained earnings MFI own equity funding
is also not associated with any change in MFI performance.
The results show that like our initial model funding in terms of grants is positively
associated with profitability and breadth of outreach. As compared to retained earnings one
percent increase in the ratio of grants to total assets entails 0.5 percent point increase in ROE
and 0.7 percent increase in the number of borrowers served.
Again we find that using savings is not associated with impact on any aspects of the
performance of MFIs consistent with previous results and supporting the idea that savings can
be promoted because they are a good product that the poor need and household studies reveal
are more effective poverty alleviating tool.
An increase by 1 percent in the ratio of concessional loans (subsidized loans or loans at an
interest rate lower than the market rates) to total assets is associated with significant increase
in MFI profitability and improvements in both outreach indicators. The use of funding from
commercial banks does not affect any of performance indicators. As compared to retained
earnings, investor funding is positively associated with profitability at the same time it entails
an increase in the both measurements of outreach. An increase in MFI’s total assets and in
gross loan portfolio is positively associated with the number of clients but does not affect
profitability. MFIs with larger total assets and gross loan portfolio have scale in terms of
breadth of outreach only.

135
We also find that riskier loans as measured by the portfolio at risk is associated with
lower profitability with 1 percent higher portfolio at risk lending to about 2 % lower ROE but
no impact on outreach. This result is consistent with the existing evidence that higher risk
level of loan portfolio affects negatively the financial performance.
The results show that the legal status and age of MFIs do not influence their social and
financial performance since there is no difference between the categories MFIs and banks
(omitted) variable and NGOs and NBFIs.
Focus on women as measured by the percentage of women clients is clearly associated
with better outreach indicators. One percent increase in the number of female borrowers is
associated with 3 times increase in the average loan balance per borrower/GNI per capita ratio
and with 2 percent increase in the clients reached. At the same time, a percent increase in
women borrowers entails 0.3 percent decrease in ROE.
The results confirm once again that reaching more clients is harder in more rural
countries as a percent increase in rural population is associated with 43 percent fewer clients
reached. Similarly, one percent increase in agriculture value added (as percentage of GDP) is
associated with reaching 7 percent fewer borrowers.
Higher GDP per capita is also associated with fewer clients (78 percent) as the
increase in annual GDP growth entails 2.5 percent decrease in the number of clients reached.
At the same time an increase in annual GDP growth significantly affects MFI profitability
(2.5 percent increase in ROE).
Table 8. Results of the SUR Model Using ROE (1) (2) (3) VARIABLES Return-on
equity (%) Number of
active borrowers (in
log)
Average loan balance per
borrower (%)
Grants to total assets 0.491*** 0.007** -0.363 (0.169) (0.003) (0.781) Savings to total assets 0.411 0.005 2.226 (0.322) (0.006) (1.491) Concessional loan to total assets
0.583*** 0.010** -1.747*
(0.206) (0.004) (0.953) Bank loans to total assets 0.371 -0.007 -0.683 (0.240) (0.005) (1.108) Investor funding to total assets 0.378*** 0.005** -1.280** (0.131) (0.003) (0.604) Equity to total assets 0.252 0.002 0.810 (0.154) (0.003) (0.712) Short-term liabilities 0.279 -0.015* 9.145*** (0.409) (0.008) (1.893)
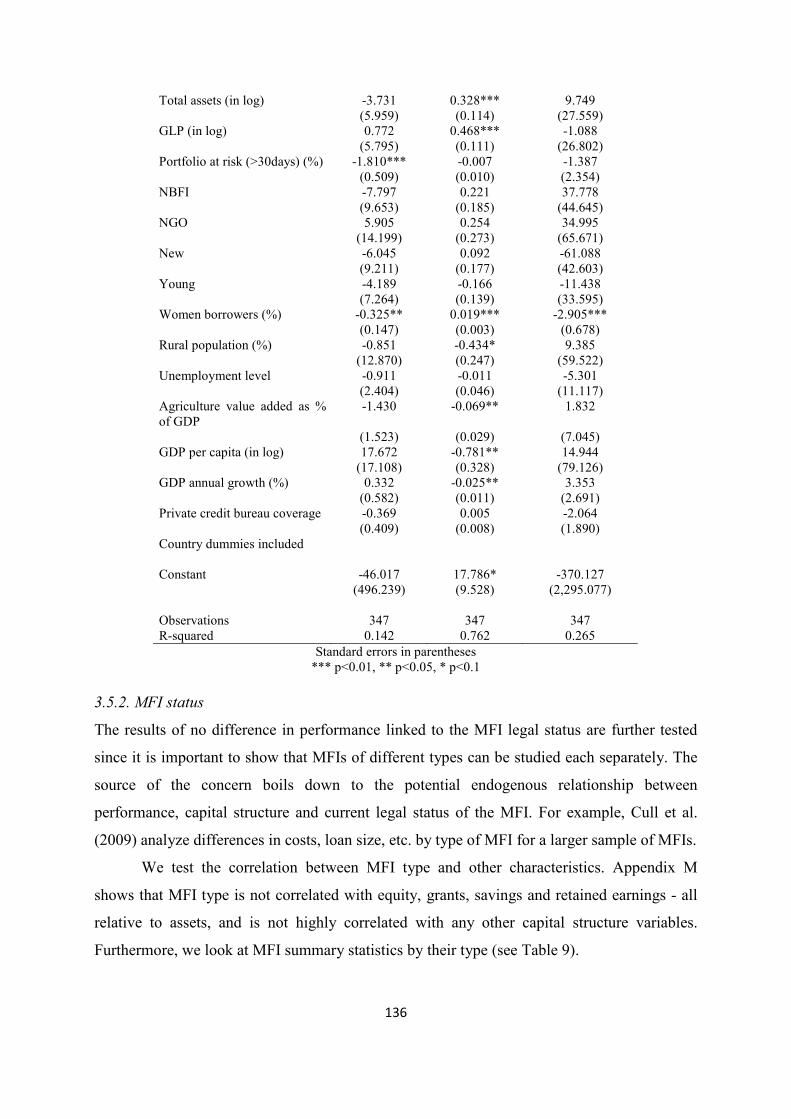
136
Total assets (in log) -3.731 0.328*** 9.749 (5.959) (0.114) (27.559) GLP (in log) 0.772 0.468*** -1.088 (5.795) (0.111) (26.802) Portfolio at risk (>30days) (%) -1.810*** -0.007 -1.387 (0.509) (0.010) (2.354) NBFI -7.797 0.221 37.778 (9.653) (0.185) (44.645) NGO 5.905 0.254 34.995 (14.199) (0.273) (65.671) New -6.045 0.092 -61.088 (9.211) (0.177) (42.603) Young -4.189 -0.166 -11.438 (7.264) (0.139) (33.595) Women borrowers (%) -0.325** 0.019*** -2.905*** (0.147) (0.003) (0.678) Rural population (%) -0.851 -0.434* 9.385 (12.870) (0.247) (59.522) Unemployment level -0.911 -0.011 -5.301 (2.404) (0.046) (11.117) Agriculture value added as % of GDP
-1.430 -0.069** 1.832
(1.523) (0.029) (7.045) GDP per capita (in log) 17.672 -0.781** 14.944 (17.108) (0.328) (79.126) GDP annual growth (%) 0.332 -0.025** 3.353 (0.582) (0.011) (2.691) Private credit bureau coverage -0.369 0.005 -2.064 (0.409) (0.008) (1.890) Country dummies included Constant -46.017 17.786* -370.127 (496.239) (9.528) (2,295.077) Observations 347 347 347 R-squared 0.142 0.762 0.265
Standard errors in parentheses *** p<0.01, ** p<0.05, * p<0.1
3.5.2. MFI status
The results of no difference in performance linked to the MFI legal status are further tested
since it is important to show that MFIs of different types can be studied each separately. The
source of the concern boils down to the potential endogenous relationship between
performance, capital structure and current legal status of the MFI. For example, Cull et al.
(2009) analyze differences in costs, loan size, etc. by type of MFI for a larger sample of MFIs.
We test the correlation between MFI type and other characteristics. Appendix M
shows that MFI type is not correlated with equity, grants, savings and retained earnings - all
relative to assets, and is not highly correlated with any other capital structure variables.
Furthermore, we look at MFI summary statistics by their type (see Table 9).
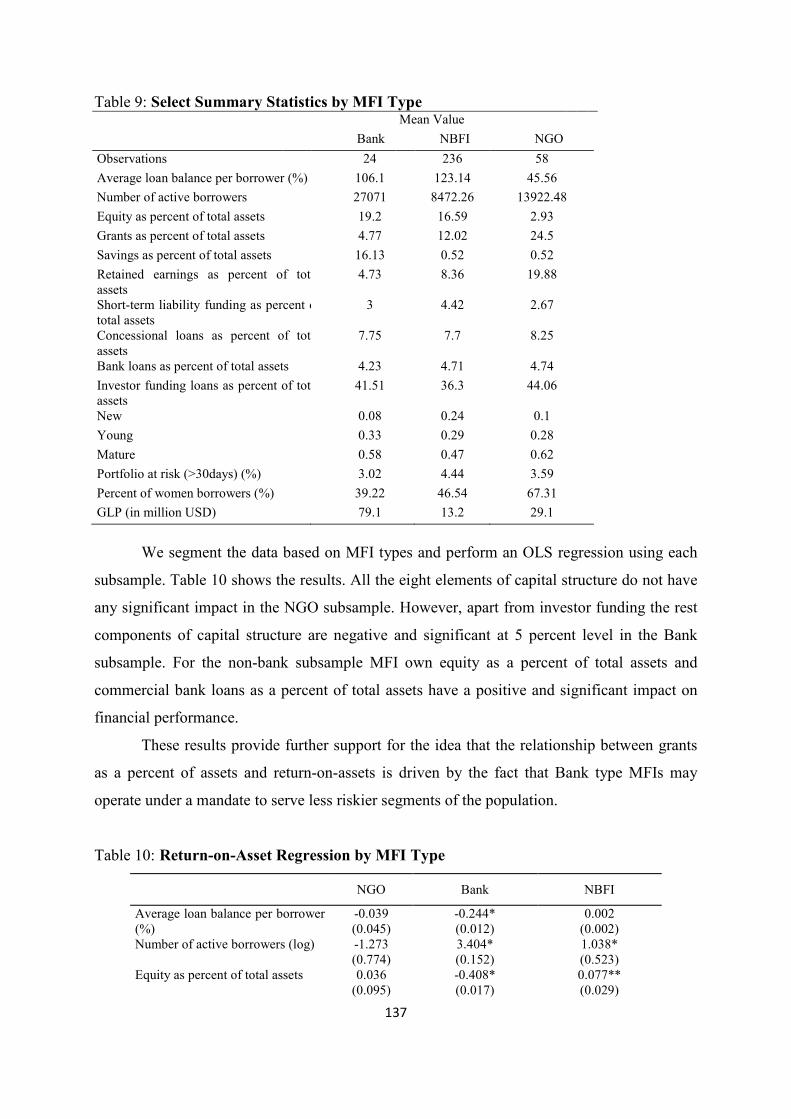
137
Table 9: Select Summary Statistics by MFI Type Mean Value
Bank NBFI NGO
Observations 24 236 58
Average loan balance per borrower (%) 106.1 123.14 45.56
Number of active borrowers 27071 8472.26 13922.48
Equity as percent of total assets 19.2 16.59 2.93
Grants as percent of total assets 4.77 12.02 24.5
Savings as percent of total assets 16.13 0.52 0.52
Retained earnings as percent of tota assets
4.73 8.36 19.88
Short-term liability funding as percent o total assets
3 4.42 2.67
Concessional loans as percent of tota assets
7.75 7.7 8.25
Bank loans as percent of total assets 4.23 4.71 4.74
Investor funding loans as percent of tota assets
41.51 36.3 44.06
New 0.08 0.24 0.1
Young 0.33 0.29 0.28
Mature 0.58 0.47 0.62
Portfolio at risk (>30days) (%) 3.02 4.44 3.59
Percent of women borrowers (%) 39.22 46.54 67.31
GLP (in million USD) 79.1 13.2 29.1
We segment the data based on MFI types and perform an OLS regression using each
subsample. Table 10 shows the results. All the eight elements of capital structure do not have
any significant impact in the NGO subsample. However, apart from investor funding the rest
components of capital structure are negative and significant at 5 percent level in the Bank
subsample. For the non-bank subsample MFI own equity as a percent of total assets and
commercial bank loans as a percent of total assets have a positive and significant impact on
financial performance.
These results provide further support for the idea that the relationship between grants
as a percent of assets and return-on-assets is driven by the fact that Bank type MFIs may
operate under a mandate to serve less riskier segments of the population.
Table 10: Return-on-Asset Regression by MFI Type
NGO Bank NBFI
Average loan balance per borrower (%)
-0.039 -0.244* 0.002 (0.045) (0.012) (0.002)
Number of active borrowers (log) -1.273 3.404* 1.038* (0.774) (0.152) (0.523)
Equity as percent of total assets 0.036 -0.408* 0.077** (0.095) (0.017) (0.029)

138
Grants as percent of total assets 0.055 -0.577* 0.046 (0.058) (0.023) (0.032)
Savings as percent of total assets -0.012 -1.763* 0.011 (0.104) (0.083) (0.037)
Retained earnings as percent of total assets
0.024 -0.610* 0.052 (0.098) (0.025) (0.044)
Short-term liability funding as percent of total assets
-0.024 (0.084)
-1.175* (0.042)
0.002 (0.025)
Concessional loans as percent of total assets
-0.777 -1.858* 0.048 (0.724) (0.071) (0.115)
Bank loans as percent of total assets
0.090 -1.065* 0.306*** (0.071) (0.047) (0.053)
Investor funding as percent of total assets
-0.397 (0.329)
2.246† (0.183)
0.072 (0.074)
Total assets (log) 3.259 69.346* -2.175* GLP (log)
(8.197) (2.876) (0.978) -1.099 -63.609* 1.536
Portfolio at risk (>30days) (%)
(8.277) (3.053) (0.966) -0.147 0.272† -0.486***
New
(0.217) (0.025) (0.095) -1.142 -5.511† 1.687
Young
(4.833) (0.656) (1.901) 1.613 -19.037* 0.716
Women borrowers (%)
(2.856) (0.934) (1.386) -0.043 -1.213* -0.020
Rural population (%)
(0.039) (0.066) (0.031) -0.249 -1.206* 0.177†
Unemployment level
(0.216) (0.080) (0.102) -0.069 -2.658* -0.034
Agricultural production
(0.168) (0.125) (0.119) -0.185 0.420 0.056
GDP per capita (log)
(0.392) (0.083) (0.157) -4.337 -11.150* 3.368*
GDP growth
(4.768) (0.594) (1.700) 0.685* 0.147† 0.029
Private credit bureau coverage (% of adults)
(0.283) (0.012) (0.081) -0.048 (0.048)
-0.095 (0.018)
-0.008 (0.050)
Constant
34.774
(51.996)
195.884† (16.467)
35.050† (18.840)
Observations 58 24 236 R-squared 0.711 1.000 0.359
Standard errors in parentheses *** p<0.001, ** p<0.01, * p<0.05, † p<0.1
3.6. Conclusions
Recent developments in the microfinance industry, such as commercialization and deposit
taking, bring attention to institutions’ use of capital and the link to MFIs performance. The
debate on whether there are trade-offs between MFI outreach and profitability and “a mission
drift” away from reaching many and poorer borrowers as MFIs are becoming more
commercially oriented is on-going and empirical results are mixed.

139
We contribute to the literature by focusing on the link between several dimensions of
MFI performance (ROA, depth and breadth of outreach) and capital structure. We use new
panel data from MFIs operating in the ECA region during the 2005 -2009 period. Rather than
using a single equation regression analysis, we use a system of equations approach – the
Seemingly Unrelated Regressions method to estimate the joint impact of 7 different types of
capital on the three aspects of performance.
The results suggest that in most cases the type of capital used is associated with the
performance preferences of the stakeholder it represents. Relative to retained earnings, use of
grants allows the MFI to improve efficiency and breadth of outreach. However, with
increased commercialization, the role for grants is becoming limited, and grant funding is
already a very small share in the capital structure of MFIs in ECA. Concessional loans and
special microfinance investment, on the other hand, remain a very important source of capital
and have a positive impact on the MFI’s outreach without affecting financial profitability. We
find that neither bank loans nor savings are linked to the indicators of performance. This
seems to support the idea that savings should be encouraged as a better instrument to serve the
needs of the poor but not because savings would lower the cost of capital. Since the data is for
the period during the financial crisis of 2008 and its aftermath, it is important that future work
uses different data and perhaps, region to study the link between this and other elements of
capital structure and the various aspect of MFI performance.
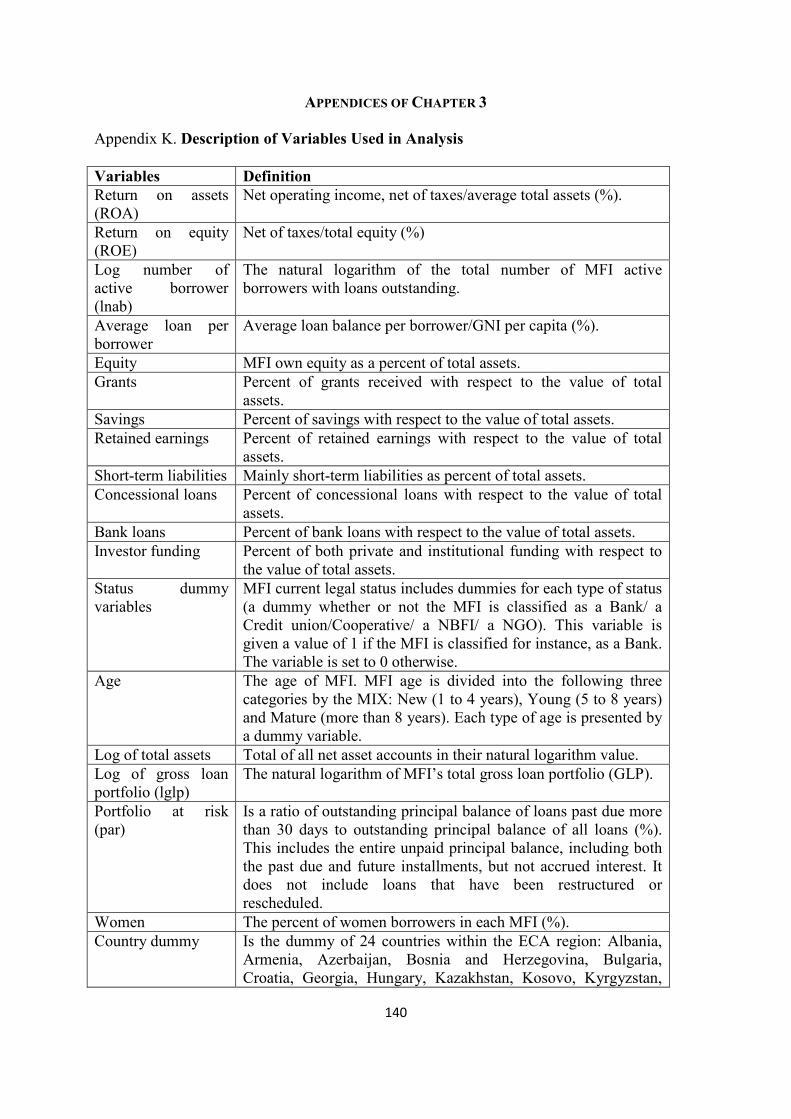
140
APPENDICES OF CHAPTER 3
Appendix K. Description of Variables Used in Analysis
Variables Definition
Return on assets (ROA)
Net operating income, net of taxes/average total assets (%).
Return on equity (ROE)
Net of taxes/total equity (%)
Log number of active borrower (lnab)
The natural logarithm of the total number of MFI active borrowers with loans outstanding.
Average loan per borrower
Average loan balance per borrower/GNI per capita (%).
Equity MFI own equity as a percent of total assets. Grants Percent of grants received with respect to the value of total
assets. Savings Percent of savings with respect to the value of total assets. Retained earnings Percent of retained earnings with respect to the value of total
assets. Short-term liabilities Mainly short-term liabilities as percent of total assets. Concessional loans Percent of concessional loans with respect to the value of total
assets. Bank loans Percent of bank loans with respect to the value of total assets. Investor funding Percent of both private and institutional funding with respect to
the value of total assets. Status dummy variables
MFI current legal status includes dummies for each type of status (a dummy whether or not the MFI is classified as a Bank/ a Credit union/Cooperative/ a NBFI/ a NGO). This variable is given a value of 1 if the MFI is classified for instance, as a Bank. The variable is set to 0 otherwise.
Age The age of MFI. MFI age is divided into the following three categories by the MIX: New (1 to 4 years), Young (5 to 8 years) and Mature (more than 8 years). Each type of age is presented by a dummy variable.
Log of total assets Total of all net asset accounts in their natural logarithm value. Log of gross loan portfolio (lglp)
The natural logarithm of MFI’s total gross loan portfolio (GLP).
Portfolio at risk (par)
Is a ratio of outstanding principal balance of loans past due more than 30 days to outstanding principal balance of all loans (%). This includes the entire unpaid principal balance, including both the past due and future installments, but not accrued interest. It does not include loans that have been restructured or rescheduled.
Women The percent of women borrowers in each MFI (%). Country dummy Is the dummy of 24 countries within the ECA region: Albania,
Armenia, Azerbaijan, Bosnia and Herzegovina, Bulgaria, Croatia, Georgia, Hungary, Kazakhstan, Kosovo, Kyrgyzstan,
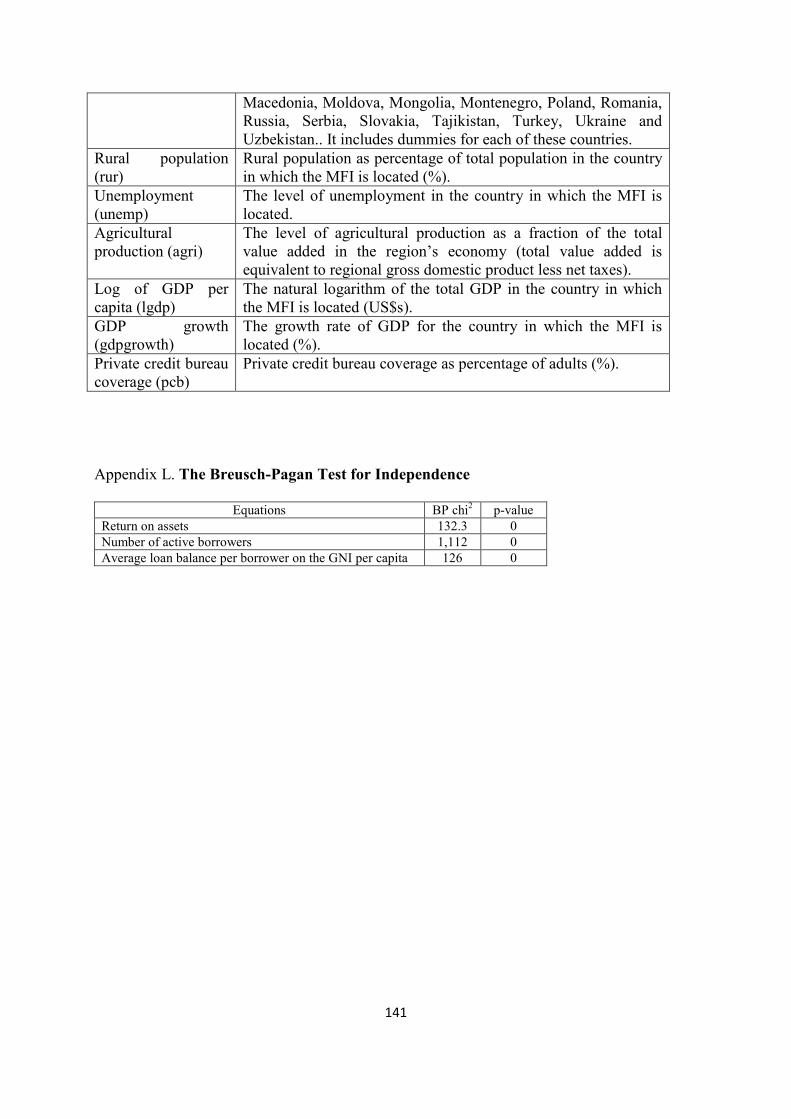
141
Macedonia, Moldova, Mongolia, Montenegro, Poland, Romania, Russia, Serbia, Slovakia, Tajikistan, Turkey, Ukraine and Uzbekistan.. It includes dummies for each of these countries.
Rural population (rur)
Rural population as percentage of total population in the country in which the MFI is located (%).
Unemployment (unemp)
The level of unemployment in the country in which the MFI is located.
Agricultural production (agri)
The level of agricultural production as a fraction of the total value added in the region’s economy (total value added is equivalent to regional gross domestic product less net taxes).
Log of GDP per capita (lgdp)
The natural logarithm of the total GDP in the country in which the MFI is located (US$s).
GDP growth (gdpgrowth)
The growth rate of GDP for the country in which the MFI is located (%).
Private credit bureau coverage (pcb)
Private credit bureau coverage as percentage of adults (%).
Appendix L. The Breusch-Pagan Test for Independence
Equations BP chi2 p-value Return on assets 132.3 0 Number of active borrowers 1,112 0 Average loan balance per borrower on the GNI per capita 126 0
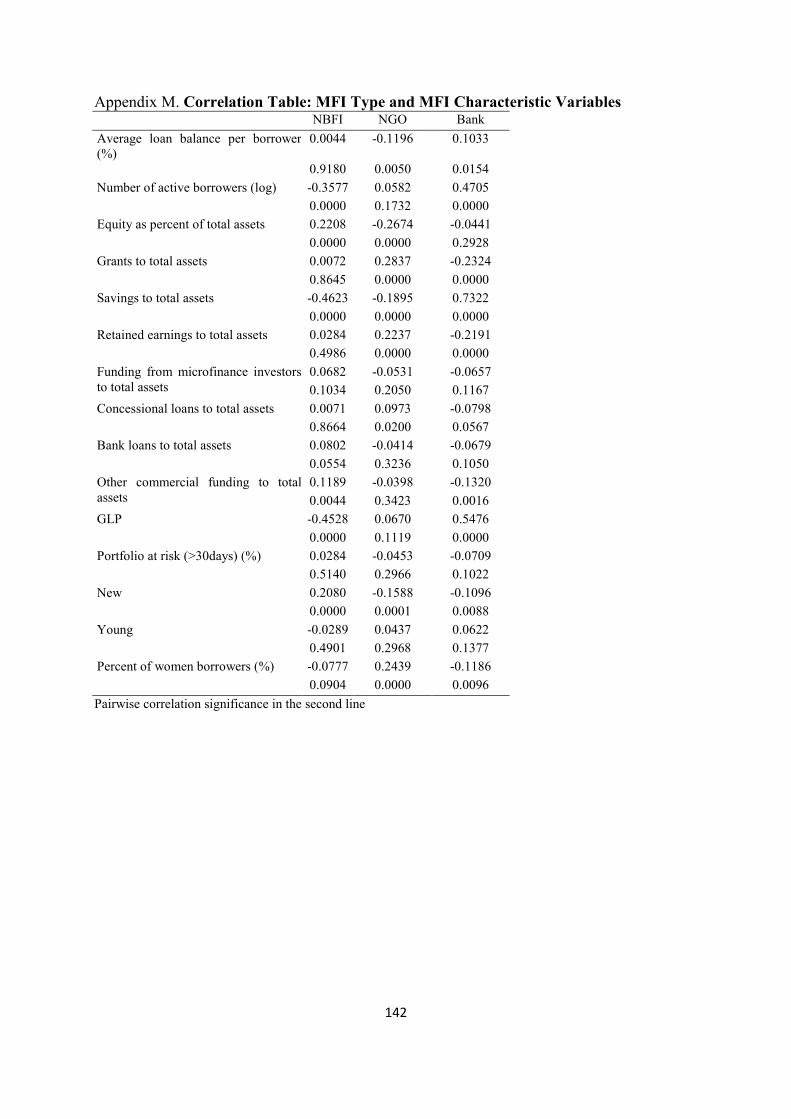
142
Appendix M. Correlation Table: MFI Type and MFI Characteristic Variables NBFI NGO Bank
Average loan balance per borrower (%)
0.0044 -0.1196 0.1033
0.9180 0.0050 0.0154
Number of active borrowers (log) -0.3577 0.0582 0.4705
0.0000 0.1732 0.0000
Equity as percent of total assets 0.2208 -0.2674 -0.0441
0.0000 0.0000 0.2928
Grants to total assets 0.0072 0.2837 -0.2324
0.8645 0.0000 0.0000
Savings to total assets -0.4623 -0.1895 0.7322
0.0000 0.0000 0.0000
Retained earnings to total assets 0.0284 0.2237 -0.2191
0.4986 0.0000 0.0000
Funding from microfinance investors to total assets
0.0682 -0.0531 -0.0657
0.1034 0.2050 0.1167
Concessional loans to total assets 0.0071 0.0973 -0.0798
0.8664 0.0200 0.0567
Bank loans to total assets 0.0802 -0.0414 -0.0679
0.0554 0.3236 0.1050
Other commercial funding to total assets
0.1189 -0.0398 -0.1320
0.0044 0.3423 0.0016
GLP -0.4528 0.0670 0.5476
0.0000 0.1119 0.0000
Portfolio at risk (>30days) (%) 0.0284 -0.0453 -0.0709
0.5140 0.2966 0.1022
New 0.2080 -0.1588 -0.1096
0.0000 0.0001 0.0088
Young -0.0289 0.0437 0.0622
0.4901 0.2968 0.1377
Percent of women borrowers (%) -0.0777 0.2439 -0.1186
0.0904 0.0000 0.0096
Pairwise correlation significance in the second line

143
CONCLUSION
In today’s society the notion of development finance has gain much attention both from
academic and practitioners perspective. Over many decades, microfinance has become one of
the essential pillars of development finance, which is considered as an important component
of any economic development strategy. Microfinance aims at filling the gap left by the
conventional financial services in the study of financial transactions in incomplete market
settings and in the provision of small-scale financial services to marginal clienteles, such as
poor households, small farmers and microentrepreneurs.
This thesis tries to bring forward the issues related the main challenges and recent
trends resulted from the industry evolution, such as commercialization and deposit
mobilization, which the microfinance institutions have to face. We seek to suggest novel
insights both from theoretical and empirical perspectives in addressing those challenges.
The first chapter of this thesis develops a novel mechanism of incentives to address both the
issues of contract enforcement and screening of borrowers.
We claim that the role of innovations in microlending technologies in explaining
opportunities for expansion of the frontier of development finance is attracting increasing
attention. These innovations are addressed to the enhancement of financial services provision
in a sustainable manner to marginal clienteles, and are mainly dealing with resolving dynamic
incentive, information, and enforcement problems and decrease of transaction costs. We
review the exiting incentive mechanisms in individual and group lending contracts and show
that the following mechanisms are being widely used: group lending technologies mostly
reply on joint liability, and individual lending technologies usually rely on the threat of
termination of the lender-borrower relationship and on the gradual improvement of the terms
and conditions of the contract as the borrower demonstrates capacity and willingness to repay
over time.
Building on the exiting evidence both in practice and in academic writing (e.g. see
Robinson, 2001; Meyer, 2002; Dowla and Alamgir, 2003), we show further that savings is
clearly gaining important interest in microfinance programmes, hence becoming a significant
pillar of MFIs’ service portfolio. This creates solid basis for building the core arguments of
this chapter: the inceptive mechanism based on compulsory savings as a repayment guarantee
lacks means for ascertaining borrowers’ abilities; and we argue that the introduction of

144
voluntary savings combined with compulsory savings will come to create a more efficient and
complete incentive mechanism allowing MFIs to deal with the screening problem as well.
Our theoretical model shows that introducing voluntary savings into the incentive mechanism
enables to discriminate borrowers’ abilities and to address screening problems in
microfinance programmes.
The ‘bright’ side of our model consists in giving all borrowers equal chances of
obtaining a loan once they agree to invest compulsory savings in the initial stage, which
serves as high certainty about the enforceability of repayments. The down side consists of
bringing this mechanism closer to traditional bank loans, which require obligatory collateral.
However, such model does not allow MFIs to control for the probability of the projects’
success. Also, we acknowledge certain limits of requiring savings: coping with country
regulations, providing both convenience and security, finding profitable reinvestment
opportunities, etc. (Morduch, 1999b).
The general conclusion of the first chapter is to shed light on exploring savings as
incentives. An interesting implication of our model is that by employing both compulsory and
voluntary savings as an incentive mechanism, MFIs can generate positive social value even
when carrying on projects which do not perform well enough at the beginning. This study
comes to contribute to the literature on the incentive mechanisms in individual lending. We
claim that empirical work testing the effect of specific instruments, combining compulsory
and voluntary savings in a microlending contract, has lagged behind theoretical work on the
topic. Apart from pure academic interest, such evidence could help us understand how
significant and necessary current use of savings is in developing more enhanced incentive
mechanisms that can help achieve the full promise of microfinance programmes.
Building a vast number of empirical studies presented in the first chapter, in the
second chapter we bring forward the claim that the recent trend of savings mobilization plays
a significant role for the enhancement of MFIs activities. Those studies (for instance,
Ledgerwood, 1999; Robinson, 2001) evidence that the ability to mobilize savings can
contribute both to meeting demands of the poor and to an improved loan outreach, a reduced
dependence on subsidies and a long term sustainability of MFIs. After having demonstrated
theoretically how savings could become incorporated into an incentive mechanism to face
repayment and screening problems, we now undertake another perspective and look at the
practice of combined microfinance (simultaneous offering of credit and savings) aiming at
145
establishing a link between offering savings and MFI performance. In doing so, we use a
different methodology as compared to the first chapter.
The second chapter claims that the current evolution of microfinance leads the MFIs to
diversify their service portfolios in order to better meet borrowers’ needs and to benefit from
economies of scope. Existing literature offers some elements to formulate hypotheses with
relation to the service portfolio diversification and performance of MFIs (more precisely, the
depth of poverty outreach and the efficiency). Moreover, recent studies came to demonstrate
the advantages and contributions of joint-lending services in efficient management of MFIs
(enhancement of incentive systems, addressing information asymmetry problems etc.). The
existing empirical findings allow to claim that offering wider choice of microfinance services
contributes to better serving the needs of the poor and can lead to a higher number of poor
persons reached (Labie et al, 2006). This goes in line with Morris and Barnes (2005)
statement, which says that MFIs can help client households reducing their financial
vulnerability through product diversification. While savings could entail various advantages
for MFIs, they have a social mission to provide security and stability to clients. Building on
the above said and arguing that by definition MFIs offering diversified services give clients
the possibility of using a larger choice of financial services, one should expect that both the
financial and social performance of multi-service MFIs is higher than that of mono-service
MFIs (Peachey, 2007). As a complement to credit, savings can yield economies of scope,
which can enable lower financial costs and eventually compensate for the increased
operational costs and risks. Thus, in the second chapter, we build on Hirschland (2005) and
Hartarska, Parmeter and Mersland (2011) and try to explore whether when combining credit
with savings economies of scope enables MFIs to achieve efficiency and productivity
advantages.
Using new panel data from 137 MFIs from Eastern and Central Europe, with the help
of propensity score matching method (PMS), we compare MFIs offering credit only with
those combining credit with savings services. Our findings suggest that the simultaneous
delivery of credit and deposits can contribute to higher productivity of microcredit
organizations. The existing evidence shows that this can be due to the economies of scope,
which can be achieved in various fields when combining credit with savings or insurance (see
e.g. Rossel-Cambier, 2012). We further find that deposit offering MFIs reach more borrowers,
thus they have increased breadth of outreach.
146
The dark side of combining microcredit and savings consists in coping with numerous
risks ranging from management complexity, increased subsidy dependency and lack of
transparency to the effects of covariance risks on economic performance. As already
mentioned in the first chapter, attracting deposits requires certain conditions in order for MFIs
to offer those services: enabling macro-economy and some political stability, appropriate
regulatory environment; public supervision of MFIs; accountable ownership, effective
governance, and consistently good management of its funds.
However, we claim that combining credit and savings is encouraged when referring to
long term organizational sustainability as savings allow to be less dependent of external loans,
and from the borrowers’ perspective allow to have more security.
This study comes to contribute to the existing literature of economies of scope, which seeks to
enhance opportunities for increasing the sustainability and efficient management of MFIs. It
also speaks to the ongoing debate on whether diversification of microfinance services helps to
increase the MFI outreach and overcome the mission drift issues, while bearing in mind that
many other variables may explain MFIs financial and social performance (for instance, the
capital structure of an MFI).
After having demonstrated theoretically and empirically the importance of saving services
in the entire set of microfinance we look further at the main challenges of the field resulted
from recent trends. The perspective change in the third chapter lies down in investigating MFI
financial and social performance through the lenses of its capital structure (including savings).
We claim that the current stage of microfinance industry commercialization growth is
associated with increased needs for funds. The industry growth and MFIs success rely on the
ability to attract and use large amounts of external capital, maintain sustainable operations
without eroding their original focus on outreach. Recent studies have demonstrated
empirically the implications of the microfinance firm’s capital structure for its operations and
impacts on its performance (Bogan, 2011; Kyereboah-Coleman, 2007). In all previous work
we are aware of, the effect of capital structure on outreach is estimated independently of that
on self-sufficiency. Empirical studies linking capital inputs to MFIs performance include
production or cost function estimation (Cull et al., 2007, Hartarska 2005). Kyereboah-
Coleman (2007) used panel data to estimate the impact of capital structure on MFIs
performance within the sub-Saharan region. Bogan (2011) estimates the effects of capital
147
structure on operational and financial self-sufficiency of worldwide sample of MFIs using an
IV approach to address the possibility that grants may be endogenous.
However, the empirical literature provides evidence for a trade-off between the outreach
and the sustainability dimensions of MFIs’ performance, suggesting that financial success
may come at the expense of serving fewer and less poor clients (Cull et al. 2007 & 2009,
Hermes, Lensink and Meesters, 2011). The links between different dimensions of
performance suggest an entirely different empirical approach to capture this dependence.
In this light, the contribution of this chapter of the thesis is to estimate the marginal
impact of various sources of capital on three dimensions of performance. Building on life-
cycle theory and profit-incentive theory we investigate the role of individual elements of
capital funding play in determining performance of MFIs. Rather than using a single equation
regression analysis, we use a system of equations approach - Seemingly Unrelated Regression
(SUR) method – to estimate the joint impact of seven categories of capital on three
dimensions of performance. As in the previous chapter, we use new data from MFIs operating
in 24 countries of the ECA region obtained from a grass-root network Microfinance Centre
for Central & Eastern Europe and the New Independent States and covering the five-year
period between 2005 and 2009.
The results suggest that performance is influenced by the interest of the stakeholders
behind the capital. Concessional loans and microfinance investment funds are useful in
improving outreach without affecting financial results. Grants are associated with better
breadth of outreach as well and better financial performance. However, bank loans and
savings are not linked to performance, supporting the notion that savings should be
encouraged as a better instrument to serve the needs of the poor not necessarily as a way to
lower the cost of capital.
This chapter contributes to literature on opportunities for increasing the sustainability and
growth of MFIs considering their financing sources. It also contributes to the ongoing debate
on whether outreach and sustainability are substitutes or complements in a particular region.
We believe that understanding these linkages can make MFI evaluation more accurate and,
further, can help position microfinance in the broader picture of economic development.
Research on small-scale financial services for the poor must address important tradeoffs,
and this dissertation is not an exception. First, theoretical work must be grounded in well-
documented stylized facts. For instance, facts about which type of MFIs mobilize both

148
compulsory and voluntary savings. We acknowledge that offering savings implies appropriate
risk and liquidity management and internal control mechanisms as well as coping with
country regulations. This is why the theoretical model in the first essay uses a general
assumption that the MFI legal structure allows for deposit collection from clients.
Empirical work on financial services for the poor suffers from the lack of extensive
data and the poor quality of available data. In this respect, this dissertation is also not an
exception. The second and third essays use data on capital structure elements collected from
MFC, which could provide data only for the MFIs in Easter Europe and Central Asia covering
the five-year period between 2005 and 2009.
For the second essay, apart from acknowledging that further research should investigate the
issue on a larger sample of institutions from different regions, we believe that further research
should also recognize the diversity of provided savings products and distinguish compulsory
and voluntary savings.
Finally, for the third essay, since the data is for the period during the financial crisis of 2008
and its aftermath, it is important that future work uses different data and perhaps, region to
study the link between this and other elements of capital structure and the various aspect of
MFI performance.
To conclude, this dissertation has brought forward selected associations with regard to the
three main challenges the microfinance current state of evaluation faces, which can help
illuminate and frame further debates on MFIs’ dynamic incentive mechanisms, combined
microfinance services and capital structure elements.
These insights and contributions open new avenues for the further research perspectives. First,
in the first essay we have suggested a new incentive mechanism by building on a theoretical
model. We intend to collect empirical data on MFIs, which offer different types of savings –
compulsory and voluntary – and to test the model in order to see how in practice savings
could serve to address enforcement and screening issues.
Second, recent trends of microfinance evaluation bring forward the importance of combined
services. Due to the composition of the database we could access, we were able to investigate
only the impact of combined credit and savings services on the MFI financial and social
performance. We will further enrich our data in order to investigate not only the impact of
simultaneous delivery of savings but also other small scale services, such as insurance,
remittances etc., on the enhancement of MFIs efficiency and outreach.
149
Third, we intend to further investigate the robustness of our study on the link between the
MFI capital funding and performance. For doing this, a more recent data including different
regions needs to be collected. This will help to understand whether the MFI performance is
influenced by the interest of the stakeholders behind the capital and whether there could be a
pattern of funding in different regions.

150
151
BIBLIOGRAPHY
Adams, Dale W, Douglas H. Graham and J.D. Von Pischke (1984), Undermining Rural
Development with Cheap Credit, Boulder, Colorado: Westview Press. Adjei, J., Arun, T. and Hossain, F., (2009), Asset Building and Poverty Reduction in Ghana:
the Case of Microfinance, Savings and Development, 265-291. Ahlin, C., Lin, J., Maio, M. (2011), Where does microfinance flourish? Microfinance
institution performance in macroeconomic context, Journal of Development Economics
95(2), 105-120. Alarcon, M.D. (2008), Securitization in Microfinance: Creating Saving and Investment
Instruments for the Poor, Microfinance Research Paper, International Development Law Organization.
Armendáriz, B. and Szafarz, A. (2011), On Mission Drift in Microfinance Institutions. In B. Armendáriz, B and Labie, M. ed. (2011), The Handbook of Microfinance, Toh Tuck Link, Singapore: World Scientific Publishing Co. Pte. Ltd, 341-366.
Armendariz, B. and Vanroose, A. (2009), Uncovering Microfinance Myths: Does Country-Wide Age Matter? Reflets et Perspectives de la vie économique. La microfinance sous la direction de Marc Labie, Tome XLVII no 3, 7-17.
Armendáriz, B. and Morduch, J. (2005), The Economics of Microfinance, Cambridge, MA: MIT Press.
Armendáriz, B. and Morduch, J. (2000), Microfinance beyond group lending, Economics of
Transition 8(2), 401–420. Armendáriz, B. (1999), On the design of a credit agreement with peer monitoring, Journal of
Development Economics 60, 79–104. Augsburg, B., and Fouillet, C. (2010), Profit Empowerment: The Microfinance Institution's
Mission Drift, Perspectives on Global Development & Technology 9 (3/4), 327-355. Ayayi, A. G., and Sene, M. (2010), What drives microfinance institution's financial
sustainability, The Journal of Developing Areas 44(1), 303-324. Bellman, E. (2006), Invisible hand: Entrepreneur gets big banks to back very small loans,
Wall Street Journal, page A1, May 15, 2006. Besley, T. and Coate, S. (1995), Group lending, repayment incentives and social collateral,
Journal of Development Economics 46(1), 1–18. Berger, A., Bonaccorsi di Patti, E., (2006), Capital structure and firm performance: A new
approach to testing agency theory and an application to the banking industry, Journal of
Banking and Finance 30, 1065-1102. Bhole, B.; Ogden, S. (2010), Group lending and individual lending with strategic default,
Journal of Development Economics 91, 348–363. Bogan, V.L., (2011), Capital Structure and Sustainability: An Empirical Study of
Microfinance Institutions. Review of Economics and Statistics, forthcoming, DOI 10.1162/REST_a_00223.
Boot, A.; Thakor, A. (2000), Can relationship banking survive competition?, The Journal of
Finance 55(2), 679-713. Bos, T. and Fetherston, T.A. (1993), Capital structure practices on the specific firm, Research
in International Business and Finance 10, 53-66. Bowen, W.G. (1994), When a business leader joins a nonprofit board. Harvard Business
Review, September–October, 38–43.
152
Brau, J.C.; Woller, G.M. (2004), Microfinance Institutions: A Comprehensive Review of the Existing Literature and an Outline for Future Financial Research, Journal of
Entrepreneurial Finance and Business. Caudill, S., Gropper, D., Hartarska V. (2009), Which microfinance institutions are becoming
more cost-effective with time? Evidence from a mixture model, Journal of Money,
Credit, and Banking 41(4), 651-672. Cave, G. and Bos, H. (1995), The Value of a GED in a Choice-Based Experimental Sample,
Manpower Demonstration Research Corporation, New York. CGAP (2003), Microfinance Consensus Guidelines. Definitions of Selected Financial Terms,
Ratios, and Adjustments for Microfinance, CGAP and The World Bank Group. Chaia, A., Dalal, A., Goland, T., Gonzalez M., Morduch J., and Schiff, R. (2009), Half the
World is Unbanked. Financial Access Initiative Framing Note. Charlton, K. A., MFI Equity: An Investment Opportunity for the Broader Public? In
Matthäus-Maier, I. and von Pischke, J.D. (2008), New Partnerships for Innovation in
Microfinance, Springer Edt., 69-83. Cheng, Y. (2003), Propensity Score Matching and the New Issues Puzzle, Working Paper. Chowdury, P.R. (2005), Group lending: sequential financing, lender monitoring and joint
liability, Journal of Development Economics 77(2), 415–39. Christen, R.P. and Drake, D (2002), Commercialization. The new reality of microfinance. In
Drake, D. and Rhyne, E. editors, The Commercialization of Microfinance. Balancing
Business and Development, chapter 1, 2–22. Kumarian Press, Bloomfield. Christen, R. (2000), Bulletin highlights. MicroBanking Bulletin 4, 41–47. Churchill C.F., Liber D., McCord M.J., Roth J. (2003), Making Insurance Work for
Microfinance Institutions, A Technical Guide to Developing and Delivering Microinsurance, ILO.
Copestake, J. (2007), Mainstreaming Microfinance: Social Performance Management or Mission Drift? World Development 35(10), 1721-1738.
Crombrugghe, A. d., Tenikue, M., and Sureda, J. (2008), Performance analysis for a sample of microfinance institutions in India. Annals of Public and Cooperative Economics, 79(2), 269-299.
Cull, R., Demirguc-Kunt, A. and Morduch, J. (2011), Does regulatory supervision curtail microfinance profitability and outreach? World Development 39(6), 949–965.
Cull, R., Demirguc-Kunt, A., Morduch J. (2009), Microfinance meets the market. Journal of
Economic Perspectives 23(1), 167–192. Cull, R.; Demirgüç-Kunt, A. and Morduch, J. (2007), Financial Performance and Outreach: A
Global Analysis of Leading Microbanks, The Economic Journal 117(517), F107-F133. Czajka, J., Hirabayash, S.M., Rioderick J.A. and Rubin, D.B. (1992), Projecting from
Advance Data Using Propensity Modeling: An Application to Income and Tax Statistics, Journal of Business and Economic Statistics 10 (2), 117-131.
Dehejia, R. H. and Wahba, S. (2002), Propensity Score Matching Methods for Nonexperimental Causal Studies, Review of Economics and Statistics 84, 151-161.
Deshpande, R., and J. Glisovic-Mezieres (2007), The true cost of deposit mobilization, Consultative Group to Assist the Poorest (CGAP), Draft report.
Dowla, A.; Alamgir, D. (2003), From microcredit to microfinance: Evolution of savings products by MFIs in Bangladesh, Journal of International Development 15, 969–988.
Egli, D. (2004), Progressive Lending as an Enforcement Mechanism in Microfinance Programs, Review of Development Economics 8(4), 505–520.
153
Farrington, T. and Abrams, J. (2002), The Evolving Capital Structure of Microfinance Institutions, Micro-Enterprise Development Review, Washington D.C., (Inter-American Development Bank Working Paper).
Fehr, D. and Hishigsuren, G. (2006), Raising capital for micro finance: sources of funding and opportunities for equity financing, Journal of Developmental Entrepreneurship 11(2), 133-143.
Fernando, J.L. (2006), Microfinance-Perils and Prospects, Routledge Studies in Development Economics, Routledge.
Fiebig, M.; Hannig, A.; Wisniwski, S. (1999), Savings in the context of microfinance- state of knowledge, Consultative Group to Assist the Poorest (CGAP), Working Group on Savings Mobilization.
Gadway, J. and M.G. O'Donnell (1996), Financing Micro-Enterprises and Rural Smallholders, Draft.
Galema, R., Lensink, R. and Mersland, R. (2012), Do Powerful CEOs Determine Microfinance Performance? Journal of Management Studies 49 (4), 718–742.
Garmaise, M. J., and Natividad, G. (2010), Information, the cost of credit, and operational efficiency: an empirical study of microfinance, Review of Financial Studies 23(6), 2550-2590.
Geweke, J. (2003), Contemporary Bayesian Econometrics and Statistics, Hoboken, NJ: Wiley.
Ghatak, M. (2000), Screening by the company you keep: joint liability lending and the peer selection effect, The Economic Journal 110(July), 601-631.
Ghatak, M. (1999), Group lending, local information and peer selection, Journal of
Development Economics 60, 27–50. Glisovic, J., El-Zoghbi, M. and Forster, S. (2010), Advancing Savings Services: Resource
Guide for Funders, Technical Guide, Draft for Public Review, CGAP October 2010. Gonzalez, A., and Rosenberg R. (2006), The State of Microcredit: Outreach, Profitability and
Poverty, Microfinance Information Exchange, Inc. (MIX) and The Consultative Group to Assist the Poor (CGAP), Washington DC.
Gonzalez-Vega, C., Schreiner, M., Meyer, R.L., Rodriguez, J. and Navajas, S. (1996), BANCOSOL: The Challenge of Growth for Microfinance Organizations, Rural Finance Program, Department of Agricultural Economics, The Ohio State University, Economics and Sociology, Occasional Paper No. 2332.
Gonzalez-Vega, Claudio (1993), “From Policies, to Technologies, to Organizations: The Evolution of the Ohio State University Vision of Rural Financial Markets,” Economics
and Sociology Occasional Paper No.2062, Columbus, Ohio, The Ohio State University Greene, W. (2003), Econometric Analysis, 5th ed. New Jersey, Prentice Hall. Grossman, S.J. and Hart, O.D (1982), Corporate financial structure and managerial incentives.
In: McCall, J. J., The Economics of Information and Uncertainty, Chicago: The University of Chicago Press, 123-155.
Gupta, S. (2008), Microfinance in Africa: Harnessing the Potential of a Continent, Microfinance Insight. An Intellecap Publication.
Gutierres-Nieto, B., Serrano-Cinca, C. and Mar, M. (2007), Microfinance institutions and efficiency, The International Journal of Management Science 35, 131-142.
Handy, F. (1995), Reputation as Collateral: An Economic Analysis of the Role of Trustees of Nonprofits, Nonprofit and Voluntary Sector Quarterly 24(4), 293-305.
Hartarska V., Nadolnyak, D. and Shen, X. (forthcoming 2013), Cost Function Approach to MFI Efficiency: The Role of Subsidy and Social Output Measures in Innovations in
154
Microfinance: Case Studies from Developing Countries and Countries in Transition, Ronny Manos, Jean-Pierre Gueyie and Jacob Yaron eds, Palgrave Macmillan.
Hartarska, V., Shen, X. and Mersland, R. (2013). Scale Economy and Price Elasticities in Microfinance Institutions. Journal of Banking and Finance. 37(1), 181-131.
Hartarska, V., Nadolnyak, D. and Shen, X. (2012), Social Performance and Cost Minimizing MFI Size, Journal of Cost Management, September/October, 20-28.
Hartarska, V., Nadolnyak, D. and Shen, X. (2012), Efficiency in Microfinance Cooperatives,
Iberoamerican Journal of Development Studies 1(2), 52-75. Hartarska, V., Nadolnyak, D. and McAdams, T. (2012), Microfinance and Microenterprises’
Financing Constraints in Eastern Europe and Central Asia in Gueyie, J.P. and Yaron, J. ed. (2012), Microfinance in Developed and Developing Countries : Issues, Policies and
Performance Evaluation, Chapter 2, 27-42. Hartarska, V.; Parmeter, C. and Nadolnyak, D. (2011), Economies of Scope of Lending and
Mobilizing Deposits in Rural MFIs: a Semiparametric Analysis, American Journal of
Agricultural Economics 93(2), 389-398. Hartarska V., Parmeter, C. and Mersland, R. (2011), Should All Mircofinance Institutions
Mobilize Microsavings? Evidence from Economies of Scope, under review in Oxford
Bulletin of Economics and Statistics.
Hartarska V. and R. Mersland (2009), Which Governance Mechanisms Promote Efficiency in Reaching Poor Clients? Evidence from Rated Microfinance Institutions, European
Financial Management 18(2), 218–239. Hartarska, V. and Nadolnyak, D. (2007), Do regulated microfinance institutions achieve
better sustainability and outreach: Cross-country evidence, Applied Economics 39, 1207–1222.
Hartarska, V. (2005), Governance and performance of microfinance institutions in central eastern Europe and the newly independent states, World Development 33(10), 1627–1643.
Heckman, J., Ichimura, H. and Todd, P.E. (1997), Matching As An Econometric Evaluation Estimator: Evidence from Evaluating a Job Training Program", Review of Economic
Studies, 64, 605-654. Heckman, J. and Smith, J.A. (1995), Assessing the Case for Social Experiments, The Journal
of Economic Perspectives 9, 85-110. Helms, B. (2006), Access for All: Building Inclusive Financial Systems. Washington, D.C.:
International Bank for Reconstruction and Development, The Consultative Group to Assist the Poor (CGAP).
Hermes, N., Lensink, R. and Meesters, A. (2011), Outreach and efficiency of microfinance institutions, World Development 39(6), 938-48.
Hirschland, M. (2005), Savings Services for the Poor: An Operational Guide. Chapter 7. Savings products. Sterling, Va.: Kumarian Press.
Holland, P. W. (1986), Statistics and Causal Inference, Journal of the American Statistical Association 81, 945-960.
Hudon, M., Traça, D. (2011), On the efficiency effects of subsidies in microfinance: an empirical inquiry, World Development 39(6), 966-973.
Hudon, M. (2007), Social Justice with Credits to the Poor: A Neo-Contractarian Approach, CEB Working Paper N° 07/003, Solvay Business School, Université Libre de Bruxelles (ULB) and Harvard University.
Hughes, J.P., Mester, L.J. (2008), Efficiency in banking: Theory, practice, and evidence. Federal Reserve Bank of Philadelphia Working Paper No. 08-1.
155
ILO STEP (2005), Health Microinsurance Schemes: Feasibility Study Guide, Volume 1 and 2.
Jackelen, H.R. and Rhyne, E. (1991), Toward a More Market-Oriented Approach to Credit and Savings for the Poor, Small Enterprise Development 2(4), 4-20.
Jensen, M.C., (1986), Agency costs of free cash flow, corporate finance and takeovers, American Economic Review 76, 323-339.
Jensen, M.C., Meckling, W. (1976), Theory of the firm: Managerial behaviour, agency costs, and capital structure, Journal of Financial Economics 3,305-360.
Judge, G.G., Griffiths, W.E., Robin H.C., Helmut, L. and Lee, T.C. (1985), The Theory and
Practice of Econometrics, New York: Wiley. Karlan, D., and Morduch, J. (2010), Access to Finance. Chapter 2 in Dani Rodrik and Mark
Rosenzweig, eds., Handbook of Development Economics, vol. 5. Amsterdam : North-Holland.
Karlan, D. (2007), Social connections and group banking, Economic Journal 117, F52–F84. Katz, D. and Kahn, R.L. (1966), Social psychology of organizations. New York: Wiley. Khandker, S.R. (1998), Fighting Poverty with Microcredit: Experience in Bangladesh.
Oxford Univ. Press for the World Bank, New York. Kreps, D.M. (1990), A Course in Microeconomic Theory. Princeton University Press,
Princeton, NJ. Kyerboach-Coleman, A. (2007), The impact of capital structure on the performance of
microfinance institutions, Journal of Risk Finance 8(1), 56-71. Labie, M., Ngongang, I., Nyssens, M., Wele, P. (2006), Analyser l’articulation entre micro-
finance et micro-assurance santé: Réflexions à partir de trois cas béninois, Working paper, Documents d’économie et de gestion, Centre de Recherche Warocqué, Mons.
Ledgerwood, J. and White, V. (2006), Transforming Microfinance Institutions, Washington, The World Bank and The MicroFinance Network.
Ledgerwood, J. (1999), Microfinance Handbook: An Institutional and Financial Perspective, The World Bank, Washington.
Leeds, Roger S. and Sunderland, J. (2003), Private Equity Investing In Emerging Markets, Journal of Applied Corporate Finance 15(4).
Martin, I.; Hulme, D.; Rutherford, S. (2002), Finance for the poor: From microcredit to microfinancial services, Journal of International Development 14, 273–294.
Mata, R. S. (2009), Microfinance Institutions on the Remittances Market: Money Transfer Activity and Savings Mobilisation, CEB Working Paper N° 09/022.
McCord, J.M., Buczkowski G. and Saksena P. (2006), Premium collection: Minimizing transaction costs and Maximizing customer service, Protecting the Poor, A
Microinsurance Compendium, ILO, CGAP and Munich Re Foundation, 197-215. McKinnon, Ronald (1993), Money and Banking in Economic Development, Washington D.C.:
The Brookings Institution. Meng, X.L. and Rubin, D.B. (1996), Efficient Methods for Estimation and Testing with
Seemingly Unrelated Regressions in the Presence of Latent Variables and Missing Observations. in Berry, D.A., Chaloner, K.M. and Geweke, J., eds. (1996), Bayesian
Analysis in Statistics and Econometrics: Essays in Honor of Arnold Zellner, New York: Wiley, 215-227.
Mersland, R. (2011), The governance of non-profit micro finance institutions: lessons from history, Journal of Management and Governance August 15(3), 327-348.
Mersland, R. and Strom, R.O. (2009), Performance and governance in microfinance institutions, Journal of Banking and Finance 33, 662-669.

156
Mersland, R. and Strom, R.O. (2008), Performance and trade-offs in microfinance organizations-Does ownership matter? Journal of International Development 20, 598-612.
Meyer, R.L. (2002), The demand for flexible microfinance products: Lessons from Bangladesh, Journal of International Development 14(3), 351-368.
MIX and CGAP (2011), Eastern Europe and Central Asia Microfinance Analysis and Benchmarking Report 2010, Washington, DC.
Microbanking Bulletin (December 2009), Vol. 19. Modigliani, F. and Miller, M.H. (1958), The cost of capital, corporate finance and the theory
of investment, The American Economic Review 48, 261-297. Montgomery, R. (1996), Disciplining or protecting the poor? Avoiding the social costs of peer
pressure in micro-credit schemes, Journal of International Development 8 (2), 289-305. Morduch, J., (2009) Borrowing to Save: Perspectives from Portfolios of the Poor, Financial
Access Initiative, December 2009. Morduch, J. (2005), Smart Subsidy for Sustainable Microfinance, Asian Development Bank -
Quarterly Newsletter of the Focal Point for Microfinance 6 (4). Morduch J. (2004), Microinsurance: the next revolution?, Oxford University Press, New
York. Morduch, J. (2000), The Microfinance Schism, World Development 28(4), 617-629. Morduch, J. (1999a), The Role of Subsidies in Microfinance: Evidence from The Grameen
Bank, Journal of Development Economics 60(1), 229–248. Morduch, J. (1999b), The Microfinance Promise, Journal of Economic Literature 37(4),
1.569–1.614. Morris, G. and Barnes, C. (2005), An Assessment of the Impact of Microfinance. A Case
Study from Uganda, Journal of Microfinance7 (1), 39-53. Moussa, M. (2007), Regulation and Supervision of Microfinance in Egypt, Essays on
Regulation and Supervision of Microfinance in Egypt 21. Myers, S. (1984), The capital structure puzzle, Journal of Finance 39, 575-92. Myers, S. (1977), Determinants of corporate borrowing, Journal of Financial Economics 5,
147-75. Navajas, S. and Gonzalez-Vega, C. (2003), Financiera Calpia in El Salvador: Innovative
Approaches to Rural Lending. In Promising Practices in Rural Finance, edited by Mark D.Wenner, Javier Alvarado, and Francisco Galarza.Washington, DC: Inter American Development Bank.
Navajas, S.; Schreiner, M.; Meyer, R.L.; Gonzalez-Vega, C. and Rodriguez-Meza, J. (1999), Microfinance and the Poorest of the Poor: Theory and Evidence From Bolivia”, World
Development 28(2), 333-346. Navaretti, B. G. and Castellani, D. (2004), Investments Abroad and Performance at Home:
Evidence from Italian Multinationals, CEPR Discussion Paper No. 4284. Nawaz, A. (2010), Issues in Subsidies and Sustainability of Microfinance: An Empirical
Investigation, Working paper 10/010, Solvay Brussels School of Economics and Management, Centre Emile Bernheim, Université Libre de Bruxelles.
Nugroho,Y and Miles, I. (2009), Mini Study 06- Microfinance and innovation: A Project for DG Enterprise and Industry, Global Review of Innovation, Intelligence and Policy
Studies.
157
Otero, M. (1989), A Handful of Rice: Savings Mobilization by Micro-Enterprise Programs and Perspectives for their Future, Accion International Monograph Series No. 3, Washington, D.C: ACCION.
Paxton, J. (2007), Technical efficiency in a semi-formal financial sector: The case of Mexico, Oxford Bulletin of Economics and Statistics 69(1), 57-74.
Peachey, S. (2007), Microfinance Institutions and Financial Access: The Double Bottom Line,
Building Inclusive Financial Systems. A Framework for Financial Access, Brookings Institution Press.
Pfeffer, J. and Salancik, J. (1978), The external control of organizations, New York: Harper and Row.
Poursat, C. (2004), Micro-assurance santé et microfinance: quelques enseignements du programme pilote du GRET au Cambodge, Rapport 2003 du Centre Walras, Economica, Paris, 56-66.
Quayes, S. (2012), Depth of Outreach and Financial Sustainability of Microfinance Institutions, Applied Economics 44(26), 3421-3433.
Raynor, W. J. (1983), Caliper Pair-Matching on a Continuous Variable in Case Control Studies, Communications in Statistics: Theory and Methods 12(13), 1499-1509.
Robinson, M. (2004), Mobilizing Savings from the Public: Basic Principles and Practices, SPEED-USAID, Women’s World Banking.
Robinson, M. (2001), The microfinance revolution: Sustainable finance for the poor, The World Bank, Washington, DC.
Robinson, M. (1994), Savings Mobilization and Microenterprise Finance: The Indonesian Experience, in: M. Otero and E. Rhyne (eds), The New World of Microenterprise
Finance, pp. 27-54, West Hartford: Kumarian. Rosenbaum, P.R. and Rubin, D.B. (1985), Constructing a Control Group Using Multivariate
Matched Sampling Methods that Incorporate the Propensity Score, The American
Statistician 39, 33-38. Rosenberg, R. (2009), Measuring Results of Microfinance Institutions–Minimum Indicators
that Donors and Investors Should Track. Consultative Group to Assist the Poor (CGAP)/The World Bank, Washington DC, June.
Rossel-Cambier, K. (2012), Can Combined Microfinance Boost Economic Results? An Empirical Cross-sectional Analysis, Review of Economics & Finance, February 2012.
Rossel-Cambier, K. (2010), Do Multiple Financial Services Enhance the Poverty Outreach of Microfinance Institutions? CEB Working Paper N° 10/058 2010.
Rothschild, M. and Stiglitz, J. (1976), Equilibrium in competitive insurance markets: An essay on the economics of imperfect information, Quarterly Journal of Economics 90, 629–649.
Sarkisyan A., Casu B., Clare A.D.,Thomas S.H. (2009), Securitization and Bank Performance, WP-CBR-04-2009, Centre for Banking Research Working Papers, Cass Business School, City University London.
Schicks, J. (2007), Developmental Impact and Coexistence of Sustainable and Charitable Microfinance Institutions: Analysing BancoSol and Grameen Bank." European Journal
of Development Research 19(4), 551-568. Schmidt, R.H. and Zeitinger, C.-P. (1997), Critical Issues in Microbusiness Finance and the
Role of Donors, Disc. Paper No. 6. Schmidt, R.H. and Zeitinger, C.-P. (1996), Prospects, Problems and Potential of Credit-
Granting NGOs, Journal of International Development 8(2), 241-258.
158
Schreiner, M. (2002), Aspects of Outreach: A Framework for the Discussion of the Social Benefits of Microfinance, Journal of International Development 14, 591–603.
Schreiner, M. (2001), Seven aspects of loan size, Journal of Microfinance 3, 27-47. Sen, A. (2000), Development as Freedom, Anchor Books, New York, 366 pages. Shaw, Edward S. (1973), Financial Deepening in Economic Development, New York: Oxford
University Press. Sheremenko, J., Escalante, C.A. and Florkowski, W.J. (2012), The Road to Financial
Sustainability. Comparative Analysis of Russia and the Caucasus Region, Southern Agricultural Economics Association Annual Meeting, Birmingham, AL, February 4-7, 2012.
Sherraden, M.; Schreiner, M.; Beverly, S. (2003), Income, Institutions, and Saving Performance in Individual Development Accounts, Economic Development Quarterly 17 (1), 95-112.
Sinha, F. (2006), Social Rating and Social Performance: Reporting in Microfinance, Towards a Common Framework, The SEEP Network for the Argidius Foundation.
Smith, J.A., and Todd, P.E. (2005), Does Matching Overcome LaLonde's Critique of Non-experimental Estimators? Journal of Econometrics 125, 305-353.
Ssewamala, F. M.; Sherraden, M. (2004), Integrating Saving into Microenterprise Programs for the Poor: Do Institutions Matter? Social Service Review September 78 (3), 404-428.
Stiglitz, Joseph (1990), Peer Monitoring in Credit Markets, World Bank Economic Review, No.4, pp.351-366.
Stiglitz, Joseph and Andrew Weiss (1981), Credit Rationing in Markets with Imperfect Information, The American Economic Review 71(3), 393-410.
Stiglitz, Joseph and Andrew Weiss (1983), Incentive Effects of Terminations: Applications to the Credit and Labor Markets, American Economic Review 73(5), 912-927.
Tedeschi, G. A. (2006), Here today, gone tomorrow: Can dynamic incentives make microfinance more flexible? Journal of Development Economics 80, 84– 105;
Tucker, M. (2001), Financial performance of selected microfinance institutions: Benchmarking progress to sustainability, Journal of Microfinance 3, 107-123.
UNDP (2009), Human Development Report. Overcoming barriers: Human mobility and development.
Van Tassel, E. (1999), Group lending under asymmetric information, Journal of Development
Economics 60, 3–25. Varian, H. (1990), Monitoring agents with other agents, Journal of Institutional and
Theoretical Economics 146, 153-174. Vigenina, D., Kritikos A.S. (2004), The individual micro-lending contract: Is it a better design
than joint-liability? Evidence from Georgia, Economic Systems 28 (2), Special Issue June, 155-76.
Villalonga, B. (2004), Does Diversification Cause the "Diversification Discount"? Financial Management 33, 5-27.
Vogel, R. C. (1984), Savings mobilization: the forgotten half of rural finance. In D. W Adams, D. H. Graham, and J. D. Von Pischke (Eds.), Undermining rural development with cheap credit (pp. 248–265). Boulder, CO: Westview Press 1994.
Williams, J. (1987), Perquisites, risk, and capital structure, Journal of Finance 42, 29-49. Wisniwski, S. (1999), Microsavings Compared to Other Sources of Funds, CGAP and GTZ,
CGAP Working Group on Savings Mobilization. Wisniwski, S. (1998), Savings in the Context of Microfinance – Lessons Learned from Six
Deposit-Taking Institutions, Interamerican Forum on Microenterprise, 26-28 March 1998, Mexico.
159
Wright, G. A. N. (2003), Designing Savings Services for the Poor. Prepared for the Micro
Banking Bulletin, MicroSave. Wydick, B. (2001), Group lending under dynamic incentives as a borrower discipline device,
Review of Development Economics 5(3), 406–20 Yaron, J., McDonald B. and Piprek, G. (1997), Rural Finance: Issues, Design, and Best
Practices, second edition, Washington, D.C.: Agriculture and Natural Resources Department, World Bank.
Yaron, J. (1992), Assessing development finance institutions: a public interest analysis, World
Bank Discussion Paper 174, Washington, DC. Zeller, M., Lapenu, C., Greeley, M. (2003), Measuring social performance of microfinance
institutions: A proposal. Social Performance Indicators Initiative (SPI) - Final Report, Argidius Foundation and Consultative Group to Assist the Poorest (CGAP).
Zeller, M. and Sharma, M. (2000), Many borrow, more save, and all insure: Implications for food and micro-finance policy, Food Policy 25, 143–167.
160
TABLE OF CONTENTS
DEDICATION ......................................................................................................................... ii
ACKNOWLEDGMENTS ........................................................................................................ iii
SUMMARY .............................................................................................................................. v
LIST OF TABLES AND APPENDICES ............................................................................... VI
LIST OF FIGURES ................................................................................................................. vii
INTRODUCTION (en Français) ............................................................................................... 8
INTRODUCTION (in English) ............................................................................................... 17
CHAPTER 1. COMPULSORY VERSUS VOLUNTARY SAVINGS AS INCENTIVE
MECHANISM IN MICROLENDING CONTRACTS ........................................................... 25
1.1. Introduction ................................................................................................................... 25
1.2. What are the existing methods offering? ...................................................................... 28
1.3. Emerging importance of microsavings ......................................................................... 36
1.4. The Model ..................................................................................................................... 41
1.4.1. Micro-entrepreneurs’ behaviors ............................................................................ 41
1.4.2. Microfinance Institution ......................................................................................... 43
1.4.3. Incentive mechanisms ............................................................................................ 45
1.5. Financial equilibrium contracts with compulsory savings ............................................ 48
1.6. Financial equilibrium contracts with compulsory and voluntary savings .................... 49
1.6.1. Structure of the contracts ....................................................................................... 51
1.6.2. Financial equilibrium contracts with compulsory and voluntary savings ............ 52
1.7. Concluding remarks ...................................................................................................... 54
Appendices of Chapter 1 ..................................................................................................... 57
CHAPTER 2. EFFICIENCY AND OUTREACH OF MICROFINANCE INSTITUTIONS:
DOES SERVICE DIVERSIFICATION MATTER? .............................................................. 67
2.1. Introduction ................................................................................................................... 68
2.2. Relevant theoretical underpinnings .............................................................................. 73
2.3. The role of service diversification in the MFI performance ......................................... 77
2.4. Method: Propensity score matching approach ............................................................... 79
2.5. Data ............................................................................................................................... 88
161
2.6. Propensity score matching analysis .............................................................................. 96
2.7. Conclusion .................................................................................................................. 103
Appendices of Chapter 2 ................................................................................................... 105
CHAPTER 3. PERFORMANCE AND CAPITAL STRUCTURE OF MICROFINANCE
INSTITUTIONS IN EASTERN EUROPE AND CENTRAL ASIA ................................... 109
3.1. Introduction ................................................................................................................. 109
3.2. Theoretical considerations: Capital structure theories and MFI performance ............. 111
3.2.1. The literature on capital structure ........................................................................ 111
3.2.2 Aspects of MFI performance ................................................................................. 114
3.2.3. Evolution and types of MFI financing ................................................................. 116
3.3. Method ....................................................................................................................... 122
3.4. Data ............................................................................................................................ 128
3.5. Results ....................................................................................................................... 130
3.5.1. Robustness check ................................................................................................. 134
3.5.2. MFI status ............................................................................................................ 136
3.6. Conclusions ............................................................................................................... 138
Appendices of Chapter 3 ................................................................................................... 140
CONCLUSION ..................................................................................................................... 143
BIBLIOGRAPHY ................................................................................................................. 151
TABLE OF CONTENTS ...................................................................................................... 160