the quest for well-being in growth industries 2: the survey
TRANSCRIPT
MEDDELANDEN FRÅN SVENSKA HANDELSHÖGSKOLAN
HANKEN SCHOOL OF ECONOMICS
WORKING PAPERS
558
Teemu Tallberg, Jeff Hearn, Charlotta Niemistö,
Pernilla Gripenberg, Marjut Jyrkinen and Linda McKie
The Quest for Well-being in Growth Industries 2: The Survey
2011

The Quest for Well-being in Growth Industries 2: The Survey Key words: care, companies, employing organisations, growth sectors, human resources
management (HRM), organisations, organisation carescapes, survey, well-being, work
© Hanken School of Economics and the authors Distributor: Library Hanken School of Economics P.O.Box 479 00101 Helsinki Finland Phone: +358 (0)40 3521 376, +358 (0)40 3521 265 Fax: +358 (0)9 431 33 425 E-mail: [email protected] http://www.hanken.fi/public Helsinki 2011 ISBN 978-952-232-140-4 ISSN 0357-4598

1
The Quest for Well-being in Growth Industries 2:
The Survey
Teemu Tallberg, Jeff Hearn, Charlotta Niemistö,
Pernilla Gripenberg, Marjut Jyrkinen and Linda McKie
Abstract:
This working paper reports the ongoing research conducted in the research project, The
Quest for Well-being in Growth Industries: A Collaborative Study in Finland and Scotland,
under the auspices of Academy of Finland research programme, The Future of Work and
Well-being. The research project examines the contradictory pressures for policies and
practices towards both the inhibition and the enhancement of work-related well-being that
are likely in growth industries. The overall aim is to evaluate the development,
implementation and use of work-related well-being policies in four selected growth
industries. These – electronics, care, finance and accounting, and tourism – have been
selected on the basis of EU and national forecasts, and demographic and socio-economic
trends in standard and non-standard employment. In this paper we aim to review the survey
that constitutes the second main phase of this research.
Keywords: care, companies, employing organisations, growth sectors, human resources
management (HRM), organisations, organisation carescapes, survey, well-being, work

2
CONTENTS
1. Introduction .............................................................................................................. 4
1.1. Transformations in the spheres of work and life ..................................................... 5
1.2. Researching well-being and work .............................................................................. 7
2. Survey design ............................................................................................................ 9
2.1. Sampling ......................................................................................................................... 9
2.2. Data collection ............................................................................................................. 10
3. Initial results of the survey ...................................................................................... 11
3.1. Survey participants ...................................................................................................... 11
3.2. Growth and expectations ........................................................................................... 13
3.3. Personnel and working arrangements .................................................................... 15
3.4. Policies and practices of well-being ......................................................................... 17
3.5. Regression models, questions and explanations ................................................... 23
4. Concluding issues ................................................................................................... 26
4.1 Summary of findings .................................................................................................. 26
4.2. Portraits of practice ....................................................................................................... 28
Bibliography……………………………………………………………………………………………………..29
APPENDIX 1: TOL codings used in the sampling………………………………………………………………32
APPENDIX 2: The survey questionnaire in Finnish……………………………………………………….....35
APPENDIX 3: The survey questionnaire in English…………………………………………………………..40
APPENDIX 4: Tables on questions 31 and 33……………………………………………………………………45
APPENDIX 5: Summary information to the respondents of the survey……………………………….47

3
LIST OF TABLES
Table 1: The survey sampling frame .............................................................................................. 9
Table 2: Organisations participating the survey by size and sector ............................................ 12
Table 3: Survey respondents by their position within their organisation .................................. 12
Table 4: Growth and growth expectations in terms of turnover and the number of employees.13
Table 5: Considering own sector as a growth sector (Q 10) ........................................................ 14
Table 6: Growth in the organisation during the last five years by sector (Q 7) .......................... 14
Table 7: Expecting growth in the organisation during the next five years (Q 8) ........................ 15
Table 8: Distribution of the organisations according to gender balance .................................... 16
Table 9: Use of flexible working arrangements ........................................................................... 16
Table 10: Personnel policies and practices in order of importance (Q 24) ................................ 19
Table 11: Well-being activity (Q 24) by size and by sector .......................................................... 20
Table 12: Services and benefits offered by the employing organisation in order of importance
(Q 29) ............................................................................................................................................ 21
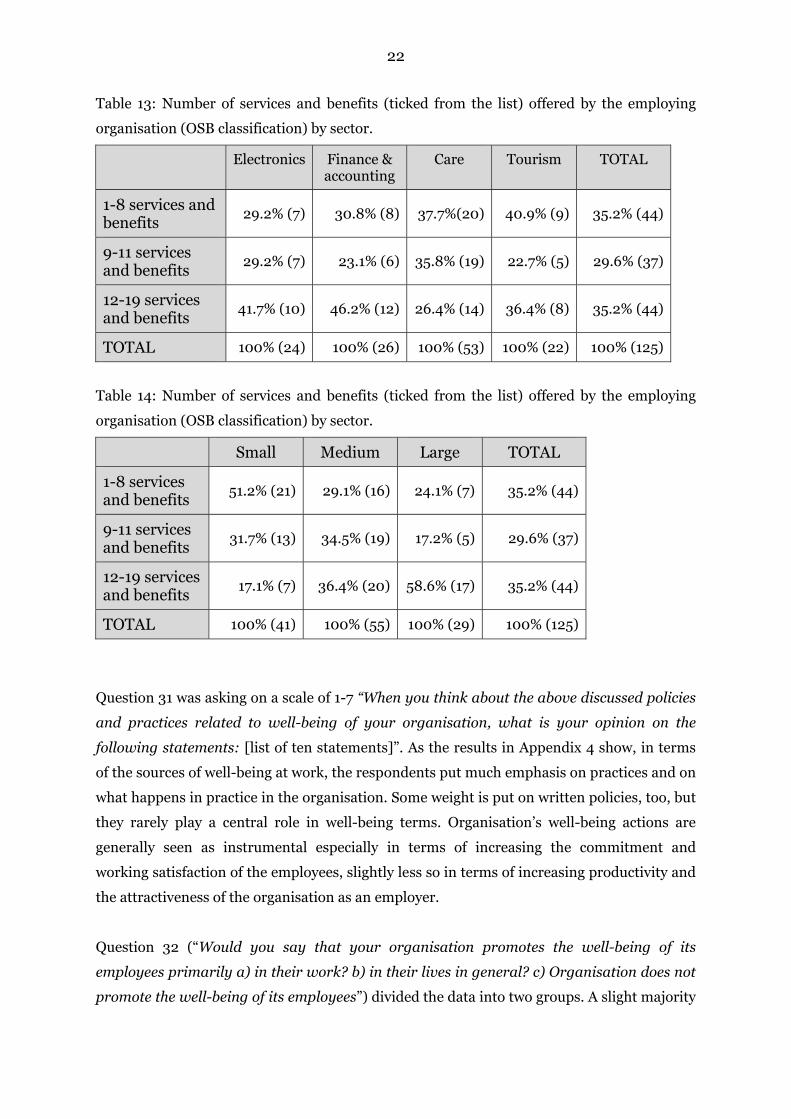
Table 13: Number of services and benefits (ticked from the list) offered by the employing
organisation (OSB classification) by sector. ................................................................................ 22
Table 14: Number of services and benefits (ticked from the list) offered by the employing
organisation (OSB classification) by sector. ................................................................................ 22
Table 15: The regression model .................................................................................................... 25

4
1. INTRODUCTION
Research project The Quest for Well-being in Growth Industries: A Collaborative Study in
Finland and Scotland, under the auspices of the Academy of Finland research programme,
The Future of Work and Well-being. It aims to study work-related well-being policies in
selected growth sectors. The Academy of Finland programme, The Future of Work and Well-
being, comprises six research consortia and 15 research projects in universities and research
institutions around Finland. The projects of this cross-disciplinary programme cover a wide
variety of research topics in this field, drawing on inter alia economics, law, occupational
health, political science, psychology, public health, social psychology, sociology, as well as
studies of work, organisations and management. The original application for this project was
made to the research co-operation between the Academy of Finland and Economic and
Social Research Council (UK). The stated goal of the original call, targeted at Finnish and UK
research collaboration, was to ‘explore the relationship between work and well-being, and to
open up new research frontiers with a view to meeting future challenges’.
The research project examines the contradictory pressures for policies and practices towards
both the inhibition and the enhancement of work-related well-being that are likely in growth
industries. The overall aim is to evaluate the development, implementation and use of work-
related well-being policies in four selected growth industries. These – electronics, care,
finance and accounting, and tourism – have been selected on the basis of EU and national
forecasts, and demographic and socio-economic trends in standard and non-standard
employment. This collaborative project provides national and transnational data, analysis
and outputs. The study is being conducted in Finland, Department of Management and
Organisation, Hanken (www.hanken.fi), with collaboration with researchers in Scotland/UK,
led by School of Law and Social Sciences, Glasgow Caledonian University (www.gcal.ac.uk),
with East London, Heriot-Watt and Reading Universities.1 2
The objectives and methods of the project are as follows:
1. To provide a systematic mapping and situational analysis of work-related legislation
and policies for well-being in Finland.
1 Hanken, Finland: Professor Jeff Hearn ([email protected]), Project leader, Researchers: Dr Teemu Tallberg (currently Helsinki University), Dr Hertta Niemi (currently Gemic Oy), Charlotta Niemistö. Associated researchers: Dr Pernilla Gripenberg, Dr Marjut Jyrkinen. Scotland/UK: Professor Linda McKie ([email protected]), Glasgow Caledonian University, Dr Andrew Smith, University of East London, Professor Gill Hogg, Heriot-Watt University, Dr Sophie Bowlby, Reading University. 2 We are grateful to all the research participants for their cooperation, and to Karl-Erik Sveiby for constructive comments on an earlier version of this working paper.
5
2. To identify which policies are in place, are being used, monitored and evaluated, in
the selected growth sectors of care services, electronics, finance and accounting, and
tourism.
3. To examine the interactions between work-related well-being policies, practices and
cultures.
4. To identify the opportunities (enhancements) and barriers (inhibitions) to the
development of well-being policies and practices both formally and informally in the
selected industries.
5. To examine how gender and other forms of social differentiation, such as age and
including forms of employment (non-standard and standard), affect competitive
advantage and well-being.
6. To examine how transnational processes and structures affect the operation of
growth industries and work-related, well-being policies.
In particular, the project draws on earlier work on organisation carescapes (McKie et al.,
2009b, 2009c) and more specifically on the conceptual and empirical background to the
current research project (Hearn et al., 2009). The aim of this current paper is to review the
survey that constitutes the second main phase of this research.
1.1. Transformations in the spheres of work and life
A number of recent studies gave drawn attention to the interrelationships of work, well-
being and lifestyle across Europe. These include:
• Rotating module included in the European Social Survey 2004 on Family, Work and
Wellbeing
• European Foundation for the Improvement of Living & Working Conditions
(Eurofound):
o Results of the 4th European Working Conditions Survey undertaken in 2005
o Working Time and Work-life Balance in European Companies undertaken in
2004/5
• ESRC funded research
o Understanding Trends in Job Satisfaction (Green, 2005; R000220279)
o Employment and the Family (Crompton, 2005; R000239727)
Across all of these studies a range of trends and issues can be identified. Workers in Europe
tend to be relatively satisfied with many aspects of their home and working lives. Those
working regular and predictable schedules perceive work-life balance most positively. There
6
are, however, tensions. Stresses can be caused by the pace and nature of growth and change.
Conflicts among colleagues and with customers or clients may also cause stress.
Uncertainties in corporate and public sector finances and downward economic trends also
cause strains. Information technologies were the main factor in the changing nature of job
content. Less change was evident in the gendered nature of work and work-life. Women
working full time, and part-time, were more likely to report problems in combing caring and
working than male counterparts. Regardless of gender and age, workers value scope for
personal initiative, remain concerned about long hours, as well as job security and future
incomes. A growing number of workers will traverse paths that shift across security and
insecurity, as they are encouraged to be flexible. It is in this context that the notion of
‘flexicurity’, combining flexibility in labour markets with social protection is promoted across
the EU (EU, 2006: 15).
Promoting and maintaining physical and psychological health is critical to ensuring well-
being and productivity. Respondents to the health and well-being survey undertaken by
Eurofound (2007) reported musculoskeletal problems (25%), psychosocial stresses (22%)
and the experience or fear of harassment and violence (15%). Reasons for health-related
problems at work included the changing nature of work, exposure to risk factors, repetitive
and stressful work, time pressures, intensification and increased multi-skilling. Further,
gender equality and diversity in work organisations remains a complex arena with attitudes
and practices seemingly entrenched (see www.monikko.net).
In noting the transformations of work and home life Glucksmann’s (2005: 20) concept of the
Total Social Organisation of Labour (TSOL) offers a useful framework. TSOL affords equal
significance to developments in ‘non-market and unpaid work, including proliferation of the
modes and extent of care work, the growth of voluntary or community work in the public
domain, and shifts in both directions across the commodity / non commodity divide.’ In this
project we also draw upon on-going empirical and conceptual work on work-life balance
(McKie et al., 2007) and care in and around organisations (McKie et al., 2009a, 2009b).
Aspects of care and well-being can be found in a range of statutory duties, policies and
related activities, including: health and safety, equality and diversity, maternity and parental
leave, religious observance, bullying and harassment, personal development, voluntary
redundancy, early retirement, employer pension schemes, grievance procedures, and
dismissal. Care is, however, intrinsic to well-being. The term, well-being, affords a broader
conceptual base and one that, while too often associated with health, builds upon ongoing
EU surveys and work.

7
1.2. Researching well-being and work
A comprehensive transdisciplinary review of published work on the concept of well-being
(Cronin de Chavez et al., 2005) examined definitions used in psychology, health studies,
sociology and anthropology, economics and multidisciplinary projects. The authors of that
paper (ibid.: 81) concluded that well-being is a ‘multifaceted concept which requires clearer
definition and agreement among both researchers and practitioners.’ Given that the concept
often appears ‘all-encompassing may well be its strength and its strategic attraction’ (ibid.).
Certainly it is a term that offers breadth, but used unreflectively can mask potential
misunderstandings, such as assuming a monolithic view of ‘well-being’, avoiding attention to
social divisions within organisations (such as gender and class), or neglecting issues beyond
the organisation (either in people’s home life or structurally in society).
The changing demographic profile of the EU has major implications for work and well-being.
This, and the issues cited above are of major concern to the European Commission and
Parliament. Businesses and organisations are grappling with a range of policies on these
matters. Employers associations and trade unions are also exploring the transformations of
work. In addition, a number of companies have emerged that offer practical HR and legal
advice, lobby governments and the EU and undertake research on these matters (see, for
example, www.eff.org.uk).
In our own research we seek to explore ways to examine well-being in which we can
‘operationalise’ the concept across all levels and sectors. Well-being in the original
programme call for proposals was defined in terms of needs or resources, to influence and
participate, in working life. The focus is upon the employee and employees more collectively,
and the opportunities or challenges, posed by frameworks of employment and the balance
between work and other spheres of life. Policies and practices in the workplace are, therefore,
critical. Thus the conceptual basis to our research design requires research methods across a
range of levels, namely:
• the health and well-being of employees, involving: health and safety legislation,
bullying and harassment policies, grievance procedures, sickness absence and
policies on stress;
• equality and diversity issues, encompassing: parental leave, sexual orientation,
ethnic and race relations, disability and age discrimination, and religious observance;
and

8
• responsibilities and rights, including: training, professional development and life-
long learning, flexibility and security (along with the notion of ‘flexicurity’),
redundancy, employer pension schemes and retirement.
Further, and as developed in the previous UK research (McKie et al., 2009c), we seek to
develop analysis that can encompass and move across and between the following:
• Formal ‘well-being’ policies: These may be defined as courses of action adopted in a
written format on the range of areas in which well-being may be relevant. How does
the adoption and form of such policies link to regulation by national and
supranational governments and pressures from professional associations, trade
unions and the labour market?
• The implementation of policies and practices of well-being: This would include, if
applicable, human resource managers or departments, and line managers.
• Experiences of well-being policies: Firstly, within companies. How have policies and
practices evolved? Who uses such policies? How, when and why? How far do
practices match policies? Who holds discretion and how do they make decisions on
accessing aspects of policies that are not statutory? Secondly, how do these practices
link to wider cultures of well-being outside the workplace?
• Well-being cultures in and around work organisations: What are the cultures of
well-being in work organisations? In what ways do these cultures evolve, develop and
transform over time? What impact do these have on working relations, employer-
employee attitudes towards the company, job security and well-being?
• Relations between well-being inside and outside organisations: How do formal well-
being policies, their implementation, and well-being cultures in organisations affect
and interlink with the experiences of well-being inside and outside organisations?
Thus we see ‘well-being’ as a multi-faceted and open ended conceptual frame for studying
organisations that incorporates the often neglected questions of care within and around
organisations. Accordingly, our approach is a multi-method one combining quantitative and
qualitative methods. This approach is highly appropriate to the researching of policies and
practices (Bryman, 2006). The project includes a survey of employers’ policies and practices,
and the employment of a range of qualitative methods through what we define as ‘portraits
of practice’. Mindful of the need to assess and enhance quality means addressing ‘traditional’
notions of internal validity and triangulation (Seale, 1999; Tashakkori and Teddlie, 2003).
First, we introduce the phases in the research plan, before going into more detail on the
implementation of the survey.

9
2. SURVEY DESIGN
The aim of the survey was to gather information on the policies and practices relevant to the
well-being of employing organisations in the four identified ‘growth industries’.
2.1. Sampling
Given the relevance of the number of employees to the development, implementation, use
and evaluation of policies, and the existence of a Human Resources department or specialists,
the sample was drawn on the basis of size as well as sector. The goal was a survey of 100
completed questionnaires: 25 completed questionnaires from each sector and within that
biased to larger organisations, with 15 of the 25 from large and 5 from each of the micro and
medium sized companies. We have recognised that most workers in the EU are employed by
SMEs but also the crucial role that large companies play in economic growth and policy and
practice development in well-being / care and work. The inclusion of large and medium sized,
as well as the often ignored small companies, in the study brings different organisational
contexts of well-being policies and practices that have been relatively neglected in some
studies.
The survey sampling frame was as in the table below:
Table 1: The survey sampling frame
Industry Small (1-49
workers)
Medium (50-249 workers)
Large (over
250 workers)
Totals
Care agencies and services
5 5 15 25
Electronics 5 5 15 25
Finance and accounting
5 5 15 25
Tourism 5 5 15 25
TOTAL 20 20 60 100
Recruitment was proactive, and particular effort will be put into recruiting SMEs. Sampling
for the survey was done on basis of the four selected growth sectors. Using the Standard
Industrial Classification TOL 2002 (http://www.stat.fi/meta/luokitukset/toimiala/001-
2002/index_en.html) a list of codes covering the four sectors was compiled (see Appendix 1).
Organisations within these categories were searched from contact information database

10
Fonecta ProFinder B2B.3 In addition to the TOL classification, the number of employees was
used as a filter in order to balance the sample in terms of size of the organisations.
Additionally, organisations with less than 10 employees were excluded from the sample. On
basis of these searches, a database with the basic and contact information of 544
organisations was compiled. The database included: company name; sector (TOL
classification + possible details); company size; address; contact person; telephone; website
address; information source (mainly Fonecta ProFinder B2B).
Considerable effort was devoted to identifying a senior person in the company with
responsibilities for organisational policies and practices on well-being, including health and
safety, disciplinary actions, grievances, bullying and harassment, as well as the more obvious
policies on work-life reconciliation. In our experience a questionnaire sent to a specific
person is much more likely to be completed.
2.2. Data collection
In developing the survey, attention was given to comparative and cross-national issues.
Topics raised included the collation of basic characteristics of the company and staff
arrangements, and policies and practices with regard to:
• Equality and diversity
• Health and well-being
• Responsibilities and rights
• Policy development and implementation
• Who uses policies, when and why
• Monitoring and evaluation
The questionnaire “Työ ja hyvinvointi” (see Appendices 2 and 3) drew on previous
questionnaires from:
a. Scottish/UK team (UK Research Council [ESRC] study “Policies and practices of
work-related well-being”) (McKie et al., 2009c);
b. previous Academy-funded research on gender policies in 100 largest companies in
Finland (Hanken) (Hearn et al., 2002);
3 Fonecta ProFinder B2B (http://www.profinderb2b.fi/) is a search engine and a database mainly for sales and marketing purposes. It includes, among other things, contact information of companies and their decision makers, as well as financial figures, and a business life cycle (BLC) description.

11
c. STAKES project (“Perhevapaat ja työelämän tasa-arvo”) on practices of work and
family reconciliation in companies (Salmi et al., 2009);
d. Hanken TEKES project (“The Role of Boards and Management Teams in
Maximizing Value Creation and Innovation”), revised in the light of this project’s
aims (http://www.hanken.fi/public/en/valuecreatingboard).
After developing the questionnaire through many drafts, piloting was carried out. At this
point the questionnaire already existed online. Volunteers for the piloting were sought for
through a letter to around 2 000 alumnae of the Hanken School of Economics. Despite the
relatively few responses from this overture, the pilots proved extremely helpful in refining
the survey. Indeed one might note that a small number of intensive ‘high quality’ pilots are
often more useful than a larger number of less intense pilots.
The survey was sent out to 540 organisations in June 2009. The internet-based
questionnaire was available in Finnish, but the informants were given the possibility to have
the questionnaire in English if they wished. Throughout the survey contacting (sending out
the survey and two reminders), email addresses bouncing back or otherwise found faulty
were replaced by new ones, either from the same organisation or by substituting the
organisation with a new one. The survey comprised open and closed questions, and analysis
has reflected the differing forms of data. Where appropriate analysis has been undertaken
using SPSS/PASW (closed questions and categorised data from open questions), and with
open questions extensive consideration has been given by the team to the categorisation of
data and subsequent handling.
3. INITIAL RESULTS OF THE SURVEY
3.1. Survey participants
The goal of the survey was to obtain 25 responses from each sector (n=100). The survey was
sent out on 21st May and 28th May 2009, with two reminders on 2nd June and 9th June. This
brought 107 positive responses, but with an uneven distribution, heavily concentrated on the
care sector. After this, employing organisations were contacted randomly (using random
numbers) among non-repliers from the data base. This brought 20 more positive responses.
Through these additional contacts a satisfactory dataset of 127 responses was reached,
comprising of 25 from electronics, 26 from finance and accounting, 53 from care, and 23
from tourism sector.

12
Table 2: Organisations participating the survey by size and sector
SECTOR SIZE
TOTAL4 SMALL MEDIUM LARGE
Electronics 4 11 8 23
Finance & Accounting 2 13 10 25
Care 22 21 9 52
Tourism 16 3 3 22
TOTAL 44 48 30 122
The care sector organisations could be assumed to be more willing or used to participate in
surveys of this kind, especially those addressing questions of well-being. In addition, some of
the employing organisations were public sector, third sector or partnership organisations
that may tend to respond more frequently to surveys. Still, the clearly higher response rate in
the care sector was a surprise to us. In terms of size, participation varied among the sectors:
in finance and accounting, as well as in electronics, the clear majority were large and
medium size organisations, whereas in tourism participants were mostly small, and in the
care sector small and medium sized organisations predominated. The majority (86.2%) of
the individuals responding to the survey had a managerial level position.
Table 3: Survey respondents by their position within their organisation
POSITION OF THE RESPONDENT IN THE ORGANISATION (N) %
Toimitusjohtaja (CEO / office/general manager) 35 29
Henkilöstöpäällikkö (HR manager) 20 16
Henkilöstöjohtaja (chief HR manager) 14 11
Talousjohtaja/päällikkö (finance manager) 6 5
Muu johtaja (other manager) 31 25
Henkilöstöassistentti (HR assistant) 7 6
Yrittäjä (entrepreneur) 6 5
Other5 4 3
TOTAL 123 100
4 Five of the organisations participating the survey did not report the number of their employees. 5 Other reported titles: esimies (superior), hallintosihteeri (administrative secretary), hallintovastaava (administrator), henkilöstöasiantuntija (personnel expert).

13
3.2. Growth and expectations
It is important to contextualise the survey and the time it took place. The survey was carried
out at a specific moment during a widespread economic downturn. Here the question of the
multi-layered economic context can only be touched upon and the effects on the responses
reflected on. We had extensive discussions in the research team on whether the ‘growth
industry’ orientation should be rethought and reconceptualised. In the event we decided to
maintain the initial plan to focus on ‘growth industries’ and the relations of ‘growth’ and
‘well-being’. To a large extent this decision was vindicated by the pattern of responses where
we saw high levels of reporting of past and expected growth (see Table 4).
Table 4: Growth and growth expectations in terms of turnover and the number of employees.
Has your organisation grown during the last five years in terms of
Do you expect your organisation to grow in the next five years?
Do you consider your sector a growth sector?
turnover? employees?
YES 78% (94) 72% (87) 69% (83) 78% (96)
NO 20% (24) 27% (32) 17% (20) 13% (16)
Don’t know
2% (2) 1% (1) 14% (17) 9% (11)
Thus, most of the organisations that participated the survey have experienced growth within
the last five years, are expecting growth years, and consider their sector a growth sector.
There are significant correlations between growth during the past five years and growth
expectations. There is an even stronger correlation between past growth in terms of turnover
and in terms of number of employees. Moreover, it is likely that the data is skewed towards
over-representation of employing organisations in terms of both growth and amount of well-
being policies and practices. While this means that no or few claims of representativeness
can be made, for our purposes, with our specific research questions regarding the inhibition
and enhancement of well-being, this is not disadvantageous.
The proportions and numbers of public and third sector organisations are small within the
data: 12% of the participant organisations are from the third sector (n=15), 11% from public
sector (n=14). Among these there is, still, a clear tendency concerning issues of growth
(questions 7 and 8, see Appendices 2 and 3). In private, public and third sector more than
two-thirds answered positively in questions concerning growth of turnover and number of
employees during the past five years. In the case of expected growth, public sector

14
organisations differ clearly in terms of poor expectations compared with the private and
third sector respondents that generally expect both turnover and employment growth.
In addition to the questions on turnover and employment growth, respondents were asked,
whether they consider their own sector a growth sector or not. In general, the survey
responses support the selection of the four sectors to represent growth industries.
Respondents mainly consider their own sector as a growth sector, most strongly in
electronics and care, less so in finance and accounting. These views can be considered
indicative, though the definition “own sector” was not pre-given: thus, when answering, the
respondents may have identified themselves somewhat differently in terms of their
understanding of their “own sector”.
Table 5: Considering own sector as a growth sector (Q 10)
Yes No Do not know TOTAL
Electronics 91.3% (21) 4.3% (1) 4.3% (1) 23
Finance & accounting 53.8% (14) 19.2% (5) 26.9% (7) 26
Care 86.5% (45) 9.6% (5) 3.8% (2) 52
Tourism 78.0% (16) 22.7% (5) 4.5% (1) 24
TOTAL 78.0% (96) 13.0% (16) 8.9% (11) 123
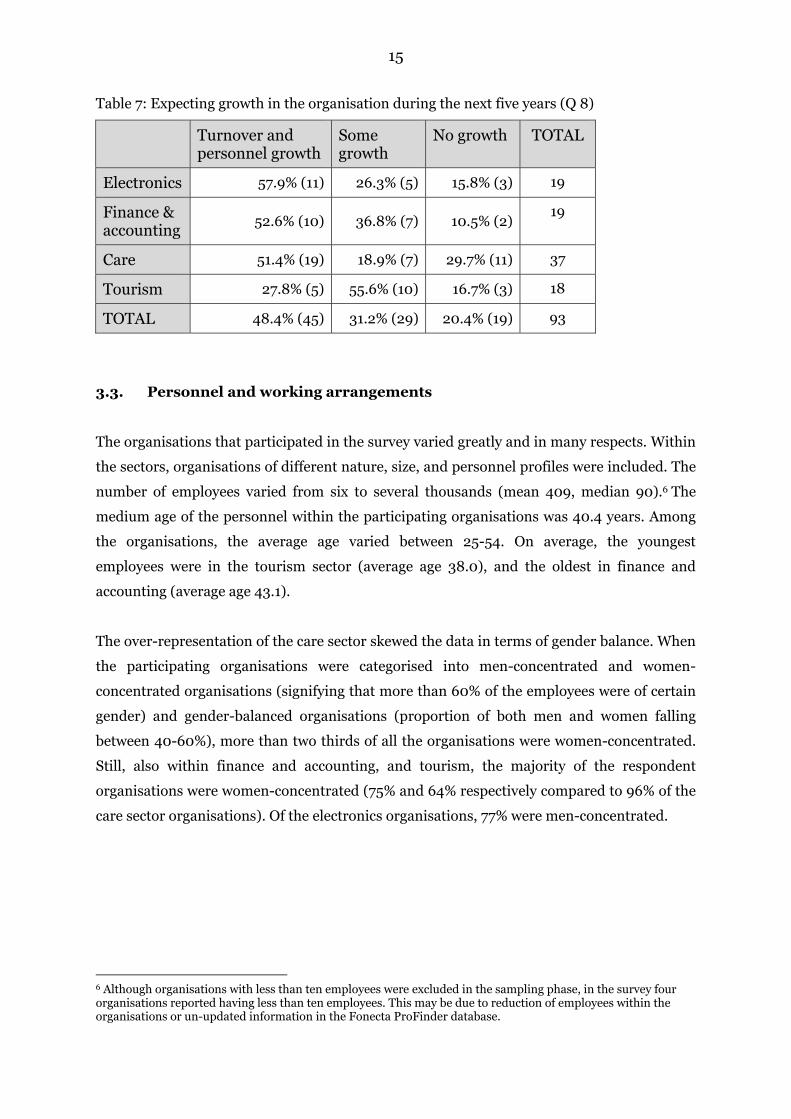
In terms of past growth, organisations in finance and accounting and care have been growing
most often: more than three out of four survey participants in those sectors had experienced
growth in terms of both turnover and the number of employees, respectively (Table 6). More
than half of the organisations within electronics, finance and accounting, and care were
expecting growth in terms of both turnover and number of employees (Table 7).
Table 6: Growth in the organisation during the last five years by sector (Q 7)
Turnover and personnel growth
Some growth
No growth TOTAL
Electronics 52.4% (11) 14.3% (3) 33.3% (7) 21
Finance & accounting
76.9% (20) 19.2% (5) 3.8% (1) 26
Care 76.6% (36) 17.0% (8) 6.4% (3) 47
Tourism 47.6% (10) 28.6% (6) 23.8% (5) 21
TOTAL 67.0% (77) 19.1% (22) 13.9% (16) 115
15
Table 7: Expecting growth in the organisation during the next five years (Q 8)
Turnover and personnel growth
Some growth
No growth TOTAL
Electronics 57.9% (11) 26.3% (5) 15.8% (3) 19
Finance & accounting
52.6% (10) 36.8% (7) 10.5% (2)19
Care 51.4% (19) 18.9% (7) 29.7% (11) 37
Tourism 27.8% (5) 55.6% (10) 16.7% (3) 18
TOTAL 48.4% (45) 31.2% (29) 20.4% (19) 93
3.3. Personnel and working arrangements
The organisations that participated in the survey varied greatly and in many respects. Within
the sectors, organisations of different nature, size, and personnel profiles were included. The
number of employees varied from six to several thousands (mean 409, median 90).6 The
medium age of the personnel within the participating organisations was 40.4 years. Among
the organisations, the average age varied between 25-54. On average, the youngest
employees were in the tourism sector (average age 38.0), and the oldest in finance and
accounting (average age 43.1).
The over-representation of the care sector skewed the data in terms of gender balance. When
the participating organisations were categorised into men-concentrated and women-
concentrated organisations (signifying that more than 60% of the employees were of certain
gender) and gender-balanced organisations (proportion of both men and women falling
between 40-60%), more than two thirds of all the organisations were women-concentrated.
Still, also within finance and accounting, and tourism, the majority of the respondent
organisations were women-concentrated (75% and 64% respectively compared to 96% of the
care sector organisations). Of the electronics organisations, 77% were men-concentrated.
6 Although organisations with less than ten employees were excluded in the sampling phase, in the survey four organisations reported having less than ten employees. This may be due to reduction of employees within the organisations or un-updated information in the Fonecta ProFinder database.

16
Table 8: Distribution of the organisations according to gender balance
Men-
concentrated (>60%)
Gender-balanced
(60/40)
Women-concentrated
(>60%) TOTAL
Number of organisations
15% (18) 17% (20) 68% (80) 100% (118)
Distribution among the sectors
Electronics (17)
Tourism (1)
Tourism (7)
F&A (6)
Electronics (5)
Care (2)
Care (48)
F&A (18)
Tourism (14)
(118)
Almost half (46%) of the respondents reported that employees in their organisation work
mainly or only daytime. Every fifth reported that work in their organisation is mainly or only
done in shifts. Among the organisations in the study, working in shifts was heavily
concentrated on the care and tourism sectors.
Table 9: Use of flexible working arrangements
“Are the following used in your organisation?” (Q19)
YES NO I DO NOT
KNOW
Flexible working hours 84% 15% 1%
Part-time working 70% 29% 1%
Change of shift patterns by/among the employees
66% 30% 4%
Work a compressed working week/day 65% 34% 1%
“Vuorotteluvapaa”7 64% 32% 4%
Work only during school term-time or school holiday-time
52% 46% 2%
Seasonal work 30% 65% 5%
Homeworking / remote work 29% 69% 2%
Roughly speaking, the use of flexible working arrangements was similar among the
organisations in the study. The size of the organisation did not affect whether or not the
listed flexible modes of working (see Table 9 above) were used in practice. Only shift
changing and seasonal work correlated significantly with sector (0.01 level): The possibility
of changing shifts among the employees concentrated heavily in the care and tourism sectors;
7 “Job alternation leave is an arrangement whereby a full-time employee […] takes job alternation leave according to an agreement made with his or her employer. The employer hires a person registered as an unemployed job seeker […] as a substitute for the same period. The person hired as the job alternation substitute should primarily be a young person, a long-term unemployed or a person who has recently completed an academic or vocational degree.” http://www.tyj.fi/default.asp?id=129

17
only three out of 51 care organisations did not have this possibility. Seasonal work was
possible in two-thirds of the tourism organisations, whereas in the other sectors less than a
quarter of the organisations used seasonal work.
3.4. Well-being as organisational goal, policy and practice
In a listing of nine organisational goals (see Appendix 4, Table on question 33), the
respondents rated the well-being of their employees as the second most important goal, and
their sustainability as an employer third; only customer service surpassed these goals.
Growth of the organisation was generally seen as much less central a goal, as were other
more directly economic goals (market leadership, and return to shareholders). The centrality
of growth as an organisational goal correlated significantly with expectations of future
growth of the organisation in terms of turnover (.386**) and number of employees (.321**).
The question concerning return to shareholders can be seen as somewhat problematic as the
respondents of the questionnaire have not been asked whether or not the organisation
actually has shareholders. It seems that those respondents whose organisations do not have
shareholders have given the 'return to shareholders' as a goal mainly valued from 0 to 1.
Comparing attitudes concerning economic and other goals becomes rather more difficult
when excluding this problematic variable.
Answers to question 33 are based on the comparative judgements of the respondents
between different organisational goals. Can the views emphasising the well-being of
employees be biased thinking of the HR managers and other employees working on Human
Resource tasks? In order to see whether the position of the respondent plays a role in the
answers, the data was split into two: one including the responses of the HR personnel (n=50),
the other including non-HR respondents (n=73).
Comparing the means between the HR and the non-HR respondents shows that the
responses are very close to each other for all the other parts of question 33 – including the
centrality of employees' well-being – except for questions concerning market leadership and
the problematic return to shareholders: HR respondents see both of these economic goals as
more central goals in their organisations than do the non-HR respondents.
Concerning the formal well-being policies and the implementation of well-being policies and
practices, there were two main questions in the survey. Question 24 listed thirty areas of
policies and practices (such as retirement, mentoring, incentives, gender equality, and

18
occupational safety) asking whether or not there were personnel policies and practices
related to them in the organisation. The respondents were also asked to choose the five areas
they found most important. Question 29 presented a list of twenty-three services and
benefits (such as staff canteen, language training, rehabilitation, and company car), asking
which of them are provided to the employees by the employing organisation and, again,
which they find most important ones.
It is difficult to hypothesise to what extent existing national legislation regarding certain
areas of personnel policy has in the above listing reduced the importance assigned to some
policy areas. Still, there are areas of strong legislative guidance at both ends of the listing
(occupational health and safety versus parental leaves and discrimination). In addition, it is
hard to say to what extent the choice of the most important areas actually reflects the
understanding of the respondents concerning what ‘well-being’ is, rather than the
importance of the thematic areas in the opinion of respondents.
The listed personnel policy and practice areas can loosely be divided into three categories:
health and well-being, responsibilities and rights, and equality and diversity related issues
(Hearn et al., 2009; McKie et al., 2009c). As can be seen in Table 10, the most important
policies and practices concern health and employees’ rights rather than equality issues. The
same division into the three categories is, to some extent relevant in terms of the services
and benefits offered by the employing organisations (see Table 10). Still, no further analysis
has been carried out based on this categorisation in relation to, for example, sector or size of
the organisations.

19
Table 10: Personnel policies and practices in order of importance (Q 24)
HEALTH AND WELL-BEING
RESPONSIBILITIES AND RIGHTS
EQUALITY AND DIVERSITY
Occupational health
60* Personnel training 58General policy on equality and discrimination
20
Occupational safety
48 Incentives 46Absence for social reasons (sickness of dependents etc.)
7
Sickness absence
28 Working hours 41 Gender equality 7
Alcohol and drug misuse
23 Staff appraisal / personnel assessment
31 Motherhood leave 4
Bullying and harassment
16 Flexible working (flexible or shortened work time, part-time work)
26 Other parental leaves 4
Workplace violence
12 Holiday entitlement 14Racial and ethnic discrimination
3
Disciplinary procedures 9 Disability discrimination 2
Dismissal 5 Fatherhood leave 2
Redundancy 3 Religious observance 1
Mentoring 3 Age discrimination 0
Retirement 2
Sexual and gender orientation
0
Unionising 1
Grievance procedures 1 * Each figure refers to the number of organisations that considered the particular policy and practice area among the five most important ones within the listing.
On basis of question 24 concerning personnel policies and practices, a sum variable was
constructed to represent the level of ‘well-being activity’ of each organisation. On each policy
and practice area, one to two points were given for reporting of written policies and/or other
practices (maximum points being 60). For further analysis, the data was categorised in terms
of well-being activity into three groups of approximately the same size.

20
Table 11: Well-being activity (Q 24) by size and by sector
WELL-BEING ACTIVITY GROUP
SIZE SECTOR
Small Medium Large Electronics F&A Care Tourism
Most active 17% (7)
44% (21)
40% (12)
46% (10)
23% (6)
38% (20)
23% (5)
Mid-group 38% (16)
35% (17)
37% (11)
27% (6)
54% (14)
33% (17)
36% (8)
Least active 45% (19)
21% (10)
23% (7)
27% (6)
23% (6)
29% (15)
41% (9)
TOTAL 100% (42)
100% (48)
100% (30)
100% (22)
100% (26)
100% (52)
100% (22)
Large and medium sized organisations seem to be more active than small organisations in
terms of well-being policies and practices (Table 11). Yet, well-being activity does not
correlate significantly with neither sector or size, nor with gender balance of the organisation,
past growth, or expected growth. Organisations that are active in terms of well-being tend to
see their own sector as a growth sector more often than the less active ones
(correlation .203*). When analysing the existence of written policies and other practices
respectively, the larger the organisation the more written policies of well-being there tend to
be (correlation .322**).
An alternative way of looking at the well-being input of employing organisations is through
the different services and benefits they offer to their employees. The offered services and
benefits might as well be referred to as ‘well-being activity’ like the above discussed policies
and practices, and they partly overlap; existence of well-being policies and practices also
correlates strongly (.638**) with the number of offered services and benefits. Still, in this
paper these two groups of activities have only been looked at separately.8
8 Although both question 24 and question 29 were followed by questions concerning additional policies and practices or services and benefits (beyond the listed ones), in the analysis the reported additional activities have not been included (in terms of, for example, giving extra weighting).

21
Table 12: Services and benefits offered by the employing organisation in order of importance
(Q 29)
Occupational health service 69*Financial support for care of sick children
3
Gym or exercise facilities, exercise coupons
62 Pension/financial advice 2
Staff canteen 53 Free / supported holiday trips/accommodation
2
Promotion of life-long learning 45 Support for transport-to-work expenses
2
Health checks 42 Company car 2
Financial support for education/training
40 Pre-retirement courses 1
Work dress or equipment 22 Massage 1
Apprenticeships or support for young workers
21 Day-care / nursery access 1
Healthy lifestyle provision 19 Services / advice on care for other dependents
0
Company phone 14 Finnish language classes for migrant workers
0
Language training 9 Financial advice/support 0
Rehabilitation 9
*Each figure refers to the number of organisations that considered the particular policy and
practice theme among the five most important ones within the listing.
Very much like the policies and practices, neither does the number of offered services and
benefits correlate significantly with organisations’ sector, size, gender balance, past growth,
or expected growth. Again, organisations that offer more services and benefits see their own
sector as a growth sector more often than others (correlation .257**).
22
Table 13: Number of services and benefits (ticked from the list) offered by the employing
organisation (OSB classification) by sector.
Electronics Finance & accounting
Care Tourism TOTAL
1-8 services and benefits
29.2% (7) 30.8% (8) 37.7%(20) 40.9% (9) 35.2% (44)
9-11 services and benefits
29.2% (7) 23.1% (6) 35.8% (19) 22.7% (5) 29.6% (37)
12-19 services and benefits
41.7% (10) 46.2% (12) 26.4% (14) 36.4% (8) 35.2% (44)
TOTAL 100% (24) 100% (26) 100% (53) 100% (22) 100% (125)
Table 14: Number of services and benefits (ticked from the list) offered by the employing
organisation (OSB classification) by sector.
Small Medium Large TOTAL
1-8 services and benefits
51.2% (21) 29.1% (16) 24.1% (7) 35.2% (44)
9-11 services and benefits
31.7% (13) 34.5% (19) 17.2% (5) 29.6% (37)
12-19 services and benefits
17.1% (7) 36.4% (20) 58.6% (17) 35.2% (44)
TOTAL 100% (41) 100% (55) 100% (29) 100% (125)
Question 31 was asking on a scale of 1-7 “When you think about the above discussed policies
and practices related to well-being of your organisation, what is your opinion on the
following statements: [list of ten statements]”. As the results in Appendix 4 show, in terms
of the sources of well-being at work, the respondents put much emphasis on practices and on
what happens in practice in the organisation. Some weight is put on written policies, too, but
they rarely play a central role in well-being terms. Organisation’s well-being actions are
generally seen as instrumental especially in terms of increasing the commitment and
working satisfaction of the employees, slightly less so in terms of increasing productivity and
the attractiveness of the organisation as an employer.
Question 32 (“Would you say that your organisation promotes the well-being of its
employees primarily a) in their work? b) in their lives in general? c) Organisation does not
promote the well-being of its employees”) divided the data into two groups. A slight majority

23
connected the well-being efforts mainly with work (53%, n=66) while almost as many saw
the well-being promotion being more general (45%, n=56). There is a significant correlation
between different answers to this question and the number of services and benefits offered
by the organisation (Q 29). Organisations that have more services and benefits state they
promote well-being of their employees in their lives in general, not only in relation to work.
Only two respondents stated their organisation did not promote the well-being of its
employees at all.
The open question 35 concerning issues that were left undiscussed in the questionnaire
brought up some additional themes that are perhaps challenging to tackle in a survey and
worth paying attention in the later phases of the research project. The key themes that were
repeatedly brought up in the surprisingly large number of answers to this open-ended
question included the role of management and leadership (especially immediate superiors)
in well-being, and the employees’ own responsibility for well-being. Additionally, references
to “communality” and “work in itself” came up several times. These further comments seem
to emphasise the importance of the variety of social relations at the workplace, as well as the
meanings and meaningfulness of work. The central purpose of the following qualitative
phase of the research project is to study the relations between these and the existing (and
non-existing) policies and practices related to well-being.
A summary of the initial results from the survey was fed back to the respondent
organisations, before planning the next phase.
3.5. Regression models, questions and explanations
After learning which policies were available in the respondent organisations, the arising
question was, what issues might affect the amount of established policies, and would other
focus questions of our study have any correlation in this issue.
We divided the respondent companies in two equally large groups and defined them as the
group with more and the group with less well-being policies and practices (i.e. higher and
lower in terms of ‘well-being activity’). The choice of having only two groups was partly due
to the sample size and relatively few observations, and thus, the need to conduct a logistic
regression analysis, which required a binary variable.

24
Dependent variable
In this study we focus on one dependent variable: the activity in the diverse field of well-
being related policies and practices in the respondent organisations. The reason for choosing
this specific variable as the dependent variable in the analysis is: to see what kind of factors
correlate with the well-being activity in organisations, and if growth factors in turnover or
personnel and age-related factors among employees have any connection to the well-being
activities of organisations operating in different sectors.
Independent variables
Initially, altogether six characters were hypothesized as correlating with well-being activity.
The hypothesized characters were tested by using respective variables from the survey:
• the mean age of the employees in the organisation
• expected growth in the amount of personnel
• past growth in turnover in the respondent organisation
• proportion of men in the respondent organisation
• sector as one of four target sectors
• company size in absolute numbers of employees
Gender balance (measured here with the proportion of men in the respondent organisation)
can be relevant in relation to well-being activity since many flexibility-increasing policies are
introduced in the Anglophone world in order to increase the amount of female employees in
the organisation. This does, however, not seem to apply in the Finnish context (Niemistö
2011, forthcoming). In Finland, the dual breadwinner- and dual carer-model are widely
supported by both men and women (Lammi-Taskula 2007). The dual carer-model was
introduced already in the 1960s (Julkunen 1995). In practice, women have still remained the
primary carers: while experiencing inequalities in working life, women still seem to hold the
hegemonic power of motherhood in households (Lammi-Taskula 2007). This means that as
women still are seen as primary carers they also take most of the family leaves, which are
included in the well-being policies in our survey.
Company size was included as based on some previous research corporate policies increase
when the corporation grows in number of personnel (see e.g. Aycan 2005).
Results As the sample size was not very large, we recoded the control variable from three different
variables (measuring well-being policies, practices, and other well-being activity) into one
binary variable and, then, fed the hypothesized characters into a logistic regression model.
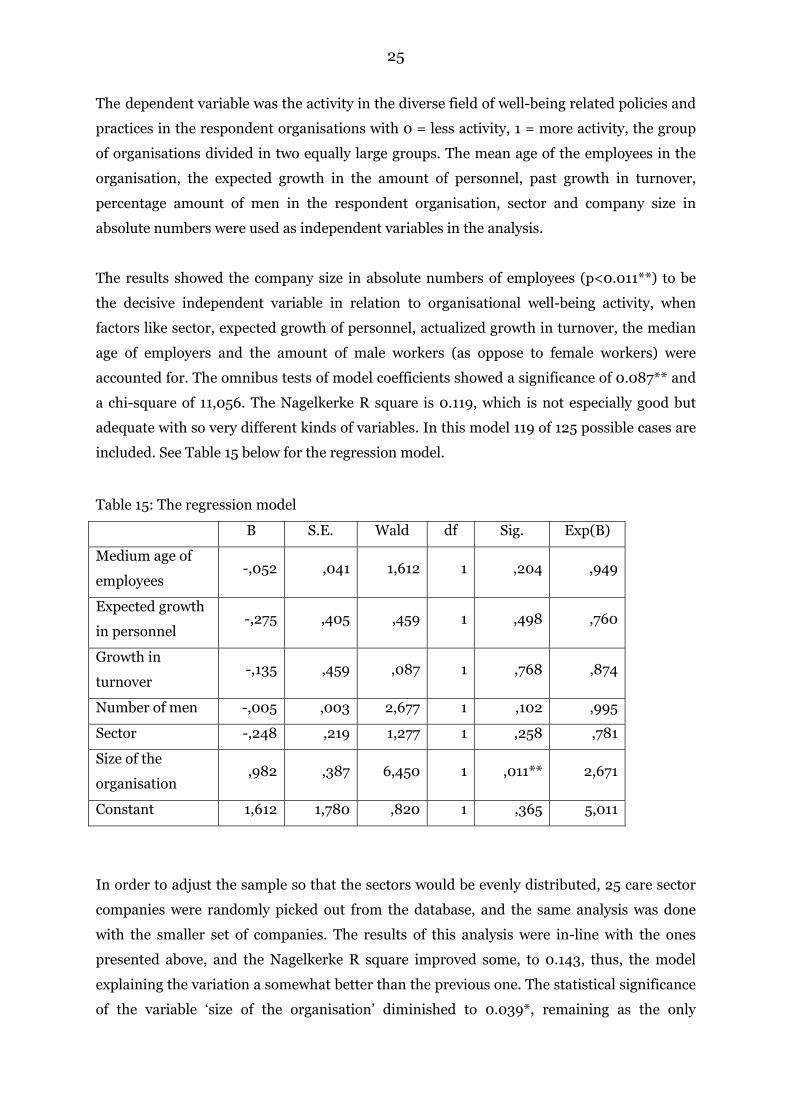
25
The dependent variable was the activity in the diverse field of well-being related policies and
practices in the respondent organisations with 0 = less activity, 1 = more activity, the group
of organisations divided in two equally large groups. The mean age of the employees in the
organisation, the expected growth in the amount of personnel, past growth in turnover,
percentage amount of men in the respondent organisation, sector and company size in
absolute numbers were used as independent variables in the analysis.
The results showed the company size in absolute numbers of employees (p<0.011**) to be
the decisive independent variable in relation to organisational well-being activity, when
factors like sector, expected growth of personnel, actualized growth in turnover, the median
age of employers and the amount of male workers (as oppose to female workers) were
accounted for. The omnibus tests of model coefficients showed a significance of 0.087** and
a chi-square of 11,056. The Nagelkerke R square is 0.119, which is not especially good but
adequate with so very different kinds of variables. In this model 119 of 125 possible cases are
included. See Table 15 below for the regression model.
Table 15: The regression model
B S.E. Wald df Sig. Exp(B)
Medium age of
employees -,052 ,041 1,612 1 ,204 ,949
Expected growth
in personnel -,275 ,405 ,459 1 ,498 ,760
Growth in
turnover -,135 ,459 ,087 1 ,768 ,874
Number of men -,005 ,003 2,677 1 ,102 ,995
Sector -,248 ,219 1,277 1 ,258 ,781
Size of the
organisation ,982 ,387 6,450 1 ,011** 2,671
Constant 1,612 1,780 ,820 1 ,365 5,011
In order to adjust the sample so that the sectors would be evenly distributed, 25 care sector
companies were randomly picked out from the database, and the same analysis was done
with the smaller set of companies. The results of this analysis were in-line with the ones
presented above, and the Nagelkerke R square improved some, to 0.143, thus, the model
explaining the variation a somewhat better than the previous one. The statistical significance
of the variable ‘size of the organisation’ diminished to 0.039*, remaining as the only
26
statistically significant result of the analysis. However, the mean age of the employees had a
t-value of 0.07, so in this adjusted model age would seem to gain in importance. This result
indicates that the mean age of the employees in the surveyed workplaces correlates
negatively with the well-being activity of the organisation: to put it simply, the higher the
mean age of employees, the lower the organisational well-being activity. We see this as a very
interesting finding.
While testing different models with numerous variables, almost none was found that would
show a statistical significance in relation to the well-being activities of organisations. Our
primary interest was to learn if economic growth or the age of employees would, in different
combinations, have any effect on the well-being activities of the organisations. Interestingly
enough, none of the numerous combinations with expected growth in personnel or turnover,
real growth in personnel or turnover, amount of temporary workforce, amount of foreign
workforce, sector, size of organisation, age of employees and amount of male workers
showed any significance until the above presented logistic regression, where the size of the
organisation actually seemed to play a significant role. To conclude, it can be stated that the
larger organisations are more active in their well-being policies, practices and other well-
being activities than the smaller organisations, regardless of the sector or other above tested
characteristics.
4. CONCLUDING ISSUES
4.1 Summary of findings
In this working paper we have reported the results of the second main phase of the Quest for
Well-being in Growth Industries project. There are a number of summary conclusions at this
stage. Some of these conclusions could be said to be negative, in the sense that they do not
show clear and consistent patterns and relationships across the four sectors. A number of
correlations that might be expected have not been found to be significant. This might well be
to do with the methodological limitations of survey method, as well as variations in the
understandings of “well-being”, despite our efforts to “translate” this into concrete policies
and practices, services and benefits.
Participation in the survey across the four sectors was uneven. The care sector proved to be
by far the most willing to participate in the survey. Although the extent of this was something
of surprise, it is perhaps less so when considering that the focus was on questions of well-

27
being. In this sector, some of the employing organisations were public sector, third sector or
partnership organisations that may tend respond more frequently to surveys. In terms of size,
participant organisations in the tourism sector were mostly small, and care sector
organisations were mostly small and medium sized, while in finance and accounting, and
electronics, the clear majority were large and medium size organisations. These variations in
size might have also influenced response rates in that respondents in smaller organisations
might have found completing the survey easier. The great majority of those responding to the
survey had a managerial level position.
Despite our concerns that “growth” might be an inappropriate focus in the light of the
changing economic situation, the respondents were generally growth-orientated, in terms of
both past and expected future performance. There was also significant correlation between
growth during the past five years and growth expectations, and an even stronger correlation
between past growth in terms of turnover and in terms of number of employees. It is likely
that there was skew towards employing organisations in terms of both growth and amount of
well-being policies and practices. However, for our purposes this is not necessarily
disadvantageous.
In terms of organisational goals, respondents rated well-being of their employees as the
second most important goal and their sustainability as an employer third, with customer
service the top choice. Paradoxically, growth of the organisation, along with other more
directly economic goals, was seen as much less central.
When we turn more specifically to policies and practices around “well-being”, the picture
becomes more complex. First, in terms of well-being, there is a strong tendency to focus on
policies and practices that are linked to health and rights, in their broadest senses, rather
than issues of equality. In developing a measure of “well-being activity” large and medium
sized organisations seemed to be more active than small organisations in terms of well-being
policies and practices. However, this was not borne out in terms of simple correlations: well-
being activity did not correlate with size, sector or indeed with gender balance of the
organisation, past growth, or expected growth. On the other hand, as regards the existence of
written policies and other practices respectively, the larger the organisation the more written
policies of well-being there tend to be. Moreover, in conducting the regression analyses none
of the numerous combinations showed significance until that where size of the organisation
seemed to play a significant role. Thus from this method the larger organisations are shown
as more active in their well-being policies, practices and other well-being activities than
smaller organisations, regardless of sector or other characteristics. Also, interestingly,
28
organisations that are active in terms of well-being tend to see their own sector as a growth
sector more often than those that are less active ones.
Many respondents emphasised the importance of organisational practices and what happens
in practice in the organisation, though some weight is put on written policies, even if they are
seen as rarely playing a central role in well-being. Organisation’s well-being actions are often
seen instrumental especially in increasing the commitment and working satisfaction of the
employees, slightly less so in terms of increasing productivity and the attractiveness of the
organisation as an employer.
In the open question answers, key themes repeatedly brought up by respondents included
the role of management and leadership, especially immediate superiors, in well-being, and
the employees’ own responsibility for well-being, as well as some references to
“communality” and “work in itself”. These seem to emphasise the importance of the variety
of social relations at the workplace, as well as the meanings and meaningfulness of work.
Thus while in larger organisations there tend to be more written policies relating to well-
being, the importance of practices in the organisations was clear. Though some weight is put
on written policies in the survey responses, these do not seem in themselves to be solely or
strictly determinant, and are rarely seen as central in constructions of well-being. In contrast,
respondents emphasised the role of management, immediate superiors and leadership, and
employees’ own responsibility for well-being, as well as referring to “communality” and
“work in itself”. These circumstances point to the importance of the social relations at the
workplace, at the immediate local and more corporate levels, and the meanings and
meaningfulness of work. Accordingly, a central purpose of the following phase of the
research project is to study the relations between these organisational social relations and
practices, and the existing (and non-existing) policies and practices related to well-being. In
the third main phase of the project we focus on practices and the everyday experiences of
work and well-being in selected employing organisations. These are to be researched through
the approach we have termed ‘portraits of practice’, which constitute the next phase of the
project.
4.2. Portraits of practice
The survey provides the sampling frame, in terms of variant employing organisations within
the four sectors, for the ‘portraits of practice’ that constitute the next phase of the project.
These ‘portraits of practice’ are detailed interpretative cases focussed on how the issues of

29
well-being and care are managed within different organisations (Hart et al., 2006). This type
of ‘case study’ goes beyond the illustrative by virtue of the researchers’ immersion in the
issues apparent in the organisation and is developed (in metaphorical terms in the same way
as an artist) by drawing upon the researchers pre-understanding of the conceptual and
regulatory context and the culture and climate of the organisation to develop a picture of the
application of theory in practice. Methods used include:
• Collation and analysis of relevant policies;
• Interviews with workers, managers, HR personnel, and senior company personnel;
• Field notes and observations undertaken before, during and after interviews
Analysis of such qualitative data is best seen as an iterative process, based upon a thematic
analysis of responses to open questions and verbatim transcripts, supported by the field
notes, observations and other data (Bowling, 1997). A future working paper will address the
results of the ‘portraits of practice’.
Bibliography
Aycan, Z. (2005): The interplay between cultural and institutional/structural contingencies in human resource management practices. International Journal of Human Resource Management, 16, 7, 1083-1119. Bowlby, S., McKie, L., Gregory, S. & MacPherson, I. (2010): Interdependency and Care Over
the Lifecourse. London: Routledge.
Bowling, A. (1997): Research Methods in Health. Buckingham: Open University Press. Bryman, A. (2006): Paradigm Peace and the Implications for Quality. International Journal of Social Research Methodology, 9, 2, 111-126. Crompton, R. (2005): Employment and the Family. End of Award Report. ESRC. R000239727. Cronin de Chavez, A., Backett-Milburn, K., Parry, O. & Platt, S. (2005): Understanding and Researching Wellbeing. Health Education Journal, 64, 1, 70-87 European Foundation for the Improvement in Living and Working Conditions (2007): Analysis of 4th European Working Conditions Survey. Dublin. EU (2006): Social Agenda. Brussels: Commission Directorate Employment & Social Affairs, 13. Glucksmann, M. (2006): Shifting Boundaries and Interconnections: Extending the ‘Total Social Organisation of Labour’, in J. Parry, R. Taylor, L. Pettinger & M. Glucksmann (eds.) A New Sociology of Work? Oxford: Blackwell (Sociological Review Monograph), pp. 19-36. Green, F. (2005): Understanding Trends in Job Satisfaction. End of Award Report. ESRC R000220279.
30
Hart, S., Hogg, G. & Tagg, S. (2007): Marketing Capability in Innovative Firms. Glasgow: Working Paper University of Strathclyde, Department of Marketing. Hearn, J., Kovalainen, A. & Tallberg, T. (2002): Gender Divisions and Gender Policies in Top Finnish Corporations. Helsinki: Swedish School of Economics and Business Administration.
Hearn, J., T. Tallberg, L. McKie, P. Gripenberg, M. Jyrkinen & C. Niemistö (2009): The Quest for Well-being in Growth Industries; Contexts, Research Design and Methodological Development. Hanken School of Economics, Working Paper Series 548. http://dhanken.shh.fi/dspace/bitstream/10227/501/1/548-978-952-232-074-2.pdf Julkunen, R. (1995): Työssäkäyvän äidin julkiset ja yksityiset suhteet. In Eräsaari L., Julkunen R. & Silius H. (eds): Naiset yksityisen ja julkisen rajalla. Vastapaino, Tampere. Lammi-Taskula J (2007): Parental leave for fathers? Gendered conceptions and practices in families with young children in Finland (Vanhempainvapaata isille? Sukupuolistuneet käsitykset ja käytännöt pikkulapsiperheissä Suomessa). Stakes Research Reports, Stakes, Helsinki 2007.
McKie, L., Airey, L., Hogg, G., Backett-Milburn, K. & Rew, Z. (2009a): Autonomy, Control and Job Advancement among Low Paid Women in Food Retail, Work, Employment and Society, 23, 4, 787-796.
McKie, L., Gregory, & S. Bowlby, S. (2002): Shadow Times: The Temporal and Spatial Frameworks and Experiences of Caring and Working. Sociology, 36, 4, 897-924.
McKie, L., Hearn, J., Bowlby, S., Hogg, G. & Smith, A. (2009b): Organisations Carescapes: Researching Organisations, Work and Care, Helsinki: Hanken School of Economics.
McKie, L., J. Hearn, S. Bowlby, P. Gripenberg, G. Hogg, M. Jyrkinen, C. Niemisto, A. Smith, & T. Tallberg (2010): Articulating Working and Caring over Time and Space, International Sociological Association Conference. Research Committee on Sociology of Work RC30. Gothenburg. July. McKie, L., Hogg, G., Bowlby, S. & Smith, A. (2009c): Organisation Carescapes: Policies & Practices of Care in Business Organisations. Final Report to ESRC. Glasgow: School of Law and Social sciences, Glasgow Caledonian University.
Malik, F., L. McKie, G. Hogg & R. Beattie (2010): A Toolkit to Support Human Resource Management, Personnel Review, 39, 2, 252-275. Niemistö, C. (2011, forthcoming): Work/family reconciliation: Corporate management, family policies, and gender equality in the Finnish context. Publications of the Hanken School of Economics.
Salmi, M., Lammi-Taskula, J. & Närvi, J. (2009): Perhevapaat ja työelämän tasa-arvo. Työ- ja elinkeinoministeriön julkaisuja: Työ ja yrittäjyys, 24/2009. Helsinki.
Seale, C. (1999): The Quality of Qualitative Research. London: Sage.
Smith, A. & L. McKie (2010): ‘Researching ‘care’ in and around the Workplace’, Sociological Research Online, 14, 4. <http://www.socresonline.org.uk/14/4/1.html>

31
Tashakkori, A. & Teddlie, C. (eds.) (2003): Handbook of Mixed Methods in Social and Behavioral Research. Thousand Oaks, CA: Sage.

32
APPENDIX 1: TOL codings used in the sampling
Standard Industrial Classification (TOL) of the Statistics Finland was revised during the
QUEST research project (http://www.stat.fi/meta/luokitukset/toimiala/001-
2008/index_en.html). Still, in the QUEST project, the TOL 2002 was used as basis for
sampling. The sample covered the subcategories listed below. These were included in the
bolded main categories D, H, J, N, and O.
A Agriculture, hunting and forestry B Fishing C Mining and quarrying D Manufacturing E Electricity, gas and water supply F Construction G Wholesale and retail trade; repair of motor vehicles, motorcycles and personal and
household goods H Hotels and restaurants I Transport, storage and communication J Financial intermediation K Real estate, renting and business activities L Public administration and defence; compulsory social security M Education N Health and social work O Other community, social and personal service activities P Private households employing domestic staff and undifferentiated production
activities of households for own use Q Extra-territorial organizations and bodies X Industry unknown’ ELECTRONICS 32 Manufacture of radio, television and communication equipment and
apparatus 31 Manufacture of electrical machinery and apparatus n.e.c. 312 Manufacture of electricity distribution and control apparatus 314 Manufacture of accumulators, primary cells and primary batteries 316 Manufacture of electrical equipment n.e.c.
3161 Manufacture of electrical equipment for engines and vehicles n.e.c. 3162 Manufacture of other electrical equipment n.e.c.
33 Manufacture of medical, precision and optical instruments, watches and
clocks 331 Manufacture of medical and surgical equipment and orthopaedic appliances 332 Manufacture of instruments and appliances for measuring, checking, testing,
navigating and other purposes, except industria 333 Manufacture of industrial process control equipment

33
TOURISM 55 Hotels and restaurants 551 Hotels 552 Camping sites and other provision of short-stay accommodation
5521 Youth hostels and mountain refuges 5522 Camping sites, including caravan sites 5523 Other provision of lodgings n.e.c.
55231 Boarding houses 55232 Holiday villages 55239 Provision of lodgings n.e.c.
63 Supporting and auxiliary transport activities; activities of travel agencies 633 Activities of travel agencies and tour operators; tourist assistance activities n.e.c.
63301 Activities of travel agencies and tour operators 63302 Tourist assistance activities n.e.c.
92 Recreational, cultural and sporting activities 923 Other entertainment activities
92330 Fair and amusement park activities 926 Sporting activities
92610 Operation of sports arenas and stadiums FINANCE & ACCOUNTING 65 Financial intermediation, except insurance and pension funding 651 Monetary intermediation
6511 Central banking 6512 Other monetary intermediation
65120 Monetary intermediation by deposit banks 652 Other financial intermediation
6521 Financial leasing 6522 Other credit granting 6523 Other financial intermediation n.e.c.
65231 Investment and development company activities 65232 Unit trust activities 65239 Other investment activities
66 Insurance and pension funding, except compulsory social security 660 Insurance and pension funding, except compulsory social security
6601 Life insurance 6602 Pension funding 6603 Non-life insurance
66031 Non-life insurance companies 66032 Insurance associations 66039 Other non-life insurance
67 Activities auxiliary to financial intermediation 671 Activities auxiliary to financial intermediation, except insurance and pension funding
6711 Administration of financial markets 67111 Stock broking 67119 Other administration of financial markets
6712 Security broking and fund management 6713 Activities auxiliary to financial intermediation n.e.c.
672 Activities auxiliary to insurance and pension funding
34
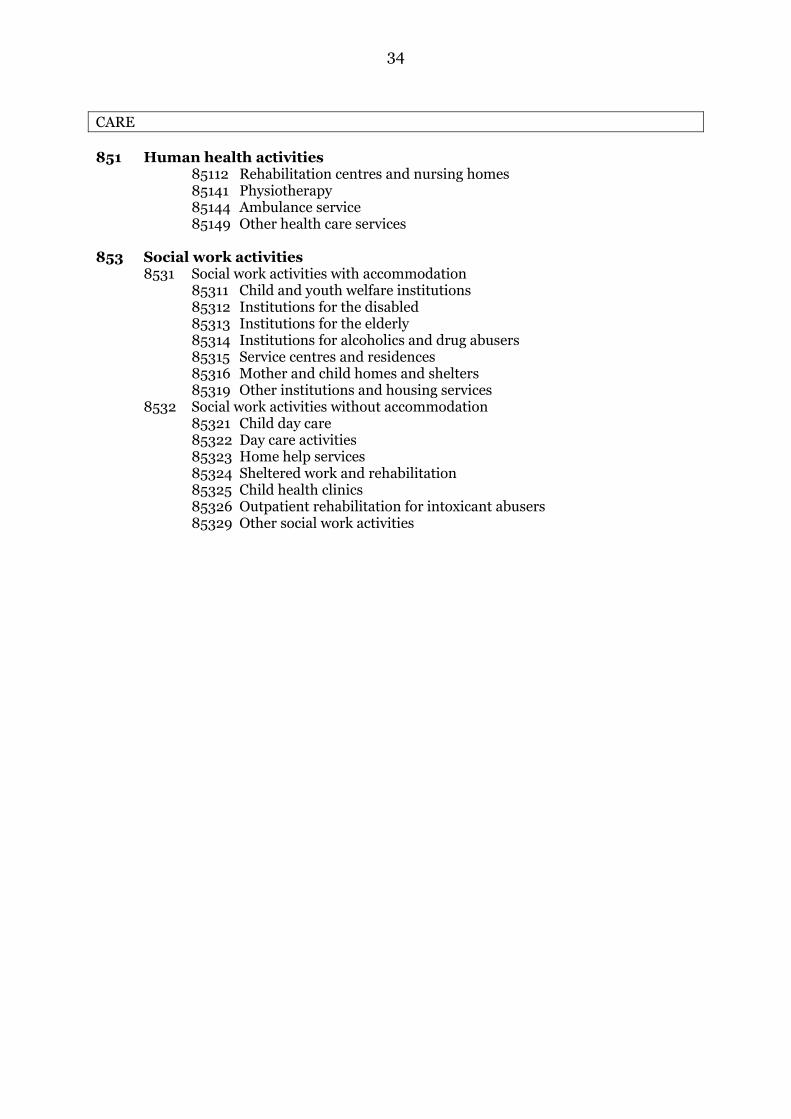
CARE 851 Human health activities
85112 Rehabilitation centres and nursing homes 85141 Physiotherapy 85144 Ambulance service 85149 Other health care services
853 Social work activities
8531 Social work activities with accommodation 85311 Child and youth welfare institutions 85312 Institutions for the disabled 85313 Institutions for the elderly 85314 Institutions for alcoholics and drug abusers 85315 Service centres and residences 85316 Mother and child homes and shelters 85319 Other institutions and housing services
8532 Social work activities without accommodation 85321 Child day care 85322 Day care activities 85323 Home help services 85324 Sheltered work and rehabilitation 85325 Child health clinics 85326 Outpatient rehabilitation for intoxicant abusers 85329 Other social work activities

35
APPENDIX 2: The questionnaires in Finnish
TYÖ JA HYVINVOINTI – KYSELYTUTKIMUS Hyvä vastaanottaja, Pyydämme teitä osallistumaan tutkimuskyselyymme alla olevan linkin kautta. Kyselyyn vastaaminen vie n. 10-15 minuuttia. Vastausaikaa on toukokuun loppuun. Kyselytutkimuksemme on osa Suomen Akatemian rahoittamaa tutkimusprojektia "Päämääränä hyvinvointi". Kysely koskee organisaationne henkilöstöä sekä työhyvinvointiin liittyviä toimenpiteitänne. Tutkimus kattaa satoja rahoituksen ja laskentatoimen, matkailun, elektroniikkateollisuuden ja hoitoalan organisaatioita sekä näihin toimialoihin liittyviä tai niitä tukevia organisaatioita. Lähetämme kyselyyn osallistuneille tiivistelmän keskeisistä tuloksista syksyllä 2009. Niiden valossa voitte halutessanne verrata organisaatiotanne kokonaistuloksiin. Antamanne vastaukset käsitellään luottamuksellisesti ja nimettöminä. Yhteystietonne olemme saaneet Fonecta ProFinder B2B -palvelusta. Olkaa hyvä ja ottakaa yhteyttä mikäli haluatte lisätietoja tutkimuksesta. If you wish to have the questionnaire in English, please contact us. Yhteistyöterveisin, FT Teemu Tallberg ja professori Jeff Hearn Hanken Svenska handelshögskolan Johtamisen ja organisaatiotutkimuksen laitos [email protected], Tel. (0)40-3521 502 [email protected], Tel. (0)40-3521 206 A = avoin kysymys K/E/EOS = kyllä/ei/en osaa sanoa MV = monivalinta DD = drop-down valikko

36
1. Vastaajan nimi (A) 2. Vastaajan asema organisaatiossa (DD + A)
a. henkilöstöjohtaja b. henkilöstöpäällikkö c. henkilöstöassistentti d. talousjohtaja/päällikkö e. toimitusjohtaja f. muu johtaja g. yrittäjä h. muu, mikä?)
3. Vastaajan ikä (A) 4. Organisaationne nimi (A) 5. Organisaationne perustamisvuosi (A) 6. Onko organisaationne osa (MV + A)
a. julkista sektoria b. yksityistä sektoria c. kolmatta sektoria d. muu, mikä?
7. Onko organisaationne kasvanut viimeisen viiden vuoden aikana (K/E/EOS)
a. tuloksen osalta? b. henkilöstönmäärän osalta?
8. Odotatteko organisaationne kasvavan seuraavan viiden vuoden aikana (K/E/EOS)
a. tuloksen osalta? b. henkilöstömäärän osalta?
9. Millä toimialalla organisaationne pääasiassa toimii? (A) 10. Pidättekö toimialaanne kasvualana? (K/ E/EOS) 11. Kuinka monta henkilöä organisaatiossanne työskentelee? (A) 12. Kuinka monta naista organisaatiossanne työskentelee? (A) 13. Kuinka monta miestä organisaatiossanne työskentelee? (A) 14. Onko organisaationne henkilöstö (MV)
a. enimmäkseen tai pelkästään alle 45-vuotiaita b. suunnilleen yhtä paljon alle ja yli 45-vuotiaita c. enimmäkseen tai pelkästään yli 45-vuotiaita?
15. Mikä on työntekijöidenne keski-ikä? (A) 16. Suurin piirtein kuinka suuri osuus (%) nykyisistä työntekijöistänne on (A)
a. ulkomaalaisia, muita kuin Suomen kansalaisia, maahanmuuttajia b. työrajoitteisia c. tilapäis/vuokratyövoimaa d. kuuluu ammattiliittoon/henkilöstöjärjestöön?

37
17. Kuinka suuri osuus (%) organisaationne henkilöstöstä on määräaikaisessa
työsuhteessa? (A) 18. Tehdäänkö organisaatiossanne (MV)
a. enimmäkseen tai pelkästään päivätyötä b. sekä päivätyötä että vuorotyötä c. enimmäkseen tai pelkästään vuorotyötä?
19. Tehdäänkö organisaatiossanne (MV-taulukko) (Kyllä / Ei / En osaa sanoa)
• työtä joustavin työajoin • osa-aikatyötä • lyhennettyä työviikkoa/ työpäivää • työvuorojen vaihtoja työntekijöiden kesken • etätöitä (kotoa käsin) • ns. sesonkityötä • Onko työtä mahdollista tehdä vain koulujen lukukausien tai lomien
aikana työntekijän niin halutessa? • Pidetäänkö organisaatiossanne vuorotteluvapaata?
20. Koskevatko epätyypilliset työaikajärjestelyt erityisesti jotakin henkilöstöryhmää (ikä,
sukupuoli, ammattiryhmä tms.)? (MV + A; Kyllä / Ei / Mitä ryhmää järjestely erityisesti koskee?)
• joustavat työajat • osa-aikatyö • lyhennetty työviikko/päivä • työvuorojen vaihto työntekijöiden kesken • työ vain koulujen lukukausien tai lomien aikana (työntekijän niin
halutessa) • etätyöt • ns. sesonkityö • vuorotteluvapaa
21. Mikä on organisaationne suurin henkilöstöä koskeva haaste lähitulevaisuudessa? (A) 22. Kuka vastaa organisaatiossanne henkilöstöasioista (MV + A):
a. henkilöstöosasto/yksikkö b. yksittäinen/useampi henkilö, millä ammattinimikkeillä? c. ei varsinaisesti kukaan d. En osaa sanoa
23. Onko seuraavissa organisaationne dokumenteissa mainittu jotain työhyvinvoinnista
(K/E/organisaatiollamme ei ole kyseistä dokumenttia/EOS) a. kehityskeskusteluja koskevat ohjeet b. organisaation strategia c. tasa-arvo-ohjelma d. työhyvinvointiohjelma e. työsuojelun toimintaohjelma f. vuosikertomus g. muu, mikä?
24. Onko organisaatiossanne käytössä seuraaviin aihepiireihin liittyviä toimintaohjeita
tai henkilöstöjohtamisen välineitä? Valitkaa lisäksi viisi tärkeintä (Kirjallisia toimintaohjeita / Muita käytäntöjä / En osaa sanoa / 5 organisaatiossanne tärkeintä)

38
• alkoholin ja huumausaineiden käyttö
• ammattijärjestötoiminta • eläkkeelle siirtyminen • erottaminen / viraltapano /
työsuhteen purkaminen • henkilöstön arviointi • henkilöstön koulutus • ikäsyrjintä • irtisanominen • joustava työskentely (joustava tai
lyhennetty työaika, osa-aikatyö) • kurinpidolliset toimet • lomaoikeudet • mentorointi • palkitseminen / kannustimet • poissaolot sosiaalisista syistä
(läheisten sairastuminen jne.)
• rotu- ja etninen syrjintä • sairauspoissaolot • seksuaalinen ja sukupuolinen
suuntautuminen • sukupuolten välinen tasa-arvo • työajat • työpaikkakiusaaminen ja häirintä • työterveys • työturvallisuus • uskonnon harjoittaminen • valituskäytännöt • vammaisiin kohdistuva syrjintä • väkivaltatilanteet • yleinen tasa-arvoa ja syrjintää
käsittelevä toimintaohje/säännöstö • isyysvapaa • äitiysvapaa • muut vanhempainvapaat
25. Mitä muita kuin edellä mainittuja toimintaohjeita tai henkilöstöjohtamisen välineitä
organisaatiossanne on käytössä? (A) 26. Mitä kautta työntekijöitänne informoidaan edellä mainituista toimintaohjeista ja
käytännöistä? (Informaatiokanava kakkien työntekijöiden kohdalla / Informaatiokanava joidenkin työntekijöiden kohdalla / Ei käytössä / En osaa sanoa)
a. esimies/työnjohto b. henkilöstökäsikirja c. henkilöstötiedote d. ilmoitustaulu e. intranet
f. perehdyttämisohjelma g. sähköposti h. työsopimus i. työsuojelun
toimintaohjelma 27. Onko organisaatiossanne viime vuosina tehty säännöllisesti (MV + A)
a. henkilöstötilinpäätös b. työilmapiiri- tai työtyytyväisyyskyselyitä c. muita henkilöstön hyvinvointiin liittyviä selvityksiä, mitä?
28. Miten yllä mainittujen selvitysten tulokset vaikuttavat organisaationne henkilöstökäytäntöihin? (A) 29. Mitkä seuraavista palveluista ja eduista ovat työnantajan toimesta henkilöstönne käytettävissä? Valitkaa lisäksi viisi tärkeintä (K/E/EOS/ 5 organisaatiossanne tärkeintä)
• elinikäisen oppimisen
edistäminen • eläke- tai taloudellinen
neuvonta • eläkkeelle siirtymiseen
valmistava koulutus • henkilöstöruokala • hieronta • ilmaiset/tuetut lomamatkat tai -
majoitus • kielikoulutus
• kouluttautumisen taloudellinen tukeminen
• kuntosali / muu liikuntatila / liikuntasetelit
• kuntoutus • lasten päivähoito • muiden huollettavien hoitoa
koskevat palvelut tai neuvonta • ohjaus terveellisiin
elämäntapoihin • oppisopimuskoulutus /
työharjoittelu

39
• sairaan lapsen hoidon tuki • suomenkielen opetus
maahanmuuttajille • taloudellinen neuvonta/tuki • terveystarkastus
• työmatkatuki • työsuhdeauto • työsuhdepuhelin • työterveydenhuolto • työvaatetus ja -välineistö
30. Mitä muita palveluita – edellä mainittujen lisäksi – on henkilöstönne käytettävissä
työnantajan toimesta? (A) 31. Kun ajattelette edellä mainittuja organisaationne hyvinvointiin liittyviä käytäntöjä ja
toimintaohjeita, mitä mieltä olette seuraavista väittämistä: (MV; 1=Pitää täysin paikkansa, 7=Ei pidä lainkaan paikkaansa; En osaa sanoa)
• Organisaatiomme hyvinvointi perustuu siihen mitä käytännössä tehdään • Organisaatiomme hyvinvointi perustuu kirjoitettuihin ohjeisiin ja
suunnitelmiin • Organisaatiossamme hyvinvointiin pyritään pääasiassa paperilla • Organisaatiossamme hyvinvointiin pyritään pääasiassa käytännön toimin • Hyvinvointitoimenpiteemme lisäävät työntekijöidemme sitoutumista • Hyvinvointitoimenpiteemme lisäävät työtyytyväisyyttä • Hyvinvointitoimenpiteemme lisäävät tuottavuutta • Organisaatiomme työntekijät voivat hyvin • Organisaatiomme pitää työntekijöistään hyvää huolta • Hyvinvointitoimenpiteemme lisäävät organisaatiomme houkuttelevuutta
työnantajana 32. Katsotteko organisaationne pyrkivän edistämään työntekijöidenne hyvinvointia ensisijaisesti heidän (MV)
a. työssään b. elämässään yleisesti c. organisaatio ei pyri edistämään työntekijöidensä hyvinvointia
33. Miten keskeisiä seuraavat tavoitteet ovat organisaatiossanne (likert scale, 1=ei lainkaan tärkeä, 7=erittäin tärkeä):
• asiakaspalvelu • markkinajohtajuus • organisaation kasvu • organisaation uudistuminen ja innovatiivisuus • osinkojen tuottaminen osakkaille • työntekijöiden hyvinvointi • vakaus työnantajana • yhteiskunnallinen vaikuttavuus • ympäristöarvot
34. Onko edellä jäänyt mielestänne käsittelemättä joitakin tärkeitä asioita? Jos on, mitä asioita jäi käsittelemättä?(A)
Kysely päättyy tähän. Painattehan vielä ”Lähetä” nappia.

40
APPENDIX 3: The survey questionnaire in English
WORK AND WELL-BEING – SURVEY
1. Name of the respondent
2. Position of the respondent in the organisation
a. HR/personnel manager b. Chief of HRM c. Personnel assistant d. Finance manager / Chief of finance e. Chief Executive Officer f. Other manager g. Entrepreneur h. Other, please specify:
3. Age of the respondent
4. Full title of the organisation
5. Start-up year of your organisation
6. Is your organisation a part of the
a. public sector b. private sector c. voluntary/third sector d. other, please specify:
7. Has your organisation grown during the last five years in terms of (Yes / No / Don’t know)
a. turnover? b. number of employees?
8. Do you expect your organisation to grow in the next five years? (Yes / No / Don’t
know)
9. In what sector does your organisation mainly operate?
10. Do you consider your sector a growth sector? (Yes / No / Don’t know)
11. How many employees do you currently have (on the payroll) in your organisation?
12. How many women do you currently have (on the payroll) in your organisation?
13. How many men do you currently have (on the payroll) in your organisation?
14. Is the personnel of your organisation aged
a. mainly or only under 45 years b. approximately as many over as under 45 years c. mainly or only over 45 years
15. What is the medium age of the personnel in your organisation?

41
16. Approximately what proportion (%) of your employees are
a. foreigners, non-Finnish nationals, immigrants b. disabled c. temporary or agency employees d. members in a union or staff association?
17. How large a proportion (%) of your personnel are fixed term employed?
18. Do employees in your organisation work
a. mainly or only daytime b. both in daytime and in shifts c. mainly or only in shifts?
19. Are the following used in your organisation?
Yes No I do not know a. flexible working hours b. part-time working c. work a compressed working
week/day
d. change of shift patterns by/among the employees
e. work only during school term-time or school holiday-time
f. homeworking / remote work g. seasonal work h. ”vuorotteluvapaa” (unemployed
workers temporarily replacing permanent staff)
20. Are there any particular groups of staff who are more likely to make use of these
flexible working arrangements (age, gender, occupational group etc.)?
Yes No Which group of staff? flexible working hours part-time working work a compressed working week/day change of shift patterns by/among the employees
work only during school term-time or school holiday-time
homeworking / remote work seasonal work ”vuorotteluvapaa” (unemployed workers temporarily replacing permanent staff)
21. What is, concerning human resources, the biggest challenge that your organisation is
facing in the near future?
22. Who is in your organisation responsible for human resource issues?
a. Human Resource / Personnel department b. Particular person(s), with what titles?

42
c. Nobody in particular d. I do not know
23. Do any of the following documents in your organisation mention/discuss work-related well-being? (yes / no / organisation does not have the document in question / do not know):
a. instructions concerning performance assessment / development discussions b. organisational strategy c. (gender) equality programme / plan d. work well-being programme / plan e. industrial safety / health and safety programme / plan f. annual report
24. In your organisation, are there personnel policies or practices concerning the
following areas? Choose the five most important ones.
• alcohol and drug misuse • unionising • retirement • dismissal • staff appraisal / personnel
assessment • personnel training • age discrimination • redundancy • flexible working (flexible or
shortened work time, part-time work)
• disciplinary procedures • holiday entitlement • mentoring • incentives • absence for social reasons
(sickness of dependents etc.) • racial and ethnic
discrimination • sickness absence • sexual and gender orientation • gender equality • working hours • bullying and harassment • occupational health • occupational safety • religious observance • grievance procedures • disability discrimination • workplace violence • general policy on equality and
discrimination • fatherhood leave • motherhood leave • other parental leaves
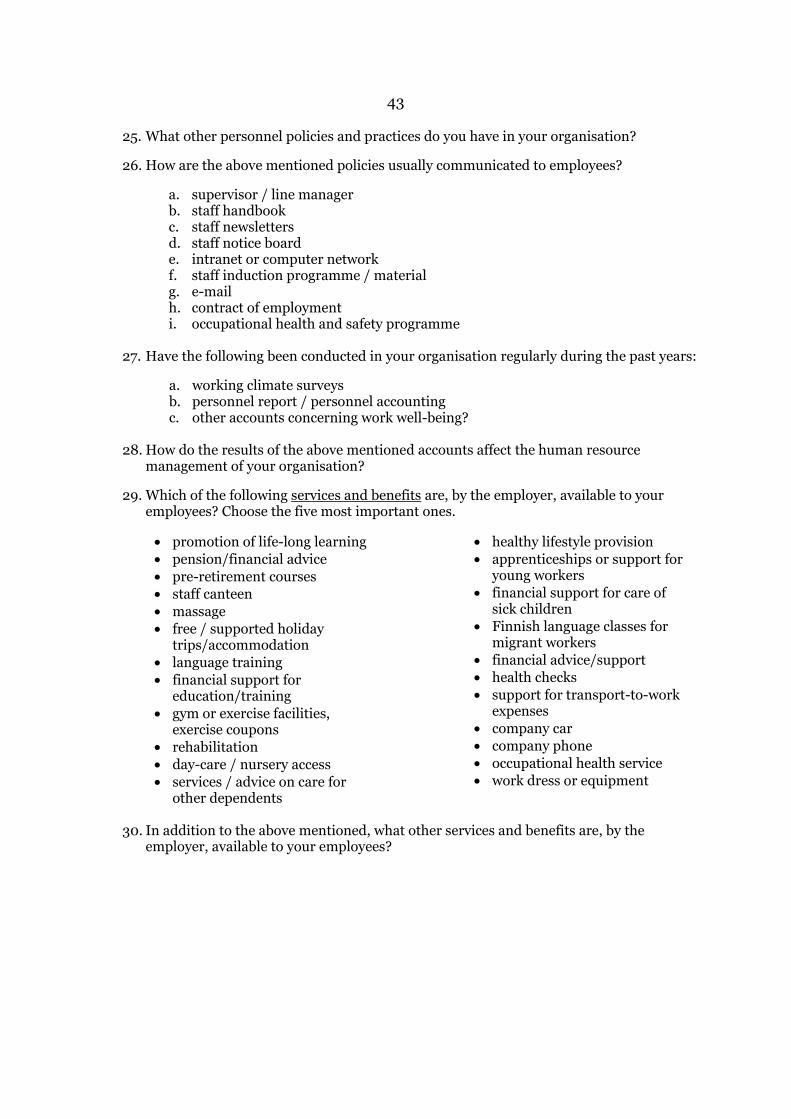
43
25. What other personnel policies and practices do you have in your organisation?
26. How are the above mentioned policies usually communicated to employees?
a. supervisor / line manager b. staff handbook c. staff newsletters d. staff notice board e. intranet or computer network f. staff induction programme / material g. e-mail h. contract of employment i. occupational health and safety programme
27. Have the following been conducted in your organisation regularly during the past years:
a. working climate surveys b. personnel report / personnel accounting c. other accounts concerning work well-being?
28. How do the results of the above mentioned accounts affect the human resource
management of your organisation?
29. Which of the following services and benefits are, by the employer, available to your employees? Choose the five most important ones.
• promotion of life-long learning • pension/financial advice • pre-retirement courses • staff canteen • massage • free / supported holiday
trips/accommodation • language training • financial support for
education/training • gym or exercise facilities,
exercise coupons • rehabilitation • day-care / nursery access • services / advice on care for
other dependents
• healthy lifestyle provision • apprenticeships or support for
young workers • financial support for care of
sick children • Finnish language classes for
migrant workers • financial advice/support • health checks • support for transport-to-work
expenses • company car • company phone • occupational health service • work dress or equipment
30. In addition to the above mentioned, what other services and benefits are, by the
employer, available to your employees?

44
31. When you think about the above discussed policies and practices related to well-being of your organisation, what is your opinion on the following statements (likert scale; 1=I agree totally; 7=I do not agree at all; I don’t know):
• In our organisation well-being comes from what happens in practice • In our organisation well-being comes from written policies • In our organisation well-being is managed mainly on paper • In our organisation well-being is managed mainly by practices • Our actions regarding well-being increase the commitment of our employees • Our well-being actions increase working satisfaction • Our well-being actions increase productivity • Our employees’ well-being is generally good • Our organisation takes good care of its employees • Our well-being actions increase the attractiveness of the organisation as an
employer
32. Would you say that your organisation promotes the well-being of its employees primarily
a. in their work? b. in their lives in general? c. the organisation does not promote the well-being of its employees
33. How central are the following goals in your organisation (likert scale, 1=Not at all
important, 7=Very important): • customer service • market leadership • growth of the organisation • organisational renewal and innovativeness • return to shareholders • well-being of the employees • sustainability as an employer • societal impact • environmental concerns
34. In your opinion, has this survey left some important issues undiscussed? If so, please
say what they are.
THANK YOU FOR YOUR TIME AND YOUR ANSWERS!
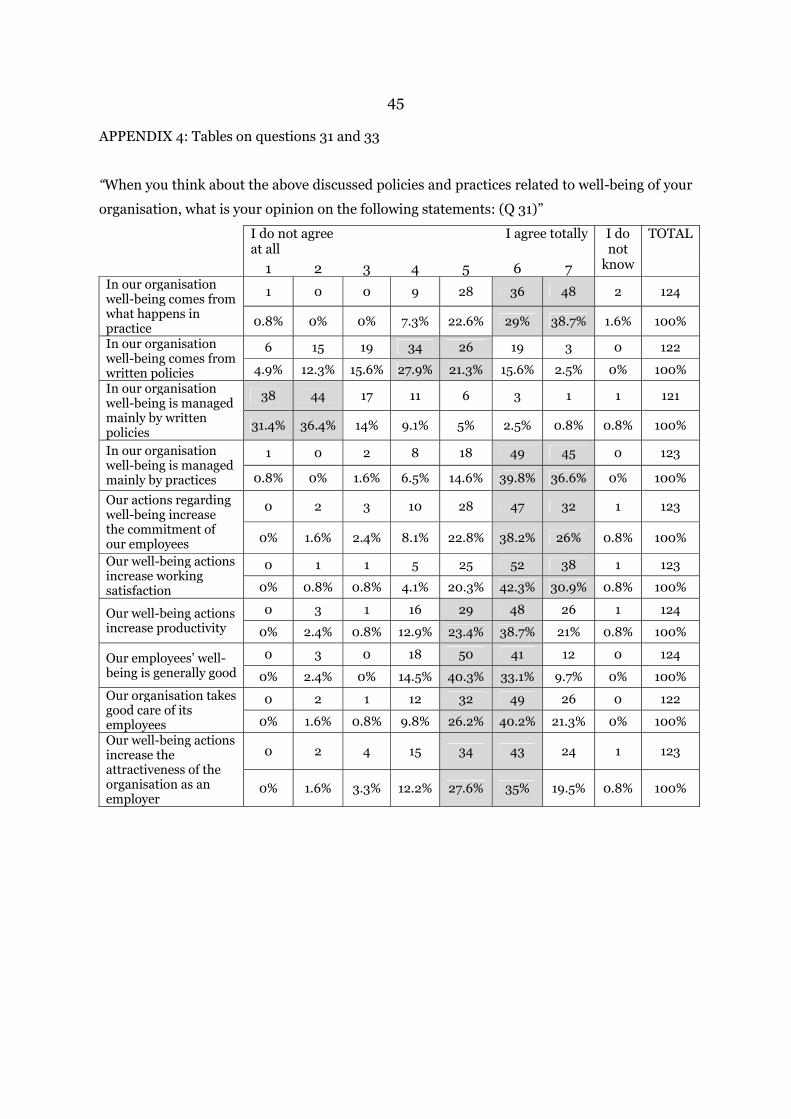
45 APPENDIX 4: Tables on questions 31 and 33
“When you think about the above discussed policies and practices related to well-being of your
organisation, what is your opinion on the following statements: (Q 31)”
I do not agree at all
I agree totally I do not
know
TOTAL
1 2 3 4 5 6 7 In our organisation well-being comes from what happens in practice
1 0 0 9 28 36 48 2 124
0.8% 0% 0% 7.3% 22.6% 29% 38.7% 1.6% 100%
In our organisation well-being comes from written policies
6 15 19 34 26 19 3 0 122
4.9% 12.3% 15.6% 27.9% 21.3% 15.6% 2.5% 0% 100%
In our organisation well-being is managed mainly by written policies
38 44 17 11 6 3 1 1 121
31.4% 36.4% 14% 9.1% 5% 2.5% 0.8% 0.8% 100%
In our organisation well-being is managed mainly by practices
1 0 2 8 18 49 45 0 123
0.8% 0% 1.6% 6.5% 14.6% 39.8% 36.6% 0% 100%
Our actions regarding well-being increase the commitment of our employees
0 2 3 10 28 47 32 1 123
0% 1.6% 2.4% 8.1% 22.8% 38.2% 26% 0.8% 100%
Our well-being actions increase working satisfaction
0 1 1 5 25 52 38 1 123
0% 0.8% 0.8% 4.1% 20.3% 42.3% 30.9% 0.8% 100%
Our well-being actions increase productivity
0 3 1 16 29 48 26 1 124
0% 2.4% 0.8% 12.9% 23.4% 38.7% 21% 0.8% 100%
Our employees’ well-being is generally good
0 3 0 18 50 41 12 0 124
0% 2.4% 0% 14.5% 40.3% 33.1% 9.7% 0% 100%
Our organisation takes good care of its employees
0 2 1 12 32 49 26 0 122
0% 1.6% 0.8% 9.8% 26.2% 40.2% 21.3% 0% 100%
Our well-being actions increase the attractiveness of the organisation as an employer
0 2 4 15 34 43 24 1 123
0% 1.6% 3.3% 12.2% 27.6% 35% 19.5% 0.8% 100%

46 Centrality of goals in organisation (1=not at all important, 7=very important)? (Q 33)
Not at all important
Very important TOTAL MEAN
1 2 3 4 5 6 7
Customer service 0 0 0 1 5 14 104 124
6.62 0% 0% 0% 0.8% 4% 11.3% 83.9% 100%
Well-being of the employees
0 0 2 1 25 40 56 124 6.04
0% 0% 1.6% 0.8% 20.2% 32.3% 45.2% 100%
Sustainability as an employer
0 0 2 1 20 40 59 122 6.01
0% 0% 1.6% 0.8% 20.2% 32.3% 45.2% 100% Organisational
renewal and innovation
0 0 3 8 16 62 35 124 5.81
0% 0% 2.4% 6.5% 12.9% 50% 28.2% 100%
Environmental concerns
1 6 3 26 34 31 23 124 5.06
0.8% 4.8% 2.4% 21% 27.4% 25% 18.5% 100%
Societal impact 4 2 12 21 32 25 27 123
4.94 3.3% 1.6% 9.8% 17.1% 26% 20.3% 22% 100%
Growth of the organization
6 5 12 23 47 21 8 122 4.42
4.9% 4.1% 9.8% 18.9% 38.5% 17.2% 6.6% %
Market leadership 9 9 9 21 46 16 13 123
4.37 7.3% 7.3% 7.3% 17.1% 37.4% 13% 10.6% 100%
Return to shareholders
35 8 12 24 18 12 13 123 3.43
28.7% 6.6% 9.8% 19.7% 14.8% 9.8% 10.7% 100%
47 APPENDIX 5: Summary information to the respondents of the survey
SUURET KIITOKSET OSALLISTUMISESTA TUTKIMUKSEEN!
Keväällä 2009 toteutimme kyselytutkimuksen Työ ja hyvinvointi. Kutsu kyselyyn lähetettiin 544 organisaatiolle neljällä toimialalla. Otokseen kuului rahoituksen ja laskentatoimen, matkailun, elektroniikkateollisuuden ja hoito-alan organisaatioita sekä näihin toimialoihin liittyviä tai niitä tukevia organisaatioita. Kyselytutkimuksemme on osa Suomen Akatemian rahoittamaa tutkimusprojektia Päämääränä hyvinvointi. Kysely koski organisaatioiden henkilöstöä sekä työhyvinvointiin liittyviä toimenpiteitä.
Työ ja hyvinvointi – tutkimuskyselyn tuloksia
Oheinen tiivistelmä kyselymme alustavista tuloksista on lähetetty kaikille tutkimukseen osallistuneille organisaatioille. Tutkimusyhteistyötä jatkaaksemme tulemme tammikuussa 2010 ottamaan yhteyttä osaan niistä organisaatioista, jotka ottivat osaa kyselyyn. Tarkoituksenamme on syventää kyselyn tuottamaa tietämystä paneutumalla tarkemmin erilaisten organisaatioiden toimintaan ja työhyvinvointia koskeviin haasteisiin.
Lämpimät kiitokset tähänastisesta yhteistyöstä.
Hyvää joulua ja onnellista uutta vuotta toivottaen,
FT Teemu Tallberg Professori Jeff Hearn FM, VTM Hertta Niemi KTM Charlotta Niemistö Hanken Svenska handelshögskolan Johtamisen ja organisaatiotutkimuksen laitos [email protected], Tel. (0)40-3521 502 [email protected], Tel. (0)40-3521 206

Meddelanden från Svenska handelshögskolan Hanken School of Economics. Working Papers. 2009 539. Ahlgren, Niklas & Juselius, Mikael: Tests for Cointegration Rank and the Initial Condition.
540. Bask, Mikael: Monetary Policy, Stock Price Misalignments and Macroeconomic Instability.
541. Ahlgren, Niklas & Antell, Jan: The Power of Bootstrap Tests of Cointegration Rank with Financial Time Series.
542. Grönroos, Christian & Ravald, Annika: Marketing and the Logic of Service: Value Facilitation, Value Creation and Co-creation, and Their Marketing Implications.
543. Leppänen, Hanna & Grönroos, Christian: The Hybrid Consumer: Exploring the Drivers of a New Consumer Behaviour Type.
544. Grönroos, Christian: Towards Service Logic: The Unique Contribution of Value Co-Creation.
545. Mickelsson, Jacob: Activityscape Mapping: Consumer Activity Systems as Service Context.
546. Heinonen, K., Strandvik, T., Mickelsson, K-J., Edvardsson, B., Sundström, E. & Andersson, P.: Rethinking Service Companies’ Business Logic: Do We Need a Customer-Dominant Logic as a Guideline?
547. Finne, Åke & Strandvik, Tore: Silent Communication - A Challenge to Established Marketing Communication Practice.
548. Hearn, J., Tallberg, T., McKie, L., Gripenberg, P., Jyrkinen, M. and Niemistö, C.: The Quest for Well-being in Growth Industries: Contexts, Research Design and Methodological Development.
2010 549. Söderqvist, Anette & Wägar, Karolina: Board Effectiveness in Small Firms.
550. Strandvik, Tore & Rindell, Anne: Value of Image in Service.
551. Rindell, Anne: Time Dimension in Consumers’ Image Construction Processes: Introducing Image Heritage and Image-in-Use.
552. Voima, Päivi, Heinonen, Kristina & Strandvik, Tore: Exploring Customer Value Formation – A Customer Dominant Logic Perspective.
553. Heinonen, Kristina, Mickelsson, Jacob & Strandvik, Tore: Customer Energy in Relationships.
554. Helle, Pekka: Re-Conceptualizing Value-Creation: From Industrial Business Logic to Service Business Logic.
2011
555. Gerkman, Linda & Ahlgren, Niklas: Practical Proposals for Specifying k-Nearest Neighbours Weights Matrices.
556. Hampf, Anders & Lindberg-Repo, Kirsti: Branding: The Past, Present, and Future: A Study of the Evolution and Future of Branding.
557. Vilppo, Tiina & Lindberg-Repo, Kirsti: Corporate Brand Repositioning with CSR as the Differentiating Factor: A Study on Consumer Perceptions.
558. Tallberg, T., Hearn, J., Niemistö, C., Gripenberg, P., Jyrkinen, M. and McKie, L.: The Quest for Well-being in Growth Industries 2: The Survey.