the quantitative analysis of curcuminoids in food … quantitative analysis of curcuminoids in food...
TRANSCRIPT
The Quantitative Analysis of Curcuminoids in Food and Food Additives Using Rapid HPLC With Electrochemical, UV, or Fluorescence DetectionQi Zhang, David Thomas, and Ian Acworth Thermo Fisher Scientific, Chelmsford, MA, USA
2 The Quantitative Analysis of Curcuminoids in Food and Food Additives Using Rapid HPLC With Electrochemical, UV, or Fluorescence Detection
References Grynkiewicz, G. and Ślifirski, P. Curcumin and curcuminoids in quest for medical
status, Acta Biochemica Polonica, 2012, 59(2), 201-212.
Rohman, A. Mini review analysis of curcuminods in food and pharmaceutical products, Int. Food Res. 2012, 19(1), 19-27.
Zhang, J.; Jinnai, S.; Ikeda, R.; Wada, M.; Hayashida, S.; Nakashima, K. A simple HPLC-fluorescence method for quantitation of curcuminods and its application to turmeric products, Anal. Sci., 2009, 25, 385-388.
Kishore, C.N.; Shrivastava; Anurekha, J. Stability-indicating RP-HPLC determination of curcumin in Vicco Turmeric cream and Haridrakhand churna, Phcog. J., 2010, 2 (6).
Pfeiffer E.; Hőhl, S.; Solyom, A.M.; Metzler M. Studies on stability of turmeric constituents, J. Food Eng., 2003, 56, 257-259.
Romson, S.; Sunisa, S.; Worapong, U. Stability of antioxidant and antibacterial properties in heated turmeric-chili paste and its ingredients, Int. Food Res., 2011, 18, 397-404.
Overview
Purpose: To develop a rapid HPLC method with electrochemical (EC) detection for quantitative determination of curcuminoids in foods and food additives. Detection limits were evaluated for EC, ultraviolet (UV), and fluorescence (FL) detection. Methods: Rapid HPLC method with electrochemical, UV and fluorescence detection. Results: The method presented here allows fast determination of curcuminoids including curcumin (C), demethoxycurcumin (DMC), and bisdemethoxycurcumin (BDMC) in food additive products within 3 mins following simple sample preparation. With electrochemical detection, the limit of detection (LOD) (S/N =3) was 2 pg (on column) for C and DMC and 4 pg for BDMC. A comparison of different detection technologies showed that ECD was more sensitive than UV detection, and was both more sensitive and had more uniform response than fluorescence detection.
Introduction Turmeric, the powered dry rhizome of the plant Curcuma longa, is widely used as a culinary additive to impart a distinctive yellow-orange color to Pakistani, Indian, and Thai cuisines. Turmeric has also been known for thousands of years as an Ayurvedic medicine. Research to date suggests that turmeric, besides having an immunomodulatory role, is also of use in preventing oxidative stress that can lead to inflammation, cancer, and arthritis. The natural products in turmeric that are purported to possess health benefits include a number of curcuminoids including curcumin (C), demethoxycurcumin (DMC) and bisdemethoxycurcumin (BDMC). Curcumin is now recognized as being responsible for most of the therapeutic effects. In recent times, there has been great interest in transforming curcumin into a drug candidate with prospective multipotent therapeutic applications1. Many analytical methods have been reported and reviewed by researchers for quantitative analysis of curcuminoids in food and pharmaceutical products2. The spectroscopic-based methods express quantitation of curcuminoids as total color content of the sample, while chromatographic-based methods including thin layer chromatography (TLC), capillary electrophoresis (CE), and high-performance liquid chromatography (HPLC), offer the advantage of separation and determination of individual curcuminoids. HPLC is the most reported technique for analysis of curcuminoids due to its high precision, accuracy, and low detection limit. HPLC separation of the curcuminods with a C18 column typically takes 10 to 30 min to complete the analysis2,3. Presented here is a rapid 3 min HPLC method using a Thermo Scientific™ Acclaim™ RSLC PolarAdvantage II (PA2) column and Dionex™ UltiMate™ 3000 electrochemical detector. Curcuminoids, including turmeric powder, curry powder and a pellet curry sauce, were quantitatively determined after simple ultrasonic extraction with methanol in three food products. ECD showed the best sensitivity among the three detection technologies, and had more uniform response than fluorescence detection. ECD also showed an advantage over UV and FL by being able to detect a degradation product of curcuminoids. Methods Liquid Chromatography A Thermo Scientific™ Dionex™ UltiMate™ 3000 HPLC system consisting of:
– LPG-3400BM Pump – WPS-3000 TBSL Autosampler – TCC-3000RS Thermostatted Column Compartment – ECD-3000RS Electrochemical Detector with 6011RS ultra Coulometric Analytical cell,
E1 = E2 = 700 mV – FLD-3400RS Fluorescence Detector with Dual PMT, Excitation 426 nm,
Emission 539 nm – VWD-3100 Variable Wavelength Detector, 426 nm
Analytical Column: Acclaim RSLC PA2, 2.1 × 50 mm, 3 µm Mobile Phase: 25% 100 mM phosphate buffer, pH 3, 75% methanol Flow Rate: 0.4 mL/min Injection Volume: 2 µL Data Analysis and Processing Chromatographic data were collected using Thermo Scientific™ Dionex™ Chromeleon™ Chromatography Data System ver. 6.8 (SR9) Standard Preparation Stock solution of C, DMC, and BDMC were prepared in methanol at 1 mg/mL. Working standards were prepared by dilution of stock solution in mobile phase. Sample Preparation Turmeric powder, yellow curry powder, and a pellet curry sauce sample were prepared at 1 mg/mL in methanol, then vortex-mixed and sonicated for 10 min. The solution was filtered through a 0.22 µm centrifuge tube filter and diluted with mobile phase prior to analysis.
© 2013 Thermo Fisher Scientific Inc. All rights reserved. All trademarks are the property of Thermo Fisher Scientific Inc. and its subsidiaries. This information is not intended to encourage use of these products in any manners that might infringe the
intellectual property rights of others PO70677_E 04/13S
The Quantitative Analysis of Curcuminoids in Food and Food Additives Using Rapid HPLC With Electrochemical, UV, or Fluorescence Detection Qi Zhang, David Thomas, and Ian Acworth
Thermo Fisher Scientific Inc., 22 Alpha Rd, Chelmsford, MA, 01824
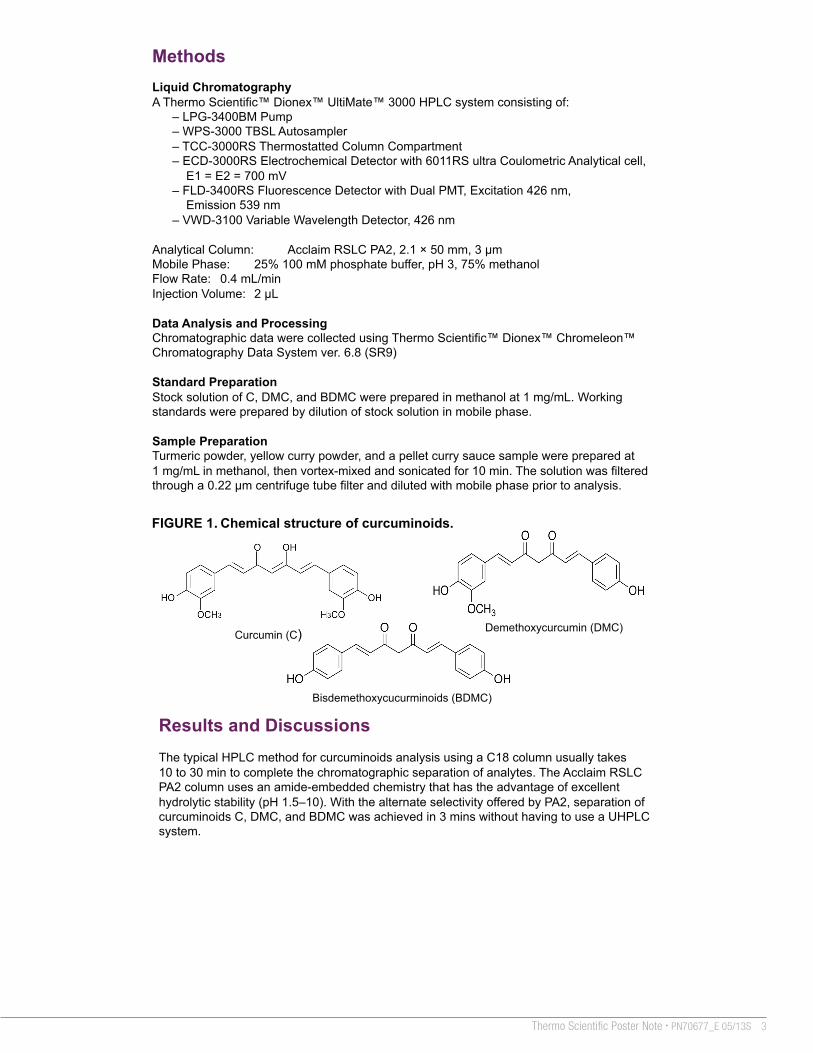
FIGURE 1. Chemical structure of curcuminoids.
Curcumin (C) Demethoxycurcumin (DMC)
Bisdemethoxycucurminoids (BDMC)
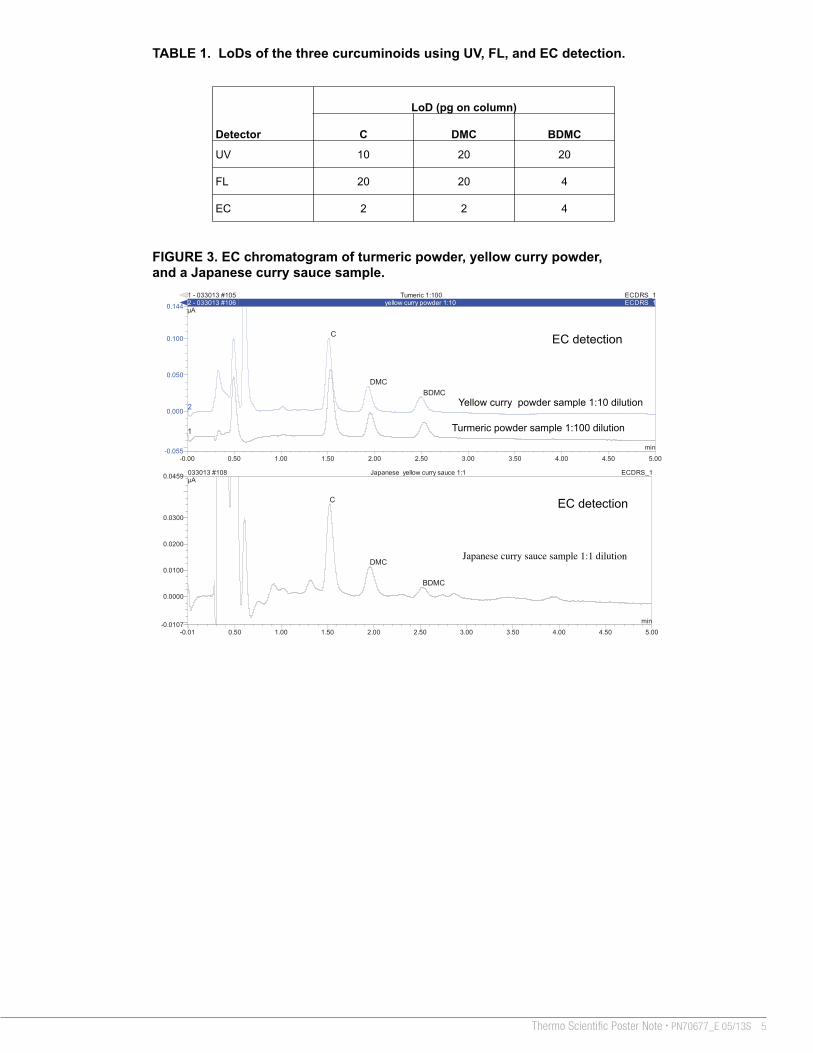
TABLE 1. LoDs of the three curcuminoids using UV, FL, and EC detection.
Detector
LoD (pg on column)
C DMC BDMC
UV 10 20 20
FL 20 20 4
EC 2 2 4
FIGURE 3. EC chromatogram of turmeric powder, yellow curry powder, and a Japanese curry sauce sample.
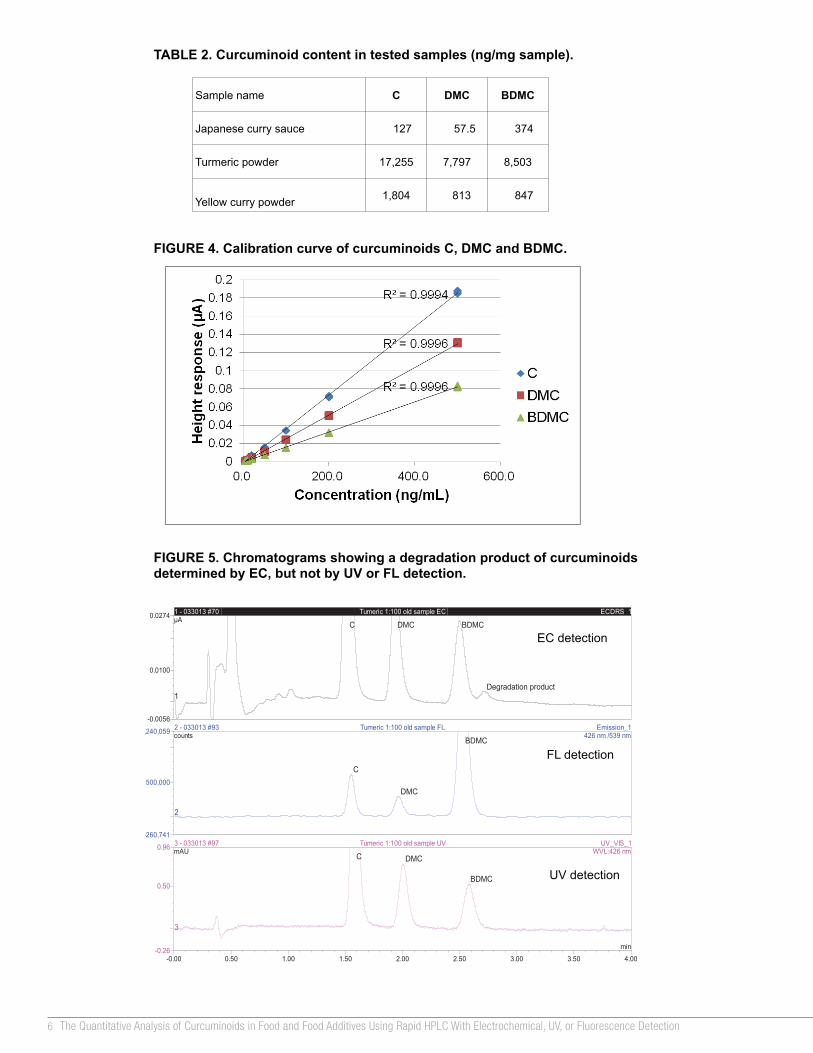
FIGURE 5. Chromatograms showing a degradation product of curcuminoids determined by EC, but not by UV or FL detection.
Conclusion A 3 min method with EC detection was developed for quantitative analysis of
curcuminods in turmeric and turmeric-containing food products.
The comparison of EC, UV, and FL detection showed that EC was more sensitive than UV and was both more sensitive and had more uniform response than FL.
A degradation product of a curcuminoids sample subjected to low pH buffer solution and light exposure was detected by EC, but not by UV or FL. EC offers a major advantage over UV and FL for studying curcuminoids stability.
FIGURE 4. Calibration curve of curcuminoids C, DMC and BDMC.
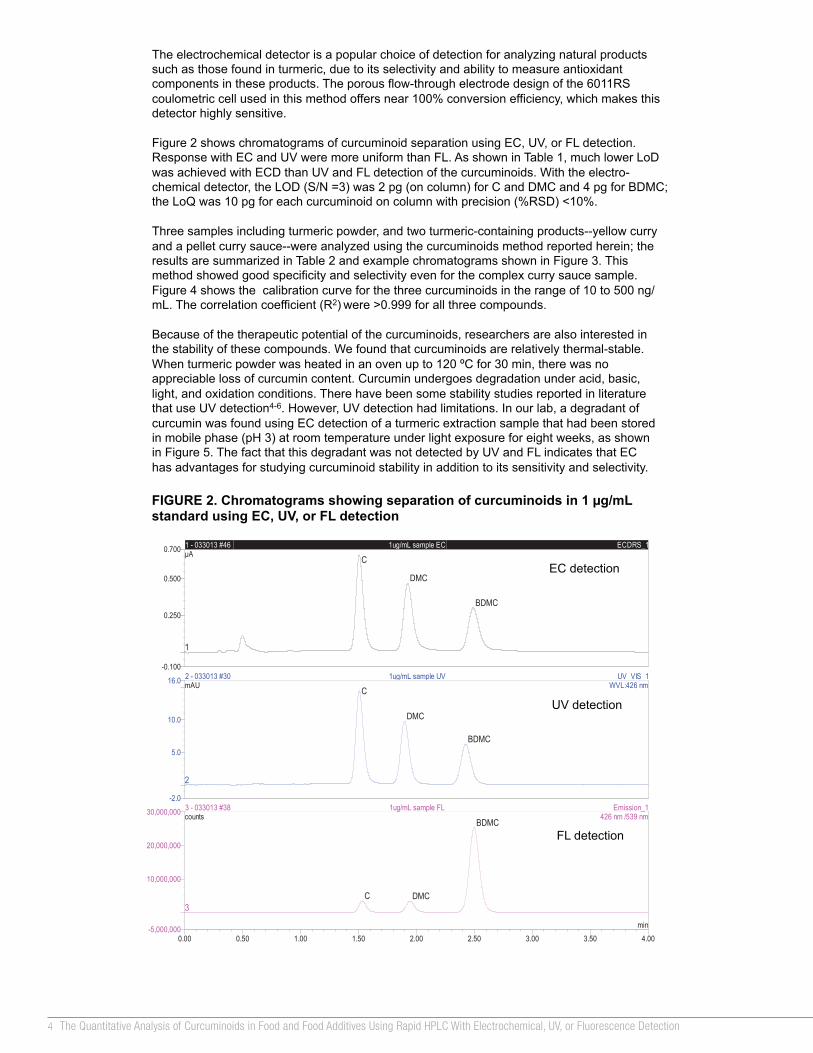
FIGURE 2. Chromatograms showing separation of curcuminoids in 1 µg/mL standard using EC, UV, or FL detection
TABLE 2. Curcuminoid content in tested samples (ng/mg sample).
Sample name C DMC BDMC
Japanese curry sauce 127 57.5 374
Turmeric powder 17,255 7,797 8,503
Yellow curry powder 1,804 813 847
The electrochemical detector is a popular choice of detection for analyzing natural products such as those found in turmeric, due to its selectivity and ability to measure antioxidant components in these products. The porous flow-through electrode design of the 6011RS coulometric cell used in this method offers near 100% conversion efficiency, which makes this detector highly sensitive. Figure 2 shows chromatograms of curcuminoid separation using EC, UV, or FL detection. Response with EC and UV were more uniform than FL. As shown in Table 1, much lower LoD was achieved with ECD than UV and FL detection of the curcuminoids. With the electro-chemical detector, the LOD (S/N =3) was 2 pg (on column) for C and DMC and 4 pg for BDMC; the LoQ was 10 pg for each curcuminoid on column with precision (%RSD) <10%. Three samples including turmeric powder, and two turmeric-containing products--yellow curry and a pellet curry sauce--were analyzed using the curcuminoids method reported herein; the results are summarized in Table 2 and example chromatograms shown in Figure 3. This method showed good specificity and selectivity even for the complex curry sauce sample. Figure 4 shows the calibration curve for the three curcuminoids in the range of 10 to 500 ng/mL. The correlation coefficient (R2) were >0.999 for all three compounds. Because of the therapeutic potential of the curcuminoids, researchers are also interested in the stability of these compounds. We found that curcuminoids are relatively thermal-stable. When turmeric powder was heated in an oven up to 120 ºC for 30 min, there was no appreciable loss of curcumin content. Curcumin undergoes degradation under acid, basic, light, and oxidation conditions. There have been some stability studies reported in literature that use UV detection4-6. However, UV detection had limitations. In our lab, a degradant of curcumin was found using EC detection of a turmeric extraction sample that had been stored in mobile phase (pH 3) at room temperature under light exposure for eight weeks, as shown in Figure 5. The fact that this degradant was not detected by UV and FL indicates that EC has advantages for studying curcuminoid stability in addition to its sensitivity and selectivity.
Results and Discussions The typical HPLC method for curcuminoids analysis using a C18 column usually takes 10 to 30 min to complete the chromatographic separation of analytes. The Acclaim RSLC PA2 column uses an amide-embedded chemistry that has the advantage of excellent hydrolytic stability (pH 1.5–10). With the alternate selectivity offered by PA2, separation of curcuminoids C, DMC, and BDMC was achieved in 3 mins without having to use a UHPLC system.
-0.100
0.250
0.500
0.700 1 - 033013 #46 1ug/mL sample EC ECDRS_1µA
1
C
DMC
BDMC
-2.0
5.0
10.0
16.0 2 - 033013 #30 1ug/mL sample UV UV_VIS_1mAU
2
C
DMC
BDMC
WVL:426 nm
0.00 0.50 1.00 1.50 2.00 2.50 3.00 3.50 4.00-5,000,000
10,000,000
20,000,000
30,000,000 3 - 033013 #38 1ug/mL sample FL Emission_1counts
min
3 C DMC
BDMC426 nm /539 nm
EC detection
UV detection
FL detection
-0.01 0.50 1.00 1.50 2.00 2.50 3.00 3.50 4.00 4.50 5.00-0.0107
0.0000
0.0100
0.0200
0.0300
0.0459 033013 #108 Japanese yellow curry sauce 1:1 ECDRS_1µA
min
C
DMC
BDMC
Japanese curry sauce sample 1:1 dilution
-0.00 0.50 1.00 1.50 2.00 2.50 3.00 3.50 4.00 4.50 5.00-0.055
0.000
0.050
0.100
0.144
1 - 033013 #105 Tumeric 1:100 ECDRS_12 - 033013 #106 yellow curry powder 1:10 ECDRS_1µA
min
2
1
C
DMC BDMC
Yellow curry powder sample 1:10 dilution
Turmeric powder sample 1:100 dilution
EC detection
EC detection
-0.0056
0.0100
0.0274 1 - 033013 #70 Tumeric 1:100 old sample EC ECDRS_1µA
1
C DMC BDMC
Degradation product
-260,741
500,000
1,240,059 2 - 033013 #93 Tumeric 1:100 old sample FL Emission_1counts
2
C
DMC
BDMC426 nm /539 nm
-0.00 0.50 1.00 1.50 2.00 2.50 3.00 3.50 4.00-0.26
0.50
0.96 3 - 033013 #97 Tumeric 1:100 old sample UV UV_VIS_1mAU
min
3
C DMC
BDMC
WVL:426 nm
EC detection
FL detection
UV detection
3Thermo Scientific Poster Note • PN70677_e 05/13S
References Grynkiewicz, G. and Ślifirski, P. Curcumin and curcuminoids in quest for medical
status, Acta Biochemica Polonica, 2012, 59(2), 201-212.
Rohman, A. Mini review analysis of curcuminods in food and pharmaceutical products, Int. Food Res. 2012, 19(1), 19-27.
Zhang, J.; Jinnai, S.; Ikeda, R.; Wada, M.; Hayashida, S.; Nakashima, K. A simple HPLC-fluorescence method for quantitation of curcuminods and its application to turmeric products, Anal. Sci., 2009, 25, 385-388.
Kishore, C.N.; Shrivastava; Anurekha, J. Stability-indicating RP-HPLC determination of curcumin in Vicco Turmeric cream and Haridrakhand churna, Phcog. J., 2010, 2 (6).
Pfeiffer E.; Hőhl, S.; Solyom, A.M.; Metzler M. Studies on stability of turmeric constituents, J. Food Eng., 2003, 56, 257-259.
Romson, S.; Sunisa, S.; Worapong, U. Stability of antioxidant and antibacterial properties in heated turmeric-chili paste and its ingredients, Int. Food Res., 2011, 18, 397-404.
Overview
Purpose: To develop a rapid HPLC method with electrochemical (EC) detection for quantitative determination of curcuminoids in foods and food additives. Detection limits were evaluated for EC, ultraviolet (UV), and fluorescence (FL) detection. Methods: Rapid HPLC method with electrochemical, UV and fluorescence detection. Results: The method presented here allows fast determination of curcuminoids including curcumin (C), demethoxycurcumin (DMC), and bisdemethoxycurcumin (BDMC) in food additive products within 3 mins following simple sample preparation. With electrochemical detection, the limit of detection (LOD) (S/N =3) was 2 pg (on column) for C and DMC and 4 pg for BDMC. A comparison of different detection technologies showed that ECD was more sensitive than UV detection, and was both more sensitive and had more uniform response than fluorescence detection.
Introduction Turmeric, the powered dry rhizome of the plant Curcuma longa, is widely used as a culinary additive to impart a distinctive yellow-orange color to Pakistani, Indian, and Thai cuisines. Turmeric has also been known for thousands of years as an Ayurvedic medicine. Research to date suggests that turmeric, besides having an immunomodulatory role, is also of use in preventing oxidative stress that can lead to inflammation, cancer, and arthritis. The natural products in turmeric that are purported to possess health benefits include a number of curcuminoids including curcumin (C), demethoxycurcumin (DMC) and bisdemethoxycurcumin (BDMC). Curcumin is now recognized as being responsible for most of the therapeutic effects. In recent times, there has been great interest in transforming curcumin into a drug candidate with prospective multipotent therapeutic applications1. Many analytical methods have been reported and reviewed by researchers for quantitative analysis of curcuminoids in food and pharmaceutical products2. The spectroscopic-based methods express quantitation of curcuminoids as total color content of the sample, while chromatographic-based methods including thin layer chromatography (TLC), capillary electrophoresis (CE), and high-performance liquid chromatography (HPLC), offer the advantage of separation and determination of individual curcuminoids. HPLC is the most reported technique for analysis of curcuminoids due to its high precision, accuracy, and low detection limit. HPLC separation of the curcuminods with a C18 column typically takes 10 to 30 min to complete the analysis2,3. Presented here is a rapid 3 min HPLC method using a Thermo Scientific™ Acclaim™ RSLC PolarAdvantage II (PA2) column and Dionex™ UltiMate™ 3000 electrochemical detector. Curcuminoids, including turmeric powder, curry powder and a pellet curry sauce, were quantitatively determined after simple ultrasonic extraction with methanol in three food products. ECD showed the best sensitivity among the three detection technologies, and had more uniform response than fluorescence detection. ECD also showed an advantage over UV and FL by being able to detect a degradation product of curcuminoids. Methods Liquid Chromatography A Thermo Scientific™ Dionex™ UltiMate™ 3000 HPLC system consisting of:
– LPG-3400BM Pump – WPS-3000 TBSL Autosampler – TCC-3000RS Thermostatted Column Compartment – ECD-3000RS Electrochemical Detector with 6011RS ultra Coulometric Analytical cell,
E1 = E2 = 700 mV – FLD-3400RS Fluorescence Detector with Dual PMT, Excitation 426 nm,
Emission 539 nm – VWD-3100 Variable Wavelength Detector, 426 nm
Analytical Column: Acclaim RSLC PA2, 2.1 × 50 mm, 3 µm Mobile Phase: 25% 100 mM phosphate buffer, pH 3, 75% methanol Flow Rate: 0.4 mL/min Injection Volume: 2 µL Data Analysis and Processing Chromatographic data were collected using Thermo Scientific™ Dionex™ Chromeleon™ Chromatography Data System ver. 6.8 (SR9) Standard Preparation Stock solution of C, DMC, and BDMC were prepared in methanol at 1 mg/mL. Working standards were prepared by dilution of stock solution in mobile phase. Sample Preparation Turmeric powder, yellow curry powder, and a pellet curry sauce sample were prepared at 1 mg/mL in methanol, then vortex-mixed and sonicated for 10 min. The solution was filtered through a 0.22 µm centrifuge tube filter and diluted with mobile phase prior to analysis.
© 2013 Thermo Fisher Scientific Inc. All rights reserved. All trademarks are the property of Thermo Fisher Scientific Inc. and its subsidiaries. This information is not intended to encourage use of these products in any manners that might infringe the
intellectual property rights of others PO70677_E 04/13S
The Quantitative Analysis of Curcuminoids in Food and Food Additives Using Rapid HPLC With Electrochemical, UV, or Fluorescence Detection Qi Zhang, David Thomas, and Ian Acworth
Thermo Fisher Scientific Inc., 22 Alpha Rd, Chelmsford, MA, 01824
FIGURE 1. Chemical structure of curcuminoids.
Curcumin (C) Demethoxycurcumin (DMC)
Bisdemethoxycucurminoids (BDMC)
TABLE 1. LoDs of the three curcuminoids using UV, FL, and EC detection.
Detector
LoD (pg on column)
C DMC BDMC
UV 10 20 20
FL 20 20 4
EC 2 2 4
FIGURE 3. EC chromatogram of turmeric powder, yellow curry powder, and a Japanese curry sauce sample.
FIGURE 5. Chromatograms showing a degradation product of curcuminoids determined by EC, but not by UV or FL detection.
Conclusion A 3 min method with EC detection was developed for quantitative analysis of
curcuminods in turmeric and turmeric-containing food products.
The comparison of EC, UV, and FL detection showed that EC was more sensitive than UV and was both more sensitive and had more uniform response than FL.
A degradation product of a curcuminoids sample subjected to low pH buffer solution and light exposure was detected by EC, but not by UV or FL. EC offers a major advantage over UV and FL for studying curcuminoids stability.
FIGURE 4. Calibration curve of curcuminoids C, DMC and BDMC.
FIGURE 2. Chromatograms showing separation of curcuminoids in 1 µg/mL standard using EC, UV, or FL detection
TABLE 2. Curcuminoid content in tested samples (ng/mg sample).
Sample name C DMC BDMC
Japanese curry sauce 127 57.5 374
Turmeric powder 17,255 7,797 8,503
Yellow curry powder 1,804 813 847
The electrochemical detector is a popular choice of detection for analyzing natural products such as those found in turmeric, due to its selectivity and ability to measure antioxidant components in these products. The porous flow-through electrode design of the 6011RS coulometric cell used in this method offers near 100% conversion efficiency, which makes this detector highly sensitive. Figure 2 shows chromatograms of curcuminoid separation using EC, UV, or FL detection. Response with EC and UV were more uniform than FL. As shown in Table 1, much lower LoD was achieved with ECD than UV and FL detection of the curcuminoids. With the electro-chemical detector, the LOD (S/N =3) was 2 pg (on column) for C and DMC and 4 pg for BDMC; the LoQ was 10 pg for each curcuminoid on column with precision (%RSD) <10%. Three samples including turmeric powder, and two turmeric-containing products--yellow curry and a pellet curry sauce--were analyzed using the curcuminoids method reported herein; the results are summarized in Table 2 and example chromatograms shown in Figure 3. This method showed good specificity and selectivity even for the complex curry sauce sample. Figure 4 shows the calibration curve for the three curcuminoids in the range of 10 to 500 ng/mL. The correlation coefficient (R2) were >0.999 for all three compounds. Because of the therapeutic potential of the curcuminoids, researchers are also interested in the stability of these compounds. We found that curcuminoids are relatively thermal-stable. When turmeric powder was heated in an oven up to 120 ºC for 30 min, there was no appreciable loss of curcumin content. Curcumin undergoes degradation under acid, basic, light, and oxidation conditions. There have been some stability studies reported in literature that use UV detection4-6. However, UV detection had limitations. In our lab, a degradant of curcumin was found using EC detection of a turmeric extraction sample that had been stored in mobile phase (pH 3) at room temperature under light exposure for eight weeks, as shown in Figure 5. The fact that this degradant was not detected by UV and FL indicates that EC has advantages for studying curcuminoid stability in addition to its sensitivity and selectivity.
Results and Discussions The typical HPLC method for curcuminoids analysis using a C18 column usually takes 10 to 30 min to complete the chromatographic separation of analytes. The Acclaim RSLC PA2 column uses an amide-embedded chemistry that has the advantage of excellent hydrolytic stability (pH 1.5–10). With the alternate selectivity offered by PA2, separation of curcuminoids C, DMC, and BDMC was achieved in 3 mins without having to use a UHPLC system.
-0.100
0.250
0.500
0.700 1 - 033013 #46 1ug/mL sample EC ECDRS_1µA
1
C
DMC
BDMC
-2.0
5.0
10.0
16.0 2 - 033013 #30 1ug/mL sample UV UV_VIS_1mAU
2
C
DMC
BDMC
WVL:426 nm
0.00 0.50 1.00 1.50 2.00 2.50 3.00 3.50 4.00-5,000,000
10,000,000
20,000,000
30,000,000 3 - 033013 #38 1ug/mL sample FL Emission_1counts
min
3 C DMC
BDMC426 nm /539 nm
EC detection
UV detection
FL detection
-0.01 0.50 1.00 1.50 2.00 2.50 3.00 3.50 4.00 4.50 5.00-0.0107
0.0000
0.0100
0.0200
0.0300
0.0459 033013 #108 Japanese yellow curry sauce 1:1 ECDRS_1µA
min
C
DMC
BDMC
Japanese curry sauce sample 1:1 dilution
-0.00 0.50 1.00 1.50 2.00 2.50 3.00 3.50 4.00 4.50 5.00-0.055
0.000
0.050
0.100
0.144
1 - 033013 #105 Tumeric 1:100 ECDRS_12 - 033013 #106 yellow curry powder 1:10 ECDRS_1µA
min
2
1
C
DMC BDMC
Yellow curry powder sample 1:10 dilution
Turmeric powder sample 1:100 dilution
EC detection
EC detection
-0.0056
0.0100
0.0274 1 - 033013 #70 Tumeric 1:100 old sample EC ECDRS_1µA
1
C DMC BDMC
Degradation product
-260,741
500,000
1,240,059 2 - 033013 #93 Tumeric 1:100 old sample FL Emission_1counts
2
C
DMC
BDMC426 nm /539 nm
-0.00 0.50 1.00 1.50 2.00 2.50 3.00 3.50 4.00-0.26
0.50
0.96 3 - 033013 #97 Tumeric 1:100 old sample UV UV_VIS_1mAU
min
3
C DMC
BDMC
WVL:426 nm
EC detection
FL detection
UV detection
4 The Quantitative Analysis of Curcuminoids in Food and Food Additives Using Rapid HPLC With Electrochemical, UV, or Fluorescence Detection
References Grynkiewicz, G. and Ślifirski, P. Curcumin and curcuminoids in quest for medical
status, Acta Biochemica Polonica, 2012, 59(2), 201-212.
Rohman, A. Mini review analysis of curcuminods in food and pharmaceutical products, Int. Food Res. 2012, 19(1), 19-27.
Zhang, J.; Jinnai, S.; Ikeda, R.; Wada, M.; Hayashida, S.; Nakashima, K. A simple HPLC-fluorescence method for quantitation of curcuminods and its application to turmeric products, Anal. Sci., 2009, 25, 385-388.
Kishore, C.N.; Shrivastava; Anurekha, J. Stability-indicating RP-HPLC determination of curcumin in Vicco Turmeric cream and Haridrakhand churna, Phcog. J., 2010, 2 (6).
Pfeiffer E.; Hőhl, S.; Solyom, A.M.; Metzler M. Studies on stability of turmeric constituents, J. Food Eng., 2003, 56, 257-259.
Romson, S.; Sunisa, S.; Worapong, U. Stability of antioxidant and antibacterial properties in heated turmeric-chili paste and its ingredients, Int. Food Res., 2011, 18, 397-404.
Overview
Purpose: To develop a rapid HPLC method with electrochemical (EC) detection for quantitative determination of curcuminoids in foods and food additives. Detection limits were evaluated for EC, ultraviolet (UV), and fluorescence (FL) detection. Methods: Rapid HPLC method with electrochemical, UV and fluorescence detection. Results: The method presented here allows fast determination of curcuminoids including curcumin (C), demethoxycurcumin (DMC), and bisdemethoxycurcumin (BDMC) in food additive products within 3 mins following simple sample preparation. With electrochemical detection, the limit of detection (LOD) (S/N =3) was 2 pg (on column) for C and DMC and 4 pg for BDMC. A comparison of different detection technologies showed that ECD was more sensitive than UV detection, and was both more sensitive and had more uniform response than fluorescence detection.
Introduction Turmeric, the powered dry rhizome of the plant Curcuma longa, is widely used as a culinary additive to impart a distinctive yellow-orange color to Pakistani, Indian, and Thai cuisines. Turmeric has also been known for thousands of years as an Ayurvedic medicine. Research to date suggests that turmeric, besides having an immunomodulatory role, is also of use in preventing oxidative stress that can lead to inflammation, cancer, and arthritis. The natural products in turmeric that are purported to possess health benefits include a number of curcuminoids including curcumin (C), demethoxycurcumin (DMC) and bisdemethoxycurcumin (BDMC). Curcumin is now recognized as being responsible for most of the therapeutic effects. In recent times, there has been great interest in transforming curcumin into a drug candidate with prospective multipotent therapeutic applications1. Many analytical methods have been reported and reviewed by researchers for quantitative analysis of curcuminoids in food and pharmaceutical products2. The spectroscopic-based methods express quantitation of curcuminoids as total color content of the sample, while chromatographic-based methods including thin layer chromatography (TLC), capillary electrophoresis (CE), and high-performance liquid chromatography (HPLC), offer the advantage of separation and determination of individual curcuminoids. HPLC is the most reported technique for analysis of curcuminoids due to its high precision, accuracy, and low detection limit. HPLC separation of the curcuminods with a C18 column typically takes 10 to 30 min to complete the analysis2,3. Presented here is a rapid 3 min HPLC method using a Thermo Scientific™ Acclaim™ RSLC PolarAdvantage II (PA2) column and Dionex™ UltiMate™ 3000 electrochemical detector. Curcuminoids, including turmeric powder, curry powder and a pellet curry sauce, were quantitatively determined after simple ultrasonic extraction with methanol in three food products. ECD showed the best sensitivity among the three detection technologies, and had more uniform response than fluorescence detection. ECD also showed an advantage over UV and FL by being able to detect a degradation product of curcuminoids. Methods Liquid Chromatography A Thermo Scientific™ Dionex™ UltiMate™ 3000 HPLC system consisting of:
– LPG-3400BM Pump – WPS-3000 TBSL Autosampler – TCC-3000RS Thermostatted Column Compartment – ECD-3000RS Electrochemical Detector with 6011RS ultra Coulometric Analytical cell,
E1 = E2 = 700 mV – FLD-3400RS Fluorescence Detector with Dual PMT, Excitation 426 nm,
Emission 539 nm – VWD-3100 Variable Wavelength Detector, 426 nm
Analytical Column: Acclaim RSLC PA2, 2.1 × 50 mm, 3 µm Mobile Phase: 25% 100 mM phosphate buffer, pH 3, 75% methanol Flow Rate: 0.4 mL/min Injection Volume: 2 µL Data Analysis and Processing Chromatographic data were collected using Thermo Scientific™ Dionex™ Chromeleon™ Chromatography Data System ver. 6.8 (SR9) Standard Preparation Stock solution of C, DMC, and BDMC were prepared in methanol at 1 mg/mL. Working standards were prepared by dilution of stock solution in mobile phase. Sample Preparation Turmeric powder, yellow curry powder, and a pellet curry sauce sample were prepared at 1 mg/mL in methanol, then vortex-mixed and sonicated for 10 min. The solution was filtered through a 0.22 µm centrifuge tube filter and diluted with mobile phase prior to analysis.
© 2013 Thermo Fisher Scientific Inc. All rights reserved. All trademarks are the property of Thermo Fisher Scientific Inc. and its subsidiaries. This information is not intended to encourage use of these products in any manners that might infringe the
intellectual property rights of others PO70677_E 04/13S
The Quantitative Analysis of Curcuminoids in Food and Food Additives Using Rapid HPLC With Electrochemical, UV, or Fluorescence Detection Qi Zhang, David Thomas, and Ian Acworth
Thermo Fisher Scientific Inc., 22 Alpha Rd, Chelmsford, MA, 01824
FIGURE 1. Chemical structure of curcuminoids.
Curcumin (C) Demethoxycurcumin (DMC)
Bisdemethoxycucurminoids (BDMC)
TABLE 1. LoDs of the three curcuminoids using UV, FL, and EC detection.
Detector
LoD (pg on column)
C DMC BDMC
UV 10 20 20
FL 20 20 4
EC 2 2 4
FIGURE 3. EC chromatogram of turmeric powder, yellow curry powder, and a Japanese curry sauce sample.
FIGURE 5. Chromatograms showing a degradation product of curcuminoids determined by EC, but not by UV or FL detection.
Conclusion A 3 min method with EC detection was developed for quantitative analysis of
curcuminods in turmeric and turmeric-containing food products.
The comparison of EC, UV, and FL detection showed that EC was more sensitive than UV and was both more sensitive and had more uniform response than FL.
A degradation product of a curcuminoids sample subjected to low pH buffer solution and light exposure was detected by EC, but not by UV or FL. EC offers a major advantage over UV and FL for studying curcuminoids stability.
FIGURE 4. Calibration curve of curcuminoids C, DMC and BDMC.
FIGURE 2. Chromatograms showing separation of curcuminoids in 1 µg/mL standard using EC, UV, or FL detection
TABLE 2. Curcuminoid content in tested samples (ng/mg sample).
Sample name C DMC BDMC
Japanese curry sauce 127 57.5 374
Turmeric powder 17,255 7,797 8,503
Yellow curry powder 1,804 813 847
The electrochemical detector is a popular choice of detection for analyzing natural products such as those found in turmeric, due to its selectivity and ability to measure antioxidant components in these products. The porous flow-through electrode design of the 6011RS coulometric cell used in this method offers near 100% conversion efficiency, which makes this detector highly sensitive. Figure 2 shows chromatograms of curcuminoid separation using EC, UV, or FL detection. Response with EC and UV were more uniform than FL. As shown in Table 1, much lower LoD was achieved with ECD than UV and FL detection of the curcuminoids. With the electro-chemical detector, the LOD (S/N =3) was 2 pg (on column) for C and DMC and 4 pg for BDMC; the LoQ was 10 pg for each curcuminoid on column with precision (%RSD) <10%. Three samples including turmeric powder, and two turmeric-containing products--yellow curry and a pellet curry sauce--were analyzed using the curcuminoids method reported herein; the results are summarized in Table 2 and example chromatograms shown in Figure 3. This method showed good specificity and selectivity even for the complex curry sauce sample. Figure 4 shows the calibration curve for the three curcuminoids in the range of 10 to 500 ng/mL. The correlation coefficient (R2) were >0.999 for all three compounds. Because of the therapeutic potential of the curcuminoids, researchers are also interested in the stability of these compounds. We found that curcuminoids are relatively thermal-stable. When turmeric powder was heated in an oven up to 120 ºC for 30 min, there was no appreciable loss of curcumin content. Curcumin undergoes degradation under acid, basic, light, and oxidation conditions. There have been some stability studies reported in literature that use UV detection4-6. However, UV detection had limitations. In our lab, a degradant of curcumin was found using EC detection of a turmeric extraction sample that had been stored in mobile phase (pH 3) at room temperature under light exposure for eight weeks, as shown in Figure 5. The fact that this degradant was not detected by UV and FL indicates that EC has advantages for studying curcuminoid stability in addition to its sensitivity and selectivity.
Results and Discussions The typical HPLC method for curcuminoids analysis using a C18 column usually takes 10 to 30 min to complete the chromatographic separation of analytes. The Acclaim RSLC PA2 column uses an amide-embedded chemistry that has the advantage of excellent hydrolytic stability (pH 1.5–10). With the alternate selectivity offered by PA2, separation of curcuminoids C, DMC, and BDMC was achieved in 3 mins without having to use a UHPLC system.
-0.100
0.250
0.500
0.700 1 - 033013 #46 1ug/mL sample EC ECDRS_1µA
1
C
DMC
BDMC
-2.0
5.0
10.0
16.0 2 - 033013 #30 1ug/mL sample UV UV_VIS_1mAU
2
C
DMC
BDMC
WVL:426 nm
0.00 0.50 1.00 1.50 2.00 2.50 3.00 3.50 4.00-5,000,000
10,000,000
20,000,000
30,000,000 3 - 033013 #38 1ug/mL sample FL Emission_1counts
min
3 C DMC
BDMC426 nm /539 nm
EC detection
UV detection
FL detection
-0.01 0.50 1.00 1.50 2.00 2.50 3.00 3.50 4.00 4.50 5.00-0.0107
0.0000
0.0100
0.0200
0.0300
0.0459 033013 #108 Japanese yellow curry sauce 1:1 ECDRS_1µA
min
C
DMC
BDMC
Japanese curry sauce sample 1:1 dilution
-0.00 0.50 1.00 1.50 2.00 2.50 3.00 3.50 4.00 4.50 5.00-0.055
0.000
0.050
0.100
0.144
1 - 033013 #105 Tumeric 1:100 ECDRS_12 - 033013 #106 yellow curry powder 1:10 ECDRS_1µA
min
2
1
C
DMC BDMC
Yellow curry powder sample 1:10 dilution
Turmeric powder sample 1:100 dilution
EC detection
EC detection
-0.0056
0.0100
0.0274 1 - 033013 #70 Tumeric 1:100 old sample EC ECDRS_1µA
1
C DMC BDMC
Degradation product
-260,741
500,000
1,240,059 2 - 033013 #93 Tumeric 1:100 old sample FL Emission_1counts
2
C
DMC
BDMC 426 nm /539 nm
-0.00 0.50 1.00 1.50 2.00 2.50 3.00 3.50 4.00-0.26
0.50
0.96 3 - 033013 #97 Tumeric 1:100 old sample UV UV_VIS_1mAU
min
3
C DMC
BDMC
WVL:426 nm
EC detection
FL detection
UV detection
5Thermo Scientific Poster Note • PN70677_e 05/13S
References Grynkiewicz, G. and Ślifirski, P. Curcumin and curcuminoids in quest for medical
status, Acta Biochemica Polonica, 2012, 59(2), 201-212.
Rohman, A. Mini review analysis of curcuminods in food and pharmaceutical products, Int. Food Res. 2012, 19(1), 19-27.
Zhang, J.; Jinnai, S.; Ikeda, R.; Wada, M.; Hayashida, S.; Nakashima, K. A simple HPLC-fluorescence method for quantitation of curcuminods and its application to turmeric products, Anal. Sci., 2009, 25, 385-388.
Kishore, C.N.; Shrivastava; Anurekha, J. Stability-indicating RP-HPLC determination of curcumin in Vicco Turmeric cream and Haridrakhand churna, Phcog. J., 2010, 2 (6).
Pfeiffer E.; Hőhl, S.; Solyom, A.M.; Metzler M. Studies on stability of turmeric constituents, J. Food Eng., 2003, 56, 257-259.
Romson, S.; Sunisa, S.; Worapong, U. Stability of antioxidant and antibacterial properties in heated turmeric-chili paste and its ingredients, Int. Food Res., 2011, 18, 397-404.
Overview
Purpose: To develop a rapid HPLC method with electrochemical (EC) detection for quantitative determination of curcuminoids in foods and food additives. Detection limits were evaluated for EC, ultraviolet (UV), and fluorescence (FL) detection. Methods: Rapid HPLC method with electrochemical, UV and fluorescence detection. Results: The method presented here allows fast determination of curcuminoids including curcumin (C), demethoxycurcumin (DMC), and bisdemethoxycurcumin (BDMC) in food additive products within 3 mins following simple sample preparation. With electrochemical detection, the limit of detection (LOD) (S/N =3) was 2 pg (on column) for C and DMC and 4 pg for BDMC. A comparison of different detection technologies showed that ECD was more sensitive than UV detection, and was both more sensitive and had more uniform response than fluorescence detection.
Introduction Turmeric, the powered dry rhizome of the plant Curcuma longa, is widely used as a culinary additive to impart a distinctive yellow-orange color to Pakistani, Indian, and Thai cuisines. Turmeric has also been known for thousands of years as an Ayurvedic medicine. Research to date suggests that turmeric, besides having an immunomodulatory role, is also of use in preventing oxidative stress that can lead to inflammation, cancer, and arthritis. The natural products in turmeric that are purported to possess health benefits include a number of curcuminoids including curcumin (C), demethoxycurcumin (DMC) and bisdemethoxycurcumin (BDMC). Curcumin is now recognized as being responsible for most of the therapeutic effects. In recent times, there has been great interest in transforming curcumin into a drug candidate with prospective multipotent therapeutic applications1. Many analytical methods have been reported and reviewed by researchers for quantitative analysis of curcuminoids in food and pharmaceutical products2. The spectroscopic-based methods express quantitation of curcuminoids as total color content of the sample, while chromatographic-based methods including thin layer chromatography (TLC), capillary electrophoresis (CE), and high-performance liquid chromatography (HPLC), offer the advantage of separation and determination of individual curcuminoids. HPLC is the most reported technique for analysis of curcuminoids due to its high precision, accuracy, and low detection limit. HPLC separation of the curcuminods with a C18 column typically takes 10 to 30 min to complete the analysis2,3. Presented here is a rapid 3 min HPLC method using a Thermo Scientific™ Acclaim™ RSLC PolarAdvantage II (PA2) column and Dionex™ UltiMate™ 3000 electrochemical detector. Curcuminoids, including turmeric powder, curry powder and a pellet curry sauce, were quantitatively determined after simple ultrasonic extraction with methanol in three food products. ECD showed the best sensitivity among the three detection technologies, and had more uniform response than fluorescence detection. ECD also showed an advantage over UV and FL by being able to detect a degradation product of curcuminoids. Methods Liquid Chromatography A Thermo Scientific™ Dionex™ UltiMate™ 3000 HPLC system consisting of:
– LPG-3400BM Pump – WPS-3000 TBSL Autosampler – TCC-3000RS Thermostatted Column Compartment – ECD-3000RS Electrochemical Detector with 6011RS ultra Coulometric Analytical cell,
E1 = E2 = 700 mV – FLD-3400RS Fluorescence Detector with Dual PMT, Excitation 426 nm,
Emission 539 nm – VWD-3100 Variable Wavelength Detector, 426 nm
Analytical Column: Acclaim RSLC PA2, 2.1 × 50 mm, 3 µm Mobile Phase: 25% 100 mM phosphate buffer, pH 3, 75% methanol Flow Rate: 0.4 mL/min Injection Volume: 2 µL Data Analysis and Processing Chromatographic data were collected using Thermo Scientific™ Dionex™ Chromeleon™ Chromatography Data System ver. 6.8 (SR9) Standard Preparation Stock solution of C, DMC, and BDMC were prepared in methanol at 1 mg/mL. Working standards were prepared by dilution of stock solution in mobile phase. Sample Preparation Turmeric powder, yellow curry powder, and a pellet curry sauce sample were prepared at 1 mg/mL in methanol, then vortex-mixed and sonicated for 10 min. The solution was filtered through a 0.22 µm centrifuge tube filter and diluted with mobile phase prior to analysis.
© 2013 Thermo Fisher Scientific Inc. All rights reserved. All trademarks are the property of Thermo Fisher Scientific Inc. and its subsidiaries. This information is not intended to encourage use of these products in any manners that might infringe the
intellectual property rights of others PO70677_E 04/13S
The Quantitative Analysis of Curcuminoids in Food and Food Additives Using Rapid HPLC With Electrochemical, UV, or Fluorescence Detection Qi Zhang, David Thomas, and Ian Acworth
Thermo Fisher Scientific Inc., 22 Alpha Rd, Chelmsford, MA, 01824
FIGURE 1. Chemical structure of curcuminoids.
Curcumin (C) Demethoxycurcumin (DMC)
Bisdemethoxycucurminoids (BDMC)
TABLE 1. LoDs of the three curcuminoids using UV, FL, and EC detection.
Detector
LoD (pg on column)
C DMC BDMC
UV 10 20 20
FL 20 20 4
EC 2 2 4
FIGURE 3. EC chromatogram of turmeric powder, yellow curry powder, and a Japanese curry sauce sample.
FIGURE 5. Chromatograms showing a degradation product of curcuminoids determined by EC, but not by UV or FL detection.
Conclusion A 3 min method with EC detection was developed for quantitative analysis of
curcuminods in turmeric and turmeric-containing food products.
The comparison of EC, UV, and FL detection showed that EC was more sensitive than UV and was both more sensitive and had more uniform response than FL.
A degradation product of a curcuminoids sample subjected to low pH buffer solution and light exposure was detected by EC, but not by UV or FL. EC offers a major advantage over UV and FL for studying curcuminoids stability.
FIGURE 4. Calibration curve of curcuminoids C, DMC and BDMC.
FIGURE 2. Chromatograms showing separation of curcuminoids in 1 µg/mL standard using EC, UV, or FL detection
TABLE 2. Curcuminoid content in tested samples (ng/mg sample).
Sample name C DMC BDMC
Japanese curry sauce 127 57.5 374
Turmeric powder 17,255 7,797 8,503
Yellow curry powder 1,804 813 847
The electrochemical detector is a popular choice of detection for analyzing natural products such as those found in turmeric, due to its selectivity and ability to measure antioxidant components in these products. The porous flow-through electrode design of the 6011RS coulometric cell used in this method offers near 100% conversion efficiency, which makes this detector highly sensitive. Figure 2 shows chromatograms of curcuminoid separation using EC, UV, or FL detection. Response with EC and UV were more uniform than FL. As shown in Table 1, much lower LoD was achieved with ECD than UV and FL detection of the curcuminoids. With the electro-chemical detector, the LOD (S/N =3) was 2 pg (on column) for C and DMC and 4 pg for BDMC; the LoQ was 10 pg for each curcuminoid on column with precision (%RSD) <10%. Three samples including turmeric powder, and two turmeric-containing products--yellow curry and a pellet curry sauce--were analyzed using the curcuminoids method reported herein; the results are summarized in Table 2 and example chromatograms shown in Figure 3. This method showed good specificity and selectivity even for the complex curry sauce sample. Figure 4 shows the calibration curve for the three curcuminoids in the range of 10 to 500 ng/mL. The correlation coefficient (R2) were >0.999 for all three compounds. Because of the therapeutic potential of the curcuminoids, researchers are also interested in the stability of these compounds. We found that curcuminoids are relatively thermal-stable. When turmeric powder was heated in an oven up to 120 ºC for 30 min, there was no appreciable loss of curcumin content. Curcumin undergoes degradation under acid, basic, light, and oxidation conditions. There have been some stability studies reported in literature that use UV detection4-6. However, UV detection had limitations. In our lab, a degradant of curcumin was found using EC detection of a turmeric extraction sample that had been stored in mobile phase (pH 3) at room temperature under light exposure for eight weeks, as shown in Figure 5. The fact that this degradant was not detected by UV and FL indicates that EC has advantages for studying curcuminoid stability in addition to its sensitivity and selectivity.
Results and Discussions The typical HPLC method for curcuminoids analysis using a C18 column usually takes 10 to 30 min to complete the chromatographic separation of analytes. The Acclaim RSLC PA2 column uses an amide-embedded chemistry that has the advantage of excellent hydrolytic stability (pH 1.5–10). With the alternate selectivity offered by PA2, separation of curcuminoids C, DMC, and BDMC was achieved in 3 mins without having to use a UHPLC system.
-0.100
0.250
0.500
0.700 1 - 033013 #46 1ug/mL sample EC ECDRS_1µA
1
C
DMC
BDMC
-2.0
5.0
10.0
16.0 2 - 033013 #30 1ug/mL sample UV UV_VIS_1mAU
2
C
DMC
BDMC
WVL:426 nm
0.00 0.50 1.00 1.50 2.00 2.50 3.00 3.50 4.00-5,000,000
10,000,000
20,000,000
30,000,000 3 - 033013 #38 1ug/mL sample FL Emission_1counts
min
3 C DMC
BDMC426 nm /539 nm
EC detection
UV detection
FL detection
-0.01 0.50 1.00 1.50 2.00 2.50 3.00 3.50 4.00 4.50 5.00-0.0107
0.0000
0.0100
0.0200
0.0300
0.0459 033013 #108 Japanese yellow curry sauce 1:1 ECDRS_1µA
min
C
DMC
BDMC
Japanese curry sauce sample 1:1 dilution
-0.00 0.50 1.00 1.50 2.00 2.50 3.00 3.50 4.00 4.50 5.00-0.055
0.000
0.050
0.100
0.144
1 - 033013 #105 Tumeric 1:100 ECDRS_12 - 033013 #106 yellow curry powder 1:10 ECDRS_1µA
min
2
1
C
DMC BDMC
Yellow curry powder sample 1:10 dilution
Turmeric powder sample 1:100 dilution
EC detection
EC detection
-0.0056
0.0100
0.0274 1 - 033013 #70 Tumeric 1:100 old sample EC ECDRS_1µA
1
C DMC BDMC
Degradation product
-260,741
500,000
1,240,059 2 - 033013 #93 Tumeric 1:100 old sample FL Emission_1counts
2
C
DMC
BDMC426 nm /539 nm
-0.00 0.50 1.00 1.50 2.00 2.50 3.00 3.50 4.00-0.26
0.50
0.96 3 - 033013 #97 Tumeric 1:100 old sample UV UV_VIS_1mAU
min
3
C DMC
BDMC
WVL:426 nm
EC detection
FL detection
UV detection
6 The Quantitative Analysis of Curcuminoids in Food and Food Additives Using Rapid HPLC With Electrochemical, UV, or Fluorescence Detection
References Grynkiewicz, G. and Ślifirski, P. Curcumin and curcuminoids in quest for medical
status, Acta Biochemica Polonica, 2012, 59(2), 201-212.
Rohman, A. Mini review analysis of curcuminods in food and pharmaceutical products, Int. Food Res. 2012, 19(1), 19-27.
Zhang, J.; Jinnai, S.; Ikeda, R.; Wada, M.; Hayashida, S.; Nakashima, K. A simple HPLC-fluorescence method for quantitation of curcuminods and its application to turmeric products, Anal. Sci., 2009, 25, 385-388.
Kishore, C.N.; Shrivastava; Anurekha, J. Stability-indicating RP-HPLC determination of curcumin in Vicco Turmeric cream and Haridrakhand churna, Phcog. J., 2010, 2 (6).
Pfeiffer E.; Hőhl, S.; Solyom, A.M.; Metzler M. Studies on stability of turmeric constituents, J. Food Eng., 2003, 56, 257-259.
Romson, S.; Sunisa, S.; Worapong, U. Stability of antioxidant and antibacterial properties in heated turmeric-chili paste and its ingredients, Int. Food Res., 2011, 18, 397-404.
Overview
Purpose: To develop a rapid HPLC method with electrochemical (EC) detection for quantitative determination of curcuminoids in foods and food additives. Detection limits were evaluated for EC, ultraviolet (UV), and fluorescence (FL) detection. Methods: Rapid HPLC method with electrochemical, UV and fluorescence detection. Results: The method presented here allows fast determination of curcuminoids including curcumin (C), demethoxycurcumin (DMC), and bisdemethoxycurcumin (BDMC) in food additive products within 3 mins following simple sample preparation. With electrochemical detection, the limit of detection (LOD) (S/N =3) was 2 pg (on column) for C and DMC and 4 pg for BDMC. A comparison of different detection technologies showed that ECD was more sensitive than UV detection, and was both more sensitive and had more uniform response than fluorescence detection.
Introduction Turmeric, the powered dry rhizome of the plant Curcuma longa, is widely used as a culinary additive to impart a distinctive yellow-orange color to Pakistani, Indian, and Thai cuisines. Turmeric has also been known for thousands of years as an Ayurvedic medicine. Research to date suggests that turmeric, besides having an immunomodulatory role, is also of use in preventing oxidative stress that can lead to inflammation, cancer, and arthritis. The natural products in turmeric that are purported to possess health benefits include a number of curcuminoids including curcumin (C), demethoxycurcumin (DMC) and bisdemethoxycurcumin (BDMC). Curcumin is now recognized as being responsible for most of the therapeutic effects. In recent times, there has been great interest in transforming curcumin into a drug candidate with prospective multipotent therapeutic applications1. Many analytical methods have been reported and reviewed by researchers for quantitative analysis of curcuminoids in food and pharmaceutical products2. The spectroscopic-based methods express quantitation of curcuminoids as total color content of the sample, while chromatographic-based methods including thin layer chromatography (TLC), capillary electrophoresis (CE), and high-performance liquid chromatography (HPLC), offer the advantage of separation and determination of individual curcuminoids. HPLC is the most reported technique for analysis of curcuminoids due to its high precision, accuracy, and low detection limit. HPLC separation of the curcuminods with a C18 column typically takes 10 to 30 min to complete the analysis2,3. Presented here is a rapid 3 min HPLC method using a Thermo Scientific™ Acclaim™ RSLC PolarAdvantage II (PA2) column and Dionex™ UltiMate™ 3000 electrochemical detector. Curcuminoids, including turmeric powder, curry powder and a pellet curry sauce, were quantitatively determined after simple ultrasonic extraction with methanol in three food products. ECD showed the best sensitivity among the three detection technologies, and had more uniform response than fluorescence detection. ECD also showed an advantage over UV and FL by being able to detect a degradation product of curcuminoids. Methods Liquid Chromatography A Thermo Scientific™ Dionex™ UltiMate™ 3000 HPLC system consisting of:
– LPG-3400BM Pump – WPS-3000 TBSL Autosampler – TCC-3000RS Thermostatted Column Compartment – ECD-3000RS Electrochemical Detector with 6011RS ultra Coulometric Analytical cell,
E1 = E2 = 700 mV – FLD-3400RS Fluorescence Detector with Dual PMT, Excitation 426 nm,
Emission 539 nm – VWD-3100 Variable Wavelength Detector, 426 nm
Analytical Column: Acclaim RSLC PA2, 2.1 × 50 mm, 3 µm Mobile Phase: 25% 100 mM phosphate buffer, pH 3, 75% methanol Flow Rate: 0.4 mL/min Injection Volume: 2 µL Data Analysis and Processing Chromatographic data were collected using Thermo Scientific™ Dionex™ Chromeleon™ Chromatography Data System ver. 6.8 (SR9) Standard Preparation Stock solution of C, DMC, and BDMC were prepared in methanol at 1 mg/mL. Working standards were prepared by dilution of stock solution in mobile phase. Sample Preparation Turmeric powder, yellow curry powder, and a pellet curry sauce sample were prepared at 1 mg/mL in methanol, then vortex-mixed and sonicated for 10 min. The solution was filtered through a 0.22 µm centrifuge tube filter and diluted with mobile phase prior to analysis.
© 2013 Thermo Fisher Scientific Inc. All rights reserved. All trademarks are the property of Thermo Fisher Scientific Inc. and its subsidiaries. This information is not intended to encourage use of these products in any manners that might infringe the
intellectual property rights of others PO70677_E 04/13S
The Quantitative Analysis of Curcuminoids in Food and Food Additives Using Rapid HPLC With Electrochemical, UV, or Fluorescence Detection Qi Zhang, David Thomas, and Ian Acworth
Thermo Fisher Scientific Inc., 22 Alpha Rd, Chelmsford, MA, 01824
FIGURE 1. Chemical structure of curcuminoids.
Curcumin (C) Demethoxycurcumin (DMC)
Bisdemethoxycucurminoids (BDMC)
TABLE 1. LoDs of the three curcuminoids using UV, FL, and EC detection.
Detector
LoD (pg on column)
C DMC BDMC
UV 10 20 20
FL 20 20 4
EC 2 2 4
FIGURE 3. EC chromatogram of turmeric powder, yellow curry powder, and a Japanese curry sauce sample.
FIGURE 5. Chromatograms showing a degradation product of curcuminoids determined by EC, but not by UV or FL detection.
Conclusion A 3 min method with EC detection was developed for quantitative analysis of
curcuminods in turmeric and turmeric-containing food products.
The comparison of EC, UV, and FL detection showed that EC was more sensitive than UV and was both more sensitive and had more uniform response than FL.
A degradation product of a curcuminoids sample subjected to low pH buffer solution and light exposure was detected by EC, but not by UV or FL. EC offers a major advantage over UV and FL for studying curcuminoids stability.
FIGURE 4. Calibration curve of curcuminoids C, DMC and BDMC.
FIGURE 2. Chromatograms showing separation of curcuminoids in 1 µg/mL standard using EC, UV, or FL detection
TABLE 2. Curcuminoid content in tested samples (ng/mg sample).
Sample name C DMC BDMC
Japanese curry sauce 127 57.5 374
Turmeric powder 17,255 7,797 8,503
Yellow curry powder 1,804 813 847
The electrochemical detector is a popular choice of detection for analyzing natural products such as those found in turmeric, due to its selectivity and ability to measure antioxidant components in these products. The porous flow-through electrode design of the 6011RS coulometric cell used in this method offers near 100% conversion efficiency, which makes this detector highly sensitive. Figure 2 shows chromatograms of curcuminoid separation using EC, UV, or FL detection. Response with EC and UV were more uniform than FL. As shown in Table 1, much lower LoD was achieved with ECD than UV and FL detection of the curcuminoids. With the electro-chemical detector, the LOD (S/N =3) was 2 pg (on column) for C and DMC and 4 pg for BDMC; the LoQ was 10 pg for each curcuminoid on column with precision (%RSD) <10%. Three samples including turmeric powder, and two turmeric-containing products--yellow curry and a pellet curry sauce--were analyzed using the curcuminoids method reported herein; the results are summarized in Table 2 and example chromatograms shown in Figure 3. This method showed good specificity and selectivity even for the complex curry sauce sample. Figure 4 shows the calibration curve for the three curcuminoids in the range of 10 to 500 ng/mL. The correlation coefficient (R2) were >0.999 for all three compounds. Because of the therapeutic potential of the curcuminoids, researchers are also interested in the stability of these compounds. We found that curcuminoids are relatively thermal-stable. When turmeric powder was heated in an oven up to 120 ºC for 30 min, there was no appreciable loss of curcumin content. Curcumin undergoes degradation under acid, basic, light, and oxidation conditions. There have been some stability studies reported in literature that use UV detection4-6. However, UV detection had limitations. In our lab, a degradant of curcumin was found using EC detection of a turmeric extraction sample that had been stored in mobile phase (pH 3) at room temperature under light exposure for eight weeks, as shown in Figure 5. The fact that this degradant was not detected by UV and FL indicates that EC has advantages for studying curcuminoid stability in addition to its sensitivity and selectivity.
Results and Discussions The typical HPLC method for curcuminoids analysis using a C18 column usually takes 10 to 30 min to complete the chromatographic separation of analytes. The Acclaim RSLC PA2 column uses an amide-embedded chemistry that has the advantage of excellent hydrolytic stability (pH 1.5–10). With the alternate selectivity offered by PA2, separation of curcuminoids C, DMC, and BDMC was achieved in 3 mins without having to use a UHPLC system.
-0.100
0.250
0.500
0.700 1 - 033013 #46 1ug/mL sample EC ECDRS_1µA
1
C
DMC
BDMC
-2.0
5.0
10.0
16.0 2 - 033013 #30 1ug/mL sample UV UV_VIS_1mAU
2
C
DMC
BDMC
WVL:426 nm
0.00 0.50 1.00 1.50 2.00 2.50 3.00 3.50 4.00-5,000,000
10,000,000
20,000,000
30,000,000 3 - 033013 #38 1ug/mL sample FL Emission_1counts
min
3 C DMC
BDMC426 nm /539 nm
EC detection
UV detection
FL detection
-0.01 0.50 1.00 1.50 2.00 2.50 3.00 3.50 4.00 4.50 5.00-0.0107
0.0000
0.0100
0.0200
0.0300
0.0459 033013 #108 Japanese yellow curry sauce 1:1 ECDRS_1µA
min
C
DMC
BDMC
Japanese curry sauce sample 1:1 dilution
-0.00 0.50 1.00 1.50 2.00 2.50 3.00 3.50 4.00 4.50 5.00-0.055
0.000
0.050
0.100
0.144
1 - 033013 #105 Tumeric 1:100 ECDRS_12 - 033013 #106 yellow curry powder 1:10 ECDRS_1µA
min
2
1
C
DMC BDMC
Yellow curry powder sample 1:10 dilution
Turmeric powder sample 1:100 dilution
EC detection
EC detection
-0.0056
0.0100
0.0274 1 - 033013 #70 Tumeric 1:100 old sample EC ECDRS_1µA
1
C DMC BDMC
Degradation product
-260,741
500,000
1,240,059 2 - 033013 #93 Tumeric 1:100 old sample FL Emission_1counts
2
C
DMC
BDMC426 nm /539 nm
-0.00 0.50 1.00 1.50 2.00 2.50 3.00 3.50 4.00-0.26
0.50
0.96 3 - 033013 #97 Tumeric 1:100 old sample UV UV_VIS_1mAU
min
3
C DMC
BDMC
WVL:426 nm
EC detection
FL detection
UV detection
www.thermofisher.com/dionex©2016 Thermo Fisher Scientific Inc. All rights reserved. All trademarks are the property of Thermo Fisher Scientific Inc. and its subsidiaries. This information is presented as an example of the capabilities of Thermo Fisher Scientific Inc. products. It is not intended to encourage use of these products in any manners that might infringe the intellectual property rights of others. Specifications, terms and pricing are subject to change. Not all products are available in all countries. Please consult your local sales representative for details.
Australia +61 3 9757 4486 Austria +43 1 333 50 34 0 Belgium +32 53 73 42 41 Brazil +55 11 3731 5140 China +852 2428 3282
PN70677_E 09/16S
Denmark +45 70 23 62 60France +33 1 60 92 48 00Germany +49 6126 991 0India +91 22 6742 9494Italy +39 02 51 62 1267
Japan +81 6 6885 1213Korea +82 2 3420 8600Netherlands +31 76 579 55 55Singapore +65 6289 1190 Sweden +46 8 473 3380
Switzerland +41 62 205 9966Taiwan +886 2 8751 6655UK/Ireland +44 1442 233555USA and Canada +847 295 7500
References Grynkiewicz, G. and Ślifirski, P. Curcumin and curcuminoids in quest for medical
status, Acta Biochemica Polonica, 2012, 59(2), 201-212.
Rohman, A. Mini review analysis of curcuminods in food and pharmaceuticalproducts, Int. Food Res. 2012, 19(1), 19-27.
Zhang, J.; Jinnai, S.; Ikeda, R.; Wada, M.; Hayashida, S.; Nakashima, K. A simpleHPLC-fluorescence method for quantitation of curcuminods and its application toturmeric products, Anal. Sci., 2009, 25, 385-388.
Kishore, C.N.; Shrivastava; Anurekha, J. Stability-indicating RP-HPLC determinationof curcumin in Vicco Turmeric cream and Haridrakhand churna, Phcog. J., 2010, 2 (6).
Pfeiffer E.; Hőhl, S.; Solyom, A.M.; Metzler M. Studies on stability of turmericconstituents, J. Food Eng., 2003, 56, 257-259.
Romson, S.; Sunisa, S.; Worapong, U. Stability of antioxidant and antibacterialproperties in heated turmeric-chili paste and its ingredients, Int. Food Res., 2011, 18,397-404.
Overview Purpose: To develop a rapid HPLC method with electrochemical (EC) detection for quantitative determination of curcuminoids in foods and food additives. Detection limits were evaluated for EC, ultraviolet (UV), and fluorescence (FL) detection.
Methods: Rapid HPLC method with electrochemical, UV and fluorescence detection.
Results: The method presented here allows fast determination of curcuminoids including curcumin (C), demethoxycurcumin (DMC), and bisdemethoxycurcumin (BDMC) in food additive products within 3 mins following simple sample preparation. With electrochemical detection, the limit of detection (LOD) (S/N =3) was 2 pg (on column) for C and DMC and 4 pg for BDMC. A comparison of different detection technologies showed that ECD was more sensitive than UV detection, and was both more sensitive and had more uniform response than fluorescence detection.
Introduction
Turmeric, the powered dry rhizome of the plant Curcuma longa, is widely used as a culinary additive to impart a distinctive yellow-orange color to Pakistani, Indian, and Thai cuisines. Turmeric has also been known for thousands of years as an Ayurvedic medicine. Research to date suggests that turmeric, besides having an immunomodulatory role, is also of use in preventing oxidative stress that can lead to inflammation, cancer, and arthritis. The natural products in turmeric that are purported to possess health benefits include a number of curcuminoids including curcumin (C), demethoxycurcumin (DMC) and bisdemethoxycurcumin (BDMC). Curcumin is now recognized as being responsible for most of the therapeutic effects. In recent times, there has been great interest in transforming curcumin into a drug candidate with prospective multipotent therapeutic applications1.
Many analytical methods have been reported and reviewed by researchers for quantitative analysis of curcuminoids in food and pharmaceutical products2. The spectroscopic-based methods express quantitation of curcuminoids as total color content of the sample, while chromatographic-based methods including thin layer chromatography (TLC), capillary electrophoresis (CE), and high-performance liquid chromatography (HPLC), offer the advantage of separation and determination of individual curcuminoids. HPLC is the most reported technique for analysis of curcuminoids due to its high precision, accuracy, and low detection limit.
HPLC separation of the curcuminods with a C18 column typically takes 10 to 30 min to complete the analysis2,3. Presented here is a rapid 3 min HPLC method using a Thermo Scientific™ Acclaim™ RSLC PolarAdvantage II (PA2) column and Dionex™ UltiMate™ 3000 electrochemical detector. Curcuminoids, including turmeric powder, curry powder and a pellet curry sauce, were quantitatively determined after simple ultrasonic extraction with methanol in three food products. ECD showed the best sensitivity among the three detection technologies, and had more uniform response than fluorescence detection. ECD also showed an advantage over UV and FL by being able to detect a degradation product of curcuminoids.
Methods Liquid Chromatography A Thermo Scientific™ Dionex™ UltiMate™ 3000 HPLC system consisting of:
– LPG-3400BM Pump – WPS-3000 TBSL Autosampler – TCC-3000RS Thermostatted Column Compartment – ECD-3000RS Electrochemical Detector with 6011RS ultra Coulometric Analytical cell,
E1 = E2 = 700 mV– FLD-3400RS Fluorescence Detector with Dual PMT, Excitation 426 nm,
Emission 539 nm – VWD-3100 Variable Wavelength Detector, 426 nm
Analytical Column: Acclaim RSLC PA2, 2.1 × 50 mm, 3 µm Mobile Phase: 25% 100 mM phosphate buffer, pH 3, 75% methanol Flow Rate: 0.4 mL/min Injection Volume: 2 µL
Data Analysis and Processing Chromatographic data were collected using Thermo Scientific™ Dionex™ Chromeleon™ Chromatography Data System ver. 6.8 (SR9)
Standard Preparation Stock solution of C, DMC, and BDMC were prepared in methanol at 1 mg/mL. Working standards were prepared by dilution of stock solution in mobile phase.
Sample Preparation Turmeric powder, yellow curry powder, and a pellet curry sauce sample were prepared at 1 mg/mL in methanol, then vortex-mixed and sonicated for 10 min. The solution was filtered through a 0.22 µm centrifuge tube filter and diluted with mobile phase prior to analysis.
© 2013 Thermo Fisher Scientific Inc. All rights reserved. All trademarks are the property of Thermo Fisher Scientific Inc. and its subsidiaries. This information is not intended to encourage use of these products in any manners that might infringe the
intellectual property rights of others PO70677_E 04/13S
The Quantitative Analysis of Curcuminoids in Food and Food Additives Using Rapid HPLC With Electrochemical, UV, or Fluorescence Detection Qi Zhang, David Thomas, and Ian Acworth
Thermo Fisher Scientific Inc., 22 Alpha Rd, Chelmsford, MA, 01824
FIGURE 1. Chemical structure of curcuminoids.
Curcumin (C) Demethoxycurcumin (DMC)
Bisdemethoxycucurminoids (BDMC)
TABLE 1. LoDs of the three curcuminoids using UV, FL, and EC detection.
Detector
LoD (pg on column)
C DMC BDMC
UV 10 20 20
FL 20 20 4
EC 2 2 4
FIGURE 3. EC chromatogram of turmeric powder, yellow curry powder, and a Japanese curry sauce sample.
FIGURE 5. Chromatograms showing a degradation product of curcuminoids determined by EC, but not by UV or FL detection.
Conclusion A 3 min method with EC detection was developed for quantitative analysis of
curcuminods in turmeric and turmeric-containing food products.
The comparison of EC, UV, and FL detection showed that EC was more sensitivethan UV and was both more sensitive and had more uniform response than FL.
A degradation product of a curcuminoids sample subjected to low pH buffersolution and light exposure was detected by EC, but not by UV or FL. EC offers amajor advantage over UV and FL for studying curcuminoids stability.
FIGURE 4. Calibration curve of curcuminoids C, DMC and BDMC.
FIGURE 2. Chromatograms showing separation of curcuminoids in 1 µg/mLstandard using EC, UV, or FL detection
TABLE 2. Curcuminoid content in tested samples (ng/mg sample).
Sample name C DMC BDMC
Japanese curry sauce 127 57.5 374
Turmeric powder 17,255 7,797 8,503
Yellow curry powder 1,804 813 847
The electrochemical detector is a popular choice of detection for analyzing natural products such as those found in turmeric, due to its selectivity and ability to measure antioxidant components in these products. The porous flow-through electrode design of the 6011RS coulometric cell used in this method offers near 100% conversion efficiency, which makes this detector highly sensitive.
Figure 2 shows chromatograms of curcuminoid separation using EC, UV, or FL detection. Response with EC and UV were more uniform than FL. As shown in Table 1, much lower LoD was achieved with ECD than UV and FL detection of the curcuminoids. With the electro-chemical detector, the LOD (S/N =3) was 2 pg (on column) for C and DMC and 4 pg for BDMC; the LoQ was 10 pg for each curcuminoid on column with precision (%RSD) <10%.
Three samples including turmeric powder, and two turmeric-containing products--yellow curry and a pellet curry sauce--were analyzed using the curcuminoids method reported herein; the results are summarized in Table 2 and example chromatograms shown in Figure 3. This method showed good specificity and selectivity even for the complex curry sauce sample. Figure 4 shows the calibration curve for the three curcuminoids in the range of 10 to 500 ng/mL. The correlation coefficient (R2) were >0.999 for all three compounds.
Because of the therapeutic potential of the curcuminoids, researchers are also interested in the stability of these compounds. We found that curcuminoids are relatively thermal-stable. When turmeric powder was heated in an oven up to 120 ºC for 30 min, there was no appreciable loss of curcumin content. Curcumin undergoes degradation under acid, basic, light, and oxidation conditions. There have been some stability studies reported in literature that use UV detection4-6. However, UV detection had limitations. In our lab, a degradant of curcumin was found using EC detection of a turmeric extraction sample that had been stored in mobile phase (pH 3) at room temperature under light exposure for eight weeks, as shown in Figure 5. The fact that this degradant was not detected by UV and FL indicates that EC has advantages for studying curcuminoid stability in addition to its sensitivity and selectivity.
Results and Discussions The typical HPLC method for curcuminoids analysis using a C18 column usually takes 10 to 30 min to complete the chromatographic separation of analytes. The Acclaim RSLC PA2 column uses an amide-embedded chemistry that has the advantage of excellent hydrolytic stability (pH 1.5–10). With the alternate selectivity offered by PA2, separation of curcuminoids C, DMC, and BDMC was achieved in 3 mins without having to use a UHPLC system.
-0.100
0.250
0.500
0.700 1 - 033013 #46 1ug/mL sample EC ECDRS_1µA
1
C
DMC
BDMC
-2.0
5.0
10.0
16.0 2 - 033013 #30 1ug/mL sample UV UV_VIS_1mAU
2
C
DMC
BDMC
WVL:426 nm
0.00 0.50 1.00 1.50 2.00 2.50 3.00 3.50 4.00-5,000,000
10,000,000
20,000,000
30,000,000 3 - 033013 #38 1ug/mL sample FL Emission_1counts
min
3 C DMC
BDMC426 nm /539 nm
EC detection
UV detection
FL detection
-0.01 0.50 1.00 1.50 2.00 2.50 3.00 3.50 4.00 4.50 5.00-0.0107
0.0000
0.0100
0.0200
0.0300
0.0459 033013 #108 Japanese yellow curry sauce 1:1 ECDRS_1µA
min
C
DMC
BDMC
Japanese curry sauce sample 1:1 dilution
-0.00 0.50 1.00 1.50 2.00 2.50 3.00 3.50 4.00 4.50 5.00-0.055
0.000
0.050
0.100
0.144
1 - 033013 #105 Tumeric 1:100 ECDRS_12 - 033013 #106 yellow curry powder 1:10 ECDRS_1µA
min
2
1
C
DMC BDMC
Yellow curry powder sample 1:10 dilution
Turmeric powder sample 1:100 dilution
EC detection
EC detection
-0.0056
0.0100
0.0274 1 - 033013 #70 Tumeric 1:100 old sample EC ECDRS_1µA
1
C DMC BDMC
Degradation product
-260,741
500,000
1,240,059 2 - 033013 #93 Tumeric 1:100 old sample FL Emission_1counts
2
C
DMC
BDMC426 nm /539 nm
-0.00 0.50 1.00 1.50 2.00 2.50 3.00 3.50 4.00-0.26
0.50
0.96 3 - 033013 #97 Tumeric 1:100 old sample UV UV_VIS_1mAU
min
3
C DMC
BDMC
WVL:426 nm
EC detection
FL detection
UV detection