project number: 257401 multiple quantitative monitoring … · multiple quantitative monitoring of...
TRANSCRIPT

1
Project Number: 257401
A highly integrated and sensitive POrous SIlicon based lab on a chip for multiple quantitaTIVE monitoring of food allergies at point of care.
Specific Targeted Research Project
Information Society Technologies
Deliverable D10.1: Report on the clinical sample preparation protocols and suggested simplification procedures for development of point-of-
care diagnostics – an update.
Due date of deliverable: September 30th 2012
Actual submission date of preliminary version: February 8th 2013
Actual submission date of final version: May 13th 2014
Start date of project: 2010-09-01 Duration: 3 Years
Organisation name of lead contractor for this deliverable: C-UB
Additional Contributions from: CNR
Revision [2.0]
Project co-funded by the European Commission within the Seventh Framework Programme
Dissemination Level
PU Public X
PP Restricted to other programme participants (including the Commission Services)
RE Restricted to a group specified by the consortium (including the Commission Services)
CO Confidential, only for members of the consortium (including the Commission Services)
2
1 About this deliverable
1.1 Introduction
As part of work package 10 this deliverable reports on the proof of principle for detection of clinical samples. We will show that clinical samples necessary for the final testing of the working platform have been prepared and alternative arrangements have been made to start testing the requirements for optimal sample detection. For this the established microarray technique of CNR, reported in D6.3, was used. The copoly (DMA-NAS-MAPS) surface chemistry used to coat the - protein microarrays in the experiments reported within this report is that reported elsewhere (D6.3). Sample preparation protocols suitable for porous alumina, the transducer material probably to feature in final devices, as agreed by the EC at the Y2 review meeting, will need only minor adjustments. The reason being that the monomers are the same, and the only difference is that the MAPS is first bound to the surface and then the DMA-NAS copolymer is covalently attached using the double bonds of MAPS. For (porous) silicon, functionalisation proceeded by having all three monomers together in the polymer that is then preformed and adsorbed to the surface after polymerization.
The work performed can therefore be seen as a proof of principle for a working assay on the POSITIVE polymer surface chemistry through the use of a fluorescent technique. It was planned that once the POSITIVE platform becomes available the preparation and assay protocols would be re-tested with it and the results added as an addendum to D10.1. Unfortunately a further update is not possible as the POSITIVE device has not yet been sufficiently developed to allow so.
1.2 Scope of the deliverable
In this deliverable we describe the protocols used for composing pool sera with low, medium and high levels of specific IgE against hen’s egg and cow’s milk, as well as with specific IgE against non-food allergens (“atopic pool serum”) and with no specific IgE (“negative pool serum”).
We outline in detail the running of the assays on the copoly (DMA-NAS-MAPS)-coated microarray compared to the already established semi-quantitative microarray device, the Phadia ISAC (Thermo Fisher) and the quantitative Phadia ImmunoCAP (Thermo Fisher). We show comparisons between results from the quantitative ImmunoCAP, the semi-quantitative ISAC and our copoly-coated microarray.
1.3 Structure of this deliverable
The report is laid out according to the tasks defined in WP10 as follows:
T10.1: Development of a simple and robust sample preparation procedure, testing the requirements for optimal sample detection (e.g. degree of dilution, interfering substances, etc.), as well as the compatibility between the various assays on a single chip. (C-UB and Farfield)

3
2 The detection techniques applied
2.1 Description of human material used
For initial comparisons, we designed pool sera with low, medium and high levels of specific IgE against cow’s milk and hen’s egg, and also an atopic pool from patients sensitized to other than food allergens.
Therefore, sera from patients with suspected sensitization to food and/or respiratory allergens were chosen. Information on oral provocation or skin prick tests are not available and can be neglected as they do not matter for the purpose of comparison of devices.
The sera were meassured on the ImmunoCAP for 6 food allergens at the same time (fx5 panel), containing hen’s egg, cow’s milk, wheat, soy, peanut and codfish native protein. In case of a result >0.35 kUA/l (the clinical cut-off for negative) differentiations to single food allergens were performed, including cow’s milk (f2) and hen’s egg (f1). F1 and f2 are both whole native extracts.
According to the level of specific IgE measured, patients are grouped in 7 classes due to recommendations of Phadia (Thermo Fisher), see Table 1.
Table 1: ImmunoCAP specific IgE 0-100 classes and corresponding calculations in ng/ml (rounded to two decimal places) according to consideration: x kUA/l * 0.994 = x kU/l; 1 kU/l = 2.42 µg/l which can be summarized in the formula: x kUA/l * 0.994 * 2.42 ng/ml
Class 0 0.00 – 0.35 kUA/l 0.00 – 0.84 ng/ml
Class 1 0.35 – 0.70 kUA/l 0.84 – 1.68 ng/ml
Class 2 0.70 – 3.50 kUA/l 1.68 – 8.42 ng/ml
Class 3 3.50 – 17.5 kUA/l 8.42 – 42.10 ng/ml
Class 4 17.5 – 50.0 kUA/l 42.10 – 120.24 ng/ml
Class 5 50.0 – 100.0 kUA/l 120.24 – 240.55 ng/ml
Class 6 > 100 kUA/l > 240.55 ng/ml
For our purpose, we screened for sera with specific IgE against cow’s milk and hen’s egg and chose sera from 6 to 8 patients to compose pool sera with low levels of specific IgE (cap class 1 and 2), medium levels (cap classes 3 and 4), and high levels (cap classes 5 and 6).
These pools were then re-measured for specific IgE to whole extracts of hen’s egg (f1) and cow’s milk (f2), but also to available individual components, which are caseins (f78), α-lactalbumin (f76) and β–lactoglobulin (f77; cow’s milk), ovomucoid (f233) and ovalbumin (f232; hen’s egg) on the ImmunoCAP.
For composition of the atopic pool, we referred to sera of patients with concentrations <0.35 kUA/l in the fx5 panel, but concentrations >0.35 kUA/l in the sx1 panel which contains Dermatophagoides pteronyssinus (dust mite; d1), cat dander (e1), dog dander (e5), Timothy grass (g6), cultivated rye (g12), Cladosporium herbarum (mould fungus; m2), common silver birch (t3) and mugwort (w6). Finally, we pooled 2 sera with 9.02 kUA/l and 1.77 kUA/l specific IgE against d1.
We also applied the sera mentioned to the semiquantitative ImmunoCAP ISAC microarray platform, which contained at that time 103 single allergens. Among these, there are α-lactalbumin, β-lactoglobulin, ovomucoid and ovalbumin (all native). Whole extracts of cow’s milk and hen’s egg are not available on ImmunoCAP ISAC. The results are shown in Table 2.

4
Table 2: Results for sIgE in the ImmunoCAP and ImmunoCAP ISAC system; n/a not available due to missing spotted allergens or offered only as CAP. Note the large difference between the results for ovalbumin on the CAP and ISAC platform in the medium pool serum. Corresponding calculations in ng/ml are given in italics
Low Medium High Atopic
Allergen (code on CAP platform)
CAP [kUA/l] [ng/ml]
ISAC [ISU]
CAP [kUA/l] [ng/ml]
ISAC [ISU]
CAP [kUA/l] [ng/ml]
ISAC [ISU]
CAP [kUA/l] [ng/ml]
ISAC [ISU]
milk (f2)
0.94
2.26 n/a
12.0
28.87 n/a
>100
>240.55 n/a
pool of 2
patients with
fx5 0.07
0.17
and
0.17
0.41
f1 and f2
<0.35
<0.84
n/a
total casein nBos d8 (f78)
0.29
0.70 0
11.7
28.14 3
>100
>240.55 20 0
n α-casein n/a n/a n/a n/a n/a n/a n/a
n ß-casein n/a n/a n/a n/a n/a n/a n/a
n κ-casein n/a n/a n/a n/a n/a n/a n/a
n α-lactalbumin nBos d4 (f76)
0.47
1.13 0
5.47
13.16 1
99.3
238.86 14 0
n ß-lactoglobulin nBos d5 (f77)
0.63
1.52 0
4.06
9.77 1
36.2
87.09 7 0
n ovomucoid nGal d1 (f233)
1.08
2.60 0
26.3
63.26 4
21.3
51.24 12 0
n ovalbumin nGal d2 (f232)
0.63
1.52 0
25.7
61.82 1
43.0
103.44 8 0
egg white (f1)
0.96
2.31 n/a
18.9
45.46 n/a
27.8
66.87 n/a n/a
For an extensive comparison of the platforms mentioned (ImmunoCAP and ImmunoCAP ISAC) with copoly (DMA-NAS-MAPS) coated silicon slides, resembling the device to be developed as concerns surface chemistry, we eventually referred to sera of 90 patients, orally challenged with cow’s milk for clinical purpose, and well described in regard to clinical symptoms and specific IgE. Before running these experiments, we first checked the protein content on the Milan chip and optimized the detection of IgE by a fluorescence-labelled antibody.
The use of the two microarray bases platforms also gave the opportunity to directly compare user protocols for ImmunoCAP ISAC and the Milan chip. The summary is presented in Table 4.

5
2.2 The ImmunoCAP ISAC
The ImmunoCAP ISAC (Figure 1) is a ready-to-use in vitro test for semi-quantitative determination of specific IgE antibodies in human serum or plasma. Allergens in form of purified or recombinant proteins are covalently bound on a solid-phase (glass) to be incubated with 20µl human serum or plasma. Bound IgE is detected by a secondary antibody, labelled with a fluorescent dye. An internal calibration is made against an in-house reference serum, standardized against ImmunoCAP specific IgE. Using a scanner to measure reflected monochromal light (Cy3), special software (MIA - Microarray Image Analysis Software) analyzes and calculates the results, subtracting background around the spot. The final result is given in ISU (ISAC Standardized Units) as shown in Table 3.
Figure 1: Microarray layout for the ISAC by Phadia. Every allergen is spotted in triplets. Bound IgE is visualized by a false-colour-scale, from black (negative) to white (strong positive) and reported as ISU.
Table 3: ImmunoCAP ISAC ranges and classes

6
2.3 The copoly (DMA-NAS-MAPS)-coated microarray
The chemistry and characteristics of copoly(DMA-NAS-MAPS) coated silicon slides have already been reported on in D6.3. Briefly, the difference with the ISAC, on which the proteins are covalently bound to a plane surface, is that a polymer is built up in which free amino groups of the proteins interact with the NAS (N,N-acryloyloxysuccinimid) component which provides functional groups for binding (NHS-Ester).
First CNR spot chips with a set of allergens consisting of individual native proteins as well as whole food native extracts from hen’s egg and cow’s milk. The spotting scheme contained orientation spots, various allergens of cow’s milk and hen’s egg, defined concentrations of IgE and pure human serum albumin as a means of calibration, and PBS. The spotting scheme is shown in Figure 2.
Figure 2: Spotting scheme for various individual proteins and protein extracts
After spotting, the chips were stored in a humid chamber over night to promote binding. Because long-term-storage of bound and ready-to-use chips is not established so far, we had to prepare several batches of slides. We therefore prepared aliquots of all proteins. For logistical reasons, we were forced to prepare several batches of diluted IgE that possibly affects reproducibility results for inter-assay comparison.
Total protein amount has been identified with flamingo stain (BioRad) and optimized as shown in Figure 3. As a fluorescence system was used, tests for autofluorescence were performed pre and post incubation with patient serum and there was no signal as shown in Figure 4.
skimmed milk from powder (native)
other protein
white egg from powder (native)
191
172
153
134
115
192
173
154
135
116
193
174
155
136
117
194
175
156
137
118
195
176
157
138
119
196
177
158
139
120
197
178
159
140
121
198
179
160
141
122
199
180
161
142
123
200
181
162
143
124
201
182
163
144
125
202
183
164
145
126
203
184
165
146
127
204
185
166
147
128
205
186
167
148
129
206
187
168
149
130
207
188
169
150
131
208
189
170
151
132
209
190
171
152
133
98
77
58
39
20
1
78
59
40
21
2
79
60
41
22
3
80
61
42
23
4
81
62
43
24
5
82
63
44
25
6
99 100 101
83
64
45
26
7
102
84
65
46
27
8
103
85
66
47
28
9
104
86
67
48
29
10
105
87
68
49
30
11
1069796
88
69
50
31
12
107
89
70
51
32
13
108
90
71
52
33
14
109
91
72
53
34
15
110
92
73
54
35
16
111
93
74
55
36
17
112
94
75
56
37
18
113
95
76
57
38
19
114
Streptavidin-Cy3 (0.1 mg/ml)
other protein
other protein
other protein
native β-casein
other protein
native κ-casein
native α-caseines
total casein
other protein
native α-lactalbumin
other protein
native β-lactoglobulin
other protein
native ovomucoid
other protein
1% HSA in PBS
PBS
human IgE
native ovalbumin
Calibration spots for IgE have 240, 120, 60, 35, 15 and 3 µg/ml.
Arrangement of concentrations: meandering from highest to
lowest, start from the leftskimmed milk from powder (native)
other protein
white egg from powder (native)
191
172
153
134
115
192
173
154
135
116
193
174
155
136
117
194
175
156
137
118
195
176
157
138
119
196
177
158
139
120
197
178
159
140
121
198
179
160
141
122
199
180
161
142
123
200
181
162
143
124
201
182
163
144
125
202
183
164
145
126
203
184
165
146
127
204
185
166
147
128
205
186
167
148
129
206
187
168
149
130
207
188
169
150
131
208
189
170
151
132
209
190
171
152
133
98
77
58
39
20
1
78
59
40
21
2
79
60
41
22
3
80
61
42
23
4
81
62
43
24
5
82
63
44
25
6
99 100 101
83
64
45
26
7
102
84
65
46
27
8
103
85
66
47
28
9
104
86
67
48
29
10
105
87
68
49
30
11
1069796
88
69
50
31
12
107
89
70
51
32
13
108
90
71
52
33
14
109
91
72
53
34
15
110
92
73
54
35
16
111
93
74
55
36
17
112
94
75
56
37
18
113
95
76
57
38
19
114
Streptavidin-Cy3 (0.1 mg/ml)
other protein
other protein
other protein
native β-casein
other protein
native κ-casein
native α-caseines
total casein
other protein
native α-lactalbumin
other protein
native β-lactoglobulin
other protein
native ovomucoid
other protein
1% HSA in PBS
PBS
human IgE
native ovalbumin
Calibration spots for IgE have 240, 120, 60, 35, 15 and 3 µg/ml.
Arrangement of concentrations: meandering from highest to
lowest, start from the left

7
Figure 3: Total protein stain. Green dots are proteins, the white dots are the guide dots (streptavidin-Cy3), which are saturated and thus appear white. PBS is blank (last row on the left). On this chip skim milk was exceptionally spotted twice, so that a protein-specific also signal occurs in the last row on the right side.
Figure 4: Test for autofluorescence after incubation with patients’ serum. The only dots that light up are the guide dots (streptavidin-Cy3)
Different IgE antibodies, such as a monoclonal antibody (mouse anti-human IgE, Fc Fragment specific, ascites, Calbiochem, Cat. # 411507, Lot. # B47299) and a polyclonal antibody (goat anti-human IgE, ε-chain, Calbiochem, # 411520, Lot # B46091) were tested. The polyclonal antibody could be shown to be superior and the results are shown in Figure 5.
Figure 5: Immunolabeling with pooled patient sera from patients sensitized to cow’s milk and hen’s egg using a monoclonal mouse anti-human IgE antibody (left hand side) and a polyclonal goat anti-human IgE antibody (right hand site) at 80% laser power and gain.

8
2.4 Comparison of user protocols for ImmunoCAP ISAC and Milan chip
The comparison of user protocols for the microarray-based platforms, working with a fluorescent labelled secondary antibody, shows very similar results as concerns time from starting to end of the assay. Consumables needed differ in favour of the Milan chip. However, on the ImmunoCAP ISAC chip there can be analyzed three sera plus control at the same time whereas the Milan chip can only manage one. This is due to the fact that the Milan chip is not implemented yet in a larger slide like the ImmunoCAP ISAC, containing four fields per slide. It has also be taken into account that the anaylsis of data is automatically managed by the MIA-software, in contrast to extensive calculations of fluorescences obtained from the Milan chip. The running protocols of the assay for the ImmunoCAP ISAC and the copoly(DMA-NAS-MAPS) coated silicon slides (Milan chip) are outlined in Table 2.
Table 4: Comparison of working steps and durations for assays on the ImmunoCAP ISAC and copoly(DMA-NAS-MAPS) coated silicon slide (Milan slide) platform. *Water refers to distilled water; ** the volume needed depends on the size of the beaker glass used for rinsing the slides in; ***applied in excess but also reducible to 20µl.
Working step ISAC Milan chip
Blocking in humid chamber 1h (solution A, 220 ml) 1h (blocking buffer, 20 ml)
Washing 5 min (water*, 220 ml) Rinse (water, 150 ml**)
Drying Minutes by air drying Seconds by nitrogen gas
Incubation with serum in humid chamber at RT
20µl for 2h 20µl for 2h
Removal of serum Tapping on paper towel Rinse (water, 150 ml)
Washing 10 min (solution A, 220 ml)
5 min (water, 220 ml)
10 min (washing buffer, 20 ml)
Drying Minutes by air drying Seconds by nitrogen gas
Incubation with secondary antibody in humid chamber at RT, protected from light
20µl of provided anti IgE solution, 1h
100µl*** of freshly diluted anti IgE, 1h
Removal of secondary antibody Tapping on paper towel or rinsing under water
Rinse (water, 150 ml)
Washing 10 min (solution A, 220 ml)
5 min (water, 220 ml)
10 min (PBS, 20 ml)
Drying Minutes by air drying Seconds by nitrogen gas
Measurement one chip with 4 areas Single chip
Total time 4h 35mins plus time for drying and handling, ~5h
4h 20mins plus time for rinsing, drying and handling, ~5h
Total of volumes 1320 ml 510 ml
9
2.5 Results for inter- and intra-assay controls (Milan chip)
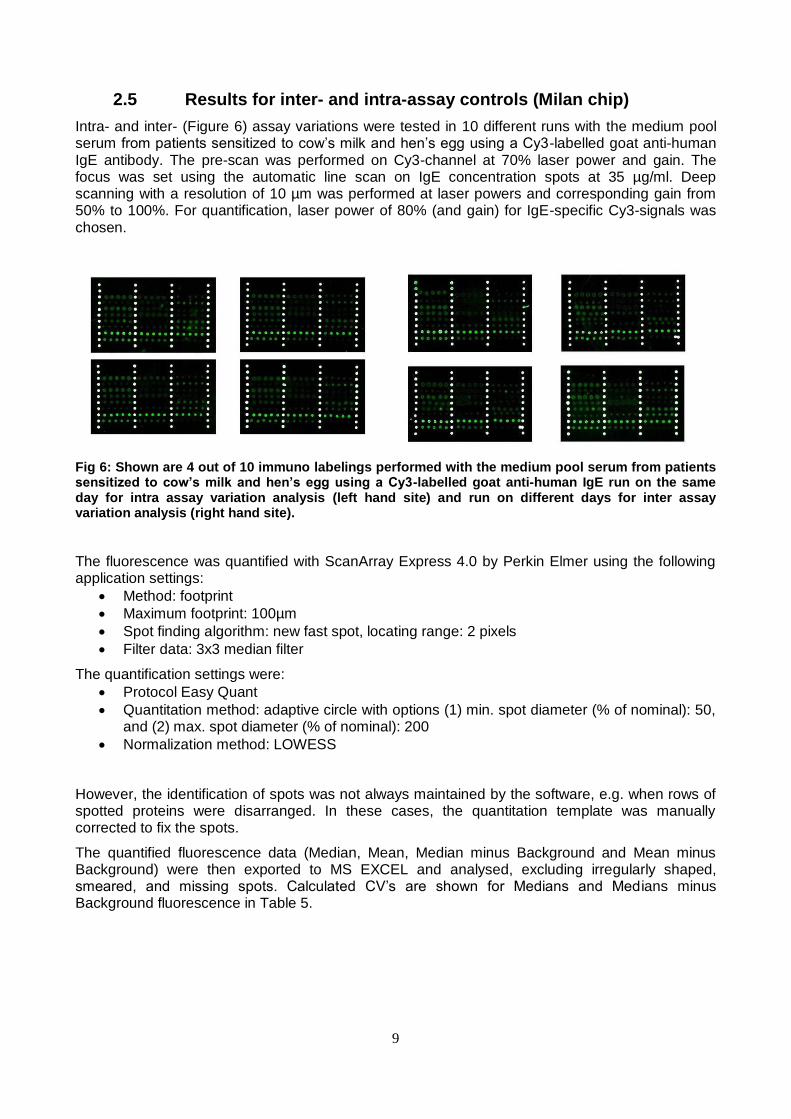
Intra- and inter- (Figure 6) assay variations were tested in 10 different runs with the medium pool serum from patients sensitized to cow’s milk and hen’s egg using a Cy3-labelled goat anti-human IgE antibody. The pre-scan was performed on Cy3-channel at 70% laser power and gain. The focus was set using the automatic line scan on IgE concentration spots at 35 µg/ml. Deep scanning with a resolution of 10 µm was performed at laser powers and corresponding gain from 50% to 100%. For quantification, laser power of 80% (and gain) for IgE-specific Cy3-signals was chosen.
Fig 6: Shown are 4 out of 10 immuno labelings performed with the medium pool serum from patients sensitized to cow’s milk and hen’s egg using a Cy3-labelled goat anti-human IgE run on the same day for intra assay variation analysis (left hand site) and run on different days for inter assay variation analysis (right hand site).
The fluorescence was quantified with ScanArray Express 4.0 by Perkin Elmer using the following application settings:
Method: footprint
Maximum footprint: 100µm
Spot finding algorithm: new fast spot, locating range: 2 pixels
Filter data: 3x3 median filter
The quantification settings were:
Protocol Easy Quant
Quantitation method: adaptive circle with options (1) min. spot diameter (% of nominal): 50, and (2) max. spot diameter (% of nominal): 200
Normalization method: LOWESS
However, the identification of spots was not always maintained by the software, e.g. when rows of spotted proteins were disarranged. In these cases, the quantitation template was manually corrected to fix the spots.
The quantified fluorescence data (Median, Mean, Median minus Background and Mean minus Background) were then exported to MS EXCEL and analysed, excluding irregularly shaped, smeared, and missing spots. Calculated CV’s are shown for Medians and Medians minus Background fluorescence in Table 5.

10
Table 5: Calculated CV’s for IgE-specific fluorescence. Excluded are HSA, PBS and Blank as their inherent fluorescence is within the noise level, resulting in very high S.D. and thus CV.
protein
inter-assay intra-assay
CV% Median CV% Median-B
CV% Median CV% Median-B
n α-casein 13 11 8 9
n ß-casein 31 30 11 19
n κ-casein 37 37 9 9
total casein 20 22 7 8
n α-lactalbumin 16 18 7 10
n ß-lactoglobulin 21 22 18 19
skim milk 27 27 12 12
n ovomucoid 25 27 20 23
n ovalbumin 26 26 12 14
egg powder 37 38 14 12
IgE 240 19 19 9 9
IgE 60 24 24 6 6
IgE 35 22 22 10 9
IgE 15 24 25 5 5
IgE 35 27 29 7 7
IgE 3 24 29 15 12
Altogether, we can see low and acceptable CV’s for proteins like native α-casein or native α-lactalbumin. On the other hand, the variations for native κ-casein and egg powder are too high and need to be improved. As expected, the CV’s of the intra-assay perform better than those of the inter-assay. We anticipate an increase in the assay performance using larger batch sizes and less manual working steps.

11
2.6 Results for sera of 90 patients
Stored serum samples of 90 patients sensitized to hen’s egg and/or cow’s milk were applied to the newly developed microarray and tested against the Phadia ImmunoCAP and ISAC methods. As an example one patient is shown in Figure 7.
Fig 7: Assay of one patient with hen’s egg and cow’s milk allergy. On the right hand side, the immunolabeling with anti-IgE (top) and on the left hand side the results for IgE on the Phadia ImmunoCAP (in kUA/l) and ISAC (in ISU). At the bottom, the spotting scheme is shown.
The analysis of the quantified fluorescence was performed visually by excluding irregularly shaped, smeared, and missing spots, but also statistically choosing the most representative spots of the five replicated per protein The standard deviations for the fluorescence within each spot (Ch1 SD, referring to the homogeneity of the fluorescent signal and implying artefacts within a spot) were ranked and a spot was excluded when its CH1 SD exceeded the doubled mean of the four (or less) left spots. The same procedure was applied to the standard deviation of the background (Ch1 B SD, referring to noise around the spot, affecting the correction of the background signal from the specific fluorescent signal).
In order to correlate fluorescence with results from the ImmunoCAP (given in kUA/l) we had to define results given as “<0.35 kUA/l” as “0.01”. ISAC results (given in ISU) that were “class 0” (zero) were also reformed to “0.01”.
Statistical analysis was done with SPSS 20.0 (IBM), applying a linear regression model for curve estimation. Representative diagrams with log-scaled x-axis are shown in Figure 8, and numeric results are shown in Table 6.
Cy3@80% laser power and gain, unadjusted 6,39native ovalbumin (ISU)
20,59native ovomucoid (ISU)
8,39native β-lactoglobulin (ISU)
21,77native κ-casein (ISU)
7,81native β-casein (ISU)
12,21native αs1 casein (ISU)
7,86native caseins (ISU)
9,27native α-lactalbumin (ISU)
59,00IgE cow‘s milk (kU/l)
47,30IgE egg white (kU/l)
434,00total IgE (KU/l)
X X X X X
n β casein n κ casein
n α casein
n total casein n α-lactalbumin n β-lactoglobulin
skim milk
n ovomucoid n ovalbumin egg powder
IgE 240 IgE 120 IgE 60
IgE 35 IgE 15 IgE 3
PBS HSA X X X X X
n β casein n κ casein
n α casein
n total casein n α-lactalbumin n β-lactoglobulin
skim milk
n ovomucoid n ovalbumin egg powder
IgE 240 IgE 120 IgE 60
IgE 35 IgE 15 IgE 3
PBS HSA

12
Figure 8: Representative diagrams for correlation of results obtained with Phadia ImmunoCAP for hen’s egg (f1) and cow’s milk (f2) against median fluorescence measured on the Milan chip platform, and with Phadia ImmunoCAP ISAC system for native α-lactalbumin (Bos d4), total casein (Bos d8), for native ovomucoid (Gal d1) and native ovalbumin (Gal d2) against corresponding native proteins on the Milan chip with. Scaling is logarithmic to basis 10.

13
Table 6: Correlation (linear regression model) between Median Fluorescence (MFl) and Median Fluorescence minus Background (MFl-B) from the Milan Chip with results from the ImmunoCAP (kUA/l) and ISAC (ISU). Abbreviations: f1 hen’s egg, f2 cow’s milk
Proteins and Phadia platforms (in brackets) Milan Chip
R2 linear MFI
R2 linear MFI-B
f1 (CAP) egg powder 0.807 0.800
f2 (CAP) skim milk 0.528 0.525
n casein (ISAC) n casein 0.767 0.770
n β-casein (ISAC) n b-casein 0.755 0.768
n κ-casein (ISAC) n κ-casein 0.641 0.639
n α-lactalbumin (ISAC) n α-lactalbumin 0.692 0.683
n β-lactoglobulin 5.0102 (ISAC) n β-lactoglobulin 0.849 0.845
n β-lactoglobulin 5.0101 (ISAC) n β-lactoglobulin 0.890 0.890
n ovomucoid (ISAC) n ovomucoid 0.789 0.795
n ovalbumin (ISAC) n ovalbumin 0.465 0.457
We clearly see correlations >0.6 for 8 of the 10 extracts/proteins for calculated medians and medians minus background which can be considered as proof of principle of the fluorescence based method (Milan Chip) applied. However, some correlations do not give satisfactory results: f2 and especially ovalbumin. The reason might be due to different formulas of the whole extracts used on Phadia’s caps and our microarray, and different affinities of the components (α- β- and κ-caseins, α-lactalbumin and β-lactoglobulin) of skimmed milk to the surface of the Milan Chip or the Phadia caps, respectively.

14
2.7 Results for IgE calibration curve
As a means for comparison, we spotted 6 concentrations of IgE, dissolved in HSA, which was also spotted and thus the zero calibrator. For logistical reasons, we could not prepare one batch for all chips, but had to use 3 different ones instead. The fluorescence measured is shown in Figure 9.
We did not normalize the fluorescence to the calibration curve as the deviations between the measurements of spotted IgE were too high. The deviations were probably due to the different batches of IgE concentrations that should therefore decrease when using aliquots of one batch only. Nonetheless, we show that direct spotting of IgE resolved in HSA can be used as a means of calibration, provided an improvement of preparation and measurement conditions.
Phadia’s ISAC system uses a reference serum for calibration that we had at hand but could not apply as this serum is designed for respiratory allergens. The ImmunoCAP system also uses calibrators based on human serum, measuring whole IgE. As this system is RAST-based, we could not apply their calibration curve (in kUA/l) to our system but stuck to the concentrations measured for IgG4 detection (in µg/ml).
Measured median fluorescence of IgE-calibration points on 90
microarrays
0
10000
20000
30000
40000
50000
60000
70000
0 50 100 150 200 250 300
Concentration of spotted IgE in HSA
Med
ian
Flu
ore
scen
ce
Fig 9: Measured median fluorescence of IgE-calibration points (0, 3, 15, 35, 60, 120, 240 µg/ml) for the 90 patients analyzed. There are large deviations for especially high concentrations of IgE. The fluorescence does not increase linear with increasing amounts of spotted IgE due to saturation near 240 µg/ml IgE.

15
2.8 Conclusions
Using the POSITIVE polymer surface chemistry and a fluorescent technique initial sample preparation protocols were defined and evaluated. A bank of appropriate clinical samples was prepared. 90 samples were tested with the ImmunoCAP and ImmunoCAP ISAC system (Phadia) as well as with the copoly-coated protein microarray.
We showed that we can achieve CV’s <25% for intra assay controls (median fluorescence), but less good results for inter assay variation depending on the proteins regarded. This is due to the fact that so far we have only been able to spot small batches max 20 chips which increases variations for chips differing in spot quality (position in frame and morphology). We expect this variation to be heavily reduced when working in larger batches.
However, we clearly see positive correlations >0.5 between higher amounts of specific IgE and increasing fluorescence in the analysis of the 90 patients chosen.
Despite some drawbacks and pitfalls, the data clearly show a proof of principle for chosen extracts and proteins.
It was planned that the sample preparation procedures already identified will be repeated on the POSITIVE device as soon as it was sufficiently developed. Unfortunately this was not possible, within the lifetime of the project.,

16
4 Glossary
Ch1 SD Channel 1 standard deviation; refers to IgE-specific signals on Cy3-
channel
Ch1 B SD Channel 1 background standard deviation; refers to the background of IgE-specific signals on Cy3-channel
CV coefficient of variation, ratio of the sample standard deviation to the sample mean
DMA N,N-dimethylacrylamide
ε-chain heavy chain of IgE molecule
f1 code for hen’s egg on the ImmunoCAP
f2 code for cow’s milk on the ImmunoCAP
Flamingo Protein-specific fluorescent stain (BioRad), detection on Cy3-channel
Fc fragment lower part (stem) below the disulfide bonds of the immuneglobuline molecule
HSA Human serum albumin
IgE Immunglobuline E
ISU ISAC Standardized Units
kU/l kilo mass units per liter (1 kU/l = 2.42 µg/l = 2.42 ng/ml)
kUA/l kilo mass units of allergen-specific IgE per liter (1 kUA/l = 0.994 kU/l)
MAPS [3-(methacryloyloxy)propyl]trimethoxysilane
MFl Median fluorescence
MFl-B Median fluorescence minus background
MIA Microarray Image Analysis Software
NAS N,N-acryloyloxysuccinimide
NHS-Ester N-Hydroxysuccinimide or 1-Hydroxy-2,5-pyrrolidindion, “activated”
carbonic acid that react with amide groups
PBS Phosphate buffered saline
sIgE specific IgE against a single allergen or whole extract containing the allergen(s)
Streptavidin-Cy3 protein of Streptomyces avidinii on which a Cy3-chromophor