the quality counts assessment - oaktrust home
TRANSCRIPT

A Study Of Texas Youth Livestock Exhibitors Knowledge Within The Constructs Of
The Quality Counts Assessment
by
J. D. Ragland, B.S., M. S.
Dissertation
In
Doctorate Agriculture Education
Submitted to the Graduate Faculty of Texas Tech University in
Partial Fulfillment of the Requirements for
the Degree of
DOCTOR OF EDUCATION
Approved
Dr. Steven Fraze Chair of Committee
Dr. John Rayfield
Dr. Todd Brashears
Dr. Jeff Ripley
Dominick Casadonte Interim Dean of the Graduate School
August, 2013

Copyright 2013, J. D. Ragland

Texas Tech University, J. D. Ragland, August 2013
ii
ACKNOWLEDGMENTS
This degree is a proud product of dedication, hard work, love and support of
many. All glory goes to my Lord Jesus Christ, answering countless prayers asking for his
guidance and strength to get me through. I have been truly blessed. I want to dedicate
this degree to my wife Angela and son Brady.
Angela provided me with the encouragement, love and confidence in me to
pursue this lifelong dream. I know at times it wasn’t easy living with me during this
journey and I probably blamed you for many unnecessary issues. For that I apologize.
You are the love of my life and I want to thank you for being such a wonderful
supportive wife.
To my son Brady, who’s a young college student at Texas Tech who I love and
am so proud of whom always provided his older college student dad with his positive
encouragement and “you can do it dad” attitude! Thanks for the love and continual
motivation.
My parents, Ronnie and Kathleen Ragland who instilled upon me at an early age,
“you can do anything you put your mind to.” They taught me the true value of dedication
and hard work and to set goals and work hard until you achieve them. I can never
sufficiently thank you enough for everything you’ve done for me. Thanks for your love,
support and always being there.
I also want to thank my committee, Dr. Steve Fraze, Dr. John Rayfield, Dr. Todd
Brashears and Dr. Jeff Ripley. I realize with Doc@Distance students it is difficult to meet
as a committee and coordinate all needed requirements for completing this degree. Each
of you were always willing to meet with me via conference call or one on one and

Texas Tech University, J. D. Ragland, August 2013
iii
provide the needed guidance I needed to keep me on track. Thanks for your continual
support and patience. I could not have done it without you.
Big thanks to both Texas Tech and Texas A&M Universities for providing the
Doc@Distance Program. I’m 49 years old and have been employed with the Texas
AgriLife Extension Service serving as a County Extension Agent for Agriculture for the
past 26 years. This occupation requires long daily hours, most nights full with meetings
and weekends jammed packed with a variety of 4-H activities leaving virtually no extra
time. Therefore this unique distance education degree program allowed me the
opportunity to continue my education that otherwise would not have been possible and
honestly was the only achievable way for me.
Just as importantly, I’d like to thank my Doc@Distance classmates, “The Salty
Six”: Donald Kelm, Stephenville, Texas; Kelli Lehman, Vernon, Texas; Shane McLellan,
Waco, Texas; Alanna Neely, Murfreesboro Tennessee and Aimee Sandifeer, Overton,
Texas lending strong support and encouraging one another to hang in there through tough
times where each one of us didn’t think we would make it. It’s been a long four and half
years. You guys are my buddies!
No one said it was going to be easy, I guess if it was everyone would do it. With
dedication, determination and perseverance I’m living proof you can never be too old to
continue your education and achieve a lifelong goal! Thanks to everyone for making my
dream become reality!

Texas Tech University, J. D. Ragland, August 2013
iv
ABSTRACT
A Study Of Texas Youth Livestock Exhibitors Knowledge Within The Constructs
Of The Quality Counts Assessment. (August 2013) J. D. Ragland, B.S.,
M. S. Chairman of Advisory Committee: Dr. Steve Fraze.
The purpose of this study was to examine the effectiveness of the current Quality
Counts program and assessment. This on-line training and assessment is a required
program of completion for all youth exhibiting livestock at all major livestock shows in
Texas. The studies additional purposes was to evaluate assessment results of participants
within their respected age groups and club affiliation, and to identify their relationships of
the four program objectives as well as the three research objectives outlined for this study
to determine where curriculum improvements maybe needed. It was concluded that the
Quality Counts program needs revision to be a more effective tool for youth exhibiting
livestock.

Texas Tech University, J. D. Ragland, August 2013
v
Table of Contents ACKNOWLEDGMENTS ............................................................................................................ ii ABSTRACT .................................................................................................................................. iv CHAPTER 1 .................................................................................................................................. 1
INTRODUCTION .................................................................................................................................... 1 Background .......................................................................................................................................... 1 Statement of the Problem ..................................................................................................................... 2 Purpose of the Study ............................................................................................................................ 2 Research Objectives ............................................................................................................................. 4 Limitations of the Study ....................................................................................................................... 5 Need for the Study ............................................................................................................................... 5 Definition of Terms .............................................................................................................................. 6 Summary .............................................................................................................................................. 7
CHAPTER II ................................................................................................................................. 8 REVIEW OF LITERATURE ................................................................................................................... 8
Purpose and Objectives ........................................................................................................................ 8 Cooperative Extension ......................................................................................................................... 8 A Brief History of 4-H ....................................................................................................................... 10 A Brief History of FFA ...................................................................................................................... 11 Extension Program Development ....................................................................................................... 12 Quality Counts Program ..................................................................................................................... 14 Livestock Exhibition .......................................................................................................................... 15 Character Education ........................................................................................................................... 16 Life Skills Gained From Livestock Projects ...................................................................................... 18 Food Quality and Safety Standards .................................................................................................... 18
CHAPTER III ............................................................................................................................. 21 METHODS AND PROCEDURES ........................................................................................................ 21
Purpose and Objectives ...................................................................................................................... 21 Research Design ................................................................................................................................. 21 Assessment Procedure ........................................................................................................................ 22 Population and Sample ....................................................................................................................... 23 Instrument .......................................................................................................................................... 24 Institutional Review Board................................................................................................................. 25 Collection of Data .............................................................................................................................. 26 Analysis of Data ................................................................................................................................. 26
CHAPTER IV.............................................................................................................................. 29 RESULTS AND DISCUSSION ............................................................................................................. 29
Purpose and Objectives ...................................................................................................................... 29 Findings for Research Objective One ................................................................................................ 29 Findings for Research Objective Two ................................................................................................ 30 Findings for Objective Objective Three ............................................................................................. 31
CHAPTER V ............................................................................................................................... 54 SUMMARY, CONCLUSION, IMPLICATIONS AND RECOMMENDATIONS............................... 54
Purpose and Objectives ...................................................................................................................... 54 Limitations of the Study ..................................................................................................................... 54 Research Design ................................................................................................................................. 55

Texas Tech University, J. D. Ragland, August 2013
vi
Population and Sample ....................................................................................................................... 55 Instrument .......................................................................................................................................... 56 Institutional Review Board................................................................................................................. 57 Collection of Data .............................................................................................................................. 57 Analysis of Data ................................................................................................................................. 57 Summary of Findings and Conclusions ............................................................................................. 58
Research Objective One ................................................................................................................. 58 Research Objective Two ................................................................................................................ 58 Research Objective Three .............................................................................................................. 59
Recommendations for Quality Counts Program Development .......................................................... 62 Recommendations for Future Study ................................................................................................... 63
LIST OF TABLES……………………………………………………………………...30 REFRENCES .............................................................................................................................. 65 APPENDIX A .............................................................................................................................. 68
QUALITY COUNTS ASSESSTMENT INSTRUMENT................................................................. 68
APPENDIX B .............................................................................................................................. 77 INSTITUTIONAL REVIEW BOARD APPROVAL ...................................................................... 77
APPENDIX C .............................................................................................................................. 79 SENIOR ASSESSMENT QUESTIONS ................................................................................................ 79

Texas Tech University, J. D. Ragland, August 2013
vii
LIST OF TABLES
4.1 Characteristics of 4-H and FFA Members…………………………………………...30 4.2 Organization and Age Division……………………………………………………...31 4.3 Descriptive Data of Senior Quality Counts Assessement Related to Program Objectives………………………………………………………………..33 4.4 Descriptive Data of Senior Quality Counts Assessment Related to Program Objective One……………………………………………………….......34 4.5 Descriptive Data of Senior Quality Counts Assessment Related to Program Objective Two…………………………………………...……………....41 4.6 Descriptive Data of Senior Quality Counts Assessment Related to Program ObjectiveThree…………………………………...……………………...42 4.7 Descriptive Data of Senior Quality Counts Assessment Related to Program Objective Four………………………………………...…………………43 4.8 Descriptive Data of Senior Quality Counts Assessment Sorted by Average……...…44

Texas Tech University, J. D. Ragland, August 2013
1
CHAPTER 1
INTRODUCTION
Background The history of youth livestock project programs in Texas dates back to 1910 when the
first beef and pig clubs were organized in Coleman County Texas (History of 4-H). Texas has
the largest number of 4-H and FFA livestock projects in the nation. According to Texas AgriLife
Extension, youth livestock exhibitors participate at county, district, regional and state levels
(Quality Counts, 2011). County Extension Agents and agricultural science teachers in Texas
spend considerable amounts of time educating and working with youth involved in the livestock
program. Each year some 76,000 head of livestock are validated in Texas and are eligible for
exhibition at county fairs and major livestock shows. Additionally each year the livestock
showing industry has a direct impact of over 14 million pounds of red meat (Quality Counts,
2011). For decades Texas youth livestock exhibitors have received unfavorable reviews
indicating that exhibitors only show their animals and have no knowledge of the livestock
industry.
These disparaging comments have made it necessary for youth livestock educators to
develop Quality Counts, A Texas Curriculum for Livestock Education (Quality Counts, 2011).
The program was launched in 2005 with the latest program revisions occurring in 2011. The
Quality Counts curriculum primarily focuses on two major components; Character Education
and Livestock Quality Assurance. Within the program curriculum there are eight core concepts
with the first four related to Character Education; 1) Six Pillars of Character, 2) Purpose of 4-H
and FFA, 3) Purpose of Livestock Projects and 4) Making Decisions and Goal Setting.

Texas Tech University, J. D. Ragland, August 2013
2
The second four concepts relate to Quality Assurance; 1) Impact of Livestock Projects on
red meat industry, 2) Responsibilities of Producing a Safe Product. 3) Medication Use/ Reading
and Following Labels, and 4) Animal Care and Well-Being.
Statement of the Problem In recent years, youth livestock exhibitors have had limited in-depth education pertaining
to general animal husbandry and food quality/safety. Although livestock project participation
has increased each year, the general knowledge of livestock has decreased. As a result, the
Quality Counts curriculum was created to increase aptitude and test knowledge of livestock as it
relates to the 4-H and FFA livestock projects. This includes demonstrating knowledge of
character skills, food quality and safety standards, general animal science information, and the
ability to promote the youth livestock project in a positive manner.
Although the Quality Counts curriculum has been in place for seven years the
requirement for testing in order to exhibit livestock projects has only been in existence for two
years (2011-12 and 2012-13) (Quality Counts, 2011). There are currently no published studies on
Quality Counts curriculum or testing. Due to the fact that general livestock information is
important to all exhibitors and the Quality Counts program and assessment is now a mandated
requirement for all junior livestock exhibitors in Texas, it is imperative to conduct research to
assess whether or not participants are achieving program objectives set forth by Quality Counts
curriculum.
Purpose of the Study The purpose of this study was to examine the effectiveness of the current Quality Counts
training assessment. The completion of the assessment is required for all youth exhibiting
livestock in all major livestock shows in Texas. The assessment was designed to evaluate results
of participating groups and identifies relationships based on the four main research objectives

Texas Tech University, J. D. Ragland, August 2013
3
outlined in this study and to also evaluate the four program objectives to determine if curriculum
improvements were needed.
The Quality Counts program was developed in 2005 (Quality Counts, 2011) in
partnership by the Texas AgriLife Extension Service and the Texas Education Agency (Smith, et
al., 2011). Quality Counts is a comprehensive curriculum program for all 4-H and FFA members
in Texas who are involved with the youth livestock program. This educational program is
designed to teach basic livestock husbandry skills along with food safety techniques and
practices for not only broadening their knowledge as an exhibitor but also as a consumer.
To complete this curriculum, all youth exhibitors are required to take the corresponding
Quality Counts online assessment and must pass with minimum score of 80% or higher. The
Quality Counts program provides an opportunity for youth livestock exhibitors to learn and
demonstrate the highest standards of both personal character and in the feeding and caring of
livestock. Quality Counts is designed to teach young people the importance of displaying good
character in carrying out livestock projects and in every aspect of their lives. This curriculum
also helps them learn the importance of using proper livestock management practices so that
food quality and safety are preserved.
With the completion of this curriculum comes the opportunity for each exhibitor to learn
and demonstrate the highest standards of both personal character and in the feeding and caring of
livestock. Quality Counts was designed to teach young people the importance of displaying good
character in carrying out livestock projects and in every aspect of their lives. This curriculum
also helps participants learn the importance of using proper livestock management practices so
food quality and safety are preserved (Smith, et al., 2011).
Texas Tech University, J. D. Ragland, August 2013
4
Quality Counts was developed using the six pillars of character as outlined in the
Character Counts Curriculum (Smith, et al., 2011). “Character Counts was established to
promote and teach the Six Pillars of Character.” The six pillars of character are: Trustworthiness,
Respect, Responsibility, Fairness, Caring and Citizenship (4-H Youth Development, 2012)
The Quality Counts program currently has four primary objectives. The first three
objectives were originally developed in partnership by Texas AgriLife Extension and the Texas
Agricultural Science Education Agency (Smith, et al., 2011). The final objective was not added
until much later when it was determined that several assessment exam questions had no
application to the initial three objectives. The following is a list of current Quality Counts
program objectives.
1. To ensure that animals raised in 4-H and FFA livestock projects meet all food quality
and safety standards
2. To provide character education for Texas Youth who participate in 4-H and FFA
livestock projects
3. To maintain a positive image of youth livestock programs (Smith, et al., 2011).
4. To assess knowledge of general animal science.
Research Objectives For this study there were three main objectives developed to accomplish the purpose of
the study.
1. Describe characteristics of 4-H and FFA members who have taken the Quality Counts
Assessment.
2. Compare students who have taken the Quality Counts Assessment based on age division
and club affiliation.

Texas Tech University, J. D. Ragland, August 2013
5
3. Evaluate current Quality Counts Assessment results related to program objectives to
determine if curriculum improvements are needed.
Limitations of the Study This study had two limitations that should be considered in interpreting the findings:
1. This study was limited to only 4-H and FFA youth exhibiting livestock at any
major stock show in Texas.
2. The study was limited to Quality Counts Program Assessments completed on-line
during the time period of May 7, 2011 to September 18, 2012 only and did not
include any other additional years.
3. Based on the randomly generated selection of senior age 4-H members for this
study, research data reflects one single member’s assessment score from that
particular group.
Need for the Study The continued concern and perceived criticism of Texas youth exhibiting
livestock and having little to no knowledge or understanding of basic animal husbandry
has lead youth livestock educators to develop the Quality Counts training and
assessment program as a requirement. Therefore, Texas A&M AgriLife Extension
Service and Texas Education Agency formed a partnership and initiated the program in
2005 but did not become mandatory for all exhibitors until 2012.
At the program’s inception, four program objectives were identified. However,
until this study there has not been any research conducted to determine if in fact
participating youth are reaching objectives set forth by the Quality Counts program.
Therefore this study was designed to assist in determining the value of the Quality

Texas Tech University, J. D. Ragland, August 2013
6
Counts program and identify possible changes needed in the program’s training and
assessments.
Definition of Terms 4-H – “A community of young people across America who are learning leadership, citizenship,
and life skills” (Learn About 4-H)
AgriLife Extension – “An organization that improves the lives of people, businesses, and
communities across Texas and beyond through high-quality, relevant education” (What is
Extension?).
AgriLife Regions – All counties in Texas are divided into four regions based on location. Those
regions are: North, South, East and West.
Character Counts Education - Curriculum established to promote and teach youth the six pillars
of character: Trustworthiness, Respect, Responsibility, Fairness, Caring and Citizenship
(Character Counts).
County Livestock Show- An event in which 4-H and FFA livestock exhibitors enter their
livestock projects to be judged based on quality traits of that animal.
FFA – “Organization dedicated to making a positive difference in the lives of students by
developing their potential for premier leadership, personal growth and career success through
agricultural education” (Mission and Motto)
Quality Assurance - Are attributes associated with animal health and well being.
Quality Counts - Educational Program that provides character education and its influence on
junior livestock projects.
Livestock Project- An animal that is raised, cared for and shown for exhibition by an individual.
Major Stock Show- Where livestock animals come together at one central location and are
exhibited for competition.
Texas Tech University, J. D. Ragland, August 2013
7
Junior Aged Exhibitor - Any youth involved in 4-H and FFA who is 9 years to 13 years of age as
of August 31 of the current year.
Senior Aged Exhibitor - Any youth involved in 4-H and FFA who is 14 to 19 years of age as of
August 31 of the current year.
Six Pillars of Character – Those human character attitudes, behaviors and skills that relate to
trustworthiness, respect, responsibility, fairness, caring and citizenship.
Urban Initiative County – Are the 20 most populated counties in Texas having a population of
200,000 or more (Ripley J. , 2012).
Non-Urban Initiative County – Counties in Texas not defined as urban initiative counties (Ripley
J. , 2012).
Summary The Texas youth livestock program is the largest in the world (Quality Counts, 2011)In
2012, there were over 76,000 junior entries in major livestock shows across Texas. This
calculates to over 14 million pounds of meat entering the food chain. The livestock show
industry is big business. When considering project work, exhibition, premium sales and final
distribution of livestock to consumer and the impact of those involved emphasizes to educators
the importance to teach and build youth character though the Texas livestock show program.
This study attempted to examine the Quality Counts training assessment and participant results
related to program objectives and determine if curriculum changes were needed.

Texas Tech University, J. D. Ragland, August 2013
8
CHAPTER II
REVIEW OF LITERATURE
For this study an overview of the purpose of Cooperative Extension, program
development, and 4-H and FFA was examined. Concluding this review, I focused on literature
pertaining to character education, youth livestock programming, and the integration of the two in
the Quality Counts Assessment.
Purpose and Objectives The purpose of this study was to examine the effectiveness of the current Quality Counts
Training Assessment. Research objectives were developed to determine whether or not
participants are meeting the program objectives. Research objectives of this study are:
1. Describe characteristics of 4-H and FFA members who have taken the Quality Counts
Assessment.
2. Compare students who have taken the Quality Counts Assessment based on age division
and club affiliation.
3. Evaluate current Quality Counts Assessment results related to program objectives to
determine if curriculum improvements are needed.
Cooperative Extension According to Rasmussen, “In the beginning, it was only those children of the well-to-do
that attended higher education” (Rasmussen, 1989). However it wasn’t until the passing of the
Morrill Act of 1862 which provided federal funding allowing states to declare land-grant
universities that made higher education available to more than just the well-to-do. The act
provided for at least one college in each state to teach agriculture and mechanic arts not
excluding traditional scientific and classical studies (Ritter).

Texas Tech University, J. D. Ragland, August 2013
9
The Hatch Act of 1887 provided the establishment of research farms where universities
could conduct their research in agricultural, mechanical and related problems faced by rural
citizens (Ritter). With the implementation of these two acts there still seemed to be a missing
link. What about those who could not attend universities? How could they obtain the knowledge
being taught? This is where Cooperative Extension began to play a major role while serving as
the link between sharing university based research and information to those who were unable to
attend college. Through extension, this information would remain available throughout one’s
life.
The Morrill Act of 1890 was passed to established land grant universities in each state to
provide non-discrimination of ethnicity for admission. This led to the establishment of what is
known today as “1890 Land-Grant Institutions. The Smith-Lever Act of 1914 established the
Cooperative Extension Service. The act mandated mutual cooperation of the United States
Department of Agriculture and Land-Grant Colleges in conducting agricultural extension work
and specified that the work,
“…shall consist of instruction and practical demonstration in agriculture and home economics to persons not attending or resident in said colleges in the several communities, and imparting to such persons information on said subjects through field demonstrations, publications and other wise…”(Ritter).
This act proved to be the beginning of the educational delivery method for bringing the
university to the people (Rasmussen, 1989). Extension is the agency for change and problem
solving that focuses on providing researched based information to serve the needs of community
clientele.
Today in Texas, Cooperative Extension is under the umbrella of the Texas A&M
University System headquartered in College Station, Texas and is known as the Texas A&M
AgriLife Extension Service and is the largest Extension Service in the United States (Borden,

Texas Tech University, J. D. Ragland, August 2013
10
2005). This network consists of 600 county extension agents, located in 250 of 254 counties and
some 350 specialists along with over 104,000 volunteers (Extension T. A., 2013). These groups
work together to educate the public in the areas of agriculture, family and consumer science, 4-H
and youth and community development programs. Through these programs Texas AgriLife
reaches over fifteen million Texans annually. Texas AgriLife Extension Service mission is to:
improve the lives of people through high-quality relevant educational programs.
A Brief History of 4-H 4-H actually began prior to the passage of Smith-Lever Act of 1914, which granted the
partnership of United State Department of Agriculture with Extension. Its earliest development
on a National level dates back to 1896 when Cornell University’s Liberty Hyde Bailey
distributed educational brochures on agriculture for youth interested in a career in agriculture
(Wessel, T. & Wessel, M., 1982). In the early 1900’s educators started to look at ways to link
learning to the needs of rural families. In Texas, the first county Extension agent was T. M.
(Tom) Marks of Jack County who organized the first 25 member boy’s corn club. Marks taught
these young boys’ hands on skills needed for growing corn and an opportunity to learn by doing.
This learning by doing concept serves as the foundation and purpose for 4-H programs across the
country. By 1910 “pig clubs”, and “beef clubs”, were established along with the first “girls’
tomato clubs” of Milam County in 1912 (Wessel & Wessel, 1982). From there expansion of
various educational programs exploded and now has developed project work in over 40 different
categories ranging from food and nutrition, leadership, shooting sports, livestock and community
service.
The 4-H organization is open to all youth ages 9-19 and even has its own national
emblem, the four-leaf clover. Each clover represents one of the four H’s and are key
components to the organizations motto and pledge: Head t0 clearer thinking, Heart to greater

Texas Tech University, J. D. Ragland, August 2013
11
loyalty, Head to larger service, and Health to better living for my club, my community, my
country and my world. Nationally, 4-H has grown to become the nation’s largest youth
organization with over 6.5 million members (National 4-H Council , 2012). The Texas 4-H
program is 104 years old and currently holds over one million youth members (Texas 4-H and
Youth Development, 2012). The mission of the organization has remained the same; develop
life skills for all youth “To Make the Best Better”.
A Brief History of FFA The Smith- Hughes Act of 1917 granted the adoption of vocational agricultural
instructional courses into education systems. Nationally, Henry Groseclose, an agricultural
teacher who helped organized the first Future Farmers of Virginia for boys in agriculture classes.
This idea soon captured the interest of many throughout the country and in 1926 it was used as
the model to create the Future Farmers of America (FFA) organization known today (History,
2012).
The 82 year history of the Texas FFA program dates back to 1929 when it was first
chartered into the Texas education system. It was introduced as an in-school classroom
agricultural educational program for youth primarily focusing on production agriculture. Since
its inception the focus has broadened to address the needs and interests of students in urban and
suburban schools while also continuing the interest of traditional rural students. Today, Texas
FFA offers more than 50 Agriculture Food and Natural Resources courses which give students
the opportunity to apply practical classroom knowledge to real world experiences.
Texas FFA is the nation’s largest FFA Association with more than 85,000 members. Of
those members 92% are in grades 9-12 and 5% are in grades 7-8. Like 4-H, FFA has its own
motto: Learning to do, Doing to Earn, Earning to Live, and Living to Serve (General
Information, 2012). The organization’s mission: to make a positive difference in the lives of

Texas Tech University, J. D. Ragland, August 2013
12
students by developing their potential for premier leadership, personal growth and career success
through agricultural education (Texas FFA Agricultural Facts, 2012).
Extension Program Development Program development is an ongoing dynamic process that Extension professionals follow
as they plan, implement and evaluate their educational programs (Gibson, 2001). The process
usually begins with an idea or need for change. These ideas are lead by individuals and or
groups who normally develop into committees. Its unique structure enables the entire program
development process to be one of the most powerful impact systems ever designed. The process
consists of four key components with corresponding steps for each. According to Texas
AgriLife Extension publication handbook “Creating Excellent Programs” there are four
necessary steps to developing effective programs. Those are: 1) Planning, 2) Design, 3)
Implementation and 4) Measure (Ripley, J., Cummings, S., Lockett, L., Pope, P.,Wright, M.,
Payne, M., Keith, L., Murphery, T.).
Planning: The first major step is the planning stage. Also within the planning stage there
are four major areas that must be identified. Those are: 1) Identify the issue, 2) Define the
situation, 3) Identify and describe the target audience and 4) Define intended outcomes and
objectives. These steps can be determined by conducting a needs assessment. According to
Gupta, a needs assessment frames the problems or opportunities of interest and builds
relationships among the people and groups who have a stake in the issue (Gupta, 2007).
Design: The second step to effective program development is outlining the program
design. There are two primary tasks to be accomplished: 1) Identify or develop content for the
issue/topic and 2) Develop the activities and lesson for delivery.

Texas Tech University, J. D. Ragland, August 2013
13
In the design process, a complete study and analysis of the entire plan is conducted to determine
the number of action plans that will be needed, and how they will be sequenced to implement the
plan program ( (Boone, J. Edgar, Safrit, Dale, R., Jones, Jo, 2002).
Implement: The third critical step is the implementation of the plan. For this step to be
successfully two key tasks must occur: 1) Deliver the content via appropriate delivery method
and 2) Measure customer satisfaction and program participation to determine needed changes.
Methods of delivery may vary depending on the target audience and the situation. Most
commonly is lectures delivery in classroom type settings. However other methods of delivery
may include those held during conferences, meetings, workshops, tours, newsletters, television,
radio, home and farm visits (Ripley, J., Cummings, S., Lockett, L., Pope, P.,Wright, M., Payne,
M., Keith, L., Murphery, T.).
Customer satisfaction is easily transferred to Extension programming. To assure
continued relations with program participants in the future, these basic questions should be
addressed: How satisfied were participants with the program? Were their expectations met?
What did you like the best and the least? Did the program help participants make decisions
about their own situation? (Organizational Development).
Measure: The final and perhaps the most important step is measure. There are three very
important tasks needed for determining total program effectiveness and outcome results:
1) Conduct an evaluation of the entire program to measure its impact. 2) Report the results to the
program stakeholders and 3) Conduct long-term follow-up evaluation to determine the economic
impact when appropriate. Collecting and analyzing program data is crucial in determine if
program has achieved the intended participant change and impact. Some examples of evaluation
methods are: surveys, questionnaires, direct observation and interviews. Stockholders are

Texas Tech University, J. D. Ragland, August 2013
14
extremely interested in program results. Interpret program highlights and summaries to key
individuals and groups such as: coworkers, administration groups and elected officials. Finally,
two to three months following the program distribute a follow up evaluation with questions
pertaining to any economic impact that may have occurred. Any economic benefits will serve as
a much more powerful documentation for interpretation.
Quality Counts Program First we must understand what quality count is and then describe its relationship to the
youth livestock exhibition industry. Quality Counts is a youth livestock educational curriculum
designed for all Texas youth livestock exhibitors. The mission of the program is two-fold:
foster the development of good character for youth who participate in livestock exhibition and to
also teach the importance of food safety and quality assurance in livestock projects (Quality
Counts, 2011).
The curriculum concentrates on teaching youth livestock exhibitor’s character building
by utilizing the six pillars of character: trustworthiness, responsibility, citizenship, caring, respect
and fairness. Furthermore the curriculum focuses on teaching youth how each pillar of character
relates to livestock and the importance of implementing proper animal husbandry practices.
Leading educational and human service organizations across the country uses character Counts,
reaching more than 40 million kids (Character Education, 2012).
In terms of how quality counts fits into the youth livestock exhibiting industry, in recent
years livestock shows and youth exhibitors have received criticism for applying unethical
practices to livestock. This created a bad perception for youth and insinuated that exhibitors
were only involved in the exhibition of livestock, and has little to no knowledge of proper animal
husbandry practices or food safety and quality assurance. This became disturbing to Texas 4-H
and FFA program administration and led to the development of the Quality Counts curriculum in

Texas Tech University, J. D. Ragland, August 2013
15
2005, which was later updated in 2011 (Quality Counts, 2011). In the summer of 2010, all
major livestock shows in Texas adopted the mandatory Quality Counts on-line training and
assessment requirement for all youth exhibitors. This meant that all youth planning to exhibit
livestock at any 2011 major livestock show in Texas must have completed and successfully
passed the quality counts training and assessment prior to entry dates of November 15 or
December 1. All Texas Major Livestock Shows included: State Fair of Texas Dallas, Texas, Ft.
Worth Exposition and Livestock Show, San Antonio Livestock Show, Houston Livestock Show
and Star of Texas Livestock Show Austin, Texas. The required assessment passing score for
quality counts is 80%. To date, there has been no research to determine the impact of the
Quality Counts for youth livestock exhibitors in Texas.
Livestock Exhibition Early history of livestock exhibition records that Elkanah Watson, a New England patriot
and farmer organized the first exhibition of livestock held in Pittsfield, Massachusetts in 1811.
This also marked the first real competition of cattle sheep and swine where prize money was
distributed. (International Association of Fairs & Expositions, 2012). Today there are over 3,200
fairs and shows held throughout the country which are the showcase for livestock competitions,
agricultural exhibits and highlights project work of youth organizations such as 4-H and FFA.
To demonstrate the value of exhibiting livestock and its impact on young participants a
study by Davis, Kieth, Williams and Fraze (2001) investigated the perception and benefits of
competitive livestock exhibiting. This qualitative study was conducted at the Houston Livestock
Show and Rodeo. The findings concluded that there were six major themes related to
competitive livestock exhibiting that were of benefit to the family. Those were: 1) social
relations, 2) character, 3) family, 4) competition, 5) learning new cultures and environments, and

Texas Tech University, J. D. Ragland, August 2013
16
6) helps finance youth’s education. The study concluded that competitive livestock exhibition
does in fact benefit Texas 4-Hers in developing life skills.
An Indiana study conducted by Rusk, Summerlot-Early, Machtmes, Talbert &
Balschweid (2003) determined that 4-Hers who exhibit livestock at a state fair have higher skill
levels in the areas of animal health care and management, selection and grooming than those
who only exhibited at local county fairs. Findings concluded that those involved in livestock
project work develop more responsibilities that benefits in completing homework, being punctual
at work and even caring for younger siblings. The study suggests that livestock project work
does in fact contribute to foundational development for producing productive citizens.
Coufal (2009) conducted a study to determine the total number of youth livestock
projects entered in Texas during 2006 and identify any apparent education trends. Further the
study determined how Quality Counts is perceived by County Extension Agents. The study
determined there were 89,839 livestock projects entered in 2006. This was compared to a similar
study conducted by Boleman, Howard, Smith and Couch (2001) which comparatively indicated a
7.06% increase in market livestock projects since 2000. As an added component, qualitative
data collection indicated Quality Counts to be educationally useful and was easy to implement
mostly being utilized at project clinics. Program participants increased their knowledge of
livestock projects, ethics and character behavior changes.
Character Education While the Quality Counts training program primarily focuses on youth livestock
education, the programs developmental structure is primarily based on the attributes of character
education. In the January (1997) State of the Union Address, former President Bill Clinton,
highlighted and discussed the important need to foster children in their development of character
education (Helwig, 1997). It was the first time a President had ever made character education a

Texas Tech University, J. D. Ragland, August 2013
17
major issue for government as well as its first real initial movement towards implementation
within public education systems.
What is Character Education? It is identified as the process of learning common
attitudes, beliefs and behaviors that are important for people to have as responsible citizens
(Quality Counts, 2011). Character Education stresses the importance of learning and practicing
good behavior that reflects positive ethical values. It helps children to become conscious of the
right thing to do, committed to doing the right thing, and competent in doing the right thing.
Does teaching Character Counts make a difference? According to a study reported by
Josephson Institute, Center for Youth Ethics, 57 Nebraska teachers who taught the six pillars of
character determined the following. Eighty-five percent reported an overall positive difference
in the children they taught. Seventy-three percent reported students using the language of the six
pillars of character and reported a change in their own behavior as a result of teaching character
education. Educators also reported 61% of students were seen helping each other more
frequently. Additionally 55% reported seeing fewer students blaming others and 50% saw
instances where students were being more truthful. (Character Counts! Works And here are the
numbers to prove it., 2007).
While studies like this provide positive results in students, the question then becomes
what type of an effect does it have on those who are teaching character education? A study
conducted by Harms and Fritz (2001) surveyed 53 Cooperative Extension personnel to determine
the effect and personal impact of ethical values from teaching character counts. Results
confirmed that 89% were more sensitive to ethical dilemmas within Cooperative Extension.
Eighty-five percent were more likely to advocate ethical decisions making in their circle of
friends and families. Eighty-three percent were more likely to take a stand in local ethical

Texas Tech University, J. D. Ragland, August 2013
18
situations. These results suggest that there are strong correlations of Extension personnel
teaching character counts and the relationship of sensitivity towards ethical dilemmas within all
facets of Cooperative Extension (Harms, K., Fritz, S., 2001).
Life Skills Gained From Livestock Projects A study conducted by Boleman, Cummings and Briers (2004) investigated parents
perception of 4-Hers involved in beef projects and effects on developing life skills. Results of
the top five selections were: 1) accepting responsibility, 2) setting goals, 3) develop self-
discipline, 4) self-motivation and 5) knowledge of livestock industry. The study revealed there
was indeed a low to moderate, positive relationship between years of participation and life skill
development. Therefore suggesting that the longer children were actively engaged in the beef
project, the more likely they were to develop needed life skills contributing to being more
productive adults.
Food Quality and Safety Standards Within the past 10 years the importance for youth to understand quality assurance of
livestock has become a major concern of livestock educators. Young people participating in
livestock projects need to understand that the final product is food. Furthermore, as a livestock
producer, there’s an obligation to produce a quality product that is safe and wholesome for the
consumer. Adult producers can participant in educational programs such as Beef, Pork and
Dairy Quality Assurance, however there are minimum programs readily available specifically
targeted for youth. A study (Nold & Hanson, 2001) conducted through the University of
Nebraska, Lincoln sought to teach youth the significance of providing a wholesome meat product
to consumers through quality assurance programming. The goal of the study was to develop a
more age appropriate quality assurance program for youth. County Extension Agents were
provided swine educational training kits which contained various hands-on lessons. Both pre

Texas Tech University, J. D. Ragland, August 2013
19
and post-test were delivered to all youth trained. Within the six constructs evaluated, results
indicated increased knowledge by all youth and strongly supported the value of hands-on
educational experiences. More importantly, the youths’ knowledge of quality assurance
strengthened livestock industry standards for producing safe and wholesome food products both
currently as well as in the future.
Due to the fact that livestock that is shown for exhibitions final end point is entered into
the food chain, youth exhibitors should be considered as livestock producers. Each year over 14
million pounds of red meat actively enters the food chain from livestock projects in Texas
(Quality Counts, 2011). Youth need to realize that it is their responsibility to make sure they are
producing safe, wholesome products and that the animal husbandry decisions they make affects
the quality of food available to the consumer.
Major Stock Shows such as State Fair Texas Dallas, Texas, Ft. Worth Exposition, San
Antonio Stock Show, San Angelo Stock Show, Houston Livestock Show and Star of Texas
Livestock Show Austin, Texas are doing their part to guarantee consumers quality assurance and
food safety standards are adhered to for livestock exhibited at shows. All major stock shows
now have zero tolerance and unethical treatment rules in place and are strictly enforced.
However in past years, some violators have created bad publicity for not only the livestock show
industry but also the individual stock show, as well as the 4-H and FFA programs.
According to a report by Goodwin (2001), Fall of 1994- Ohio State Fair, carcasses of
seven of the tops ten steers were condemned because of illegal drugs. Also that same year at the
North American International Livestock Exposition in Louisville, Kentucky, three of the top six
placing animals were found to have illegal drug residues. In September of 1994, Tyler County

Texas Tech University, J. D. Ragland, August 2013
20
Fair in Woodville, Texas a violator was caught putting a water hose down a pigs throat so that if
would fill up with water so that it would make the required weight limit (Goodwin, 2001).
These situations have led livestock exhibitions across this country to engage in animal
ethics and food safety educational programs such as the series of livestock ethics educational
videos produced by Goodwin and quality counts program to educate youth right from wrong
regarding livestock ethics. The Quality Counts curriculum dedicated an entire section to the
food supply continuum (Quality Counts 2011). Steps to the food supply continuum include: 1)
producers, 2) transportation, 3) marketing, 4) harvesting, 5) processing, 6) retail/distribution, 7)
food service and consumer.
The way animals are raised, and decisions their caretakers make determine the quality of
the food that comes from those animals. Youth livestock exhibitors/ producers need to
understand that product safety is critical. However infractions can occur at any point during the
food supply continuum. Improper use of drugs, medicines, stress during transport,
contamination at, during or after carcass harvest, or even improper handling of product by
consumers can all effect food quality and safety.

Texas Tech University, J. D. Ragland, August 2013
21
CHAPTER III
METHODS AND PROCEDURES
This chapter provides the research methods and procedures utilized for this study. This
chapter discusses the following topics: Research Design, Population and Sample, Instrument,
Collection of Data and Analysis of Data.
Purpose and Objectives The purpose of this study was to examine the effectiveness of the current Quality Counts
Training Assessment. Research objectives were developed to determine whether or not
participants meet program objectives. Research objectives of this study are:
1. Describe characteristics of 4-H and FFA members who have taken the Quality Counts
assessment.
2. Compare students who have taken the Quality Counts assessment based on age division
and club affiliation.
3. Evaluate current Quality Counts Assessment results related to program objectives to
determine if curriculum improvements are needed.
Research Design This assessment is a required program of completion for all youth exhibiting livestock in
all major livestock shows in Texas. Secondary purposes of the study was to evaluate all
completed assessment results of participating groups, and identify relationships based on the
research objectives developed for this research study and to also evaluate the four program
objectives to determine if curriculum improvements are needed.

Texas Tech University, J. D. Ragland, August 2013
22
The research design was by three two factorial ANOVA to compare participant groups
and evaluate the quality counts program to determine if participants are meeting each of the four
required objectives set forth by program developers.
Assessment Procedure Beginning in 2012, all major livestock shows in Texas which includes: the State Fair of
Texas, Ft. Worth Stock Show, San Antonio Livestock Exposition, San Angelo Stock Show,
Houston Livestock Show and Rodeo, and the Star of Texas Fair and Rodeo adopted a new rule
that now requires all exhibitors to have successfully completed and passed the Quality Counts
Assessment as part of their livestock entry requirement. All major livestock show entry
deadlines are during the fall with the exception of the State Fair of Texas, which is prior to
spring shows. For all data reported in this study, all major livestock show entry deadlines were:
August 15, 2011 for State Fair of Texas- Dallas, Texas; November 15, 2011 for Ft. Worth Stock
Show- Ft. Worth, Texas; December 1, 2011 for San Antonio Livestock Show- San Antonio,
Texas, San Angelo Livestock Show- San Angelo, Texas, Houston Livestock Show- Houston,
Texas, and Star of Texas Livestock Show- Austin, Texas, as well as the August 15, 2012 entry
deadline for State Fair of Texas- Dallas, Texas.
Participants are required to log on to Quality Counts web site at
http://qualitycounts.tamu.edu/. First step is for all participants to log in their first and last name.
Then they must provide their age, and affiliated group. There are three group selection options,
which include 4-H member, FFA member, or both. Participants must then review the training
section and take the required assessment test to become certified. The Texas A&M AgriLife
Extension Service State 4-H Program Office in College Station, Texas is the housing and
resource agency for both junior and senior age assessment questions.

Texas Tech University, J. D. Ragland, August 2013
23
Population and Sample The target population of this study was all 4-H and FFA junior and senior age youth who
entered livestock at any 2012 major livestock show in Texas. Junior age youth, 9 years or entered
into the third grade to13 years as of August 31, 2011; senior age youth, 14-19 as of August 31,
2011. Although the Quality Counts Curriculum has been in place since 2005 the requirement for
taking corresponding assessment in order to exhibit livestock projects has only been in existence
since 2011.
For this study the population was Quality Counts Assessment "Completers” which
consist of all 4-H and FFA youth livestock exhibitors who intend to exhibit livestock at any
major livestock show in Texas during the 2012 major livestock show season. These youth have
successfully completed the required quality counts program assessment from the time period of
May 7, 2011 to September 18, 2012. All participants must have received Quality Counts training
and successfully passed the assessment prior to entry of any major livestock show. For the major
livestock show season in Texas, from May 7, 2011 to September 18, 2012 there were 18, 580
junior age assessment completers and 75, 172 senior age assessment completers for a sum total
of 93,752 youth completers. Therefore due to the large population size for this study, a suggested
sample size would need to be determined. After much research of reliable resources for
suggested sample sizes, it was determined to utilize the recommendations provided by
Pennsylvania State University (Extension P. S.), publication entitled: How to Determine a
Sample Size which can be found at http://enxtension.psu.edu/evaluation/pdf/TS60.pdf.
The publication illustrates a table to be used as a guide for finding a base sample size utilizing
95% confidence level with a +/- 5% margin of error at a variability of 50% and was the reference
for determining the sample size utilized for this study. The publication table suggests that when
population sizes are 4,000-100,000 then it is recommended to use a sample size of 58. Since this

Texas Tech University, J. D. Ragland, August 2013
24
studies population size for all junior aged (9 to 13 years of age as of August 31 of the current
year) Quality Counts completers there were 18,580 and all senior aged (14 to 19 years of age as
of August 31 of the current year completers there were 75,172. Therefore as recommended by
Pennsylvania State University publication, (Extension P. S.), How to Determine a Sample Size it
was determined that a total of 58 juniors and 58 seniors were selected as the final sample size for
this study. The three different organizations for the junior section include junior 4-H members,
junior FFA members, and junior 4-H and FFA members. The three different organizations for the
senior sections include senior 4-H members, senior FFA members, and senior 4-H and FFA
members. The selection of the 58 participants from each age division was determined by
utilizing the Random Number Generator (Random. Org, 1998-2012) found at www.random.org.
The junior assessment scores within each organization was determined to be a
homogenous group, meaning scores were fairly close to one another. Therefore, due to the large
variance of assessment scores within the senior age division, the descriptive data focuses only
senior age division with the three organization selections. The senior assessment consists of 110
questions that can be found in Appendix C.
Additionally, although there were 75,172 senior age division completers, the data for this
study included assessment scores based on number of total assessment attempts. This is due to
the fact that all Quality Counts completers may take the assessment as many times as needed to
achieve a passing score of 80% or higher. Therefore for this study a total of 107,061 senior
assessment score attempts were analyzed.
Instrument The junior age division assessment is composed of a randomly computer generated 10
question exam. The senior assessment is composed of a randomly computer generated 20
Texas Tech University, J. D. Ragland, August 2013
25
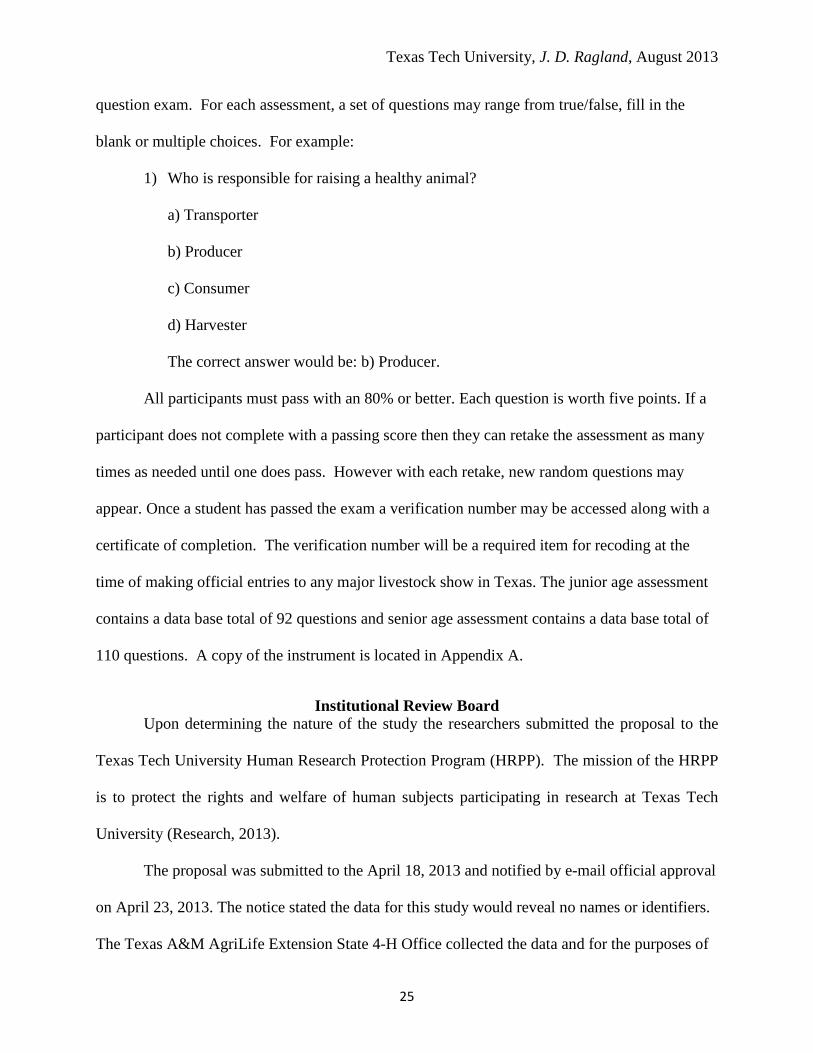
question exam. For each assessment, a set of questions may range from true/false, fill in the
blank or multiple choices. For example:
1) Who is responsible for raising a healthy animal?
a) Transporter
b) Producer
c) Consumer
d) Harvester
The correct answer would be: b) Producer.
All participants must pass with an 80% or better. Each question is worth five points. If a
participant does not complete with a passing score then they can retake the assessment as many
times as needed until one does pass. However with each retake, new random questions may
appear. Once a student has passed the exam a verification number may be accessed along with a
certificate of completion. The verification number will be a required item for recoding at the
time of making official entries to any major livestock show in Texas. The junior age assessment
contains a data base total of 92 questions and senior age assessment contains a data base total of
110 questions. A copy of the instrument is located in Appendix A.
Institutional Review Board Upon determining the nature of the study the researchers submitted the proposal to the
Texas Tech University Human Research Protection Program (HRPP). The mission of the HRPP
is to protect the rights and welfare of human subjects participating in research at Texas Tech
University (Research, 2013).
The proposal was submitted to the April 18, 2013 and notified by e-mail official approval
on April 23, 2013. The notice stated the data for this study would reveal no names or identifiers.
The Texas A&M AgriLife Extension State 4-H Office collected the data and for the purposes of

Texas Tech University, J. D. Ragland, August 2013
26
this study agreed to share the de-identified data. Due to the fact that there will be no interaction
or intervention with human subjects, the HRPP determined that the research did not need HRPP
review or approval. Therefore the proposal file was closed. A copy of the e-mail received is
located in Appendix B.
Collection of Data All data was collected through a central data base storage system operated under the
direction of the Texas A&M AgriLife Extension Service State 4-H Program Office in College
Station, Texas. Data analysis was collected from the assessment instrument based on the
percentage of questions participants answers correct or incorrectly and will be analyzed by using
sums, averages, means and standard deviations. All published data reviled any names or
identifiers of participants. Additionally, there was no interaction or intervention with participants
throughout the study, nor was there any collection of personal or private information from the
subjects. All final data analysis will assist in determining what objectives are being achieved by
quality counts participants and will indicate needed changes in program delivery and assessment.
Analysis of Data The assessments were developed and lead by the Texas A&M AgriLife Extension
Service College Station, Texas. The program is under the direction and leadership of Dr. Chris
Boleman, State 4-H and Youth Development Program Leader. Dr. Boleman and his associate Dr.
Kevin Chilek provides leadership and direction for Quality Counts Program.
For this research all Quality Counts Assessment data has already been collected and is
available through the Texas A&M AgriLife Extension State 4-H Office. All data access has
been granted through permission of Dr. Chris Boleman who has agreed to the release of all
resources and needed materials for this study.

Texas Tech University, J. D. Ragland, August 2013
27
SPSS for windows software version ten was used to calculate the data analysis for this
particular study except where pre coding was needed so that groups and their relationships could
be measured. Due to the fact that Quality Counts program developers had never categorized all
assessment questions to one of the four main objectives, this was the first step. All assessment
questions were color coded and assigned to an objective that best fit the question. For example:
1) A trustworthy youth would not do which of these?
a) Take a water bucket that does not belong to them
b) Use only approved drugs on animals
c) Follow all the show rules
d) Remember to feed and water daily
The correct answer is: a) Take water bucket that does not belong to them.
This question is a best fit to objective 1= blue: To provide character education for
Texas Youth who participate in 4-H and FFA livestock projects. Other objectives were color
coded as: objective 2= yellow: To ensure that animals raised in 4-H and FFA livestock
projects meet all food quality and safety standards; objective 3= pink: To maintain a positive
image for youth livestock programs; and objective 4= green: To assess knowledge of general
animal science.
As a result of the coding task the following assessment question break down as
related to the quality counts program objectives was determined.

Texas Tech University, J. D. Ragland, August 2013
28
Quality Counts Program Objectives: Assessment Junior Senior
1) Ensure all 4-H & FFA livestock projects meet all food quality standards 17 82
2) Provide character education for Texas 4-H and FFA youth 30 14
3) Maintain a positive image of youth livestock programs. 7 6
4) Broaden general knowledge of animal science 38 8
Total: 92 110
Other additional data that was coded prior to generating SPSS version ten calculations for
this study pertained to participants affiliated group. As previously stated, when a participant logs
on to the Quality Counts they must first choose which affiliation they are a member of. Therefore
the following code was assigned for each affiliation: 1= FFA; 2= 4-H and 3= both.

Texas Tech University, J. D. Ragland, August 2013
29
CHAPTER IV
RESULTS AND DISCUSSION
Chapter IV will discuss the findings of this study. Each objective will be explored in-
depth.
Purpose and Objectives The purpose of this study is to evaluate the Quality Counts on-line training and assessment to
determine whether or not participants are meeting the program objectives. The objectives of this
study are:
1. Describe characteristics of 4-H and FFA members who have taken the Quality Counts
Assessment.
2. Compare students who have taken the Quality Counts Assessment based on age division
and club affiliation.
3. Evaluate current Quality Counts Assessment results related to program objectives to
determine if curriculum improvements are needed.
Findings for Research Objective One Research objective one sought to identify characteristics of 4-H and FFA members who
have taken the Quality Counts assessment during the time period of May 7, 2011 to
September 18, 2012. Data gathered and measured included number of individual youth who
indicated, at time of assessment login their primary club affiliation membership as: 1.) 4-H
member, 2.) FFA member, or 3.) both organizations, along with percentage of those
assessment completers from each of the represented groups.
Figure 4.1 illustrates the following findings: The total number of FFA junior age
members and percentage of those who have completed the Quality Counts Assessment

Texas Tech University, J. D. Ragland, August 2013
30
(n = 22, 37.93 %); 4-H junior age members (n = 25, 43.10%); 4-H/ FFA junior age members
(n = 11, 18.96 %); FFA senior age members (n = 46, 79.31 %); 4-H senior age members
(n = 1, 1.72 %); 4-H/ FFA senior age members (n = 11, 18.96 %).
Table 4.1 Characteristics of 4-H and FFA Members FFA 4-H Both Totals
n % n % n % n % Junior
22 37.93% 25 43.10% 11 18.96% 58 100%
Senior 46 79.31% 1 1.72% 11 18.96% 58 100%
Note: % indicates those percentages of members within each of the respected groups
Findings for Research Objective Two Objective two’s goal was to compare 4-H and FFA members who have taken the Quality
Counts assessment based on age division during the time period of May 7, 2011 to September
18, 2012. Characteristics gathered and measured included individual youth organization
membership i.e. 4-H or FFA, or both organizations along with appropriate age division i.e. junior
or senior, average test scores, and standard deviations within each organization and age division.
Figure 4.2 illustrates the organization and age division with average assessment scores that
relate to each category. The follow findings were revealed: The total number of FFA junior age
members who have completed the Quality Counts Assessment (n = 22, M = 85.0%); 4-H junior
age members (n = 25, M = 85.6%); 4-H/ FFA junior age members (n = 11, M = 90.0%); FFA
senior age members (n =46, M = 70.43%); 4-H senior age members (n =1, M = 90.0%); 4-H/
FFA senior age members (n = 11, M = 80.90%).
Texas Tech University, J. D. Ragland, August 2013
31
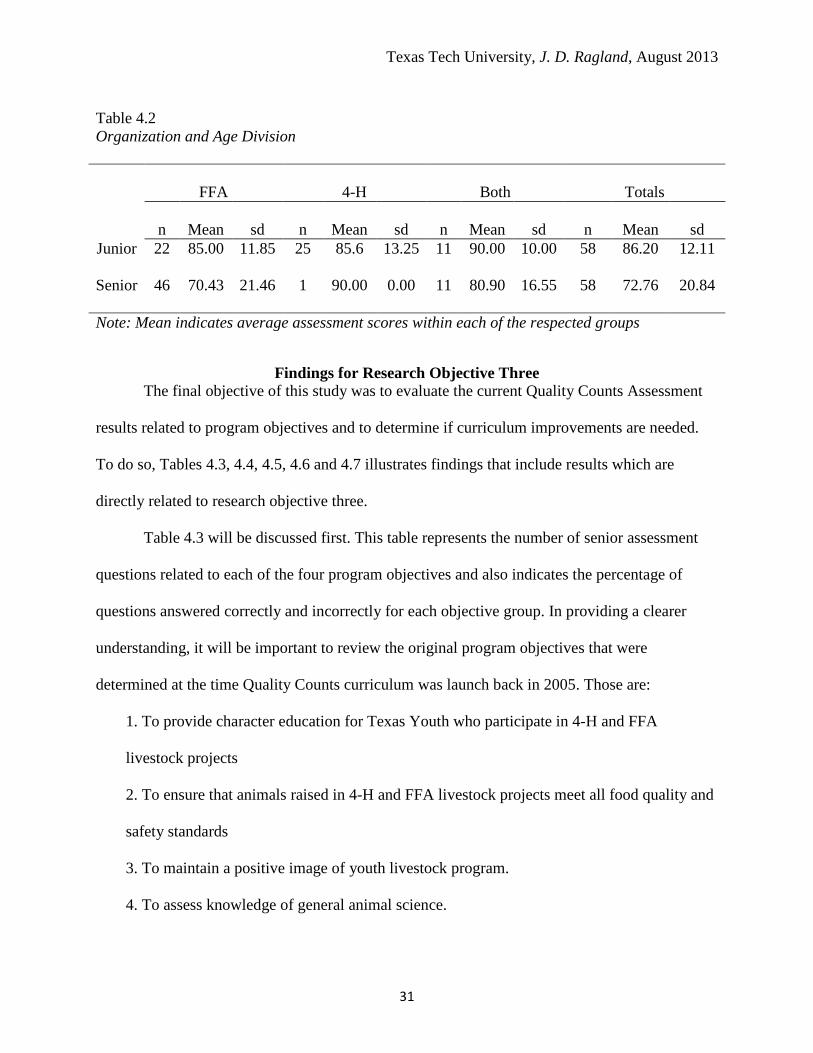
Table 4.2 Organization and Age Division
FFA 4-H Both Totals
n Mean sd n Mean sd n Mean sd n Mean sd
Junior 22 85.00 11.85 25 85.6 13.25 11 90.00 10.00 58 86.20 12.11
Senior 46 70.43 21.46 1 90.00 0.00 11 80.90 16.55 58 72.76 20.84
Note: Mean indicates average assessment scores within each of the respected groups
Findings for Research Objective Three The final objective of this study was to evaluate the current Quality Counts Assessment
results related to program objectives and to determine if curriculum improvements are needed.
To do so, Tables 4.3, 4.4, 4.5, 4.6 and 4.7 illustrates findings that include results which are
directly related to research objective three.
Table 4.3 will be discussed first. This table represents the number of senior assessment
questions related to each of the four program objectives and also indicates the percentage of
questions answered correctly and incorrectly for each objective group. In providing a clearer
understanding, it will be important to review the original program objectives that were
determined at the time Quality Counts curriculum was launch back in 2005. Those are:
1. To provide character education for Texas Youth who participate in 4-H and FFA
livestock projects
2. To ensure that animals raised in 4-H and FFA livestock projects meet all food quality and
safety standards
3. To maintain a positive image of youth livestock program.
4. To assess knowledge of general animal science.

Texas Tech University, J. D. Ragland, August 2013
32
Keep in mind that the Quality Counts senior assessment data base contains a total
of 110 questions. Notice that Table 4.3 indicates there are at total of 82 questions that
directly relate to program objective one. During the time period of May 7, 2011 to
September 18, 2012 there were a total of 75,172 senior age participants that completed
the Quality Counts assessment. In Table 4.3, the frequency represents the number of
times the questions were answered correct and incorrect related to each program
objective The research result for Table 4.3 included the following findings: For Program
Objective one, (n = 82; correct = 68.8%, incorrect = 31.2%); Program Objective Two (n
= 14; correct = 71.4%, incorrect = 28.6%); Program Objective Three (n = 6; correct =
77.9%, incorrect = 22.1%); and Program Objective Four (n = 8, correct = 76.3%,
incorrect = 23.7%).

Texas Tech University, J. D. Ragland, August 2013
33
Table 4.3 Descriptive Data of Senior Quality Counts Assessment Related to Program Objectives
Correct Incorrect Number Program Objective n M SD f % f %
1 To insure that animals raised in 4-H & FFA livestock projects meet all food quality and safety standards
82 0.69 0.43 1,099,134 68.8% 497,368 31.2%
2 To provide character education for Texas youth who participate in 4-H & FFA livestock projects
14 0.71 0.39 194,518 71.4% 77,884 28.6%
3 To maintain a positive image of youth livestock programs 6 0.78 0.39 90,557 77.9% 25,749 22.1%
4 To assess general animal science 8 0.76 0.39 118,976 76.3% 36,921 23.7% Note. (n = number of questions related to specific program objective) Note. Standard deviation applies specifically to mean

Texas Tech University, J. D. Ragland, August 2013
34
Table 4.4 illustrates each question related to program objective one. Frequency and percentage for all correctly and incorrectly
answered questions can be found along with the mean and standard deviation for each question. At the bottom of Table 4.4 the grand
mean for all 82 questions related to program objective one is listed as M = 0.69.
Table 4.4 Descriptive Data of Senior Quality Counts Assessment Questions for Program Objective One Ranked by Mean
Correct Incorrect
Rank Question Number Question M SD f % f %
1 3578 A razor blade is what type of food safety hazard? 0.93 0.26 18320 92.9% 1400 7.1%
2 3589 Who is responsible for cutting the carcass into primal and retail cuts for distribution? 0.90 0.30 17518 89.7% 2010 10.3%
3 3721 All of this information is required on a medication label except 0.90 0.31 17308 89.5% 2021 10.5%
4 3644 On a feed tag, this alerts you to any special concerns that may create problems. 0.89 0.31 17414 89.4% 2058 10.6%
5 3715 All of this information is required on a medication label except 0.88 0.32 17115 88.4% 2253 11.6%
6 3575 Wood chips are what type of food safety hazard? 0.87 0.34 16932 86.9% 2548 13.1%
7 3574 Liquid pesticide residue is what type of food safety hazard? 0.86 0.34 16830 86.3% 2679 13.7%
8 3572 E. Coli Bacteria represent what type of food safety hazard? 0.85 0.36 16423 84.8% 2935 15.2%
9 3640 The part of the label that says "caution, or warning" tells you what? 0.85 0.36 16551 84.6% 3016 15.4%
10 3652 The label says to treat for five days. Your first treatment is Monday and you give the last shot on Friday, which type of medicine use is being described?
0.84 0.36 16520 84.4% 3047 15.6%

Texas Tech University, J. D. Ragland, August 2013
35
Table 4.4 Descriptive Data of Senior Quality Counts Assessment Questions for Program Objective One Ranked by Mean
Correct Incorrect
Rank Question Number Question M SD f % f %
11 3579 A piece of plastic is what type of food safety hazard? 0.84 0.36 16297 84.3% 3024 15.7%
12 3580 Any type of bacteria is what type of food safety hazard? 0.84 0.37 16561 84.1% 3142 15.9%
13 3648 If you are medicating a steer and the label reads that you are to use 2 cc/100lbs. And the steer weighs 900lbs. How much medicine should you use?
0.84 0.37 16547 83.9% 3171 16.1%
14 3653 You use a drug approved for chickens on your sheep without prescription from a veterinarian, which type of medicine use is being described?
0.84 0.37 16191 83.7% 3162 16.3%
15 3738 All of this information is required on a feed label except 0.84 0.37 16298 83.7% 3183 16.3%
16 3736 All of this information is required on a feed label except 0.83 0.37 16166 83.3% 3239 16.7%
17 3594 Record keeping is vital when it comes to food (livestock) production. Producers should keep careful records of what activities?
0.82 0.38 15856 82.1% 3467 17.9%
18 3577 Listeria Virus is what type of food safety hazard? 0.82 0.39 15816 81.9% 3499 18.1%
19 3740 All of this information is required on a feed label except 0.82 0.39 16031 81.8% 3573 18.2%
20 3739 All of this information is required on a feed label except 0.82 0.39 15955 81.6% 3588 18.4%
21 3751 All of this information is required on a feed label except 0.81 0.39 15822 81.4% 3604 18.6%
22 3711 All of this information is required on a medication label except 0.81 0.39 16007 81.1% 3725 18.9%
23 3571 Safe food is equivalent to what? 0.80 0.40 15677 80.3% 3844 19.7%
24 3650 You decide to use a drug for pneumonia to treat your animal's ring worm without consulting a veterinarian, which type of medicine use is being described?
0.79 0.40 15568 79.5% 4018 20.5%
25 3569 Packing plants are not required to have a Hazard Analysis & Critical Control Points (HACCP) program in place. 0.79 0.40 15634 79.3% 4072 20.7%

Texas Tech University, J. D. Ragland, August 2013
36
Table 4.4 Descriptive Data of Senior Quality Counts Assessment Questions for Program Objective One Ranked by Mean
Correct Incorrect
Rank Question Number Question M SD f % f %
26 3702 Lamb's and goat's dressing percent is very close, at 53% and 55% respectively. 0.79 0.41 15511 79.2% 4083 20.8%
27 3712 All of this information is required on a medication label except 0.79 0.41 15389 78.9% 4121 21.1%
28 3576 Oil and grease residue is what type of food safety hazard? 0.78 0.42 15155 77.7% 4339 22.3%
29 3728 All of this information is required on a medication label except 0.77 0.42 14804 76.8% 4461 23.2%
30 3733 From these choices what is the best rout for injection medication 0.77 0.42 15055 76.8% 4558 23.2%
31 3718 All of this information is required on a medication label except 0.76 0.43 14987 76.2% 4673 23.8%
32 3583 The weight of the carcass after an animal has been harvested is referred to as the what? 0.76 0.43 14821 76.2% 4624 23.8%
33 3713 All of this information is required on a medication label except 0.76 0.43 14708 75.6% 4748 24.4%
34 3732 From these choices what is the best route for injection medication 0.75 0.43 14727 75.5% 4785 24.5%
35 3584 What is the name of meat harvested from sheep older than one year of age called? 0.75 0.43 14513 75.3% 4763 24.7%
36 3719 All of this information is required on a medication label except 0.75 0.43 14631 75.0% 4874 25.0%
37 3642 The active ingredient on a medicine label identifies what? 0.75 0.43 14465 74.8% 4870 25.2%
38 3723 All of this information is required on a medication label except 0.75 0.43 14556 74.7% 4935 25.3%
39 3729 All of this information is required on a medication label except 0.75 0.44 14435 74.6% 4902 25.4%
40 3701 What is the average dressing percent for swine? 0.74 0.44 14614 73.8% 5180 26.2%
41 3649 Your animal is diagnosed with foot rot and you treat it with over the counter medication approved for foot rot, which type of medicine use is being described?
0.74 0.44 14233 73.7% 5078 26.3%

Texas Tech University, J. D. Ragland, August 2013
37
Table 4.4 Descriptive Data of Senior Quality Counts Assessment Questions for Program Objective One Ranked by Mean
Correct Incorrect
Rank Question Number Question M SD f % f %
42 3747 All of this information is required on a feed label except 0.73 0.44 14151 72.9% 5265 27.1%
43 3707 Each of these could be considered parts of a Hazard Analysis & Critical Control Points (HACCP) plan except 0.72 0.45 14053 72.1% 5440 27.9%
44 3716 All of this information is required on a medication label except 0.72 0.45 13988 71.8% 5490 28.2%
45 3752 All of this information is required on a feed label except 0.71 0.45 13953 71.3% 5607 28.7%
46 3717 All of this information is required on a medication label except 0.70 0.46 13656 70.0% 5843 30.0%
47 3724 All of this information is required on a medication label except 0.70 0.46 13510 69.9% 5804 30.1%
48 3705 Each of these could be considered parts of a Hazard Analysis & Critical Control Points (HACCP) plan except 0.70 0.46 13596 69.6% 5945 30.4%
49 3722 All of this information is required on a medication label except 0.69 0.46 13622 69.4% 6010 30.6%
50 3586 What is the product after the animal is harvested called? 0.68 0.47 13381 68.3% 6201 31.7%
51 3645 On a feed tag, this identifies the species and class of animal for which the feed is intended to be used. 0.66 0.47 12937 66.3% 6568 33.7%
52 3730 All of this information is required on a medication label except 0.66 0.47 12719 65.7% 6641 34.3%
53 3720 All of this information is required on a medication label except 0.65 0.48 12568 64.8% 6824 35.2%
54 3750 All of this information is required on a feed label except 0.65 0.48 12617 64.6% 6915 35.4%
55 3709 Each of these could be considered parts of a Hazard Analysis & Critical Control Points (HACCP) plan except 0.64 0.48 12451 63.9% 7035 36.1%
56 3735 All of this information is required on a feed label except 0.63 0.48 12351 63.4% 7131 36.6%
57 3749 All of this information is required on a feed label except 0.63 0.48 12318 62.7% 7315 37.3%
58 3654 The label says to give 10cc and your vet says to give 20cc, which type of medicine use is being described? 0.63 0.48 12305 62.7% 7330 37.3%

Texas Tech University, J. D. Ragland, August 2013
38
Table 4.4 Descriptive Data of Senior Quality Counts Assessment Questions for Program Objective One Ranked by Mean
Correct Incorrect
Rank Question Number Question M SD f % f %
59 3588 Who is responsible for safe handling of the animal product once they get it home? 0.62 0.49 12015 62.1% 7319 37.9%
60 3725 All of this information is required on a medication label except 0.61 0.49 11918 61.4% 7483 38.6%
61 3708 Each of these could be considered parts of a Hazard Analysis & Critical Control Points (HACCP) plan except 0.57 0.49 11074 57.4% 8204 42.6%
62 3743 All of this information is required on a feed label except 0.56 0.50 10771 55.6% 8601 44.4%
63 3744 All of this information is required on a feed label except 0.55 0.50 10800 55.5% 8672 44.5%
64 3726 All of this information is required on a medication label except 0.55 0.50 10679 55.3% 8631 44.7%
65 3742 All of this information is required on a feed label except 0.54 0.50 10498 54.0% 8936 46.0%
66 3748 All of this information is required on a feed label except 0.54 0.50 10425 53.5% 9044 46.5%
67 3746 All of this information is required on a feed label except 0.53 0.50 10375 53.2% 9114 46.8%
68 3741 All of this information is required on a feed label except 0.53 0.50 10238 53.0% 9082 47.0%
69 3587 When you calculate the carcass weight divided by the live weight times 100 you are calculating what? 0.51 0.50 9941 51.2% 9475 48.8%
70 3706 Each of these could be considered parts of a Hazard Analysis & Critical Control Points (HACCP) plan except 0.51 0.50 9856 50.8% 9544 49.2%
71 3651 The label says "administer only to lactating females" and your veterinarian says to give it to your three week old calf, which type of medicine use is being described?
0.48 0.50 9353 48.0% 10132 52.0%
72 3714 All of this information is required on a medication label except 0.48 0.50 9198 47.5% 10149 52.5%
73 3734 From these choices what is the best rout for injection medication 0.47 0.50 9059 46.6% 10380 53.4%
74 3737 All of this information is required on a feed label except 0.46 0.50 8841 45.8% 10463 54.2%

Texas Tech University, J. D. Ragland, August 2013
39
Table 4.4 Descriptive Data of Senior Quality Counts Assessment Questions for Program Objective One Ranked by Mean
Correct Incorrect
Rank Question Number Question M SD f % f %
75 3593 What is the process of rendering the animal unconscious, draining the blood, and removing the head intestines and stomach as well as the hide and the shank of the animal called?
0.45 0.50 8864 45.4% 10679 54.6%
76 3710 Each of these could be considered parts of a Hazard Analysis & Critical Control Points (HACCP) plan except 0.45 0.50 8776 45.2% 10621 54.8%
77 3665 How many levels of biosecurity are there? 0.45 0.50 8680 44.6% 10800 55.4%
78 3637 The lot number on a medicine label Identifies what? 0.42 0.49 8029 41.7% 11221 58.3%
79 3646 On a feed tag, this is where you'll find the minimum and/or the maximum levels of essential nutrients. 0.41 0.49 7855 40.7% 11461 59.3%
80 3585 The weight of the animal at the time of harvest is called what? 0.38 0.49 7480 38.0% 12184 62.0%
81 3727 All of this information is required on a medication label except 0.32 0.47 6304 32.2% 13291 67.8%
82 3745 All of this information is required on a feed label except 0.31 0.46 5968 31.1% 13246 68.9%
Grand Mean: 0.69

Texas Tech University, J. D. Ragland, August 2013
40
Table 4.5 illustrates each question related to program objective two. Frequency and percentage for all correctly and incorrectly
answered questions can be found along with the mean and standard deviation for each question. At the bottom of Table 4.5 the grand
mean for all 14 questions related to program objective one is listed as M = 0.72
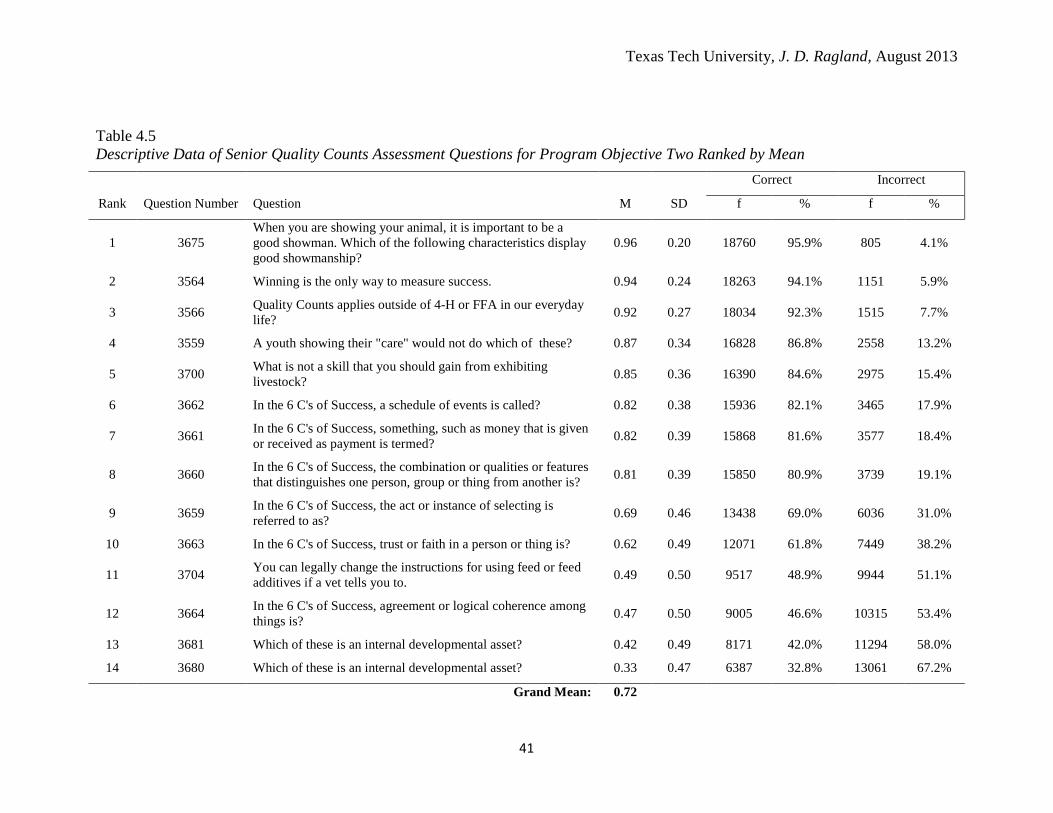
Texas Tech University, J. D. Ragland, August 2013
41
Table 4.5 Descriptive Data of Senior Quality Counts Assessment Questions for Program Objective Two Ranked by Mean
Correct Incorrect
Rank Question Number Question M SD f % f %
1 3675 When you are showing your animal, it is important to be a good showman. Which of the following characteristics display good showmanship?
0.96 0.20 18760 95.9% 805 4.1%
2 3564 Winning is the only way to measure success. 0.94 0.24 18263 94.1% 1151 5.9%
3 3566 Quality Counts applies outside of 4-H or FFA in our everyday life? 0.92 0.27 18034 92.3% 1515 7.7%
4 3559 A youth showing their "care" would not do which of these? 0.87 0.34 16828 86.8% 2558 13.2%
5 3700 What is not a skill that you should gain from exhibiting livestock? 0.85 0.36 16390 84.6% 2975 15.4%
6 3662 In the 6 C's of Success, a schedule of events is called? 0.82 0.38 15936 82.1% 3465 17.9%
7 3661 In the 6 C's of Success, something, such as money that is given or received as payment is termed? 0.82 0.39 15868 81.6% 3577 18.4%
8 3660 In the 6 C's of Success, the combination or qualities or features that distinguishes one person, group or thing from another is? 0.81 0.39 15850 80.9% 3739 19.1%
9 3659 In the 6 C's of Success, the act or instance of selecting is referred to as? 0.69 0.46 13438 69.0% 6036 31.0%
10 3663 In the 6 C's of Success, trust or faith in a person or thing is? 0.62 0.49 12071 61.8% 7449 38.2%
11 3704 You can legally change the instructions for using feed or feed additives if a vet tells you to. 0.49 0.50 9517 48.9% 9944 51.1%
12 3664 In the 6 C's of Success, agreement or logical coherence among things is? 0.47 0.50 9005 46.6% 10315 53.4%
13 3681 Which of these is an internal developmental asset? 0.42 0.49 8171 42.0% 11294 58.0%
14 3680 Which of these is an internal developmental asset? 0.33 0.47 6387 32.8% 13061 67.2%
Grand Mean: 0.72
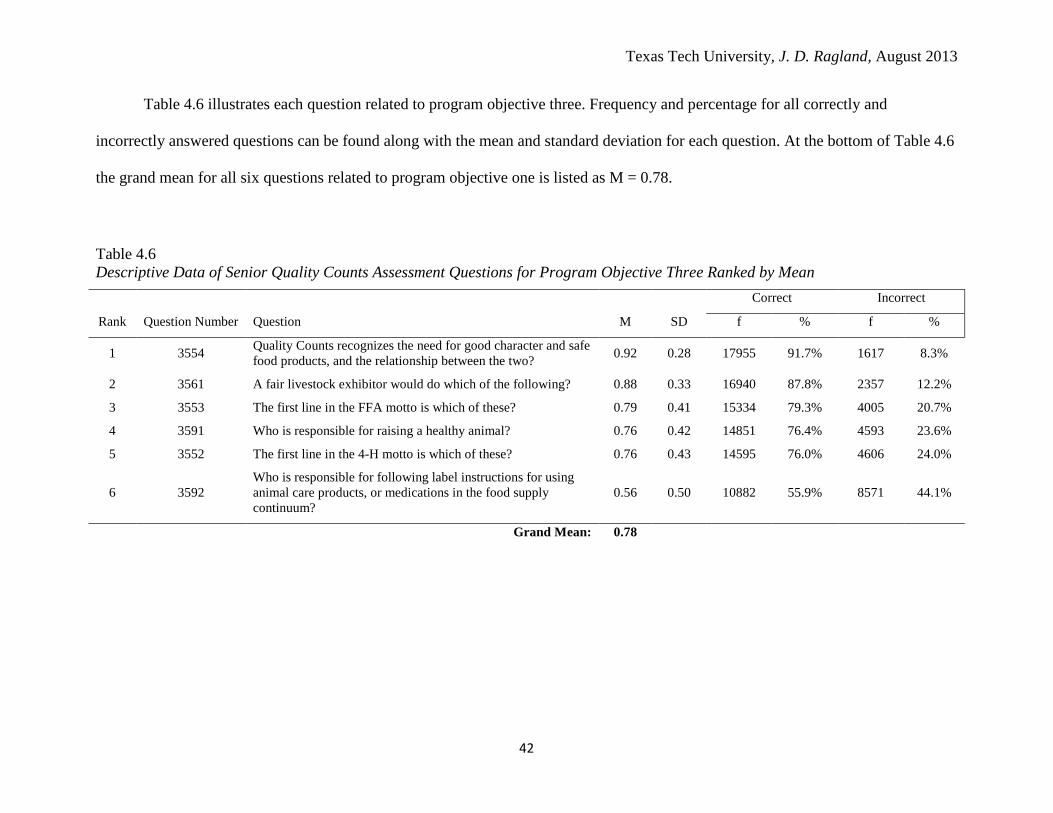
Texas Tech University, J. D. Ragland, August 2013
42
Table 4.6 illustrates each question related to program objective three. Frequency and percentage for all correctly and
incorrectly answered questions can be found along with the mean and standard deviation for each question. At the bottom of Table 4.6
the grand mean for all six questions related to program objective one is listed as M = 0.78.
Table 4.6 Descriptive Data of Senior Quality Counts Assessment Questions for Program Objective Three Ranked by Mean
Correct Incorrect
Rank Question Number Question M SD f % f %
1 3554 Quality Counts recognizes the need for good character and safe food products, and the relationship between the two? 0.92 0.28 17955 91.7% 1617 8.3%
2 3561 A fair livestock exhibitor would do which of the following? 0.88 0.33 16940 87.8% 2357 12.2%
3 3553 The first line in the FFA motto is which of these? 0.79 0.41 15334 79.3% 4005 20.7%
4 3591 Who is responsible for raising a healthy animal? 0.76 0.42 14851 76.4% 4593 23.6%
5 3552 The first line in the 4-H motto is which of these? 0.76 0.43 14595 76.0% 4606 24.0%
6 3592 Who is responsible for following label instructions for using animal care products, or medications in the food supply continuum?
0.56 0.50 10882 55.9% 8571 44.1%
Grand Mean: 0.78

Texas Tech University, J. D. Ragland, August 2013
43
Table 4.7 illustrates each question related to program objective one. Frequency and percentage for all correctly and incorrectly
answered questions can be found along with the mean and standard deviation for each question. At the bottom of Table 4.7 the grand
mean for all eight questions related to program objective one is listed as M = 0.76.
Table 4.7 Descriptive Data of Senior Quality Counts Assessment Questions for Program Objective Four Ranked by Mean
Correct Incorrect
Rank Question Number Question M SD f % f %
1 3619 The ham is (species specific) or found only on what animal? 0.96 0.19 18681 96.1% 763 3.9%
2 3617 The brisket is (species specific) or found only on what animal? 0.91 0.29 17688 90.9% 1771 9.1%
3 3600 What should be visible in the lower quarter of a steer when it is walking? 0.82 0.38 16159 82.3% 3478 17.7%
4 3623 When you ear notch a hog's right ear it denotes what? 0.81 0.39 15980 81.4% 3657 18.6%
5 3620 The jowl is (species specific) or found only on what animal? 0.75 0.43 14392 75.1% 4771 24.9%
6 3616 What cattle breed is not typically used as a show steer? 0.73 0.44 14287 73.2% 5243 26.8%
7 3603 Which of these is the best growth indicator found on market lambs and goats? 0.57 0.50 11071 56.6% 8505 43.4%
8 3596 Cattle, sheep, and goats don’t have front top teeth, just molars in the back 0.55 0.50 10718 55.1% 8733 44.9%
Grand Mean: 0.76

Texas Tech University, J. D. Ragland, August 2013
44
Table 4.8 ranks all 110 senior Quality Counts assessment questions from highest to lowest percentages based upon questions
answered correctly and incorrectly.
Table 4.8 Descriptive Data of Senior Quality Counts Assessment Questions Sorted by Average
Correct Incorrect
Rank Question Number Question Program Objective n M SD f % f %
1 3619 The ham is (species specific) or found only on what animal?
4 19444 0.96 0.19 18681 96.1% 763 3.9%
2 3675 When you are showing your animal, it is important to be a good showman. Which of the following characteristics display good showmanship?
2 19565 0.96 0.20 18760 95.9% 805 4.1%
3 3564 Winning is the only way to measure success. 2 19414 0.94 0.24 18263 94.1% 1151 5.9%
4 3578 A razor blade is what type of food safety hazard? 1 19720 0.93 0.26 18320 92.9% 1400 7.1%
5 3566 Quality Counts applies outside of 4-H or FFA in our everyday life?
2 19549 0.92 0.27 18034 92.3% 1515 7.7%
6 3554 Quality Counts recognizes the need for good character and safe food products, and the relationship between the two?
3 19572 0.92 0.28 17955 91.7% 1617 8.3%
7 3617 The brisket is (species specific) or found only on what animal?
4 19459 0.91 0.29 17688 90.9% 1771 9.1%
8 3589 Who is responsible for cutting the carcass into primal and retail cuts for distribution?
1 19528 0.90 0.30 17518 89.7% 2010 10.3%
9 3721 All of this information is required on a medication label except
1 19329 0.90 0.31 17308 89.5% 2021 10.5%
10 3644 On a feed tag, this alerts you to any special concerns that may create problems.
1 19472 0.89 0.31 17414 89.4% 2058 10.6%

Texas Tech University, J. D. Ragland, August 2013
45
Table 4.8 Descriptive Data of Senior Quality Counts Assessment Questions Sorted by Average
Correct Incorrect
Rank Question Number Question Program Objective n M SD f % f %
11 3715 All of this information is required on a medication label except
1 19368 0.88 0.32 17115 88.4% 2253 11.6%
12 3561 A fair livestock exhibitor would do which of the following?
3 19297 0.88 0.33 16940 87.8% 2357 12.2%
13 3575 Wood chips are what type of food safety hazard? 1 19480 0.87 0.34 16932 86.9% 2548 13.1%
14 3559 A youth showing their "care" would not do which of these?
2 19386 0.87 0.34 16828 86.8% 2558 13.2%
15 3574 Liquid pesticide residue is what type of food safety hazard?
1 19509 0.86 0.34 16830 86.3% 2679 13.7%
16 3572 E. Coli Bacteria represent what type of food safety hazard?
1 19358 0.85 0.36 16423 84.8% 2935 15.2%
17 3700 What is not a skill that you should gain from exhibiting livestock?
2 19365 0.85 0.36 16390 84.6% 2975 15.4%
18 3640 The part of the label that says "caution, or warning" tells you what?
1 19567 0.85 0.36 16551 84.6% 3016 15.4%
19 3652 The label says to treat for five days. Your first treatment is Monday and you give the last shot on Friday, which type of medicine use is being described?
1 19567 0.84 0.36 16520 84.4% 3047 15.6%
20 3579 A piece of plastic is what type of food safety hazard?
1 19321 0.84 0.36 16297 84.3% 3024 15.7%
21 3580 Any type of bacteria is what type of food safety hazard?
1 19703 0.84 0.37 16561 84.1% 3142 15.9%

Texas Tech University, J. D. Ragland, August 2013
46
Table 4.8 Descriptive Data of Senior Quality Counts Assessment Questions Sorted by Average
Correct Incorrect
Rank Question Number Question Program Objective n M SD f % f %
22 3648 If you are medicating a steer and the label reads that you are to use 2 cc/100lbs. And the steer weighs 900lbs. How much medicine should you use?
1 19718 0.84 0.37 16547 83.9% 3171 16.1%
23 3653 You use a drug approved for chickens on your sheep without prescription from a veterinarian, which type of medicine use is being described?
1 19353 0.84 0.37 16191 83.7% 3162 16.3%
24 3738 All of this information is required on a feed label except
1 19481 0.84 0.37 16298 83.7% 3183 16.3%
25 3736 All of this information is required on a feed label except
1 19405 0.83 0.37 16166 83.3% 3239 16.7%
26 3600 What should be visible in the lower quarter of a steer when it is walking?
4 19637 0.82 0.38 16159 82.3% 3478 17.7%
27 3662 In the 6 C's of Success, a schedule of events is called?
2 19401 0.82 0.38 15936 82.1% 3465 17.9%
28 3594 Record keeping is vital when it comes to food (livestock) production. Producers should keep careful records of what activities?
1 19323 0.82 0.38 15856 82.1% 3467 17.9%
29 3577 Listeria Virus is what type of food safety hazard? 1 19315 0.82 0.39 15816 81.9% 3499 18.1%
30 3740 All of this information is required on a feed label except
1 19604 0.82 0.39 16031 81.8% 3573 18.2%
31 3739 All of this information is required on a feed label except
1 19543 0.82 0.39 15955 81.6% 3588 18.4%
32 3661 In the 6 C's of Success, something, such as money that is given or received as payment is termed?
2 19445 0.82 0.39 15868 81.6% 3577 18.4%

Texas Tech University, J. D. Ragland, August 2013
47
Table 4.8 Descriptive Data of Senior Quality Counts Assessment Questions Sorted by Average
Correct Incorrect
Rank Question Number Question Program Objective n M SD f % f %
33 3751 All of this information is required on a feed label except
1 19426 0.81 0.39 15822 81.4% 3604 18.6%
34 3623 When you ear notch a hog's right ear it denotes what?
4 19637 0.81 0.39 15980 81.4% 3657 18.6%
35 3711 All of this information is required on a medication label except
1 19732 0.81 0.39 16007 81.1% 3725 18.9%
36 3660 In the 6 C's of Success, the combination or qualities or features that distinguishes one person, group or thing from another is?
2 19589 0.81 0.39 15850 80.9% 3739 19.1%
37 3571 Safe food is equivalent to what? 1 19521 0.80 0.40 15677 80.3% 3844 19.7%
38 3650 You decide to use a drug for pneumonia to treat your animal's ring worm without consulting a veterinarian, which type of medicine use is being described?
1 19586 0.79 0.40 15568 79.5% 4018 20.5%
39 3569 Packing plants are not required to have a Hazard Analysis & Critical Control Points (HACCP) program in place.
1 19706 0.79 0.40 15634 79.3% 4072 20.7%
40 3553 The first line in the FFA motto is which of these? 3 19339 0.79 0.41 15334 79.3% 4005 20.7%
41 3702 Lamb's and goat's dressing percent is very close, at 53% and 55% respectively.
1 19594 0.79 0.41 15511 79.2% 4083 20.8%
42 3712 All of this information is required on a medication label except
1 19510 0.79 0.41 15389 78.9% 4121 21.1%
43 3576 Oil and grease residue is what type of food safety hazard?
1 19494 0.78 0.42 15155 77.7% 4339 22.3%

Texas Tech University, J. D. Ragland, August 2013
48
Table 4.8 Descriptive Data of Senior Quality Counts Assessment Questions Sorted by Average
Correct Incorrect
Rank Question Number Question Program Objective n M SD f % f %
44 3728 All of this information is required on a medication label except
1 19265 0.77 0.42 14804 76.8% 4461 23.2%
45 3733 From these choices what is the best rout for injection medication
1 19613 0.77 0.42 15055 76.8% 4558 23.2%
46 3591 Who is responsible for raising a healthy animal? 3 19444 0.76 0.42 14851 76.4% 4593 23.6%
47 3718 All of this information is required on a medication label except
1 19660 0.76 0.43 14987 76.2% 4673 23.8%
48 3583 The weight of the carcass after an animal has been harvested is referred to as the what?
1 19445 0.76 0.43 14821 76.2% 4624 23.8%
49 3552 The first line in the 4-H motto is which of these? 3 19201 0.76 0.43 14595 76.0% 4606 24.0%
50 3713 All of this information is required on a medication label except
1 19456 0.76 0.43 14708 75.6% 4748 24.4%
51 3732 From these choices what is the best route for injection medication
1 19512 0.75 0.43 14727 75.5% 4785 24.5%
52 3584 What is the name of meat harvested from sheep older than one year of age called?
1 19276 0.75 0.43 14513 75.3% 4763 24.7%
53 3620 The jowl is (species specific) or found only on what animal?
4 19163 0.75 0.43 14392 75.1% 4771 24.9%
54 3719 All of this information is required on a medication label except
1 19505 0.75 0.43 14631 75.0% 4874 25.0%
55 3642 The active ingredient on a medicine label identifies what?
1 19335 0.75 0.43 14465 74.8% 4870 25.2%
56 3723 All of this information is required on a medication label except
1 19491 0.75 0.43 14556 74.7% 4935 25.3%

Texas Tech University, J. D. Ragland, August 2013
49
Table 4.8 Descriptive Data of Senior Quality Counts Assessment Questions Sorted by Average
Correct Incorrect
Rank Question Number Question Program Objective n M SD f % f %
57 3729 All of this information is required on a medication label except
1 19337 0.75 0.44 14435 74.6% 4902 25.4%
58 3701 What is the average dressing percent for swine? 1 19794 0.74 0.44 14614 73.8% 5180 26.2%
59 3649 Your animal is diagnosed with foot rot and you treat it with over the counter medication approved for foot rot, which type of medicine use is being described?
1 19311 0.74 0.44 14233 73.7% 5078 26.3%
60 3616 What cattle breed is not typically used as a show steer?
4 19530 0.73 0.44 14287 73.2% 5243 26.8%
61 3747 All of this information is required on a feed label except
1 19416 0.73 0.44 14151 72.9% 5265 27.1%
62 3707 Each of these could be considered parts of a Hazard Analysis & Critical Control Points (HACCP) plan except
1 19493 0.72 0.45 14053 72.1% 5440 27.9%
63 3716 All of this information is required on a medication label except
1 19478 0.72 0.45 13988 71.8% 5490 28.2%
64 3752 All of this information is required on a feed label except
1 19560 0.71 0.45 13953 71.3% 5607 28.7%
65 3717 All of this information is required on a medication label except
1 19499 0.70 0.46 13656 70.0% 5843 30.0%
66 3724 All of this information is required on a medication label except
1 19314 0.70 0.46 13510 69.9% 5804 30.1%
67 3705 Each of these could be considered parts of a Hazard Analysis & Critical Control Points (HACCP) plan except
1 19541 0.70 0.46 13596 69.6% 5945 30.4%

Texas Tech University, J. D. Ragland, August 2013
50
Table 4.8 Descriptive Data of Senior Quality Counts Assessment Questions Sorted by Average
Correct Incorrect
Rank Question Number Question Program Objective n M SD f % f %
68 3722 All of this information is required on a medication label except
1 19632 0.69 0.46 13622 69.4% 6010 30.6%
69 3659 In the 6 C's of Success, the act or instance of selecting is referred to as?
2 19474 0.69 0.46 13438 69.0% 6036 31.0%
70 3586 What is the product after the animal is harvested called?
1 19582 0.68 0.47 13381 68.3% 6201 31.7%
71 3645 On a feed tag, this identifies the species and class of animal for which the feed is intended to be used.
1 19505 0.66 0.47 12937 66.3% 6568 33.7%
72 3730 All of this information is required on a medication label except
1 19360 0.66 0.47 12719 65.7% 6641 34.3%
73 3720 All of this information is required on a medication label except
1 19392 0.65 0.48 12568 64.8% 6824 35.2%
74 3750 All of this information is required on a feed label except
1 19532 0.65 0.48 12617 64.6% 6915 35.4%
75 3709 Each of these could be considered parts of a Hazard Analysis & Critical Control Points (HACCP) plan except
1 19486 0.64 0.48 12451 63.9% 7035 36.1%
76 3735 All of this information is required on a feed label except
1 19482 0.63 0.48 12351 63.4% 7131 36.6%
77 3749 All of this information is required on a feed label except
1 19633 0.63 0.48 12318 62.7% 7315 37.3%
78 3654 The label says to give 10cc and your vet says to give 20cc, which type of medicine use is being described?
1 19635 0.63 0.48 12305 62.7% 7330 37.3%

Texas Tech University, J. D. Ragland, August 2013
51
Table 4.8 Descriptive Data of Senior Quality Counts Assessment Questions Sorted by Average
Correct Incorrect
Rank Question Number Question Program Objective n M SD f % f %
79 3588 Who is responsible for safe handling of the animal product once they get it home?
1 19334 0.62 0.49 12015 62.1% 7319 37.9%
80 3663 In the 6 C's of Success, trust or faith in a person or thing is?
2 19520 0.62 0.49 12071 61.8% 7449 38.2%
81 3725 All of this information is required on a medication label except
1 19401 0.61 0.49 11918 61.4% 7483 38.6%
82 3708 Each of these could be considered parts of a Hazard Analysis & Critical Control Points (HACCP) plan except
1 19278 0.57 0.49 11074 57.4% 8204 42.6%
83 3603 Which of these is the best growth indicator found on market lambs and goats?
4 19576 0.57 0.50 11071 56.6% 8505 43.4%
84 3592 Who is responsible for following label instructions for using animal care products, or medications in the food supply continuum?
3 19453 0.56 0.50 10882 55.9% 8571 44.1%
85 3743 All of this information is required on a feed label except
1 19372 0.56 0.50 10771 55.6% 8601 44.4%
86 3744 All of this information is required on a feed label except
1 19472 0.55 0.50 10800 55.5% 8672 44.5%
87 3726 All of this information is required on a medication label except
1 19310 0.55 0.50 10679 55.3% 8631 44.7%
88 3596 Cattle, sheep, and goats don’t have front top teeth, just molars in the back
4 19451 0.55 0.50 10718 55.1% 8733 44.9%
89 3742 All of this information is required on a feed label except
1 19434 0.54 0.50 10498 54.0% 8936 46.0%

Texas Tech University, J. D. Ragland, August 2013
52
Table 4.8 Descriptive Data of Senior Quality Counts Assessment Questions Sorted by Average
Correct Incorrect
Rank Question Number Question Program Objective n M SD f % f %
90 3748 All of this information is required on a feed label except
1 19469 0.54 0.50 10425 53.5% 9044 46.5%
91 3746 All of this information is required on a feed label except
1 19489 0.53 0.50 10375 53.2% 9114 46.8%
92 3741 All of this information is required on a feed label except
1 19320 0.53 0.50 10238 53.0% 9082 47.0%
93 3587 When you calculate the carcass weight divided by the live weight times 100 you are calculating what?
1 19416 0.51 0.50 9941 51.2% 9475 48.8%
94 3706 Each of these could be conidered parts of a Hazard Analysis & Critical Control Points (HACCP) plan except
1 19400 0.51 0.50 9856 50.8% 9544 49.2%
95 3704 You can legally change the instructions for using feed or feed additives if a vet tells you to.
2 19461 0.49 0.50 9517 48.9% 9944 51.1%
96 3651 The label says "administer only to lactating females" and your veterinarian says to give it to your three week old calf, which type of medicine use is being described?
1 19485 0.48 0.50 9353 48.0% 10132 52.0%
97 3714 All of this information is required on a medication label except
1 19347 0.48 0.50 9198 47.5% 10149 52.5%
98 3664 In the 6 C's of Success, agreement or logical coherence among things is?
2 19320 0.47 0.50 9005 46.6% 10315 53.4%
99 3734 From these choices what is the best rout for injection medication
1 19439 0.47 0.50 9059 46.6% 10380 53.4%
100 3737 All of this information is required on a feed label except
1 19304 0.46 0.50 8841 45.8% 10463 54.2%
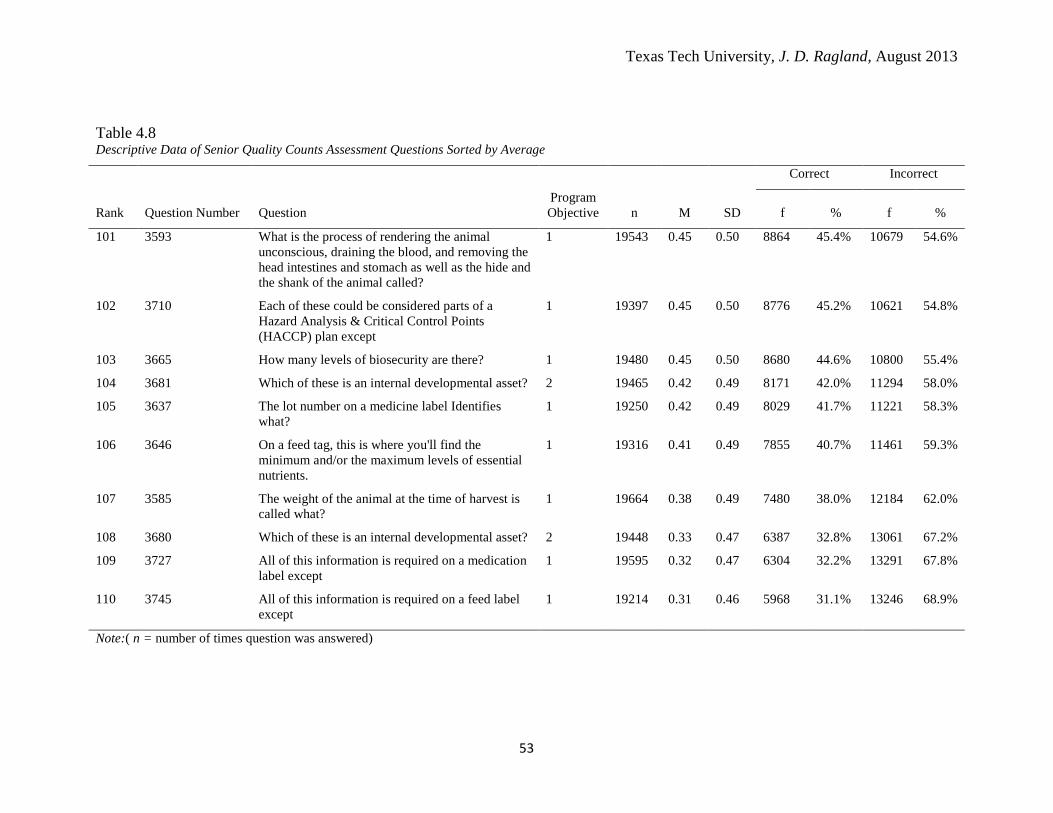
Texas Tech University, J. D. Ragland, August 2013
53
Table 4.8 Descriptive Data of Senior Quality Counts Assessment Questions Sorted by Average
Correct Incorrect
Rank Question Number Question Program Objective n M SD f % f %
101 3593 What is the process of rendering the animal unconscious, draining the blood, and removing the head intestines and stomach as well as the hide and the shank of the animal called?
1 19543 0.45 0.50 8864 45.4% 10679 54.6%
102 3710 Each of these could be considered parts of a Hazard Analysis & Critical Control Points (HACCP) plan except
1 19397 0.45 0.50 8776 45.2% 10621 54.8%
103 3665 How many levels of biosecurity are there? 1 19480 0.45 0.50 8680 44.6% 10800 55.4%
104 3681 Which of these is an internal developmental asset? 2 19465 0.42 0.49 8171 42.0% 11294 58.0%
105 3637 The lot number on a medicine label Identifies what?
1 19250 0.42 0.49 8029 41.7% 11221 58.3%
106 3646 On a feed tag, this is where you'll find the minimum and/or the maximum levels of essential nutrients.
1 19316 0.41 0.49 7855 40.7% 11461 59.3%
107 3585 The weight of the animal at the time of harvest is called what?
1 19664 0.38 0.49 7480 38.0% 12184 62.0%
108 3680 Which of these is an internal developmental asset? 2 19448 0.33 0.47 6387 32.8% 13061 67.2%
109 3727 All of this information is required on a medication label except
1 19595 0.32 0.47 6304 32.2% 13291 67.8%
110 3745 All of this information is required on a feed label except
1 19214 0.31 0.46 5968 31.1% 13246 68.9%
Note:( n = number of times question was answered)

Texas Tech University, J. D. Ragland, August 2013
54
CHAPTER V
SUMMARY, CONCLUSION, IMPLICATIONS AND RECOMMENDATIONS The final Chapter V features a summary of the study as well as conclusions, implications
and recommendations.
Purpose and Objectives The purpose of this study was to evaluate the Quality Counts on-line training and assessment
to determine whether or not participants are meeting the program objectives. Objectives for this
study are:
1. Describe characteristics of 4-H and FFA members who have taken the Quality Counts
Assessment.
2. Compare students who have taken the Quality Counts Assessment based on age division
and club affiliation.
3. Evaluate current Quality Counts Assessment results related to program objectives to
determine if curriculum improvements are needed.
Limitations of the Study This study had two major limitations, which should be considered in interpreting the findings:
1. This study was limited to only 4-H and FFA youth exhibiting livestock at any major stock
show in Texas.
2. The study was limited to Quality Counts Program Assessments on-line completers during
the time period of May 7, 2011 thru September 18, 2012 only, and did not include any
additional years.
3. Based on the randomly generated selection of senior age 4-H members for this study,
research data reflects one single member’s assessment score from that particular group.

Texas Tech University, J. D. Ragland, August 2013
55
Research Design The research designs main purpose for this study was twofold. First was the intent to
examine the effectiveness of the Quality Counts Assessment. This Assessment is a requirement
for all youth exhibiting livestock at all major livestock shows in Texas. Those shows included:
State Fair of Texas in Dallas, Ft. Worth Livestock Show and Exposition, San Antonio Livestock
Show, San Angelo Stock Show, Houston Livestock Show and Star of Texas Livestock Show in
Austin. The second purposes was to evaluate all completed assessment results of participants
and their designated organization and identify relationships based on the original four research
objectives determined in 2005 and to determine if curriculum improvements are needed. The
research design will include descriptive research for comparing participant groups and evaluate
the quality counts program to determine if participants are meeting each of the four required
objectives set forth by program developers.
Population and Sample The target population of this study was all 4-H and FFA junior and senior age youth who
entered livestock at any 2012 major livestock show in Texas. Junior age youth requirements, 9
years or entered into the third grade to13 years as of August 31, 2011, senior age youth, 14-19 as
of August 31, 2011. The population of this study represented all participants who completed the
on-line assessment during May 7, 2011 thru September 18, 2012. Therefore according to Quality
Counts Program database records there were 18,540 junior aged youth and 75, 172 senior aged
youth for a combined total of 93,725 completers (Chilek, 2012). Due to the large population size
for this study, a suggested sample size would need to be determined. After much research of
reliable resources for suggested sample sizes, it was determined to utilize the recommendations
provided by Pennsylvania State University (Extension P. S.), publication entitled: How to
Determine a Sample Size .The publication suggests when utilizing 95% confidence level with a

Texas Tech University, J. D. Ragland, August 2013
56
+/- 5% margin of error at a variability of 50% with population size of 4,000-100,000 it is
recommended to utilize as sample size of 58 (Extension P. S,) Therefore findings indicated in
tables 4.1 and 4.2 are based on 58 junior aged Quality Counts assessment completers as well as
58 senior aged junior completers. The Random Number Generator (Random. Org, 1998-2012)
was utilized for the selection of the 58 for each age division.
When analyzing the junior aged assessment scores it was determined that the group was
homogeneous, meaning scores were fairly close to one another. Therefore only the senior age
division descriptive data found in tables 4.3, 4.4 and 4.5 were the focus for this study. Quality
Counts completers may take the assessment as many times as needed to achieve a passing score
of 80% or higher. Therefore for this study a total of 107,061 senior assessment score attempts
were analyzed.
Instrument The assessment instrument used for this study had already been developed by Quality
Counts Program developers and is the required instrument for all completers. This on-line system
is equipped with separate junior and senior aged assessments. The junior aged assessment is
composed of a randomly computer generated 10 question exam. The senior aged assessment is
composed of a randomly computer generated 20 question exam. For each assessment, a set of
questions may range from true/false; fill in the blank or multiple choices. The junior age
assessment database contains a total of 92 questions and the senior age assessment database
contains a total of 110 questions. A copy of the instrument is located in Appendix C.
All participants must pass with an 80% or better. Each question is worth five points. If a
participant does not pass then retakes may be taken as many times as needed. However with each
retake, new random questions may appear. Once a completer has passed the assessment then a

Texas Tech University, J. D. Ragland, August 2013
57
certificate of completion will appear along with an assigned certificate of completion number.
This verification number is a required item for recoding at the time of official entries to any
major livestock show in Texas.
Institutional Review Board Upon determining the nature of the study the researchers submitted the proposal to the
Texas Tech University Human Research Protection Program (HRPP). The proposal was
submitted on April 18, 2013 and notified by e-mail of official approval on April 23, 2013.
A copy of the e-mail received is located in Appendix B.
Collection of Data All data was collected through a central data base storage system operated under the
direction of the Texas A&M AgriLife Extension Service State 4-H Program Office in College
Station, Texas. Data analysis will be collected from the assessment instrument based on the
percentage of questions participants answers correct or incorrectly and will be analyzed by using
sums, averages, means and standard deviations. All published data did not revile any names or
identifiers of participants. Additionally, throughout the course of this study at no time was there
interaction with any participants.
Analysis of Data For this study all Quality Counts Assessment data had already been collected and made
available through the Texas A&M AgriLife Extension State 4-H Office located on the Texas
A&M University Campus in College Station, Texas. All data access has been granted through
permission of Dr. Chris Boleman who has agreed to the release of all resources and needed
materials for this study. SPSS for windows software version ten was used to calculate the data
analysis for this particular study except where pre coding was needed so that groups and their
relationships could be measured.

Texas Tech University, J. D. Ragland, August 2013
58
Summary of Findings and Conclusions
Research Objective One Research objective one sought to identify characteristics of 4-H and FFA members who
have taken the Quality Counts assessment during the time period of May 7, 2011 to
September 18, 2012. According to recommendations from the Pennsylvania State University
publication, How to Select a Random Sample Size (Extension P. S), a randomly selected 58
junior and 58 senior Quality Counts completers were utilized and are indicated in Tables 4.1
and 4.2. Table 4.1, includes the number of individual youth member from recommended
sample size of 58 and their selected choice of organization i.e. 4-H or FFA, or both along
with represented percentage of those respected groups.
For research objective one, there are two key conclusions that can be made. First, this
study’s research data finds that the majority (43.10%) of those who have taken the Quality
Counts Assessment at the junior age level are members who indicated 4-H as their only
organization. Secondly, and interestingly enough the research data also finds that the majority
(79.31%) at the senior age level indicated FFA as their only organization. Therefore research
data in Table 4.1 helps support conclusion that junior aged Quality Counts completers are more
than likely participating and being informed about the Quality Counts program and requirements
through County Extension Offices and the many 4-H programs throughout Texas. On the other
hand, as youth advance to senior age level they appear to become involved in local high school
FFA programs and are more than likely receiving their Quality Counts information through their
local FFA chapters.
Research Objective Two Research objective two’s goal was to compare assessment scores of junior and senior 4-H
and FFA member groups who have taken the Quality Counts assessment during the time period

Texas Tech University, J. D. Ragland, August 2013
59
of May 7, 2011 to September 18, 2012. Characteristics of these groups were gathered and
measured and can be found in Table 4.2. Participants were asked to select their choice of
organizational membership i.e. 4-H member, FFA member, or both organizations along with
appropriate age division i.e. junior or senior.
Research objective two concluded that assessment scores at the junior age level where
were fairly comparable i.e. FFA (M = 85%), 4-H (M = 85.6) and FFA/4-H (M =90%). However
when comparing assessment scores at the senior age level scores relieved FFA (M = 70.4%) and
4-H (M = 90%), and FFA/4-H (M = 80.90%). Again, keep in mind the randomly generated
selection process assigned only one senior 4-H member to the group. Research data obtained in
Table 4.2 supports the conception that perhaps senior age FFA participants may not be as
informed or receiving the level of Quality Counts instruction needed to achieve higher
percentages of assessment scores.
Research Objective Three The final research objective of this study was to evaluate Quality Counts Assessment
results to related program objectives to determine if curriculum improvements are needed. For
this research objective there were three main components. Each component featured a separate
table to illustrate all findings.
The first component for research objective three, Table 4.3 represents the number of
senior assessment questions related to a specific program objective and the percentage of correct
and incorrect answers per objective. Program Objective One: To insure that animals raised in 4-
H & FFA livestock projects meet all food quality and safety standards (n = 82; correct = 68.8%,
incorrect = 31.2%); Program Objective Two: To provide character education for Texas youth
who participate in 4-H & FFA livestock projects (n = 14; correct = 71.4%, incorrect = 28.6%);

Texas Tech University, J. D. Ragland, August 2013
60
Program Objective Three: To maintain a positive image of youth livestock programs (n = 6;
correct = 77.9%, incorrect = 22.1%); Program Objective Four: To assess knowledge of general
animal science (n = 8, correct = 76.3%, incorrect = 23.7%).
Conclusions for the first component of research objective three determined the most
frequently correct and incorrect answered questions from the 110 data base senior assessment
questions. The research data concluded that 74.54% of a senior age assessment is directly related
to program objective one (answered correct = 68%, answered incorrect = 31.2 %.). Adding
12.72% of the questions are related to program objective two (answered correct = 71.4%,
answered incorrect = 28.6%). Whereas only 5.45% of the questions are related to program
objective three (answered correct = 77.9%, answered correct = 22.1%). Finally, 7.27% of the
questions are related to program objective four (answered correct = 76.3%, answered correct =
23.7%). This research data concludes that senior assessment questions need to be distributed
more equally among all program objectives.
The second component for research objective three is illustrated in Tables 4.4, 4.5, 4.6
and 4.7. Table 4.4 illustrates each question related to program objective one. Frequency and
percentage for all correctly and incorrectly answered questions can be found along with the mean
and standard deviation for each question. A total of 82 questions were directly related to program
objective one.
Conclusion for second component shown in Table 4.4 that the top nine ranking questions
for program objective one contained average assessment scores ranging from 93% to 85%.
Additionally all questions for program objective one indicated a grand mean score (M = 0.69).

Texas Tech University, J. D. Ragland, August 2013
61
Table 4.5 illustrates each question related to program objective two with a total of 14
related questions. For program objective two the top five questions resulted in average
assessment scores ranging from 96% to 85% with a grand mean score (M = 0.72).
Table 4.6 illustrates each question related to program objective three with a total of six
related questions. This data indicated the two questions with average assessment scores ranging
from 92% to 88% with a grand mean score (M = 0.78).
Table 4.7 illustrates each question related to program objective four with a total of eight
related questions. This data concluded that the top two questions had average assessment scores
ranging from 96% to 91% with a grand mean score (M= 0.76).
The third and final component for research objective three is Table 4.8 ranks all senior
assessment questions from highest to lowest percentages based upon questions answered
correctly and incorrectly. The highest-ranking top three questions were: Question 3619, The ham
is (species specific) or found only on what animal? (correct = 96.1%, incorrect = 3.9%);
Question 3675, When you are showing your animal, it is important to be a good showman.
Which of the following characteristics display good showmanship? (correct = 95.9%, incorrect
= 4.1%); Question 3564, Winning is the only way to measure success? (correct = 94.1%,
incorrect = 5.9%). The lowest ranking three questions were: Question 3745, All of this
information is required on a feed label except? (correct = 31.1%, incorrect = 68.9%); Question
3727, All of this information is required on a medication label except (correct = 32.2%,
incorrect 67.8%); Question 3680, Which of these is an internal developmental asset? (correct =
32.8%, incorrect 67.2%).
This research data concludes a clear understanding of those questions that are answered
correctly most frequent no matter what their objective category may be. For example the highest

Texas Tech University, J. D. Ragland, August 2013
62
ranked assessment question that provided the most correctly answer is Question 3619 (correct =
96.1%). The lowest ranked question provided the most often provided incorrect answer is
Question 3745, (incorrect = 68.9%). This research data concludes those assessment completers
who are received effective teaching as evident from assessment scores and also provides
indicators where improvements are needed in training and question wording.
Recommendations for Quality Counts Program Development This Quality Counts study is the first to have ever been researched. Obviously much
more research is needed to strengthen the Quality Counts educational process. The following are
suggestions for needed improvement related to Quality Counts program development.
1) At time of participant on-line login to Quality Counts, incorporate more gender
information such as male/ female, specific age, project interest, number of years
exhibited livestock, and what attempt is this for you in taking the assessment. This
information will assist in providing more in-depth research can be conducted
regarding participant gender and demographics.
2) The use of a different collection database system will help increase the effectiveness
of the Quality Counts Program for both 4-H and FFA members.
3) The original Quality Counts Program objectives need to be reviewed and researched.
Additionally a more equal number of questions relative to objectives need to be
distributed within each assessment. Currently too many questions are in one
objective. Example: Currently 82 of 110 relate to Quality Counts program objective
one which is, To insure that animals raised in 4-H and FFA livestock projects meet all
food quality and safety standards.

Texas Tech University, J. D. Ragland, August 2013
63
4) More extensive research needs to be conducted regarding the Quality Counts
Assessment Questions. Many are difficult to understand and changing of words need
to be developed.
5) Develop a table of specifications for Quality Counts program and assessment
requirements. This may include specific subject matter topics along with timeline for
completion of each.
6) Develop separate Quality Counts program, training, and assessment requirements for
youth planning to exhibit livestock at county show only.
Recommendations for Future Study The following is a list of suggested recommendations for future studies regarding the
Quality Counts program and assessment.
1) Future study needs to be conducted to compare those participants who receive
training via on-line verves those who receive training fact-to-face instruction.
2) Continued research is needed to determine how Quality Counts completers are
receiving their training. Is it effective? Or do Quality Counts program changes need
to occur?
3) Research should be conduct that supports the need for constant and continual
updating of the Quality Counts Training and Assessment. This could be conducted by
an annual review of completer’s assessment scores.
4) It is suggested that all Major Livestock Shows in Texas become involved and
conducts their own research for exhibitors who attending their show to help further
support and determine if exhibitors are actually learning from the Quality Counts
Program.
Texas Tech University, J. D. Ragland, August 2013
64
5) For future Quality Counts studies, researchers should utilize a stratified random
sample for determining sample size.

65
REFRENCES
Random. Org. (1998-2012). Retrieved June 5, 2013, from Random.Org: www.random.org.
Character Counts! Works And here are the numbers to prove it. (2007). Retrieved November 25, 2012, from Character Counts: http://charactercounts.org/pdf/CC-evidence.pdf
Quality Counts. (2011). Retrieved November 8, 2012, from Texas A&M AgriLife Extension: http://agrilifecdn.tamu.edu/qualitycounts/files/2010/11/EDIT-MAY-19-PRESS-RELEASE.pdf
General Information. (2012). Retrieved December 9, 2012, from Texas ffa: http://www.texasffa.org/page.aspx?ID=89
History. (2012). Retrieved December 9, 2012, from FFA history: http://www.absarokee.k12.mt.us/clubs/ffa/ffahistory.html
International Association of Fairs & Expositions. (2012). Retrieved November 27, 2012, from The history of fairs: http://www.fairsandexpos.com/aboutiafe/history/
Texas 4-H and Youth Development. (2012). Retrieved December 9, 2012, from History of 4-H: http://texas4-h.tamu.edu/learn/learn_history
Texas FFA Agricultural Facts. (2012). Retrieved December 9, 2012, from My Texas ffa. org: http://mytexasffa.org/sites/default/files/TexasFFA_Fact_Sheet.pdf
4-H Youth Development. (2012). Character Education. Retrieved November 9, 2012, from Character Education/ 4-H Youth Development: 4h.msue.msu.edu/4hcharter_eduction
Boleman.C. T., Cummins, S. R., Briers, G. E. (2004). Prents perception of life skills gained by youth participanting in the 4-H beef project. Journal of Extension .
Boone, J. Edgar, Safrit, Dale, R., Jones, Jo. (2002). Developiin Programs in Adult Educaiton. Long Grove, IL: Waveland Press, Inc.
Borden, R. (2005). Historic Brazos County: An Illustrated History. San Antonio: Historic Publishing Network.
Character Counts. (n.d.). Retrieved November 8, 2012, from Josephson Institute Center for Youth Ethics: http://charactercounts.org/overview/faq.html#WhatIs
Character Educaton. (n.d.). Retrieved November 9, 2012, from Michigan State Universtiy Extension : 4h.msue.msu.edu/4h/character_education
Chileck, D. K. (2012, November 14). Assistant Profesor & Extension Program Specialist, 4-H Southest Distric 9 . (J. Ragland, Interviewer)

66
Council, N. 4.-H. (2012). Hisotry . Retrieved December 9, 2012, from 4-H frequently asked questions: http://www.4-h.org/about/4-h-history/faq/
Davis, C., Keith, L., Williams, K., Fraze, S. (2001). Retrieved November 27, 2012, from Validation the precieved benefits of competitive livestock exhibition by theTexas 4-H members: A qualitiative study: http://pubs.aged.tamu.edu/jsaer/vol50whole.pdf#page=119
Extension, P. S. (n.d.). How to Determine a Sample Size . Retrieved June 5, 2013, from Pennsylvania State Coopertive Extension Program Evaulation Tip Sheet #60 : http://enxtension.psu.edu/evaluation/pdf/TS60.pdf
Extension, T. A. (2013). What Is Extension? College Station, Texas: AgriLife Communications.
Gibson, T. L. (2001). Coopertive Extension Program Planning in Wisconsin. Madison, Wisconsin: Cooppertive Extension, University of Wisconsin.
Harms, K., Fritz, S. (2001). Internalization of Character Traits by Those Who Teach Character Counts! Journal of Extension.
Helwig, C. T. (1997). Character Education After the Bandwagon has Gone. Retrieved November 9, 2012, from Charter Education After the Bandwagon has Gone: http://tigger.uic.edu/~lnucci/MoralEd/articles/helwig.html
Helwig, Charles. (1997). Retrieved November 24, 2012
History. (2012). History. Retrieved December 9, 2012, from FFA History: http://www.absarokee.k12.mt.us/clubs/ffa/ffahistory.html
History of 4-H. (n.d.). Retrieved November 8, 2012, from Texas 4-H and Youth Development : texas4-h.tamu.edu/learn/learn_history
Learn About 4-H. (n.d.). Retrieved November 8, 2012, from Texas 4-H & Youth Development: http://texas4-h.tamu.edu/learn
Mission and Motto. (n.d.). Retrieved November 8, 2012, from National FFA Organization : https://www.ffa.org/about/whoweare/Pages/MissionandMotto.aspx
Nash, S.A., Sant L.L. (2005). Life-skill development found in 4-H animal judging. Journal of Extension.
National 4-H Council . (2012). Hisotry. Retrieved December 9, 2012, from 4-H frequently asked questions: http://www.4-h.org/about/4-h-history/faq/
Nold, R., & Hanson, D. (2001). Effectiveness of Quality Assurance Training for Youth. Journal of Extension .
(n.d.). Organizational Development. College Station, Texas : Department of Agricultrureal Leadership, Educaiton & Communicaitons .

67
Rasmussen, W. D. (1989). Taking the University to the People: Seventy-Five Years of Cooperative Extension. Ames, Iowa: Iowa State University Press.
Research, O. o. (2013). Human Research Protection Program . Retrieved May 21, 2013, from Texas Tech University Office of the Vice President For Research : http://www.depts.ttu.edu/vpr/irb/index.php
Ripley, J. (2012, November 9). Assistant Professor and Extension Specialist. (J. D. Ragland, Interviewer)
Ripley, J. C. (n.d.). Creating Excellent Programs. College Station, Texas: Texas A&M AgriLife Communications.
Ripley, J., Cummings, S., Lockett, L., Pope, P.,Wright, M., Payne, M., Keith, L., Murphery, T. (n.d.). Creating Excellent Programs. College Station, Texas: Texas A&M AgriLife Communications.
Ritter, E. (n.d.). The USDA and Land-Grant University System Partnership in Support Of Coopertive Extension: A Breif Historical Overview. College Station, Texas: Texa AgriLife Extension.
Rusk, C.P., Martin, C. A., Talbert, B. A., Balschweid, M. A. (2002). Attributes of Indiana's 4-H livestock judging program. Journal of Extension .
Smith, K., Phillips, T., Boleman, C., Chilek, K., Coufal, D., Keith, L., et al. (2011). Quality Counts: Quality Assurance, Character Education. College Station, Texas: AgriLife Extesion Bookstore.
Texas 4-H and Youth Development. (2012). Texas 4-H and Youth Development. Retrieved December 9, 2012, from History of Texas 4-H: texas4-h.tamu.edu/learn/learn_history
Ward, C. K. (1996). Life skills development related to participantion in 4-H animal science projects. Journal of Extension .
Wessel, T. & Wessel, M. (1982). 4-H : An American idea 1900-1980, A history of 4-H. Chevy Chase, MD: National 4-H Council.
What is Extension? (n.d.). Retrieved November 8, 2012, from Texas A&M AgriLife Extension Service: http://agrilifeextension.tamu.edu/about/
68
APPENDIX A
QUALITY COUNTS ASSESSTMENT INSTRUMENT

69

70

71

72

73

74

75
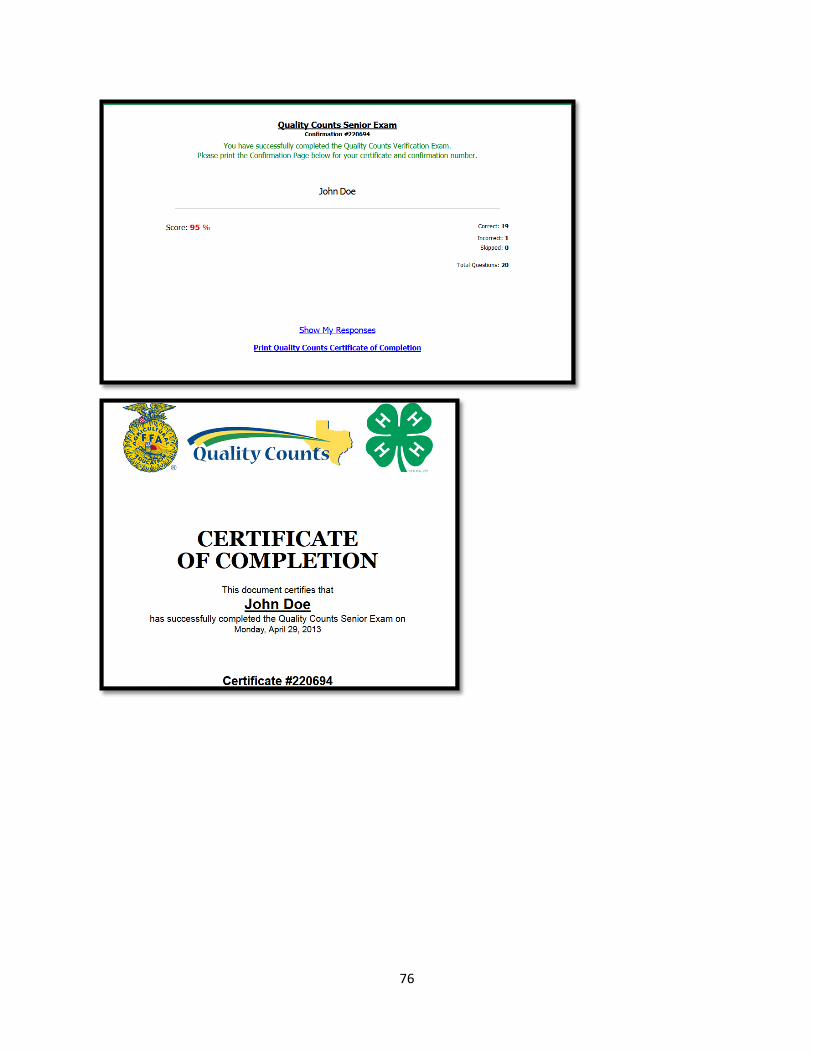
76

77
APPENDIX B
INSTITUTIONAL REVIEW BOARD APPROVAL

78
From: Peters, Donna [[email protected]] Sent: Tuesday, April 23, 2013 11:59 AM To: Fraze, Steven; JD Ragland Cc: Lucey, Esther Subject: IRB 503937 A Study of Texas Youth Livestock Exhibitors... Dr. Steve Fraze and J.D. Ragland: I am reviewing your human subjects research proposal entitled, “A Study of Texas Youth Livestock Exhibitors Knowledge Within the Constructs of the Quality Counts Assessment.” Your proposal indicates that the data you will be working with has no names or identifiers. The Texas A&M AgriLife Extension State 4-H Office has already collected the data and agreed to share de-identified data with you. You do not have any interaction or intervention with human subjects nor will you be collecting any personal or private information from the subjects. According to federal regulations (45 CFR 46.102) we can determine that your research does not need IRB review and approval. I will close your proposal file. I hope your project goes well. Donna Donna Peters, CIP Manager, Human Research Protection Program Office of the Vice President for Research Texas Tech University 357 Administration Building, Box 41075 Lubbock, TX 79409-1075 806-742-2064 Beginning April 1, the HRPP Office will designate Wednesdays as confidential work days and have closed office doors. Researchers can continue to submit IRB proposals by campus mail.
79
APPENDIX C
SENIOR ASSESSMENT QUESTIONS

80
Question # Question
1 3552 The first line in the 4-H motto is which of these? 2 3553 The first line in the FFA motto is which of these? 3 3554 Quality Counts recognizes the need for good character and safe food products,
and the relationship between the two? 4 3559 A youth showing their "care" would not do which of these? 5 3561 A fair livestock exhibitor would do which of the following? 6 3564 Winning is the only way to measure success. 7 3566 Quality Counts applies outside of 4-H or FFA in our everyday life? 8 3569 Packing plants are not required to have a Hazard Analysis & Critical Control
Points (HACCP) program in place. 9 3571 Safe food is equivalent to what?
10 3572 E. Coli Bacteria represent what type of food safety hazard? 11 3574 Liquid pesticide residue is what type of food safety hazard? 12 3575 Wood chips are what type of food safety hazard? 13 3576 Oil and grease residue is what type of food safety hazard? 14 3577 Listeria Virus is what type of food safety hazard? 15 3578 A razor blade is what type of food safety hazard? 16 3579 A piece of plastic is what type of food safety hazard? 17 3580 Any type of bacteria is what type of food safety hazard? 18 3583 The weight of the carcass after an animal has been harvested is referred to as
the what? 19 3584 What is the name of meat harvested from sheep older than one year of age
called? 20 3585 The weight of the animal at the time of harvest is called what? 21 3586 What is the product after the animal is harvested called? 22 3587 When you calculate the carcass weight divided by the live weight times 100
you are calculating what? 23 3588 Who is responsible for safe handling of the animal product once they get it
home? 24 3589 Who is responsible for cutting the carcass into primal and retail cuts for
distribution? 25 3591 Who is responsible for raising a healthy animal? 26 3592 Who is responsible for following label instructions for using animal care
products, or medications in the food supply continuum? 27 3593 What is the process of rendering the animal unconscious, draining the blood,
and removing the head intestines and stomach as well as the hide and the shank of the animal called?
28 3594 Record keeping is vital when it comes to food (livestock) production. Producers should keep careful records of what activities?
29 3596 Cattle, sheep, and goats don’t have front top teeth, just molars in the back

81
30 3600 What should be visible in the lower quarter of a steer when it is walking? 31 3603 Which of these is the best growth indicator found on market lambs and goats? 32 3616 What cattle breed is not typically used as a show steer? 33 3617 The brisket is (species specific) or found only on what animal? 34 3619 The ham is (species specific) or found only on what animal? 35 3620 The jowl is (species specific) or found only on what animal? 36 3623 When you ear notch a hog's right ear it denotes what? 37 3637 The lot number on a medicine label Identifies what? 38 3640 The part of the label that says "caution, or warning" tells you what? 39 3642 The active ingredient on a medicine label identifies what? 40 3644 On a feed tag, this alerts you to any special concerns that may create
problems. 41 3645 On a feed tag, this identifies the species and class of animal for which the feed
is intended to be used. 42 3646 On a feed tag, this is where you'll find the minimum and/or the maximum
levels of essential nutrients. 43 3648 If you are medicating a steer and the label reads that you are to use 2
cc/100lbs. And the steer weighs 900lbs. How much medicine should you use? 44 3649 Your animal is diagnosed with foot rot and you treat it with over the counter
medication approved for foot rot, which type of medicine use is being described?
45 3650 You decide to use a drug for pneumonia to treat your animal's ring worm without consulting a veterinarian, which type of medicine use is being described?
46 3651 The label says "administer only to lactating females" and your veterinarian says to give it to your three week old calf, which type of medicine use is being described?
47 3652 The label says to treat for five days. Your first treatment is Monday and you give the last shot on Friday, which type of medicine use is being described?
48 3653 You use a drug approved for chickens on your sheep without prescription from a veterinarian, which type of medicine use is being described?
49 3654 The label says to give 10cc and your vet says to give 20cc, which type of medicine use is being described?
50 3659 In the 6 C's of Success, the act or instance of selecting is referred to as? 51 3660 In the 6 C's of Success, the combination or qualities or features that
distinguishes one person, group or thing from another is? 52 3661 In the 6 C's of Success, something, such as money that is given or received as
payment is termed? 53 3662 In the 6 C's of Success, a schedule of events is called? 54 3663 In the 6 C's of Success, trust or faith in a person or thing is? 55 3664 In the 6 C's of Success, agreement or logical coherence among things is? 56 3665 How many levels of biosecurity are there?

82
57 3675 When you are showing your animal, it is important to be a good showman. Which of the following characteristics display good showmanship?
58 3680 Which of these is an internal developmental asset? 59 3681 Which of these is an internal developmental asset? 60 3700 What is not a skill that you should gain from exhibiting livestock? 61 3701 What is the average dressing percent for swine? 62 3702 Lamb's and goat's dressing percent is very close, at 53% and 55% respectively. 63 3704 You can legally change the instructions for using feed or feed additives if a vet
tells you to. 64 3705 Each of these could be considered parts of a Hazard Analysis & Critical Control
Points (HACCP) plan except 65 3706 Each of these could be considered parts of a Hazard Analysis & Critical Control
Points (HACCP) plan except 66 3707 Each of these could be considered parts of a Hazard Analysis & Critical Control
Points (HACCP) plan except 67 3708 Each of these could be considered parts of a Hazard Analysis & Critical Control
Points (HACCP) plan except 68 3709 Each of these could be considered parts of a Hazard Analysis & Critical Control
Points (HACCP) plan except 69 3710 Each of these could be considered parts of a Hazard Analysis & Critical Control
Points (HACCP) plan except 70 3711 All of this information is required on a medication label except 71 3712 All of this information is required on a medication label except 72 3713 All of this information is required on a medication label except 73 3714 All of this information is required on a medication label except 74 3715 All of this information is required on a medication label except 75 3716 All of this information is required on a medication label except 76 3717 All of this information is required on a medication label except 77 3718 All of this information is required on a medication label except 78 3719 All of this information is required on a medication label except 79 3720 All of this information is required on a medication label except 80 3721 All of this information is required on a medication label except 81 3722 All of this information is required on a medication label except 82 3723 All of this information is required on a medication label except 83 3724 All of this information is required on a medication label except 84 3725 All of this information is required on a medication label except 85 3726 All of this information is required on a medication label except 86 3727 All of this information is required on a medication label except 87 3728 All of this information is required on a medication label except 88 3729 All of this information is required on a medication label except 89 3730 All of this information is required on a medication label except 90 3732 From these choices what is the best route for injection medication

83
91 3733 From these choices what is the best route for injection medication 92 3734 From these choices what is the best route for injection medication 93 3735 All of this information is required on a feed label except 94 3736 All of this information is required on a feed label except 95 3737 All of this information is required on a feed label except 96 3738 All of this information is required on a feed label except 97 3739 All of this information is required on a feed label except 98 3740 All of this information is required on a feed label except 99 3741 All of this information is required on a feed label except
100 3742 All of this information is required on a feed label except 101 3743 All of this information is required on a feed label except 102 3744 All of this information is required on a feed label except 103 3745 All of this information is required on a feed label except 104 3746 All of this information is required on a feed label except 105 3747 All of this information is required on a feed label except 106 3748 All of this information is required on a feed label except 107 3749 All of this information is required on a feed label except 108 3750 All of this information is required on a feed label except 109 3751 All of this information is required on a feed label except 110 3752 All of this information is required on a feed label except

84