the public sector's experience and response to private
TRANSCRIPT

University of Pennsylvania University of Pennsylvania
ScholarlyCommons ScholarlyCommons
Publicly Accessible Penn Dissertations
2014
The Public Sector's Experience and Response to Private The Public Sector's Experience and Response to Private
Competition: The Case of Nepal Competition: The Case of Nepal
Priyadarshani Joshi University of Pennsylvania, [email protected]
Follow this and additional works at: https://repository.upenn.edu/edissertations
Part of the Education Policy Commons, and the Public Policy Commons
Recommended Citation Recommended Citation Joshi, Priyadarshani, "The Public Sector's Experience and Response to Private Competition: The Case of Nepal" (2014). Publicly Accessible Penn Dissertations. 879. https://repository.upenn.edu/edissertations/879
This paper is posted at ScholarlyCommons. https://repository.upenn.edu/edissertations/879 For more information, please contact [email protected].

The Public Sector's Experience and Response to Private Competition: The Case The Public Sector's Experience and Response to Private Competition: The Case of Nepal of Nepal
Abstract Abstract Private schools have become a mainstay in developing countries. The private market share in primary education in low-income countries has nearly doubled from 12% in 1990 to 22% in 2010 (World Bank, 2013). There is a long-running debate amongst academics and the policy community about how increased choice, through charter, voucher, or private schools, will affect the education system. School choice advocates expect higher parental satisfaction through choice and improvements in public schooling through competition. Skeptics are concerned about the loss of shared citizenship and the potential for further stratification as the government reduces its provider role in education. Despite the fact that both advocates and skeptics have focused many of their arguments on the potential impact of choice on the public school system, these consequences remain largely uninvestigated in developing countries. In the dissertation, I provide the first comprehensive analysis of how competition from private schools affects public schools in a developing South Asian country: Nepal. I utilize a mixed methods approach to analyze a unique competition- focused dataset compiled from extensive primary and secondary data collection. I find no evidence to suggest that public schools in Nepal have improved as result of private competition. However, there is a recent surge of quasi-private policies being implemented by public schools. I show that the key obstacles to improvement include not only well-known factors such as bureaucratic rigidities and financial constraints, but also lesser-recognized impediments such as direct political interference in the education sector and stigmatization of public schooling. In conclusion, the historical analysis of the Nepal context suggests that private competition is unlikely to automatically induce public school improvements in developing countries. However, the emergence of quasi-private policies in public schools suggests that competitive pressures coupled with accountability incentives can affect public school behavior. Thus, choice systems need to include well-timed accountability mechanisms and targeted financial and leadership supports to have an enduring productive impact on public schools.
Degree Type Degree Type Dissertation
Degree Name Degree Name Doctor of Philosophy (PhD)
Graduate Group Graduate Group Education
First Advisor First Advisor Emily Hannum
Keywords Keywords competition, private schools, public sector reform, school choice, South Asia
Subject Categories Subject Categories Education Policy | Public Policy
This dissertation is available at ScholarlyCommons: https://repository.upenn.edu/edissertations/879

THE PUBLIC SECTOR’S EXPERIENCE AND RESPONSE TO PRIVATE COMPETITION:
THE CASE OF NEPAL
Priyadarshani Joshi
A DISSERTATION
in
Education
Presented to the Faculties of the University of Pennsylvania
In Partial Fulfillment of the Requirements for the
Degree of Doctor of Philosophy
2013
Supervisor of Dissertation ________________________________ Emily Hannum, Associate Professor of Sociology Graduate Group Chairperson ________________________________ Stanton Wortham, Professor of Education
Dissertation Committee
Professor Richard Ingersoll, Board of Overseers Professor of Education and Sociology
Professor Jere Behrman, William R. Kenan, Jr. Professor of Economics
Professor Amita Chudgar, Associate Professor of Educational Administration, Michigan State University
THE PUBLIC SECTOR’S EXPERIENCE AND RESPONSE TO PRIVATE COMPETITION:
THE CASE OF NEPAL
COPYRIGHT 2013 Priyadarshani Joshi

iii
DEDICATION
To my mother, Aparna and my father, Janardan

iv
ACKNOWLEDGEMENTS
This dissertation has been a passion project, and an attempt to understand an issue that
will hopefully contribute to reforming the education system of my country, Nepal, and other
developing countries. There are many people and institutions to thank for the successful
completion of this research. Firstly, I would like to thank Professor Emily Hannum, my
dissertation advisor and committee chair, for providing constant encouragement and for believing
in the promise of the project.
In the exploratory phase of the research, I would like to thank Professors Edward Boe,
Margaret Goertz and John Puckett for their comments on my analysis of the United States and
Chile’s choice programs in the second year of my PhD program. I would like to thank Professor
Dan Wagner for encouraging me to conduct my own data collection and to do it in the case of
Nepal. I would like to thank Professors David Figlio, Sigal Ben-Porath and Mr. Elliot Weinbaum
for their suggestions on my research design. I would like to thank Tara Beteille, Amrit Thapa,
Varun Gauri, and Gregory Elacqua since their research was instrumental in shaping my analyses.
The following summer (2010), I was able to interact with many deputy directors at the Nepal
Department of Education (DoE), including Mr. Bishnu Bahadur G.C., who kindly provided me
with the approval to conduct primary field research. I have to thank the many DoE officials and
the several principals, school management committee members and teachers that I met in field
visits for helping me narrow my research focus to the topic of the public sector’s experience and
response to private competition.
I would like to thank the World Bank Nepal country office for financing the competition
focused survey data collection of the research project. The funding support from the Amherst
College Funding for Further Graduate Study and the Dean’s Fellowship further enabled me to
cover the costs of my data collection and field visits.
v
For research implementation, I would also like to thank Ms. Juna Mathema, Lilaji, and
the Blitz Media survey team’s enumerators (Ajita Lama, Anu Upreti, Bikash Thapa, Binod Pr.
Chapagain, Dipak Chudali, Gopal Khatiwada, Govinda Pr. Chapagain, Krishna Pr. Ligal, Nisha
Subedi, Rameshwor Uprety, Sankar Dash, Santosh Karki, Sapana Goutam, Sarita Dhakal,
Shivaraj Poudyal, Sumitra Rai) for enthusiastically and professionally completing the principal
survey data collection in Kathmandu and Chitwan. I would also like to thank my qualitative field
research team (Ashish Thapa Chhetri, Asim Gautam, Navin Ghimire, Sunada Khadka, Arju
Pradhan, Alisha Shrestha, Sneha Singh, Angela Upreti, Biswash Yub) who conducted the parent
surveys with utmost enthusiasm. As I conducted most of the qualitative field research on my own,
I have to thank the hundreds of national government officials, education experts, district officials,
local officials, school principals and parents from Kathmandu, Chitwan, Jhapa,
Kavrepalanchowk, Mustang, Sarlahi and Dadeldhura districts, who shared their experiences, their
concerns, and their perspectives on the emergence of a dual public and private system with me.
My foremost supporter in my research endeavors was my father, Janardan Joshi, who
accompanied me, and encouraged and supported my work. I will be indebted to him on a number
of levels for this dissertation.
In the analysis phase, I would like to thank my committee members (Professors Richard
Ingersoll, Jere Behrman, and Amita Chudgar) for taking a keen interest and providing helpful
suggestions. I would also like to thank journal reviewers and commentators from the various
venues that I have presented this research, including conferences, government meetings, and
university talks, as their comments have helped me refine the research. I would also like to thank
Mr. Venkatesh Sundararaman, Saurav Bhatta, Maheshwor Sharma, Uttam Sharma, Amrit Thapa
and Tara Beteille for providing valuable comments. I am grateful to Ashutosh Tamrakar for
helping me with the aesthetic presentation of my research.
vi
On the personal front, I am grateful to all of my friends and my family, particularly my
sisters Malshree and Roopshree, for their help in the research process. I would like to thank Seher
Ahmed, for having been a constant support and a research partner, and for generously offering
her home to me for the better part of a year. I am also eternally thankful to my optimistic and
incredibly productive friend, Sebastian Cherng, for encouraging me on the path to better research.
Above all, I want to thank my husband, Amir Tamrakar, who has been my rock
throughout the dissertation process, and in my life.

vii
ABSTRACT
THE PUBLIC SECTOR’S EXPERIENCE AND RESPONSE TO PRIVATE COMPETITION:
THE CASE OF NEPAL
Priyadarshani Joshi
Emily Hannum
Private schools have become a mainstay in developing countries. The private market
share in primary education in low-income countries has nearly doubled from 12% in 1990 to 22%
in 2010 (World Bank, 2013)1. There is a long-running debate amongst academics and the policy
community about how increased choice, through charter, voucher, or private schools, will affect
the education system. School choice advocates expect higher parental satisfaction through choice
and improvements in public schooling through competition. Skeptics are concerned about the loss
of shared citizenship and the potential for further stratification as the government reduces its
provider role in education. Despite the fact that both advocates and skeptics have focused many
of their arguments on the potential impact of choice on the public school system, these
consequences remain largely uninvestigated in developing countries. In the dissertation, I provide
the first comprehensive analysis of how competition from private schools affects public schools
in a developing South Asian country: Nepal. I utilize a mixed methods approach to analyze a
unique competition- focused dataset compiled from extensive primary and secondary data
collection. I find no evidence to suggest that public schools in Nepal have improved as result of
private competition. However, there is a recent surge of quasi-private policies being implemented
by public schools. I show that the key obstacles to improvement include not only well-known
factors such as bureaucratic rigidities and financial constraints, but also lesser-recognized
1 The World Bank low-income group definition included 36 countries in 2013.

viii
impediments such as direct political interference in the education sector and stigmatization of
public schooling. In conclusion, the historical analysis of the Nepal context suggests that private
competition is unlikely to automatically induce public school improvements in developing
countries. However, the emergence of quasi-private policies in public schools suggests that
competitive pressures coupled with accountability incentives can affect public school behavior.
Thus, choice systems need to include well-timed accountability mechanisms and targeted
financial and leadership supports to have an enduring productive impact on public schools.

ix
TABLE OF CONTENTS
ACKNOWLEDGEMENTS IV ABSTRACT VII LIST OF TABLES XII LIST OF FIGURES XIV CHAPTER 1. INTRODUCTION 1 Dissertation Outline 3 Contributions 7 Insights for Policymaking 9
CHAPTER 2. LITERATURE REVIEW 11 Trends in School Choice 11 The Choice Debate 12 Do Private Schools Improve Public School Outcomes? Competitive Effects
Literature 15
Investigating Intermediate Outcomes in Choice: School Responses 20 Summary and Gaps in the Literature 26 CHAPTER 3. CONCEPTUAL FRAMEWORK AND RESEARCH QUESTIONS
32
The Experiences of Competition 32 The Responses to Competition 32 The Factors that Mediate the Response to Competition 33 The Linkages between Outcomes, Competition and Responses 33 Research Questions 34 CHAPTER 4. DATA AND METHODS 38 National Context 38 Needs addressed by the Primary and School-level Secondary Data Collection 44 Research Sites 46 Datasets from Primary Data Collection 48 Datasets from Secondary Data Collection 53 Methods 56 CHAPTER 5. THE EXPERIENCES OF COMPETITION 67 Abstract 67 Introduction 68 Conceptual Framework and Research Questions 69 Data and Methods 70

x
Results 74 Discussion and Conclusions 96 CHAPTER 6. THE PUBLIC SCHOOL RESPONSE TO COMPETITIO N 120 Abstract 120 Introduction 121 Conceptual Framework and Research Questions 121 Data and Methods 124 Results 132 Discussion 149 CHAPTER 7. THE FACTORS THAT MEDIATE HOW PUBLIC SCHO OLS RESPOND TO PRIVATE COMPETITION
166
Abstract 166 Introduction 167 Conceptual Framework and Research Questions 167 Data and Methods 168 Results 172 Discussion 205 CHAPTER 8. DOES PRIVATE COMPETITION IMPROVE PUBLIC SCHOOL QUALITY OR INCREASE THE STRATIFICATON OF THE EDUCATION SECTOR?
217
Abstract 217 Introduction 218 Conceptual Framework and Research Questions 219 Data and Methods 220 Instrumental Variable Validity Check 229 Results 230 Discussion 236 CHAPTER 9. CONCLUSIONS 250 Integrating the Research Findings 251 Limitations 256 Policy Implications 260 Implications for the Choice Debate 265 Future Research 268 APPENDICES 270 List of Appendix Tables 270 Appendix 2.1 Empirical research on differences in outcomes by types of 274
xi
schools Appendix 5.1 The characteristics of public schools that were identified as
competition or as the best schools in the district 279
Appendix 5.2 Some key regulations governing private schooling: requirements and provisions for private school establishment and functioning
282
Appendix 6.1 Causal inference limitations of the study 286 Appendix 6.2 Analysis of the other school policies 287 Appendix 6.3 The competitive response mechanism: follow the lead of the
best public schools? 291
Appendix A7.1 The perceptions of principals of selective schools, by extent of private competition
294
Appendix 8.1 Descriptive graphs of dependent variables, competition measures, and explanatory continuous variables
296
Appendix 8.2 Potential mechanisms via which policies could affect outcomes 302 Appendix 8.3 Instrument variable validity check - first stage equation results 304 Appendix 8.4 Detailed estimation tables of models of school-level outcome
measures, competition measures, and other variables 309
Appendix 8.5 Detailed estimation tables of models of school-level outcome measures, policy responses, and other variables
328
Appendix 8.6 Detailed estimation tables of models of relative locality-level outcome measures on competition measures and other variables
347
REFERENCES 366
xii
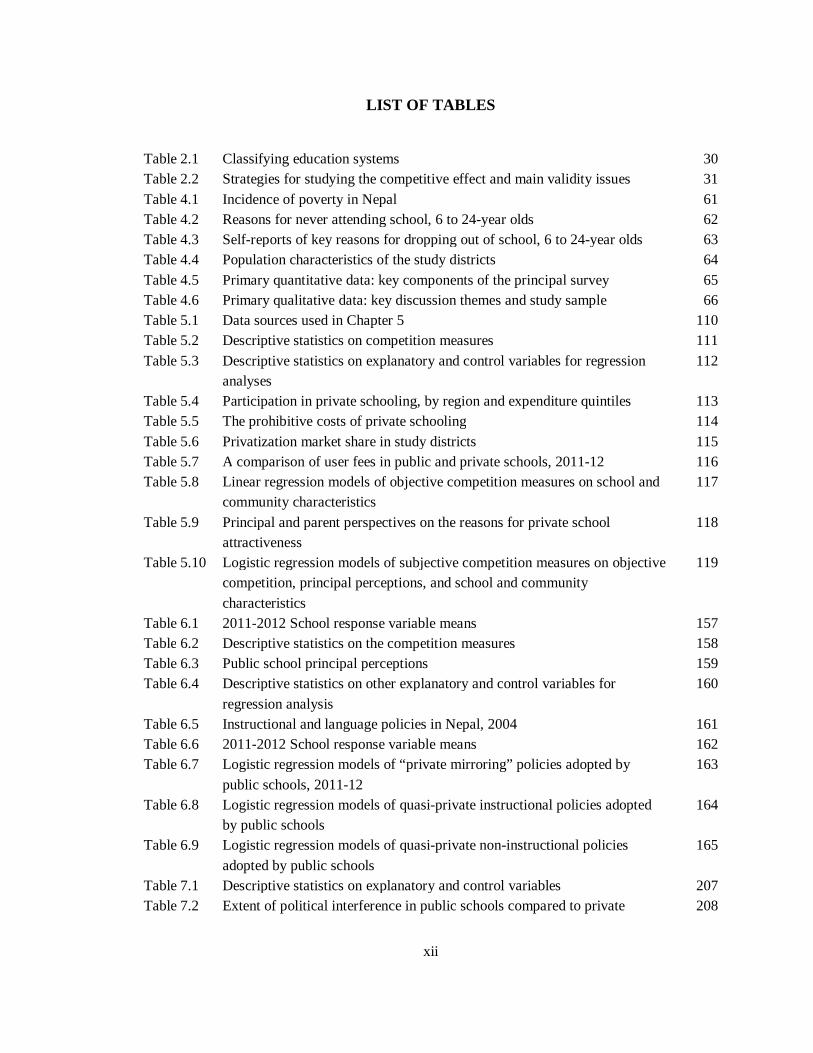
LIST OF TABLES
Table 2.1 Classifying education systems 30 Table 2.2 Strategies for studying the competitive effect and main validity issues 31 Table 4.1 Incidence of poverty in Nepal 61 Table 4.2 Reasons for never attending school, 6 to 24-year olds 62 Table 4.3 Self-reports of key reasons for dropping out of school, 6 to 24-year olds 63 Table 4.4 Population characteristics of the study districts 64 Table 4.5 Primary quantitative data: key components of the principal survey 65 Table 4.6 Primary qualitative data: key discussion themes and study sample 66 Table 5.1 Data sources used in Chapter 5 110 Table 5.2 Descriptive statistics on competition measures 111 Table 5.3 Descriptive statistics on explanatory and control variables for regression
analyses 112
Table 5.4 Participation in private schooling, by region and expenditure quintiles 113 Table 5.5 The prohibitive costs of private schooling 114 Table 5.6 Privatization market share in study districts 115 Table 5.7 A comparison of user fees in public and private schools, 2011-12 116 Table 5.8 Linear regression models of objective competition measures on school and
community characteristics 117
Table 5.9 Principal and parent perspectives on the reasons for private school attractiveness
118
Table 5.10 Logistic regression models of subjective competition measures on objective competition, principal perceptions, and school and community characteristics
119
Table 6.1 2011-2012 School response variable means 157 Table 6.2 Descriptive statistics on the competition measures 158 Table 6.3 Public school principal perceptions 159 Table 6.4 Descriptive statistics on other explanatory and control variables for
regression analysis 160
Table 6.5 Instructional and language policies in Nepal, 2004 161 Table 6.6 2011-2012 School response variable means 162 Table 6.7 Logistic regression models of “private mirroring” policies adopted by
public schools, 2011-12 163
Table 6.8 Logistic regression models of quasi-private instructional policies adopted by public schools
164
Table 6.9 Logistic regression models of quasi-private non-instructional policies adopted by public schools
165
Table 7.1 Descriptive statistics on explanatory and control variables 207 Table 7.2 Extent of political interference in public schools compared to private 208

xiii
schools Table 7.3 Extent of decision-making control of different stakeholders 209 Table 7.4 Demographic and social status differences between public and private
schools 210
Table 7.5 Parental involvement and awareness and teacher quality at the school 211 Table 7.6 Expectations and motivations to compete 212 Table 7.7 Odds ratios: Logistic estimation results of decision-making barriers and
supports to reform 213
Table 7.8 Odds ratios: Logistic estimation results of parental background and involvement related barriers and supports to reform
214
Table 7.9 Odds ratios: Logistic estimation results of teacher quality and effort related supports and barriers to reform
215
Table 7.10 Odds ratios: Logistic estimation results of the main reasons public schools lack motivation to reform
216
Table 8.1 Descriptive statistics of the dependent variables 241 Table 8.2 Descriptive statistics of the competition measures 242 Table 8.3 Descriptive statistics of the explanatory and control variables, 243 Table 8.4 Correlation matrix: competition measures, outcome measures and the
instrumental variable, 2010-11 244
Table 8.5 First-stage equation results (IV check) – OLS and random effects estimates 245 Table 8.6 Estimated coefficients from OLS, random effects and fixed effects
regressions of school-level outcomes (test scores, enrollment) on measures of competition
246
Table 8.7 Estimated coefficients from regressions of mathematics test scores on measures of competition, policies intended to improve test scores, and other variables
247
Table 8.8 Estimated coefficients from regressions of enrollment in grade 1 on measures of competition, policies intended to improve enrollment, and other variables
248
Table 8.9 Estimated coefficients from OLS, random effects and fixed effects regressions of relative locality-level outcomes (test scores, enrollment) on measures of competition
249

xiv
LIST OF FIGURES
Figure 3.1 Framework: The impact of private sector competition on public schools 37 Figure 4.1 Data sources 58 Figure 4.2 Districts of study 59 Figure 4.3 District-level schooling characteristics, 2011-12 60 Figure 5.1 National private share of total enrollment, 2003-04 to 2011-12 100 Figure 5.2 Historical expansion of private and public Schooling in selected districts 101 Figure 5.3 Private share of enrollment in selected districts, 2006-07 and 2011-12 102 Figure 5.4 Private school annual user fees in grade 1 in selected districts, by decade
of establishment
103
Figure 5.5 National school-level student pass rates in school-leaving certificate (SLC) examinations
104
Figure 5.6 National demographic differences between public and private schools (By school type)
105
Figure 5.7 National demographic differences in private school adoption within rural and urban regions (By gender and dalit categories)
106
Figure 5.8 Population trends in the nation and within selected districts, 2001 to 2011 107 Figure 5.9 Evolution in average grade 1 enrollment in public schools nationally and
in selected districts 108
Figure 5.10 Comparison of the differences in high-stakes pass rates between public schools, and schools identified as competing or best schools
109
Figure 6.1 Historical trends in policy adoption: Private-mirroring strategies (Number of schools, by year the school started adopting the policy)
154
Figure 6.2 Historical trends in policy adoption: quasi-private instructional strategies (Number of schools, by year the school started adopting the policy)
155
Figure 6.3 Historical trends in policy adoption: quasi-private non-instructional strategies (Number of schools, by year the school started adopting the policy)
156
Figure 8.1 Relative outcome measures and private market share 240
1
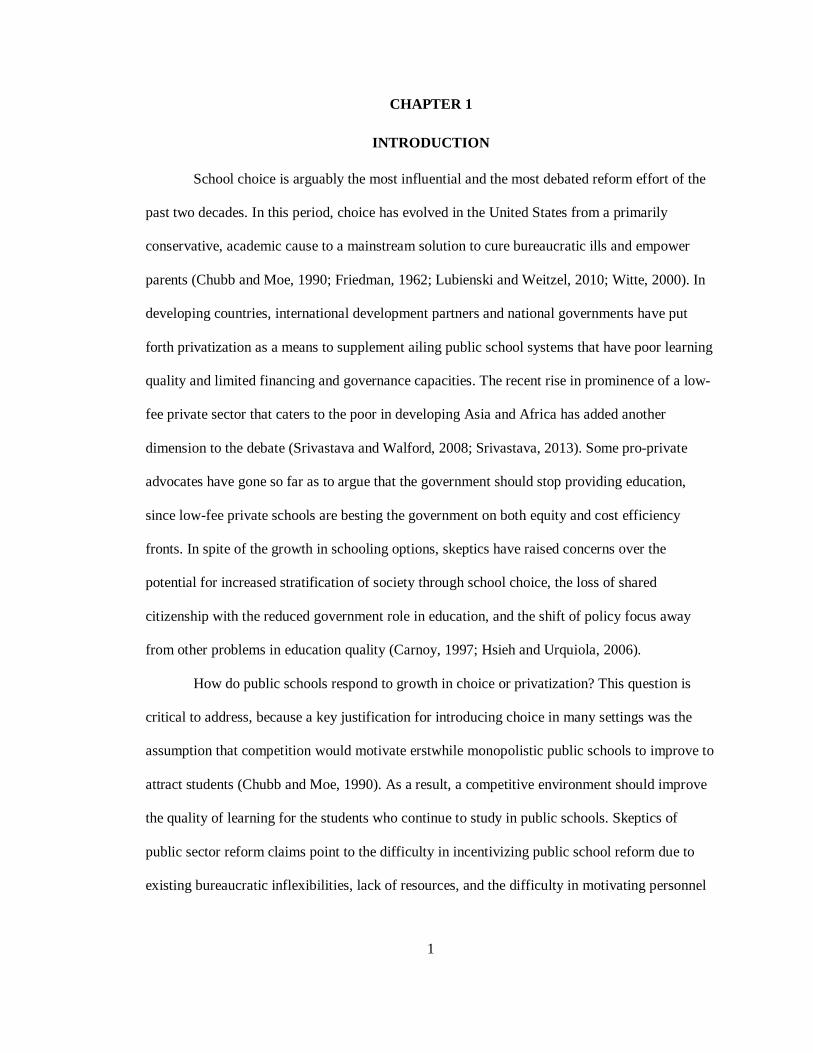
CHAPTER 1
INTRODUCTION
School choice is arguably the most influential and the most debated reform effort of the
past two decades. In this period, choice has evolved in the United States from a primarily
conservative, academic cause to a mainstream solution to cure bureaucratic ills and empower
parents (Chubb and Moe, 1990; Friedman, 1962; Lubienski and Weitzel, 2010; Witte, 2000). In
developing countries, international development partners and national governments have put
forth privatization as a means to supplement ailing public school systems that have poor learning
quality and limited financing and governance capacities. The recent rise in prominence of a low-
fee private sector that caters to the poor in developing Asia and Africa has added another
dimension to the debate (Srivastava and Walford, 2008; Srivastava, 2013). Some pro-private
advocates have gone so far as to argue that the government should stop providing education,
since low-fee private schools are besting the government on both equity and cost efficiency
fronts. In spite of the growth in schooling options, skeptics have raised concerns over the
potential for increased stratification of society through school choice, the loss of shared
citizenship with the reduced government role in education, and the shift of policy focus away
from other problems in education quality (Carnoy, 1997; Hsieh and Urquiola, 2006).
How do public schools respond to growth in choice or privatization? This question is
critical to address, because a key justification for introducing choice in many settings was the
assumption that competition would motivate erstwhile monopolistic public schools to improve to
attract students (Chubb and Moe, 1990). As a result, a competitive environment should improve
the quality of learning for the students who continue to study in public schools. Skeptics of
public sector reform claims point to the difficulty in incentivizing public school reform due to
existing bureaucratic inflexibilities, lack of resources, and the difficulty in motivating personnel

2
(Ni and Arsen, 2010). In spite of the centrality of the public sector improvement hypothesis in
the choice argument, the investigation of whether public schools improve or not seems to have
gotten lost in the shuffle. In the United States, the research on competitive effects is primarily
limited to contrasting the outcomes of public schools that face different levels of competition
(Betts, 2009; Ni and Arsen, 2010). Recent research syntheses have called for more in-depth
investigations into local education markets to understand how competition is experienced and
what policies or accountability pressures appear to make a difference in improving public
schools (Lubienski and Weitzel, 2010). This strand of choice research is virtually nonexistent in
the developing country literature, despite the rapid growth in the private sector.
This study is the first investigation to perform a comprehensive analysis of the
implications of school choice for the public school system in a low-income country: Nepal. I
frame the impact of competition as a series of interlinked processes that require public schools to
first experience competition, then respond with competition-induced changes, which may
eventually lead to improvements in school outcomes. Through the analysis, I provide insights
into the diversity of historical and current experiences of competition, and the possibilities and
constraints that public school leaders face while responding to competition. To undertake these
analyses, I conducted competition-focused principal surveys in selected high privatization
districts, and combined the primary data with the national and district records on education
indicators, user fees, and school outcomes. I perform quantitative analysis of the linkages
between competition and school responses and outcomes utilizing multivariate analysis (OLS,
logistic, fixed and random effects, IV estimation). I complement these analyses with in-depth
qualitative investigations of the experience of competition and the barriers to competition
utilizing interview data collected from national, district and local level education officials, school
principals and parents.
My research addresses four research questions:
3
1. How do public schools experience private competition?
2. What are public schools doing in order to respond to competition?
3. What are the factors that mediate how public schools respond to competition?
4. How are public school actions and their experience of competition linked with their
outcomes?
Dissertation Outline
The dissertation is organized as follows. In Chapter 2, I review the literature on the
impact of competition on the public sector by discussing the theoretical expectations and
empirical findings on public school responses, the factors that mediate public school responses,
and the outcome effects on public schools that face high competition. In Chapter 3, I present my
conceptual framework and research questions. In Chapter 4, I discuss the national context, and
the data and methodology followed for the analysis. I present the main findings of the
dissertation in Chapters 5 through 8, and highlight the key findings from the research questions
below. Chapter 9 concludes with a summary of the findings, policy implications, and an outline
of areas for further research. The policy discussion highlights the need for better targeting of
currently available finances and mobilizing more domestic resources, and describes the
circumstances required for public schools to productively compete despite unfavorable political
climates.
Research Question 1: How do Public Schools Experience Private Competition?
To answer this question, I analyze both the historical and current experiences with
privatization, and the principals’ subjective opinions on competition. In the early phase of
privatization (1980s), public schools and private schools alike were witnessing growing
enrollments due to high fertility rates, growing populations, and mass education expansion. The
main impact of competition on public schools in the early phase was the flight of higher SES
students and influx of lower SES students. In recent years, public schools in urban areas have

4
begun facing enrollment decline as a larger proportion of lower SES students have begun
switching to the growing private sector. In recent years, competitive pressures on public schools
grown as new accountability mechanisms now link public school financing to public school
enrollment. Public schools that cannot maintain enrollment may be compelled to close down or
merge with other schools in the future. Despite the growing presence of private schools, not all
public schools mention private schools as competition when asked to list competing schools.
Even in such a competitive climate, some public schools may not consider private schools as
competition because they may believe that they exist in parallel systems, governed by different
motivations and regulations, or that private schools do not really provide better quality.
Research Question 2: What are Public Schools doing in order to Respond to Competition?
My work suggests that public schools are primarily responding to growing competition
by mirroring policies that make private schools more attractive to parents. These strategies
include transitioning from Nepali to English medium of instruction, providing extra tuition
classes for the high-stakes examination results, and improving uniforms by requiring ties and
belts. Importantly, schools that had principals who mentioned private schools as competition
were significantly more likely to have attempted quasi-private policy changes than schools with
principals who did not mention private schools as competition. Despite the lack of public school
improvements in the past, there may be room for more optimistic prognostications as
competition seems to be inducing productive changes by motivating principals in some schools.
Research Question 3: What are the Factors that Mediate how Public Schools Respond to
Competition?
Public school officials face a variety of sociopolitical, bureaucratic and financial
conditions that reduce their motivation and impede their efforts to compete. The most substantial
constraints reported in interviews with school principals and education officials were the direct
external political interference in school functioning that limits their decision-making control, the
5
lack of proper incentive mechanisms to motivate teacher effort, and the pervasive stigmatization
of public schools.
For instance, principals mentioned that the teaching force in public schools also worked
as party affiliates of the main political parties. As a result, despite the fact that principals have
the bureaucratic authority to sanction teachers, principals are unable to hold teachers accountable
for their schooling performance. Some principals mentioned that if they tried to hold teachers
accountable for their negligence or absenteeism, then teachers would utilize their political
connections to threaten the principal with school transfer or physical harm. Additionally, the
national-level policy decision to decentralize authority to school management committees from
district level education offices seems to have had the unintended consequence of increasing
political interference in public schooling. According to many principals and education officials
that I interviewed, many party members have joined the management committees to use it as
another opportunity for political interference – for instance, by providing teaching jobs to
members of their political party.
Many national education officials conceded that the national level education agencies
had been unable to strictly implement accountability criteria to assess, reward or reprimand
schools and teachers for their performance. Many of the high performing public school principals
talked about how they had devised creative methods within their schools to motivate teachers
since the government monitoring and financing structures did not differentiate between well-
functioning or poorly performing public schools.
A substantively related problem was that due to the climate of pervasive political and
bureaucratic incompetence, citizens appear to distrust all types of public provision of services,
including education. There was near unanimous agreement among public school officials that
there was significant sorting of students into private schools by income and ability, which
significantly disadvantaged public schools. Over time, the sorting of students, and other public
6
sector inefficiencies had led to stigmatization of public schooling, particularly in urban areas.
Some public school teachers professed how choosing a public school for your child would be
considered embarrassing by society and peer groups. Consequently, parents try and enroll their
children in the relatively politics-free and more socially acceptable private schools instead of
public schools if it is financially feasible.
However, there are noteworthy variations in the extent of political interference and
community support faced by public schools. Firstly, some of the public school principals are able
to demonstrate effective leadership and incentivize teacher teams to be accountable for student
learning, and deflect most of the political pressures. Secondly, community support for public
schooling is higher in rural schools and regions where there has not been as significant a growth
in private market share, due to the lack of sorting in these regions. The school principals that
have been able to demonstrably improve the school through better student results or higher test
scores have also experienced growth in community support over time.
Research Question 4: How are Public School Actions and their Experience of Competition
Linked with their Outcomes?
Public school examination outcomes do not seem to have significantly benefited or
worsened because of private competition, but there are signs that indicate growing inequalities
between the public and private sectors. Specifically, my analysis shows that there does not seem
to be a significant positive or negative association between public school test scores (high-stakes
school-leaving examination) outcomes and the extent of private competition in recent years.
However, there is evidence to suggest that the gap between public and private school test scores
is higher in localities with high privatization. This finding may be a result of higher competition
between the larger number of private schools in the most urbanized and populous regions of the
country. Another noteworthy finding is that the public schools that have better outcomes are also
more likely to use selection criteria during admission. This finding highlights the variation in
7
public schools and may suggest that sorting does exist within the public school system as well.
Finally, it may be too early to tell if the school policies instituted in the last two or three years
have induced significant changes in school outcomes. Nevertheless, the most recent data show
that enrollment in lower grades in public schools continue to decline, indicating that parental
perceptions that favor private schooling have still not changed noticeably.
Contributions
To the best of my knowledge, there has not been a systematic investigation of the public
sector consequences of competition in developing countries. I add globally relevant theoretical
and empirical insights to advance our understanding of competitive effects by analyzing the
consequences of competition in terms of its evolving, local and subjective nature. My
contributions focus on how researchers should conceptualize the experience and response to
competition, while recognizing the barriers public schools in developing countries may face
while responding to competition.
My analysis suggests that researchers need to analyze the variations in financial
supports, community supports, personnel motivation, and policy changes to fully elucidate how
the public sector experiences and then responds to private competition. While economists and
sociologists have long recognized that sorting of students by income and ability is a likely
consequence of unregulated choice programs, researchers have not fully recognized how long-
run sorting can encumber the public schools’ ability to compete with private schools. In
particular, researchers should not conceive of the public sector as a uniform entity while
assessing the sector’s capacities to compete with private schools. They should recognize that the
local experience of competition will vary significantly by the school’s urban or rural location,
availability of additional income sources, community supports, and the extent of private
competition. Researchers should also account for the fact that school leadership’s motivation to
respond to competition will depend on the individuals’ decision-making control and capacities
8
along with the incentives and barriers that they face. Consequently, competition should also be
analyzed as a subjective experience, since principals’ perceptions of private competition seem to
drive their behavior to change policies, along with the actual number of private schools in close
proximity to their public schools. In addition, more researchers need to investigate the policy
actions that public schools engage in to respond to competition since these behaviors provide the
most transparent indication of school efforts. These school responses should be conceptualized
as intermediate outcomes that can give a sense of whether policy or systemic changes are
creating distortionary incentives or aiding achievement.
I find that public schools face bureaucratic inefficiencies, poor accountability
mechanisms, difficulty in incentivizing personnel, and financial limitations that limit their ability
to function effectively or implement competitive responses. These factors are consistently
highlighted in the school choice and effectiveness literature in the United States. My work also
highlights the additional constraints that researchers need to be aware of while analyzing
obstacles to public school improvements in developing countries. Firstly, researchers should
recognize that a significant additional impediment to competitive responses not highlighted in
the literature is the extent of direct political interference in decision-making in the public school
system of conflict-affected developing countries. Secondly, researchers need to be aware that
financial barriers are a higher order constraint in low-income developing countries, particularly
for schools that are located in the most economically deprived communities. Finally, researchers
have to be aware that the lack of community ownership and social stigma is a substantial hurdle
to overcome for public schools as parents in developing countries (who do not have to pay direct
taxes for education) may consider “fee-charging” private schools as an investment decision and
may relegate “free” public schools provided by an untrustworthy government to second-tier
status.
9
Insights for Policymaking
Choice has been a popular policy reform for policymakers due to the enormity of the
policy challenges that exist in education systems, and the theoretical promise of better learning,
higher parental satisfaction, and improved public sector in choice environments. Public schools
play an important role in educating the majority of the world’s poor and also receive substantial
government financial and policy attention. I argue that policymakers in developing countries
need to carefully calibrate the timing of choice policies, targeted supports, and accountability
mechanisms if choice is to yield public school reform.
My research indicates that public schools will require significant supports, accountability
pressures, and strong implementation of regulations to have the capacity and incentive to
compete with private schools. It is unlikely that these conditions will be met in developing
countries that have inadequate resources and poor governance. Thus, in a hypothetical scenario
with no school choice, the introduction of choice will not be the most efficient means of trying to
induce public sector competitiveness in developing countries.
However, in situations where private schools have been allowed to expand,
policymakers need to take steps to improve public schools in the following ways. First of all,
they need to keep track of the outcome and sorting consequences of private competition on
public schools. Policymakers need to track this evolution since there may be a tipping point in
terms of erosion of community support after which public schools will be unable to respond to
competitive pressures. As a result, the later the accountability and support systems are tagged on
to an existing choice system, the larger the magnitude of the public sector problem, and the more
difficult it will be to stage a reversal and regain parental acceptance. Policymakers need to focus
on tracking public school policies and facilitating needs-targeted financial and leadership
improvements to address the inequalities that exist within the public sector, and eventually
reduce the disparities between the public and private sectors. Targeted policy attention can
10
ensure that more public schools are in a better position to compete in the future, and will
especially benefit public schools in regions with nascent privatization that have not faced
significant middle class flight from public schools.

11
CHAPTER 2
LITERATURE REVIEW
This chapter reviews the education choice literature that is relevant for the dissertation. I
first briefly review the trends and central debate in school choice, and then discuss the relevant
empirical analysis on the impact of competition on public schools’ policies and outcomes. I
conclude by summarizing the literature and identifying the gaps in the literature that I try to
address with this research study.
Trends in School Choice
Education alternatives (choices) are defined as variations in financing and management
to the most common method of provision, the publicly funded (through taxation) and publicly
operated education system. In general, as shown in Table 2.1, these have been previously
classified into four types of schools according to combinations of public and private management
and funding. However, it may be appropriate to think of choice possibilities as a continuum – for
instance, there are plenty of services within government schools that may be privately contracted
(transportation, food), and there may be government operated schools that cannot rely
exclusively on government funding because of resource limitations. There is a wide variety of
public-private operation and management possibilities that continue to proliferate as choice ideas
gain greater global policy and consumer acceptance (Plank and Sykes, 2003).
The private sector provision of primary and secondary education, supported or
independent of government intervention, is a growing phenomenon in many developing
countries (Srivastava and Walford, 2008; Srivastava, 2013; Tooley and Dixon, 2005), including
the context of study, Nepal (Carney and Bista, 2009). The past decade has seen the role of the
private sector in education provision grow from providing education access to an elite or upper
middle class constituency to a growing group of middle and lower class consumers. These
developments have coincided with a growing empirical consensus among institutions,
12
policymakers and academics that even low-fee private schools are able to provide a better quality
of schooling than traditional public schools in developing countries. In fact, the significant
support for private schools in these contexts may even seem warranted and more palatable given
the poor learning achievements documented through new assessment tests. For instance, recent
calculations have suggested that fewer than 10% of youth in many countries are reaching
minimal literacy and numeracy levels, even when school attainment seems to have improved
rapidly (Hanushek and Woesmann, 2008).
Choice reforms have gained enduring popularity due to some substantial shifts in
intellectual, institutional, demographic and political environments (Plank and Sykes, 2003).
Among the intellectual shifts include the popular critique of the traditional system as being
overly bureaucratic and political (Chubb and Moe, 1990); the “choice with equity” argument
which argues that public education was already unequal to begin with (Jencks, 1970); and the
constant quest to reinvent government. Institutionally, the rise of influential transnational
organizations such as the World Bank has also aided the advocacy of choice and decentralization
globally. Politically, school choice reform can be appealing from a public finance perspective as
it gives governments a chance to shift financing burdens off the budget. Additionally, parental
preferences have also shifted in favor of increased differentiation (through quality, peer groups)
due to reductions in fertility and universal access to schooling. These interlinked arguments and
influential institutions are likely to ensure the continued expansion of decentralization and choice
based reforms globally in the near future.
The Choice Debate
The question of whether choice improves or worsens the overall system has been one of
the central debates in education policy. The theoretical expectation is that choice will allow
parents to better match their children to preferred schools; and that these competitive pressures
will incentivize improvements in bureaucratic public schools (Chubb and Moe, 1990; Friedman,
13
1962). Importantly, these benefits are likely to come as a result of increased alignment. School
choice could narrow the gap between schools and parents’ objectives through higher parental
involvement, reduced information asymmetry, and strengthened accountability (Schneider,
Teske and Marschall, 2000). The hypothesis also includes the expectation that public and private
schools that are unable to compete will die out (“creative destruction”). In conjunction, these
processes are expected to improve the functioning of the overall system, incentivize innovation,
and result in better student outcomes and parental satisfaction.
Critics of choice are particularly concerned that choice policies will increase the
stratification of the system as more informed, educated and concerned parents opt out of the
traditional system (Fiske and Ladd, 2001; Hsieh and Urquiola, 2006). The potential for
stratification is a logical concern as parents and schools have incentives to focus on sorting.
Given the choice, parents may use peer selection to improve their children’s life chances, and
schools may try to attract the best students to minimize their effort in producing good outcomes
(Chakrabarti and Roy, 2010; Epple and Romano, 1998; Nechyba, 2009). Additionally, there is
skepticism over whether there will be positive competitive effects on public schools. Choice may
not lead to better outcomes as parents may not choose based on academic quality, and thus not
provide the market-based accountability required to improve public schools through competitive
pressures (Lubienski and Weitzel, 2010). The public school students could instead be harmed as
they have to deal with adverse peer effects, and schools may be negatively affected due to
turbulence and potential reduced funding (Ni and Arsen, 2010). Institutional theory arguments
question whether choice can incentivize innovation. Institutional theory conceptualizes
educational organizations as large bureaucracies with loosely coupled structures, little control or
evaluation of instruction, and with a focus on categories or rules called “ritual classification.”
Based on this conceptualization, schools may not be motivated to innovate but rather focus on
emulating others that they perceive to be more successful when faced with any uncertainties
14
(DiMaggio and Powell, 1983; Meyer and Rowan, 1977). Finally, there is also recognition that
the policy adoption of school choice is strongly politicized. While the expectation is for market-
based accountability driven improvements in outcomes to drive future policy direction,
policymakers may not have the patience or the neutrality to use the evidence (Lubienski and
Weitzel, 2010). The concern is that political ideology or advocacy will solidify a policy
direction, even if the outcomes do not seem to pan out. Consequently, these new policy problems
may exacerbate the problems rather than resolving them. As a result of these complexities,
researchers have argued for more analysis on the systemic implications of choice rather than just
a focus on education outcomes (Levin, 2002).
Most of the outcomes-based quantitative evidence aims to examine the theoretical
expectations of quality and equity consequences from choice (McEwan, 2000; Zief, Maynard,
Bradley, Keefe, and Kralik, 2005). The vast literature on private, voucher and charter literature
have concluded that there are mixed to slightly positive outcomes of education choice in the
United States (McEwan, 2000; Miron, Evergreen and Urschel, 2008). The results appear more
positive in developing country contexts that have conducted voucher experiments such as
Colombia (Angrist, Bettinger and Kremer, 2006). However, there is more consistent evidence
that there was sorting by both income and ability under large-scale systemic changes (Chile,
New Zealand) or primarily by ability when there is an income based restriction (USA). In
addition, the validity of most of the literature is questioned due to the fact that it is based on
findings from nonexperimental programs2, such as the Chilean voucher program.
The main relevant empirical literatures for the dissertation are the competitive effects on
outcomes literature and the literature on public school responses to choice systems.
2 A brief overview of the public-private outcomes differences literature is presented in Appendix 2.1.

15
Do Private Schools Improve Public School Outcomes? Competitive Effects Literature
Defining Competition
Competitive effects are typically studied in quantitative models by conceptualizing
student outcomes or school resources as a function of the competition measure and a variety of
school and community covariates (Dee, 1998; Geller, 2006; Payne, 2010). The main measures
used to operationalize the extent of competition faced by the schools include measures that (i)
compute the concentration of enrollment (the Herfindahl index3), (ii) count the number of choice
schools that are in close proximity (geographic proximity), and (iii) compute the share of choice
schools in overall enrollment (market share) (Thapa, 2012a). These measures suggest that public
schools that have alternatives nearby, or are located in regions with high private market share
will experience more competition than public schools that face less competition nearby. A more
direct strategy for studying competitive pressures is to focus on schools that lose students to
specific alternative schools (school-by-school switching) and then to see whether schools that
have faced significant losses in enrollment are the ones that step up their efforts for
improvement.
Issues in Causal Inference
As discussed in Table 2.2, all of these measures have substantial validity issues,
especially if there is only cross-sectional data available for the analysis. A central issue in these
analyses is the difficulty in conclusively identifying the competitive effect – that is, how can one
determine whether any fluctuations in outcome is conclusively caused by the competition they
face and not by other factors such as the existence of more schools in urban markets predisposed
to higher outcomes? Conducting causal analysis is a major problem since choice programs are
typically not initiated using some sort of randomized strategy, and there is limited data on
3 The Herfindahl index is computed as the sum of the squares of the enrollment share of all the schools. A higher index suggests less competition. The index allows one to incorporate all schools and not just private schools in competition measures.
16
students before they started experiencing choice. In general, there is consensus that the empirical
analysis would be better served with more longitudinal student-level data, and detailed school-
level data. For instance, a panel dataset with repeated observations can help take the analysis
from a correlational cross-sectional analysis to a before-after analysis and enable one to ask: does
the public school outcome improve after the charter school opens up? Other major issues that
complicate the identification is that choice schools may locate where public schools are failing to
produce outcomes, and public and choice schools may have different compositions of students.
One of the main strategies to resolve the endogeneity problem is by using instrumental variable
(IV) strategies. The goal is to find an instrumental variable that is correlated with the competition
measure but not with the outcomes (Wooldridge, 2009).
Empirical Findings from the United States
In the United States, researchers have studied the impact on public school performance
of private competition using the private market share in enrollment as the main competition
measure. Most of the earlier studies found limited effects of competition on public school
students’ educational outcomes (Belfield and Levin, 2002; McEwan, 2000). Some of these
studies aimed to use an IV measure of the density of Catholic population in the area in order to
improve causal inference. However, future studies questioned the validity of religious
concentration as an instrument for private schooling (Cohen-Zada and Sander, 2007; Figlio and
Stone, 2000) because these measures were found to be correlated with outcomes.
The main analysis from voucher competitive effects comes from the pioneering
Milwaukee program. Chakrabarti (2008) analyzed how vouchers affected public school
outcomes by investigating the effects of the two major phases in Milwaukee’s voucher program,
the initial 1990 small scale voucher program and the later expansion in 1998 which allowed
religious private schools and increased the revenue loss experienced by public schools. The
author uses difference-in-difference strategies and finds the effects on public school performance

17
to be higher in the second phase compared to the initial phase. Carnoy, Adamson, Chudgar,
Luschei and Witte (2009) utilize methodology from Chakrabarti (2008) to confirm that there was
an enhancement in public school performance right after the increased competition in
Milwaukee. However, they argue that it appears that the positive achievement outcome appears
to have been a one-time response, and that more analysis is needed on exactly what changes
were introduced in the public schools to bring about improvements. They hypothesize that
teachers were motivated to enhance performance on examinations when they perceived a strong
threat, but were not able to do any more as the threat of competition persisted.
New evidence on voucher competitive effects comes from neo-voucher options whose
design has benefited from years of previous experiences. Figlio and Hart (2010) study the
Florida Tax Credit (FTC) Scholarship Program using fixed-effects approaches. They examine
whether students in schools that face a greater threat of losing students to private schools due to
the introduction of tuition tax credit scholarships improve their test scores more than students in
schools that face less pronounced threats. They find evidence that public schools subject to more
competitive pressures4 (elementary and middle schools in particular) raised their test scores the
most following the introduction of the program, and that the positive effect also extended to
students who were not eligible for voucher programs. The authors argue that they could better
isolate the competitive effect of the voucher threat compared to previous studies due to the fact
that there was a year lag between policy announcement and when students actually started
attending private schools.
The majority of the competitive effects research comes from the charter school
experiences in the United States. Three recent reviews of charter school research (Betts, 2009;
4 The competitive measures used by Figlio and Hart (2010) included greater ease of access to private school options, measured by geographic proximity and whole district measures; the options that students have in terms of the religious or secular affiliations of private schools, a diversity measure; and the Herfindahl index, a measure of concentration of student enrollment.
18
Zimmer and Buddin, 2010; Ni and Arsen, 2010) identified 13 studies that did state-level analysis
on competitive effects in Arizona, California, Florida, Michigan, North Carolina and Texas. The
evidence is decidedly mixed - of states that had more than one study, Michigan and North
Carolina show mixed results, while Texas has positive competitive effects on public schools.
These reviews contend that it may be too early to draw firm conclusions on the competitive
effects of charters on public schools.
Betts (2009) argues that since many of the studies use data from periods when charters
were only two to three% of market share, it is only natural that public schools do not feel highly
incentivized to reform and improve their quality. Betts (2009) recommends more “black box”
analysis of charter induced mechanisms – that is, more research to figure out if charters are
actually innovating, and then study if public schools are adopting any of these innovative
practices. Betts (2009) also suggests that research needs to expand to indicators beyond test
scores to aspects that matter to parents using insights from parent decision-making analysis.
Ni and Arsen (2010)’s analysis is more informed by implementation of charters and
appear less optimistic about choice-induced improvements. They provide a policy design based
explanation for Texas’ positive effects. They argue that since Texas charter school policies were
focused on ensuring at-risk students left district schools that it might have enabled district
schools to focus on improving programs for the benefit of higher performing students who stay
behind. An added study in their review is a school-level analysis by Ni (2009) which used 11
years of Michigan data to compute short and long run impacts of competition. The author
reviews Hoxby (2003)’s influential work which documented positive competitive effects on
Michigan and Arizona. Ni (2009) finds that charter competition exceeding 6% of district
enrollment, Hoxby(2003)’s measure of competition, actually hurt student achievement and
school efficiency in Michigan. Importantly, the negative competitive effect became more
substantial in the long run. Ni and Arsen (2010) also comment on the political realities in
19
education policymaking. They point out that policy debates may not be patient enough to let the
evidence mature before pushing for other alternatives. In their conclusion, they remain
noncommittal as to whether competitive effects may result in the future, but strategically
mention Hess’ argument about how choice may not lead to dramatic theoretically suggested
improvements because of the organizational and institutional rigidities of public schools.
Empirical Findings from other Contexts
The international evidence is quite limited in terms of studies on public school impacts.
Hsieh and Urquiola (2006)’s analysis of systematic sorting suggests that there were long-term
negative effects on public schools as a result of the Chilean voucher choice program. The study
found that between 1982 and 1996, communities that had higher increases in private school
enrollment also had lower public school test scores, higher gaps in test scores between elite
private and public schools, and higher socioeconomic gaps between public and private school
parents. The empirical analysis on New Zealand (dezoning and not an introduction of market-
based choice) used teacher and principal surveys of 10% of primary schools to show that the
quality of student learning and teaching style were more negatively affected in schools facing
competition rather than those not facing competition (Ladd and Fiske, 2003).
In contrast, Thapa (2011)’s cross-sectional analysis on Nepal finds significant positive
effects on public school performance of private competition using instrumental variable analysis.
Thapa (2011) studies competitive effects utilizing a comprehensive cross-sectional dataset on
schooling, the high stakes examination (SLC) 2004 Study (MoES, 2005). In the author’s model,
the dependent variable is the SLC examination test scores (the aggregate test score from the
compulsory subjects), and it is regressed on a competition measure (number of private schools in
the neighborhood) and a vector of controls (student, family, school, teacher and community
characteristics). The author utilizes the instrument variable (IV) of the presence of a motorable
road within an hour of walking distance of the school. The argument is that the presence of a
20
road should increase the chance of having more private schools in the location, but the presence
of a road should not have any relation with current student test scores5. The author finds
significant positive effects of private school competition on public school outcomes using the IV
analysis. Thapa (2013)’s competitive effects study is a valuable contribution to the developing
country research on the topic.
In summary, the competitive effects literature suggests that there are substantial
analytical difficulties in isolating the competitive effect of private schools. The empirical
analysis suggests that the outcomes evidence is mixed. It may be too early to tell if there have
been productive competitive effects in some contexts such as charter adoption in the United
States. There seem to be positive competitive effects from voucher adoptions such as the
Milwaukee program and neo-voucher programs. On the other hand, it may be too late to expect
productive competitive effects in contexts that have been less regulated and had systematic
reforms and experienced dramatic sorting such as Chile and New Zealand. The research on
competitive effects in developing countries is virtually non-existent. The analysis from Nepal is
limited by data but seems to show positive competitive effects on public school outcomes from
cross-sectional analysis.
Investigating Intermediate Outcomes in Choice: School Responses
The lack of conclusive evidence on the competitive effects on public school outcomes
does not mean that public schools are not changing as a result of the influx of private schools.
For instance, in his forward to the book “The Charter School Experiment” (Lubienski and
Weitzel, 2010), Henig states “Education needed some shaking and prodding, and charter schools
have delivered on that part of the promise. There are vitality and talent and resources in public
education today that were flagging prior to the 1983 federal report A Nation at Risk…”
5 The author uses the Hausman test to conclude that the 2SLS model is better than the OLS model.
21
The subfield of education choice that studies public school responses analyzes what
public schools are doing as a result of the “shaking and prodding” from the competitive
pressures. The purpose behind analyzing what schools do is that while school responses may not
necessarily lead to better outcomes, a lack of school response is highly unlikely to improve the
schools from their initial conditions (Hannaway and Hamilton, 2008; Hess, Maranto and
Milliman, 2001; Rofes, 1998; Rouse, Hannaway, GoldHaber and Figlio, 2007). These responses
can also be thought of as intermediate outcomes that provide an early signal as to whether the
final outcomes of learning improvements are likely to be met or not. These school responses can
also give a sense of whether policy or systemic changes are creating distortionary incentives or
aiding achievement, and thus improve the information available to policymakers. These studies
represent a relatively small subset of the literature, which is partially attributable to the fact that
there is a lack of data systematically describing instructional and organizational policies (Rouse
et al., 2007).
Research in the subfield can be categorized into studies that investigate market-based
choice plans’ impact on public school responses, and studies that try to utilize explicitly defined
accountability systems to study responses and outcomes. The majority of the studies that look at
public school responses have been qualitative in nature, and utilize interviews (principals,
teachers, policymakers) and document reviews, while some studies employ more representative
school surveys.
Evidence from Choice Plans: what Mediates School Responses?
There are serious complications in understanding the experience of competition. For
instance, do public schools start responding immediately after there is choice, or do choice
schools need to take up significant market share first (Zimmer and Buddin, 2010)? Besides the
number and density of private schools, a competitive response is determined by a complex set of
evolving mediating factors. The response will depend on whether the competition is viewed as a

22
threat that requires a response, whether personnel are incentivized to respond, whether there is
capacity to respond, and the school personnel’s expectations of success in overcoming
obstructive factors from these responses (Mohrman and Lawler, 1996). Studies such as Rouse et
al. (2007) have noted that it is not clear why school personnel would be incentivized to make
changes by setting different policies or investing in a different mix of inputs. Given the potential
difficulties in incentivizing responses in complex organizations such as schools (O’Day, 2002)
accountability systems aim to align incentives with a careful selection of rewards and sanctions.
However, even with well-designed accountability systems schools need to have the human and
financial resources to enact changes, and individuals within the school system need to derive
satisfaction from meeting the goals set out by the reform. Given these intricacies, it is critical to
understand motivations and to analyze context specific experiences while discussing the
experience of competition.
Zief et al. (2005)’s systematic review of U.S. market-based choice plans provides an
instructive list of factors that are likely to mediate a district’s response to competition. They
found that the most important factor that was important for districts to feel an impact was
enrollment trends – contexts with declining enrollment felt a large competitive threat while there
was a less of a threat felt in contexts with overcrowding and teacher shortages. Other factors that
mediated a district’s perceived impact included district size (larger districts did not feel as big a
threat), financial loss (those that were compensated for enrolment loss or had little financial
impact did not feel as big a threat), leadership (more reform-minded leaders were likely to
respond positively to choice plans), the initial availability of private options, flexibility in the
legislation, and the characteristics of students or parents who were leaving.

23
For instance, Hess, Maranto and Milliman (2001) examine four small and isolated
Arizona6 school districts which lost a substantial portion of their enrollment to charter schools in
a small period using qualitative comparative case study methodology. The main dimensions of
context that were important in whether schools felt a competitive threat were: whether the district
was growing, the quality of the charter schools that arrived as competition and the kind of
students targeted by the charter schools. For instance, the authors find that districts were likely to
respond if they lost students who were more mainstream and thus less expensive to educate. If
districts were growing, then both charters and public schools could prosper, and in fact new
schools were even welcomed as they functioned as pressure release valves in overcrowded
districts.
Evidence from Choice Plans: how do Schools Respond?
Based on the U.S. evidence, schools appear to respond in three types of ways – by
accommodating entry, by competing or by creating barriers to entry (Ni and Arsen, 2010).
Schools’ passivity may signal an inability or a lack of motivation to compete. Schools that decide
to compete can try to improve quality or aggressively improve their marketing strategies and
consumer relations. Other schools may react unproductively, for instance, by making the
working environment difficult for choice schools by mobilizing political opposition, or by
limiting access to important networks.
Schools that decide to respond have to decide to implement a few from among the
feasible set of policy domains such as instructional practices, personnel decisions, student
policies (admission, retention, failure), school financing (fee structure), parent interactions, and
6 The Arizona case is important given its status as an early adopter of charter schooling in the United States. Additionally, its minimal regulation meant that Arizona’s charter system adoption somewhat approximated a free market for education in the US context. The state has had the longest and most significant adoption of charter schools, and over 20% of current market share in public school enrolments belongs to charters. A group of authors (Hess, Maranto, Milliman, Gresham) have contributed to multiple related studies on the early charter school development in the state.
24
infrastructure related policies (Khan, 2005; Rouse et al., 2007). Instructional strategies could
include curriculum modifications, changes in classroom time or a focus on low performers. Non-
classroom strategies can include leadership related changes, active promotion, fund-raising and
changing decision-making roles. Besides being antagonistic towards charter schools,
unproductive consequences of competition can include attempts to improve school exclusivity,
or methods to game accountability systems to the school’s advantage. While some experts deem
non-classroom changes as being superficial or minimal, this designation is debatable as the
consequences are unclear for school productivity and parental satisfaction.
In Arizona, Hess et al. (2001) finds that when faced with additional pressure, district
schools were likely to respond with leadership changes. Maranto, Milliman, Hess and Gresham
(1999) employ mixed methodology (interviews and surveys) and find that a large portion of the
districts were happy to not do anything and have charter schools absorb extra students. It was
only the highly affected districts that tried to improve their customer service, advertised the
options that they had available compared to other schools, and tried to provide competitive
curriculum opportunities, such as through opening magnet schools. Among the strongly negative
reactions included the use of somewhat unethical spreading of false rumors to squash
competition. The school survey compared the behavioral changes in the treatment group
(Arizona school districts with at least 30% elementary schools as charter schools) as compared to
two comparison groups, the Nevada school district (similar state, almost no competitive
pressure) and less competitive Arizona school districts. The researchers find that the Arizona
groups reported that principals encouraged teachers to experiment, tried to protect them from
external pressures, and consulted with them more frequently. The Arizona high competition
group showed the greatest change in behavioral responses, as the schools stepped up efforts to
inform parents about their programs, and made teachers more responsible in decision-making.
Maranto, Milliman and Hess (2010) utilize the same data to focus on pre-competition

25
organizational culture. They find that the threat of school entry increased teacher curriculum
control for district schools which already had a highly collaborative culture but had no impact for
schools with initial low collaborations. These studies provided useful methodological insights
into doing in-depth analysis on the experience of competition. The major limitation of the
quantitative (survey-based) analysis is the lack of acknowledgement of the methodological
problems with the retrospective component of the survey – the data from 1994-1995 was
collected after three years along with the 1997-1998 data, which was likely to have been affected
by more serious recall issues.
There is limited evidence on responses to competition from other countries. The major
reforms in New Zealand and Chile have led to significant systemic changes which should have
been strong enough to incentivize responses from public schools. However, there are only a
handful of studies that even tangentially discuss public school responses. Gauri (1998)’s
systemwide analysis of Chile concludes that privatization and the threat of students exiting
public schools did not incentive educational innovation because “Chilean parents do not choose
schools for educational reasons” (p. 104). In New Zealand, the major conclusion by Fiske and
Ladd (2001) is that the systemic reform lead to responses that lead to higher stratification
without much positive impact on learning. For instance, the lack of zoning incentivized schools
to focus on enrollment, engage in aggressive marketing and promoting of schools, and in
changing the leadership in failing schools. Notably, there was not much curricular innovation,
attributed primarily to the fact that the incentives in the system were to increase enrollment and
popularity rather than to diversity offerings. Thus, Fiske and Ladd (2001) argue that parental
choice really gave way to school choice, as oversubscribed schools held the most power.
Consequently, the school choice reform kept previously disadvantaged schools in a
disadvantageous position which could not be overcome despite responses such as changes in
leadership and governance.
26
Evidence from Accountability systems: How do Schools Respond when there is an Explicit
Motivation to Respond?
Accountability studies are instructive from a “school response” standpoint when they
discuss how schools appear to be changing in response to accountability pressures. These studies
also provide most of the quantitative empirical evidence on intermediate outcomes. The evidence
from U.S. state-level accountability studies suggests that schools do appear to respond based on
explicit incentives to respond from accountability systems. Schools typically focus their
productive efforts on certain points of the academic distribution, depending on which grades,
subjects, and parts of the academic distributions have high stakes associated with them (Figlio
and Ladd, 2010; Jacob, 2005; Krieg, 2007). The evidence also suggests that high stakes may
incentivize schools and classroom teachers to game the system. Sudden improvements in test
scores may occur as schools and teachers strategize to respond to accountability pressures
through teaching to the test or narrowing their curriculum (Deere and Strayer, 2001; Ladd and
Zelli, 2002), changing the composition of students who take the examinations (Cullen and
Reback, 2006; Figlio and Getzler, 2007; Jacob, 2005), or even try outright cheating (Jacob and
Levitt, 2004). Rouse et al. (2007) is a unique study that combines high quality information on
both intermediate and final outcomes in an analysis of Florida’s accountability system. When
conducting the linked process and outcomes analysis, they find that combined with other
policies, a set of key domains explain more than 15% of test score gains in reading and over 35%
of test score gains in mathematics. The Rouse et al. (2007) study suggests that accountability
systems can not only incentive behavioral change in schools but can also affect the type of
school responses that a school engages in.
Summary and Gaps in the Literature
Early choice proponents expected improvements in efficiency, outcomes, and in the
alignment between schools and parents’ goals regarding schooling. Critics were concerned that

27
choice would further stratify society and doubted that choice related benefits would come to pass
due to a wide range of organizational concerns. Despite decades of data and methodological
advances, there is still limited experimental data and a lack of conclusive evidence on the ability
of choice interventions to improve school outcomes. There is some evidence to suggest that the
choice may have been beneficial in terms of improving public school outcomes in developing
countries. At the same time, there is consistent evidence that unregulated choice programs have
caused increases in sorting by income and ability. Despite the skepticism and the limited
evidence, choice has gained substantial global policy acceptance in the past three decades.
The question of how the public sector is impacted by private competition is one that is
central to education choice and has significant consequences for public sector reform in the
current era of growing privatization. However, the evidence on whether competition induces
productive competitive effects on public schools is also limited because of the lack of
experimental design in quantitative analyses, and the lack of in-depth analysis on public school
experiences with competition in their local settings. The available U.S. research suggests that the
evidence on charter and voucher impacts on public schools is mixed at best, and that it may be
too early to tell if there are any significant effects on school outcomes since the market share of
these choice schools is still very low. The U.S. research on school responses suggests that how
public schools respond and experience competition is determined in a complex manner. Some
recent high-stakes accountability systems seem to have been able to incentivize public schools to
focus on school quality interventions such as increasing instructional time and focusing on high-
stakes populations and subjects. However, depending on the accountability mechanism in place,
public schools may simply not react, or may have incentives to react unproductively.
Furthermore, these responses to competition may have unpredictable consequences on learning
outcomes. Given these varied possibilities, it is important to understand exactly what is occurring
28
in the context of interest to gain a better understanding of whether choice reforms are indeed
incentivizing reforms and whether stakeholders are satisfied with current trends.
There are two important gaps in the current literature. Firstly, from a conceptual
standpoint, there is a lack of integrated supply (school) and demand (parent) side analysis, which
would be needed to understand if school responses were linked with factors that parents appear
to value (Betts, 2009). To address the gap, I conducted analysis on parent decision-making in
local education markets in Nepal (Joshi, 2013a) in preparation for this dissertation. I found far
less engagement between parents and school officials in public schools than in private schools.
Additionally, public school parents relied strongly on their children for education decision-
making and monitoring, given their own low education levels. In combination, these findings
suggest that public school parents are putting very little pressure on schools to improve. Thus, it
is likely that parents in Nepal’s public schools are not providing the demand-side accountability
required for well-functioning choice systems. My dissertation addresses the supply side piece of
this integrated analysis.
Secondly, from a contextual standpoint, there is a lack of research on competitive effects
in developing countries, despite their growing privatization. In order to conduct these analyses,
one needs to be aware of the ways in which the choice environment in low-income countries
differs from the developed and middle income countries. Many of these countries, like Nepal,
have young education systems that lack a taxation-linked education financing system. These
countries are still expanding access while their systems have become more privatized, and have
an accidental rather than government regulated choice environment (Srivastava and Walford,
2008). Furthermore, most of these countries have a limited tradition of national data systems or
longitudinal data collection. For instance, the most recent quantitative analysis of competitive
effects on public school outcomes in Nepal (Thapa, 2012b) comes from a one-time 2004 cross-
sectional dataset which was collected before the major private schooling expansion of the past
29
decade. These limitations make it more difficult to study competitive effects by only using
quantitative analysis. The dissertation contributes to the research gap by offering a case study
built on a research design that is mindful of these differences.
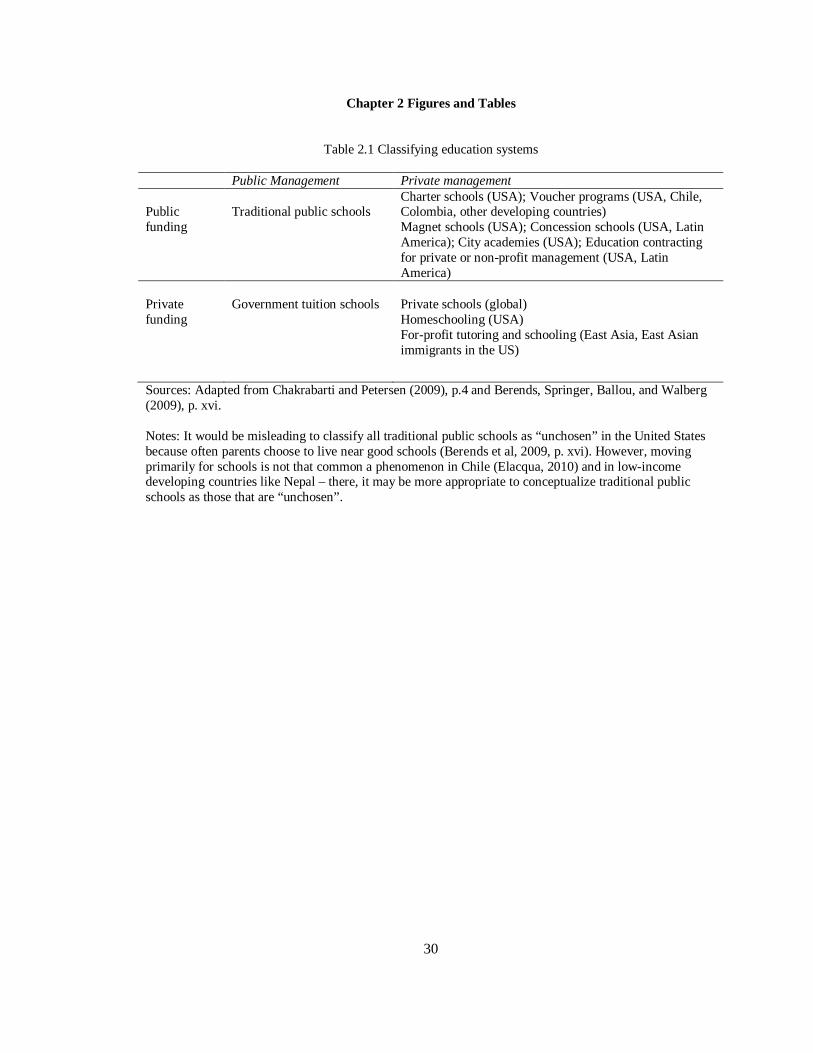
30
Chapter 2 Figures and Tables
Table 2.1 Classifying education systems
Public Management Private management Public funding
Traditional public schools
Charter schools (USA); Voucher programs (USA, Chile, Colombia, other developing countries) Magnet schools (USA); Concession schools (USA, Latin America); City academies (USA); Education contracting for private or non-profit management (USA, Latin America)
Private funding
Government tuition schools
Private schools (global) Homeschooling (USA) For-profit tutoring and schooling (East Asia, East Asian immigrants in the US)
Sources: Adapted from Chakrabarti and Petersen (2009), p.4 and Berends, Springer, Ballou, and Walberg (2009), p. xvi. Notes: It would be misleading to classify all traditional public schools as “unchosen” in the United States because often parents choose to live near good schools (Berends et al, 2009, p. xvi). However, moving primarily for schools is not that common a phenomenon in Chile (Elacqua, 2010) and in low-income developing countries like Nepal – there, it may be more appropriate to conceptualize traditional public schools as those that are “unchosen”.

31
Table 2.2 Strategies for studying the competitive effect and main validity issues
Strategy How to measure
Hypothesis Main issues that threaten validity
Geographic proximity
Count the number of choice schools within a given distance of each traditional public school
Choice schools that are closer impose greater competitive pressure than choice schools that are further away
Endogenous decision to locate – if the choice school’s decision to locate in a particular neighborhood is based on location and public school characteristics, then cannot get unbiased estimates of effects of choice schools on traditional schools, e.g. poor leadership may cause both low test scores in the public school and the emergence of choice schools; misleading if conclude that competition from choice school causes low test scores in public schools. Potential solutions: • panel dataset with repeated observations on test scores
and location of choice schools • instrumental variable that can predict whether a charter
school opens up locally, and does not directly affect test scores
Composition bias – may fail to capture movements of students between traditional public schools and choice schools if data is school-level Potential solution: • student-level data, and get data before-after choice school
enters the neighborhood Appropriateness of distance measure: Competitive pressures from choice schools may extend beyond a specified distance, thus making a distance proxy for competition only moderately appropriate.
Whole-district/ Market Share
Compute the share of enrollment of choice schools in each district
Districts with high choice share may face more overall incentives to improve
Improvement over method 1: Avoids endogeneity issue since location choice of charter within district is not a relevant concern Problems: Without student level data, would still have composition bias problems Other problem: A new form of potential endogeneity – district level changes that may impact charter growth and public school outcomes e.g. hiring of a more reform minded superintendent who favors charters and also wants to improve public schools
School-by-school switches
Calculate number of students each school lost to choice schools
If there are competitive effects, schools that have lost the most students to choice schools should have improved the most
One can overemphasize the results from those who switch as these groups are not necessarily representative of the larger population of students
Source: Adapted from Betts (2009).
32
CHAPTER 3
CONCEPTUAL FRAMEWORK AND RESEARCH QUESTIONS
I conceptualize the public sector response to private competition as a set of interlinked
processes in the dissertation. As outlined in the framework depicted in Figure 3.1, I argue that
schools need to first experience competitive pressures to decide to respond with some policy
actions. Then, the changes in school policies may eventually lead to improvements in school
outcomes. Besides the extent of private competition, the school’s responses to competition will
additionally depend on a host of constraints and supports, such as their personnel and financial
resources, their decision-making control over school policies, and the existing communal,
political and bureaucratic environment.
The Experiences of Competition
The quantitative competitive effects literature suggests that competition from choice
schools should be measured through geographic proximity indicators and other indicators that
show the extent of private school market share in a region. The analysis would require detailed
data on growth in private schooling and enrollment trends. The qualitative literature suggests that
the experience of competition is additionally determined by a variety of other initial conditions
such as school enrollment, district size, and legislation governing school finances, and more
subjective factors such as school leadership. Historical perspectives on how public schools have
been impacted by competition are also essential to describe the experience of competition in
contexts that have had long-term experiences with privatization. Thus, a variety of indicators and
approaches need to be triangulated to fully describe the experience of competition.
The Responses to Competition
The literature on school responses suggests that when faced with competition, public
schools can decide not to respond, decide to respond with instructional and non-instructional

33
reforms, or decide to focus on unproductive responses such as improving the school’s exclusivity
or gaming the system. Providing a detailed analysis of school response to competition requires
detailed data on school policies, when schools made these policy changes, and data on
competition measures to assess if these policies are likely to be a consequence of competition. In
contexts that lack longitudinal data from before and after policy changes, it will be highly
difficult to conclusively claim that certain policies are a direct cause of private competition.
However, the complementary use of stakeholder perspectives, following the qualitative
literature, helps strengthen the argument on which policies are likely to be a result of private
competition rather than other unobservable reasons.
The Factors that Mediate the Response to Competition
The responses to competition are additionally determined by whether there is capacity to
respond, and the school personnel’s expectations of success in overcoming obstructive factors
from these responses. In order to be able to provide a detailed account of these factors, one
would need information on principal perceptions of the benefit of responding to competition, and
the constraints they may face in decision-making. Specially, these mediating factors include the
macro-level political and economic environments, societal attitudes towards public schooling,
and school-level personnel and financial constraints and relationships with the community.
The Linkages between Outcomes, Competition and Responses
In the competitive effects literature, most of the studies model school outcomes as a
function of the competition schools face and control for other school and community
characteristics. The accountability systems literature suggests that one can assess whether key
policy changes have had any substantial impact on outcomes by modeling outcomes as a
function of policy changes and schooling characteristics. The availability of longitudinal
information or the use of instrumental variable strategies would help strengthen the causal
inference of such analysis.

34
Research Questions
The Research Questions are the following:
1. How do public schools experience competition?
i. What is the extent of private competition experienced by public schools in Nepal?
ii. What are the other pressures faced by public schools that mediate their experience of
a competitive threat?
iii. How do public school principals view their schools’ experiences with privatization?
iv. What are the characteristics of the schools that public schools identify as
competition or as the best schools in the district?
These questions are addressed in Chapter 5. The chapter examines the extent to which public
schools experience private competition. It triangulates data from national records of school-level
indicators, detailed district-level records on private schooling, a survey of public school
principals, policy documents, and interviews with government officials and school principals.
2. What are they doing in order to respond to competition from private schools?
i. What are the policies that public schools adopt in order to compete with private
schools?
ii. Are public schools that experience higher competition more likely to have adopted
these school policies than public schools that experience lower competition?
These questions are addressed in Chapter 6. The chapter first describes the current school
policies in public schools and assesses whether public school policy changes can be attributed to
competitive pressures. It primarily utilizes interviews with school principals and government
officials and a combined quantitative dataset (a principal survey for competition measures and
school policies, linked data on school and community characteristics from the national school-
level records). The analysis for Research Question 2(i) is based on descriptive statistics and

35
interview data. Then, research question 2(ii) assesses whether there are statistically significant
differences in terms of policy adoptions between public schools that experience different levels
of competition using the combined quantitative dataset.
3. What are the factors that mediate how public schools respond to private competition?
i. What are the barriers and supports faced by public schools in instituting reforms and
responding to competition?
ii. Do principal perceptions on the key barriers and supports to reform differ by the
extent of private competition faced by the school?
These questions are addressed in Chapter 7, using a two-step mixed methods analysis. The
chapter first describes other aspects that mediate school responses after they have decided that
they feel enough competitive pressures and feel the need to respond. It also describes the
variations and similarities in perceptions on public school constraints among different
stakeholders. In doing so, it provides an understanding of the main difficulties that schools
encounter in making schooling improvements, and a sense of which of these challenges can be
addressed by policies. Then, through research question 3(ii), the chapter provides quantitative
analysis of how these constraints and supports vary by the extent of competition faced by the
public school. The analysis primarily utilizes interviews with various stakeholders (principals,
local-level officials, district-level officials, national-level officials) and perception questions
from the principal survey.
4. How are public school actions and their experience of competition linked with their
outcomes?
i. Do public schools in higher competition regions have better outcomes (test scores,
enrollment) than public schools in low competition regions?
ii. What is the relationship between outcomes (test scores, enrollment) and public
school responses that intend to improve those outcomes?
36
iii. Do localities with higher private competition have larger gaps between public and
private school outcomes (test scores, enrollment) than localities with lower private
competition?
These questions are addressed in Chapter 8. The chapter utilizes longitudinal data. To address
research question 4(i), I assess whether there is a statistically significant difference in schooling
outcomes (standardized test scores, low proficiency measure, and high proficiency measure,
grade 1 enrollment) between schools that face different levels of competitive pressures. To
address research question 4(ii), I analyze whether there is a statistically significant difference in
enrollment between schools that have adopted certain policies to have a quick effect on
enrollments, and whether there is a statistically significant difference in test scores between
schools that have adopted examination focused policies. To address research question 4(iii), I
analyze whether the public school performance relative to the private school performance differs
between schools in localities that have different levels of competition. In order to improve causal
inference, I utilize fixed effects regressions (for the time-variant competition measure, private
market share) and instrumental variable techniques.
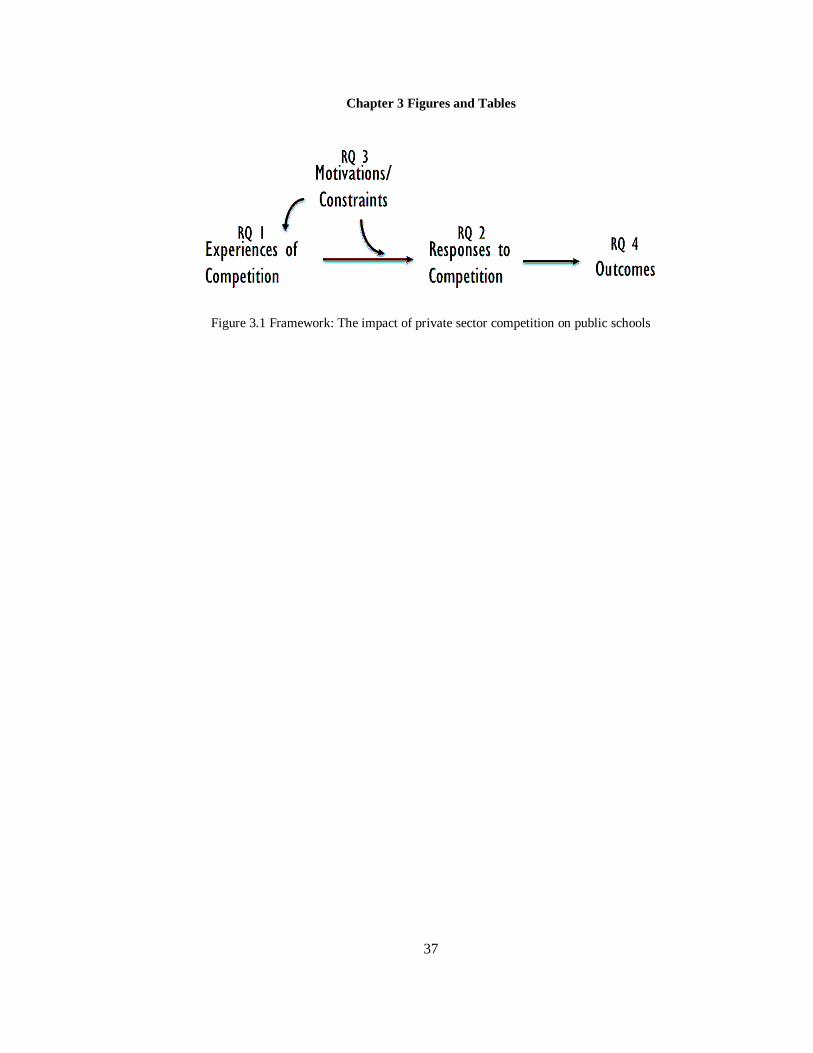
37
Chapter 3 Figures and Tables
Figure 3.1 Framework: The impact of private sector competition on public schools
38
CHAPTER 4
DATA AND METHODS
I describe the national context, research sites and the primary and secondary data that
was used for the analysis presented in the dissertation in this chapter. I provide a discussion on
the needs addressed by the primary data collection and how the secondary data is being utilized
throughout the dissertation. These data were collected between 2010-11 and 2012-13, as mapped
in Figure 4.1. My contextual focus on Nepal allowed me to utilize insider and outsider
perspectives as a Nepalese citizen who is trained in research methods in the United States7.
National Context
Nepal Socioeconomic Context
Nepal is a developing country situated between India and China with a population of
26.6 million and 17% urban population (CBS, 2012a). The country is administratively divided
into five development regions (far-western, mid-western, western, central, and eastern), and three
ecological belts (mountains, hills, Terai). Nepal’s current administrative structure is based on the
Local Self-Governance Act of 1999. Nepal has a two-tier system of local governance – there are
75 districts that are constituted of village development committees (VDCs) and municipalities
(towns and cities)8. There are substantial differences in human development indicators by region,
ecological belt, and rural or urban area. Adult literacy rates (15 and older) are the highest in
Kathmandu valley (84%) and lowest in the far and mid-western regions (54.1%). The mountain
and Terai (plains) regions have significantly higher gender disparity in adult literacy than in the
7 The primary and secondary data collection was completed with funding support from the World Bank’s Nepal country office and with the approval of the Nepalese Education implementing agency, the Department of Education (DoE). 8 Each VDC is further divided into nine wards, and each municipality is divided into a minimum on nine wards.
39
hilly region. For instance, two-thirds of the adult men, and only one-third of adult women are
literate in the mountain region of the country (CBS, 2011).
From an economic perspective, Nepal is considered a low-income, primarily rural,
agrarian economy. The country has seen a recent increase in living standards due to a growth in
remittances which has offset poor domestic employment growth (IMF, 2011a). Households have
become increasingly reliant on remittances – over 55% of households receive remittances and
these remittances constitute over 30% of these household’s income. Over 29% of households
have at least one absentee living abroad (CBS, 2012). Between 1995/96 and 2010/11, the country
has experienced significant gains in adult literacy, and accessibility to major facilities such as
schools, health services, banking services, and market centers (CBS, 1997; CBS, 2004; CBS,
2011). These continued improvements in living standards have resulted in a drop in poverty rates
from over 40% in 1995 to 1996 to 25% of the population in 2010-11(CBS, 2011). Analysis on
Nepal’s poverty indicates that the poverty incidence is highest among the agricultural laborers,
less educated people, disadvantaged groups such as dalits and hill janjatis, families with larger
households, and families with low land ownership (CBS, 2006, CBS 2012). For instance,
households that have an illiterate household head are almost three times more likely to be poor
than households with a household head with at least seven years of schooling, as shown in Table
4.1 (CBS, 2012b).
Despite improvements in living standards, Nepal’s economic competitiveness has
continued to decline over the past decade due to inadequate road connectivity, poor access to
power, a fragile financial system and weak institutions (World Bank, 2011; World Economic
Forum, 2011; IMF, 2011a). Perhaps the most important limitation, however, is the highly
unstable political environment. Important historical markers in Nepal have been the beginning of
democratic rule in 1991, the disarray caused by political volatility, and the resultant decade-long
violent Maoist political struggle between 1996 and 2006. The past few years have ushered in a

40
new era – Nepal is finally without a monarchy, but continues to operate in an extremely fragile
state with frequent changes in leadership as its political leaders try to develop a new constitution
while attempting to address historical injustices in the country’s nascent democracy. Some recent
positive developments have included the official incorporation of over 1300 former Maoist
soldiers into the Nepal army in July 2013 (Martin Chautari, 2013) and the relatively peacefully
held November 2013 elections.
Education System
The systematic development of an education system with the objective of a national
universal system only began about 60 years ago. Prior to the 1950s, a 100-year oligarchic regime
that was in power during the colonial era supported isolation and education suppression in the
country (Wood, 1959). Between 1950 and 1990, education access expanded from a low starting
point. However, aggressive expansion really took off after the 1990 Education For All
international commitment – in 1951, there were 321 primary (grades 1 through 5) (8,505
students) and 11 secondary (1,680 students) schools (Bhatta, 2009). By 2012, these numbers had
skyrocketed to 34,066 basic (6,595,565 students) and 7,938 secondary (848,569 students)
schools (MoE, 2012)9.
The Nepal K-12 education system is still going through substantial transitions. The
education system used to be divided into primary (grades 1 through 5), lower secondary (grades
6 through 8), secondary (grades 9 through 10) and higher secondary (grades 11 through 12)
levels. There are efforts under way to build a pre-primary system and to transition the 1-12
system to basic (grades 1 through 8) and secondary (grades 9 through 12), with separate
vocational and academic tracks. Politically, it has been difficult to close down the intermediate
levels (grades 11 through 12) in campuses throughout the nation due to student and other
9 For a recent detailed discussion on Nepal’s education development, please see Thapa (2011) and Sharma (2012).

41
protests. Simultaneously, the Department of Education is working to mainstream religious
(Hindu, Buddhist and Muslim) primary schools and to ensure that the schools stay “basic level”
or “secondary level” schools and stop adding grades to transition from basic to secondary level
schools. While there are nationally administered examinations in the 5th grade and 8th grade, the
most important high-stakes examination taken by all students is the end of high school 10th grade
School-Leaving Certificate (SLC) examination as it directly determines student placement in
higher education and career opportunities.
In the early years of education access, that is, in the 1950s and 1960s, Nepal’s schooling
system used to be entirely community funded and operated. In the inception phase, there were
strong recommendations for the development of a tax system, but there was significant resistance
from the small and elite minority of professionals and industrialists who claimed that taxation
was an affront to private investors (Upraity, 1962). There were brief forays into voluntary
taxation in the mid-1960s which yielded some success in increasing enrollment in a few districts
(Padhye, 1976). Any mention of attempting a local taxation based financing model has
disappeared since then.
The first major policy reform in Nepal was the National Education Sector Plan (NESP)
of 1971 that was financed by USAID and sought to create a unified system of public education,
with district level education offices empowered to administer schools. The policy emphasis was
on central planning and there was a shift of the locus of control to the capital Kathmandu. The
quest to increase central government responsibility was particularly significant in terms of
teacher provisions and also led to a loss of influence of local interest groups in schooling. The
nationalization movement did not last long – starting with the Decentralization Act of 1982,
Nepal has undergone a three-decade long emphasis on decentralization, bolstered by increasingly
important donor support. Private schools were re-allowed to operate starting in the early 1980s,
and have since expanded significantly.

42
While there has been substantial growth in education access, there remain pervasive
problems with poor education quality in Nepal’s education system. The significant growth in
education access since the 1980s have led to substantial progress in out-of-school rates in Nepal
– as shown in Table 4.2, while over 36% of 6 to 24-year olds never attended school in 1995-96,
the number had decreased to 8.7% by 2010-11. Of the students who did not attend schooling,
schooling costs are not as prohibitive as they used to be in the 1990s. However, parents desire
not to send their children to school and the need to help around the home continue to be the key
reasons for lack of schooling access. Self-reports from 6 to 24-year olds, detailed in Table 4.3,
suggests that poor academic progress at the school, potentially due to high repetition or lack of
learning, is a dominant reason for student dropout. Nepal has very high repetition rates,
particularly in early grades and there still are problems with education completion. In
conjunction, these statistics point to issues caused by low schooling quality, alongside economic
and sociocultural barriers.
A main policy reform initiated in the past decade to improve education quality was the
Community School Support Program (CSSP), modeled after the community-focused
decentralization programs in Latin America. The CSSP sought to shift management control and
financing to the community level and reduce government responsibility to a facilitator role
(World Bank, 2003). The main rationale for the decentralization push was the notion that pre-
1971 community initiated and operated model for schooling provision was more successful than
the centrally governed Nepal education system. While the program was initiated and promoted
with much fanfare, there has been significant opposition to the program, particularly from
teachers (World Bank 2011; GSDRC, 2011). Another important recent policy was the
establishment of the per-child fund (PCF) accountability mechanism, which was initiated in 2008
with the goal of tying funding more directly to enrollment.

43
Furthermore, the public education system has been plagued by issues of overt
politicization10. Some of the key instances of political dysfunction are found in the teaching
profession. An Education Service Commission was established for the purpose of independently
hiring and certifying teachers in 2001. However, the commission remained defunct for the
greater part of the last decade, and has only started the process of hiring teachers in a transparent
manner for the 2013-14 academic year11. The country addressed the need for teachers to
accompany the education expansion efforts of the 1990s by appointing temporary teachers
through “rahat” (relief) quotas from the development (donor funded) budget. Local school
experts frequently remarked on the questionable, subjective teacher hiring practices in the period,
and suggested that the legacy of loose teacher hiring had endured and exacerbated in the present
political climate. Specifically, experts suggest that these systemic problems have allowed the
teaching profession to be held hostage to political interests. In such a context, private schools
have thrived since they provide a relatively politics-free education environment, teach in the
valued English medium of instruction, and have routinely produced better student test scores
than public schools.
Financing the education system has become increasingly reliant on foreign assistance.
The lack of domestic revenues12 to support expenditures coupled with massive education
expansion has contributed to the country’s increased dependence on foreign assistance13 in
education spending.
10 The extent and dimensions of political interference in Nepal’s education system are discussed in more detail as one of the reasons for their inability to compete with private schools in Chapter 7. 11 Source: http://www.tsc.gov.np/ 12 One of Nepal’s key financial issues is low domestic revenues. Even in comparison to other low-income countries, Nepal has a disproportionate and unsustainable reliance on import based taxation and low tax yields (IMF, 2011b). 13 The growing role of donor funds can be seen in the foreign role in budgetary allocations that have been made for district level expenditures, which are separately accounted for from expenditures that are made
44
Thus, Nepal’s experience has unique context specific characteristics. Still, Nepal is a
good choice for the analysis on competition since its experiences are likely to be significant in a
comparative sense for a range of developing countries. Firstly, Nepal’s experience is relevant for
other South Asian countries, as there has been diversified private sector growth in India
(Muralidharan and Kremer, 2009) and Pakistan (Andrabi, Das and Khwaja, 2008). Secondly,
Nepal’s experience provides insights for other developing countries with which it shares
structural similarities, such as land-locked countries or countries in conflict situations that have
robust private sector engagement in education. It is important to thoroughly analyze how public
schools in countries like Nepal are being impacted by privatization growth so that more rigorous
evidence can be used for policymaking.
Needs addressed by the Primary and School-level Secondary Data Collection
I decided to collect primary data and school-level secondary data after a careful
exploration of the available datasets on education and an assessment of their limitations for the
research study. Some of the comprehensive datasets were not focused on education but provided
important descriptive and methodological insights. For instance, the main living standard survey
that has been conducted in Nepal three times (1995/96, 2003/04, and 2010/11) was primarily
useful for providing some of the key descriptive statistics on household burden of schooling
expenditures and adult and child enrollment and literacy. The School-Leaving Certificate (SLC)
study of 2004 is a comprehensive cross-sectional study that surveyed school principals, teachers
and students, and also collected performance data. The 2004 dataset has been utilized for
policymaking at the secondary school level, and a variety of interesting research studies on
private tutoring, public-private differences, and competitive effects in Nepal (Bhatta, 2004;
Jayachandran, 2008; Sharma, 2012; Thapa, 2011). However, the dataset suffers from three key
from the central government. In the five-year period between 2004-05 and 2009-10, district level spending quadrupled (in nominal terms) while central spending doubled. In the period, foreign grants and loans constituted over 90% of the funding for district-level expenditures (Ministry of Finance, 2009).

45
limitations for this dissertation. Firstly, the data come from the 2004 academic year, which
makes it outdated for studying whether public schools have been impacted by the significant
recent expansion of private schooling in Nepal. Secondly, since the dataset was not focused on
competition, it does not capture data on school policies and perception questions that relate to
public-private differences and competition. Thirdly, since the sampling strategy was focused on
national representativeness, the dataset could not have captured the diversity of competitive
experiences within each locality. These are important shortcomings for my dissertation approach,
which is based on the argument that we need a better understanding of how competition is
experienced locally (Betts, 2009; Lubienski and Weitzel, 2010; Miron, 2010).
The primary data collection addresses these issues in the following ways. Firstly, I
administered a principal survey which collected relevant information on competition measures,
school policies, and perception questions. The principal survey allowed me to investigate the
questions raised in the conceptual framework more thoroughly from the school principal’s
perspective. Survey data was collected from every public secondary school that had students who
participated in the School-Leaving Certificate (SLC) exam in 2008 in the two districts of study.
Secondly, I conducted a variety of interviews with national, district and school-level officials in
the two districts of study, and in a set of other diverse districts. The extensive qualitative data
collection allowed me to gain multi-level stakeholder insights. Even though the questions were
focused on how public schools were experiencing and responding to competition, the answers
also come from adequate investigation of private schools, government officials, and parent
perspectives on the issue.
Besides the primary data collection, I also gained access to the Nepal school-level
national records in education, and detailed district level records on private school fees and
establishment histories in the two main districts of study. The annual national records were
essential to be able to understand the extent of private market share, and the trends in enrollment
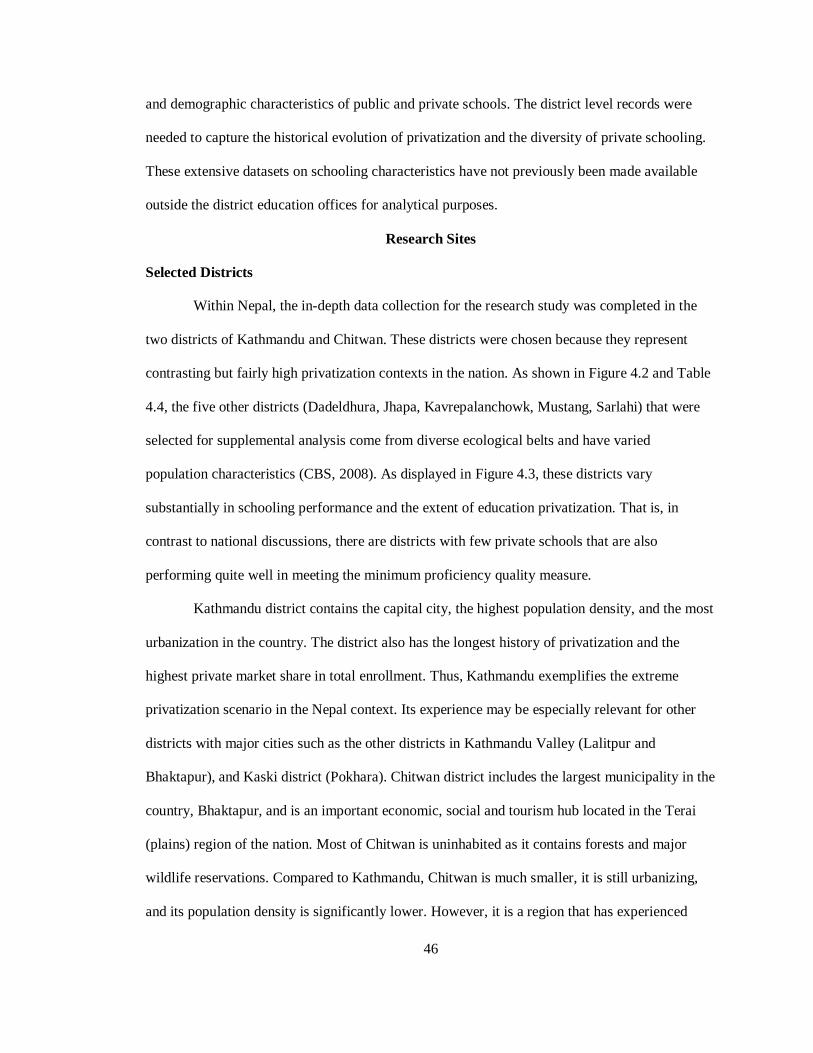
46
and demographic characteristics of public and private schools. The district level records were
needed to capture the historical evolution of privatization and the diversity of private schooling.
These extensive datasets on schooling characteristics have not previously been made available
outside the district education offices for analytical purposes.
Research Sites
Selected Districts
Within Nepal, the in-depth data collection for the research study was completed in the
two districts of Kathmandu and Chitwan. These districts were chosen because they represent
contrasting but fairly high privatization contexts in the nation. As shown in Figure 4.2 and Table
4.4, the five other districts (Dadeldhura, Jhapa, Kavrepalanchowk, Mustang, Sarlahi) that were
selected for supplemental analysis come from diverse ecological belts and have varied
population characteristics (CBS, 2008). As displayed in Figure 4.3, these districts vary
substantially in schooling performance and the extent of education privatization. That is, in
contrast to national discussions, there are districts with few private schools that are also
performing quite well in meeting the minimum proficiency quality measure.
Kathmandu district contains the capital city, the highest population density, and the most
urbanization in the country. The district also has the longest history of privatization and the
highest private market share in total enrollment. Thus, Kathmandu exemplifies the extreme
privatization scenario in the Nepal context. Its experience may be especially relevant for other
districts with major cities such as the other districts in Kathmandu Valley (Lalitpur and
Bhaktapur), and Kaski district (Pokhara). Chitwan district includes the largest municipality in the
country, Bhaktapur, and is an important economic, social and tourism hub located in the Terai
(plains) region of the nation. Most of Chitwan is uninhabited as it contains forests and major
wildlife reservations. Compared to Kathmandu, Chitwan is much smaller, it is still urbanizing,
and its population density is significantly lower. However, it is a region that has experienced
47
substantial, more recent privatization. Chitwan may be representative of about ten other districts
that have medium-sized and growing urban regions and relatively large rural areas.
Chitwan and Kathmandu share similarities in terms of demographic composition. While
it used to be a historically Newar (Tibeto-Buddhist ethnic group) region, the capital city of
Kathmandu has routinely experienced significant migration from throughout the country, making
it a true sociocultural melting pot (CBS, 2011). In the 1950s and 1960s, Chitwan districts
underwent substantial deforestation and malaria eradication, and the government encouraged
habitation in the region. The initial settlers came from throughout the country and thus Chitwan
is also populated with significant linguistic and ethnic diversity. Chitwan and Kathmandu are the
two most socially and politically aware districts in the country. The in-depth investigation of
these two districts provided me with an understanding of how public schools are likely to
respond in regions that experience high and growing exposure to private schools. Moreover, the
fact that all public schools in the districts have been surveyed meant that I was able to gain
insights from rural regions in the two districts, which makes the analysis relevant for the
remaining districts that have primarily rural populations.
Of the other five study districts, Mustang is a sparsely populated, relatively inaccessible
mountain district but is relatively wealthy due to adventure and religious tourism. Jhapa and
Sarlahi are populous regions in the plains (Terai) of the country. While Jhapa has relatively
progressive indicators, Sarlahi in the central plains has one of the lowest official percentages of
private schools, and suffers from one of the highest gender disparities in the country.
Kavrepalanchowk and Dadeldhura represent hilly districts of the country. Kavrepalanchowk
benefits from being located right next to the Kathmandu valley and thus has significantly
developed infrastructure and education access. On the other hand, Dadeldhura is in the far-west
part of the country, is primarily rural, and has limited economic growth opportunities. Thus,

48
these districts represent the ecological and economic diversity in the country, and are helpful as
comparisons to the experience of competition in the two main study districts.
Datasets from Primary Data Collection
Principal Survey
A principal school survey was administered for this dissertation to principals under my
supervision between July and September, 2011. The types of data collected included data on
competition measures, school policies, perception questions, and education indicators. The key
data components of the principal survey are outlined in Table 4.5, and discussed in greater detail
in each results chapter. One of the initial decisions that I made was to restrict the analysis to the
impact on public secondary schools because the only major performance assessment conducted
in Nepal is at the end of high-school (10th grade), called the school-leaving certificate (SLC)
examinations. I decided to survey principals since they are the main officials who are responsible
for school decision-making. In the figures and tables for all chapters, I will reference this source
as “Principal Survey” for simplicity.
Survey instrument design. The survey questions, particularly on school policies, were
developed by primarily referencing Rouse et al. (2007)’s study on Florida and the Nepal SLC
study questionnaire (MoES, 2005). I developed additional perception questions on public-private
differences and motivations and expectations from competing with private schools based on my
contextual knowledge, and initial qualitative fieldwork from Summer 2010. The instrument was
finalized after discussions with key school principals and a formal pre-testing in June, 2011. The
survey was then administered by 20 enumerators from a contracted firm.
Sampling design. The sampling frame for data collection was the list of secondary
schools that had participated in the high stakes secondary examination in 2008 – 2009 academic
year (Nepali year 2064). The sample was a census of the public secondary schools and a
randomly stratified sample of private secondary schools. The sample consists of 212 public
49
schools (145 Kathmandu public schools, 67 Chitwan public schools) and 81 private schools (58
Kathmandu private schools, 23 Chitwan private schools). The rationale for collecting data on a
census of public schools was to capture the diversity of experiences with competition throughout
the two districts. The private school sample is primarily used to illustrate the differences between
public and private schools in policy adoption and principal perceptions. There was a 100%
response rate from public schools for the sections on competition measures, perceptions and
policies. A random replacement procedure was followed in case of non-response from the private
schools.
Data on competition. The school principals were asked to identify the number of private
and public primary, lower secondary and secondary schools within one kilometer14 of their
school. The data was used to define one of the objective measures of school competition,
geographic proximity. School principals were also asked for their subjective opinion on their
competition. They were asked for the names of up to three competitor schools. Public schools
that identified at least one private school as a competitor could be defined as public schools that
subjectively experience competition. They were also asked to name up to three of the best
secondary schools in their district.
Data on school policies. School principals were asked whether or not they currently
implemented policies on recruitment and promotion, other policies to make schools more
attractive, policies on instructional time, attempt to reduce student and teacher absenteeism,
policies to improve teacher quality, parental participation, and enhance selectivity in the
admission process. They were asked the questions as a binary outcome (yes/no) and also asked
the year they started that policy (the retrospective data), and which grades (grades 1 through 10)
they were implementing the policy. The enumerators noted that principals would often ask for
14 I was debating between using one kilometer or a ten minute walk to proxy geographic proximity. I was advised by the survey firm to use one kilometer during the survey finalization process.

50
the assistance of other school officials to ensure accuracy of their responses, especially if they
had not worked at the school for a long time.
Data on perceptions. The data on perceptions include questions on school
decisionmaking, school climate and environment, public-private differences and the expectations
and motivations of public schools to compete. School principals were asked to respond to these
questions on a 4-point ordered Likert scale. Based on field visits, it appeared that principals were
more likely to err on the side of mildly agreing with the questions. Thus, they were less likely to
strongly agree or disagree with the responses.
Statistical indicators. School principals, with assistance from the school accountants or
other teachers responsible for school accounts, were interviewed to put together some key
statistical data on enrollment, demographics, school performance, selectivity, fees, and school
finances for the past three years. The survey also attempted to collect data from ten years ago but
most of the schools were unable to provide that information. Most of the data, except for data on
student selectivity, are supposed to be compiled for the national records. The rationale behind
collecting the data through the school survey was to ensure a high response rate for important
variables.
Qualitative Data
I collected all of the qualitative data. In the exploratory phase (Summer 2010), I
conducted interviews with a few national policymakers (Department of Education), district
officials (District Education Office) and visits to three public schools each in Kathmandu and
Chitwan, and Jhapa, Mustang and Kavrepalanchowk districts to understand public school
functioning and the key issues plaguing public schooling. In the Summer of 2011, I had
narrowed my research questions to focus on public school decision-making and the experience of
private competition. In Kathmandu and Chitwan, I conducted a detailed study which included
discussions with district officials, local level district officials (resource persons), and interviews
51
with principals. I additionally visited two other districts, Sarlahi and Dadeldhura, and
interviewed district level officials and four public and private school principals to understand the
privatization and competitive environment in those districts. I also had discussions with a larger
group of other national policymakers in the Department of Education, Ministry of Education, and
National Curriculum Development Center.
In the tables and figures, I refer to detailed data collected from Kathmandu and Chitwan
as “Qualitative (In-Depth) Dataset” for simplicity. I refer to the qualitative data from the five
districts and the national policymakers as the “Qualitative (Supplemental) Dataset” for
simplicity. Other qualitative data used for the analysis include field notes, policy documents
provided by schools and district officials, and news articles pertaining to public school
competitiveness. The qualitative data sample and key discussion topics are summarized in Table
4.6.
The interviews were conducted in a semi-structured manner. The interviews with
national level officials focused on the historical evolution of private schools in the nation, public
school actions in response to competitive pressures, the differences between public and private
schools, the effectiveness of school reform efforts, the constraints faced by public schools, and
their opinions on school financing policies. My interviews with the district level and local level
officials were more specific since our discussions focused on similar topics but were limited to
their district or their location. At the school-level, I initiated the interview with the school
principal or available senior official with questions on the historical changes experienced by the
school. The interviews then covered other relevant issues such as the evolution of privatization in
the region and its impact on the school, their opinions on privatization and recent school policies,
the reforms that they have undertaken recently, and the constraints they face while trying to
improve the school.
52
Location and school selection within Kathmandu and Chitwan. In order to conduct more
in-depth analysis in local settings, I selected three regions each within Kathmandu and Chitwan.
These regions (an older city location, a newer city/semi-urban location, and a rural location)
represented variations in schooling and economic contexts within Kathmandu and Chitwan
districts. The locations were selected based on the earlier discussions with local education
experts, and initial fieldwork. I used geographic proximity and resource center location in order
to identify a plausible local education market as it is likely that parents strongly factor in distance
from home while making schooling decisions. The resource center is the most disaggregated
level of the education bureaucracy in Nepal and one resource person is in charge of the resource
center and monitors and caters to the needs of the area’s public and private schools.
The main city area in both districts consists of populations that have historical ties to the
community, and feature some of the oldest schools and neighborhoods, and the earliest
transportation and industrial development. The semi-urban regions are regions that were more
recently urbanized. In Kathmandu, the semi-urban region is substantially populated while in
Chitwan it is a much more recent population and urban center. The rural region is considered
relatively remote and is more sparsely populated. The rural region selected in Kathmandu is on
the outskirts of the major city and has a higher share of migrants, while the rural region selected
in Chitwan is a remote village area close to the major forests with historically disadvantaged
populations.
The strategy was to select a diverse set of four to six public and private schools that were
geographically close enough to each other to be considered as schooling choices for the people
living in the community. The final school selection decisions were made through a series of
discussions with local education officials and exploratory analysis from the Summer of 2010.
Since I went through a prolonged selection process, I believe that I have sampled schools that

53
provide a relatively accurate sense of most of the variation of options available to local middle
and lower class parents in those locations.
Parent Survey and Focus Groups
The data on parent decision-making15 was collected from focus groups and parent
surveys in the two districts of Kathmandu and Chitwan. Parent surveys were collected from 30
parent meetings conducted in urban, semi-urban and rural locations with sixth grade parents
between June and September 2011. A team of eight survey enumerators administered brief
surveys to the parents to gather data on basic parental characteristics and their responses on the
reasons they chose the school, the other schools they considered, the reasons for private school
attraction, their satisfaction with the school, and their involvement in and knowledge about their
children’s education. I conducted the focus groups myself. The focus group protocols were
focused on similar themes, but allowed for less limited, specific examples to the research
questions.
Datasets from Secondary Data Collection
There are six secondary sources of quantitative data that have been used for analysis in
the dissertation: (1) the national school level records on education based on the Education
Management Information System (National EMIS data); (2) the national school level records on
the high-stakes School leaving certificate examinations (National SLC data); (3) population and
community characteristics from the Population Census (National Census data), (4) district
records on private school fees and establishment years from Kathmandu and Chitwan (District
private school records), (5) National Living Standards Survey (NLSS) reports, and (6) the
School-Leaving Certificate (SLC) 2004 study.
15 While the parent dataset is not explored fully in this dissertation, the data has been used briefly for descriptive purposes in some of the chapters. For a detailed description of the parent decision-making research design and literature, see Joshi (2013).
54
National EMIS data: The Education Management Information System (EMIS) is used
nationally to produce annual16 reports on national schooling trends (student, teacher and
infrastructure characteristics) on all public and private K – 12 schools. I use the Flash reports that
provide district-level aggregates for national descriptive statistics on student characteristics. I use
the Flash school-level dataset for the quantitative analysis. I used the data to compute another
measure of competition – the private market share in enrollment at the disaggregated local levels
(VDCs and wards). I also use it to define some of the control variables on school efficiency,
teacher characteristics and infrastructure that are used for the regression analysis17 (MoE,
2012b). In the tables and figures, I refer to “Flash reports” and “Flash dataset” to denote the
EMIS data being used for simplicity.
National SLC data: The Office of the Controller of Examinations publishes the school
leaving certificate (SLC) examinations results (high-stakes examination outcomes). In recent
years (since 2062 (2005-06)), they have been producing books with school-level data on the
high-stakes examinations. I manually scanned the data for the research. These books contain
district-level data, and data on the average school-level examination scores in the six compulsory
subjects (English, Nepali, Mathematics, Science, Social Studies, and Health, Population and
Environmental Education); the number of students who appeared in the examination, number of
students who passed the exam (scored over 32%), the number of students who failed (scored less
than 32%); and the number of students who scored in different percentage ranges. These data are
16 The data system was initiated in 2003. However, my discussions with officials suggested that credible data from the dataset are available from the 2007 academic year16. 17 The data collection process is as follows: these data are filled out in paper forms by the school officials twice a year (Flash I and Flash II), and submitted to the District Education Office. The data are then compiled through the use of an online reporting system by appointed school supervisors in each District Education Office. The data are further compiled at the national level by the Department of Education EMIS office and used to produce the Flash I and Flash II annual reports on the education system. The types of data collected include student characteristics, teacher characteristics, school infrastructure, school inputs, and school finances. At the beginning of the year, finance data from the previous fiscal year are collected – for instance, at the beginning of the 2011-12 academic year in April-May, the 2010 fiscal year finance data are collected.

55
used for outcomes analysis and to describe school variations in policy adoption and other
characteristics by academic performance (OCE, 2009; OCE, 2010; OCE, 2011; OCE 2012). In
the tables and figures, I refer to “SLC reports” and “SLC dataset” to denote the EMIS data being
used for simplicity.
National census data: The general level of community awareness and wellbeing are also
likely to affect a host of aspects such as decision for private school entry and pressures on the
public schools to stay competitive. I use data on population growth rate, migrant population and
literacy rates for district-level descriptive statistics. I use village development committee level
disaggregated literacy rates from the 2001 Census (CBS, 2002) for the regression analyses. In the
tables and figures, I refer to these data as “Census Data” or “Census Reports” for simplicity.
District-level records: Data was collected through the district education offices directly
since the national school records did not include information on private school fees and the year
of school establishment. These data were manually entered from hard copy records from district
education offices. These data provide a sense of how private schools have expanded in the two
districts of study, and a sense of the diversity in school fees in the country (DEO, Kathmandu
2012; DEO, Chitwan 2012). In the tables and figures, I refer to the dataset as “District Records”
for simplicity.
National living standards survey data: I utilize various reports that utilize the national
household survey (1995-1996, 2003-04, and 2011-12) to provide household-based information
on education participation rates, household expenditures, and the linkages between poverty and
education. I utilize published reports and some descriptive analysis of the survey data for this
purpose. I refer to the dataset as “NLSS Reports” or “NLSS Data” for simplicity.
SLC study 2004 data: I utilize the nationally representative, comprehensive survey of
institutions, teachers, students, and parents conducted in 2004 to provide some of the baseline
indicators of the national status of policy adoptions (e.g. English medium, coaching classes). I
56
conduct some brief descriptive analysis for this purpose. I refer to the dataset as “SLC study
2004” for simplicity.
Methods
I utilize qualitative and quantitative procedures to answer the research questions posed in
the dissertation. The mixed methods approach allows me to present analysis that focuses on the
representativeness of the competitive experience while at the same time highlighting the
contextual characteristics of the process. I briefly summarize the methods utilized in the
dissertation here, and discuss the techniques in more detail in the respective chapters.
For the qualitative analysis, all of the interviews were transcribed and translated, and
then coded using a structured approach for themes and patterns by research questions in each
chapter (Yin, 2010). I was able to use the principal interviews to compare variations in thematic
emphasis between public and private schools, rural and urban regions, and between districts.
Using the district and local official interviews, I was able to compare rural and urban regions,
and Kathmandu and Chitwan districts. I was additionally able to contrast principal, local
government official, and national level officials’ perspectives on these themes.
For the descriptive analysis, I utilize the relevant national and district-level records from
the Flash reports, the SLC reports, the Census reports, the district records, and the principal
survey. In each chapter, I present a variety of relevant descriptive statistics such as measures of
central tendency, scatter plots, bar graphs, and correlations.
For the quantitative analysis, I utilize a school-level dataset that has been put together
using the principal survey and the Flash dataset, SLC dataset and the Census dataset. I refer to
the dataset as “Combined Quantitative Dataset” in the regression results in the results chapter for
simplicity. The dataset includes data on schooling characteristics, policies, student outcomes, and
community covariates for the 212 public secondary schools in Kathmandu and Chitwan that
were part of the principal survey sample. The variables that are used in the quantitative analysis
57
were finalized after utilizing missing imputation techniques18 and conducting descriptive
analysis. In each chapter, I utilize OLS, logit and ordered logit regression techniques, depending
on whether the dependent variables are continuous, ordered categorical, or binary variables
respectively.
The final chapter on outcomes is the only chapter that conducts longitudinal analysis
using four years of data. In this chapter, I analyze the test score outcomes and enrollment data
using random and fixed effects regressions. I also use instrumental variable strategies on the test
score outcomes data to improve causal inference. The final chapter utilizes two versions of the
Combined Quantitative Datset. One set of analysis is based on school-level data, and referred to
as “Combined Quantitative Dataset – School-level Sample” in the tables. The school-level
sample is equivalent to the sample used in the analysis for Chapters 5, 6, and 7. The other
analysis in Chapter 8 is based on the locality-level, and is the same dataset that has been
aggregated to the locality level. This dataset is referred to as “Combined Quantitative Dataset –
Locality-level Sample.”
18 I utilized predictive mean matching to multiply impute the covariates, which were less than 5% of the sample. Since the data do not change substantially with the imputation, the results without the imputed data points are not presented here.

58
Chapter 4 Figures and Tables
Figure 4.1 Data sources

59
Figure 4.2 Districts of study
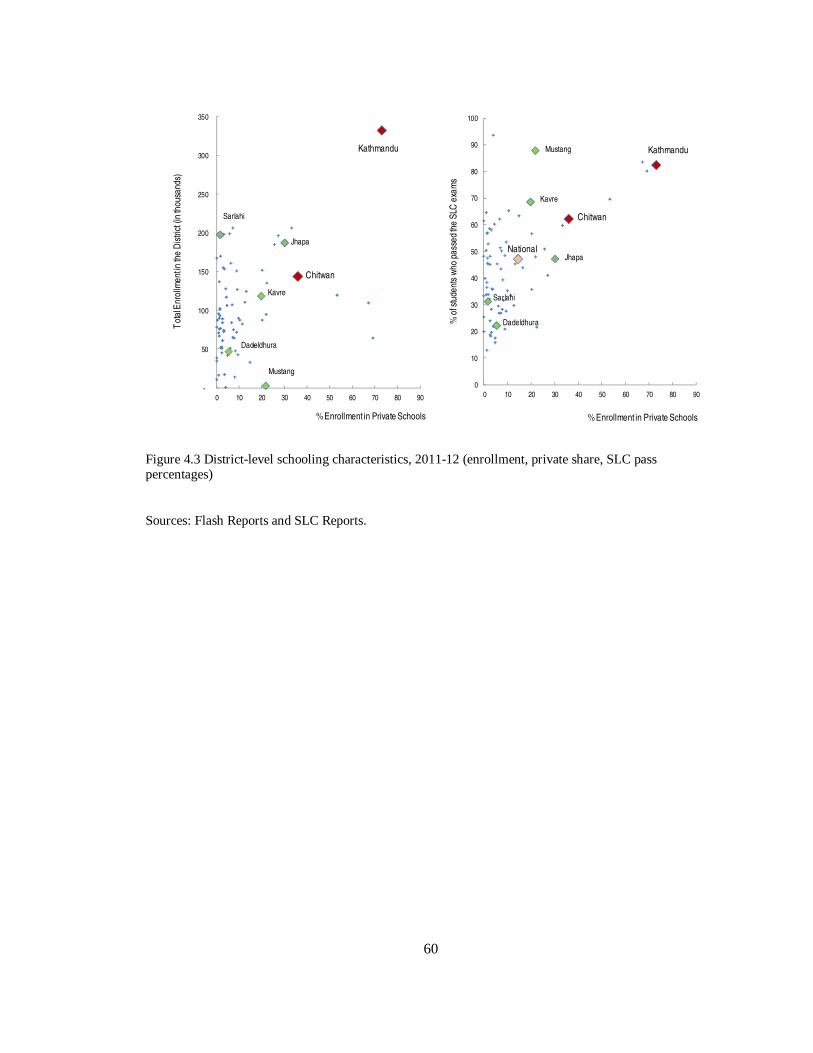
60
Figure 4.3 District-level schooling characteristics, 2011-12 (enrollment, private share, SLC pass percentages)
Sources: Flash Reports and SLC Reports.
-
50
100
150
200
250
300
350
0 10 20 30 40 50 60 70 80 90
Kathmandu
Jhapa
Chitwan
Mustang
Kavre
Sarlahi
Dadeldhura
0
10
20
30
40
50
60
70
80
90
100
0 10 20 30 40 50 60 70 80 90
Kathmandu
Jhapa
Chitwan
Mustang
Kavre
Sarlahi
Dadeldhura
National
Tot
al E
nrol
lmen
t in
the
Dis
trict
(in
thou
sand
s)
% Enrollment in Private Schools % Enrollment in Private Schools
% o
f stu
dent
s w
ho p
asse
d th
e S
LC e
xam
s

61
Table 4.1 Incidence of poverty in Nepal
1995-96 2003-04 2010-11
National poverty rate 41.8 30.8 25.2
Rural 43.3 34.6 26.4
Urban 21.6 9.6 15.5
Development regions Eastern 38.9 29.3 21.4
Central 32.5 27.1 21.7
Western 38.6 27.1 22.3
Mid-western 59.9 44.8 31.7
Far-western 63.9 41 45.6
Ecological belts Mountains 57 32.6 42.3
Hills 40.7 34.5 24.3
Terai 40.3 27.6 23.4
Years of schooling illiterate 50.9 42.0 33.5
5 or less 35.7 28.2 27.0
6 - 7 28.5 23.3 19.5
8 - 10 19.8 8.4 12.9
11 + 11.4 1.6 7.1
Sources: CBS, 2006 and CBS, 2012.
Note: The consumption aggregate based poverty line has been recomputed in 2010-11 given the fact that food and non-food consumption patterns have changed drastically since the poverty line was first estimated in 1995-96.
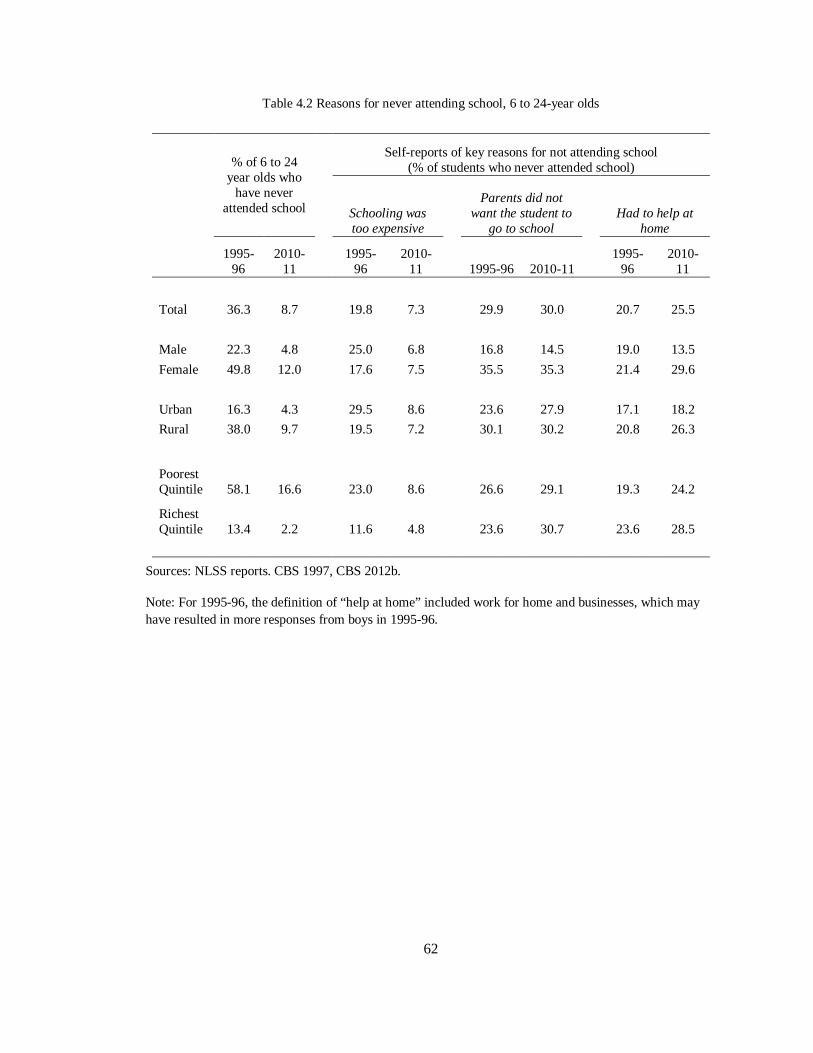
62
Table 4.2 Reasons for never attending school, 6 to 24-year olds
% of 6 to 24 year olds who
have never attended school
Self-reports of key reasons for not attending school
(% of students who never attended school)
Schooling was too expensive
Parents did not want the student to
go to school Had to help at
home
1995-
96 2010-
11 1995-
96 2010-
11 1995-96 2010-11 1995-
96 2010-
11
Total 36.3 8.7 19.8 7.3 29.9 30.0 20.7 25.5
Male 22.3 4.8 25.0 6.8 16.8 14.5 19.0 13.5
Female 49.8 12.0 17.6 7.5 35.5 35.3 21.4 29.6
Urban 16.3 4.3 29.5 8.6 23.6 27.9 17.1 18.2
Rural 38.0 9.7 19.5 7.2 30.1 30.2 20.8 26.3
Poorest Quintile 58.1 16.6 23.0 8.6 26.6 29.1 19.3 24.2
Richest Quintile 13.4 2.2 11.6 4.8 23.6 30.7 23.6 28.5
Sources: NLSS reports. CBS 1997, CBS 2012b.
Note: For 1995-96, the definition of “help at home” included work for home and businesses, which may have resulted in more responses from boys in 1995-96.

63
Table 4.3 Self-reports of key reasons for dropping out of school, 6 to 24-year olds (% of respondents who had dropped out of school)
Had to help at
home Too expensive Poor academic
progress Parents did not
want it
2003-
04 2010-
11
2003-04
2010-11
2003-04
2010-11
2003-04
2010-11
Total 26.8 22.0
11.5 6.5
31.6 24.6
8.5 7.4
Urban 23.1 18.1
15.7 7.0
33.4 23.0
6.1 5.4
Rural 27.5 23.0
10.7 6.3
31.3 25.0
8.9 7.9
Poorest Quintile 27.1 27.6
19.4 11.3
29.3 18.2
7.5 10.0
Richest Quintile 22.7 17.1
8.9 3.9
33.3 25.8
7.0 6.2
Sources: NLSS reports. CBS 2004, CBS 2012b.

64
Table 4.4 Population characteristics of the study districts
Annual
Population Growth rate (2001-11)
Population density
(sq. km.) (2011)
Total population
(2011)
% absentee population
(2011)
Average household
size (2011)
Literacy rate (can read and
write, six years and
older) (2001) Mustang -0.82 4 13, 799 10.7 3.96 51.2 Dadeldhura 1.15 92 141, 543 8.3 5.12 47.6 Chitwan 1.83 255 566, 661 8.6 4.27 64.3 Kavre 0.11 279 389, 959 3.7 4.5 53.3 Sarlahi 1.90 611 768, 649 2.7 5.49 32.9 Jhapa 1.64 505 810, 636 9.9 4.3 63.7 Kathmandu 4.76 4408 1.74 mill 5.6 3.7 77.2 Nepal 1.4 181 26.6 mill 7.1 4.7 38.0
Sources: Census Reports, 2001 and 2011.
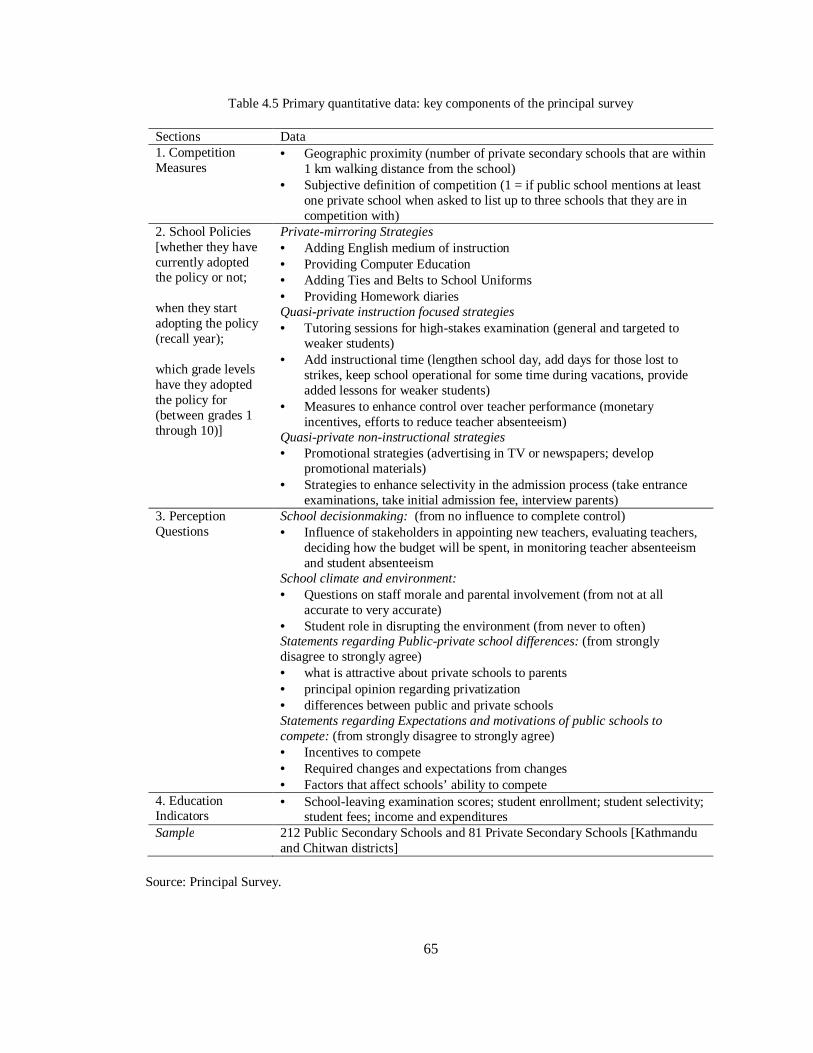
65
Table 4.5 Primary quantitative data: key components of the principal survey
Sections Data 1. Competition Measures
• Geographic proximity (number of private secondary schools that are within 1 km walking distance from the school)
• Subjective definition of competition (1 = if public school mentions at least one private school when asked to list up to three schools that they are in competition with)
2. School Policies [whether they have currently adopted the policy or not; when they start adopting the policy (recall year); which grade levels have they adopted the policy for (between grades 1 through 10)]
Private-mirroring Strategies • Adding English medium of instruction • Providing Computer Education • Adding Ties and Belts to School Uniforms • Providing Homework diaries Quasi-private instruction focused strategies • Tutoring sessions for high-stakes examination (general and targeted to
weaker students) • Add instructional time (lengthen school day, add days for those lost to
strikes, keep school operational for some time during vacations, provide added lessons for weaker students)
• Measures to enhance control over teacher performance (monetary incentives, efforts to reduce teacher absenteeism)
Quasi-private non-instructional strategies • Promotional strategies (advertising in TV or newspapers; develop
promotional materials) • Strategies to enhance selectivity in the admission process (take entrance
examinations, take initial admission fee, interview parents) 3. Perception Questions
School decisionmaking: (from no influence to complete control) • Influence of stakeholders in appointing new teachers, evaluating teachers,
deciding how the budget will be spent, in monitoring teacher absenteeism and student absenteeism
School climate and environment: • Questions on staff morale and parental involvement (from not at all
accurate to very accurate) • Student role in disrupting the environment (from never to often) Statements regarding Public-private school differences: (from strongly disagree to strongly agree) • what is attractive about private schools to parents • principal opinion regarding privatization • differences between public and private schools Statements regarding Expectations and motivations of public schools to compete: (from strongly disagree to strongly agree) • Incentives to compete • Required changes and expectations from changes • Factors that affect schools’ ability to compete
4. Education Indicators
• School-leaving examination scores; student enrollment; student selectivity; student fees; income and expenditures
Sample 212 Public Secondary Schools and 81 Private Secondary Schools [Kathmandu and Chitwan districts]
Source: Principal Survey.
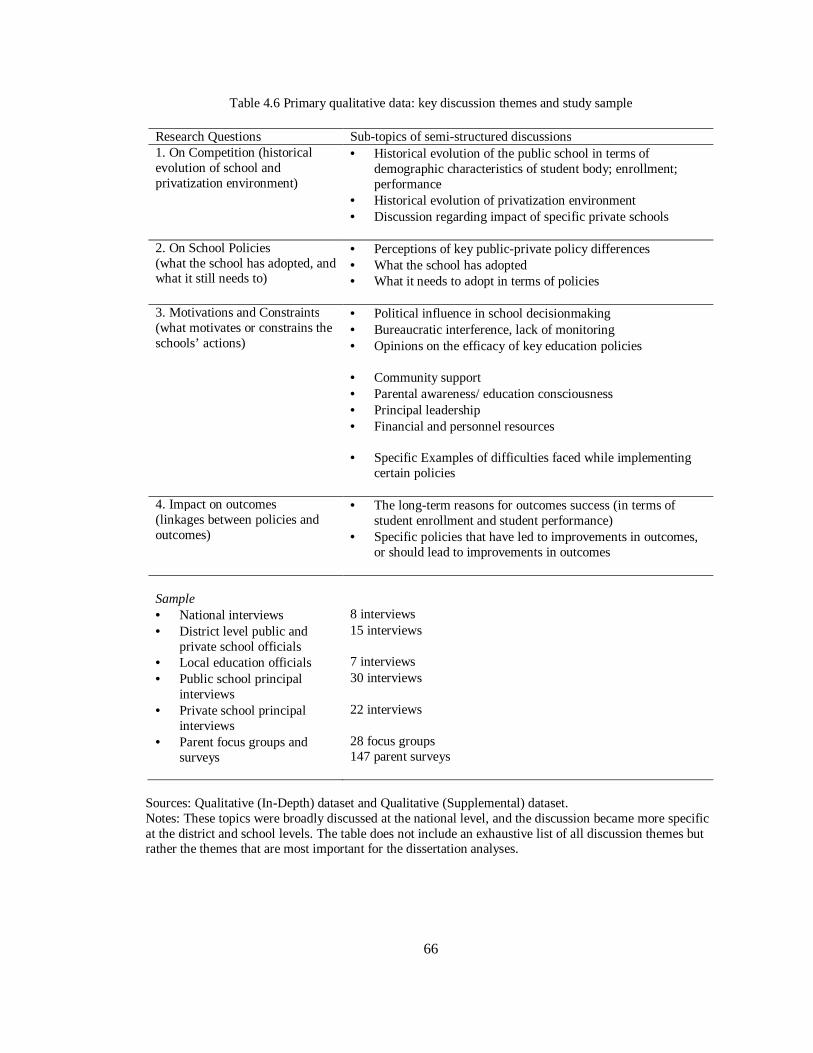
66
Table 4.6 Primary qualitative data: key discussion themes and study sample
Research Questions Sub-topics of semi-structured discussions 1. On Competition (historical evolution of school and privatization environment)
• Historical evolution of the public school in terms of demographic characteristics of student body; enrollment; performance
• Historical evolution of privatization environment • Discussion regarding impact of specific private schools
2. On School Policies (what the school has adopted, and what it still needs to)
• Perceptions of key public-private policy differences • What the school has adopted • What it needs to adopt in terms of policies
3. Motivations and Constraints (what motivates or constrains the schools’ actions)
• Political influence in school decisionmaking • Bureaucratic interference, lack of monitoring • Opinions on the efficacy of key education policies
• Community support • Parental awareness/ education consciousness • Principal leadership • Financial and personnel resources
• Specific Examples of difficulties faced while implementing
certain policies
4. Impact on outcomes (linkages between policies and outcomes)
• The long-term reasons for outcomes success (in terms of student enrollment and student performance)
• Specific policies that have led to improvements in outcomes, or should lead to improvements in outcomes
Sample
• National interviews 8 interviews • District level public and
private school officials 15 interviews
• Local education officials 7 interviews • Public school principal
interviews 30 interviews
• Private school principal interviews
22 interviews
• Parent focus groups and surveys
28 focus groups 147 parent surveys
Sources: Qualitative (In-Depth) dataset and Qualitative (Supplemental) dataset. Notes: These topics were broadly discussed at the national level, and the discussion became more specific at the district and school levels. The table does not include an exhaustive list of all discussion themes but rather the themes that are most important for the dissertation analyses.
67
CHAPTER 5
THE EXPERIENCE OF COMPETITION
Abstract
This chapter addresses how public schools experience competition from private schools
in the Nepal context. I argue that experiencing competition is a necessary starting point for
public schools to feel the need to initiate reforms to compete with private schools. I utilize
quantitative and qualitative data to elucidate how the experience of competition is linked to the
extent of privatization, school and community characteristics and principal perceptions. I find
that there are key temporal and demographic dimensions that determine the public school’s
experience of competition and their ability to respond with reforms. Public schools were shielded
from experiencing substantial competitive pressures throughout the early phase of privatization
(1980s and 1990s) because of growing populations and mass education expansion. Competitive
pressures on public schools intensified in the 2000s due to rapid private sector growth, public
school enrollment declines, and an accountability mechanism tying financing to enrollment.
However, unregulated privatization allowed for long-term sorting of higher SES students out of
public schools, which resulted in the stigmatization of urban public schools. The most negatively
affected public schools are unlikely to be able to compete with private schools regardless of the
severity of newly established accountability pressures. Moreover, the analysis of principals’
subjective experiences suggests that despite growing privatization, many public school principals
do not view private schools as competition because they may believe that private schools
function in separate, parallel systems or that private schools do not really provide better quality.
Since the historical evolution in demographic trends and public school stigmatization is a
phenomenon that is likely to be found in other developing countries, policymakers need to be
mindful of the role played by stigmatization of public schooling in how public schools can react
to accountability pressures and compete.
68
Introduction
I describe the circumstances under which public schools experience competition in this
chapter. I argue that public schools need to sense competitive pressures in order to feel the need
to respond with policy improvements. I address the following research question in the analysis:
How do public schools experience private competition? I first provide a thorough account of
objective measures that would determine competition, such as the number of private schools in
their locality and the accountability mechanisms that put incentivize public schools. I then
highlight the subjective experience of competition, such as the principal perspectives on their
school’s historical experience with competition, and the characteristics of the public schools that
identify private schools as competitors.
I will show that private schools have grown rapidly in the past decade, due to higher
parental demand and ease of market entry into the private sector. I will then argue that public
schools have recently begun to face more pressures to compete with private schools because they
face enrollment declines and are now funded by a new accountability system which ties
financing to enrollment. However, I will also show that principal perspectives indicate a more
complicated experience of competition. I find that the public schools’ historical experiences with
privatization vary by the local context, and that stigmatization of public schooling is more of an
issue in urban areas. When asked to identify competing schools, public school principals selected
public schools that have higher enrollments than their school, and only about half of them
mentioned nearby private schools. Over two-thirds of the public schools only mentioned other
public schools as being among the best schools in the district. The public schools that were
identified as the best schools were more selective, more expensive, and had higher test scores
and higher enrollment than the sample schools. The fact that not all public schools view private
schools as competition or as among the best schools in their district may indicate a lack of
private schools in their proximity, the belief that private schools are governed by different
69
regulatory mechanisms, or principals’ assessment that private schools really are no better in
terms of quality.
Conceptual Framework and Research Questions
The literature and conceptual framework demonstrated that a multi-dimensional
approach would be required to comprehensively describe the experience of competition. The
quantitative literature suggests that public schools are expected to feel competitive pressures if
there is a high private share of enrollment in their region (private market share) or if they are
located near more private schools (geographic proximity). However, as discussed in the
conceptual framework, there are a variety of initial policy conditions, locality and school
characteristics that may obscure how the public schools actually experience competition,
regardless of the number of private schools around them. To reiterate, some of these conditions
include whether the districts and the school are suffering from enrollment declines, whether they
are facing accountability pressures, and the characteristics of the students who are leaving for
private schools. For instance, a school that is located in a context with overcrowding and teacher
shortages may welcome the addition of new schools to abet their enrollment pressures rather than
perceive them as a competitor that requires a systematic response. The literature posits that there
is a need to conduct in-depth, qualitative analysis in districts and schools to gain a thorough
understanding of how schools have experienced competition in their local education markets.
Despite the growth in private schooling in Nepal, there is very little detailed descriptive
work that explains how private schools have expanded and diversified. Additionally, the research
on Nepal has primarily focused on highlighting public-private differences, effects on public
school outcomes, or describing the dysfunction in the education sector (Caddell, 2007; Carney
and Bista, 2009; Thapa, 2011). Consequently, there is scant research that approaches the
question from the public school perspective, illuminating how public schools have been affected
by competition through statistical indicators or officials’ own perspectives.
70
Bearing the framework and research gap in mind, the chapter addresses the following research
questions:
(1) What is the extent of private competition experienced by public schools in Nepal?
(2) What are the other pressures faced by public schools that mediate their experience of a
competitive threat?
(3) How do public school principals view their schools’ experiences with privatization?
(4) What are the characteristics of the schools that public schools identify as competition or
as the best schools in the district?
Data and Methods
Data
For the analysis, I triangulate data from national living standards surveys, school-level
records, district-level records on private schooling, a survey of public school principals, policy
documents, and interviews with government officials and school principals. Details on the
primary and secondary data are presented in Chapter 4: Data and Methods19. A summary table of
data sources used in the chapter is presented in Table 5.120.
Measures of Competition
The main objective measure used to describe the growth of private schooling in the
descriptive analysis is the market share of private schools in total enrollment. I utilize the private
market measure at the national level to show district level variations, and within the districts of
study to show intra-district variations (Flash Dataset). I additionally utilize other objective and
subjective measures of competition that were based on the primary survey data collection to
19 Please refer to Figure 4.1 in the Chapter for a Data Map. 20 The primary quantitative data is referred to as “Principal Survey” and the qualitative data is referenced as “Qualitative (In-Depth) Dataset” and “Qualitative (Supplemental) Dataset” in the tables and figures for simplicity.
71
more comprehensively capture the extent of competition faced by the public secondary schools
of Kathmandu and Chitwan (Principal Survey).
The geographic proximity measure of competition was defined as follows: the school
principals were asked to mention the number of private secondary schools21 that were located in
close proximity (within a one kilometer walk) of the public school22. The variable represents a
well-known geographic proximity competition measure that is used in the literature, and it was
adopted from the 2004 Nepal High-Stakes School-Leaving Certificate (SLC) Study principal
questionnaire (MoES, 2005).
I also utilize two measures to capture the subjective experience of competition. The first
subjective measure of competition is a categorical variable that equals 1 if the school principal
mentions at least one private school when prompted to list three competing schools. A second
subjective measure used for the analysis is a categorical variable that equals one if the school
principal mentions at least one private school when prompted to list the three best schools in the
district. I define these measures as the “competing” school measure and the “best” school
measure respectively. I call the two “subjective” measures since the measures should capture the
school leadership’s perception of competition and high quality schooling. These subjective
measures were designed with reference to Elacqua, Schneider and Buckley (2006)’s approach to
analyzing parent decision-making23. I argue that asking principals to list the best or competing
21 Another competition measure was created using the total number of primary, lower secondary and secondary schools. This was a slightly different competition measure but it did not alter the results substantively. 22 The category cut-offs of low, medium and high competition were determined separately for the two districts since the smaller district had far fewer private schools in proximity, and because the relative experience of competition is likely to be district specific. 23 Elacqua et al. (2006) ask parents to list three schools that they were considering for their children. The researchers argue that asking parents to explicitly mention the schools that they were considering reduces their tendency to provide socially normed responses, which would be expected if one asked them to rank whether school academics or demographics were more important in determining school choice. The authors instead utilize the question on school names to later examine the parent’s true preferences for

72
schools is likely to reduce their tendency to give a socially normed response on privatization,
which could have been expected if I had directly asked them if they thought private schools were
competition or among the best schools in the district.
Empirical Strategy
To describe the extent and evolution of privatization in the country, Research Question
1, I utilize reports from the national living standards surveys, school records and high-stakes
results databases (referred to as NLSS data, EMIS data and SLC data respectively in Chapter 4).
I provide descriptive statistics on principal and parent perspectives on the reasons private schools
are attractive to provide an understanding of why there has been substantial private sector
growth. I detail the privatization growth in the two districts in Nepal using district records on
private schooling characteristics, the policy documents on regulations governing privatization,
and interviews with public and private school officials. I conclude the section using the school
survey data on competition to show that in these two districts, the public schools are currently
surrounded by private schools, and that most regions have high private market share.
To describe the factors that mediate the public schools’ experience of a competitive
threat, Research Question 2, I utilize interviews with education officials, national school-level
records on enrollment, and policy reports to document the evolving policy and competition
climate. To describe how public schools have experienced private competition, Research
Question 3, I utilize interviews with principals, and the survey items on subjective competition
measures. I first present a historical account using interviews with all of the public school
principals in the seven districts of study to analyze any discernible patterns in the historical
evolution of public schools’ experience of private competition. These interviewed public schools
provide regional variation as they are located in urban, semi-urban and rural regions in diverse
demographics or academic quality by matching the mentioned schools to national records on school characteristics. I decided to use a similarly posed question to study whether public school principals thought they were competing with private schools.

73
districts. Finally, to address Research Question 4, I analyze the characteristics of schools that are
identified as competition and the characteristics of the public schools that select private schools
as competition24.
Models
I model competition measures as a function of school and community characteristics to
understand the characteristics of the public schools that are more likely to experience subjective
or objective competition. I estimate the association between the competition measures and the
school and community characteristics in the two districts of study using the following set of OLS
regressions:
Cobj = α + γP + δZ + ε (Model 1)
where Cobj represents the continuous competition measures, geographic proximity and private
market share, P represents a vector of the explanatory variables, and Z represents a vector of
school characteristic controls.
Then, I model subjective competition measures as a function of a categorical
transformation25 of the geographic proximity measure and other explanatory variables to run the
following logistic analyses:
Csubj = α + Cthirds2 + Cthirds3 + γP + δZ + ε (Model 2)
where Csubj equals 1 if the public school identifies at least one private school as a “competing”
school or “best” school in the district, Cthirds2 and Cthirds3 represents the medium and high
competition as measured in terms of geographic proximity (low competition is the omitted
24 I also analyze the public schools that have been identified as “competing” or “best” schools in more detail. Some brief analysis on these characteristics is presented in Appendix 5.1. 25 The continuous variable, the number of private secondary schools within one kilometer of the school, was converted to a categorical variable of low, medium and high competition for use as an explanatory variable in Model 2. The category cut-offs of low, medium and high competition were determined separately for the two districts since the smaller district had far fewer private schools in proximity, and the relative experience of competition is likely to be district specific.
74
category), P represents a vector of the explanatory variables, and Z represents a vector of
controls.
The summary statistics of the competition measures used in the analysis are presented in
Table 5.2. The explanatory and control variables, including school and community
characteristics and principal perceptions, used in the OLS and logistic analysis are listed in Table
5.3.
As discussed in the Chapter on Data and Methods, the combined quantitative analysis
dataset, referenced in the results tables as the “Combined Quantitative Dataset”, is based on the
Principal Survey, Flash dataset, SLC dataset, and the Census dataset.
Results
What is the Extent of Private Competition Experienced by Public Schools in Nepal?
Evolution of a national public-private two-tiered education system
Globally, there are a variety of school arrangements in terms of financing and
management of school activities that can be classified as falling within the public-private
schooling continuum (Berends, Springer, Ballou, and Walberg, 2009; Chakrabarti and Petersen,
2009). In the context of Nepal, public and private schooling have undergone a significant
evolution. In the early years of education access (mid-1950s), Nepal’s schooling system used to
be entirely community funded and operated. Many of these early “private” schools were
supported with the leadership of community leaders and the in-kind and in-cash contributions of
the local communities. These developments are probably comparable to initial schooling access
in many countries, including the initial development of the U.S. education system in the 17th and
18th centuries (Tyack, 1974). In the 1970s, a decade of nationalization efforts successfully gave
rise to the public school concept. Private schools were re-allowed to operate starting in the early
1980s, and truly expanded after the mid-1990s.

75
The bulk of the schools that are currently labeled as public or “community” schools,
over 29,000 schools, are either fully or partially funded by the public sector. They vary in the
extent of the district bureaucracy’s control over school management decisions. Most of the other
schools, over 5000 schools, operate as for-profit enterprises and are called “institutional” schools
(MoE, 2012a). These schools are jointly registered as corporations with the Business registration
bureau and are approved by the District Education Office. In addition, these private schools pay
a reduced corporate tax rate to the government. Due to the relatively simple private schooling
regulatory structure in Nepal, private school entry is largely determined by market potential.
The development of a dual public-private education system has not gone unnoticed in
Nepalese politics. In the early 2000s during the Maoist insurgency in Nepal, the private sector
became a central political concern (Caddell, 2007). In the insurgency period, private schools
were forced to reduce their school fees and change their curriculum, and there were routine calls
for banning private schooling altogether. After the Maoist government entered the mainstream,
private schools have continued to receive threats. However, it is unlikely that there will be an
outright ban on private schooling. The current situation suggests that private schools have
continued to thrive despite persistent political pressures; and there does not seem to be much
movement to formally improve the relationships between the public and private sectors (Caddell,
2007; Carney and Bista, 2009; Thapa, 2011).
Extent of privatization. Privatization has been documented to be a rapidly growing
global phenomenon, including in developing countries in Asia and Africa. Based on World Bank
economic classifications and UNESCO statistics, Nepal is one of 39 low or lower-middle income
countries (out of 78 with available data) where private schools educate more than 10% of the
children in primary schooling (UNESCO, 2012).
There has been significant growth in private school adoption, albeit with substantial
urban-rural and economic disparities throughout Nepal. The living standards survey based data

76
displayed in Table 5.4 show that between 1995-96 and 2010-11, the percentage of children in
primary schooling grades (grades 1 through grade 5) attending private schools increased from
5.9% to 20.3% nationally. The private school participation rates divided by expenditure quintiles
indicate that private schooling costs are prohibitive for most of the poor. For instance, in 2010-11
over 70% of the top quintile children attended private primary schools, while only 2% of the
bottom quintile attended private primary schools. There are stark differences in private school
adoption by rural and urban regions, and by ecological belts. The differences between
socioeconomic groups in participation rates are not surprising since user fee data computed from
household expenditures, displayed in Table 5.5, show that the per-student household
expenditures were over ten times higher in private primary schools and over six times higher in
private secondary schools compared to public schools in 2003-04. Most families in the bottom
quintiles of Nepal would not be able to afford private schooling since on average the costs of a
primary secondary school are about two-thirds of the per-capita expenditures of an average
household.
Data from the census of all schools in Nepal confirm these trends and disparities. As
displayed in Figure 5.1, the available national school records indicate that between the 2003-04
and 2011-12 academic years, the private share of total enrollment in primary and lower
secondary grades (Grade 1 through Grade 10) has grown from about 11% to 16% of total
enrollment. The data indicate that private adoption in urban areas is at least five times greater
than in rural areas. District-level data, shown in Table 5.6, from the seven study districts suggests
that private schooling has grown across the board in recent years26.
26 There are a few caveats regarding data quality in utilizing these district-level trends data. Due to the limited oversight on private schools, it is possible that private schools may have been in operation but that their information was not recorded each year. Secondly, some anecdotal discussions with officials and experts has suggested that there may be duplication in student records – for instance, enrolling the same child in two public schools to get government scholarship benefits; or enrolling a child in a public school but educating them in a private school. Finally, the quality of records may vary substantially across
77
Private sector growth and fee-based diversification in Kathmandu and Chitwan. The
detailed data from Kathmandu and Chitwan confirm that there has been substantial growth in
private market growth and some diversification in school fees. The number of private schools
has expanded particularly strongly after the advent of democracy in the early 1990s, as
demonstrated in Figure 5.2. These data suggest that while 100 schools opened between 1980 and
1990, an additional 200 schools opened in the 1990s alone. What is striking is the fact that there
continues to be a growth in the number of private schools even in the past decade. As a result, as
shown in Figure 5.3, most of the localities in Kathmandu and Chitwan have seen a growth in the
private market share of enrollment between 2006-07 and 2011-12.
It is also important to analyze whether there is any diversity of private schooling options.
In Nepal, the main advantage of public schools is that they are supposed to be the cheaper
alternative. While there has been a historical presence of elite private schools in all of the study
districts the availability of cheaper options would make private schools more desirable to lower
income families. Indeed, a common refrain from all officials, parents and principals was that
even poor people had started sending their children to private school. The first grade school fee
data described in Figure 5.4 from Kathmandu and Chitwan confirm that newer private schools,
established between 2000 and 2012, are relatively more affordable than those that were started
earlier. The fee diversification is clearer in the larger Kathmandu market. The higher fees of
older private schools are likely to be a result of reputation and school longevity. Still, while the
newly established schools are more affordable than older private schools, the fees are still not
comparable to the school fees of public schools. Most public schools do not take any fees in
Grade 1. Furthermore, as shown in Table 5.7, their fees are very low compared to private school
fees even in Grade 9 though they are allowed to take fees at the high school level.
districts and the prevalence of private schooling may be much higher than documented in the official statistics.

78
These descriptive statistics indicate that there is robust private sector growth and
substantial variation in private market share penetration in the country. The detailed data from
Kathmandu and Chitwan confirm that there has been significant growth in private market share
and some diversification in school fees.
Implications for public school’s experience of competition. Clearly, private schools have
grown significantly since the early 1990s, particularly in the two districts of study. The growth in
private schools should increase the urgency felt by public schools to try and attract parents. The
documented unabated growth in private schooling suggests that public schools are likely to be
surrounded by private schools, and to be located in regions where private schools have gained
significant market share. The higher density of private schools is confirmed by data on
competition measures, as shown in Table 5.2. Due to higher population density and higher
privatization rates, the public schools in Kathmandu have a higher number of private schools in
close proximity than in Chitwan. Only 15% of public schools in Kathmandu and 35% of public
schools in Chitwan report that they have no private secondary schools that are located within a
one kilometer walk from their school. In Chitwan, the public schools that have the highest
number of private schools around them have between three to nine private secondary schools
around them; while in Kathmandu the range for the highest thirds of competition is between six
and 25 private secondary schools. Similarly, most of the public schools in Kathmandu are
located in regions where private schools have taken up a significant portion of the market share.
On average, the Kathmandu public schools were located in regions where private schools had
taken up 36% of market share while the Chitwan public schools were located in regions were
private schools had taken up 25% of market share.
The linear regression results of these objective competition measures as a function of
school and community covariates, displayed in Table 5.8, confirm that the schools that face a
higher number of private schools in geographic proximity or higher private market share based
79
competition are more likely to be located in Kathmandu district and communities with higher
literacy. Higher private market share is also logically associated with population growth. Public
schools that are located in higher private market share are also less likely to have a computer
room or have a toilet for teachers, which signal worse infrastructure conditions.
Reasons for private school growth
Quality and sorting. The growing demand for private schools in Nepal is widely
attributed to better quality provided by private schools as well as the expected increase in social
status attached to attending private schooling. There are significant public-private differences in
performance in the main high-stakes examination taken at the end of 10th grade, the SLC
examinations, as displayed in Figure 5.5. In 2011-12, over 85 % of the private school students,
and a mere 36 % of public school students, passed the examination. The public sentiment has
grown strongly pro-private in recent years due to the growing distrust with public sector
provision.
As shown in Table 5.9, the data on principal and parent perspectives from Kathmandu
and Chitwan districts confirm that parents and principals are in agreement that private schools
are attractive to parents because they teach in English medium of instruction, better monitoring
of teachers, and have better high-stakes examination results. Private school parents and
principals disagree that private schools are attractive due to their potential to indicate higher
social status, while public school parents and principals agree that social status is one of the key
reasons for private school attraction. In interviews, public school officials discussed how public
schools were in a difficult position since they had to counter negative perceptions and educate
more disadvantaged populations, such as girls and dalit (disadvantaged group) students. Indeed,
girls and dalit students are a much higher share of the public school population, as shown in
Figure 5.6. The national demographic differences by rural and urban regions are even more
telling – as shown in Figure 5.7, while over 40% of all urban area children attend private schools,
80
only 16% of dalit children attend private schools. Public school principals argued that the
systematic sorting of students over decades has led to stigmatization of public schooling, and that
selecting public schools for your children would result in a loss of social status and peer
derision27. To quote a public school principal from the remote district of Dadeldhura:
“If you talk about other teachers, they see that the neighbors are sending their children to private school so they have to do the same for social prestige. I have to send my children to private school just to survive in society! In the villages they may admit their children in the public schools but in the district headquarters they are enrolling them in the (private) boarding schools.” (personal communication, September 4 2011) Migration impacting private schooling demand and supply. Private sector growth is
additionally aided by the strong emphasis on migration for employment, which is increasingly
common in Nepal due to the lack of domestic employment opportunities and high political
instability (CBS, 2011). There is high demand for private schooling due to the fact that private
schools teach in English medium and are likely to be more focused on the high stakes
examination results. Parents link these characteristics to the likelihood of migration and the ease
with which their children would be able to adapt to foreign cultures. The fact that a substantial
portion of the population receives remittances also means that private school fees are more
affordable to more families now than they used to be in the past few decades. On the supply side,
private schools are likely to be viewed as one of the means to make a profitable investment in a
context that has very limited smaller scale investment opportunities.
Lack of regulatory mechanisms governing private entry and functioning. Private schools
are able to flourish in Nepal due to a lack of implementation and monitoring of regulations
governing private schooling, rather than the lack of regulations themselves. Indeed, there is a
detailed listing of the rules and regulations governing private school entry and functioning,
which include requirements on documentation, finances, user fees, and scholarships that have to
27 A more detailed discussion on the extent and consequences of stigmatization of public schooling are discussed in Chapter 7: the factors that mediate the response to competition.

81
be provided to disadvantaged groups28. However, since private schools do not receive any
funding and get very little monitoring support from government offices, they have few incentives
to strictly follow the rules. In a large private schooling market like Kathmandu, which has over
1000 private schools and 300 public schools, the overwhelmed district education office is
unlikely to be able to effectively monitor private schools.
The majority of the government officials interviewed mentioned that they did not believe
that private schools were meeting the government requirements on equity-enhancing
scholarships or fee restrictions. The regulations on private schooling clearly state that 10% of the
private school students have to be students from disadvantaged populations who need to be
provided with special scholarships. These government officials argued that private schools were
instead providing scholarships to their relatives or figuring out other ways to distribute the
scholarship without abiding by government regulations. While the issue of dalit scholarships was
not discussed by most private school principals, one of the principals I interviewed admitted that
her school could not admit dalit students on scholarships because they typically had much poorer
education performance. Also, while there are careful limits placed on the monthly and annual
fees that schools can take, district officials in charge of private school administration
acknowledged that a few private schools in Kathmandu routinely bypass these regulations, and
one of their jobs is to investigate and reprimand those schools. Moreover, the majority opinion
among national officials was that as long as the parents were cooperative, there should not be
overtly strict regulations governing private school fees.
Principals from both private and public schools consistently brought up the issue that the
government rarely utilized enrollment and population data to determine the need for new schools
in any region before granting approvals. For instance, one of the rules for opening a private
school is that schools need to get a no objection letter signed by at least two nearby schools.
28 See a detailed list of requirements and regulations governing private schools in Appendix 5.2.
82
Given the high density of private and public schools in Kathmandu district, school principals
mentioned that private schools typically do not face any issue with being able to get at least two
schools to agree with their entry into the market. The loophole in the regulation enabled schools
to open up despite the fact that a portion of the community or public schools did not see the need
for new school entry.
One of the consequences of loose monitoring is the existence of unregistered schools in
some districts, which means that the official records may underestimate the existing number of
private schools. For instance, a district education official in the Sarlahi district, a populous
district bordering India, frankly mentioned that there were plenty of private schools that were not
registered officially because these private schools did not want to have to abide by district
regulations. The district officials had sent the schools letters warning that if they did not register
then their students would not be able to take the high-stakes examinations. A principal of one of
the private schools I visited in Sarlahi mentioned that they were part of the tradition of unofficial
private schools in the district:
“We do not have permission to teach up to 10th grade level. This is an old tradition in the district that the students of class 9 and10 are registered in some public school and come to private schools to study in English medium. They sit in and appear in English medium examinations from some other schools but they are our product…
But your school name will not be mentioned anywhere in the records?
But the school is noted in our locality and it is known that it operates as a tuition center in the district. Many schools in the past operated like this and we also did the same.” (personal communication, August 26 2011) Thus, these findings confirm those from previous studies (Caddell, 2007; Carney and
Bista, 2009) that the growth in private schooling in Nepal has been aided by the lack of
implementation of regulatory mechanisms controlling the number of schools established, and the
quality of schooling they need to provide.

83
Who runs and teaches in private schools? The loose private entry into the education
system has also affected who owns and operates private schools. Some of the government
officials I interviewed noted that private school rulings do not specify any professional
requirements for private school ownership and management. While there were no available
national records on who establishes private schools, the majority of the government officials and
principals suggested that a substantial portion of the private school owners were previously
public school teachers who were looking to secure permanent employment as they were unlikely
to get hired as permanent teachers in public schooling. In fact, the majority of the older private
school principals who participated in this dissertation had backgrounds as public school teachers.
Many public school principals and government officials argued that the owners of
schools that were established since the mid-1980s were differently motivated than the school
owners who helped established community private schools with the nationalistic intention of
providing education to the masses. School and government officials suggested that there may be
a growing group of investors with limited education affiliation who are currently operating
private schools. A few of the government officials and principals also claimed that many
members of the Maoist leadership, who are politically pro-public, have heavily invested in
private schooling themselves. One indicator that private schools are functioning more like
businesses than social institutions can be seen from the extent of ownership turnover in the large
(1000 school) Kathmandu market. Official district records from the Kathmandu district show
that in the past two years alone there have been over 150 different requests for private school
ownership changes.
The private market appears to function somewhat differently in Chitwan district. Private
school principals and private schooling board officials suggested that the majority of private
schools in Chitwan were jointly founded by multiple shareholders, such as teacher groups, and
comprise of unemployed or frustrated teachers or personnel qualified in education. In addition,
84
given the district’s more socialist orientation, the school principals condemned what they found
to be an aggressively profit-motive orientation in Kathmandu. They additionally suggested that
private school fee structures were strictly monitored and regulated by politically motivated actors
in Chitwan. Discussions in the five other districts confirmed that many of the people engaged in
private schooling were former public school teachers.
The analysis further revealed that a main motivation for opening private schools was to
stem the outflow of students from the district into districts or countries that had better economic
prospects. For instance, in the case of Chitwan, private schools were established in the main city
region of Bharatpur in an attempt to limit the migration to Kathmandu, the capital; while private
schools in rural regions were interested in limiting the migration to Bharatpur. Similarly, in the
sparsely populated mountainous Mustang district, the first private secondary school in the region
was established to stop the flow of middle and upper class students to the nearby major city,
Pokhara. Importantly, private school owners are able to take advantage of the high
unemployment rates of educated youth, as private schools can pay low wages and short term
contracts to large population.
In summary, private schools have grown substantially over the past two decades in the
nation, and newer schools are likely to be somewhat cheaper than more established schools.
Private schooling growth has been fueled by demand side factors, such as the perception of better
schooling in private schools, the social stigma attached to public schools, and the growth in the
ability to pay for private schooling with migrant remittances. On the supply side, private schools
are attractive to entrepreneurs since private schools are easy to open, have a ready supply of
available employees, loosely regulated, and have very limited direct government control, which
makes them a lucrative and stable investment opportunity.
What are the Policy, Community and School Characteristics that Mediate the Public
Schools’ Experience of a Competitive Threat?

85
Population and enrollment trends
The public school’s experience of competition depends on the population growth in the
district. The argument behind analyzing population growth is that if the population is growing,
then there should be less incentive to compete since arguably all public and private schools could
thrive and share in the expanding enrollment. Data from the latest Population Census indicate
that the study districts, particularly Kathmandu, have grown substantially between 2001 and
2011. As shown in Figure 5.8, the districts with the higher population growth rates between 2001
and 2011 are also the ones that have a fairly high private share in enrollment. It is not surprising
to find that Kathmandu experienced a massive growth in population, as it is the financial and
political capital of the country. Reports have documented that in the period of civil unrest, there
was substantial internal migration from the conflict-torn more remote districts to Kathmandu
(World Bank, 2011). These data do not preclude the fact that public schools could have also
benefited from the growth in population – but rather it more clearly suggests that private schools
are motivated by the potential for higher market share.
Despite the population growth, public schools are rapidly losing enrollment, especially
in urban areas. In interviews, many of the public school principals suggested that public schools
had recently registered strong declines in enrollments, and that the enrollment decline was worse
in primary schooling (grades 1 through 5). The main cause for decline in primary grades was
because there were many more primary private schools, and these were typically the more
affordable schooling grades for poorer parents. As shown in Figure 5.9, the Kathmandu and
Chitwan district data confirms these suspicions – of the subset of schools with available data,
there appears to have been a significant decline in grade 1 enrollment between 2006-07 and
2012-13. It is noteworthy that some schools have grown even through the majority of schools

86
have lost enrollment, as demonstrated in the scatter plots comparing enrollments grade 1 in
2006-07 to enrollments in grade 1 in 2012-1329.
Accountability mechanisms to increase competitive pressures
The accountability based argument suggests that if school officials are not held
accountable for poor performance or loss of students, they will not be bothered to make any
schooling improvements. Thus, public schools are presumably more likely to experience a
competitive threat if they are penalized for enrollment loss or poor performance when private
schools in their locality take up more market share and produce better results. Historically, public
schools appear to have had limited accountability pressures. For most of their existence, public
schools experienced few external pressures to focus on quality in Nepal as the community
population continued to expand. Also, there is near universal acknowledgement and concern that
the stronghold of political parties in teacher unions has meant that teachers cannot be held
accountable for their work. In discussions with school principals and government officials, they
often brought up stories of the difficulties encountered when trying to move or replace teachers,
and in more extreme cases, merge or shut down schools30. The immunity afforded to school
teachers because of their role in national politics may only be subsiding now, as the country has
begun the process of transparently hiring qualified teachers for the 2013-14 academic year31.
Over the past five or six years, there have been some changes in the accountability
climate. The per-child-fund (PCF) financing mechanism, established in 2008, is a noteworthy
development in Nepal’s education system as it is the first explicit accountability mechanism 29 Data on student gender and disadvantaged groups do not show any particular movement in the public schools in these districts. The lack of change is likely to be a result of the fact that the dramatic demographic movements (male, non-dalit) in these districts may have happened before the availability of national school-level records in 2007. 30 More details of the lack of accountability and the political constraints faced by public schools is discussed in chapter 7: The factors that mediate the response to competition. 31 More details on evolutions in the teaching profession are provided in the National context discussion in Chapter 4: Data and Methods.
87
instituted in the country. Its goal is to reform how education is financed by directly linking salary
and non-salary financing to student enrollment (Government of Nepal, 2009). Recent analysis
suggests that the accountability mechanism may not yet be fulfilling its objectives. A mid-term
evaluation of the School Sector Reform Plan (SSRP), the national education plan for 2009 to
2015, suggested that the PCF mechanism may be causing perverse incentives to inflate
enrollment data, and recommends improvements in the sophistication of the mechanism to
reduce these negative effects (AUSAID, 2012). As schools get used to the funding modality, the
PCF reform could potentially incentivize schools to become concerned about their enrollment
losses. Secondly, there has been a strong growth in the negative perceptions of public schooling,
which has been popularized in the media. The negative public opinion may be putting some
pressures on public schools and officials to improve their reputation. For instance, some local-
level district officials talked about how they were better able to merge or collapse poorly
functioning schools than in earlier years due to the growing public awareness that resources
were being wasted in schools that were near collapse.
In summary, the conditions of enrollment decline and greater accountability pressures
may be making public schools more susceptible to competitive pressures in recent years, despite
the fact that public school officials continue to be buffered by their political affiliations. The
competitive pressures are likely to be higher in schools that have experienced serious enrollment
declines.
How do public school principals view their schools’ experiences with privatization?
This section is based on interviews with 30 public school principals on the schools’
evolution and the role of private competition in their historical evolution. These schools
represented variations in public schooling in the 7 districts of study. In the two districts of in-
depth study, the schools also varied in terms of rural and urban locations. I found that public
schools’ historical experiences with competition fell into three main narratives – (i) schools that
88
experienced historical middle class flight and enrollment decline, (ii) schools that are
exceptionally high in quality, and (iii) schools that had experienced a flight of middle class
students but not enrollment declines.
A history of middle class and male flight, and enrollment decline
The oldest schools, the “first generation” of public schools, in the district or region were
typically started in the early 1950s when socially conscious elites of the country began a
concerted effort to spread education to “commoners” at the end of Nepal’s oligarchic rule. These
schools were initiated in large population centers in the heart of Kathmandu city and other
populous areas of important districts. In their initial decades, these schools enormously benefited
from the lack of private schooling in Nepal, and were considered prestigious schools and would
educate children from the local community. A “second generation” of public schools included
the schools that were started a decade or so later, in newer population centers within the
important districts, and in the main population areas in the more remote districts of Nepal. These
schools similarly thrived until the 1980s.
The principals of both the “first generation” and “second generation” of early public
schools gave examples of how the school produced very good outcomes and had excellent
student-teacher-parent relationships during their peak years. As a result, some of the most
influential political leaders and professionals in the country were graduates from these schools.
When private schools were re-allowed in the mid-1980s, these public schools started
experiencing some flight of higher SES students because the local elite children of their
graduates started attending elite private schools. However, these public schools’ stellar initial
reputations allowed them to continue growing in terms of enrollment through the mid-1990s as
the country continued to experience mass education expansion. Once private schooling
substantially expanded in the country after the mid-1990s, these schools faced further enrollment
declines and middle class flight. Over the decades, public schools in these unregulated choice

89
environments have gone through a dramatic demographic transition and no longer serve the
community that they are located in. Instead, their student body is comprised of children who
work as household laborers in these neighborhoods, children of migrant workers, and children
who come from other highly disadvantaged economic backgrounds. Public schools typically
have a higher proportion of girls as boys are more likely to be sent to private schools.
I also encountered a few public schools that represented a slightly different experience in
that these schools had never experienced a significant peak in popularity in the community, the
“never popular” public schools. These schools were initiated as part of the growing public
schooling expansion movement, but were located close to more established public schools. Some
of these schools experienced the most severe declines in enrollment as private schools expanded
around them.
For these “first generation”, “second generation” and “never popular” public schools, the
decline of public schooling quality reached a crescendo around the early 2000s. Since then,
schools have taken divergent paths. While some schools have not been able to reverse their
decline and have continued on a downward trajectory, others have been able to initiate a
successful turnaround. The successful schools have been able to do so primarily due to the
retirement of older principals and the influx of new leadership which dedicated itself to
improving the school internally. The few schools that have made the turnaround suggested that
they were still in the early phases of reform. Still, the majority of these schools in urban centers
suggest that there is no local community support for their schools, unlike in villages, and as a
result they cannot really flourish in their localities as “community” schools.
Exceptionally high quality schools
In the districts that have experienced high privatization, there were a few schools of
exemplary quality that were flourishing. Interestingly, these “exceptional” schools had a
surprisingly similar narrative. These public schools were struggling to gain a foothold well into

90
the mid-1980s, but then experienced leadership changes that allowed them to flourish. Many of
the national government officials and the principals themselves mentioned that a major
determinant of these schools’ success was the principal’s ability to develop a committed teaching
team that was not influenced by the national political environment. The “exceptional” public
schools also focused on quality through their innovations to build a child-centric learning
environment, and by focusing on involving and counseling parents. The schools continued to
build on their initial reputation, and have become symbols of public school exceptionalism. The
principals attribute their success to effective leadership, a committed teaching team, and their
belief in the need to provide high quality. However, even these public schools are typically not
educating the wealthier communities’ children. Rather, they produce high quality outcomes from
students who come from less advantaged backgrounds.
A history of middle class and male flight, but not enrollment decline
The rest of the public schools were “large but facing difficulty.” These public schools
had experienced middle class flight with the expansion of private schools. However, they were
either located in rural regions with limited private schools or in districts that had very large
populations. Due to low level of private market saturation or high populations, these schools
were not in a real danger of losing student enrollment. For instance, in the populous Terai
districts (Jhapa, Sarlahi), the principals mentioned the difficulties they faced as they had to cram
anywhere from 60 to a 100 students in one classroom because of the lack of teachers and
facilities. In fact, many of these schools were in favor of some privatization as private schools
were able to relieve their enrollment pressures. However, the majority of these public schools
have also experienced middle class flight documented in the major urban centers of the country.
These experiences appear similar to what was being experienced in the mid-1980s to mid-1990s
in Kathmandu public schools. Schools in these districts are cognizant of the deterioration that
91
was experienced in Kathmandu, but are currently not under severe pressures to improve their
quality because the incentive mechanisms are primarily linked to enrollment.
Negative effects of competition: who is to blame?
Throughout the nation, public schools have experienced substantial decline in social
status since the mid- 1980s. The overwhelming majority of public schools place the blame of the
falling status of public schools on the growth of private schooling. The public schools primarily
blame bureaucratic incompetence for allowing rampant private sector expansion, for not having
been able to appropriately shield them from private competition, and not providing them with
adequate resources to be able to truly compete with the private schools. In regions that have had
a longer privatization history, public schools tend to blame privatization in more general terms
and highlight that the “mushrooming” (intense growth) of private schools of the past decade has
negatively impacted their student enrollment.
Public schools that exist in smaller population centers were more likely to discuss the
impact that they felt due to the entry of specific private schools. For instance, a principal from
school “A” in a rural region in Kathmandu argued that the school was adequately serving the
local rural population through the mid-1990s. Then, a non-Nepalese missionary organization
came to the community and agreed to pay for the education of the poorest students in that
neighborhood. The public school happily agreed to this arrangement as it eased their
administrative burden of having to collect school fees from late fee payers. The agency collected
information on all the poor households in the community in the process. Then, the missionary
organization decided to open a new school and informed the parents that they would only
continue to receive these funds if their children transferred to their new school. As a result of that
move, the public school “A” lost half of its student body. As Kathmandu land prices skyrocketed
in the next two decades, the local rural farmers became wealthy landowners and did not need to
92
seek out the cheaper public school. Thus, this public school was never able to recover its
stronghold in the community.
However, the public schools’ negative effects of privatization are not just confined to
urbanizing areas. In one of the remote districts of the study, public school “B” was located very
close to two private schools. A young teacher had been requested to rescue the school from near
collapse. He took charge of the school and tried to institute some key reforms. However, his
efforts were met with strong resistance. He received threats from the community and was
discouraged by most of the education officials in the region from continuing these initiatives. He
later discovered that the community had been treating him abrasively because they had heavily
invested in these private schools. Since they were located in a very small population area, the
community did not want the public school to succeed for the fear that it would make the private
schools less profitable. This public school is an extreme example of hostile relationships between
public and private school stakeholders, and the complexity of increasing “community”
ownership of public schools.
Overall, the public schools’ historical experience of competition suggests that different
regions of the country are following similar trajectories, but may be at different stages in their
struggle to compete with private schools. The experiences in Nepal suggest that it does take
enrollment threats and accountability pressures to “tip” public schools into feeling competitive
pressures, which is consistent with the U.S. evidence. In addition, the specific local milieu will
heavily affect how the schools will experience competition from private schools. The decline of
public schooling prestige in Kathmandu suggests that there is a second “tipping” point after
which it may be “too late” to reinstill community trust in public sector provision of education
without substantial government intervention. For instance, the community may simply not want
the public school to improve. This evolution provides a cautionary tale and suggests the need for
93
regulations and accountability mechanisms to ensure that public schools located in other
urbanizing centers do not experience the same loss of relevance.
What are the Characteristics of the Schools that are Identified as Competition or as the
Best Schools in the District?
Characteristics of schools identified as competing or best schools
An inspection of the schools that have been mentioned as “competing” schools reveals
that these competitor schools are primarily public and private schools that are located nearby.
Figure 5.10 plots the average difference in high-school examination pass rates between public
schools and the schools that they have identified as competing schools and the best schools in
their districts. Perhaps not surprisingly, the schools that have been identified as the best schools
have better high school examination results than the public schools, while the “competing”
schools appear to have similar test scores as the schools. Thus, public schools appear to assess
competition on the basis of geographic proximity and assess quality using the high-stakes
examination scores, the only well-known indicator of schooling quality in Nepal.
Public schools’ perception of private schools as competition
Interestingly, not all of the sampled public schools refer to private schools as
competition when explicitly asked to mention their competitor schools. As shown in Table 5.2,
only 39% of Chitwan secondary school principals and 62% of Kathmandu secondary school
principals mention at least one private school when asked to list up to three competing schools.
Similarly, when asked to name the three best schools in the district, secondary school principals
from 63% of Chitwan schools and a mere 37% of Kathmandu schools cited at least one private
school among the three best schools in the district. That is, despite the proven higher test scores
in private schools, many public schools are reluctant to name private schools as competition or as
best schools.
94
The hesitance to name private schools may have varying explanations. Firstly, it may
indicate that despite the density of private schools, public schools in both districts may view
private schools as operating in a separate, parallel system governed by different motivations and
regulations. The fact that the principals of schools in Chitwan are more likely to admit that
private schools are among the best schools in the district than in Kathmandu is slightly puzzling
since Kathmandu has the most prestigious private schools in the country. Kathmandu school
officials may have built a more defensive stance against private schools and be more likely to
focus their attention within the public sector than Chitwan school officials. However, a
significant majority of Chitwan school principals also do not view private schools as
competition. Some of these schools may simply not have private schools around them. However,
it may suggest that Chitwan schools look to other public schools as competitors rather than other
private schools that are taking up significant market share and, by their own admission, have
better quality in the district.
Another plausible explanation for why private schools are not considered among the best
schools or as competition may simply be that public schools do not believe that private schools
are really better in terms of quality. Public schools attributed the poor examination performance
of public school students to factors beyond the school’s control, such as political and
bureaucratic problems, student background and lack of parental involvement. They argued that
private school students perform better because private schools can function more smoothly
because of higher decision-making control, more educated and involved parents, and the lack of
bureaucratic rigidities.
Furthermore, the majority of government officials and public school principals that I
interviewed suggested that they do not believe that private schools provide a higher quality of
learning. Many public school principals questioned the credibility of the methods via which the
private schools procure higher results in the high-stakes examinations. The public school
95
principals suggested that private schools focused on rote learning methods to drill the lessons
into amenable private school children. A few of the public school principals in remote districts
even highlighted how the private schools were prone to have institutionalized cheating in the
high-stakes examinations to shore up their results. The majority of public school principals
mentioned that private school students were comparatively less likely to do as well in higher
secondary and further schooling, confirming to them that private schools did not provide better
quality of education. Government officials and public school principals further claimed that
public schools had far superior behavioral outcomes – specifically, that private school students
were socially insular while public school students were sociable, intellectually flexible, and left
school equipped with the ability to tackle broader life challenges.
Characteristics of schools that identify private schools as best or competing schools
The logistic regressions results of the subjective measures, as shown in Table 5.10,
suggests that public schools whose principals perceived private schools as competition were
more likely to be located in Kathmandu district, and surprisingly, to be located in rural areas.
Also, principals from schools that are located in high or medium competition regions in terms of
geographic proximity are significantly more likely to perceive private schools as competition
schools than schools that are located in low competition regions. The fact that rural area schools
are more likely to mention private schools as competition may indicate that they have few
private schools in the neighborhood and hence can pinpoint which private schools are
competition. Additionally, rural area public schools may also feel that they are more equipped to
compete with private schools because they still enjoy some community support and may not
have experienced massive flight of the middle class.

96
The association between the perception questions and the measures of subjective
competition are especially illuminating32. The public schools that had identified private schools
as competing schools are much more likely to agree that their experienced teachers are excellent
than principals who had not identified private schools as competition. Interestingly, the public
schools who perceived private schools as competition did not agree that parents are highly
involved in their school activities. The combination of these findings suggest that the public
schools that consider private schools as competition trust their within-school efforts rather than
their parental involvement, and thus may be likely to be motivated to make policy improvements.
The public schools that had identified private schools as among the best students in the district
were understandably more likely to agree that private schools were better in overall quality than
public schools.
Discussion and Conclusions
The global conversation on private schooling in developing countries has often focused
on the difference in quality between public and private schools. From an accountability
perspective, governments may be interested in ensuring that public schools feel competitive
pressures and engage in reforms so that they may improve schooling quality for the majority of
the children who continue to study in public schools. The analysis of the extent and reasons for
privatization in Nepal, the accountability climate, and the historical evolution of the experience
of competition showed that public schools have recently been put in an accountability situation
that may require the public schools to respond to competitive pressures.
Specifically, there has been strong growth in private schooling in recent years in Nepal,
and particularly in the two more urbanized districts that were selected for in-depth study. The
private sector growth has happened because of easy entry into the private sector, the profit-
32 A more detailed discussion of the association between measures of competition and principal perceptions are presented in Chapter 7.
97
making opportunities in the sector, and the solidifying community preference for private
schooling. As a result, public schools are surrounded by private schools which have taken up
significant market share, thus intensifying their experience of competition. In recent years, the
policy climate and population and enrollment trends have also become more aligned towards
making schools experience stronger competitive pressures. Consequently, public schools are
likely to currently be in an accountability environment that incentivizes them to respond to
competition and try to improve their quality, as measured by test scores.
However, the school officials’ perspectives reveal a substantively different take on the
issue of school quality and their experience of competition. Despite significant private school
growth throughout the 1980s and 1990s, public schools were shielded from having to deal with
private competition in the past due to the expansion of education access and the lack of
accountability incentives focused on school quality. By the time accountability mechanisms that
tied enrollment to financing were instituted in the mid-2000s, the majority of public schools had
experienced decades of systematic sorting and had lost the public perception battle. Many of the
urban public schools report that they are unlikely to be able to regain parental trust without
significant government efforts to counter public school stigmatization. In contrast, public school
officials in the remote parts of the country are more likely to have adequate enrollment and fewer
private schools in their district. However, even this assessment is a bit problematic since in areas
without a large population, the presence of one or two private schools can prove extremely
detrimental to the local public school. Clearly, demographic trends in the local context play a
significant role in the experience of competition in gradual, unregulated choice environments.
The historical analysis of the experience of competition suggests that there really are at
least two major tipping points that policymakers need to be aware of when thinking about the
likelihood of competition to induce public school reforms. Firstly, as discussed in the U.S.
literature, private schools need to take up significant enrollment, and public schools need to be
98
penalized for their enrollment declines for public schools to be pressurized into engaging in
school reforms. However, there is an additional tipping point – if the accountability systems are
set in place after the private schools have become the dominant provider, then it may also be “too
late” to make changes with school level efforts, requiring schools to undergo significant
government intervention to regain community trust. The temporal nature of the experience of
competition suggests that choice environments need to include well-timed accountability
mechanisms and support systems to have an enduring productive impact on public schools.
These findings on the historical evolution of public school status may be especially relevant for
other developing countries, since many countries that have undergone rapid education expansion
since the 1990s are likely to have experienced limited competition during the mass expansion
era, followed by growing stigmatization of public schooling with unregulated private expansion.
Despite the existence of the recent accountability mechanism and the acknowledgement
that private schools have been detrimental for them, not all public schools identify private
schools as “competition”, and even fewer public schools acknowledge private schools as among
the best schools in their district. Public schools may view private schools as operating with very
different motivations and regulations, and thus operating as parallel entities. Alternatively, unlike
the more popular macro consensus on quality differences between public and private schools,
many public school principals appear to think that private schools are any better in terms of
quality. Public school principal’s low evaluation of private school quality will affect the desire to
compete with private schools, and the strategies the public schools employ if they do try to
compete with private schools. Future analysis should probe deeper into the public and private
school quality differences.
The analysis from the Nepal case suggests that research on the experience of competition
in other low-income contexts needs to conceive of the public sector as a heterogeneous sector,
with variations in community and resource supports and personnel motivations. Competition

99
should be analyzed as a subjective experience, influenced by the school’s historic experiences
with competition and the principals’ perceptions of private competition, in addition to the extent
of private school growth. While economists and sociologists have long recognized that sorting of
students by income and ability is a likely consequence of unregulated choice programs,
researchers need to especially recognize how long-run sorting can lead to stigmatization of
public schooling in low-income developing countries with unregulated choice environments, as it
will impact the public schools’ experience of competition, and their ability to productively
respond to private competition. The question of the extent to which public schools are engaging
in school actions in order to respond to competition will be addressed in the next chapter.

100
Chapter 5 Figures and Tables
Figure 5.1 National private share of total enrollment, 2003-04 to 2011-12
Sources: Flash reports, various years and Flash dataset.
11
16
0
10
20
30
40
50
2003-04 2005-06 2007-08 2009-10 2011-12
urban
rural
national
% in
priv
ate
scho
ols

101
Kathmandu Chitwan
Figure 5.2 Historical expansion of private and public Schooling in selected districts (number of existing secondary level schools, by year) 1/
1/ Sources: District Records (Kathmandu and Chitwan); and Principal Survey. This chart plots the available data on school establishment for secondary level public and private schools in these two districts. It includes 212 public secondary schools (67 Chitwan schools and 145 Kathmandu schools), and 557 private secondary level schools (93 Chitwan schools and 464 Kathmandu schools). There are four caveats to the data. Firstly, the data is based on a one-time data collection and does not include schools that may have shut down over the years. There are indications that there is significant volatility in private schooling closures and ownership changes, particularly in Kathmandu, which would not be captured through the data. Secondly, this snapshot data would not be able to differentiate schools that may have transitioned between public and private schooling status. Thirdly, due to the large number of private schools in Kathmandu and unavailability of records, over a third of the establishment year data for Kathmandu secondary level schools is not available. Finally, there are a significant number of public and private schools that are below secondary level which could also be construed as competing schools. However, since the data for primary and lower secondary public schools was not available, I chose not to plot the primary and lower secondary private schools here.
0
100
200
300
400
500
pre-1950
1960 1970 1980 1990 2000 2010
public
private
0
20
40
60
80
100
pre-1950
1960 1970 1980 1990 2000 2010
public
private N
umbe
r of
sch
ools
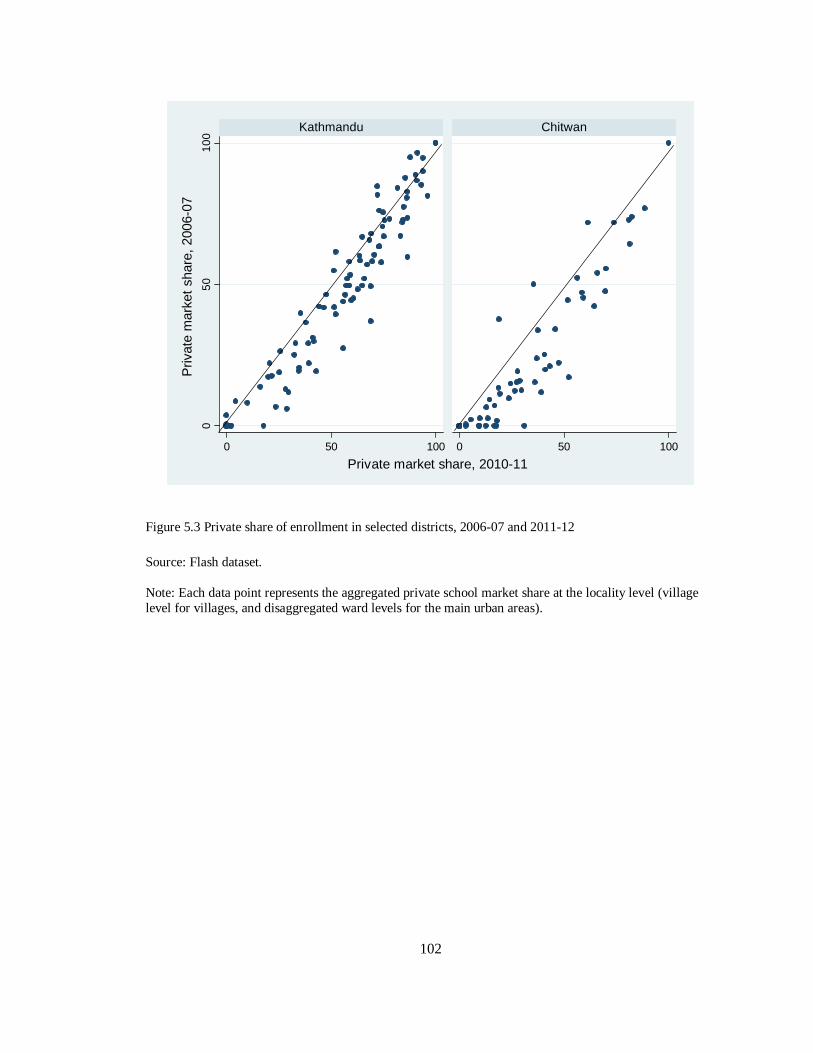
102
Figure 5.3 Private share of enrollment in selected districts, 2006-07 and 2011-12 Source: Flash dataset. Note: Each data point represents the aggregated private school market share at the locality level (village level for villages, and disaggregated ward levels for the main urban areas).
050
100
0 50 100 0 50 100
Kathmandu Chitwan
Priv
ate
mar
ket
shar
e, 2
006-
07
Private market share, 2010-11

103
Kathmandu Chitwan
Figure 5.4 Private school annual user fees in grade 1 in selected districts, by decade of establishment (in U.S. dollars) Sources: District Records (Kathmandu and Chitwan); and Principal Survey. The charts plot the total school fees by establishment decade for available schools in Kathmandu and Chitwan districts. Notes: The total fees for each school were calculated as the sum of annual fees and ten months of monthly fees. The data was compiled from the available monthly and annual fee records kept in the district education offices. The U.S. dollar to Nepali rupee exchange rate used is: 1U.S. $ = N.Rs. 86.65, which was the 2011-12 average exchange rate (based on IMF IFS statistics). The chart includes 607 Kathmandu private schools, 113 Chitwan private schools, 145 Kathmandu public schools, and 67 Chitwan public secondary schools. The data used in the analysis represents about half of the private schools that are currently operational in Kathmandu and over 70% of Chitwan private schools. The coverage limitation is due to lack of data availability on either school establishment year or school fee data for the remaining schools.
010
020
030
0
pre-1980 1980s 1990s 2000s
010
020
030
0
pre-1980 1980s 1990s 2000s
Public schools = $8.60
Public schools = $3.60
Tot
al fe
es (i
n U
.S. d
olla
rs),
201
1-12
Decade of establishment
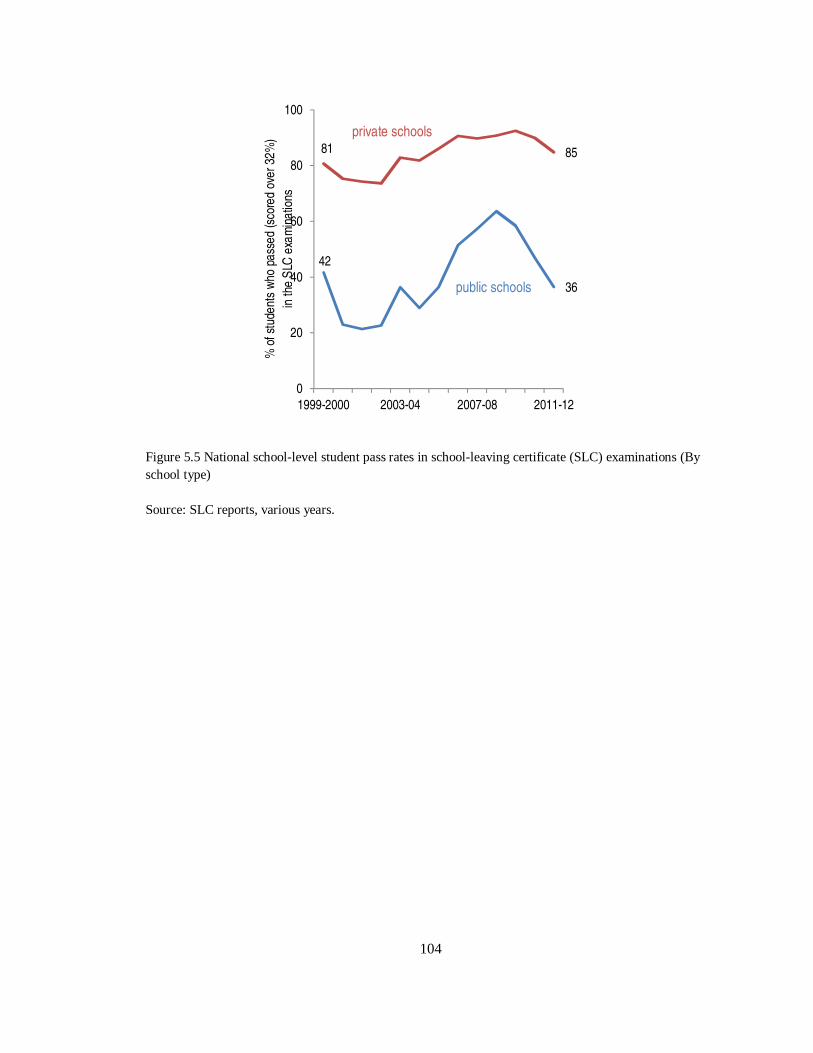
104
Figure 5.5 National school-level student pass rates in school-leaving certificate (SLC) examinations (By school type) Source: SLC reports, various years.
42
36
81 85
0
20
40
60
80
100
1999-2000 2003-04 2007-08 2011-12
public schools
private schools
% o
f stu
dent
s w
ho p
asse
d (s
core
d ov
er 3
2%)
in th
e S
LC e
xam
inat
ions
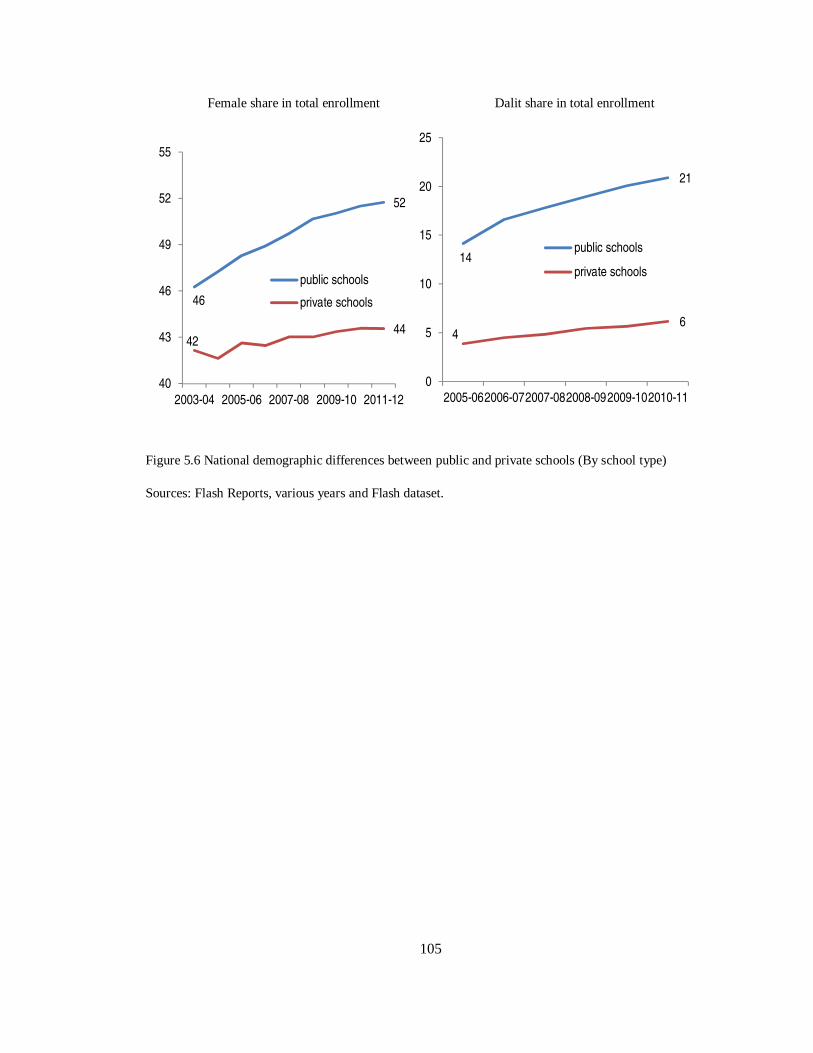
105
Female share in total enrollment Dalit share in total enrollment
Figure 5.6 National demographic differences between public and private schools (By school type) Sources: Flash Reports, various years and Flash dataset.
46
52
4244
40
43
46
49
52
55
2003-04 2005-06 2007-08 2009-10 2011-12
public schools
private schools
14
21
46
0
5
10
15
20
25
2005-062006-072007-082008-092009-102010-11
public schools
private schools

106
Figure 5.7 National demographic differences in private school adoption within rural and urban regions (By gender and dalit categories) Source: Flash dataset.
58
39
43
0
10
20
30
40
50
2005-06 2006-07 2007-08 2008-09 2009-10 2010-11
urban
urban female
urban dalit
rural
rural female
rural dalit
% in
priv
ate
scho
ols
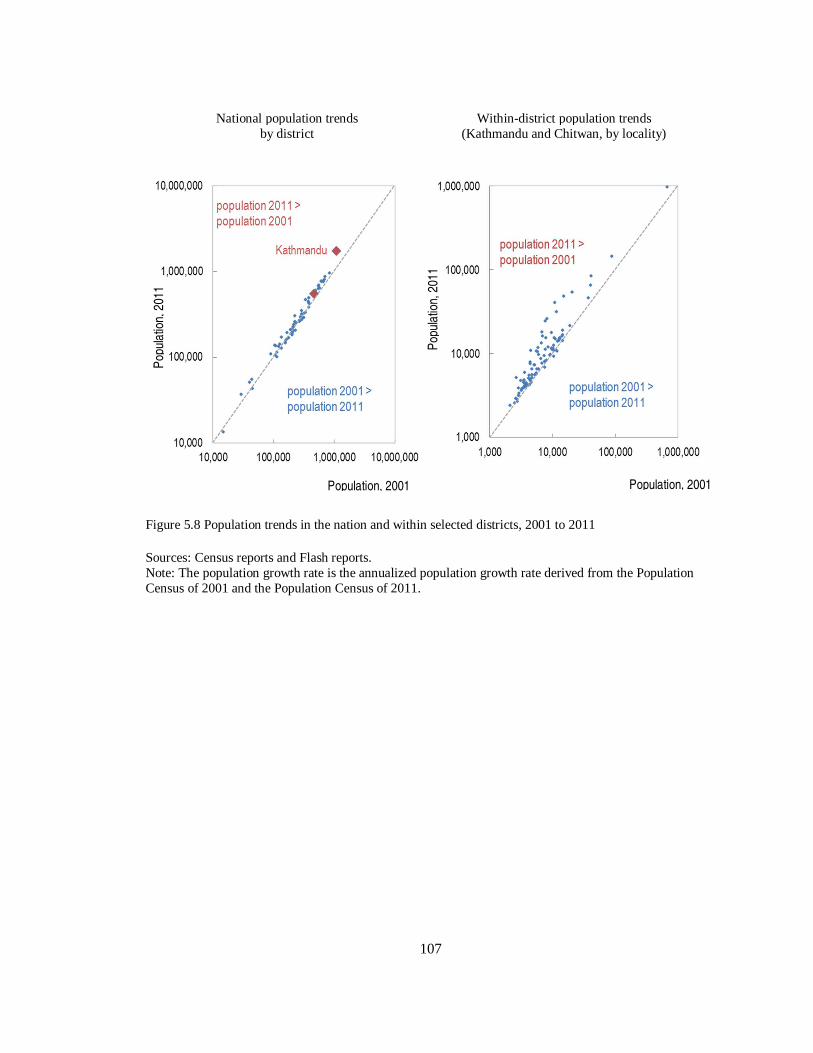
107
National population trends
by district Within-district population trends
(Kathmandu and Chitwan, by locality)
Figure 5.8 Population trends in the nation and within selected districts, 2001 to 2011 Sources: Census reports and Flash reports. Note: The population growth rate is the annualized population growth rate derived from the Population Census of 2001 and the Population Census of 2011.
Population, 2001
Pop
ulat
ion,
201
1
Pop
ulat
ion,
201
1
Population, 2001
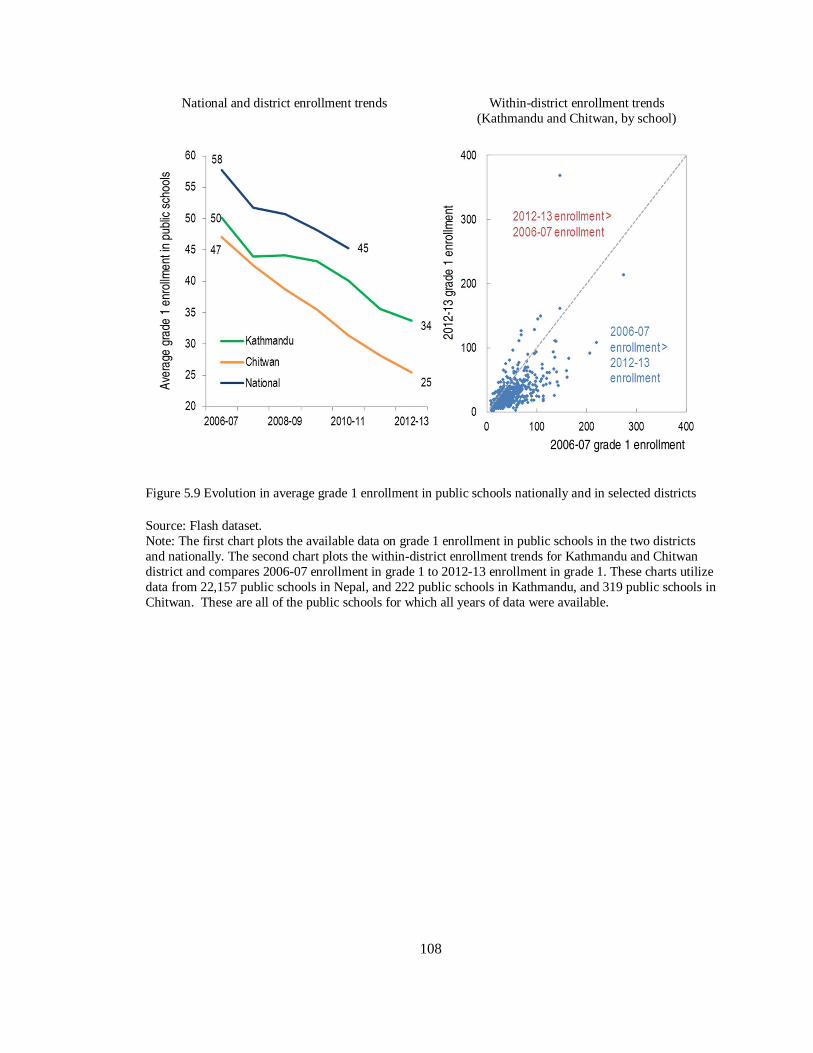
108
National and district enrollment trends Within-district enrollment trends (Kathmandu and Chitwan, by school)
Figure 5.9 Evolution in average grade 1 enrollment in public schools nationally and in selected districts Source: Flash dataset. Note: The first chart plots the available data on grade 1 enrollment in public schools in the two districts and nationally. The second chart plots the within-district enrollment trends for Kathmandu and Chitwan district and compares 2006-07 enrollment in grade 1 to 2012-13 enrollment in grade 1. These charts utilize data from 22,157 public schools in Nepal, and 222 public schools in Kathmandu, and 319 public schools in Chitwan. These are all of the public schools for which all years of data were available.
Ave
rage
gra
de 1
enr
ollm
ent i
n pu
blic
sch
ools
2012
-13
grad
e 1
enro
llmen
t 2006-07 grade 1 enrollment

109
Figure 5.10 Comparison of the differences in high-stakes pass rates between public schools, and schools identified as competing or best schools Source: Author’s calculations based on Principal Survey and Flash dataset. Note: The chart plots the kernel density of the average difference in pass rates between public school and the schools the public schools list as competing or best schools. The plotted differences are calculated as follows. The raw data used is the high-stakes school-leaving examination pass rates at the school level. The pass rates of the public schools are subtracted from the pass rates of the three schools that they identified as competing schools and the pass rates for the three schools they identified as the best schools. Then, the average of these differences is computed for the “competing schools” and “best schools” separately. The graph is a kernel density of those averages. Thus, if the average difference is greater than 0, then the public school has a lower pass rate on average than the schools it mentions as competing or best schools. If the average difference is less than 0, then the public school has a higher pass rate on average than the schools it mentions as competing or best schools.
0.0
05.0
1.0
15.0
2
-50 0 50 100
dens
ity
Average difference (Other schools – own schools)
Difference with “Best”
schools
Difference with
“Competing” schools

110
Table 5.1 Data sources used in Chapter 5
Research questions Data sources What is the extent of private competition in Nepal?
• Evolution of public-private
system
Descriptive data on annual national records of enrollment, teaching and infrastructural indicators (Flash Reports and datasets, 2008-09 to 2011-12) (MoE, 2012a; MoE, 2012b)
• Private sector growth and fee
diversification in Kathmandu and Chitwan
District records on school fees (2011-12) and establishment year, Kathmandu and Chitwan district offices (District records from Kathmandu and Chitwan, 2012)
• Competition Measures Principal Survey, 2011, Kathmandu and Chitwan Regression results: Combined Quantitative Dataset (Principal Survey, SLC dataset, Flash dataset, Census dataset)
• Reasons for private school growth
National records on high-stakes performance (SLC Reports, various years); Flash Dataset; Regulations governing private schooling
• Who runs private schools
Interviews with government officials and principals Volatility in ownership: district records on requests for school ownership changes, Kathmandu district education office (District Records from Kathmandu and Chitwan, 2012)
What are the policy, community and school characteristics that mediate the public schools’ experience of a competitive threat?
• Population and Enrollment
Trends
Census Report; Flash dataset
• Accountability mechanisms Policy reports, interviews with parents and principals (Qualitative (In-depth) and Qualitative (Supplemental) Dataset)
How do public school principals view their schools’ experiences with privatization?
• Historical Experience of Competition
Interviews with 30 public school principals in seven districts (Qualitative (In-depth) and Qualitative (Supplemental) Dataset) Main protocol questions: • Tell us a little bit about the school’s evolution • When did private schools expand in the region? Have there
been any recent evolutions in private schooling? What are the characteristics of the schools that are identified as competition or as the best schools in the district? • Characteristics of schools
identified as competition or best schools
Principal Survey, 2011, Kathmandu and Chitwan Regression results: Combined Quantitative Dataset

111
Table 5.2 Descriptive statistics on competition measures
Chitwan Kathmandu
Number of schools 67 145 Measure 1: Private schools in geographic proximity (range in each category)
Question: List the number of private secondary schools that are within one kilometer walk of the school
low competition 0 0 - 2
medium competition 1 - 2 3 - 5
high competition 3 - 9 6- 25
Measure 2: Private Share in Total Enrollment (range in each category)
low competition 0 – 19 0 – 25
medium competition 20 – 38 27 - 63
high competition 39 - 72 63 - 100
Measure 3: Subjective Competition (%) Question: List up to three schools that you are in competition with.
No private competition 61.2 37.9
At least one private school in set of competing schools 38.8 62.1
Measure 4: Subjective Competition (%) Question: List up to three schools that are among the best schools in the district
No private schools among the best schools 37.3 57.9
At least one private school in set of best schools 62.7 42.1
Source: Author’s calculations based on Principal Survey and Flash dataset.

112
Table 5.3 Descriptive statistics on explanatory and control variables for regression analyses
Variable description, year Mean S.D. Median
Number of public schools [N = 212]
Community characteristics
• Female literacy rate, six years and older, 2001 60.9 11.7 60.8
• District dummy (percentage Kathmandu) 68.4
• Urban dummy (percentage urban) 42.9
• Population growth (decadal), 2001 to 2011 49.3 53.3 45.2
Sorting characteristics
• Whether the school requires an entrance examination for grade 6 admission, 2011-12 49.1
• Total fees, grade 9, 2010-11 (in Nepali Rupees) 18.9 19.3 15.0
• Fraction dalit (disadvantaged population) in enrollment, 2010-11 11.1 7.8 9.7
Principal perceptions (percentage that agree or strongly agree to the following statements)
• Private schools are better than public schools in overall quality. 35.8
• There is no need to compete with private schools since our competition is really with other public schools. 17.0
• Teachers who have more than 15 years of experience are excellent in our school. 69.8
• Parents are highly involved in school activities in our school. 46.7
Control variables
• Total grade 1 to 10 enrollment, 2011-12 545 314 456
• Fraction female in grade 1 to 10 enrollment, 2011-12 53.07 8.63 53.2
• Percentage of teachers with permanent contracts, 2010-11 51.3 25.6 53.2
• School age in years, 2011-12 49.1 15.0 49.0
• Percentage of schools that hired private schools due to a lack of teachers, 2011-12 79.25
• Class size in 6th grade, 2011-12 44.7 17.1 44.5
• Repetition rates, primary grades (1 through 5), 2010-11 6.0 7.0 3.4
• Percentage newly admitted students in grade 10, 2010-11 3.6 14.3 0.0
• Percentage of schools that have inadequate desks, 2009-10 24.9
• Percentage of schools with a computer room, 2011-12 41.0
• Percentage of schools with a toilet for teachers, 2008-09 62.1
Source: Author’s calculations based on Combined Quantitative dataset (Principal Survey, Flash dataset, and Census dataset). Note: The U.S. dollar to Nepali Rupee exchange rate used was: 1 US $ = 80.0 N.Rs.

113
Table 5.4 Participation in private schooling, by region and expenditure quintiles (% in private schools)
Primary grades Secondary grades
1995-96 2003-04 2010-11 1995-96 2003-04 2010-11
National 5.9 14.0 20.3 5.1 12.8 17.5
By Region
Urban 39.2 51.2 55.7 21.9 44.7 48.0
Rural 3.5 8.9 14.5 2.9 5.3 9.4
By Ecological Belt
Mountain 0.4 0.6 6.2 0.0 0.0 3.5
Hills 5.9 14.7 17.5 7.4 17.1 17.1
Terai 6.9 15.4 26.3 3.0 10.3 20.8
By Consumption Quintile
Poorest 3.1 5.0 2.3 1.6 2.3 1.5
QII 1.3 2.7 7.9 1.8 1.8 3.3
QIII 2.8 6.5 12.5 0.0 2.0 5.7
QIV 4.1 14.0 33.7 1.4 6.5 14.7
Richest 18.2 55.2 72.2 10.8 33.2 52.0
Sources: Authors’ calculations based on NLSS databases.
Note: Primary grades include grades 1 through 5; secondary grades include grades 6 through 10.
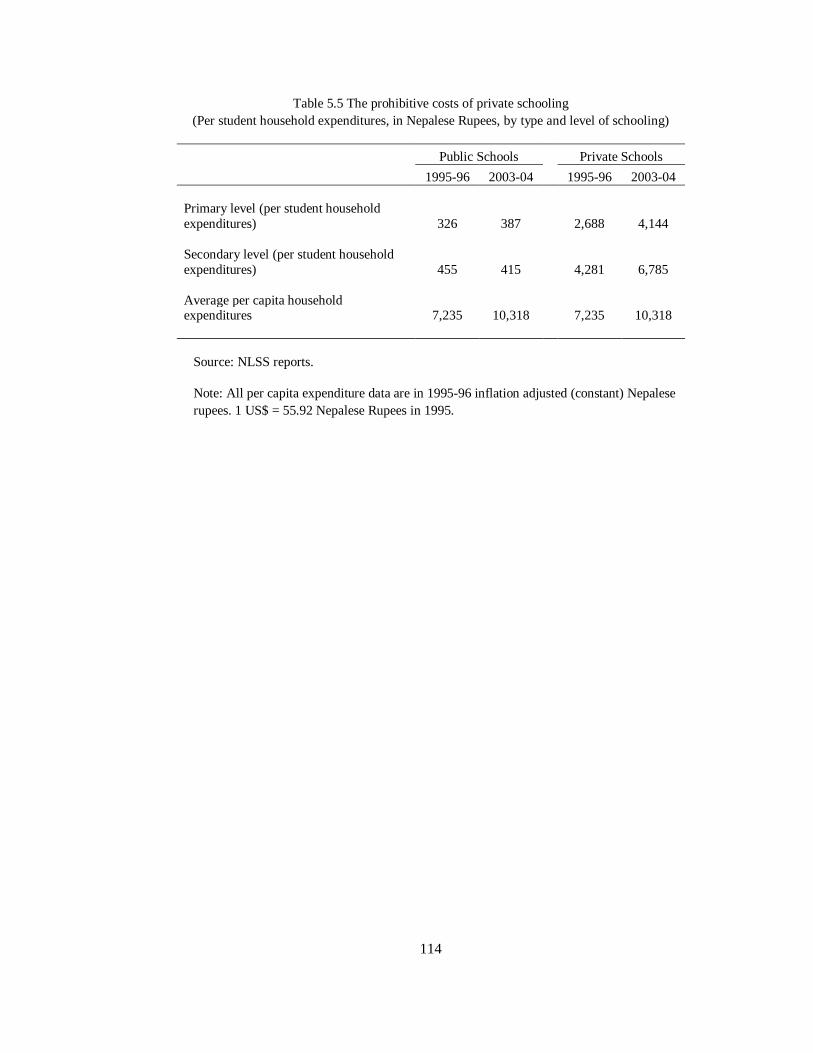
114
Table 5.5 The prohibitive costs of private schooling (Per student household expenditures, in Nepalese Rupees, by type and level of schooling)
Public Schools Private Schools
1995-96 2003-04 1995-96 2003-04
Primary level (per student household expenditures)
326
387
2,688
4,144 Secondary level (per student household expenditures)
455
415
4,281
6,785
Average per capita household expenditures
7,235
10,318
7,235
10,318
Source: NLSS reports.
Note: All per capita expenditure data are in 1995-96 inflation adjusted (constant) Nepalese rupees. 1 US$ = 55.92 Nepalese Rupees in 1995.

115
Table 5.6 Privatization market share in study districts
2008-09 2011-12
Chitwan 29.0 36.0
Dadeldhura 3.5 5.4
Jhapa 24.4 30.2
Kavre 16.8 19.8
Kathmandu 63.9 73.1
Mustang 11.8 21.8
Sarlahi 0.5 1.7
Nepal 11.6 14.5
Sources: Flash reports, various years.

116
Table 5.7 A comparison of user fees in public and private schools, 2011-12 (9th grade, in U.S. dollars)
N Mean Median Std. Dev. Min Max
Kathmandu public schools 145 25.86 19.62 34.17 0.00 369.32
private schools 775 335.36 280.45 336.99 0.00 6,959.42
Chitwan public schools 66 10.62 3.46 35.02 0.00 227.36
private schools 112 156.26 158.98 36.94 66.94 304.69
Sources: District records, Kathmandu and Chitwan and Principal Survey. These data come from the district private school records in Chitwan and Kathmandu, and school survey of public secondary schools, 2011. Notes: The total fees for each school were calculated as the sum of annual fees and ten months of monthly fees. The data was compiled from the available monthly and annual fee records kept in the district education offices. The U.S. dollar to Nepali rupee exchange rate used is: 1U.S. $ = N.Rs. 86.65, which was the 2011-12 average exchange rate (based on IMF IFS statistics). There are two main caveats to the data. Firstly, these data may not exhaustively capture all the user fees that parents have to pay the schools, but should be the most significant recurrent expenses incurred by the parents. Secondly, due to the large number of private schools in Kathmandu and unavailability of records, over a third of the data for Kathmandu secondary level schools is not available. However, there is unlikely to have been a systematic underreporting of cheaper schools.
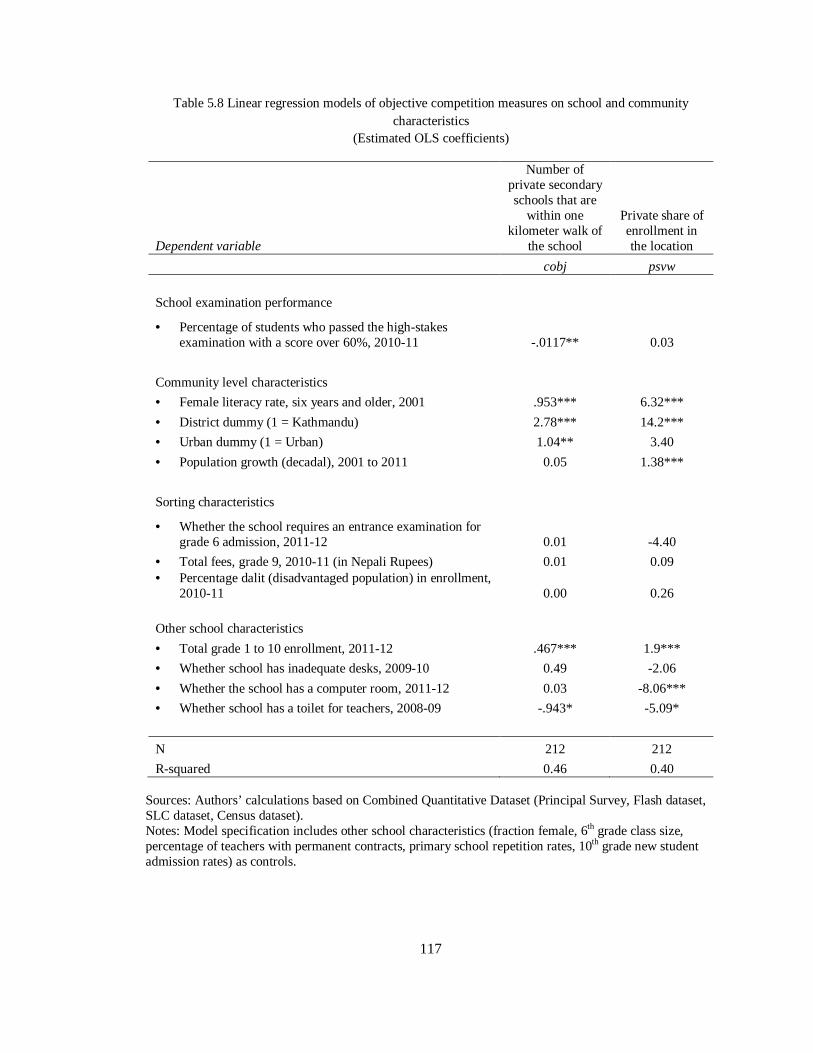
117
Table 5.8 Linear regression models of objective competition measures on school and community characteristics
(Estimated OLS coefficients)
Dependent variable
Number of private secondary schools that are
within one kilometer walk of
the school
Private share of enrollment in the location
cobj psvw
School examination performance
• Percentage of students who passed the high-stakes examination with a score over 60%, 2010-11 -.0117** 0.03
Community level characteristics
• Female literacy rate, six years and older, 2001 .953*** 6.32***
• District dummy (1 = Kathmandu) 2.78*** 14.2***
• Urban dummy (1 = Urban) 1.04** 3.40
• Population growth (decadal), 2001 to 2011 0.05 1.38***
Sorting characteristics
• Whether the school requires an entrance examination for grade 6 admission, 2011-12 0.01 -4.40
• Total fees, grade 9, 2010-11 (in Nepali Rupees) 0.01 0.09 • Percentage dalit (disadvantaged population) in enrollment,
2010-11 0.00 0.26
Other school characteristics
• Total grade 1 to 10 enrollment, 2011-12 .467*** 1.9***
• Whether school has inadequate desks, 2009-10 0.49 -2.06
• Whether the school has a computer room, 2011-12 0.03 -8.06***
• Whether school has a toilet for teachers, 2008-09 -.943* -5.09*
N 212 212
R-squared 0.46 0.40 Sources: Authors’ calculations based on Combined Quantitative Dataset (Principal Survey, Flash dataset, SLC dataset, Census dataset). Notes: Model specification includes other school characteristics (fraction female, 6th grade class size, percentage of teachers with permanent contracts, primary school repetition rates, 10th grade new student admission rates) as controls.
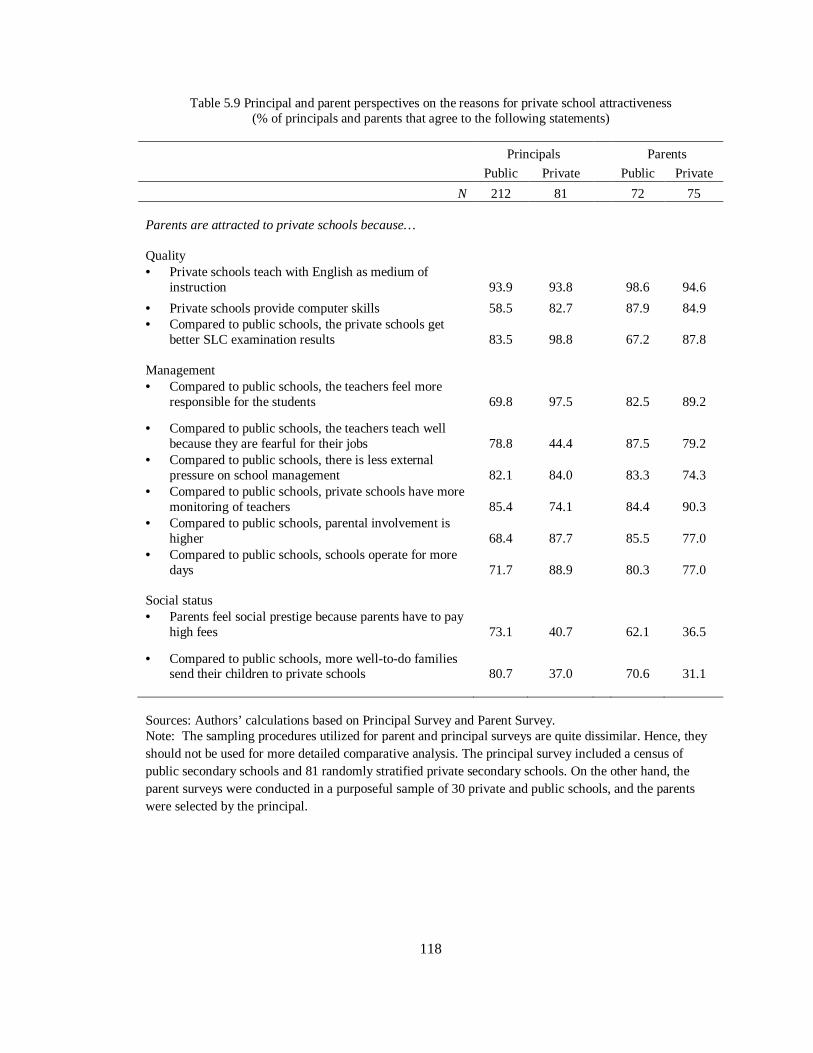
118
Table 5.9 Principal and parent perspectives on the reasons for private school attractiveness (% of principals and parents that agree to the following statements)
Principals Parents
Public Private Public Private
N 212 81 72 75 Parents are attracted to private schools because… Quality • Private schools teach with English as medium of
instruction 93.9 93.8
98.6 94.6
• Private schools provide computer skills 58.5 82.7
87.9 84.9 • Compared to public schools, the private schools get
better SLC examination results 83.5 98.8
67.2 87.8 Management • Compared to public schools, the teachers feel more
responsible for the students 69.8 97.5
82.5 89.2
• Compared to public schools, the teachers teach well because they are fearful for their jobs 78.8 44.4
87.5 79.2
• Compared to public schools, there is less external pressure on school management 82.1 84.0
83.3 74.3
• Compared to public schools, private schools have more monitoring of teachers 85.4 74.1
84.4 90.3
• Compared to public schools, parental involvement is higher 68.4 87.7
85.5 77.0
• Compared to public schools, schools operate for more days 71.7 88.9
80.3 77.0
Social status • Parents feel social prestige because parents have to pay
high fees 73.1 40.7
62.1 36.5
• Compared to public schools, more well-to-do families send their children to private schools 80.7 37.0
70.6 31.1
Sources: Authors’ calculations based on Principal Survey and Parent Survey. Note: The sampling procedures utilized for parent and principal surveys are quite dissimilar. Hence, they should not be used for more detailed comparative analysis. The principal survey included a census of public secondary schools and 81 randomly stratified private secondary schools. On the other hand, the parent surveys were conducted in a purposeful sample of 30 private and public schools, and the parents were selected by the principal.
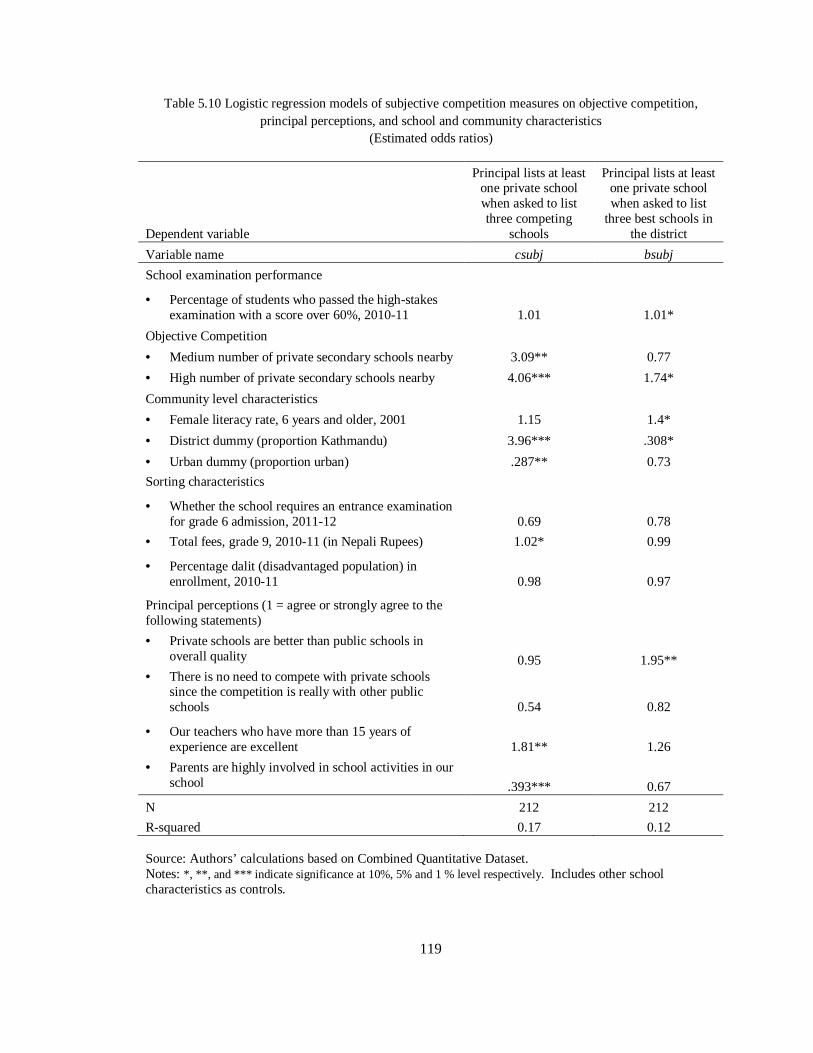
119
Table 5.10 Logistic regression models of subjective competition measures on objective competition, principal perceptions, and school and community characteristics
(Estimated odds ratios)
Dependent variable
Principal lists at least one private school when asked to list three competing
schools
Principal lists at least one private school when asked to list
three best schools in the district
Variable name csubj bsubj
School examination performance
• Percentage of students who passed the high-stakes examination with a score over 60%, 2010-11 1.01 1.01*
Objective Competition
• Medium number of private secondary schools nearby 3.09** 0.77
• High number of private secondary schools nearby 4.06*** 1.74*
Community level characteristics
• Female literacy rate, 6 years and older, 2001 1.15 1.4*
• District dummy (proportion Kathmandu) 3.96*** .308*
• Urban dummy (proportion urban) .287** 0.73
Sorting characteristics
• Whether the school requires an entrance examination for grade 6 admission, 2011-12 0.69 0.78
• Total fees, grade 9, 2010-11 (in Nepali Rupees) 1.02* 0.99
• Percentage dalit (disadvantaged population) in enrollment, 2010-11 0.98 0.97
Principal perceptions (1 = agree or strongly agree to the following statements)
• Private schools are better than public schools in overall quality 0.95 1.95**
• There is no need to compete with private schools since the competition is really with other public schools 0.54 0.82
• Our teachers who have more than 15 years of experience are excellent 1.81** 1.26
• Parents are highly involved in school activities in our school .393*** 0.67
N 212 212
R-squared 0.17 0.12 Source: Authors’ calculations based on Combined Quantitative Dataset. Notes: *, **, and *** indicate significance at 10%, 5% and 1 % level respectively. Includes other school characteristics as controls.
120
CHAPTER 6
THE PUBLIC SCHOOL RESPONSE TO COMPETITION
Abstract
The goal of the chapter is to describe and analyze the policies that are likely to be
adopted by public schools in order to compete with private schools in Nepal. The analysis is
essential since school policy changes provide the clearest indication of reform efforts, and are
necessary to engender outcome improvements. Despite the rapid growth in private schooling,
there is scant research on the public sector consequences of privatization in developing countries.
The analysis utilizes a mixed methods approach and analyzes 30 public school interviews and a
300-school competition focused principal survey. I first analyze the principal interviews and
retrospective, descriptive statistics to identify the policies that are most likely to be attributable to
private competition. I then conduct logistic regression analysis to test the hypothesis that public
schools that experience more competition are more likely to have implemented key policies. I
find that public schools have begun responding to private competition by “mirroring” desirable
private school policies. For instance, schools in high competition regions are over four times as
likely as schools in low competition regions to have lengthened their school day than officially
required. Furthermore, public schools whose principals mention private schools as competitors
are over twice as likely to have adopted English medium as public schools whose principals do
not mention private schools as competitors. The Nepal case suggests that the competitive
pressures and accountability mechanisms may have incentivized public schools to respond with
policy actions. The public school responses to private competition can be similarly fleshed out in
other developing countries by developing policy databases, understanding public-private policy
differences, and analyzing principal perceptions.

121
Introduction
In the chapter, I describe the policies that are being instituted in public schools in
response to private competition. I address the following research question in the analysis: How
do public schools respond to private competition? There are two main reasons why researchers
have to investigate how the presence of a growing private sector is affecting public school
policies. Firstly, the rise of private provision of education in low-income countries, including in
Nepal, has often been attributed to worse quality in public schools. Private schools are
theoretically expected to provide competitive pressures and incentivize public schools to
respond. However, despite the rapid growth in the private sector and the documented poor
quality of the public sector, the strand of research that analyzes public sector’s response to
competition is virtually nonexistent in developing country contexts (Thapa, 2012a). Secondly,
public schools continue to provide education to the majority of children in most developing
countries – 84% of all children in Nepal are documented to be enrolled in public schools in the
2012-13 academic year. So, if public schools are not providing good quality, we need them to
strive to improve as a result of these competitive pressures.
Conceptual Framework and Research Questions
The literature and conceptual framework suggest that when faced with competition,
public schools may adopt one of three stances – they may decide not to do anything, decide to
react with instructional and non-instructional reform efforts, or decide to react unproductively.
They may decide not to react to competition if they think that the private school does not have
anything different to offer, or if they lack the capacity to respond with policy changes. This
implies that we have to first evaluate if there are any noteworthy differences between private and
public schools in the context of study that are worth emulating by the public schools.
In qualitative studies, the researchers first identify public schools that are likely to be
most impacted by competition, and then investigate their reactions using descriptive statistics,
122
shareholder perspectives and observations. The argument that certain policies are responses to
competition rests on the notion that without these competitive pressures there would be no
incentives to adopt new policies. These studies have found that affected public schools have
focused on trying to improve customer relations, advertising, increasing teacher decision-making
control, providing better curricular options, and making the working environment difficult for
their competition.
In quantitative studies, the studies typically try to collect detailed data on school policies
before and after the introduction of competition or accountability measures from a representative
sample of schools. Then, the methodological focus is on trying to ensure that one compares the
policy adoptions in schools that are similar on all dimensions, such as community and schooling
characteristics, except the level of competition they face. These studies have found that schools
that face higher competitive or accountability pressures are more likely to provide more
instructional time for the high-stakes populations and subjects, increase teacher control over
decision-making, or game the system by cheating on the examinations.
A significant complication in describing public school responses as reactions to
competition is that it is very difficult to pinpoint what causes public schools to experience and
react to competitive pressures. As discussed in the conceptual framework and analyzed in
Chapter 5, the public school experience of competition is subjectively determined and it will
depend on a confluence of factors such as the extent of privatization, the school’s initial
conditions, and the leadership’s motivations. These findings suggest that a well-defined
subjective measure of competition may be better able to capture the less tangible aspects of
competition, and thus should be used to measure competition alongside objective measures when
studying responses to competition.
The main limitation in the school response literature is in causal inference – that is, in
arguing that certain policies are caused by and not just strongly associated with competition. The
123
identification is especially difficult in contexts like Nepal that have limited longitudinal data on
policies and privatization growth33. In fact, there is no national or district level database on
school policies that can be used to assess how public school policies have changed over time in
Nepal. Additionally, while there are many allusions to the public-private differences that have
made private schools attractive to parents, there are no descriptive or analytical studies that have
tried to assess whether public schools are basing their policymaking decisions to correct these
assumed differences in public and private schooling.
In this chapter, I analyze the policy changes that are likely to be induced by competition,
a topic that has not been investigated previously in developing countries. I address the question:
How do public schools respond to private competition? I assume that public schools have three
main strategies that they can utilize when faced with competition - they may decide not to do
anything, decide to react with quality enhancing reform efforts, or decide to react by increasing
their selectivity or other means to change student composition. The specific research questions
addressed are the following:
(1) What are the policies that public schools adopt in order to compete with private schools?
(2) Are public schools that experience higher competition more likely to have adopted
competition-induced policies than public schools that experience lower competition?
i. Are public schools that have more private schools in close proximity, referred to as
“objective competition”, more likely to have adopted competition-induced policies
than public schools that have fewer private schools in close proximity?
ii. Are public schools where the principals perceive private schools to be competition,
referred to as “subjective competition”, more likely to have adopted competition-
induced policies than public schools where principals do not perceive private schools
as competition? 33 Appendix 6.1 contains a discussion of the causal inference limitations of the study.
124
Data and Methods
Research Site
The analysis in the chapter is focused on the two districts of detailed study, Kathmandu
and Chitwan. As discussed in more detail in the Chapter on Data and Methods, these districts
were chosen for their high private sector exposure, which should provide schools in these
districts with enough competitive pressures to need to respond. For instance, the number of
private schools in both districts has expanded particularly strongly after the advent of democracy
in the early 1990s. Over the past decade, lower-income populations have also begun to go to
private schools and the private education sector has grown and diversified to address the
demand. Still, the data from district records suggests that the average annual 9th grade school fees
are at least 15 times higher in private schools compared to public schools, suggesting that private
secondary schools continue to be considerably more expensive than public secondary schools in
these study districts34.
In conducting the analysis on public school responses, it is important to be aware of the
ways in which the Nepal context is substantially different from the U.S. context that serves as the
site for much of the literature reviewed on school responses. Firstly, since Nepal is a low-income
country there may be contextually different policy responses to private competition that would
be required to attract students. Secondly, similar to other Asian and African countries
(Srivastava, 2013) the growth in private schooling over the past twenty years has been “de
facto”, that is with minimal government support or regulatory oversight, unlike the “de jure”
34 This finding may appear counterintuitive given that there is so much attention paid to the growing low-fee private sector in low-income contexts. The finding may be explained in the following ways. Firstly, there is a very small group of non-profit private schools in Nepal as most private schools are run as corporations. Secondly, given that Kathmandu and Chitwan are important politically, it is likely that they have few undocumented private schools, a phenomenon that may be more common in other populous parts of the country. Thirdly, the finding also suggests that rather than lowered school fees, it is the parental demand for private schools that is pushing private sector growth. That is, parents are willing to pay a premium for the perceived or real higher quality in private schools.

125
adoption of voucher programs in the U.S. (Witte, 2000) and Chile (Hsieh and Urquiola, 2006).
While there have been decades of policies focused on improving access and quality, the 2008
per-child-financing (PCF) modality is the first accountability mechanism in Nepal. The PCF
mechanism distributes salary and non-salary funds based on student enrollment. From a school
response perspective, the mechanism is likely to have substantially increased the incentives of
the public school system to improve and retain students. Finally, Nepal’s education system is
managed at the district level by the District Education Offices that have deconcentrated power as
the local level implementing agency (Bhatta, 2009). In interviews, district officials mentioned
that their involvement has been primarily restricted to collecting statistics, informing and
monitoring schools, and holding inter-school meetings to highlight promising practices and
conduct trainings. Thus, in contrast to district-level policy responses in the United States,
Nepalese public schools are likely to be primarily affected by school-led policy changes rather
than district level initiatives.
Data Sources
Quantitative data
In this chapter, I utilize the school-level Combined Quantitative Dataset, which
combines data on school policies, competition measures, community and school characteristics,
which were compiled from a primary dataset (principal survey) and various secondary sources
(national education indicators, student performance, population census)35.
Policy domains. Due to the lack of representative data on school policies, I developed a
school policy instrument which was developed and finalized using the key literature (MoES,
2005; Rouse et al., 2007), the initial exploratory qualitative work in 2010, and several rounds of
formal testing and discussions with the implementing survey firm. The survey enumerators asked
35 The various data sources are described in more detail in Chapter 4: Data and Methods, and displayed in Figure 4.1.
126
the school principals whether or not they had implemented a range of policies (yes/no question)
and when they started implementing these policies (a recall question), and the grades that they
implemented these policies for (from grade 1 through grade 10).
School principals were asked questions on policies that were more prevalent in private
schools, such as English medium, providing ties and belts, homework diaries, and computer
education; and other quasi-private instructional strategies (added instructional time, teacher
quality efforts) and quasi-private noninstructional strategies (emphasis on recruitment and
promotions and procedures for selection during admission). The summary statistics of these
school policies are presented in Table 6.1, and are discussed further in the results section of
Research Question 1.
Competition Measures. The main explanatory variables used in the analysis are the
measures of competition36. I use the survey to develop two measures of competition, which are
displayed in Table 6.2. Firstly, the geographic proximity measure was developed from a survey
question on the number of private secondary schools in close proximity to the public schools.
The school principals were asked to mention the number of private secondary schools that were
located in close proximity (within a one kilometer walk) of the public school, and the continuous
variable was then converted to a categorical variable of low, medium and high competition. I
decided to use a categorical transformation into high, medium and low competition because I felt
that it would be better for interpretation, because competition may not have a linear relationship
with the policy response. On the other hand, I felt that a binary transformation (1 = at least one
private school) would not capture the variations in the competitive environment. Secondly, a
subjective measure of competition was defined as a categorical variable that equals 1 if the
36 Further details on the competition measures are provided in the Data section of Chapter 5, which analyzes the competition measures in more detail.

127
school principal mentions at least one private school when prompted to list three competing
schools, and measures the school leadership’s perception of competition37.
Principal perceptions and high-stakes performance. The school survey dataset also
included perception questions on the reasons for private school attractiveness, decision-making
control, and school motivations and expectations from policy reforms. These data were first
collapsed from Likert scale items to binary data, and then divided by public school academic
performance quartiles. The school survey dataset also collected data on school-level pass rates in
the high-stakes examination. In the analysis, those results were used to divide the public school
sample into quartiles of academic performance for further analysis of differences in policy
responses and principal perceptions. The principal perceptions on select public-private
differences and decision-making roles by academic quartile are presented in Table 6.3.
Explanatory and Control Variables. In order to quantitatively analyze the association
between school responses and the subjective and objective measures of competition, I utilize the
above described school policy actions as the dependent variables. The other important
community covariates of interest in the analysis are the district variable, identifying whether the
district is Kathmandu or Chitwan; the urban variable, identifying whether the school is in urban
or rural regions. I also add variables that may measure the school’s ability to be selective, such as
whether the school takes entrance examinations, the schools’ total fees, and the proportion of the
school students who come from disadvantaged (dalit) backgrounds. I add a variable measuring
the permanent share of teachers in schooling, as the literature has suggested that it may be an
indicator of the school’s flexibility and the amount of leverage they would have to ensure higher
teacher effort (Sharma, 2012). Additionally, I also incorporate principal perceptions on the
37 A second subjective measure on the best schools in the district was based on a question that asked them to list the three best schools in their district. The question was used to identify the best public schools in the district and then highlight the policies that they had adopted. The analysis of the policies adopted by the best schools is discussed in Appendix 6.3.

128
public schools’ ability to make changes and the resource limitations that they face since the
reaction to competition is also based on subjective perceptions. In addition, I control for other
school characteristics such as school and class size, the proportion of female students in
enrollment, the age of the school, efficiency indicators such as the proportion of new students in
secondary schooling and the fraction that have dropped out in primary schooling; and for
infrastructure and resource characteristics - whether they have had to hire teachers due to lack of
funds, whether they have computer space, and whether their classroom desks are in adequate
condition. The descriptive statistics of these variables are listed in Table 6.4.
Qualitative Data
The qualitative data used for the analysis includes over 50 interviews of national
policymakers, and district, local and public and private school principals in the two districts of
Kathmandu and Chitwan, collected between July and September, 2011. The analysis focused on
the portions of the discussions that were focused on public-private differences and what public
schools were doing or could be doing in response to competition from private schools.
Empirical Strategy
I identify the policies that are more likely to be a response to private competition by
utilizing a two step mixed methods approach based on stakeholder perspectives and survey data
on public school responses. The lack of longitudinal information on policy changes and the
extent of competition does not permit conclusive causal inference38 analysis. However, I argue
that using school principals’ perspectives on public-private differences and what they have done
in response to competition increases the likelihood that certain policies are “competition-
induced” rather than just general improvements.
38 Appendix 6.1 contains a discussion of the causal inference limitations of the study.
129
To address Research Question 1, identifying the policies that are likely to be induced by
competition, I first analyze the descriptive statistics of school policies. I then highlight the
policies that are likely to be public school responses by going through the following steps. For
each policy, I studied the extent of the policy’s adoption in the private school sample, and
whether the policy was adopted more frequently in private schools than in public schools. I
simultaneously analyzed stakeholder perspectives from interviews and principal perceptions to
understand whether that policy was something that made private schools better than public
schools, and thus considered worth emulating. Then, I noted the historical trends in the adoption
of that policy in public schools. In this manner, I triangulated a variety of sources and
perspectives to identify a set of policies that were likely to be a response to private competition.
In the presentation of the descriptive data, I categorized the school policies as “private
mirroring”, “quasi-private instructional” and “quasi-private non-instructional” strategies. The
private mirroring strategies include strategies that were most visible and attributed to private
schools. The quasi-private instructional strategies included strategies that were more prevalent in
private schools compared to public schools, but were viewed as quality improvement tactics
rather than exclusively private school strategies. The quasi-private non-instructional strategies
included polices focused on school promotion and selectivity during admissions. These policies
were considered quasi-private but differed from other private-mirroring strategies in that these
were not directly related to school quality. I show the historical trends on when schools started
adopting these policies to identify if there has been a substantial increase in the frequency of any
of these policy adoptions in recent years.
For the descriptive analysis, I also use information on the number of grades for which
they had implemented the policy in order to understand if the policies had been sustained. The
school was defined as having “sustained” policies if the school had adopted these policies for at
least three grades. I developed the sustained policy definitions for the following policies:

130
adopting English medium, adding computer education, providing additional instructional time
for days lost to strikes, providing additional instructional time by keeping the school partly
operational during vacations, providing targeted additional time for weak students, and
lengthening the school day. The rationale for creating this definition was that it would allow one
to highlight the schools that have exerted efforts throughout the schooling cycle. Since Nepal’s
high-stakes examination only tests 10th grade children, all three of these grades would not have
high stakes attached to them. Additionally, the fact that they have implemented these strategies
for at least three grades would suggest that the school had not just initiated these efforts in this
academic year.
To address Research Question 2, whether policy adoption varied by the extent of
competition, I use logistic regression analysis to quantify the association between the selected
school responses, identified in Research Question 1, and the subjective and objective measures
of competition. The school’s policy response to competition is expected to depend on the
school’s student, financial and physical characteristics, and community characteristics, following
Rouse et al. (2007) and other empirical studies that focus on school policies. In presenting the
results, I approach the question of public school responses to competition using quantitative
measures and contrast schools by the extent of subjective and objective competition they face. In
the regression results, I interpret the odds ratio results for the measures of competition, and key
explanatory variables (the district variable, the indicator of selectivity, and principal
perceptions).
Model
131
I estimate a set of cross-sectional school-level models which estimates the association
between policy responses and the objective and subjective measure of competition using the
following set of logistic regressions39:
Ai = α + β1Csubj + β2C thirds2 + β3C thirds3 + γP + δZ + ε (Model 1)
where A represents whether the school has implemented policy i in 2011-12, Cthirds2 and Cthirds3
represent categorical40 indicators of competition - the medium and high number of private
secondary schools in geographic proximity (the omitted category is low competition), and Csubj
represents the subjective competition measure, whether the school had mentioned at least one
private school as a competition school. P represents a vector of key explanatory variables, and Z
represents a vector of school characteristic controls. The key parameters of interest are β1, β2, and
β3, which measure the effect of competition on the likelihood of the school’s policy response. As
stated earlier, the summary statistics on the competition measures and explanatory and control
variables are presented in Tables 6.2 and 6.4, respectively. In the presentation of the results, I
refer to the analytical dataset as “Combined Quantitative Dataset”, and the survey as “Principal
Survey” for simplicity41.
39 I also ran the following models of the objective and subjective measures separately.
Ai = α + β1Csubj + γP + δZ + ε (Model 1a) Ai = α + β2C thirds2 + β3C thirds3 + γP + δZ + ε (Model 1b)
Re-estimating the model with the subjective and objective measures separately did not change the estimation results for the key covariates in any substantial manner. Hence, these results are not described in the text. 40 The continuous variable that measured the geographic proximity measure of competition was converted to a categorical variable that took three values (low, medium and high) of competition for the analysis. I decided to use a categorical transformation into high, medium and low competition because I felt that it would be better for interpretation, because competition may not have a linear relationship with the policy response. On the other hand, I felt that a binary transformation (1 = at least one private school) would not capture the variations in the competitive environment. 41 For further details on the data, please refer to Figure 4.1’s data map in Chapter 4: Data and Methods.

132
Results
What are the Policies that Public Schools appear to be Adopting in order to Compete with
Private Schools?
Private-mirroring strategies
The set of policies that are most likely to be public school responses to competition are
policies that are viewed by stakeholders to be quintessentially private school characteristics and
worthy of emulation by public schools. Thus, the public schools’ growing adoption of these
strategies can be interpreted as their efforts to “mirror” private schools with the hope of
increasing their attractiveness in the community. The policies include adopting English medium
of instruction, adding computer education to the curriculum, requiring ties and belts on school
uniforms, and making students keep homework diaries. These “private mirroring” strategies are
also distinguishable from other reform efforts since these are more visible measures. For
instance, a principal can show the school’s transition to English medium by showing English
textbooks, take parents for a tour of the computer class, hand out homework diaries, and show
the ties and belts that their students are now required to wear on their uniforms. The historical
trends in public school adoption of these policies are presented in Figure 6.1.
English medium. According to most stakeholders, private schools are primarily more
attractive because they teach in the globally relevant English medium of education while public
schools provide instruction in the official national language, Nepali42. Private schools were
started, primarily in the 1980s and 1990s, to provide modern education to elite students, which
included teaching in English medium. Of the 81 private schools sampled in the principal surveys,
all but one of the private schools was started as an English medium school. In discussions, all
parents and policymakers attributed the decline of public school attractiveness at least in part to
42 Nepal has experienced a complicated history in determining the main language of instruction given its complex language diversity (Yadava, 2007). While arguments were made for Nepali, Hindi and English, Nepali was chosen to foster a unified national identity (Rai, Rai, Phyak & Rai, 2011).
133
the medium of instruction issue. For instance, as shown in Table 6.3, over 90% of surveyed
public school principals agreed that parents prefer private schools because private schools teach
using English medium. In discussions, some public school officials and parents even claimed
that it was the only significant difference between public and private schools.
The adoption of English medium is by far the most important “private-mirroring”
strategy that could be adopted by public schools. Public and private schools have long been
distinguished by their language of instruction. As shown in Table 6.5, a nationally representative
study from 2004 showed that while over 75% of private secondary schools were found to be
operating as English medium schools, only 1.9% of the public secondary schools were operating
as English medium schools. However, English has been valued for many decades in Nepal,
potentially due to the long-term importance of English in neighboring post-colonial India,
Pakistan and Bangladesh. Additional macroeconomic and political events have also aided in
increasing the relevance of English - the past two decades of political instability and consequent
migration boom has increased the importance of English fluency and household’s ability to
finance private schooling. The push for English is also reflected in a different kind of policy
response, a policy directive from the district office. For instance, in Kathmandu, the District
Education Office reported that he was leading an effort to get high school principals to commit to
transitioning their school to English medium in 2011-12 (personal communication, August 23,
2011). Thus, the adoption of English medium is by far the most important public-private
difference and the most important “private-mirroring” strategy that could be adopted by public
schools. There is an expectation that public schools may have started adopting English medium
instruction over the past few years to compete and survive as private schools rapidly grow in
their communities, despite the considerable difficulties a school may face in adjusting to a new
language of instruction.

134
The policy adoption trends from the survey data confirm these expectations. Nearly
three-quarters of the public schools say that they have adopted English medium in their schools
in the 2011-12 academic year. Importantly, the adoption of English is a fairly recent
development. As seen in Figure 6.1, most of the public schools in both districts, except for a few
older Kathmandu schools, mentioned that they initiated English medium teaching only in the
past five to six years. It also appears that English medium efforts are in their infancy for most
schools. While almost three-fourths of all public schools had adopted English medium, less than
a third taught in English in three or more school grades. An additional indicator of the school’s
serious commitment to English medium is whether they have hired teachers specifically for
English teaching purposes. About a third of the public schools appear to have recruited teachers
specifically to teach in English.
Computer education in the curriculum. Based on interviews, one of the other key aspects
that appear to differentiate public and private schools include their commitment to technology-
based education. As shown in Table 6.3, nearly 60% of the public school principals agreed that
parents find private schools to be more attractive because they provide computer skills. There
has been growing recognition of the need to provide computer-based education in Nepal. Many
of the sampled public schools had operational computer labs due to donations. The Nepalese
government also launched a pilot One Laptop Per Child (OLPC) program in 60 schools and
evaluated it for its learning benefits (Sharma, 2012). In the study, the provision of computer
education as a tested subject is a proxy measure that would signal that the school has firmly
integrated ICT based education into the learning environment. The data indicate that over 90% of
private schools, over 50% of public schools in Kathmandu, and only 28% in Chitwan, have
provided computer education as a subject. Also, efforts to provide computing skills in public
schools are only just beginning – only 35% of Kathmandu public schools and 12% of Chitwan
public schools provide computer classes for three or more school grades.
135
Adding ties and belts to the school uniform. The physical appearance of school children,
based on their cleanliness and the quality of their school uniforms, are an easy way to
differentiate public and private school students. Private schools in Nepal often have elaborate
uniform requirements (formal blazers, sports uniforms) while public school students only require
a basic blue shirt and grey pants or skirts. Interviewed principals mentioned that a tactic to lessen
some of the perceived difference between public and private school students has been to require
public school students to wear ties and belts on their school uniforms. About 80% of Kathmandu
schools, and 40% of Chitwan schools, have added ties and belt requirements to their school
uniforms as of 2011-12. The trend data in Figure 6.1 show that in Chitwan the public schools
only started adding ties and belts to uniforms from around 2005-06, while it was more prevalent
from the 1990s in Kathmandu.
Instituting a homework diary system. A homework diary system is a means for parents,
teachers and students to collaboratively monitor student learning. In such a system, students are
expected to keep a homework diary. As described by public school principals, the homework
diary system expects all parties to regularly track student progress by looking at the homework
records, and then signing a page in the diary to note that they have reviewed the work. The
checks and balances system can ensure that parents, students and teachers are on the same page
regarding student developments and are mutually accountable. While over 80% of private
schools have such systems in place, the adoption in public schools is fairly low. Only 34% of
Chitwan public schools and 19% of Kathmandu public schools have adopted a homework diary
system.
In summary, these “private-mirroring” policies have clearly been widely adopted by
private schools. There are two things worth noting with regards to the public school adoption of
these policies. Firstly, the historical trends appear to show significant differences between
Kathmandu and Chitwan public schools in the adoption of these strategies. As shown in the

136
historical adoption data in Figure 6.1, the adoption of these policies in Chitwan public schools
appear to be a recent response to the private school competition in the district, while it has been a
longer-term process in Kathmandu given the more pervasive exposure to private schools in the
capital. Secondly, while public schools have adopted policies that require primarily school level
actions, few public schools have tried to set up a homework diary system, which requires the
coordinated efforts of students, teachers and parents. This finding may suggest that public school
managements are less convinced of their ability to influence teacher and parent behavior.
Quasi-private instructional strategies
Other policies that public schools could implement include strategies that could be the
“behind the scenes” reasons for private schools’ presumed higher quality and be more frequently
adopted in private schools. The policies that focus on instruction and outcomes include an
emphasis on high-stakes results through tutoring sessions for the high-stakes examinations, a
focus on adding instructional time, and efforts to have better managerial control over teacher
performance. The adoption of these strategies by public schools may be construed as espousing
“private-like” behavior. I distinguish these quasi-private strategies from the “private mirroring”
strategies because the public school principals seem to view the instructional strategies as school
improvement policies rather than exclusively private school strategies. The historical trends in
public school adoption of these policies are presented in Figure 6.2.
Control over teacher performance. There is a general perception among parents that
private schools are better able to provide quality education and score higher test scores because
these schools have better managerial control over teacher performance. Public school principals
appear to concur with this assessment. As shown in Table 6.3, less than 60% of public school
principals say that they have substantial control over teacher appointments and almost 70% agree
that private school teachers may be viewed as being more responsible. Teacher absenteeism in
public schools has been widely acknowledged as a serious reason for relatively worse education

137
quality in public schools in developing countries. For instance, an influential study on rural India
(Muralidharan and Kremer, 2009) found that private school teachers were two to eight
percentage points less likely to be absent, and six to nine percentage points more likely to be
engaged in teaching activity as compared to teachers in public schools. Additionally, Beteille
(2009) argues that there are deep rooted structural and institutional problems that allow for
teacher absenteeism and ineffectiveness to prevail in settings such as India.
In Nepal, interviews suggested that public school teachers are heavily politicized and
frequently work as local level political officials for their parties, much like the “teacher
politicians” documented in the Nepal-bordering state of Uttar Pradesh (Kingdon and Muzammil,
2003). In fact, given the continuing volatile political climate in Nepal, the teacher politicization
situation may conceivably be a heightened form of the complex teacher political environment
that exists in India. Such a situation would adversely affect schooling. For instance, in a well-
functioning public school in one of the study sites, the 6-month absence of an English teacher
who could not be replaced with a substitute in time resulted in 25 failures in the high-stakes
examination at the school.
The attempts by school managers to monitor and incentivize teachers are proxied in the
analysis with three measures: whether the school provides monetary incentives to incentivize
performance, whether the school takes disciplinary action against teacher absenteeism, and
whether it has involved parents in monitoring teacher absenteeism. Two-thirds of the private
schools, and half of the public schools, stated that they provide monetary incentives for teacher
performance43.
Additionally, about half of the private schools, and only 20% of the public schools, had
policies in place to take disciplinary action for teacher absenteeism. It is rare for schools to
43 Since the survey did not ask for specific information on the kinds of monetary incentives required of teachers, it is possible that the surprisingly high response rate for this question that was trying to measure performance pay initiatives may be due to an acquiescence bias.

138
provide reports on teacher absenteeism to the parents – only seven of the 212 public schools
provide such a report to their parents, and only about 20% of public schools involve parents in
monitoring teacher absenteeism. As shown in Figure 6.2, there do not seem to be any discernible
historical trends in when schools stared instituting policies to fine teachers for absenteeism or
involve parents to monitor absenteeism. These historical trends may suggest that most schools
fine teachers on a case by case basis as they experienced absenteeism.
Tutoring sessions for the high-stakes secondary school examination. The main 10th grade
school-leaving (SLC) examination is the single most important indicator of school quality in the
country. Public schools have historically lagged significantly behind private schools in these
schooling outcomes (Thapa, 2012b). As shown in Table 6.3, over 80% of principals agree that
the high-stakes outcomes are a main reason why private schools are more attractive than public
schools. However, the common refrain from public school principals was that they thought that
private schools were excessively teaching to the test, while public school teaching was much
more conceptually based. Like the private tutoring phenomenon documented in many East Asian
countries (Dang and Rogers, 2008), a popular school policy in Nepal is to add tutoring sessions,
referred to as coaching classes, to ensure that students are well prepared for these examinations.
Public schools also seem to have latched on to this trend early on. As shown in Table 6.5, over
half of schools nationally admitted to having some type of coaching classes, especially for the
more difficult subjects of Mathematics, English and Science in 2004.
The data from 2011-12 for the two districts indicate that almost all public and private
schools appear to have instituted SLC coaching classes, indicating that public schools are also
expending additional effort to improve their high stakes examinations. Coaching classes that
cater specifically to weaker students are less prevalent. However, two-thirds of private schools
and less than half of the public schools have instituted ability targeted coaching classes. As
shown in Figure 6.2, there are no discernible historical trends to the adoption of these coaching
139
policies. It is worth noting that the quality and regularity of the coaching classes received by the
students will vary tremendously depending on the school’s financial condition. It is also likely
that the nature of the SLC examination coaching classes has changed over time, since there has
been increased awareness of how most public school students do not pass in these exams.
Adding instructional time. One of the other reasons that public schools may not perform
as well in the high-stakes examinations is if they spend less time studying at the school. Indeed,
as shown in Table 6.5, data from 2004 show that while almost 80% of private schools had
instituted some form of remedial teaching, remedial teaching was prevalent in less than one
quarter of public schools nationally. For this study, principals were asked whether their schools
supplemented instruction for the days lost to political strikes and vacations, lengthened the
school day, or targeted instructional time for weaker students. The interviews suggested that in
public schools there was a need for added instructional time in subjects that public school
students were typically weaker in such as English, Mathematics and Science.
The data from 2011-12 for the two districts indicate that sampled private schools were
substantially more likely to utilize these strategies to extend the amount of studying time
compared to public schools. For instance, almost 80% of the private schools, but only a third of
the public schools, mentioned that they provided extra lessons for weaker students. These public
schools were also less likely to have instituted these instructional time policies throughout the
schooling cycle. While a third of the schools provide extra classes to help weaker students, less
than 15% provided these extra sessions for at least three school grades. As shown in Figure 6.2,
the effort to add instructional time by lengthening the school day, adding extra school time
during vacations, and adding extra classes for weaker students (remedial classes) seem to have
gained significant traction in the past decade.
To summarize, most public schools have instituted coaching classes to improve their
high-stakes performance examinations. Public schools are also trying to add instructional time

140
beyond official requirements to make sure that the students at least complete their required
course load. The fact that few schools involve parents in monitoring teacher performance
suggests that school officials, in public and private schools, believe that managing teachers is the
school’s responsibility and not the parents.
Quasi-private non-instructional policies
Other non-instructional policies that could be adopted by public schools in their desire to
compete include strategies to promote the school or strategies to enhance school selectivity.
While these non-instructional strategies are considered private school behavior, I distinguish
these strategies from the “private-mirroring” strategies because promotional and selectivity
related strategies are rarely characterized as quality enhancing strategies. The historical trends in
public school adoption of these policies are presented in Figure 6.3.
Increasing admission selectivity. A prototypical private-school strategy is to be selective
during admissions. Schools can selectively admit students by using screening processes such as
interviewing parents, conducting entrance examinations, requiring special admission fees, or
requiring information on parent profession (Contreras, Bustos and Supelveda, 2009). The fact
that private schools can employ selection strategies is often cited as a strong critique of allowing
school choice in developed countries. The implication is that better student performance in
private schools may be primarily attributable to the ability to filter students and not their ability
to deliver quality education. In interviews, many of the public school principals highlighted that
their main disadvantage was that they had to accept all students who came to the school, while
private schools could sort students by income and ability. Given the discussions in the
interviews, I expected to find that public schools may be interested in employing selective
strategies as a means to maintain or initiate a competitive advantage since there were no strict
regulations governing school admissions due to a lack of zoning and education related taxation.
141
The survey data indicate that private schools were more likely than public schools to
collect special admission fees and use entrance examinations for student selection in the
admission process. For instance, less than half of the public schools in Chitwan, but almost all
private schools, had entrance examinations. These data suggest that private schools are able to
utilize sorting mechanisms while taking in students. Over 60% of Chitwan public schools, and
only 26% of private schools, mentioned that they conducted parent interviews. As shown in
Figure 6.3, there are no historical trends in the frequency of adoption of selectivity (taking
entrance examinations or requiring parent interviews) policies in public schools. These trends
may suggest that schools are using interviews and examinations for baseline statistics and
information gathering rather than as a means for sorting. Or, it may suggest that there are no
discernible group trends to increase selectivity and the schools that change their admission
requirements will do so on a case by case basis.
It is worth noting that the school’s usage of these admission requirements may
substantially differ between public and private schools. For instance, parents in Chitwan public
schools could potentially be considered to be “interviewed” when they were just informally
engaging in discussions, a product of a more community oriented school setting in the less
urbanized district. Also, requiring information on parents’ profession is administrative data that
need not be used for selection purposes. Public schools are also less likely to take special
admission fees to admit students, and are likely to charge lower fees than private schools during
admission season. Similarly, the entrance examination process could serve dual purposes,
depending on the desirability of the schools. While well-known public and private schools could
use examinations as a strategy to selectively admit students, public school principals suggested
that they used the examinations to assess baseline learning abilities even if all students had to be
admitted. Nevertheless, the fact that these procedures are followed by some public schools at the

142
very least suggests that there is a higher order of rigor and selectivity in these public schools’
admission process.
Promoting the school. Public schools principals frequently stated that private schools
aggressively mislead parents and students with their promotional tactics. Despite these
perceptions, less than a third of the sampled Kathmandu private schools, but 80% of the sampled
Chitwan private schools, mentioned that they promoted their school by placing advertisements in
television and newspapers. Advertising may be less frequent in Kathmandu than in Chitwan due
to the higher costs of advertisements in that market. Still, advertising in TV and newspapers is
twice as likely in private schools than in public schools. Public schools are also as likely as
private schools to regularly produce banners and pamphlets promoting the school, suggesting
that public schools are also aware of the need for school visibility. The adoption of these policies
is particularly interesting since these are not linked to quality, and are thus not likely to be based
on any parental demand for advertising. Thus, these promotional strategies are likely to be
emulation of private school behavior.
Among the strategies employed by public schools to shore up their declining enrollment
include promoting the school to the community. Schools were asked if they went door-to-door
during admission season6. While the majority of public schools go door-to-door to recruit
students, very few private schools are likely to have such institutionalized recruitment policies.
Most of the public schools have started going door to door to recruit students in the past 5-6
years, indicating that public schools are facing a more significant struggle in recruiting students
recently. As shown in Figure 6.3, the historical trends on non-instructional policies suggests that
attempts to promote the school through advertisements, promotional pamphlets or by going door
to door to recruit students are all recent initiatives.
To summarize, a substantial number of public schools are developing promotional
materials to increase the visibility of their school, and have had to go door to door to recruit
143
students. Interestingly, many public schools also have a variety of admission requirements such
as initial exams and admission fees, but it is unlikely that all public schools can utilize admission
requirements for screening purposes44.
Are Public Schools that Experience Higher Competition more likely to have Adopted these
School Policies than Public Schools that have Lower Competition?
Descriptive Statistics
As displayed in Table 6.6, schools in higher competition areas (surrounded by more
private secondary schools) were more likely to add extra instructional time during strikes and
have longer school days, provide computer education, institute a homework diary system, recruit
teachers to teach in English medium, and engage in selectivity practices than schools in lower
competition areas (surrounded by fewer private schools). In contrast, schools that were in low
and medium competition regions were more likely to have adopted English medium, require ties
and belts in school uniforms, advertise in TV or newspapers, and add extra classes for weak
students. These trends of a higher rate of policy adoption in low or medium competition areas
suggest that public schools that are surrounded by too many private competitors may be
experiencing the negative consequences of stratification.
Schools that experience subjective competition, that is, where principals identified at
least one private school when asked to mention three competing schools, were more likely than
44 There are two other pieces of analysis that illuminate public school responses that are discussed in more detail in the appendices. Firstly, there are other policies that public schools have adopted to address school quality problems which are routinely considered to be worse in public schools. These policies include the school’s efforts that focus on recruiting better teachers, and its non-instructional efforts to engage with the community to reduce absenteeism, and gain higher community financing support. These actions are considered to be a separate category of responses since these are not strategies that are considered to be private school behaviors, even though these actions may have been necessitated due to high privatization. A description of these policies is presented in Appendix 6.2. Secondly, another approach to understanding the policies that are likely to be attributable to competition is to investigate the policies that are being implemented by the best public schools in the country. Since public schools interact with each other a lot more than with private schools, the majority of public schools may be indirectly affected by private schools through the best practices instituted by the top public schools. An initial exploration of the best public schools’ policy actions are presented in Appendix 6.3.
144
those that do not experience subjective competition to have adopted English medium of
instruction and recruited teachers for English medium, provided computer education as a subject,
added ties and belts to school uniforms, and adding a homework diary system. The schools that
experienced subjective competition were also more likely to adopt instructional and non-
instructional strategies such as taking entrance examinations during admission, taking
disciplinary action for teacher absenteeism, adding instruction time by lengthening the school
day, keeping the school operational during vacations, and providing extra instructional time for
weak students, advertise in TV and in newspapers.
Regression Results
Private-mirroring strategies. As displayed in Table 6.7, I find that public schools that
are located in high and medium competition are less likely to have added English medium of
instruction. The public schools in high competition regions are less than half as likely as schools
in low competition regions to have adopted English medium, and the result is significant at the
10% level. The schools in medium or high competition regions are far less likely to have
recruited teachers for English medium as well. In addition, there does not seem to be a
significant relationship between the extent of competition and the school adoption of other
private mirroring strategies such as teaching computer education as a subject, adding ties and
belts to school uniforms, or requiring homework diaries. These results may suggest that schools
in areas of medium or high competition do not have the resources to be able to provide computer
education for their students or recruit new teachers for English medium.
On the other hand, public schools that have principals who mentioned at least one
private school as a competing school were over twice as likely to have adopted English medium
(significant at the 5% level), and over one and a half times as likely to have recruited teachers for
the purpose (not significant at the 10% level). Schools with principals who mentioned that they
consider private schools to be competitor schools are about twice as likely to require ties and

145
belts in school uniforms (significant at the 5% level) and to have instituted a homework diary
system (not significant at the 10% level). Interestingly, adding computer education as a subject is
not significantly different between schools by perception of competition.
The results also indicate that there is a clear demarcation between the two districts of
study, Kathmandu and Chitwan, in terms of school policy adoption. Chitwan public schools are
more than twice as likely to have adopted English medium as Kathmandu schools, after
controlling for other characteristics. However, the schools in Kathmandu were over 6 times as
likely as schools in Chitwan to have recruited teachers for English medium. These results
suggest that English medium is a more recently adopted initiative in Chitwan than in the capital
city of Kathmandu, but that Kathmandu schools are moving towards English medium adoption
more seriously. Schools in Kathmandu are over four times as likely to have added computer
education and added ties and belts to school uniforms. The public schools in Kathmandu are
more likely to have historically adopted quasi-private strategies given their prolonged exposure
to private school practices, and better access to resources to be able to adopt computer education.
The fact that Chitwan public schools are over five times as likely to require students to keep a
homework diary suggests that more Chitwan schools are able to get parents, teachers and
students to collaboratively commit to keeping track of student progress.
The public schools that display signs of selectivity, specifically by requiring entrance
examinations for 6th grade students, are over twice as likely to have adopted English medium and
recruit teachers for English medium. It seems logical to find that schools that are selective are the
ones that are able to transition to English medium, since the transition would be highly expensive
and time consuming in terms of textbooks, training, and teacher cooperation. Surprisingly,
selective public schools seem less likely to adopt computer education as a subject. The fact that
nonselective schools are more likely to adopt computer education as a subject may simply

146
suggest that even nonselective schools understand the importance of computer education, but
further analysis would be required to understand why this is the case.
The odds ratios results from principal perceptions suggest that principals believe that
English medium is what sets private schools apart from public schools, and that without English
medium private schools are not really better in quality. Specifically, public schools that have
principals who do not believe that they need to compete with private schools are five times less
likely to recruit English medium teachers than public schools whose principals believe that they
need to compete with private schools. However, public school principals who did not believe that
private schools were better in overall quality were twice as likely to have adopted English
medium and recruit teachers for English medium.
Quasi-private instructional strategies. As shown in Table 6.8, there are no statistically
significant differences between schools that differ in the extent of competition (high, medium or
low competition) in adopting extra coaching classes for weaker students to prepare for the
school-leaving certificate (SLC) examinations. The main instruction related strategy that appears
to be more frequently adopted in higher competition regions is the school’s decision to lengthen
the school day. The schools in high competition regions are over four times as likely as schools
in low competition regions to have longer school days than officially required. The longer school
day reform results suggest that schools in high competition regions are putting significant effort
into ensuring that students are covering the instructional material. In addition, of the few schools
that have involved parents in some capacity to monitor teacher absenteeism, schools that have a
medium number of private schools nearby are twice as likely to have parental involvement in
absenteeism as schools located in a low competition region.
Public schools that perceive subjective competition are less likely to have added SLC
coaching classes for weak students but are over one and a half times as likely to have added
remedial lessons. One interpretation of these findings is that the schools that perceive subjective
147
competition may actually be more engaged in improving school quality throughout the school
cycle, and may not need special instructional targeting during the final high-stakes examinations.
In addition, public schools that perceive private schools as competition are almost three times as
likely to have involved parents in monitoring teacher absenteeism.
In terms of the explanatory variables, Kathmandu public schools were over four times as
likely to mention that they had SLC coaching for weaker students and had fined teachers for
absenteeism, compared to Chitwan public schools. In contrast, Chitwan public schools were
much more likely to stay operational during vacation periods, have extra classes for weaker
students (remedial classes), and involve parents in monitoring teacher absenteeism. These results
suggest that Kathmandu public schools have a higher focus on the examination performance of
their students and that they may encounter and have to deal with higher incidence of teacher
absenteeism. On the other hand, Chitwan public schools appear to be more likely to involve
parents and trying to improve schooling outcomes for students throughout the schooling cycle.
The more selective schools are significantly more likely to keep schools partly
operational during vacations, and have some system of remedial education. It is not surprising
that public schools that are selective are more likely to adopt these policies, since all of these
interventions would require significant personnel and financial resources. For instance, teachers
need to be paid extra to ensure that they come during vacations or are willing to teach remedial
classes. Selective schools are less likely to institute SLC exam coaching for weaker students. The
fact that schools that are selective do not have special SLC coaching for weaker students may
simply suggest that they provide adequate attention in schooling and do not need to implement
special measures during examinations.
Public schools that believed that they were competing primarily with public schools, and
not with private schools, were twice as likely to have SLC coaching classes for weaker students
and to have longer school days. These findings suggest that these public schools believe that
148
adding instructional time and coaching classes are quality improvements and not exclusively
private school strategies. Not surprisingly, public school principals who stressed a lack of
resources were less likely to have instituted the more expensive strategies of adding coaching
classes for weaker students or keeping schools operational during vacations. Schools that
believed that private schools are better are more likely to stay open during vacations, suggesting
that added instructional time is a way to compete with private schools.
Quasi-private non-instructional strategies. As shown in Table 6.9, the strategies that
may suggest selective admission practices, such as entrance examinations or parent interviews,
are not more prevalent in high competition regions. This finding may imply that certain public
schools adopt selection policies after they have demonstrated quality and gained a favorable
reputation, irrespective of whether they are located in low or high competition areas. There are
also no significant differences between public schools in low, medium or high competition
regions in the adoption of school advertising, developing promotional materials or in going door
to door to recruit students.
Public schools that have principals who perceive private schools as competition are not
more likely to require parent interviews or entrance examinations, again suggesting that selection
processes are a product of improved quality rather than a strategy to enhance quality in public
schools. On the other hand, the public schools whose principals perceive private schools as
competition are almost twice as likely to advertise and go door to door to recruit students,
suggesting that principals who recognize private schools as competition also realize the
importance of visibility and interactions with parents.
Kathmandu public schools were over 5 times as likely to require entrance examinations
compared to Chitwan schools. As a district with more long-term private school exposure, it
seems that it is acceptable for some public schools to also try and maintain a school quality
premium using entrance examinations in Kathmandu. However, Kathmandu schools were far

149
less likely to require parent interviews during admissions, advertise on TV or newspapers, and go
door to door during recruiting season. The adoption of these promotional policies again suggests
that public schools in the smaller, less urbanized Chitwan district are more likely to try and reach
the community and have more regular interactions with the parents.
Schools that are more selective do not seem to advertise (statistically significant at 5%
level) or go door to door to recruit students (not significant at the 10% level), which is not
surprising since it implies that selective schools get more than adequate student enrollment
requests. Schools with principals who agreed that they were primarily competing with public
schools were more likely to advertise, but less likely to have developed other promotional
materials. This finding suggests that some public schools also view advertising as a necessity
rather than a private school strategy.
Discussion
Public schools in developing countries have long held the dubious reputation of being
inflexible, inefficient, corrupt institutions. The rise of a low-fee private sector that caters to the
poor in developing Asian and African countries has motivated some pro-private actors to argue
that low-fee private schools need to be expanded since private schools are besting the
government on both equity and efficiency fronts (Dixon, 2012). On the other hand, pro-public
advocates continue to argue for governance improvements and added resources to public
schools, and are concerned that full-fledged privatization will exacerbate rather than ameliorate
inequalities (UNESCO, 2008). In the Nepal context, the dominant narrative has been that public
school system has steadily lost ground to private schools over the past two decades. In contrast to
the pessimistic global and national discourse on public school sluggishness, my analysis in the
Nepal context suggests that there has been a recent surge of policy adoptions in Nepalese public
secondary schools as they attempt to compete with the private sector.
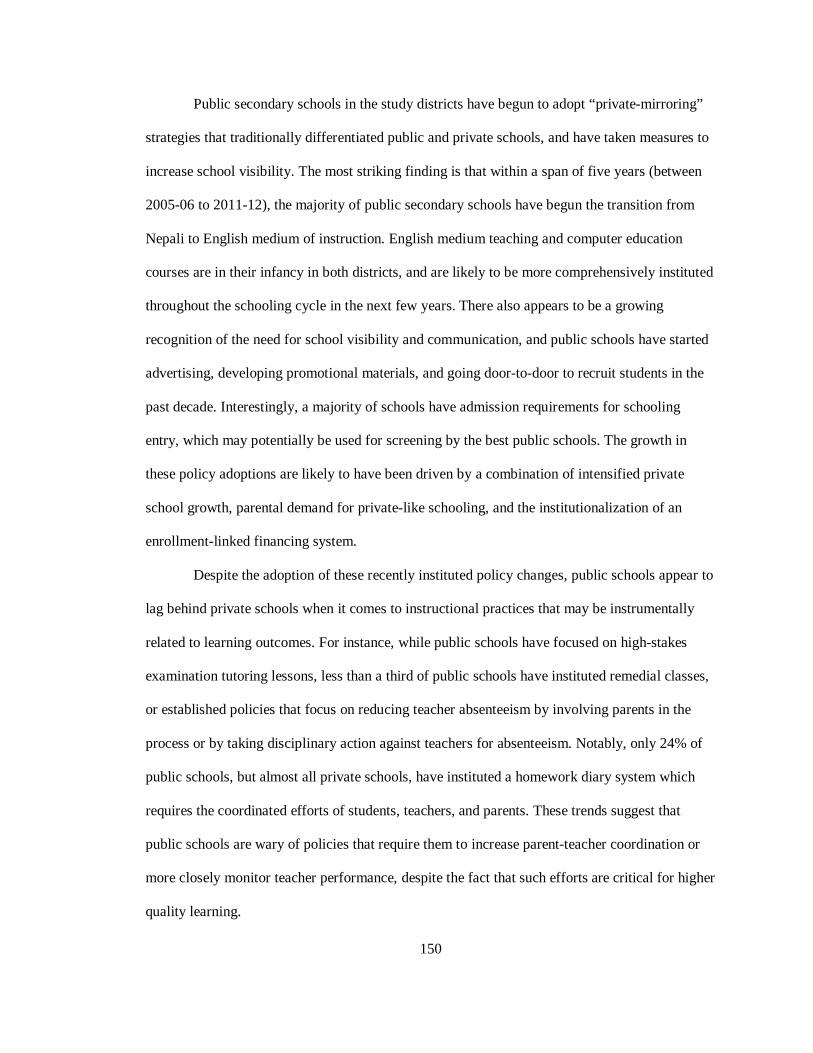
150
Public secondary schools in the study districts have begun to adopt “private-mirroring”
strategies that traditionally differentiated public and private schools, and have taken measures to
increase school visibility. The most striking finding is that within a span of five years (between
2005-06 to 2011-12), the majority of public secondary schools have begun the transition from
Nepali to English medium of instruction. English medium teaching and computer education
courses are in their infancy in both districts, and are likely to be more comprehensively instituted
throughout the schooling cycle in the next few years. There also appears to be a growing
recognition of the need for school visibility and communication, and public schools have started
advertising, developing promotional materials, and going door-to-door to recruit students in the
past decade. Interestingly, a majority of schools have admission requirements for schooling
entry, which may potentially be used for screening by the best public schools. The growth in
these policy adoptions are likely to have been driven by a combination of intensified private
school growth, parental demand for private-like schooling, and the institutionalization of an
enrollment-linked financing system.
Despite the adoption of these recently instituted policy changes, public schools appear to
lag behind private schools when it comes to instructional practices that may be instrumentally
related to learning outcomes. For instance, while public schools have focused on high-stakes
examination tutoring lessons, less than a third of public schools have instituted remedial classes,
or established policies that focus on reducing teacher absenteeism by involving parents in the
process or by taking disciplinary action against teachers for absenteeism. Notably, only 24% of
public schools, but almost all private schools, have instituted a homework diary system which
requires the coordinated efforts of students, teachers, and parents. These trends suggest that
public schools are wary of policies that require them to increase parent-teacher coordination or
more closely monitor teacher performance, despite the fact that such efforts are critical for higher
quality learning.

151
Furthermore, while the growth in policy adoption has been impressive, it is unclear if
these policies will be able to improve the desirability of these public schools since school choice
is inextricably based on both quality and sorting. For instance, by the time these school policies
are adopted by lower performing public schools, these policies may have lost their novelty and
there may be no real “catching up” to the private schools or the better public schools. For
example, when everyone starts teaching in English medium, parents will differentiate schools by
quality of English teaching which will presumably advantage schools with a longer history of
English teaching. Since many of the policies like English medium and computer education are
clearly in their infancy of adoption in Nepalese public schools, further research will be required
to assess if there has been a substantial improvement in outcomes and desirability as a result of
these policy changes.
The distinctions between Kathmandu and Chitwan districts reveal interesting variations
in policies that may be adopted by schools that are in high privatization versus medium
privatization contexts. For instance, the public schools in Kathmandu are able to adopt sorting
behavior (take an entrance examination, require a special admission fee) in an environment of
lax monitoring and high population densities. Kathmandu public schools clearly have a longer
history and familiarity with the more visible private mirroring strategies such as English
medium, computer education, adding ties and belts to uniforms. In contrast, nearly all of the
policies that were adopted in higher frequency in Chitwan district (homework diary, interviewing
parents, extra classes for weaker students, going door to door to recruit students) signal regular
interactions with community members and a focus on improving learning quality internally.
Furthermore, the major private mirroring strategies of adding ties and belts, English medium,
computer education have been very recently and rapidly adopted in the Chitwan district. On the
whole, the efforts made by schools in Chitwan district appear to hold more promise for future
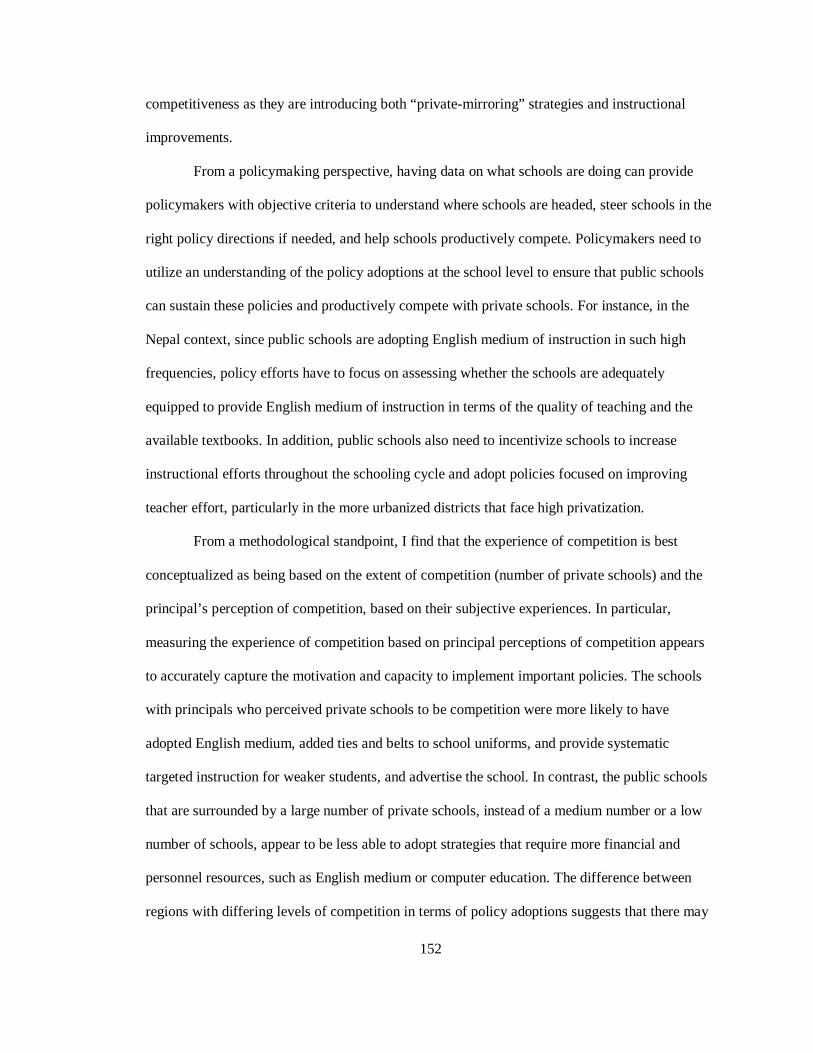
152
competitiveness as they are introducing both “private-mirroring” strategies and instructional
improvements.
From a policymaking perspective, having data on what schools are doing can provide
policymakers with objective criteria to understand where schools are headed, steer schools in the
right policy directions if needed, and help schools productively compete. Policymakers need to
utilize an understanding of the policy adoptions at the school level to ensure that public schools
can sustain these policies and productively compete with private schools. For instance, in the
Nepal context, since public schools are adopting English medium of instruction in such high
frequencies, policy efforts have to focus on assessing whether the schools are adequately
equipped to provide English medium of instruction in terms of the quality of teaching and the
available textbooks. In addition, public schools also need to incentivize schools to increase
instructional efforts throughout the schooling cycle and adopt policies focused on improving
teacher effort, particularly in the more urbanized districts that face high privatization.
From a methodological standpoint, I find that the experience of competition is best
conceptualized as being based on the extent of competition (number of private schools) and the
principal’s perception of competition, based on their subjective experiences. In particular,
measuring the experience of competition based on principal perceptions of competition appears
to accurately capture the motivation and capacity to implement important policies. The schools
with principals who perceived private schools to be competition were more likely to have
adopted English medium, added ties and belts to school uniforms, and provide systematic
targeted instruction for weaker students, and advertise the school. In contrast, the public schools
that are surrounded by a large number of private schools, instead of a medium number or a low
number of schools, appear to be less able to adopt strategies that require more financial and
personnel resources, such as English medium or computer education. The difference between
regions with differing levels of competition in terms of policy adoptions suggests that there may

153
be a tipping point in terms of the level of competition beyond which public schools are faced
with loss of support that impedes them from carrying out internal improvements. Future research
efforts could aim to better understand the mechanism of the competitive effect, particularly by
evaluating whether or not public schools are indirectly affected by competition through the
actions of top performing public schools. This analysis would shed further light on the
competitive effects process and their implications for outcomes.
To conclude, the Nepal case suggests that researchers in low-income contexts can
understand what public schools are doing in response to competition by developing school policy
databases, understanding public-private differences, and conceptualizing competition as a
subjective experience. Other low-income contexts that have experienced similar gradual private
sector growth may also have public schools that are responding to competition in a variety of
ways that have gone unnoticed as policymakers and researchers limit their focus to student
outcomes or overgeneralize public schools as sluggish institutions averse to change. To state a
seemingly simple point, understanding what schools are doing will allow policymakers and
researchers to develop better solutions to improve public schools. The following chapter focuses
on illuminating the constraints faced by public schools when trying to compete with private
schools.

154
Chapter 6 Figures and Tables
Kathmandu Chitwan
Figure 6.1 Historical trends in policy adoption: Private-mirroring strategies (Number of schools, by year the school started adopting the policy) Source: Principal Survey. Note: Each school was asked whether they had adopted the policy, and the year they started adopting the policy. These charts plot the historical trends based on the year of policy adoption recall question.
0
20
40
1980 1985 1990 1995 2000 20052010
Transitioned to English medium
0
10
20
1980 1985 1990 1995 2000 20052010
Transitioned to English medium
0
5
10
1980 1985 1990 1995 2000 20052010
Recruit teachers for English medium
0
5
10
1980 1985 1990 1995 2000 20052010
Recruit teachers for English medium
0
10
20
30
1980 1985 1990 1995 2000 20052010
Added ties and belts to uniforms
0
5
10
15
1980 1985 1990 1995 2000 20052010
Added ties and belts to uniforms
0
5
10
15
1980 1985 1990 1995 2000 20052010
Computer education as a subject
0
2
4
6
1980 1985 1990 1995 2000 20052010
Computer education as a subject
0
5
10
1980 1985 1990 1995 2000 20052010
Require homework diaries
0
2
4
6
1980 1985 1990 1995 2000 20052010
Require homework diaries

155
Kathmandu Chitwan
Figure 6.2 Historical trends in policy adoption: quasi-private instructional strategies (Number of schools, by year the school started adopting the policy) Source: Principal Survey. Note: Each school was asked whether they had adopted the policy, and the year they started adopting the policy. These charts plot the historical trends based on the year of policy adoption recall question.
05
101520
1980 1985 1990 1995 2000 20052010
School-leaving certificate exam (SLC) coaching
0
5
10
1980 1985 1990 1995 2000 20052010
SLC coaching
02468
1980 1985 1990 1995 2000 2005 2010
SLC coaching for weaker students
02468
1980 1985 1990 1995 2000 20052010
SLC coaching for weaker students
0
2
4
1980 1985 1990 1995 2000 20052010
Teachers fined for absenteeism
0
2
4
1980 1985 1990 1995 2000 20052010
Teachers fined for absenteeism
0
5
10
15
1980 1985 1990 1995 2000 20052010
Partly operational during vacations
0
5
10
1980 1985 1990 1995 2000 20052010
Partly operational during vacations
0
5
10
15
1980 1985 1990 1995 2000 20052010
Lengthened the school day
0
2
4
6
1980 1985 1990 1995 2000 20052010
Lengthened the school day
0246
1980 1985 1990 1995 2000 20052010
Extra time for weaker students (remedial)
0
2
4
6
1980 1985 1990 1995 2000 20052010
Extra time for weaker students
0
2
4
6
1980 1985 1990 1995 2000 20052010
Parents given report/monitor teacher absenteeism
0
2
4
6
1980 1985 1990 1995 2000 20052010
Parents given report/monitor teacher absenteeism
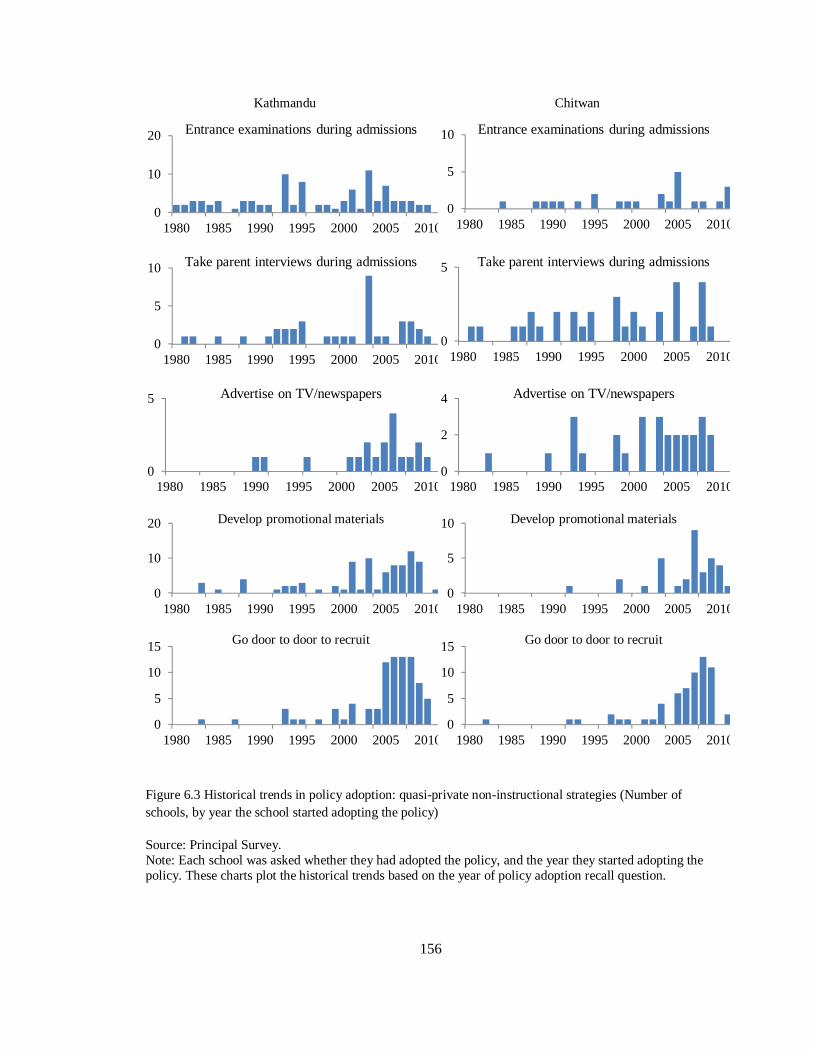
156
Kathmandu Chitwan
Figure 6.3 Historical trends in policy adoption: quasi-private non-instructional strategies (Number of schools, by year the school started adopting the policy)
Source: Principal Survey. Note: Each school was asked whether they had adopted the policy, and the year they started adopting the policy. These charts plot the historical trends based on the year of policy adoption recall question.
0
10
20
1980 1985 1990 1995 2000 20052010
Entrance examinations during admissions
0
5
10
1980 1985 1990 1995 2000 20052010
Entrance examinations during admissions
0
5
10
1980 1985 1990 1995 2000 20052010
Take parent interviews during admissions
0
5
1980 1985 1990 1995 2000 20052010
Take parent interviews during admissions
0
5
1980 1985 1990 1995 2000 20052010
Advertise on TV/newspapers
0
2
4
1980 1985 1990 1995 2000 20052010
Advertise on TV/newspapers
0
10
20
1980 1985 1990 1995 2000 20052010
Develop promotional materials
0
5
10
1980 1985 1990 1995 2000 20052010
Develop promotional materials
0
5
10
15
1980 1985 1990 1995 2000 20052010
Go door to door to recruit
0
5
10
15
1980 1985 1990 1995 2000 20052010
Go door to door to recruit
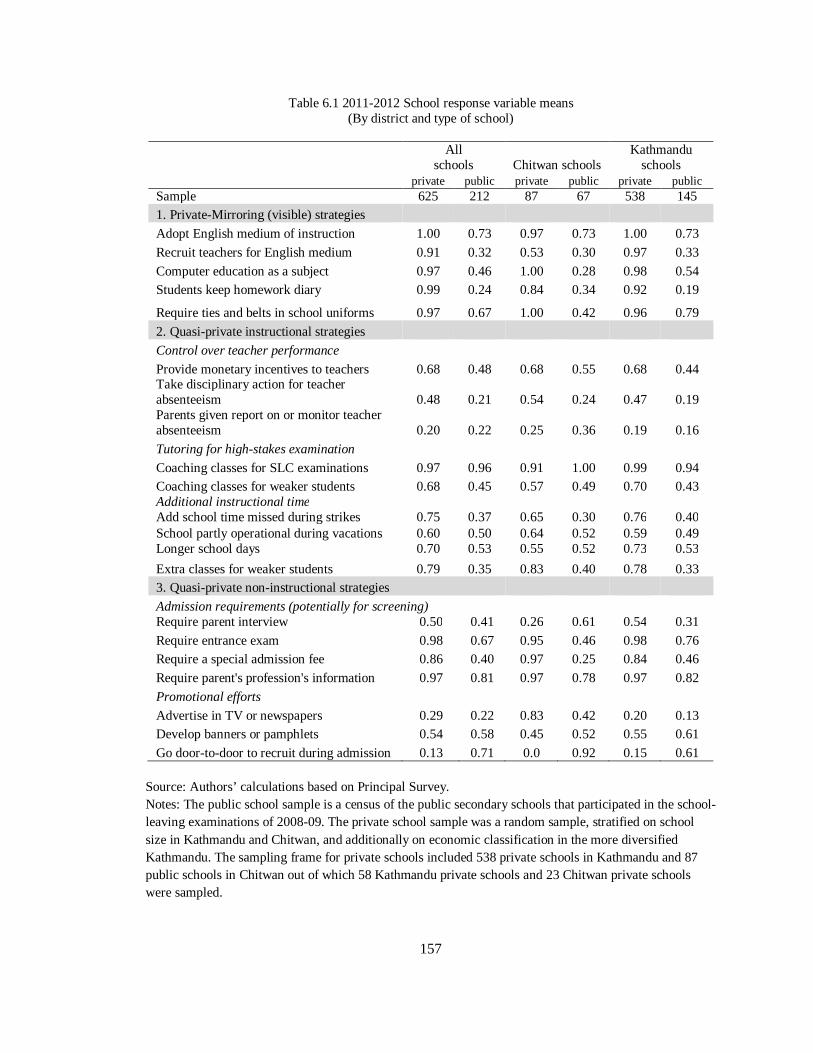
157
Table 6.1 2011-2012 School response variable means (By district and type of school)
All
schools Chitwan schools Kathmandu
schools private public private public private public Sample 625 212 87 67 538 145 1. Private-Mirroring (visible) strategies
Adopt English medium of instruction 1.00 0.73 0.97 0.73 1.00 0.73
Recruit teachers for English medium 0.91 0.32 0.53 0.30 0.97 0.33
Computer education as a subject 0.97 0.46 1.00 0.28 0.98 0.54 Students keep homework diary 0.99 0.24 0.84 0.34 0.92 0.19
Require ties and belts in school uniforms 0.97 0.67 1.00 0.42 0.96 0.79
2. Quasi-private instructional strategies
Control over teacher performance
Provide monetary incentives to teachers 0.68 0.48 0.68 0.55 0.68 0.44 Take disciplinary action for teacher absenteeism 0.48 0.21 0.54 0.24 0.47 0.19 Parents given report on or monitor teacher absenteeism 0.20 0.22 0.25 0.36 0.19 0.16
Tutoring for high-stakes examination
Coaching classes for SLC examinations 0.97 0.96 0.91 1.00 0.99 0.94 Coaching classes for weaker students 0.68 0.45 0.57 0.49 0.70 0.43 Additional instructional time Add school time missed during strikes 0.75 0.37 0.65 0.30 0.76 0.40 School partly operational during vacations 0.60 0.50 0.64 0.52 0.59 0.49 Longer school days 0.70 0.53 0.55 0.52 0.73 0.53
Extra classes for weaker students 0.79 0.35 0.83 0.40 0.78 0.33 3. Quasi-private non-instructional strategies
Admission requirements (potentially for screening) Require parent interview 0.50 0.41 0.26 0.61 0.54 0.31
Require entrance exam 0.98 0.67 0.95 0.46 0.98 0.76 Require a special admission fee 0.86 0.40 0.97 0.25 0.84 0.46
Require parent's profession's information 0.97 0.81 0.97 0.78 0.97 0.82
Promotional efforts
Advertise in TV or newspapers 0.29 0.22 0.83 0.42 0.20 0.13 Develop banners or pamphlets 0.54 0.58 0.45 0.52 0.55 0.61
Go door-to-door to recruit during admission 0.13 0.71 0.0 0.92 0.15 0.61 Source: Authors’ calculations based on Principal Survey. Notes: The public school sample is a census of the public secondary schools that participated in the school-leaving examinations of 2008-09. The private school sample was a random sample, stratified on school size in Kathmandu and Chitwan, and additionally on economic classification in the more diversified Kathmandu. The sampling frame for private schools included 538 private schools in Kathmandu and 87 public schools in Chitwan out of which 58 Kathmandu private schools and 23 Chitwan private schools were sampled.
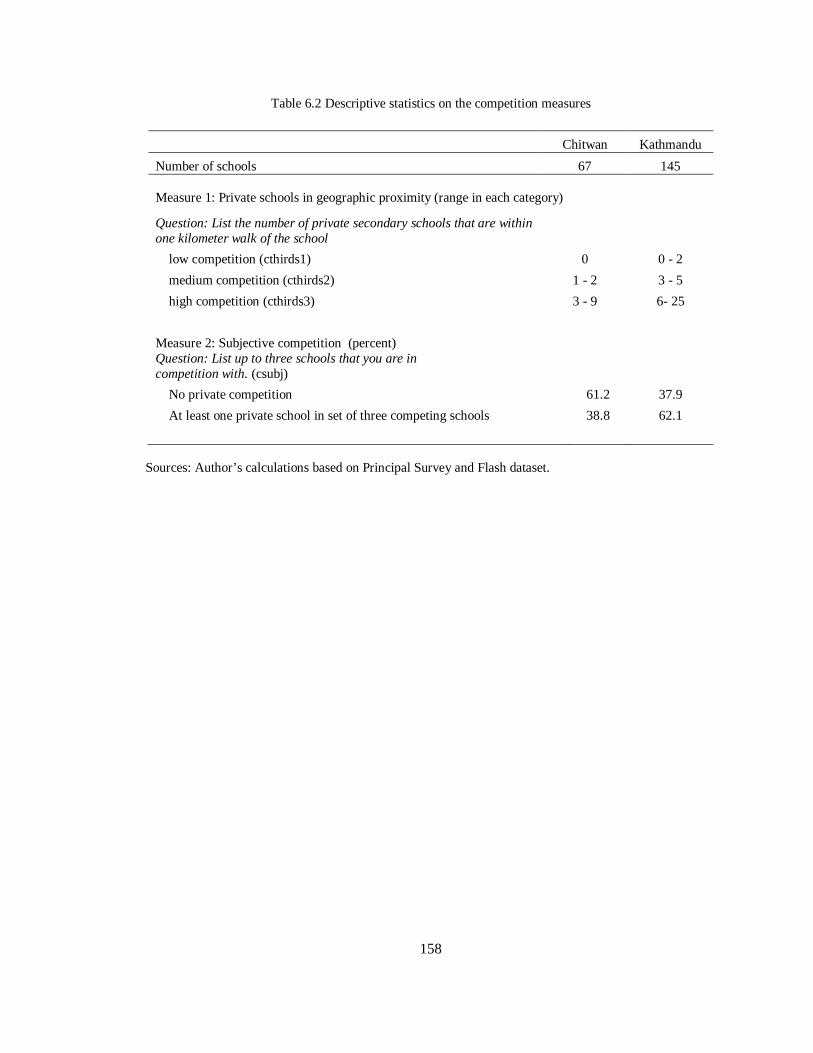
158
Table 6.2 Descriptive statistics on the competition measures
Chitwan Kathmandu
Number of schools 67 145 Measure 1: Private schools in geographic proximity (range in each category)
Question: List the number of private secondary schools that are within one kilometer walk of the school
low competition (cthirds1) 0 0 - 2
medium competition (cthirds2) 1 - 2 3 - 5
high competition (cthirds3) 3 - 9 6- 25
Measure 2: Subjective competition (percent) Question: List up to three schools that you are in competition with. (csubj)
No private competition 61.2 37.9
At least one private school in set of three competing schools 38.8 62.1
Sources: Author’s calculations based on Principal Survey and Flash dataset.
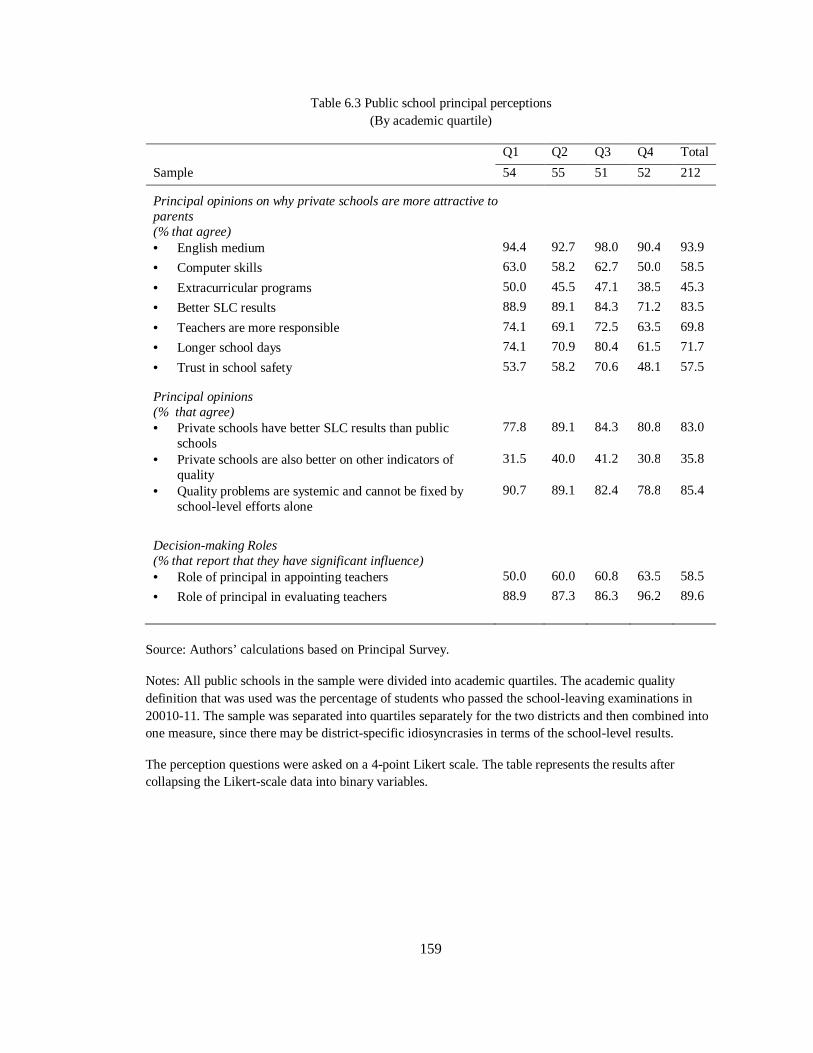
159
Table 6.3 Public school principal perceptions (By academic quartile)
Q1 Q2 Q3 Q4 Total
Sample 54 55 51 52 212
Principal opinions on why private schools are more attractive to parents (% that agree)
• English medium 94.4 92.7 98.0 90.4 93.9
• Computer skills 63.0 58.2 62.7 50.0 58.5
• Extracurricular programs 50.0 45.5 47.1 38.5 45.3
• Better SLC results 88.9 89.1 84.3 71.2 83.5
• Teachers are more responsible 74.1 69.1 72.5 63.5 69.8
• Longer school days 74.1 70.9 80.4 61.5 71.7
• Trust in school safety 53.7 58.2 70.6 48.1 57.5
Principal opinions (% that agree)
• Private schools have better SLC results than public schools
77.8 89.1 84.3 80.8 83.0
• Private schools are also better on other indicators of quality
31.5 40.0 41.2 30.8 35.8
• Quality problems are systemic and cannot be fixed by school-level efforts alone
90.7 89.1 82.4 78.8 85.4
Decision-making Roles (% that report that they have significant influence)
• Role of principal in appointing teachers 50.0 60.0 60.8 63.5 58.5
• Role of principal in evaluating teachers 88.9 87.3 86.3 96.2 89.6
Source: Authors’ calculations based on Principal Survey.
Notes: All public schools in the sample were divided into academic quartiles. The academic quality definition that was used was the percentage of students who passed the school-leaving examinations in 20010-11. The sample was separated into quartiles separately for the two districts and then combined into one measure, since there may be district-specific idiosyncrasies in terms of the school-level results.
The perception questions were asked on a 4-point Likert scale. The table represents the results after collapsing the Likert-scale data into binary variables.
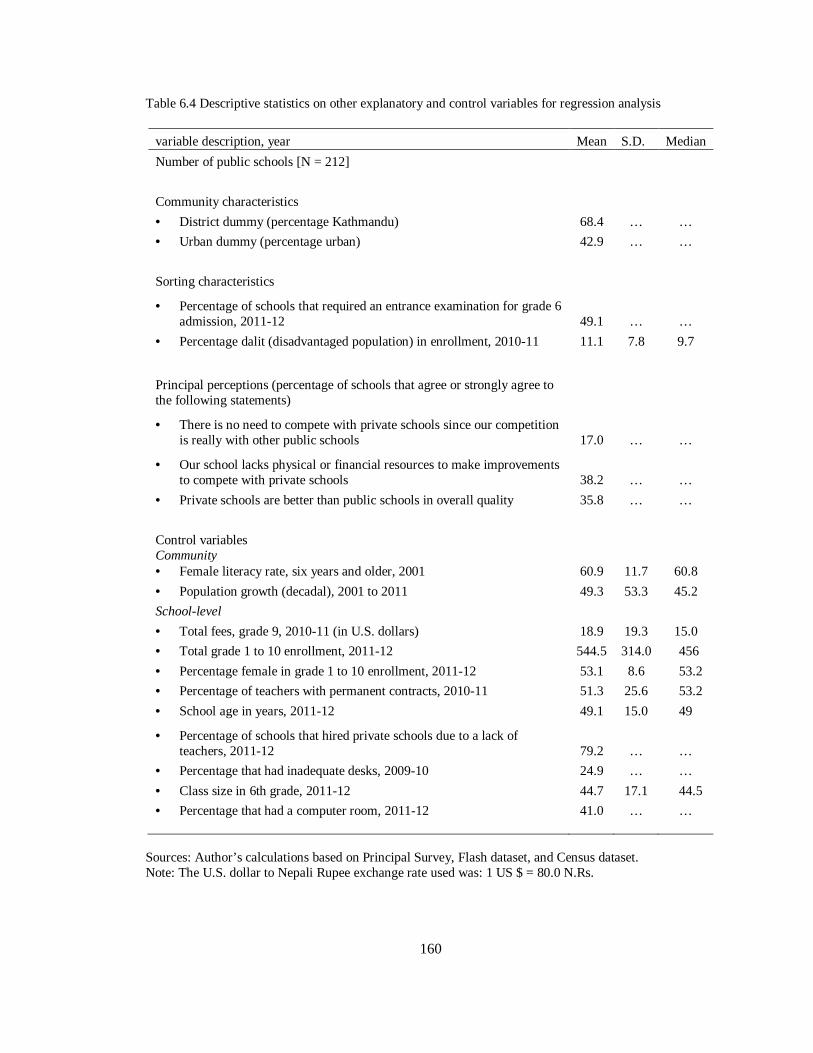
160
Table 6.4 Descriptive statistics on other explanatory and control variables for regression analysis
variable description, year Mean S.D. Median
Number of public schools [N = 212]
Community characteristics
• District dummy (percentage Kathmandu) 68.4 … …
• Urban dummy (percentage urban) 42.9 … …
Sorting characteristics
• Percentage of schools that required an entrance examination for grade 6 admission, 2011-12 49.1 … …
• Percentage dalit (disadvantaged population) in enrollment, 2010-11 11.1 7.8 9.7
Principal perceptions (percentage of schools that agree or strongly agree to the following statements)
• There is no need to compete with private schools since our competition is really with other public schools 17.0 … …
• Our school lacks physical or financial resources to make improvements to compete with private schools 38.2 … …
• Private schools are better than public schools in overall quality 35.8 … …
Control variables Community • Female literacy rate, six years and older, 2001 60.9 11.7 60.8
• Population growth (decadal), 2001 to 2011 49.3 53.3 45.2
School-level
• Total fees, grade 9, 2010-11 (in U.S. dollars) 18.9 19.3 15.0
• Total grade 1 to 10 enrollment, 2011-12 544.5 314.0 456
• Percentage female in grade 1 to 10 enrollment, 2011-12 53.1 8.6 53.2
• Percentage of teachers with permanent contracts, 2010-11 51.3 25.6 53.2
• School age in years, 2011-12 49.1 15.0 49
• Percentage of schools that hired private schools due to a lack of teachers, 2011-12 79.2 … …
• Percentage that had inadequate desks, 2009-10 24.9 … …
• Class size in 6th grade, 2011-12 44.7 17.1 44.5
• Percentage that had a computer room, 2011-12 41.0 … …
Sources: Author’s calculations based on Principal Survey, Flash dataset, and Census dataset. Note: The U.S. dollar to Nepali Rupee exchange rate used was: 1 US $ = 80.0 N.Rs.
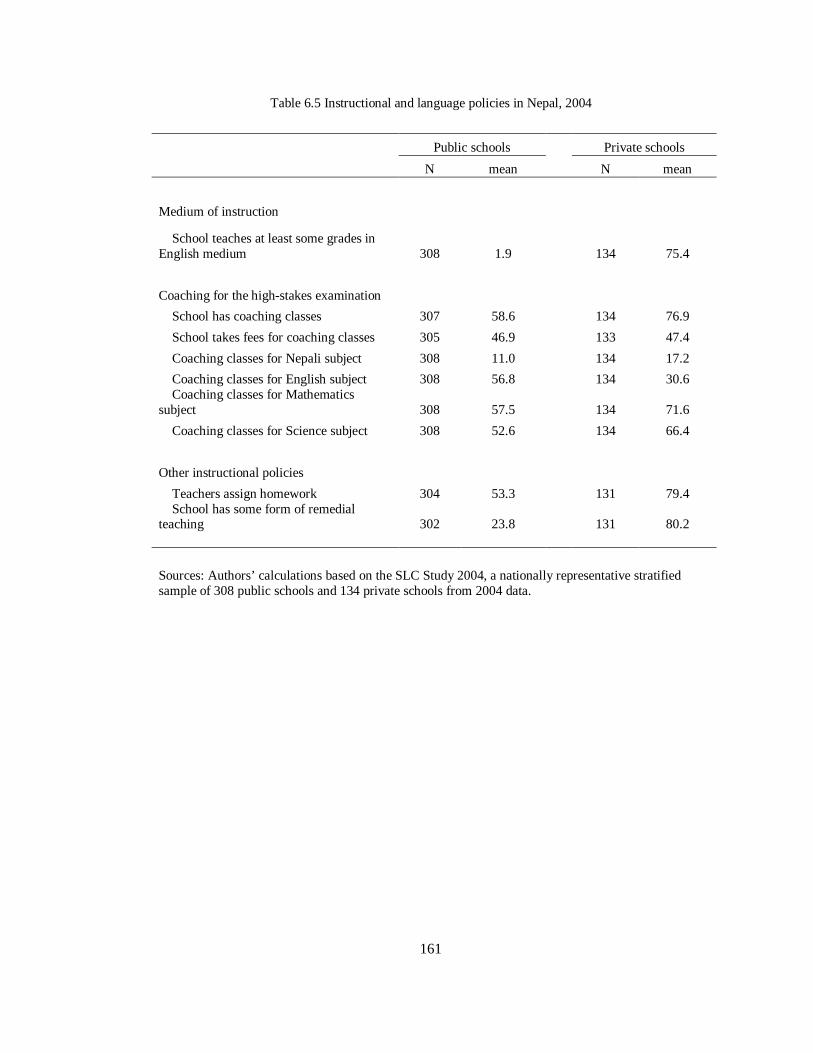
161
Table 6.5 Instructional and language policies in Nepal, 2004
Public schools Private schools
N mean N mean
Medium of instruction
School teaches at least some grades in English medium 308 1.9
134 75.4
Coaching for the high-stakes examination School has coaching classes 307 58.6
134 76.9
School takes fees for coaching classes 305 46.9
133 47.4
Coaching classes for Nepali subject 308 11.0
134 17.2
Coaching classes for English subject 308 56.8
134 30.6 Coaching classes for Mathematics
subject 308 57.5
134 71.6
Coaching classes for Science subject 308 52.6
134 66.4
Other instructional policies Teachers assign homework 304 53.3
131 79.4
School has some form of remedial teaching 302 23.8
131 80.2
Sources: Authors’ calculations based on the SLC Study 2004, a nationally representative stratified sample of 308 public schools and 134 private schools from 2004 data.

162
Table 6.6 2011-2012 School response variable means (By competition measures)
All public
Subjective measure Objective measure
No
Compn Compn low med high Sample 212 96 116 76 83 53
1. Private-Mirroring (visible) strategies
English medium
• Adopted English medium of instruction 0.73 0.66 0.79 0.74 0.73 0.72
Teach in English medium, at least three grades 0.30 0.23 0.36 0.37 0.29 0.23
• Recruited teachers for English medium 0.32 0.28 0.35 0.29 0.31 0.38
Computer education
• Provided computer education as a subject 0.46 0.42 0.50 0.43 0.43 0.55
Teach computer classes for at least three grades 0.28 0.28 0.28 0.25 0.27 0.34
Students keep homework diary 0.24 0.22 0.25 0.21 0.20 0.32
Require ties and belts in school uniforms 0.67 0.57 0.76 0.68 0.71 0.60
2. Quasi-private instructional strategies
Control over teacher performance
• Provide monetary incentives to teachers 0.48 0.51 0.45 0.47 0.43 0.55
• Take disciplinary action for teacher absenteeism 0.21 0.17 0.24 0.13 0.30 0.17 • Parents given report / monitor teacher
absenteeism 0.22 0.17 0.27 0.17 0.30 0.17
SLC coaching classes for weaker students 0.45 0.50 0.41 0.45 0.37 0.57
Instructional time
• Add school time missed during strikes 0.37 0.40 0.34 0.34 0.34 0.45
Add school time during strikes, three grades 0.23 0.27 0.20 0.18 0.23 0.30
• School partly operational during vacations 0.50 0.47 0.53 0.50 0.48 0.53
Add school time during vacations, three grades 0.19 0.22 0.17 0.20 0.20 0.17
• Longer school days 0.53 0.50 0.55 0.41 0.53 0.70 Longer school days, three grades 0.27 0.28 0.27 0.16 0.35 0.32
• Extra classes for weaker students 0.35 0.32 0.38 0.36 0.35 0.36
Extra classes for weaker students, three grades 0.14 0.10 0.16 0.12 0.18 0.09 3. Quasi-private non-instructional strategies Admission selectivity • Take entrance examinations 0.67 0.61 0.71 0.61 0.61 0.83 • Require parent interview 0.41 0.44 0.38 0.38 0.46 0.36 • Require a special admission fee 0.40 0.40 0.40 0.36 0.41 0.43 Promotional efforts
• Advertisements on TV and in newspapers 0.22 0.20 0.24 0.18 0.27 0.21 • Developing banners or pamphlets 0.58 0.57 0.55 0.55 0.57 0.66 • Go door-to-door to recruit 0.71 0.69 0.72 0.78 0.77 0.51
Sources: Authors’ calculations based on Principal Survey. Notes: Subjective measure is defined as equaling 1 if the public school principal mentions at least one private school when asked to list three competing schools. The objective measure is a categorical indicator based on the number of private secondary schools in geographic proximity to the public schools.
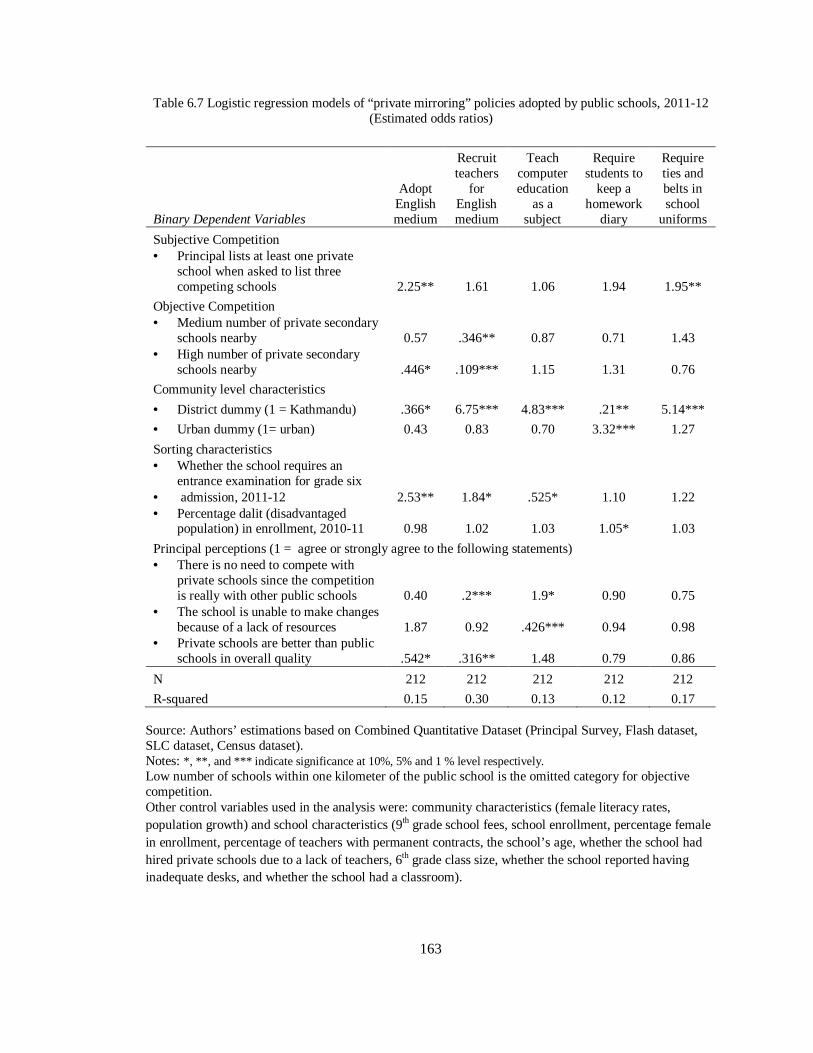
163
Table 6.7 Logistic regression models of “private mirroring” policies adopted by public schools, 2011-12 (Estimated odds ratios)
Binary Dependent Variables
Adopt English medium
Recruit teachers
for English medium
Teach computer education
as a subject
Require students to
keep a homework
diary
Require ties and belts in school
uniforms
Subjective Competition • Principal lists at least one private
school when asked to list three competing schools 2.25** 1.61 1.06 1.94 1.95**
Objective Competition • Medium number of private secondary
schools nearby 0.57 .346** 0.87 0.71 1.43 • High number of private secondary
schools nearby .446* .109*** 1.15 1.31 0.76
Community level characteristics
• District dummy (1 = Kathmandu) .366* 6.75*** 4.83*** .21** 5.14***
• Urban dummy (1= urban) 0.43 0.83 0.70 3.32*** 1.27
Sorting characteristics • Whether the school requires an
entrance examination for grade six • admission, 2011-12 2.53** 1.84* .525* 1.10 1.22 • Percentage dalit (disadvantaged
population) in enrollment, 2010-11 0.98 1.02 1.03 1.05* 1.03
Principal perceptions (1 = agree or strongly agree to the following statements) • There is no need to compete with
private schools since the competition is really with other public schools 0.40 .2*** 1.9* 0.90 0.75
• The school is unable to make changes because of a lack of resources 1.87 0.92 .426*** 0.94 0.98
• Private schools are better than public schools in overall quality .542* .316** 1.48 0.79 0.86
N 212 212 212 212 212
R-squared 0.15 0.30 0.13 0.12 0.17 Source: Authors’ estimations based on Combined Quantitative Dataset (Principal Survey, Flash dataset, SLC dataset, Census dataset). Notes: *, **, and *** indicate significance at 10%, 5% and 1 % level respectively. Low number of schools within one kilometer of the public school is the omitted category for objective competition. Other control variables used in the analysis were: community characteristics (female literacy rates, population growth) and school characteristics (9th grade school fees, school enrollment, percentage female in enrollment, percentage of teachers with permanent contracts, the school’s age, whether the school had hired private schools due to a lack of teachers, 6th grade class size, whether the school reported having inadequate desks, and whether the school had a classroom).

164
Table 6.8 Logistic regression models of quasi-private instructional policies adopted by public schools (Estimated odds ratios)
Binary Dependent Variables
SLC coaching
for weaker students
Teachers fined for
being absent
Parents involved in monitoring
teacher absenteeism
School partly
operational during
vacations
Longer school days
Extra classes
for weaker students
Subjective Competition • Principal lists at least one
private school when asked to list three competing schools .602* 1.22 2.95** 1.39 1.18 1.59*
Objective Competition • Medium number of private
secondary schools nearby 0.87 1.43 2.42* 0.82 2.17** 0.83 • High number of private
secondary schools nearby 1.15 0.76 1.00 0.88 4.38*** 0.76
Community level characteristics
• District (1 = Kathmandu) 4.83*** 5.14*** .171*** .241** 0.84 .312**
• Urban dummy (1 = urban) 0.70 1.27 1.30 1.09 2.13 0.89 Sorting characteristics • Whether the school requires
an entrance examination for grade 6 admission, 2011-12 .525* 1.22 1.48 3.96*** 1.86 2.79***
• Percentage dalit (disadvantaged population) in enrollment, 2010-11 1.03 1.03 0.98 0.98 1.03 0.99
Principal perceptions (1 = agree or strongly agree to the following statements) • There is no need to compete
with private schools since the competition is really with other public schools 1.9* 0.75 0.81 0.59 2.06** 1.19
• The school is unable to make changes because of a lack of resources .426*** 0.98 1.64 .529** 0.77 0.54
• Private schools are better than public schools in overall quality 1.48 0.86 0.65 1.77* 0.79 0.60
N 212 212 212 212 212 212 R-squared 0.13 0.17 0.15 0.14 0.15 0.13
Source: Authors’ estimations based on Combined Quantitative Dataset. Notes: *, **, and *** indicate significance at 10%, 5% and 1 % level respectively. Low number of schools within one kilometer of the public school as omitted category for objective competition. Other control variables used in the analysis were: community characteristics (female literacy rates, population growth) and school characteristics (9th grade school fees, school enrollment, percentage female in enrollment, percentage of teachers with permanent contracts, the school’s age, whether the school had hired private schools due to a lack of teachers, 6th grade class size, whether the school reported having inadequate desks, and whether the school had a classroom).

165
Table 6.9 Logistic regression models of quasi-private non-instructional policies adopted by public schools (Estimated odds ratios)
Binary Dependent Variables
Require parent
interview
Take entrance exams
Advertise on TV or in news papers
Develop banners or pamphlets
for promotions
Go door to door during
recruiting season
Subjective Competition
• Principal lists at least one private school when asked to list three competing schools 1.06 1.06 1.98** 1.17 1.87*
Objective Competition • Medium number of private
secondary schools nearby 1.49 0.65 1.63 1.01 1.40 • High number of private secondary
schools nearby 0.79 1.34 1.25 1.06 0.88
Community level characteristics
• District dummy (1 = Kathmandu) .26*** 5.65*** .126*** 1.24 .254***
• Urban dummy (1 = urban) 1.74 0.67 1.22 3.82*** 0.90
Sorting characteristics • Whether the school requires an
entrance exam for grade six admission, 2011-12 … … .448** 0.94 0.59
• Percentage dalit (disadvantaged population) in enrollment, 2010-11 1.00 0.98 0.98 1.04* 1.09***
Principal perceptions (1 = agree or strongly agree to the following statements) • There is no need to compete with
private schools since the competition is really with other public schools 1.33 0.90 3.02** .538* 0.71
• The school is unable to make changes because of a lack of resources 1.61 0.75 1.05 0.80 0.74
• Private schools are better than public schools in overall quality 1.08 1.45 1.51 0.79 0.86
N 212 212 212 212 212
R-squared 0.12 0.21 0.20 0.09 0.37 Source: Authors’ estimations based on Combined Quantitative Dataset. Notes: *, **, and *** indicate significance at 10%, 5% and 1 % level respectively. Low number of schools within one kilometer of the public school as omitted category for objective competition. Other control variables used in the analysis were: community characteristics (female literacy rates, population growth) and school characteristics (9th grade school fees, school enrollment, percentage female in enrollment, percentage of teachers with permanent contracts, the school’s age, whether the school had hired private schools due to a lack of teachers, 6th grade class size, whether the school reported having inadequate desks, and whether the school had a classroom).

166
CHAPTER 7
THE FACTORS THAT MEDIATE HOW
PUBLIC SCHOOLS RESPOND TO PRIVATE COMPETITION
Abstract
This chapter analyzes the factors that mediate public schools’ ability to productively
respond to competition from private schools. An understanding of impediments can help
policymakers better target their attention to the key bottlenecks and the most disadvantaged
populations. I conduct a two-step mixed methods analysis. I first conduct qualitative analysis of
interview data and descriptive statistics of principal perceptions to describe the barriers to reform
that generally affect public schools more frequently than private schools. Then, I analyze
whether the barriers (and supports) to reform can be systematically linked to the extent of
privatization by conducting logistic regressions of the perception indicators of barriers and
supports to reform on competition measures, school and community covariates. I find that the
obstacles to improvements include not only well-known factors such as bureaucratic rigidities
and financial constraints, but also lesser-recognized impediments such as direct political
interference in the education sector and stigmatization of public schooling. Over time, a growing
lack of trust has led to middle class flight from public schools, leaving public schools with a
concentration of students from disadvantaged backgrounds. The regression analyses indicate that
the barriers to reform are especially heightened in public schools that face higher levels of
private competition. These findings are consistent with the notion that the combination of a lack
of community involvement and political interference in public education may have significantly
reduced the school personnel’s motivation to reform.

167
Introduction
This chapter was motivated by the question, can public schools in developing countries
respond effectively to increased competition from the private sector? An understanding of
impediments and supports to public school reform efforts is critical for the long-term survival of
public schools since private schools are growing in popularity in emerging Asia and Africa
(Thapa, 2011; Tooley and Dixon, 2005; World Bank, 2013). Specifics on the key constraints and
challenges to reforms can improve policy targeting on the key bottlenecks and disadvantaged
populations. Moreover, the strand of choice research that investigates public school constraints in
responding to competition is absent in the developing country literature. Specifically, I analyze
the factors that facilitate or constrain public school officials’ attempts to productively respond to
competition from private schools. I show that public schools face intense political interference, a
lack of parental engagement and community support, and a lack of well-defined accountability
incentives that impede their ability to effectively compete with private schools. In addition, I
highlight the substantial variations within the public sector in their experience of these
constraints, as some schools have been able to thrive despite difficult bureaucratic and political
conditions. Furthermore, I find that principals of public schools that face more competition are
more likely to highlight poor government monitoring and the lack of parental educational
awareness than principals of public schools that face less competition.
Conceptual Framework and Research Questions
As discussed in the literature review, previous research into the processes of school
choice has suggested that a competitive response is determined by an evolving set of mediating
factors, such as resource constraints and personal motivation and expectations (Hess, Maranto
and Milliman, 2001; Mohrman and Lawler, 1996; Zief, Maynard, Bradley, Keefe, and Kralik,
2005). In fact, it is the complexity of the competitive process that has led to the rise of explicit
accountability pressures to incentivize productive public school behavior in many developed

168
countries (Rouse et al., 2007). In Chapter 5, I discussed some key accountability pressures that
may have begun to motivate public schools to consider private schools as competition. Once they
have decided to respond to private competition with policy actions, which are described in
Chapter 6, public schools’ success in instituting these policies are dependent on adequate
supportive conditions from the bureaucracy, community, and policy environment. It is likely that
these conditions vary significantly between the public and private sectors, and also within the
public sector.
In the chapter, I address the research question: What are the factors that mediate how
public schools respond to competition? Specifically, I ask:
(1) What are the barriers and supports faced by public schools in instituting reforms and
responding to competition?
(2) Do principal perceptions on the key barriers and supports to reform differ by the
extent of private competition faced by the school?
Data and Methods
Data sources
Qualitative data
The qualitative data includes over 80 interviews that I conducted with public and private
school principals, education officials, and a smaller sample of teachers and school management
committee members. The education officials I interviewed included resource persons and school
supervisors (responsible for local level school supervision), district education officers and
section officers (responsible for the entire district’s supervision), and deputy directors at the
Department of Education, Ministry of Education, National Planning Commission and National
Curriculum Development (responsible for national level planning and implementation). The
stakeholders provided their perspectives on the factors that constrain public school reform
efforts. I compiled these varied perspectives to highlight the variations in constraints that were

169
stressed by stakeholders in different districts and at different levels of the education bureaucracy.
National level policymakers provided perspectives on the national state of affairs, a discussion of
the efficacy of current and past policy trends, and their assessments of why public schools are
not able to compete with private schools. District level officials’ opinions provided their
understanding of the variations in school quality that exist within the district, and of the impact
of the rise of privatization for their district. Local level officials provided clarity on the
heterogeneity in public school quality in smaller local education markets. Finally, public and
private school principals provided a sense of the constraints and supports that public schools
faced as they attempted to compete with private schools.
Quantitative data
I utilized primary and secondary data sources compiled into a “Combined Quantitative
Dataset” to analyze the relationship between principal perceptions on the barriers and supports to
reform, competition measures, and school and community variables45.
Principal perceptions. Principals were asked questions pertaining to the extent of
decision-making control of different stakeholders, the stigmatization of public schooling, school
climate and political interference, public-private differences, and the expectations and
motivations to compete. School principals were asked these questions on a 4-point ordered scale.
By responding to these questions, the school principals revealed their opinions on the factors that
constrain or support their ability to reform or respond to competition. The majority of the
statements were phrased in a manner that if they agreed to the statement then that would imply
that the public school faced barriers to reform. Specifically, if public schools agree that they face
more political interference or more disadvantaged student backgrounds than private schools, then
it would be a significant barrier for the public school as they attempt to implement any kind of
45 The data sources are mapped in Figure 4.1, and are described in more detail in Chapter 4 on Data and Methods. The competition measures are discussed in more detail in Chapter 5’s data section.

170
systemic reform. In terms of decision-making, if the principals perceive that the district
education officers have a large role in school related decisions or that the principals themselves
have limited influence, then it would suggest that principals have less flexibility to suggest
reforms. If the principals agree that their schools (or public schools in general) lack the
motivation to compete because of a lack of government monitoring, financial resources, teacher
quality, or greater political interference, then it may suggest that the school officials have been
frustrated by having to deal with these specific barriers to reform. In contrast, some of the
statements were phrased in a manner that if they agreed to the statement then that would imply
that the public schools had supportive conditions. For instance, if the principals agreed that the
parents were actively involved in the school or that the teachers were of high quality, then that
would suggest that the school has important supports that would facilitate their quality
improvement efforts.
Empirical Strategy
I conducted a two-step mixed methods analysis. I first analyzed the qualitative
interviews and the descriptive data on the barriers to reform. Then, I conducted logistic
regression analysis on the perception indicators on the key barriers to reform. To address
Research Question 1, the identification of the key constraints faced by public schools, I coded all
interviews for stakeholder’s views on motivations and expectations, and the main supports and
constraints available to function effectively, or encountered while responding to competition. I
highlighted the key supports and constraints, and also discuss how perspectives on these key
factors vary by district, urbanicity, and by types of stakeholders. To complement the qualitative
analysis, I descriptively analyzed the differences between public and private school principals’
perceptions on the political, social and policy environment barriers to reform. In the analysis, I
transformed the Likert 4-scale perception questions to binary data.

171
To address Research Question 2, whether perceptions vary by the extent of competition,
I quantitatively analyzed some key principal perceptions on barriers to reform. I only analyzed
the perceptions on the barriers to reform that had substantial variation (that is, where public
schools did not universally agree or disagree to the perception statements). I ran the logistic
regressions of perception questions on competition measures, community and school-level
variables. I argue that constraints faced by public schools will be heightened in high privatization
(primarily urban) regions as they may experience a more intense lack of community support and
political pressure. Therefore, I test the hypothesis that principals of public schools in high
competition regions are more likely to perceive severe constraints and limitations than public
schools in low competition regions.
Limitations. All public schools require supportive conditions to be able to function well
and to be able to respond to competition. A limitation of the study is that when officials and
parents talk about school responses, they are generally referring to school functioning overall and
not exclusively about their ability to respond to competition. However, the conditions that aid or
impede their ability to function are also linked to those that aid/impede their ability to respond to
competition. There are some instances when they discuss specific changes they made in a desire
to compete, for instance, by transitioning to English medium of instruction. While these
comments were limited they were useful to paint a picture of how schools view their challenges
as they make improvements. I additionally try to address this limitation with the quantitative
analysis to provide a sense of the association between competition and principal perceptions.
Model
The cross-sectional model for the logistic regression analysis is of the following form46:
46 I also ran the following models of the objective and subjective measures separately.
Pi = α + β1Csubj + γP + δZ + ε (Model 1a) Pi = α + β2C thirds2 + β3C thirds3 + γP + δZ + ε (Model 1b)
172
Pi = α + β1Csubj + β2C thirds2 + β3C thirds3 + γP + δZ + ε (Model 1)
Where Pi is the perception of a public school principal of perception question i,
discussed in Research Question 1; Cthirds2 and Cthirds3 represent categorical indicators of
competition47 - the medium and high number of private secondary schools in geographic
proximity (the omitted category is low competition, i.e. low number of private secondary schools
in geographic proximity), and Csubj represents the subjective competition measure, whether the
school had mentioned at least one private school as a competing school; and Z includes
explanatory and control variables. The key parameters of interest are β1, β2, and β3, which measure
the effect of competition on the principal perceptions on key constraints. The variable definitions
and descriptive statistics on the explanatory and control variables are listed in Table 7.1.
Results
What are the Key Barriers and Supports Faced by Public Schools in Instituting Reforms
and Responding to Competition?
Political interference
All of the stakeholders at the national, district, local and school levels unanimously
agreed that the politicization of education was the central problem hindering public school
improvements, and consequently, their ability to compete with private schools. They argue that
political interference pervades every aspect of society, and consequently, the school system
functioning in Nepal. In fact, politics is so pervasive that one school principal even closed down
Re-estimating the model with the subjective and objective measures separately did not change the estimation results for the key covariates in any substantial manner. Hence, these results are not described in the text. 47 The continuous variable that measured the geographic proximity measure of competition was converted to a categorical variable that took three values (low, medium and high competition for the analysis). I decided to use a categorical transformation into high, medium and low competition because I felt that it would be better for interpretation, because competition may not have a linear relationship with the policy response. On the other hand, I felt that a binary transformation (1 = at least one private school) would not capture the variations in the competitive environment.
173
their budding alumni association because these alumni started “playing politics” and fighting for
their party’s rights. To quote a Department of Education Deputy Director:
“The political situation and thinking is what has hampered the determination and ability of the team to work hard. Politically, all the teachers are divided. And so are the school management committees (management boards). And so is society. When you talk about children, they ask “whose child” they are and “which party” they belong to.” (personal communication, July 28 2010) While the Nepal education system consists of a large private sector in urban markets,
officials argue that the private system is relatively insulated from ongoing political interference,
despite being used as political targets by left-wing politicians. As shown in Table 7.2, there is
near universal agreement among public and private school principals that public schools
experience more political pressures than private schools.
The omnipresence of political influence has interlinked manifestations for decision-
making and policy implementation at different levels of the education system. Firstly, the lack of
political stability and almost annual changes in government over Nepal’s two decade-long
democratic rule has implied that there are significant challenges in planning for education. Public
school officials and national officials acknowledge that there is a dearth of people who are
actually interested in developing an educational vision as everyone is focused on preserving their
jobs. For instance, most planners are risk averse since jobs are linked to people rather than
institutions, and each transitional government leads to a change in positions in important
institutions like the National Planning Commission and the Ministry of Education. To quote a
ministry official:
“The national plans are made by the National Planning Commission. The problem there is that people are changed frequently due to political change…Everybody gets their share in leadership… in Nepal, we only design the plan of the one who becomes the minister. Then, when the next minister comes, he will say that the previous plan was the worst, and he will design another one. So that is the dilemma in Nepal.” (personal communication, June 7 2011)

174
National policymakers also pointed out the difficulty caused because of incomplete
cycles of reforms in the country, stressing how a country like Nepal differs from developed
countries in how they implemented and evaluated policies. To quote a national expert who has
been active in education planning for the past four decades:
“They (the U.S.) are doing reforms with a rationale in their mind, and do an evaluation to verify the output at the end. They do cycles of reform over there, but they complete the cycle. I think that changes happen because of a change in political leadership. But the problem over here is that at times we won’t even have started the cycle or may have just started the cycle and then we have to stop it. We never complete it. Even if we complete it, it is not evaluated at all and then changed without any evaluation.” (personal communication, July 5 2010) Within the education system, a hallmark of the Nepalese system is the excessive political
influence which has led to a situation where teachers are more focused on political interests than
on professional development. There are as many teacher unions as political associations, which
are divided on ideological lines and support left-wing and right-wing policies. Due to the
multitude of teacher unions jostling for political power, they are unlikely to make unified
decisions and thus hamper school functioning even further. Leftist ideology based politics
pervades various aspects of schooling and have led to regular protests or strikes on politicized
issues as varied as banning private schooling, forcing teachers to teach their children in public
schools, and ensuring that public schools take no user fees.
Interestingly, the policy planners and implementers stressed how these differences in
ideology were superficial at best, particularly in the current private schooling landscape. Many
principals, district and national officials talked about the hypocritical system where national
political leaders who supported or initiated the public campaign of banning private education
were actually owners of private schools. As expounded by a Department of Education Deputy
Director:
“Of the 4000 private schools, over 1200 are owned by the Maoist leaders! Never mind them sending their children to private schools – they are in charge of 25% of the sector! And the party policy is to “take out all of your children from private schools and send
175
them to public schools”. So they have to say one thing in their agenda and do something else while in power. They can't close all private schools either… But they still have to say that we have to shut down the schools. They are not in a position to be able to say we will allow them to exist because it seems like the private schools are necessary.” (personal communication, June 29 2011) National policymakers particularly lament the powerful role of politically affiliated
teacher unions and claim that they are unable to fix the major problems in education, specifically
the need to redistribute teachers between and within districts that have an excess number of
teachers and an inadequate number of teachers to equalize student-teacher ratios. A national
expert involved in school policymaking stated the following:
“I talked with one undersecretary about the government allotted teachers and he replied in the same way. If there is a high ratio of teachers in certain schools they cannot adjust transfers and they wait for directives from above because even if they try and change it they will face revolt from the teachers – this is all due to politics.” (personal communication, July 5 2010) Nepal has been on a path towards decentralization of authority to the district and local
levels for well over three decades. However, the implementation of more aggressive national
policies to decentralize authority to the school level, the Community School Support Project
(CSSP) launched in 2003, seem to have been particularly affected by political resistance. The
CSSP project was met with substantial resistance by teacher unions, as many teachers were
concerned about the changes implied in their job security. Teachers and party leaders typically
portrayed the policy as the government trying to shirk its responsibility from the education
sector, handing over authority for teacher transfers and teacher hires to less educated local
community members. Many national, district and school level officials pointed out how these
debates continue to rage years after the policies were first adopted.
At the district level, problems with political interference were typically reflections of the
national political climate, barring a few exceptional districts. For instance, all district officials
mentioned that they needed to engage with the political parties’ district level officials to ensure
that they could implement policies. Due to the decentralized and politicized nature of education,

176
district education officials talked about how they lacked authority to truly sanction schools or
teachers. At a more extreme level, district officials supposedly face threats from political parties
as politicians tried to intervene in district decision-making and planning. As recounted by a
teacher:
“There is an association in my district - there were no teachers in that association. All of them were political party members. They went to the district office and told the district education officer – “we will kill you right now. If you don't do what we tell you to do, then we will just kill you before you reach the door.” They were trying to get people from their association into the district education committee (planning board in the office). That organization has no teachers, and that is not allowed because of the regulations. And without the district education committee, when will they convene and when will they recommend that certain schools go through certain procedures?” (personal communication, July 28 2010) A local level official gave a specific example of how their efforts to redistribute teachers
in a Kathmandu location were ceased due to political authority a few years ago.
“We have also tried to do this earlier - about two years ago, we were really dedicated to complete the teacher equalization process... Then, the process was stopped because we got one phone call from the topmost level of political power. He just said – “don't do this” and that was that.” (personal communication, September 13 2011) At the school level, the stakeholders particularly highlighted the role played by political
pressures in teacher appointments and accountability, budget distribution, and school
improvements. Many of the principals suggested that public school teachers, including teachers
at their school, frequently work as local level political officials for their parties. Allegedly, the
political party affiliation is instrumental in teacher hiring and transferring decisions, and provides
teachers with protection against sanctions. For instance, in a well-functioning public school in
one of the study sites, the English teacher was absent for six months, and could not be replaced
with a substitute in time. The irresponsible behavior of the teacher resulted in an unprecedented
high number of failures in the high-stakes examination at the public school.
Most officials regarded public school teachers as highly qualified and trained
professionals, compared to relatively inexperienced private school teachers. However, there was

177
near unanimous agreement that many teachers felt immune from accountability, and principals
were typically unable to hold teachers accountable for their schooling performance. As described
by a Department of Education Deputy Director:
“It is not that there is no system for reward and punishment.... For example, the principal has been given the authority to cut seven days of pay for the school teacher. But the head teacher cannot cut the pay. The reason for this is that if they cut the salary for seven days – then the teacher will be affiliated with some political party and that party might threaten to attack him. Because of these reasons, he will not be able to implement this available policy. So, it's not like there are no rules. But since this is a transitional period in terms of politics, we have not been able to implement these policies.” (personal communication, July 28 2010) A principal from the capital noted that politically appointed teachers were a historically
accepted phenomenon in Nepal, but that there was a substantial rise in these appointments after
the Maoist civil war.
“The simple reason is that these party people fought in the battle, did so much, and then begged to have a job. Then where can you get work? The easiest place to get a job is in teaching. So, they were asked whether they would like to be a teacher. Now who will they place in teaching positions? Put yourself in that person’s shoes…Obviously you will choose your political person who had helped you in the past.” (personal communication, July 5 2011)
Besides teacher absenteeism and limited teacher effort, other substantial examples of
teacher political interference focused on the difficulties encountered in trying to transfer
teachers. For instance, a teacher mentioned how after trying to transfer one teacher, the district
education officer was transferred instead. Some parents and teachers also talked about additional
instances of within-school political activities that affected students more directly, such as how
teachers held political meetings within school grounds, or took their students to political rallies.
Politics apparently also played a significant role in budget distributions and school
financing. A few principals alleged that the lack of party affiliation and networks often hurt
schools when it came to procuring additional budgeting support. The majority of public school
principals argued that the national-level decentralization policy to empower communities seems
to have had the significant unintended consequence of increasing political interference.
178
Allegedly, community members who are divided along party lines have joined individual school
management committees to use it as another opportunity for political influence – for instance,
with the goal of providing teaching jobs to members of their political party. The increased
community role is also accompanied by an increase in nepotism in the school management
committee – for instance, the desire and the power to hire your own children as teachers. Some
school management committee related tensions included the absence of an SMC for years on
end, because of party politics. As a result, some schools were unable to complete outstanding
building renovation projects. In other schools, ongoing disputes with the community meant that
schools could not utilize the available land as an asset to generate additional revenues for school
improvements. A local education official (resource person) who was regularly part of school-
management committee formation discussions in Chitwan said the following:
“I haven't seen anyone talk about quality at all in even one place (while attending school management formation discussions). It's all about politics. This is the major frustration and constraint here.
How do you handle this (politics) then? What is your role?
We have such a major difficulty here. It's as if we are administrators who are involved in an election campaign. We should not have to do this. There is so much time that we lose doing all this. When we go to the schools we have to spell out the rules in the education act regarding the school management committee – that only the “real” relatives (whose child studies at that school) can come in. And even within the real relatives, the discussion is based on politics. Among these relatives, there is a discussion about how the head of the committee has to be from my party, that in the 10-member SMC, there have to be at least four from my party, and so on.” (personal communication, August 7 2011) Contradictory findings. However, there are some schools and districts that talked about
how they were able to thrive despite the claustrophobic political environment due to their
focused teamwork. The most striking examples came from the principal of nationally renowned
school “A” who mentioned that he was able to work with a teaching team from various political
affiliations by insisting that all teachers “leave politics outside the school gates during school
hours.” He argued that he was able to do so because of his transparency in terms of school
179
financing and the efforts he put into the school to ensure high quality. As a result, the principal
was able to work with school management committee members, teachers and parents who came
from a variety of political parties. The school was frequently mentioned by national officials as a
school where there was trust that was no political within-school activities despite the principal’s
own active role in politics. A highly successful school in another district (School “B”) had very
similar schooling related characteristics, but allegedly had a completely different modus operandi
when it came to political influence in schooling. Stakeholders from nearby schools mentioned
that the schools in the district had been divided along party lines. These stakeholders argued that
School “B” was able to concentrate on schooling related activities due to a lack of political
friction. Neighboring principals also mentioned how this particular school received political
concessions to take fees while they faced severe restrictions.
There were also district level differences in political involvement. While most of the
district (Dadeldhura, Chitwan, Jhapa, Kathmandu, Sarlahi) officials highlighted the intensity of
political involvement, another district (Mustang) official mentioned that due to their remoteness,
there was limited interest from politicians. One district (Kavre)’s officials focused on how they
were able to operate fairly systematically in the political environment because of their
transparency and their willingness to listen to and adopt suggestions made by political parties. In
addition, a few of the education officials also suggested that the dominant role of politics in the
teaching profession was on a receding trend. For instance, local officials talked about how
principals would now be chosen through a fair competition rather than through someone’s
recommendation.
(Lack of) bureaucratic and financial support
Public schools are under the jurisdiction of the public education sector bureaucracy
which is comprised of the Ministry of Education which works out the details of education policy,
and the Department of Education, which is responsible for the implementation of policies and

180
supervision of schooling. The authority of the Department of Education is devolved to 75
district-level District Education Offices (DEOs), who in turn have resource persons and school
supervisors who are expected to provide local level support and monitoring to schools in their
catchment areas. The efforts of the past decade to decentralize authority have increased the
decision-making role of the local level players in school management committees. A
consequence of the decentralization initiative is that public schools are now beholden to
numerous stakeholders at the national, district and local level, much like in developed countries.
The difference in decision-making control between public and private schools is clearly
demonstrated in Table 7.3. Private school principals suggest that they have almost all control
while public school principals have to share authority with other stakeholders in the bureaucracy
(district education office) and the local community (school management committee members).
While district education officers play a substantial role in public schools in appointing teachers,
evaluating teachers, and deciding how the budget will be spent, their role is nonexistent in
private schools.
The top-level official at the Department of Education argued that there was very limited
politics within bureaucracy, as compared to the rest of the country.
“When we talk about this politicization of education, how can we take it out of the bureaucracy?
There isn't that much in the bureaucracy. There is a small thorn in the bureaucracy and if you go digging for it, you can take out the weed. However, in other sectors, there is so much of that that it's pierced through and has entered the bloodstream. So that's very difficult to get rid of.” (personal communication, June 29 2011)
However, public school principals mentioned a long list of other complaints that were
attributed to bureaucratic inefficiencies and inadequacies, including dissatisfaction with
monitoring and supervision, resource provision, wrong-minded policies and poor
implementation.

181
Monitoring and supervision. At the district level, district education officers, school
supervisors and resource persons highlight the various tasks they perform to support education
quality directives from the central agency, the Department of Education. These tasks include
conducting regular monthly meetings to discuss school performance, addressing technical
support needs in schools through teacher trainings, school visits and classroom observations, and
collecting statistics and monitoring them for misuse.
However, almost all of the interviewed public school officials thought that local level
resource persons and supervisors, who were expected to be in more direct contact with schools,
were a waste of resources. One principal derogatorily labeled resource persons as “postmen”
travelling from the school to the district education offices delivering statistics and district-level
requests. Yet another principal disparagingly called them “son-in-laws” of the district education
office, implying that they were shielded from accountability. While the resource person job is
supposed to be balanced between school-level support activities and district-level activities,
school principals contend that the job has primarily been implemented as the local arm of the
district education office. To quote an experienced principal:
“The government’s monitoring is completely absent. The supervisors, they don't even have to note their attendance. They have field work jobs - and they are just simply earning salaries. The resource center doesn't do school visits, teacher training, feedback and observation, or teacher counseling. They basically collect paperwork from our schools and make sure that they get to the DEO. They officially support DEO and therefore do not really support the teacher. The education agencies should be supportive for the headmaster and the teachers, but I haven't found any of that.” (personal communication, July 30 2010) The resource persons themselves agree that such a negative perception exists. They
attribute part of the problem to the variation that exists in effort expended by each resource
person and school supervisor as there is no performance-based criteria to judge local officials’
performance. However, all of the interviewed resource persons argued that the main problem

182
was that there was too much work assigned to the resource person, including administrative
duties, and that the main issue was a lack of more streamlined terms of reference.
“We have not been able to do the work that we were supposed to be hired for. We should actually be kept completely separate from the administrative work really! We would be incredibly happy if they would say – you don't have to deal with any of these forms, your job is to observe classrooms, monitor them, and give feedback and interact with the teachers. Then we would also be able to really interact and get to know the teachers.” (personal communication, August 7 2011) The district officers and the resource persons admit that they have not been able to
provide the adequate monitoring support in the classroom since the district’s bureaucratic
responsibilities take up much of their time. They also suggest that they lack adequate manpower
to effectively handle all the required tasks, since they have not had an increase in manpower in
over two decades.
“The District Education Office and staff numbers were envisioned 20-30 years ago for the number of schools that existed back then. It still is in the same structure now – and given that, how much can we really manage and observe? There is a need for a re-envisioning and transformation of the system.” (personal communication, August 9 2010) Some officials noted that newer projects that focused on teacher professional
development, and included requirements for teacher project work and goal setting was increasing
the frequency of face-to-face interaction with teachers. In addition, district and national officials
countered public school accusations by suggesting that school officials were too focused on
blaming bureaucratic officials, who were far away from schools and lacked manpower, while
community members and principals were not adequately monitoring locally even though it was
expected of them in a more decentralized conception of school management.
Finance. When discussing financial and personnel resource constraints, school principals
focused on the foundational needs for daily operations, and additional supports needed for
making productive changes. Many schools complained about the lack of adequate foundational
resources, such as an adequate number of subject-wise teachers, lack of funds for support staff,
and poor physical facilities, which meant that they had to find additional funds or go under-
183
resourced. Public schools additionally argued that they would require funds for innovation, such
as additional English teachers, more extra-curricular activities, or better laboratory facilities. In
contrast, most public school officials argued that finance was not a major problem in public
secondary schools. Instead, they critiqued the lack of good management and the lack of effort to
creatively utilize existing resources in public schools. A few bureaucratic officials provided a
more nuanced finance related discussion. While they agreed that the government provided the
majority of funds for school functioning, they agreed that it was unable to provide all of the
funds necessary for a good school environment.
Thus, the government provided funds are often inadequate for foundational expenses, let
alone additional costs. As a result, the schools would require funds from the community and
parents, even though public schooling is widely advertised as “free” schooling. For instance,
even though schools were allowed to take fees after basic education (8th grade), many schools do
not have the ability to raise such fees. For instance, some schools exclusively educate
disadvantaged communities that balk at even minor fees raised for additional activities, such as
extra classes in English and Mathematics. Additionally, given that public schools are heavily
politicized any attempts to raise fees, even with parental agreements, were met with protests and
threats from political parties. Thus, the funding shortage problem is magnified in communities
that have higher concentrations of disadvantaged populations.
A major reason for low financial efficiency was the general consensus that there was a
lack of utilization of needs-based criteria in government budgeting processes. While financing
formulae tried to implement the same policy throughout Nepal, these blanket approaches ended
up being unequal due to the disparities in district living standards and public school resources.
All national policy implementers, districts and principals sought policies that differentiated
schools and districts by needs. However, district officials also argued that differentiated policies
were unlikely since resolving this difficult problem would require a real investigation into the
184
details of the districts, which would be too inconvenient to be pursued by an indifferent national
planning system based in the capital, Kathmandu.
Similarly, all stakeholders noted the lack of equity in the major equity related initiative, a
scholarship system that provides scholarships for girls, dalit and janjati students, and for the
remote Karnali region. While these are disadvantaged populations and regions, national and
district officials argued that these scholarships are likely to be inefficient since they lack income-
based criteria on which to identify children for scholarships. That is, scholarships were likely to
be provided through an informal guessing game and may reach the more privileged among these
targeted groups. One public school principal had instituted a novel approach to remedy the
problem, and had assigned the scholarship responsibility to students.
“When it comes time to give scholarships, I ask the students regarding whom I should be giving scholarships to. Here we don't take recommendations from the assistant headmaster, teachers, ward, village development committees (VDC), and so on… We go to the class and say – you have two scholarship quotas here. Who are your friends who need the financial support - let me know in 15 days… They bring such a correct report – it's basically 99% correct. The VDC and ward people's reports are 100% wrong… Here, we also try to limit the psychological damage. The government says... put up the notice regarding scholarship availability and ask for them to give you their names. But we don't do that. The one who has received the scholarship knows about it, and the one who has recommended the scholarship knows about it. No one else knows… No one really wants to be called poor…So, we don't publicly out the children – we don't yell at them. The teacher cannot scold them and say – I gave you a scholarship, you need to study. If the teacher uses such methods, then the teachers get reprimanded.” (personal communication, August 22 2011) Another type of finance related complaint brought up by public schools was the fact that
the bureaucrats did not seem to listen to public school officials’ recommendations. In the
sparsely populated district of Mustang, the schools received plenty of government and
international donor supports. One year, the principals got together and submitted a proposal on
which school should get additional improvement funds in the next cycle. However, they found
that the district did not listen to their recommendations and provided the extra funding to a
school that had no need for it.
185
The discussion of funds is generally accompanied by an analysis of misuse and
corruption in developing countries, and Nepal is no exception. Recently established projects such
as the per-child funding accountability mechanism, which provided schools funds based on the
number of children in the school, had invariably led to corruption. National officials mentioned
small-scale “misuse” incidents such as schools trying to inflate their student enrolment data in
order to gain extra resources for their schools, and more egregious corruption, such as the
invention of fake schools and students to “pocket” funds. On the other hand, principals and local
officials cited macro incidents such as ministers who were fired for siphoning off funds from the
budgets.
Governance and language policies. Almost all of the schools mentioned that government
policies regarding decentralization and language policies were inadequately planned and
implemented, and not tailored to school or district needs. Public school officials and bureaucrats
alluded to how the policy of governance decentralization had not borne fruit, primarily because
of a lack of real devolution of responsibility, and because the program was developed without
adequate participation from teacher groups.
Many national officials conceded that the decentralization approach was “imposed”
rather than demanded. Furthermore, such a management system would invariably depend on the
capacity and willingness of communities to participate in the system. Many school officials
questioned the viability of the community concept in urbanized, individualized societies.
According to teachers, one of the key problems caused by the increasing focus on
decentralization has been a consistent confusion over the boundaries of authority between the
district education office, the national Department of Education, and the school management
committee. Most stakeholders also argued that the community management concept was brought
in without focusing on adequate consensus and capacity building. One of the complaints was that
despite the almost two-decade long effort to decentralize authority, the functioning of the

186
bureaucracy remains obstinately “top to bottom” while it was supposed to transition to “bottom
to top” management. That is, while the majority of the stakeholders agreed that decentralization
was best for democracy, they questioned the applicability of the community management
strategy given the current national political context, urbanization, and erosion of communities.
In terms of language policies, the government had introduced mother tongue education
to help ease the transition to schooling of children whose mother tongue was not Nepali.
However, in most regions the current demand was for English, and mother tongue education
apparently has not been relevant for decades. Furthermore, the policy was only instituted in
public schools while the bulk of students in urban centers studied in private schools, which are
referred to as “boarding” schools in Nepal. A local official described a peculiar situation in a
historical urban neighborhood:
“So even in this school (the school with the Resource center) – the children nearby don't go to school here?
Not at all – not even one of the local children go to school here. The funny thing here is that – there are Nepal bhasa (Newari) teachers at that school. This locality, of course, is the center of Kathmandu proper, the heart of the Newari community. Because of that, they have added Newari as one of the languages for children so that they are able to learn in that local language (mother tongue). But when you go to that class, there isn't even one Newar child there. That's because all of the local children go to boarding schools. The ones who are in government schools now are migrant children and others who are not Newar.” (personal communication, August 22 2011)
Inability to regulate private school practices. Furthermore, public school officials also
discussed the lack of systematic regulations governing private school growth and functioning as
having caused public school decline. The inability of the government to regulate the private
system is also chalked up to bureaucratic inefficiencies and the loose functioning of the private
sector is often blamed by public school officials for their inability to compete. Most public and
private school officials believed that approval for schools was given too liberally. Some public
school officials even argued that perhaps privatization was the end goal of the government and
these lax regulations signaled that the government was trying to escape from its responsibilities
187
to provide education. There were frequent mentions of the fact that key political leaders had
invested in private schools. The school officials argued that many national officials were
indifferent in supporting public school improvements, despite having a deep understanding of the
problems in public schooling.
Public school teachers were highly dissatisfied with private school practices, and they
focused their discontent on what they deemed as unfair practices that prevented public schools
from competing with private schools. Given the high unemployment of educated youth, private
schools can pay low salaries to short-term teachers. Many private schools continue to have
differentiated salary structures and have the ability to hire and fire teachers, which exerts
additional pressures on private school teachers to improve their performance. While these
accountability systems could also be construed as a positive aspect of private schooling, many
public school principals discussed the low teacher wages in the private sector as “exploitation”,
despite new regulations governing wages for privately hired teachers. For instance, a public
school official in an urbanizing district even argued that if all the private schools were to pay
teachers required wages then only a quarter of all private schools would remain in business.
“The boarding schools, if they were to follow all government regulations, then only 25% would really last. Because, now in primary schools the salary is Rs. 11,100 – no matter what their (private or public) status. But, in private schools, they have two teachers under the same salary. If the government were to follow up on this (private school salaries), then most would not be able to function as well.” (personal communication, August 10 2010) Additionally, public school principals also argued that private schools practiced
unhealthy competition by targeting the best students from public schools – that is, private
schools lie in wait to see if the children showed any promise after the public schools put their
blood and sweat into them, and then they are attracted to the private schools with the promise of
scholarships and special incentives. As a result, public school teachers were demoralized while
private school teachers gained another easy way to improve their test scores.

188
Private schools are also expected to contribute to improving equity, but many national
officials argue that this was not the case. While private schools are required to give scholarships
to disadvantaged students, national officials argue that they are likely to not have provided
scholarships to disadvantaged students and instead giving them to their relatives given the
inability to effectively monitor their scholarship distribution schemes. Additionally, many of the
national level officials argued in favor of a voucher scheme that would allow the existing
scholarship funds for dalit, janjati and girls to be utilized by the poor students to go to private
schools. They argued for it as a right to choose, and as a means to mix up students who are now
living in segregated societies and are ripe for future conflict without any significant government
intervention.
The dimensions and consequences of public school stigmatization
In this environment of growing national political instability and bureaucratic
inefficiencies, many national, district and school officials, and parents agreed that public schools
were perceived to be inferior to private schools. With the passage of time, the flight of middle
class students away from the increasingly abundant public schools gave way to the
stigmatization of public schooling and erosion of community support.
Public schools concentrated with disadvantaged students. Firstly, as a result of the dual
education system (public and private), public schools experienced the negative consequences of
sorting by income, capacity, and behavioral traits. Private schools were attractive to parents since
they taught in English medium, and provided a relatively politics-free, disciplined environment.
Public school officials argued that there had been a gradual, historical flight of middle and high
SES students away from public schools to private schools. With the transformation of the
education system and migration, a growing group of lower-income families also began to select
the increasingly abundant private schools. Some public school officials also mentioned that due
to stigmatization of public schooling, students who were behaviorally difficult to manage where

189
transitioned from private to public schools, while good students were encouraged to attend
private schools. The stratification had escalated to such an extent that urban area public schools
were now concentrated with difficult-to-educate low SES students, and many public schools had
to be merged or collapsed because of a lack of enrollment. Public school officials mentioned that
there was social pressure to send your child to private school and that it was embarrassing to
send your child to public school. A teacher described his personal experiences to demonstrate the
widespread stigmatization of public schooling:
“The thing is here – the culture in Nepal is – whether you can or you cannot; whether they teach or they don't – you still have to send your children to boarding school. If you don't send them to boarding school, your neighbor, your relatives, your well-wishers - all of them will criticize you. I have experienced it myself. I brought my child here for two years. He was studying in a private boarding school. But, he couldn't read Nepali. He had passed 6th grade, but when I asked him to read in Nepali, he couldn't read the text from any pamphlets or newspapers. And I was alarmed by that and decided that was not good, and brought him here (to the public school I was teaching in). So, I kept him here for two years. In those years, there were just so many people who yelled at me – you couldn't even keep that one son in boarding school. Why did you take him to a government school? Because of this trend, people send children to boarding school because they feel compelled as well, even when they cannot afford it. Since it's a question of a need for a cultural change, it's not something that we can do all by ourselves.” (personal communication, August 10 2010) A key aspect of the stigmatization was the thinking that public schools were “schooling
for the poor”. Many principals illustrated the stigmatization by citing that their schools were full
of children of footpath dwellers, migrant laborers, and anyone who did not have a stable income
and was living “hand to mouth”. One of the reasons for this perception was the fact that public
schools have been mandatorily free by law. While some principals were in favor of free
education, most talked about how they were handicapped by the policy since parents now
perceived of public schools as education for those who could not afford user fees. For instance, a
local official described how parents would discriminate between children sent to public and
private schools, and how this discrimination had clear gender-based dimensions.
190
“Because the parents have paid fees …they continually ask the (private) school how their child is doing, and whether their quality is improving. They go to the school, have discussions with the teacher and the principal, take tiffin (lunch) for their child. And then at four pm, they arrive on time to get them from the school. They make sure that they have done their homework as well. In the same household, the older sister goes to the public school – no one is sure what she has eaten, what she wears and how much she has studied as she makes her way to the school. They send the son to the boarding school, but the older sister has to come back from the school and wash the brother's uniform, she has to polish his shoes, and get her tiffin ready.” (personal communication, August 7 2011) Interestingly, there were noticeable differences in opinions between public and private
school principals on the parental background and social status of public schools, as shown in
Table 7.4. Almost all public school officials agree that public schools face more challenging
home environments, less education conscious parents, and low social prestige. About half of the
private school principals disagreed that public schools face substantial demographic
disadvantages, primarily because they also educate poorer students nowadays. However, these
differences in opinion are arguably due to the fact that private school officials may not have
accounted for the fact that they are educating a smaller group among the poor while the rest of
the more disadvantaged students go to public schools.
Lack of community support. Over time, the flight of middle class parents and the
institutionalization of the free education policy have resulted in a loss of community support
since none of the community members with historical ties to the community send their children
to public schools. A typical type of lack of support experienced by the public school was
indifference or lack of interest in the public school’s functioning since their children did not
study there. Urban area school principals painted a narrative about the importance of public
schooling as a symbol of pride and progress in villages, which has all but disappeared in urban
regions. Additionally, an unforeseen consequence of globalization is the fact that many children
in wealthy urban communities have migrated to foreign countries after going there to study
abroad. There has also been significant migration from villages to the cities and to neighboring
191
countries due to the conflict and continued lack of employment. As a result, public school
principals argue that there is a dearth of local people to lead the community and participate in
public schooling or other community activities.
A higher level of friction between the community and school existed where the
community actively resists improvements in the school because it does not serve their self-
interest. For instance, the school officials from a historically important all girls’ school claimed
that many of their local neighbors threw their garbage into the school compound, and had tried to
steal some of the expensive urban land from the school.
“We also get to hear that the schools in village regions that have gone through the community handover have gotten better. And the reason this happens is because the community themselves show a lot of interest. On the other hand, in our school our neighbors all they are thinking about is how to take over our land holdings here. When you have a situation like that, it becomes self-explanatory how involved they will be in helping the school. For us, it has been difficult just maintaining the school.” (personal communication, July 29 2010) Furthermore, the decentralization policy which handed significant authority to the school
management committee exacerbated the situation and created an increasingly hostile
environment between teachers and communities. A more extreme scenario of lack of community
support for the public school was seen in the highly negative resistance to public school
improvements in a remote village in a far-western district. In this public school, the principal
who was trying to institute some key reforms, such as implementing English, began receiving
threats and faced significant opposition from the district education office and even members of
the public school’s management committee. The main reason for this extreme reaction was that
the community members had invested in the local private schools, and were worried that the
improvements in the public school would lead to private school failure, given the small market.
Many principals also highlighted the precarious situation they found themselves in after
the community gained so much authority over teachers. To quote a principal’s interpretation of
how community started viewing teachers:

192
“The community handover idea must be to give incentives and then mobilize the community? What the community and parents understood from this (handover program) was that the teachers have to listen to what we say. They thought that all of the teachers are their shepherds and workers. And when that sentiment exists, that creates a problem between parents and teachers.” (personal communication, July 19 2010)
Contradictory findings. While national officials mainly talked about the dire situation in
public schooling, there were district level and regional differences in stigmatization and the level
of community support. Some remote district officials and rural region principals mentioned that
due to the lack of private schools there was not much stigmatization of public schooling and that
all types of students would study together. However, even these district officials acknowledged
that the main reason for the lack of stratification was the lack of private schools and the lack of
parents’ ability to pay. Some public school officials highlighted the generosity and trust of the
local community that had helped their school flourish over time. Other principals talked about
their harmonious working relationships with their management committee, and how the well-
functioning school management committee worked efficiently on all managerial aspects of
schooling while the principals focused on the academic aspects. There were also some officials
who claimed that since public schools were on a serious rebound, there had been gradual
progress in reducing public school stigmatization.
Motivations and expectations of school personnel
A public school official who is expected to carry out reforms will base his decision to
conduct these reforms on the likelihood of success of these strategies, and the accountability
mechanisms that incentivize these efforts. Given the lack of community support and
stigmatization of public schooling, the extensive political influence in decision-making, and
problems with the bureaucratic support systems, it would not be surprising for public schools to
have limited motivation to carry out reforms.

193
The principals’ opinions on parental involvement and awareness and teacher quality in
their schools, displayed in Table 7.5, confirm these suspicions. While almost all private school
principals agree that parents are highly involved in schooling activities and communicate their
academic concerns to the school, less than half of public school principals confirm the same. On
teacher quality, public school principals are more likely than private school principals to believe
that the more experienced teachers are of high quality.
However, as discussed earlier, a major problem with the national accountability system
was the inability to utilize existing bureaucratic norms to sanction schools and teachers, given
the political influence. In addition, the principals and public school officials decried the fact that
the accountability systems made no attempts to differentiate between well-functioning and
poorly functioning school teams, and incentivize better schools. One principal stated, “why
would it matter if I work harder? There is no incentive system that promotes good teaching.”
Thus, there is very little reward for individual good behavior and even less punishment for poor
behavior. Government support for public schooling is limited to praising and rewarding schools
that produce good results in the school-leaving examinations and asking why other schools are
unable to produce similar results. However, even the best schools are unhappy with the existent
accountability mechanisms that do not utilize performance-based criteria to assess and reward
schools and teachers.
“The policy of the government is that “shit and gold are equal”. Government won't conduct inspections to distinguish between the schools and teachers that are good and bad….Whether it is an organization or a person it is necessary to add more value. If I have done a good job, the government won't add any more budgets for my school neither it will raise my salary. Then how will the people be encouraged to do well? To do well, the government must encourage the schools by saying, “you have practiced well, and we will support your school and increase your facilities.” Those kinds of policies are needed, but our government doesn't have those policies.” (personal communication, August 22 2011) Public schools argued that the no fee system was a politically sensitive government
regulation which has decreased parental involvement and has also handicapped their efforts to

194
innovate. While some schools are able to come to an agreement with political party members and
parents to raise additional funds through fees and community fundraising to pay for additional
costs and innovative efforts, other schools argue that they lack real community interest or
supports.
“The other problem we have is the no-fee situation. This is because government schools have been told that we cannot raise fees. We had a discussion with the policy level people then. We talked about how the situation is akin to them telling us to swim after tying our hands and feet together. In that situation, can we swim? There is no means of raising resources. And without financial support, we cannot really innovate. All we can do is maintain whatever we are currently doing.” (personal communication, August 10 2010) The public school officials also highlighted the lack of other individual incentives to
really improve. One of the other reasons cited for the lack of motivation for teachers to perform
was that these teachers’ children also often do not study in these public schools which lowered
the stakes for poor quality of education for these officials. A district official highlighted how a
school in his district was successfully able to increase ownership by requiring that teachers send
their children to the same school.
“One of our model schools – what it has done is that it has instituted a system whereby all of the teachers and school management committee members have to send their children to the same school. One example was that the teacher put their child in a private school and that teacher was then fired from the job. What I have been saying is that even a cook will not work hard or may even spit in your food if he has predetermined that he will not eat that cooking. If you have to eat it yourself, then you will focus on cleaning up the food and making sure that it is well prepared overall. Similarly, one should be able to think that public schools provide an appropriate or adequate education for my children if they were to study here. That's how we need to approach it.” (personal communication, August 9 2010) A national official pointed to the inability to utilize school personnel’s expertise as
limiting personnel’s motivation and effort. That is, given their long-term experiences of
frustrations in the system, many teacher resign themselves to just keeping their jobs and working,
rather than focusing on innovations.
195
“The other thing we find is that there are not that many people who have had good experiences. Many of them are quite frustrated – they say, well they've never listened to what we have to say, let it just continue on as it is….So, there are those people who think that it won't matter what I say, I should just finish the job and retire. There are only a few who think that they need to struggle for the country. The person will have spent a lot of time gathering expertise and then he will retire and that expertise will leave with him.” (personal communication, July 28 2010) Many public school officials talked about how they had developed an internal
accountability system so that teachers felt motivated, despite the lack of monetary or other
incentive structures in the public school system. Arguably, the only substantial external
motivation for productive changes is the fact that the dramatic negative reputation of the public
schools may one day lead to school closure and loss of employment. One national level official
talked about how there was a heightened awareness for the need of increased teacher effort, and
for teacher unions to focus primarily on the profession since public school credibility reached the
figurative “bottom of the barrel.”
“We conducted a journalist meeting recently and the topic of the meeting was “teachers can make a difference.” In that discussion the best performing teachers from many districts discussed how they were making a difference even under the current policy environment … the teachers union and organizations are gradually changing their mental attitude. They are concerned now that the general people's outlook towards them is sinking. They feel that they are now in a shameful situation…I have felt that they have come to a realization that the situation is worsening because of the teachers themselves, and not just because of government policy and resource issues. The union and profession teacher leaders are saying that they will convince teachers to teach and work effectively. So some sort of attitudinal change is happening.” (personal communication, July 4 2011) These qualitative findings on expectations and motivations to compete are corroborated
by the descriptive statistics as shown in Table 7.6. The majority of public school teachers agree
that there is lower motivation for public schools to improve because of lack of monitoring, a
higher number of politically appointed teachers, and because teachers don’t send their children to
their public school. Additionally, over four-fifths of the public school principals agree that public
schools face systemic problems that cannot be fixed with school-level efforts alone. However,
public schools express optimism and satisfaction when the questioning is directed towards their
196
specific experiences. For instance, most public schools do not agree that they lack personnel or
financial resources to conduct reforms, and agree that the government does an adequate job
monitoring their school. In addition, they almost unanimously express urgency for school-level
improvement efforts and optimism of making improvements with school-level efforts.
An Example: Factors that Mediate the Implementation of English Medium of Instruction
Public school experiences with implementing English medium of instruction highlight
the variety of constraints and supports experienced by the diverse public schools in the sample.
There was unanimous agreement among public school principals and district officials that public
schools needed to adopt English medium, since it was a consumer demand that public schools
had to provide if they were to survive in the modern age.
The public schools varied in terms of internal management and resource support, and
hence had very different experiences with transitioning to English medium. In the best case
scenario, school principals who had efficient teams and strong reputations expressed their
confidence that they could implement English medium as the teachers were enthusiastic and
highly qualified. Some schools mentioned that they had regained enrollment as the community
acknowledged their efforts to improve by implementing English. Many public school officials
also provided additional support for extra English classes and received district supports for
English teacher training. These principals discussed the medium of instruction challenge as just
one of the policies they needed to institute:
“It's ok, maybe there is an issue of medium of instruction and that not matching up. If you have the will and capacity, then why not make them English medium then. That's the only shortcoming we have in comparison to them (private schools) – we teach in Nepali and they teach in English.” (personal communication, July 30 2010) However, the majority of the public schools faced a myriad challenges in their
implementation of English. The foremost amongst these problems were related to teachers.
Firstly, most public school principals argued that the current teacher pool would have difficulty
197
teaching in a new medium of instruction, given their lack of English fluency. The problem was
exacerbated by older teachers’ resistance to change, since unlike private schools they could not
be compelled to exerting effort to improve their English medium teaching.
“Here, actually most of the teachers of Kathmandu don't have condition to teach in English medium. For me, for example, at this place if I tried to convert into English medium then it will be the greatest problem for me. I can't remove the existing teachers. I can't take it into totally English medium along with the existing teachers. So, my concept will remain in thought only.” (personal communication, July 9 2011)
Other school officials highlighted a host of problems that plague public schools in Nepal.
Firstly, some principals highlighted that the extremely disadvantaged home background of public
school students would prevent them from realistically teaching in English.
“We have also said we have started it (English) from (Grades) 1 to 5 – but it remains as is, inconsequential. There is English medium I guess, but English won't just happen out of thin air – it needs an environment. We don’t have the manpower that can teach English. There are children who come in here without shoes on their feet, and who are hungry in the afternoon because they can't afford lunch. You can’t just force English to happen – it will be unnatural and artificial.” (personal communication, August 10 2010) Another school principal focused on the difficulty in implementing English medium due
to student population volatility. Given the fact that the school was a public school, they lost
students to better schools in the transition to secondary school, and did not have the authority to
deny admission to other students. As a result, public schools faced a lack of continuity in student
populations to adequately continue providing English medium.
“In the lower grades, we teach Math and Science in English. We have a goal of teaching in English in Math and Science through 10th grade. But in order to be able to do that, we need continuity. In our school, the ones who we have taught with English medium in primary schooling leave for other schools. And the ones who come in towards the end of primary are those who have only learned in Nepali medium. So how do we get them to study in English medium then? That's been a big problem for us.” (personal communication, August 10 2010)
Many teachers expressed concerns over their inability to teach well in English because
of the poor learning levels. Many of the schools had to teach English mixed in with Nepali given
the student’s initial English backgrounds. In fact, one district local official suggested that even

198
the best public schools were actually dealing with the transition by teaching one section in
English and the other section in Nepali, thus sorting the student population by ability and
capacity. To quote a teacher in a struggling school:
“I teach English, and there is variety within the classroom. For instance, some students understand and enjoy English speaking in the classroom. For another student, if you ask them to speak in English, they don't understand any of it. Even with just eight students there is that kind of gap. And the reasons for that is the family background and not being able to give that kind of time afterwards. They are with us for six hours of the day after all.” (personal communication, August 2 2010)
With regards to external supports, a principal in a remote district recounted that he had a
particularly harsh experience implementing English since he received significant resistance from
the local community, the management committee, and even the district education office. He
recalled how he had very little bureaucratic help in implementing English medium, and could not
even get them to provide teacher training, and thus had to continue with the effort in a fairly
isolated manner.
Given the fact that transitioning to English medium would require systematic efforts
from the schools, some schools had also experienced a lack of funds, and the government’s rigid
rules regarding fees made the costs prohibitive for them as they tried to institute English
medium.
“We should teach in parallel, in both the English and Nepali medium but could not do so. Firstly we do not have necessary number of teachers and secondly we are not allowed to receive the school fees. Sometime back we started to receive a nominal amount of donation Rs.100-150 from each student but then we received the letter from the DEO office to return it. We tried to do something but we were not allowed to do so.” (personal communication, September 4 2011)
Another teacher pessimistically highlighted that even if they taught in English medium,
the parents would not trust their ability to deliver quality English since they were perceived to be
inferior.
“In order to stop the flow out from here to boarding school as much as possible, we have said that we will teach in English medium in 1-2 grades. With that English medium, some of the classes have been operated in that way. But, even then, it's not like the

199
parents are convinced that we will definitely do it in a competent manner. In boarding schools, they think that they will definitely do it – there is more trust in their competence.” (personal communication, August 10 2010)
Thus, the problems encountered while implementing English consistently reflect the
supports and constraints that plague schools, and demonstrate the variations in public school
capabilities. Schools that have a strong reputation, good resources, and are able to ensure a stable
student population appear to be at ease with initiating and consistently maintaining English
language education to meet consumer demand. Other schools face difficulty in maintaining
English medium education because of student backgrounds and learning levels, teacher quality
and effort, and lack of funds. The least advantaged schools feel that they are in such an
unfavorable position in terms of these inputs that they think it best not to try to institute the
policy, despite the fact that it is highly valued. There is also great variability across districts.
While English medium education is a known intervention and supported strongly in the capital,
public schools that are in remote regions have to do a lot more of the work and struggle by
themselves. In summation, these findings call for more recognition of the variation in teaching
resources and income sources in the public schools.
In summary, public schools appear to face myriad political, bureaucratic, and
motivational barriers to reform. Interestingly, in the context of Nepal, politics is not just an
external impediment – for instance, politicians stopping or forcing certain policies – but rather a
cancer that is debilitating school functioning internally. In particular, the systematic involvement
of teachers and school management committee members in politics, and the linkages between the
bureaucracy and political parties, has allowed for public schools to be used as hotbeds for
political machinations. The fact that politics has seeped into every aspect of Nepalese society
implies that governance reforms to decentralize the responsibility for education will likely shift
authority from a small group of political interests to a larger group of political players who are
beholden to the political elite. As a result, unless politics can be taken out of the entire
200
bureaucracy, it is unlikely that decentralization reforms will help public schools be as
autonomous as private schools.
Public schools are also in a precarious position because of the dysfunction in the
bureaucracy as each stakeholder looks to blame another for its systemic ills. For instance, public
school officials at the national and district level officials highlight the lack of teacher effort and
the inability of local actors to truly take responsibility for education governance. On the other
hand, public school officials highlight the lack of thoughtful policy formation and systematic
financing strategies, and the red-tape laden yet poorly functioning monitoring system as having
allowed private schools to leapfrog over public schools. Interestingly, both local level officials
and school principals lament the lack of classroom monitoring. While public school officials
believe that the lack of classroom monitoring is a product of loose accountability, local level
officials responsible for that monitoring highlight the misalignment of tasks. Consequently,
better targeting of financing and policies, and better delineation of responsibilities could greatly
improve the functioning of the existing bureaucratic support structure.
Lastly, public schools have lost significant community support, particularly in urban
areas, since the mid-1990s. When everyone who could afford to pay some school fees began to
send their children to private schools, public schools became far less relevant for urban
populations with stable incomes. As a result, public schools became concentrated with girls (in a
country with son preference) and poor children, or even emptied out in some instances. Public
schools appear to have lost the perception battle to private schools. Resurgence in public
schooling in urban neighborhoods would require systemic interventions tied to school-level
efforts, and a re-examination of the no user fee policy of public education systems in developing
countries.
The fact that public school officials are mostly optimistic about their ability to improve
from their current conditions and compete with private schools through their individual efforts

201
may be attributable to an attenuation bias. That is, public school principals may have felt that
they needed to acquiesce with these seemingly positive statements when these questions were
specifically about their schools. However, the fact that they readily admitted the difficulties
faced by most public schools because of politically appointed teachers, poor government
monitoring, and disadvantaged student backgrounds suggests that public school principals do
feel that public school reform requires systematic interventions along with school-level efforts.
Even in such a dire political, bureaucratic and social environment, some public schools
have been able to beat the odds and gain respectability and parental trust. Predictably, the credit
for exceptional, thriving public schools is given to the hardworking, engaging and dynamic
principals. In some instances, schools’ turnarounds or efficient functioning are credited to well-
functioning school management committees, but primarily given their ability to successfully
recruit a reliable principal. The literature on school leadership has thoroughly detailed the
powerful transformative role of principals in public schools in the United States and other
developed country contexts (Tyack and Hansot, 1982; Leithwood and Jantzi, 2005). Clearly, the
role of the principal in maintaining public school quality is heightened in less politically stable
environments as these principals need to motivate teachers and students in an environment of
minimal external accountability, strong stigma against public schools, and navigate political and
bureaucratic demands.
Do Principal Perceptions on the Key Barriers and Supports to Reform Differ by the Extent
of Private Competition Faced by the School?
As demonstrated in the earlier discussion, the key barriers to reform faced by public
schools include the politicization of the public school system, the lack of adequate monitoring
and financial support, and the stigmatization of public schooling, which in unison may reduce
public school officials’ motivation to reform. In this section, I analyze whether the barriers, and
some supports, to reform can be systematically linked to the extent of privatization or their

202
perception of private schools as competition. I argue that the barriers to reform are likely to be
heightened in public schools that are located in regions with higher privatization. For instance,
important urban regions are likely to be targets of political attention and have more
individualized societies that primarily send their children to the more abundant private schools.
Table 7.7 presents the logistic regression estimation results of key decision-making
related barriers to reform. In a decentralized era, significant district influence in appointing or
evaluating teachers, limited principal influence on these decisions, and high management
committee influence in dealing with teachers could be a product of undue external interference
and may suggest that the principal has limited flexibility in making decisions to improve school
quality. Principals of public schools that are located in high competition regions were statistically
significantly more likely to suggest that the District Education Office (DEO) had a significant
role in appointing teachers than principals of schools from lower competition regions. While
principals of schools located in higher competition regions were also more likely to suggest that
the school management committee had higher involvement in evaluating teachers, these results
were not statistically significant. The schools with principals who perceive subjective
competition, controlled for the geographic proximity to private schools, were significantly less
likely to suggest that the school management committee plays a role in evaluating teachers.
Table 7.8 focuses on principal perceptions on parent engagement with their school and
the general level of awareness of public school parents. Principals of public schools located in
medium or high competition regions were over three times as likely to suggest that public school
parents were not very aware of the importance of education, which may suggest that these public
school principals had to face a concentration of educationally deprived parent populations.
Tellingly, principals of more selective public schools were more likely to agree that parents were
active in the school and that they monitored their children’s academic progress, and less likely to
agree that public school parents were not education conscious. These findings logically suggest

203
that principals of selective schools encounter a different group of parents than principals of
nonselective schools. Importantly, public school principals who considered private schools
competitors are less likely to suggest that parents are highly involved in school activities, or that
parents monitor their children’s academic progress compared to public school principals who did
not mention private schools as competition. These findings suggest that principals who perceive
private schools as competition have seen parents play a limited or less than adequate role in
helping their school improve48.
Table 7.9 highlights principal perceptions on teacher quality and effort, which are key
determinants of school performance. Interestingly, principals who perceived private schools to
be competition were almost twice as likely to suggest that their experienced teachers were of
excellent quality, compared to principals who did not mention private schools as competition.
Principals of school in high competition regions were substantially more likely to agree that their
new teachers were of excellent quality than principals of schools in low competition regions.
This finding could suggest that the schools with principals who perceived private schools as
competition were more likely to have higher quality older teachers, and probably were more
capable of implementing instructional policies to compete with private schools. There is a
possibility of reverse causality in this argument since public school principals who have a higher
regard for their experienced teachers may be more likely to believe that private schools are
competitors. The fact that schools in higher competition regions believe that their new teachers
are of high quality may suggest that new recruits coming in are of a better quality in those
schools in contrast to experienced teachers. As discussed earlier, teachers who are politically
involved are a main hindrance to school improvements in the Nepal context. Significantly, I find
that the principals of public schools in higher competition regions were over four times as likely
48 A brief analysis of the association between perceptions of principals of selective schools by the extent of private competition is presented in Appendix A7.1.
204
to say that they lacked the incentives to perform because of politically appointed teachers
compared to principals of public schools in low competition regions.
Table 7.10 focuses on perceptions on the adequacy of government provided supports.
Principals from public schools in high and medium competition regions were over four times as
likely to agree that public schools lacked incentives to reform because of a lack of government
monitoring. Consistently, principals of public schools in high and medium competition regions
were less likely to agree that the government does an adequate job monitoring their school.
Principals of public schools in high and medium competition regions were also more inclined to
agree that the school management committee members do not care about improving schooling
quality and that they lacked adequate teachers, although these results were not statistically
significantly different.
In summary, the regression results suggest that public schools that are located in high
competition regions face heightened barriers to reform. The school principals in high
competition regions experience significant district influence in teacher hiring and agree that
public schools lack incentives to compete due to a lack of monitoring supports and a higher
number of politically appointed teachers. Furthermore, principals in regions with high
privatization are much more likely to agree that public school parents are not education
conscious than principals in public schools in low competition regions, which provides
suggestive evidence of flight of middle class and educated families to private schools in regions
with higher privatization. These results suggest that the public schools that are located in high
privatization regions face a higher order of constraints, and may be unable to respond to
competition without significant targeted government intervention.
In contrast, public school principals who perceive private schools as competition,
regardless of the number of private schools around them, seem to encounter favorable within-
school conditions. The principals who perceive private schools to be competing schools believe
205
that they have high quality experienced teachers but are also more insistent on the lack of
parental involvement in public schools. These findings suggest that principals who report that
they are competing with private schools are really highlighting the fact that they are able to
provide adequate within-school efforts that enable them to compete, and are not just listing
schools that are nearby or have proven detrimental to them.
Discussion
Public schools require supports from the bureaucracy, community, parents and students
to be able to function effectively. I find that most public schools face a variety of barriers, and do
not receive adequate supports, as they attempt to make quality improvements. Public schools
face bureaucratic inadequacies, such as a lack of monitoring and financial support and adequate
decision-making control. In addition, a significant impediment to competitive responses that is
not regularly highlighted in the literature is the extent of direct political interference in decision-
making in the public school system. The public school system is perceived as being
bureaucratically inefficient and politically entangled, and inferior to the private school system.
Over time, the lack of trust in public schooling has led to significant middle class flight, an
erosion of community support for public schooling, and led many public schools to become
concentrations of disadvantaged populations. The combined effect of bureaucratic, political, and
community issues, and a lack of individualized accountability systems has led to a situation
where school officials have little motivation or capacity to initiate competitive reforms. In fact,
the main reason public schools are initiating some new reforms is arguably because public
schools have reached an all-time low in credibility, and are fearful of school closures and loss of
employment.
Thankfully, the pessimistic summation is not the complete story. The few schools that
have been able to flourish despite the problematic political and bureaucratic environment have
developed internal systems of accountability, harnessed creative solutions that are not dependent
206
on external funding or personnel supports, and have a proven track record of education
performance. National and government officials, and principals, agree that the headmaster plays
the most important role in ensuring effective functioning, as he needs to expertly sidestep the
political infringement to focus on education, motivate less educated parents to focus on their
children’s education, motivate students, run a well-functioning teacher team without the help of a
monetary rewards system, and work with the school management committee on administrative
tasks.
While the problems of public school quality tend to be generalized in national and global
discussions, my analysis suggests that researchers need to analyze the variations in community
supports, personnel motivations and policy implementations while responding to private
competition. Policymakers need to prioritize the recruitment of principals who are adept at
functioning in political conditions, and the development of more equitable, better targeted
financing criteria. Policy also needs to focus on the public schools that exist in high competition
regions since these schools appear to suffer the most from a lack of community and bureaucratic
support, experience substantial political interference.

207
Chapter 7 Figures and Tables
Table 7.1 Descriptive statistics on explanatory and control variables
variable description, year Mean S.D. Median
Number of public schools [N = 212]
Geographic proximity measure of competition (continuous) 3.5 2.5 3.9
Community characteristics • Female literacy rate, 6 years and older, 2001 60.9 11.7 60.8
• District dummy (percentage Kathmandu schools) 68.4 • Urban dummy (percentage urban schools) 42.9 • Population growth (decadal), 2001 to 2011 49.3 53.3 45.2
School-level indicators
• Whether the school requires an entrance examination for grade 6 admission, 2011-12 49.06
• Total fees, grade 9, 2010-11 (in U.S. dollars) 18.87 19.25 15.00
• Percentage dalit (disadvantaged population) in enrollment, 2010-11 11.13 7.83 9.70
• Total grade 1 to 10 enrollment, 2011-12 544.53 313.99 456.00
• Percentage female in grade 1 to 10 enrollment, 2011-12 53.07 8.63 53.19
• Percentage teachers with permanent contracts, 2010-11 11.13 7.83 9.70
• School age, 2011-12 49.08 15.00 49.00
• whether private teachers were hired due to lack of teachers, 2011-12 79.20
• whether school has poor, inadequate desks, 2009-10 24.90 • whether the school has a computer room, 2011-12 41.00 • Class size in 6th grade, 2011-12 44.52 17.11 44.15
Source: Authors’ calculations based on Combined Quantitative Dataset. Note: Exchange rate used to compute total fees in U.S. dollars: 1 U.S. $ = 80 Nepali Rupees.
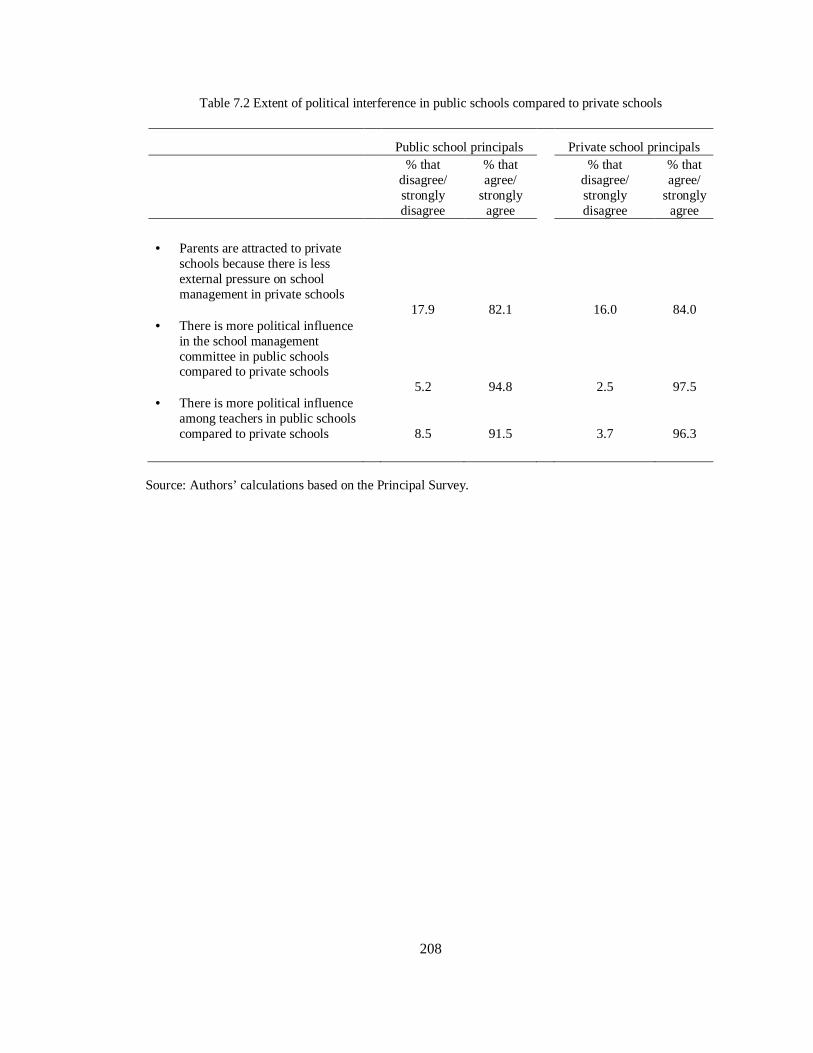
208
Table 7.2 Extent of political interference in public schools compared to private schools
Public school principals Private school principals
% that disagree/ strongly disagree
% that agree/
strongly agree
% that disagree/ strongly disagree
% that agree/
strongly agree
• Parents are attracted to private
schools because there is less external pressure on school management in private schools 17.9 82.1 16.0 84.0
• There is more political influence in the school management committee in public schools compared to private schools 5.2 94.8 2.5 97.5
• There is more political influence among teachers in public schools compared to private schools 8.5 91.5 3.7 96.3
Source: Authors’ calculations based on the Principal Survey.
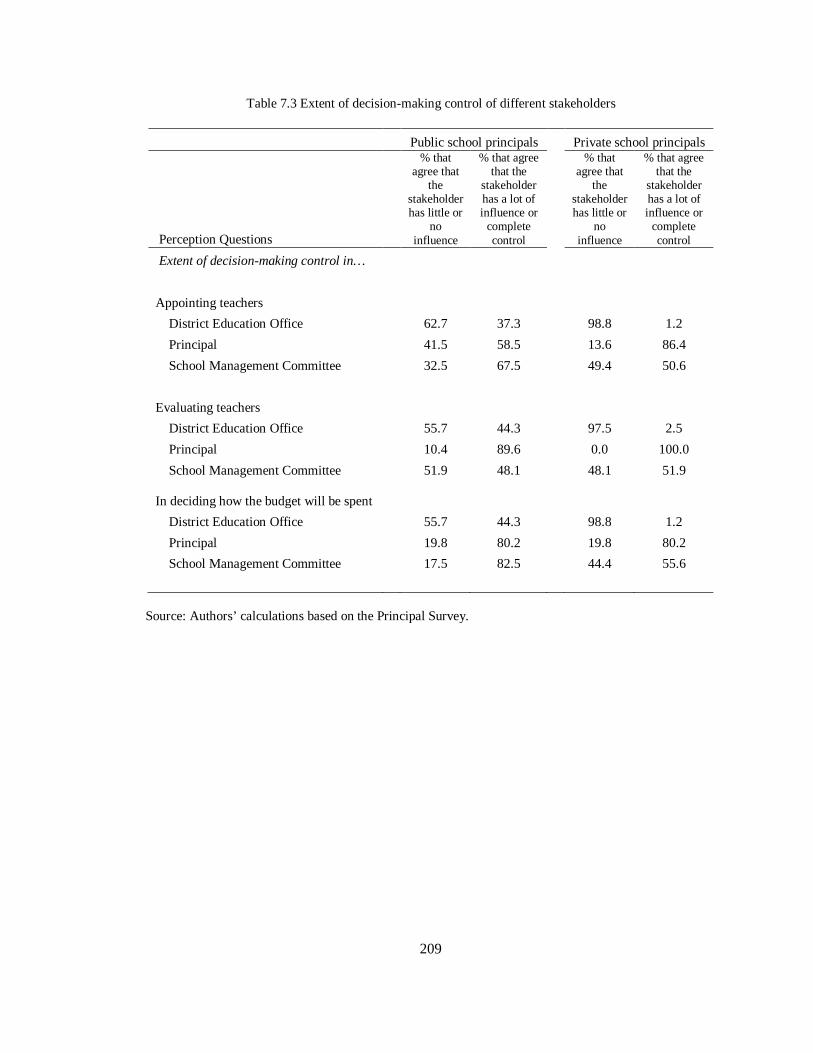
209
Table 7.3 Extent of decision-making control of different stakeholders
Public school principals Private school principals
Perception Questions
% that agree that
the stakeholder has little or
no influence
% that agree that the
stakeholder has a lot of influence or complete control
% that agree that
the stakeholder has little or
no influence
% that agree that the
stakeholder has a lot of influence or complete control
Extent of decision-making control in…
Appointing teachers
District Education Office 62.7 37.3 98.8 1.2
Principal 41.5 58.5 13.6 86.4
School Management Committee 32.5 67.5 49.4 50.6
Evaluating teachers
District Education Office 55.7 44.3 97.5 2.5
Principal 10.4 89.6 0.0 100.0
School Management Committee 51.9 48.1 48.1 51.9 In deciding how the budget will be spent
District Education Office 55.7 44.3 98.8 1.2
Principal 19.8 80.2 19.8 80.2
School Management Committee 17.5 82.5 44.4 55.6
Source: Authors’ calculations based on the Principal Survey.

210
Table 7.4 Demographic and social status differences between public and private schools
Public school principals Private school principals
Perception Questions
% that disagree /strongly disagree
% that agree /
strongly agree
% that disagree /strongly disagree
% that agree / strongly agree
Demographic differences • Compared to public schools, private
schools can select the students they take in 11.3 88.7 22.2 77.8
• Comparatively speaking, the home environment of public school students is more challenging 4.2 95.8 37.0 63.0
• Most of the parents of public school students do not understand the importance of education 40.6 59.4 80.2 19.8
Social prestige
• Public schools are equated with poor or low status schooling 9.0 91.0 45.7 54.3
• There is social pressure to send your child to private school 27.4 72.6 37.0 63.0
Source: Authors’ calculations based on the Principal Survey.

211
Table 7.5 Parental involvement and awareness and teacher quality at the school
Public school principals Private school principals
Perception Questions
% that say the
statement is rarely or
never accurate
% that say the
statement is somewhat
or very accurate
% that say the
statement is rarely or
never accurate
% that say the
statement is somewhat or
very accurate
Parental involvement
• Parents are highly involved in school activities 53.3 46.7 21.0 79.0
• Parents monitor the academic progress of their children closely 34.4 65.6 4.9 95.1
• Parents communicate their academic concerns to the school 47.6 52.4 6.2 93.8
Teacher quality
• Teacher absenteeism is a big problem 85.8 14.2 91.4 8.6
• Teachers who have less than three years of experience are excellent 59.0 41.0 49.4 50.6
• Teachers who have more than 15 years of experience are excellent 30.2 69.8 35.8 64.2
Source: Authors’ calculations based on the Principal Survey.
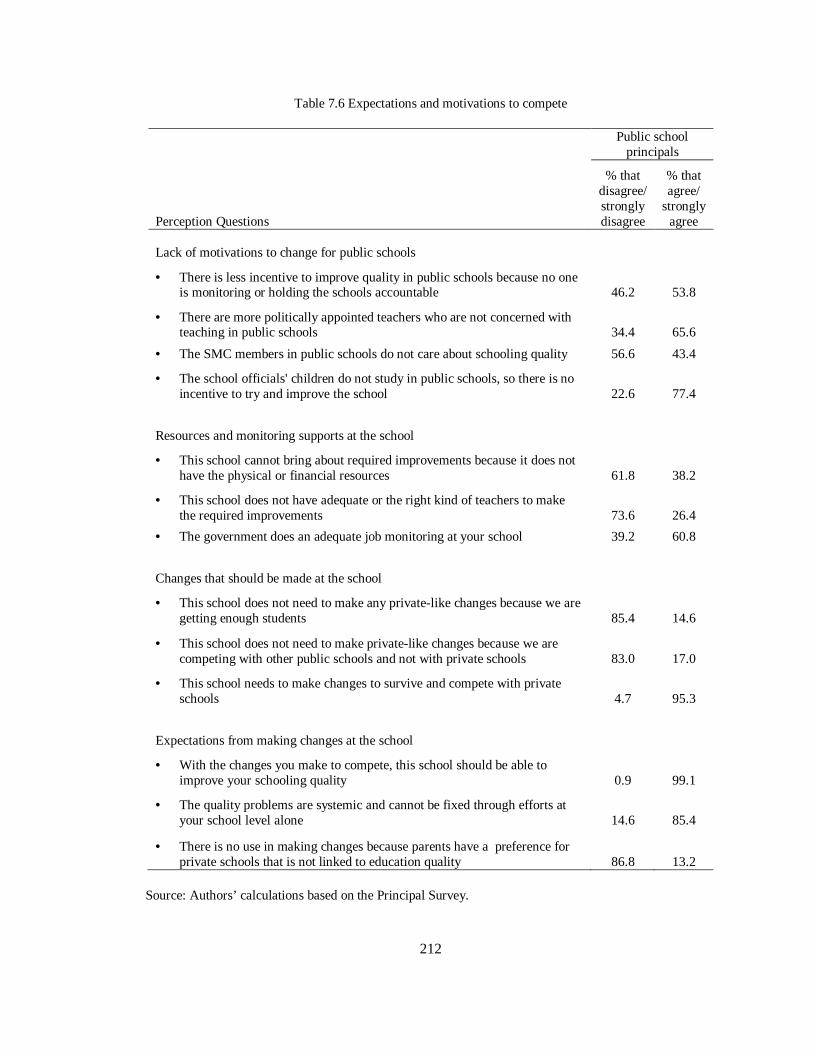
212
Table 7.6 Expectations and motivations to compete
Public school
principals
Perception Questions
% that disagree/ strongly disagree
% that agree/
strongly agree
Lack of motivations to change for public schools
• There is less incentive to improve quality in public schools because no one is monitoring or holding the schools accountable 46.2 53.8
• There are more politically appointed teachers who are not concerned with teaching in public schools 34.4 65.6
• The SMC members in public schools do not care about schooling quality 56.6 43.4
• The school officials' children do not study in public schools, so there is no incentive to try and improve the school 22.6 77.4
Resources and monitoring supports at the school
• This school cannot bring about required improvements because it does not have the physical or financial resources 61.8 38.2
• This school does not have adequate or the right kind of teachers to make the required improvements 73.6 26.4
• The government does an adequate job monitoring at your school 39.2 60.8
Changes that should be made at the school
• This school does not need to make any private-like changes because we are getting enough students 85.4 14.6
• This school does not need to make private-like changes because we are competing with other public schools and not with private schools 83.0 17.0
• This school needs to make changes to survive and compete with private schools 4.7 95.3
Expectations from making changes at the school
• With the changes you make to compete, this school should be able to improve your schooling quality 0.9 99.1
• The quality problems are systemic and cannot be fixed through efforts at your school level alone 14.6 85.4
• There is no use in making changes because parents have a preference for private schools that is not linked to education quality 86.8 13.2
Source: Authors’ calculations based on the Principal Survey.

213
Table 7.7 Odds ratios: Logistic estimation results of decision-making barriers and supports to reform
Perception questions (agree/strongly agree)
DEO -
appointing teachers (barrier)
SMC - appointing teachers (support)
Principal - appointing teachers (support)
DEO - evaluating teachers (barrier)
SMC - evaluating teachers (barrier)
DEO - spending
the budget
(barrier) Variable
Geographic proximity measure of competition
medium competition 1.50 0.82 0.85 0.81 1.30 0.97
high competition 2.08** 0.94 0.61 1.47 1.26 1.04
Subjective competition 0.97 0.67 1.04 0.59 .526** 1.53
Female literacy rate 1.27 0.76 0.73 1.06 0.92 1.04
District dummy 2.04* 3.08** 5.43*** 0.54 1.73 0.37
Urban dummy 0.77 1.39 1.13 0.70 0.56 1.15
Population growth .95* 1.01 0.99 0.99 0.99 0.97
Selective school 1.31 0.60 1.46 1.25 1.81 1.61
Total grade 9 school fees 0.99 1.00 1.00 1.02 0.99 1.02
Fraction dalit in total enrollment 0.98 0.98 0.99 1.01 0.98 1.01
Total enrollment 1.04 1.06 1.04 1.05 1.08 1.01 Fraction female in total enrollment 0.94 1.6* 1.13 0.87 0.86 1.06
Fraction of teachers with permanent contracts .88** 0.97 1.03 1.01 0.97 .844**
School age 1.03 0.91 .92* 1.05 .854*** 1.04
Hired private teachers due to lack of quota 2.16** 0.92 0.93 1.39 0.94 1.20
Poor quality of desks 1.06 1.61 1.85 0.81 1.04 1.05
Have a computer room .509*** 1.65 1.21 .572* .496** 1.31
Class size, 6th grade 0.87 0.82 0.93 0.95 .784** 0.81
Toilets for teachers 0.86 1.39 2.18** 0.86 1.68 0.78
Primary, repetition rate 0.98 0.99 1.01 1.04 1.00 0.98
10th grade new student rate 0.98 1.00 0.99 1.01 1.00 0.95
First division percentage rate .986* 0.99 1.01 1.00 1.00 1.00
pseudo R-squared 0.09 0.10 0.17 0.09 0.11 0.09
chi-sq. 66.80 46.10 80.50 36.50 62.20 38.70 Source: Authors’ estimations based on the Combined Quantitative Dataset. Note: *, **, and *** indicate significance at 10%, 5% and 1 % level respectively.
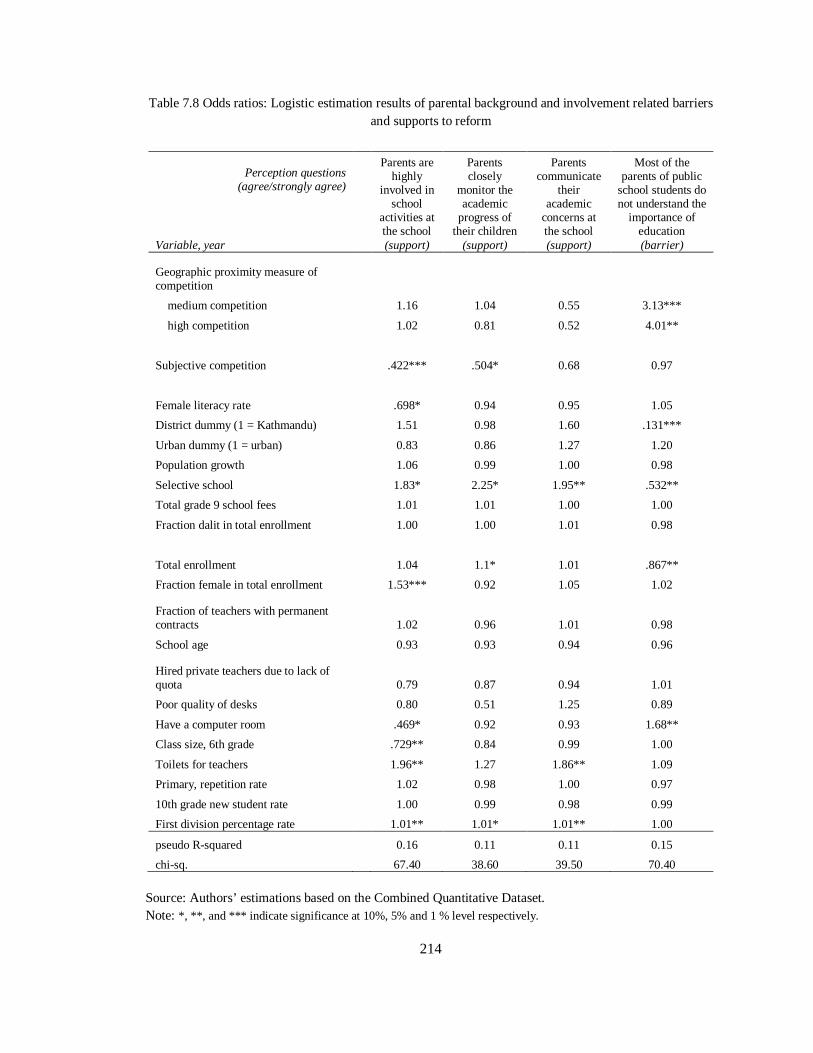
214
Table 7.8 Odds ratios: Logistic estimation results of parental background and involvement related barriers and supports to reform
Perception questions
(agree/strongly agree)
Parents are highly
involved in school
activities at the school (support)
Parents closely
monitor the academic
progress of their children
(support)
Parents communicate
their academic
concerns at the school (support)
Most of the parents of public
school students do not understand the
importance of education (barrier) Variable, year
Geographic proximity measure of competition
medium competition 1.16 1.04 0.55 3.13***
high competition 1.02 0.81 0.52 4.01**
Subjective competition .422*** .504* 0.68 0.97
Female literacy rate .698* 0.94 0.95 1.05
District dummy (1 = Kathmandu) 1.51 0.98 1.60 .131***
Urban dummy (1 = urban) 0.83 0.86 1.27 1.20
Population growth 1.06 0.99 1.00 0.98
Selective school 1.83* 2.25* 1.95** .532**
Total grade 9 school fees 1.01 1.01 1.00 1.00
Fraction dalit in total enrollment 1.00 1.00 1.01 0.98
Total enrollment 1.04 1.1* 1.01 .867**
Fraction female in total enrollment 1.53*** 0.92 1.05 1.02
Fraction of teachers with permanent contracts 1.02 0.96 1.01 0.98
School age 0.93 0.93 0.94 0.96
Hired private teachers due to lack of quota 0.79 0.87 0.94 1.01
Poor quality of desks 0.80 0.51 1.25 0.89
Have a computer room .469* 0.92 0.93 1.68**
Class size, 6th grade .729** 0.84 0.99 1.00
Toilets for teachers 1.96** 1.27 1.86** 1.09
Primary, repetition rate 1.02 0.98 1.00 0.97
10th grade new student rate 1.00 0.99 0.98 0.99
First division percentage rate 1.01** 1.01* 1.01** 1.00
pseudo R-squared 0.16 0.11 0.11 0.15
chi-sq. 67.40 38.60 39.50 70.40 Source: Authors’ estimations based on the Combined Quantitative Dataset. Note: *, **, and *** indicate significance at 10%, 5% and 1 % level respectively.
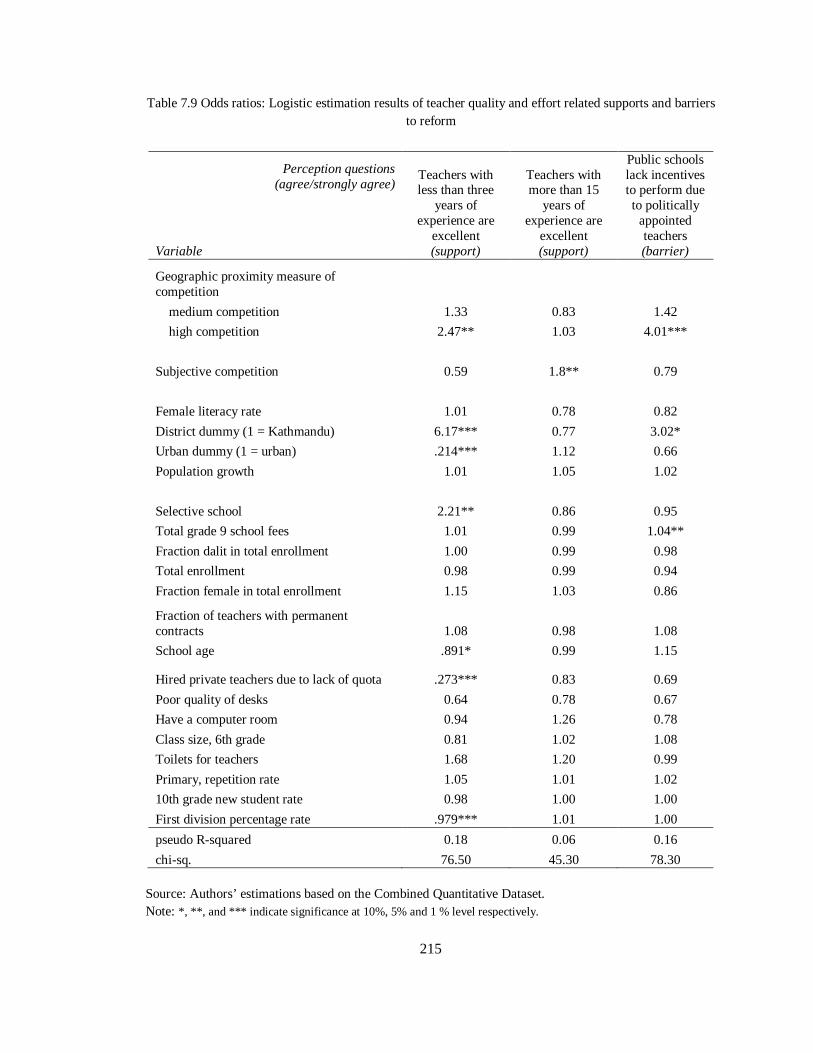
215
Table 7.9 Odds ratios: Logistic estimation results of teacher quality and effort related supports and barriers to reform
Perception questions (agree/strongly agree)
Teachers with less than three
years of experience are
excellent (support)
Teachers with more than 15
years of experience are
excellent (support)
Public schools lack incentives to perform due to politically appointed teachers (barrier) Variable
Geographic proximity measure of competition
medium competition 1.33 0.83 1.42
high competition 2.47** 1.03 4.01***
Subjective competition 0.59 1.8** 0.79
Female literacy rate 1.01 0.78 0.82
District dummy (1 = Kathmandu) 6.17*** 0.77 3.02*
Urban dummy (1 = urban) .214*** 1.12 0.66
Population growth 1.01 1.05 1.02
Selective school 2.21** 0.86 0.95
Total grade 9 school fees 1.01 0.99 1.04**
Fraction dalit in total enrollment 1.00 0.99 0.98
Total enrollment 0.98 0.99 0.94
Fraction female in total enrollment 1.15 1.03 0.86
Fraction of teachers with permanent contracts 1.08 0.98 1.08
School age .891* 0.99 1.15
Hired private teachers due to lack of quota .273*** 0.83 0.69
Poor quality of desks 0.64 0.78 0.67
Have a computer room 0.94 1.26 0.78
Class size, 6th grade 0.81 1.02 1.08
Toilets for teachers 1.68 1.20 0.99
Primary, repetition rate 1.05 1.01 1.02
10th grade new student rate 0.98 1.00 1.00
First division percentage rate .979*** 1.01 1.00
pseudo R-squared 0.18 0.06 0.16
chi-sq. 76.50 45.30 78.30 Source: Authors’ estimations based on the Combined Quantitative Dataset. Note: *, **, and *** indicate significance at 10%, 5% and 1 % level respectively.
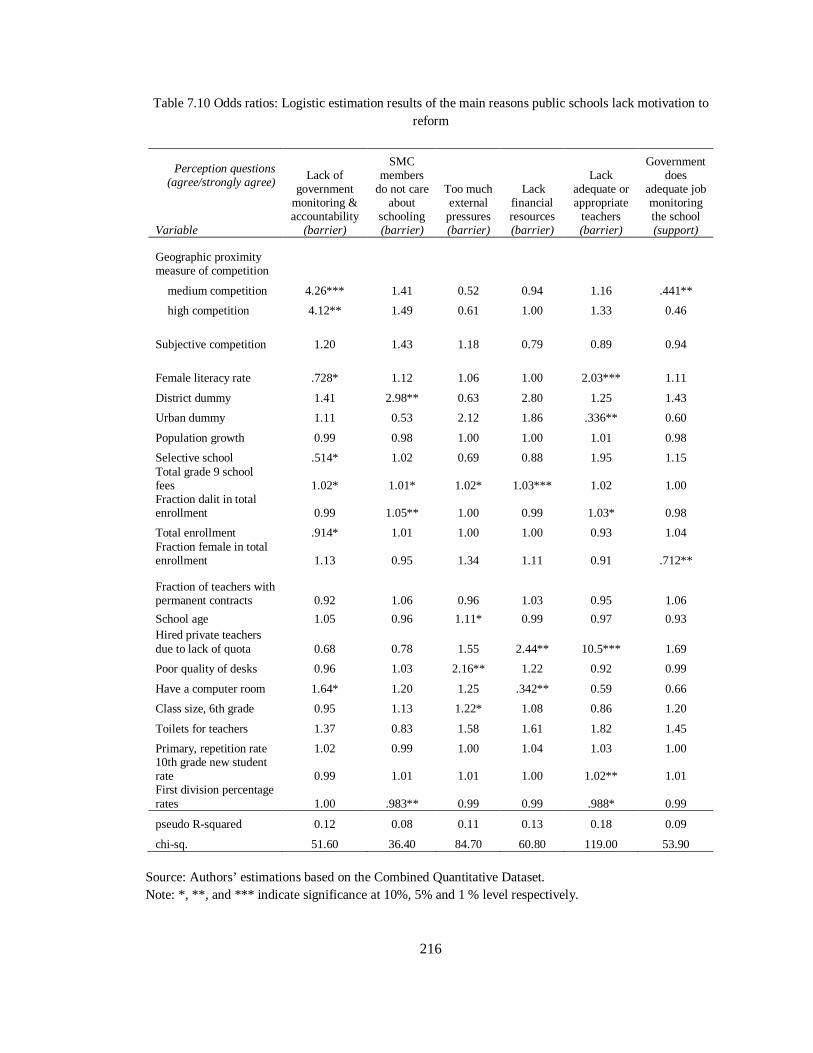
216
Table 7.10 Odds ratios: Logistic estimation results of the main reasons public schools lack motivation to reform
Perception questions (agree/strongly agree)
Lack of government
monitoring & accountability
(barrier)
SMC members
do not care about
schooling (barrier)
Too much external pressures (barrier)
Lack financial resources (barrier)
Lack
adequate or appropriate
teachers (barrier)
Government does
adequate job monitoring the school (support) Variable
Geographic proximity measure of competition
medium competition 4.26*** 1.41 0.52 0.94 1.16 .441**
high competition 4.12** 1.49 0.61 1.00 1.33 0.46
Subjective competition 1.20 1.43 1.18 0.79 0.89 0.94
Female literacy rate .728* 1.12 1.06 1.00 2.03*** 1.11
District dummy 1.41 2.98** 0.63 2.80 1.25 1.43
Urban dummy 1.11 0.53 2.12 1.86 .336** 0.60
Population growth 0.99 0.98 1.00 1.00 1.01 0.98
Selective school .514* 1.02 0.69 0.88 1.95 1.15 Total grade 9 school fees 1.02* 1.01* 1.02* 1.03*** 1.02 1.00 Fraction dalit in total enrollment 0.99 1.05** 1.00 0.99 1.03* 0.98
Total enrollment .914* 1.01 1.00 1.00 0.93 1.04 Fraction female in total enrollment 1.13 0.95 1.34 1.11 0.91 .712**
Fraction of teachers with permanent contracts 0.92 1.06 0.96 1.03 0.95 1.06
School age 1.05 0.96 1.11* 0.99 0.97 0.93 Hired private teachers due to lack of quota 0.68 0.78 1.55 2.44** 10.5*** 1.69
Poor quality of desks 0.96 1.03 2.16** 1.22 0.92 0.99
Have a computer room 1.64* 1.20 1.25 .342** 0.59 0.66
Class size, 6th grade 0.95 1.13 1.22* 1.08 0.86 1.20
Toilets for teachers 1.37 0.83 1.58 1.61 1.82 1.45
Primary, repetition rate 1.02 0.99 1.00 1.04 1.03 1.00 10th grade new student rate 0.99 1.01 1.01 1.00 1.02** 1.01 First division percentage rates 1.00 .983** 0.99 0.99 .988* 0.99
pseudo R-squared 0.12 0.08 0.11 0.13 0.18 0.09
chi-sq. 51.60 36.40 84.70 60.80 119.00 53.90 Source: Authors’ estimations based on the Combined Quantitative Dataset. Note: *, **, and *** indicate significance at 10%, 5% and 1 % level respectively.
217
CHAPTER 8
DOES PRIVATE COMPETITION IMPROVE PUBLIC SCHOOL QUAL ITY OR
INCREASE THE STRATIFICATION OF THE EDUCATION SECTOR ?
Abstract
In this chapter, I contribute evidence to address the fundamental debate in school choice,
whether competition leads to improvements in public school outcomes or increases stratification.
I utilize a 4-year longitudinal dataset of 212 public secondary schools to analyze the associations
between public school outcomes (test scores, enrollment), public school policies intended to
improve outcomes, and measures of private competition. In order to address stratification, I
compute locality-level relative ratios of the public school outcomes and all locality school
outcomes. I attempt to improve the causal inference of the analysis by utilizing fixed effects
estimation (for the time-varying private market share competition measure) and instrumental
variable strategies (for all test score based outcome measures). I find no discernible evidence to
suggest that public schools that are located in higher competition regions have higher test score
outcomes, after controlling for community and school characteristics. In addition, policies
instituted to emulate private schools have not yet been able to stop the enrollment hemorrhage
from public schools. The most consistent evidence comes from the locality-level stratification
analysis. I find that localities that have higher private market penetration are likely to have larger
gaps between public and private school test score and enrollment outcomes. Significantly, the
fixed effects estimation suggests that the gaps in student pass rates and grade 1 enrollment have
widened in recent years with an increasing private sector. Despite the limitations of the causal
analysis, the evidence from the Nepal case is consistent with previous analysis from Chile and
New Zealand, which suggested that a key consequence of unregulated choice is the stratification
of the education system.

218
Introduction
A central question in the school choice debate is whether public schools will improve as
a result of experiencing competition from private schools or whether providing choice will
instead lead to more stratification of the society. However, there is scant evidence on the
outcome and sorting consequences of increased choice in developing countries. In chapters 6 and
7, I described how public schools respond to private competition and the constraints and supports
they face while trying to stay competitive. The ultimate goal of these policy changes is to
influence student performance as it is the most accessible gauge of school quality that influences
parents’ schooling decisions. Therefore, it is also important to understand whether privatization
and policy responses to competition are having desirable effects on school outcomes.
In order to address research gaps in the outcomes literature, I conduct longitudinal
analysis of the associations between school outcomes (test score performance, enrollment),
competition measures, and school responses in this chapter. I utilize fixed effects regressions and
instrumental variable techniques to improve the causal inference of the analysis on how test
scores are affected by competition measures. I show that public schools that experience higher
competition, that is, public schools that are located in regions with higher private market share or
that have a high number of private schools in their geographic proximity, do not have discernibly
different test scores outcomes compared to public schools located in regions with lower
competition. Rather, there is suggestive evidence of stratification as localities with higher private
penetration have a greater gap between private and public school test score outcomes than
localities with lower private market penetration. In terms of the policy responses attempted by
public schools in order to stay competitive, public schools that have implemented policies to add
instructional time (by lengthening their school day or adding remedial classes) appear to have
higher average mathematics test scores, and higher number of students meeting high and low
proficiency cut-offs. On the other hand, policy responses that were initiated in order to improve
219
enrollment have not yet been successful in abating the outflow of students. For instance, public
schools that have added English medium of instruction are significantly more likely to have
lower enrollments in grade 1. It is important to note that the findings on the linkages between the
policy responses and student outcomes (test scores, enrollment) may indicate reverse causality.
For instance, public schools that suffered enrollment losses a few years ago were probably more
inclined to feel the need to introduce policies, but may not yet have been able to regain parental
trust. Similarly, public schools that have higher test scores are likely to have more favorable
conditions, and to have the resources to add remedial classes or lengthen the school day.
Conceptual Framework and Research Questions
The chapter follows an economics of education approach to estimate the impact of
competition on test score outcomes. As discussed in the literature review, competitive effects are
typically studied in quantitative models by conceptualizing student outcomes as a function of the
competition measure and school and community covariates (Payne, 2010). A central issue in
these analyses is in conclusively identifying the competitive effect – that is, how can one
determine whether any fluctuations in outcomes are caused by the competition public schools
face and not by other factors such as the existence of more schools in urban markets predisposed
to higher outcomes? (Dee, 1998; Geller, Sjoquist and Walker, 2006; Thapa, 2012a). Some of the
problems in the estimation may include the fact that private schools may be able to attract a
higher caliber of students (“cream-skimming”), private school entry may be significantly related
to public school quality, and the estimation may omit relevant variables. To improve causal
inference, these analyses typically require longitudinal data, information from before and after
policy changes, or instrumental variable (IV) strategies49 for cross-sectional datasets
49 In IV estimation, the first-stage regression utilizes the competition measure as the dependent variable, with the instrument and other explanatory and control variables. Then, the fitted values from the first-stage regression for the competition measure are substituted into the second-stage regression of outcomes on competition and other variables.s
220
(Wooldridge, 2009). The lagged value of competition is a measure that has been previously
utilized in the competitive effects literature (Geller, et al., 2006). In order to analyze the
relationship between policies and outcomes, I reference the literature on accountability systems
and competitive effects of competition (Rouse et al., 2007) to model the linkages between key
policy adoptions, competition measures, and outcomes. In order to understand the sorting
implications of unregulated choice, I analyze the relative outcomes (the ratio of public school
outcomes and all outcomes) through a locality-level analysis, in reference to Hsieh and Urquiola
(2006).
The research question addressed in the chapter is: How is the extent of private
competition linked with public school outcomes and public school responses? The specific
questions that are analyzed are the following:
(1) Do public schools in higher competition regions have better outcomes (test scores,
enrollment) than public schools in low competition regions?
(2) What is the relationship between outcomes (test scores, enrollment) and public school
responses that intend to improve those outcomes?
(3) Do localities with higher private competition have larger gaps between public and
private school outcomes (test scores, enrollment) than localities with lower private
competition?
Data and Methods
Data Sources
Given the data limitations in the Nepal context, the data collection strategy included
primary and secondary data collection that was completed over a two year period. I compiled a
4-year (2007-08 to 2010-11) school-level longitudinal dataset of 212 public schools by
combining a competition-focused principal survey conducted for the dissertation, national school
records on education indicators (the EMIS database) and national records on high-stakes

221
examination performance (the OCE database), and community characteristics from the national
population census (Census database) 50. I refer to the data set here as “Combined Quantitative
Dataset - School-level sample” for simplicity. The dependent variables are various school
outcomes from the end of high school 10th grade examination results and school enrollment in
grade 1. The competition measures are the private market share and geographic proximity
measures. These dependent variables, competition measures, and explanatory variables used in
the analysis are described more fully in the Descriptive Statistics section51. In order to conduct
locality-level analysis, I simply aggregate the school-level statistics for all dependent variables,
competition measures, and the explanatory and control variables. In reporting the results, I refer
to the locality-level dataset as “Combined Quantitative Dataset -locality-level sample” for
simplicity.
Models
In order to address Research Question 1, I test the hypothesis that public schools that
face higher competition will have better outcomes (test scores, enrollment) than public schools
that face less competition (Thapa, 2012).
The most comprehensive specification of the first set of models estimated is of the
following form:
Ypt = α + βCCpt + βxXpt + βyYp(t-1) + βDD + ε (Model 1.1)
• Yp = school-average mathematics scores, school-level pass percentage rates, or school-level
first division percentage rates in public school p in year t (used separately)
50 The datasets merged to develop the competition focused dataset used for the analysis are described in greater detail in Chapter 4, Data and Methods, and mapped in Figure 4.1. 51 Appendix 8.1 displays descriptive graphs of all outcome measures, competition measures and explanatory variables used in the model specifications.

222
• Cp = measures of competition faced by the public school p (Private market share at the VDC
or ward level in year t (psvw); or the number of private secondary schools in close
geographic proximity in 2011-12 (cobj)) (used separately)
• Xpt = school characteristics in year t, including total student enrollment (time-variant)
• Yp(t-1) = lagged test score outcome (used separately)
• D = community and school characteristics (time-invariant)
The models estimated for enrollment as the dependent variable includes a lagged school
outcome, the percentage of students who achieved first division pass rates (scored over 60%)
since enrollment is likely to be associated with the school’s performance. The model
specification is of the following form:
Ept = α + βCCpt + βxXpt + βEEp(t-1) + βDD + ε (Model 1.2)
• Ept = enrollment in grade 1 in school p in year t
• Cp = measures of competition faced by the public school p (Private market share at the VDC
or ward level in year t (psvw); the number of private secondary schools in close geographic
proximity in 2011-12 (cobj)) (used separately)
• Xpt = school characteristics in year t, including first division pass rates in year t-1 (time-
variant)
• Ep(t-1) = enrollment in grade 1 in year t-1
• D = community and school characteristics (time-invariant)
In order to address Research Question 2, the relationship between outcomes (test scores,
enrollment) and policy adoptions intended to improve those outcomes, I run two models. Firstly,
I analyze the association between test score outcomes and the school’s adoption of interventions
focused on increasing instructional time (coaching classes for weaker students, extra classes for
weaker students (remedial classes), and lengthening the school day). These interventions are

223
quasi-private instructional efforts that arguably should have a direct impact on test scores. I test
the hypothesis that schools that have adopted these policies at least two years earlier will have
higher test score outcomes than schools that have not adopted these policies.
Ypt = α + βsSp(t-2) + βCCpt + βxXpt + + βyYp(t-1) + βDD + ε (Model 2.1)
• Yp = school-average mathematics score in public school p in year t; school-level pass
percentage rates in public school p in year t; school-level first division percentage rates in
public school p in year t
• Sp(t-2) = whether school p has adopted the policy of coaching classes for weak students in
year t-2; whether the school p has adopted the policy of adding extra classes for weaker
students in year t-2; whether the school p has lengthened the school day in year t-2
• Cpt = measures of competition faced by the public school p (Private market share at the VDC
or ward level in year t (psvw); the number of private secondary schools in close geographic
proximity in 2011-12 (cobj)) (separately analyzed)
• Yp(t-1) = test score outcome in year t -1
• Xpt = school characteristics in year t, including enrollment (time-variant)
• D = community and school characteristics (time-invariant)
Secondly, I analyze the association between enrollment, policy adoptions and the test
score outcomes52. I test the hypothesis that schools that have adopted certain “private-mirroring”
policies with the express attempt to attract students (adopted English medium and added ties and
belts to their uniforms), are likely to have higher enrollment. I utilize two-year lagged values of
policy adoptions since it is likely that it will take some time for communities to hear of and trust
the improvements in the public school efforts. I also include lagged test score outcomes, the first
52 The selection of the key policy responses used for the analysis were based on interviews with 30 public school principals who shed light on the possible mechanisms via which enrollment and test score outcomes could be linked to policies. A brief discussion of policy- outcome mechanisms are presented in Appendix 8.2.
224
division pass rates, since schools that have higher test score outcomes are likely to attract more
students. In essence, Model 2.2 analyzes if there are any changes in parents’ acceptance of public
schools in response to public school policy efforts.
Ept = α + βsSp(t-2) + βYYp(t-1) + βCCpt+ βEEp(t-1) + βxXt + βDD+ε (Model 2.2)
• Ept = enrollment in grade 1 in public school p in time t
• Sp(t-2) = whether the public school p has adopted the English medium of instruction in time t-
2; whether the school has added ties and belts to school uniforms in time t-2;
• Yp(t-1) = school-average first division rates in public school p in year t-1;
• Cp = measures of competition faced by the public school p (Private market share at the VDC
or ward level in year t (psvw); the number of private secondary schools in close geographic
proximity in 2011-12 (cobj));
• Ep(t-1) = enrollment in grade 1 in year t -1;
• Xpt = school characteristics in year t (time-variant);
• D = community and school characteristics (time-invariant)
In order to address Research Question 3, I conduct a locality-level analysis of relative
outcome measures, defined as the ratio of a locality’s public school outcomes and the locality-
wide average. The locality is a government defined area, such as a village development
community or ward. The relative outcome measure is computed as the ratio of the public school
outcomes to all school outcomes in the locality. I test the hypothesis that the communities that
have higher or growing competition have worse relative outcomes (test scores, enrollment).
These measures have been developed in reference to Hsieh and Urquiola (2006) 53, who utilize
53 The Hsieh and Urquiola (2006) strategy was used here because like in Chile, there was differential growth in private market share in different localities, based on community trends. However, there are some important differences. Firstly, while the change in private market share occurred in Chile as a result of the adoption of a voucher program in 1982, in Nepal the changes in private market share occurred because private schools were re-allowed to exist in the early 1980s. Secondly, while Chile had specific communes that handle schools and other public services, Nepal has localities but no regulations governing where

225
community level definitions to provide suggestive evidence for the indirect measure of sorting.
The authors argue that the measure can be used to measure sorting since test scores are a by-
product of both sorting and productivity changes in any community that has seen changes in
private market shares.
The model specifications for locality-level test score outcomes are of the following form:
RYlt = α + βCClt + βxX lt + βDDl + βYYl(t-1) + ε (Model 3.1)
• RYlt = ratio of the locality l’s weighted average public school test score outcomes and the
locality-wide weighted average test score outcomes (all public and private schools) in year t
• Cl = measure of competition at the locality level (private market share in the locality year t,
average number of private secondary schools in geographic proximity to the public schools
in the locality, 2011-12) separately
• Y l(t-1) = locality-level weighted averages of the public school outcomes in year t-1
• X lt = average characteristics of the public secondary schools at the locality level in year t
(time-variant)
• Dl = average community characteristics in the locality (time-invariant)
The model specifications for locality-level grade 1 enrollment are of the following form:
RECt = α + βCCCt + βxXt + βDDl + βEE(t-1) + βYY(t-1) + ε (Model 3.2)
• RECt = ratio of the locality’s average public school grade 1 enrollment and the locality-wide
average grade 1 enrollment (all public and private schools) in year t
• CC = measure of competition at the community level (private market share in the locality
year t, average number of private secondary schools in geographic proximity to the public
schools in the locality, 2011-12) separately
children need to go to school. While students arguably attend schools in their localities, one cannot be absolutely sure to consider these as different markets. Thus, the locality definitions in the Nepal case are less accurate definitions of “markets” compared to the Chilean case.

226
• E(t-1) = locality-level average public school enrollment in year t-1
• Y(t-1) = locality-level average first division pass percentage rates in year t-1
• Xt = average school characteristics of public secondary schools at the locality level in year t
(time-variant)
• Dl = average community characteristics in the locality (time-invariant)
Estimation Strategies
I first estimate the models with OLS by pooling data over the four years for which data
are available. In order to utilize the longitudinal nature of the sample, I then run random effects
and fixed effects regressions54. The fixed effects estimation also addresses some of the
endogeneity issues since it controls for time-invariant community or school trends and only
captures the within-school or within-locality variations. In the model specification, I added
population growth data in order to control for a key pre-existing trend that could be correlated
with private sector growth.
In addition, I utilize the well-known solution of instrumental variable estimation to
attempt to resolve the endogeneity problem for the test score outcomes in the school and
community samples. The instrument used in the analysis is the number of private schools that
existed in 1982. I argue that this measure is a good instrument because the number of private
schools in the early 1980s, when private schools were re-allowed to enter the Nepalese market, is
likely to be correlated with the current number of private schools or private market share, since
private schools in Nepal were likely to enter in areas with higher market potential. However, the
historic number of private schools should not have any direct impact on the current public school
test score outcomes. Given the time-invariant nature of the measure, I do not use IV estimation
54 I utilize a Hausman test (or the Sargan-Hansen chi-sq statistic) to test whether the fixed or random effects should be used. While the Sargan-Hansen statistic suggests that the fixed effects model is preferable in this analysis, I present the analysis for all types of regressions that I attempted.

227
for the fixed effects estimation. I also do not use IV estimation for the enrollment dependent
variables since the validity checks did not suggest the need to use 2SLS over OLS methods.
Variable Description and Descriptive Statistics
Dependent variables
The dependent variables for Model 1.1 (and Model 2.1) are three school-level outcomes
based on the high-stakes School-Leaving Certificate (SLC) examination that is taken by all
students at the end of high-school (10th grade) in Nepal. These measure are the school-level
average raw mathematics test score (0 to 100), the percentage of students who passed in the SLC
examination (scored over 32%, a low proficiency measure) and the percentage of students who
got first division results in the SLC examination (scored over 60 %, a high proficiency measure).
As shown in Table 1, the test scores and the proficiency measures show that public
schools have improved results between 2007-08 and 2010-11. For example, the median school
passed 64% of its students in 2007-08, while the median school passed 80% of its students in
2010-11. However, the descriptive statistics also indicate high variation in school performance
across public schools, and suggest that learning levels are quite poor overall. For instance, the
worst performing school in 2010-11 was only able to get less than 15% of its students to secure
passing grades. The dependent variable for Model 1.2 (and Model 2.2) is the enrollments in
grade 1. The descriptive statistics show that the median enrollment in first grade for the public
secondary schools in the sample has steadily decreased from 44 students per school in 2006-07
to about 31 students per school by 2011-12.
The dependent variables for Model 3.1 are the locality-level relative test score outcomes.
The relative test score outcomes are (1) the ratio of the weighted average public school
mathematics score outcomes and the locality-wide weighted average mathematics score of all
public and private schools; (2) the ratio of the weighted average first division pass rates in public
schools and the locality-wide weighted average first division pass rates; and (3) the ratio of the
228
weighted average pass rates in public schools and the locality-wide average pass rates of all
public and private schools. The descriptive statistics of the relative measures suggest that public
school students are on average performing relatively decently but that there are some localities
where public schools are performing far worse than private schools. For instance, the median
relative mathematics score is 0.88. However, in some localities the ratio of public school average
score to locality-wide average scores is as low as 0.45.
The dependent variable for Model 3.2 is the ratio of the average first grade enrollment in
public schools and the community-wide average enrollment in grade 1 in all public and private
schools. In the median locality, the public school average grade 1 enrollment was 0.61 times the
overall grade 1 enrollment in 2007-08. The enrollment data suggest that private schools have not
only rapidly expanded but also, on average, have more students than public schools. Moreover,
the median locality’s public school average grade 1 enrolment was 0.53 times the overall grade 1
enrollment in 2010-11. These trends suggest that there has been a further decline in enrollment in
public schools in recent years as more parents choose private schools for their young children.
The descriptive graphs in Figure 8.1 show the association between the four relative
outcome measures and private market share. Obviously, when there are few private schools in
the locality, the public schools’ relative test scores are close to 1. There is a clear negative
relationship between the relative measures and the locality’s private market share.
Competition measures
The key explanatory variables of interest are the competition measures. As shown in the
descriptive statistics in Table 8.2, the private market share have grown from about 37% of total
enrollment in 2006-07 to about 46% of the enrollment share in 2011-12. While there has been
substantial private sector growth in the six-year period, the data also suggest that these two
districts have had a longer history of high privatization. The second measure of competition, a

229
geographic proximity definition55, was derived from the principal survey question that asked
school principals to list the number of schools within one kilometer of the school. The
descriptive statistics suggests that on average, there were four private secondary schools in close
geographic proximity to the public schools in 2011-12. The descriptive statistics of these
measures demonstrate that there is wide variation in the extent of competition in the localities in
the districts. That is, along with growing private competition, there continue to be more scarcely
populated or rural regions that have few or no private schools in the locality.
Other explanatory and control variables
As shown in the descriptive statistics in Table 8.3, I include community characteristics,
and school-level explanatory variables and other control variables in the empirical specifications.
The important explanatory variables include whether the school is selective (requires an entrance
examination test), the proportion of students who are female and dalit (indicators of
disadvantaged populations), school age, and the new student admission rate in grade 10. While it
would have been ideal to have more indicators describing student and teacher backgrounds, the
variable selection was based on data availability and quality.
Instrumental Variable Validity Check
After conducting correlational analysis and first-stage equations based validity checks, I
confirm that the instrument is valid and a strong predictor of both competition measures. As
shown in Table 8.4, the basic correlation between these measures shows that the instrumental
variable, number of private schools in 1982 (nvw1982), is fairly highly correlated with the
competition measures (between 0.48 and 0.50), and is less correlated with the school-level
outcome measures (between 0.20 and 0.25). The locality-level relative outcome measures are
55 The geographic measure may more accurately represent the extent of competition experienced by the private school than the private school market share measure because parents are not restricted by zoning regulations in their choice of school. The private market share definition of competition is time-varying, and thus useful for fixed effects estimation.
230
slightly negatively correlated with the instrumental variable. The instrumental validity checks
from first-stage equation results show that there seems to be some support for the use of 2SLS
over the OLS method. Table 8.5 displays first-stage equation results of the instrumental variable
on the competition measures which demonstrate that the instrument appears to be a significant
predictor of both the private market share and geographic proximity competition measures56.
Results
Do Public Schools in Higher Competition Regions have Better Outcomes (Test Scores,
Enrollment) than Public Schools in Low Competition Regions?
Table 8.6 provides a summary of the estimates of the competition measures on the test
score and enrollment measures utilizing a variety of estimation techniques (pooled OLS, random
effects, fixed effects, and IV estimation for pooled OLS and random effects). Overall, I find that
there is no consistent, statistically significant difference in test score outcomes between public
schools that face different levels of private competition after controlling for other explanatory
and control variables.
For the regressions with mathematics test score as the dependent variable, the pooled
OLS regression results without covariates indicate that a 1 percentage increase in private market
share is associated with a 0.06 point increase in the school-average mathematics test score, which
ranges from 0 to 100. In standard deviation terms, a 1 SD increase in private market share is
associated with a 0.15 SD increase in mathematics test scores. After instrumenting for
competition, with the number of private schools from 20 years ago, the coefficients rise in
magnitude. However, the coefficient seizes to be significant after the inclusion of other
explanatory variables into the model. The random effects specification results follow patterns
that are similar to the pooled OLS results. That is, there isn’t a significant relationship between
competition measures and the mathematics test score after controlling for covariates. The fixed
56 Further detailed tables and discussion of the instrumental validity checks are provided in Appendix 8.3.
231
effects specification also gives somewhat similar results. However, the main difference is that
the relationship between the number of private schools and the mathematics test score is found to
be negative to begin with.
The results for the high proficiency outcome measure, the percentage of students who
scored above 60% in the SLC examination, yields similar results. For instance, while increasing
the number of private secondary schools by 1 school increases mathematics scores by 0.92 points
(weakly significant at the 10% level), the coefficient is not statistically significant after
controlling for other variables.
The results for the low proficiency measure, the percentage of students who scored
below 32% in the SLC examination, are not consistent across specifications and competition
measures. The geographic proximity (cobj) measure suggests that the positive, significant
relationship between school pass rates and competition measures becomes negative and
significant after controlling for other variables. However, the estimate becomes positive and
insignificant in the instrumental variable estimation. In addition, the private market share (psvw)
measures do not indicate any sign of a negative relationship, except in the statistically
insignificant results from the fixed effects estimation.
In terms of enrollment, the OLS and random effects estimates show that public schools
in higher competition regions appear to have higher enrollments in grade 1 compared to public
schools in lower competition regions. Using the private market share definition of competition, I
find that the enrollment is not significantly related with competition once one controls for lagged
enrollment data. In contrast, the geographic proximity measure for competition finding suggests
that having a higher number of private schools in close proximity is associated with higher
enrollment, even after controlling for community characteristics such as population growth and
urbanicity. The difference in these findings may be attributable to the fact that the public schools
that are surrounded by private secondary schools are more likely to be in the densest urban

232
neighborhoods. I do find the fixed effects results from the private market share analysis to be
consistent with the anecdotal discussions. That is, the fixed effects estimation results suggests
that public schools that are in localities that have experienced private market share growth in the
4-year period between 2007-08 and 2010-11 have also experienced a significant reduction in
grade 1 enrollment.
The coefficients on the other explanatory variables have the expected signs, and suggest
that public schools that have more favorable conditions and are in higher demand are more likely
to have higher test score outcomes and higher enrollment. Specifically, the other explanatory
variables57 that were frequently significantly correlated with test score outcomes included:
whether the school had conducted any entrance examinations or not (positive association),
school fees (positive association), whether the school had a computer room or not (positive), the
school’s age (negative), the fraction of newly admitted students in grade 10 (negative) and the
district (Kathmandu has higher test scores). Some of the explanatory variables that were
significantly associated with enrollment included: migrant population (positive association),
selectivity of the school (positive), age of the school (negative), repetition rates (positive), and
the percentage of teachers with less than a bachelor’s degree (negative).
Public schools in Kathmandu valley are likely to have higher test score outcomes and
enrollment, suggesting that there is greater emphasis on test scores in the larger district. The
inclusion of the lagged dependent variable improves the goodness of fit of the model, and has a
statistically significant and sizeable positive association with the test scores and enrollment
measures. However, in the fixed effect estimation the lagged dependent variable is negatively
associated with the outcomes.
57 The detailed results are presented in the 18 tables in Appendix 8.4.

233
What is the Relationship between Outcomes (Test Scores, Enrollment) and Public School
Responses that Intend to Improve those Outcomes?
In this section, I summarize how outcomes (test scores, enrollment) are associated with
the policies adopted by the public schools. Table 8.7 summarizes the regression results between
test score outcomes (mathematics test score as an example), the policy adoptions targeting
instruction (coaching classes for weaker students, extra classes for weaker students), and
measures of competition. Table 8.8 summarizes the regression results between enrollment in
grade 1, policies adopted to boost enrollment (adopted English medium, added ties and belts),
and measures of competition58.
As shown in Table 8.7, I find that there does not seem to be any association between
student test scores and the fact that they have adopted coaching classes for weaker students two
years ago. However, the schools that added remedial classes for weaker students two years ago
seem to have higher mathematics test scores than schools that did not have remedial classes. For
instance, the pooled OLS regression results, which controls for lagged test scores and other
variables, suggests that the school had instituted remedial classes for weaker students two years
ago had 0.74 points higher mathematics scores compared to schools that had not instituted these
remedial classes two years ago. The fixed effects model results suggest that schools that had
opted to have longer school days at least two years ago had over five points higher mathematics
scores compared to schools that had not lengthened their school day.
The results for the enrollment in grade 1 as dependent variable, shown in Table 8.8,
suggest that an increase in private competition is linked to a decrease in public school
enrollment. Perhaps surprisingly, the association between school enrollment and policies
intended to improve enrollment (school’s adoption of English medium, adding ties and belts to
58 The detailed results of all models linking outcomes with policy responses are presented in the 18 tables in Appendix 8.5.
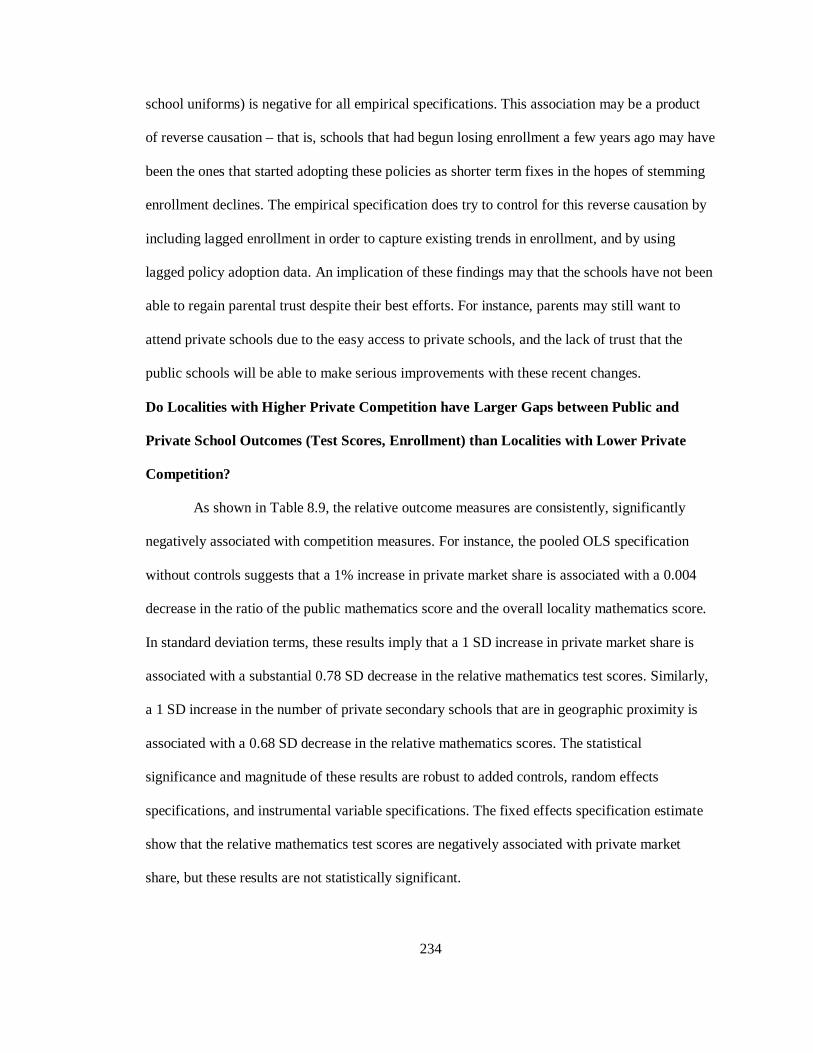
234
school uniforms) is negative for all empirical specifications. This association may be a product
of reverse causation – that is, schools that had begun losing enrollment a few years ago may have
been the ones that started adopting these policies as shorter term fixes in the hopes of stemming
enrollment declines. The empirical specification does try to control for this reverse causation by
including lagged enrollment in order to capture existing trends in enrollment, and by using
lagged policy adoption data. An implication of these findings may that the schools have not been
able to regain parental trust despite their best efforts. For instance, parents may still want to
attend private schools due to the easy access to private schools, and the lack of trust that the
public schools will be able to make serious improvements with these recent changes.
Do Localities with Higher Private Competition have Larger Gaps between Public and
Private School Outcomes (Test Scores, Enrollment) than Localities with Lower Private
Competition?
As shown in Table 8.9, the relative outcome measures are consistently, significantly
negatively associated with competition measures. For instance, the pooled OLS specification
without controls suggests that a 1% increase in private market share is associated with a 0.004
decrease in the ratio of the public mathematics score and the overall locality mathematics score.
In standard deviation terms, these results imply that a 1 SD increase in private market share is
associated with a substantial 0.78 SD decrease in the relative mathematics test scores. Similarly,
a 1 SD increase in the number of private secondary schools that are in geographic proximity is
associated with a 0.68 SD decrease in the relative mathematics scores. The statistical
significance and magnitude of these results are robust to added controls, random effects
specifications, and instrumental variable specifications. The fixed effects specification estimate
show that the relative mathematics test scores are negatively associated with private market
share, but these results are not statistically significant.

235
The results for relative pass rates and first division rates in the locality show similar
negative results. The main exception is that the estimates for the relative pass rate measure are
weakly significant (at the 10% level) even for the fixed effects specification. That is, after
controlling for all time-invariant measures, the schools that are located in growing private
markets have experienced widening gaps between private and public school pass rates. The
relative enrollment measure also indicates that localities with higher private competition have a
larger gap between public and private school enrollments in grade 1. The fixed effects
specification suggests that schools in localities that have grown over the past four years have
seen growing gaps between private and public school average grade 1 enrollments.
The other explanatory variables that were significantly associated with relative locality-
level outcomes include: average school selectivity of the locality’s public secondary schools
(positive association), district (Kathmandu has worse relative outcomes), average fraction dalit in
locality’s public secondary schools (negative association), average fraction female in locality’s
public secondary schools (positive association), average student to teacher ratio in locality’s
public secondary schools (negative association), and the average share of teachers with
permanent contracts in the locality’s public secondary schools (negative association)59. The fact
that Kathmandu district, which has the larger private market, has worse relative outcomes
compared to Chitwan, is consistent with the notion that more private schooling leads to higher
stratification. Similarly, localities with public schools that have high dalit populations, larger
class sizes, and more teachers on permanent contracts appear to have relatively worse otucomes,
which are consistent with the suggestion that public schools face difficult to educate student
populations, and less flexible teachers. It is also logical that localities with more selective public
schools are able to shore up average relative outcomes.
59 The detailed results of all relative outcome models are presented in the 18 tables in Appendix 8.6.
236
Discussion
Public schools in Nepal are widely perceived by academics, policymakers, and the media
to be worse performers in comparison to private schools. All of the existing large-scale studies
on Nepal, albeit based on the same comprehensive cross-sectional dataset from 2004, have
found that private schools have better high-stakes performance than public schools, even after
controlling for student, school and community characteristics. These findings remain robust to
various sophisticated nonexperimental techniques, such as propensity score matching (Thapa,
2012) or careful sample selection and instrumental variable strategies (Sharma, 2012). The
existing competitive effects evidence on Nepal, again using 2004 data, shows that public schools
that experience competition have better student test scores than public schools without private
competition when one uses the instrumental variable of motorable road (Thapa, 2013). In
essence, these findings suggest both the superiority of private schools and a likely positive
impact of private schools on public school outcomes.
However, in my analysis of more recent data on outcomes in the high privatization
districts I do not find evidence of a causal, significant or sizeable relationship between measures
of competition and test score measures. While the association between competition measures and
outcome measures were significant without covariates, the inclusion of explanatory variables
removes this association. The differences between my findings and Thapa (2013) may in part be
attributable to different sample sizes, different dates of study, and the use of different
instrumental variables. The lack of a significant competitive effect suggests that while schools
that are located in high competition regions may have slightly higher test scores than schools in
lower competition regions, the effects may be attributable to other factors, such as school
selectivity, age of the school, and community characteristics rather than competition itself. A
lack of competitive effects evidence is not all that surprising since it may be presumptuous to
expect major improvements in public schools without significant competition-related

237
accountability pressures. The only accountability mechanism that has currently been instituted in
Nepal, the per-child funding system, may have initiated reforms in schools but this may not yet
be transitioning to test score or parental acceptance improvements.
In my analysis of the association between lagged policy adoptions and current
enrollment, I do not find any evidence to suggest that recently implemented policies that have
been instituted to boost enrollment have had their desired effect. The finding may imply that
school policies have not been implemented for long enough to be able to reverse on-going
enrollment trends, given the easy availability of private schools and the prevalent stigmatization
of public schooling. However, I do find that schools that have adopted policies of lengthening
the school day and adding remedial classes have higher test score outcomes. These results are not
surprising and suggest that adding targeted instructional time is important for improving high
stakes outcomes. Still, the schools that mentioned that they had additional targeted coaching
classes for the high-stakes examinations did not have significantly better test scores than schools
that did not have targeted coaching classes. These additional findings suggest that targeted
teaching to the test last minute just for weaker students do not contribute to test score results as
much as instituting remedial classes or longer school days throughout the schooling cycle. While
these findings are suggestive, it is important to note that it is difficult to make a causal argument
linking public school policies and school outcomes when there are no exogenous variations in
the policy interventions or records on implementation of policies that can be exploited for
identification.
I find more compelling, suggestive evidence of stratification between the public and
private systems. The relative locality-level outcome measures, the ratio of public school
outcomes and all school outcomes, are consistently and significantly negatively associated with
competition measures. That is, I find that there is higher gap between public and private school
outcomes (test scores, enrollment) in higher competition regions than in lower competition

238
regions. Moreover, the fixed effects estimations suggests that schools in localities that have
experienced recent increases in private competition are more likely to have widened the gaps in
student pass rates and early grade enrollment between private and public schools. As discussed
by Hsieh and Urquiola (2006), a growth in the gap between public and private school outcomes
can have several explanations. A potential interpretation of these findings it that as more parents
lose trust in the public schools and gravitate to private schools, the public school officials have to
work with an increasing concentration of highly disadvantaged and vulnerable populations that
are not able to dedicate as much effort to schooling. Another explanation for a large gap between
public and private school outcomes may be that private schools have entered where public
schools were already failing. The history of private school expansion in Nepal seems to suggest
that private entry is associated with urbanization and market potential rather than specific public
school failures. While it is near impossible to disentangle the sorting and outcome effects of
long-term privatization, it is perhaps more likely that the causality runs in the opposite direction.
That is, the long-term growth in private schooling may have contributed to current public school
examination performance. Perhaps the most likely explanation for the larger gap between public
and private schools in high privatization localities is that the high number of private schools in
the market may have motivated private schools to do better to ensure their competitiveness,
while public schools were less affected or motivated due to lack of bureaucratic pressures and
other barriers.
In conclusion, public school outcomes are not substantially better in high competition
regions than in lower competition regions, despite the fact that they have more exposure to high
performing private schools. This finding contradicts the Friedman (1962) argument that
competition will automatically lead to better public school performance. Instructional time
focused policies are associated with higher test scores while policies to boost enrollment have
not yet stemmed the enrollment hemorrhage from public schools. The dominant finding from the

239
analysis is that public schools that exist in localities with higher private market penetration seem
to be far behind the area’s private schools, which is likely to be reflective of both higher private
sector performance and more stratification. The public schools in high private share regions
appear to be caught in a vicious cycle of falling enrollments and worsening relative test scores.
These findings are consistent with the evidence from Chile (Hsieh and Urquiola, 2006) and New
Zealand (Fiske and Ladd, 2000) which suggest that a predominant effect of long-term,
unregulated school choice is the stratification of the system.
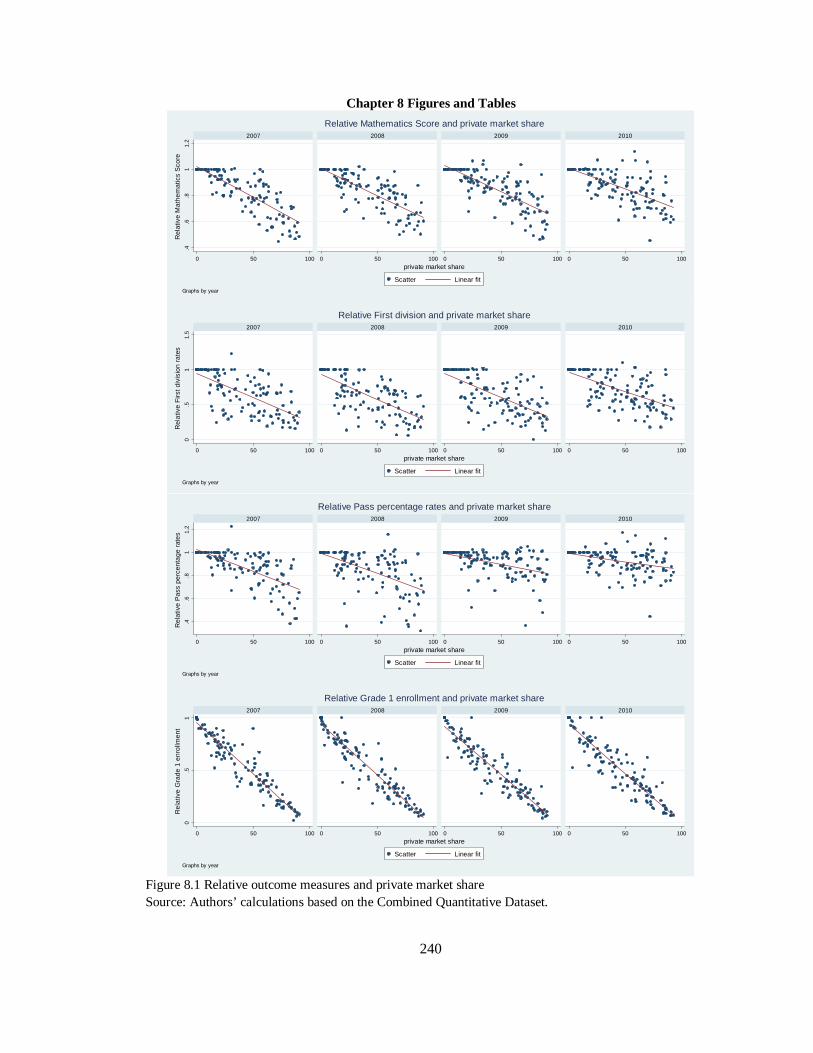
240
Chapter 8 Figures and Tables
Figure 8.1 Relative outcome measures and private market share Source: Authors’ calculations based on the Combined Quantitative Dataset.
.4.6
.81
1.2
0 50 100 0 50 100 0 50 100 0 50 100
2007 2008 2009 2010
Scatter Linear fit
Rel
ativ
e M
athe
mat
ics
Sco
re
private market share
Graphs by year
Relative Mathematics Score and private market share
0.5
11.
5
0 50 100 0 50 100 0 50 100 0 50 100
2007 2008 2009 2010
Scatter Linear fit
Rel
ativ
e F
irst d
ivis
ion
rate
s
private market share
Graphs by year
Relative First division and private market share
.4.6
.81
1.2
0 50 100 0 50 100 0 50 100 0 50 100
2007 2008 2009 2010
Scatter Linear fit
Rel
ativ
e P
ass
perc
enta
ge r
ates
private market share
Graphs by year
Relative Pass percentage rates and private market share
0.5
1
0 50 100 0 50 100 0 50 100 0 50 100
2007 2008 2009 2010
Scatter Linear fit
Rel
ativ
e G
rade
1 e
nrol
lmen
t
private market share
Graphs by year
Relative Grade 1 enrollment and private market share
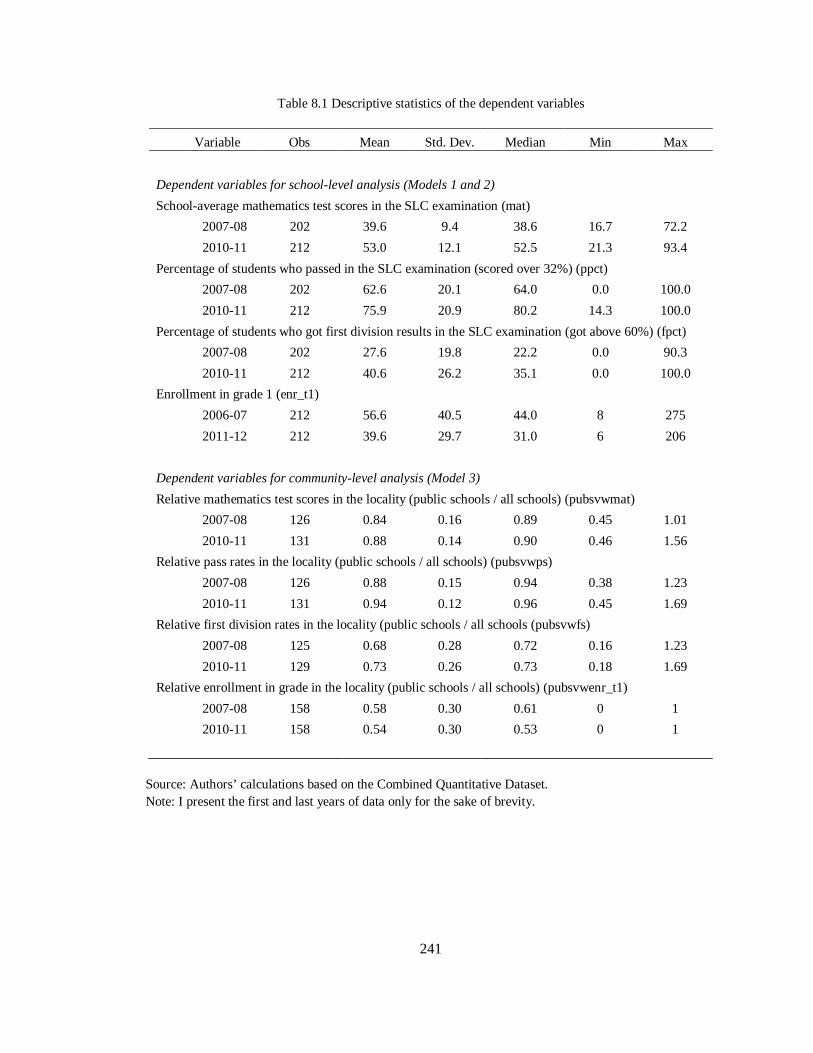
241
Table 8.1 Descriptive statistics of the dependent variables
Variable Obs Mean Std. Dev. Median Min Max
Dependent variables for school-level analysis (Models 1 and 2)
School-average mathematics test scores in the SLC examination (mat)
2007-08 202 39.6 9.4 38.6 16.7 72.2
2010-11 212 53.0 12.1 52.5 21.3 93.4
Percentage of students who passed in the SLC examination (scored over 32%) (ppct)
2007-08 202 62.6 20.1 64.0 0.0 100.0
2010-11 212 75.9 20.9 80.2 14.3 100.0
Percentage of students who got first division results in the SLC examination (got above 60%) (fpct)
2007-08 202 27.6 19.8 22.2 0.0 90.3
2010-11 212 40.6 26.2 35.1 0.0 100.0
Enrollment in grade 1 (enr_t1)
2006-07 212 56.6 40.5 44.0 8 275
2011-12 212 39.6 29.7 31.0 6 206
Dependent variables for community-level analysis (Model 3)
Relative mathematics test scores in the locality (public schools / all schools) (pubsvwmat)
2007-08 126 0.84 0.16 0.89 0.45 1.01
2010-11 131 0.88 0.14 0.90 0.46 1.56
Relative pass rates in the locality (public schools / all schools) (pubsvwps)
2007-08 126 0.88 0.15 0.94 0.38 1.23
2010-11 131 0.94 0.12 0.96 0.45 1.69
Relative first division rates in the locality (public schools / all schools (pubsvwfs)
2007-08 125 0.68 0.28 0.72 0.16 1.23
2010-11 129 0.73 0.26 0.73 0.18 1.69
Relative enrollment in grade in the locality (public schools / all schools) (pubsvwenr_t1)
2007-08 158 0.58 0.30 0.61 0 1
2010-11 158 0.54 0.30 0.53 0 1
Source: Authors’ calculations based on the Combined Quantitative Dataset. Note: I present the first and last years of data only for the sake of brevity.

242
Table 8.2 Descriptive statistics of the competition measures
Variable Obs Mean Std. Dev. Median Min Max
Private market share in each locality (psvw)
2006-07 158 36.4 30.2 34.0 0.0 100.0
2007-08 158 39.7 29.7 38.9 0.0 100.0
2008-09 158 41.6 30.4 39.5 0.0 100.0
2009-10 158 43.0 30.2 39.7 0.0 100.0
2010-11 158 44.0 30.2 43.0 0.0 100.0
2011-12 158 45.8 30.6 49.0 0.0 100.0
Number of private secondary schools in geographic proximity (school-level) (cobj)
2011-12 212 3.5 2.5 3.9 0 25
Source: Authors’ calculations based on the Combined Quantitative Dataset.
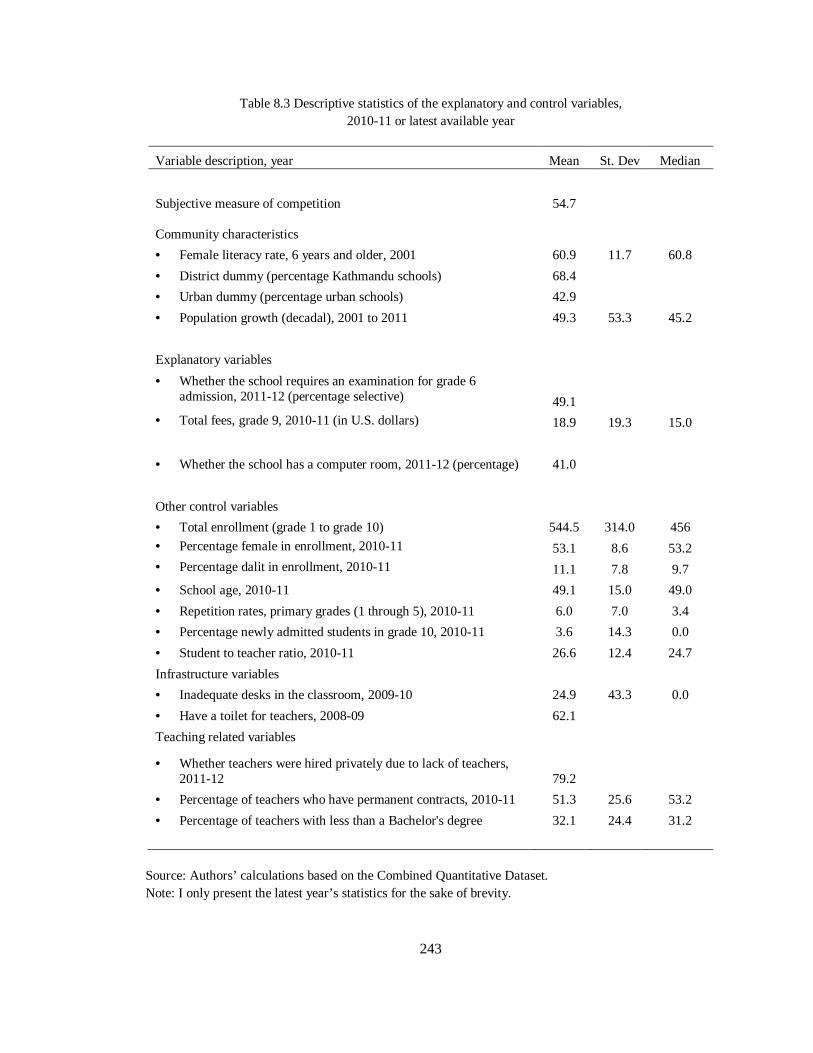
243
Table 8.3 Descriptive statistics of the explanatory and control variables, 2010-11 or latest available year
Variable description, year Mean St. Dev Median
Subjective measure of competition 54.7 Community characteristics
• Female literacy rate, 6 years and older, 2001 60.9 11.7 60.8
• District dummy (percentage Kathmandu schools) 68.4 • Urban dummy (percentage urban schools) 42.9 • Population growth (decadal), 2001 to 2011 49.3 53.3 45.2
Explanatory variables • Whether the school requires an examination for grade 6
admission, 2011-12 (percentage selective) 49.1 • Total fees, grade 9, 2010-11 (in U.S. dollars) 18.9 19.3 15.0
• Whether the school has a computer room, 2011-12 (percentage) 41.0
Other control variables
• Total enrollment (grade 1 to grade 10) 544.5 314.0 456
• Percentage female in enrollment, 2010-11 53.1 8.6 53.2 • Percentage dalit in enrollment, 2010-11 11.1 7.8 9.7
• School age, 2010-11 49.1 15.0 49.0
• Repetition rates, primary grades (1 through 5), 2010-11 6.0 7.0 3.4
• Percentage newly admitted students in grade 10, 2010-11 3.6 14.3 0.0
• Student to teacher ratio, 2010-11 26.6 12.4 24.7
Infrastructure variables • Inadequate desks in the classroom, 2009-10 24.9 43.3 0.0
• Have a toilet for teachers, 2008-09 62.1 Teaching related variables
• Whether teachers were hired privately due to lack of teachers,
2011-12 79.2 • Percentage of teachers who have permanent contracts, 2010-11 51.3 25.6 53.2
• Percentage of teachers with less than a Bachelor's degree 32.1 24.4 31.2
Source: Authors’ calculations based on the Combined Quantitative Dataset. Note: I only present the latest year’s statistics for the sake of brevity.

244
Table 8.4 Correlation matrix: competition measures, outcome measures and the instrumental variable, 2010-11
Instrumental
variable
Competition measures
nvw1982
psvw cobj
Instrumental variable • Number of private schools in 1982 (nvw1982) 1
Competition measures
• Private market share (psvw) 0.48
1 • Number of private secondary schools in geographic
proximity (cobj) 0.50
0.59 1
School-level Outcome measures • Mathematics test score (mat) 0.20
0.22 0.21
• Percentage of students who got first division results (scored over 60%) in the SLC examination (fpct) 0.24
0.24 0.17
• Percentage of students who passed (scored over 32 %) in the SLC examination (ppct) 0.25
0.31 0.20
Locality-level Relative Outcome measures
• Relative mathematics test scores (pubsvwmat) -0.12 -0.65 -0.29
• Relative student first division rates (pubsvwfs) 0.11 -0.32 -0.05
• Relative student pass rates (pubsvwps) -0.03 -0.55 -0.23
Source: Authors’ estimations based on the Combined Quantitative Dataset.
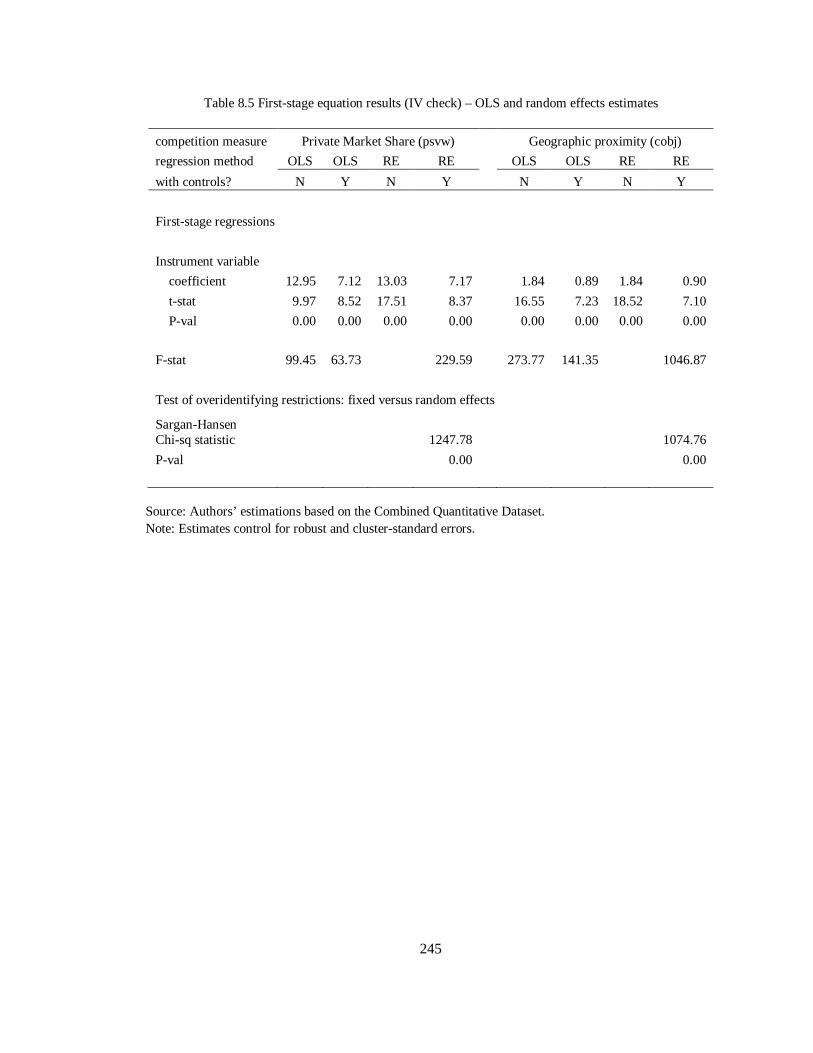
245
Table 8.5 First-stage equation results (IV check) – OLS and random effects estimates
competition measure Private Market Share (psvw) Geographic proximity (cobj)
regression method OLS OLS RE RE OLS OLS RE RE
with controls? N Y N Y N Y N Y
First-stage regressions
Instrument variable
coefficient 12.95 7.12 13.03 7.17 1.84 0.89 1.84 0.90
t-stat 9.97 8.52 17.51 8.37 16.55 7.23 18.52 7.10
P-val 0.00 0.00 0.00 0.00 0.00 0.00 0.00 0.00
F-stat 99.45 63.73 229.59 273.77 141.35 1046.87
Test of overidentifying restrictions: fixed versus random effects
Sargan-Hansen Chi-sq statistic 1247.78 1074.76
P-val 0.00 0.00
Source: Authors’ estimations based on the Combined Quantitative Dataset. Note: Estimates control for robust and cluster-standard errors.

246
Table 8.6 Estimated coefficients from OLS, random effects and fixed effects regressions of school-level outcomes (test scores, enrollment) on measures of competition
Competition Measures Measure 1: private market share
(psvw) Measure 2: number of private
secondary schools in proximity (cobj)
Dependent variables
without controls
with controls
w/ controls & lagged dep. var
without controls
with controls
w/controls & lagged dep.
var.
School-average mathematics test scores in the SLC examination (mat) Pooled OLS .06072*** -0.01 0.00 .3928*** -0.06 0.04
[0.15] [-0.03] [0.004]
[0.14] [-0.03] [0.01]
Pooled OLS, IV .1187*** 0.09 0.03
.8197*** 0.75 0.25
Random Effects .05273** -0.02 0.00
.3851*** -0.03 0.04
Random Effects, IV .1177*** 0.09 0.03 .8121** 0.64 0.25
Fixed Effects -0.08 -0.10 -0.07 … … …
[-0.11] [-0.26] [-0.19] … … …
Percentage of students who got first division results in the SLC examination (got above 60%) (fpct)
Pooled OLS .1728*** -0.03 -0.01 .9186*** -0.51 -0.14
[0.2] [-0.04] [-0.01] [0.16] [-0.09] [-0.02]
Pooled OLS, IV .3197*** 0.09 0.05 2.209*** 0.77 0.40 Random Effects .1412*** -0.06 -0.01 .8908*** -0.52 -0.14 Random Effects, IV .3143*** 0.08 0.05
2.177*** 0.62 0.40
Fixed Effects -0.26 -0.23 -0.11
… … …
[-0.22] [-0.31] [-0.16]
… … …
Percentage of students who passed in the SLC examination (scored over 32%)(ppct)
Pooled OLS .1675*** 0.02 0.02
.7261** -.4862** -.3056*
[0.22] [0.02] [0.02] [0.14] [-0.09] [-0.06]
Pooled OLS, IV .2936*** 0.23 0.14
2.028*** 1.89 1.14
Random Effects .1527*** 0.00 0.02 .7096** -.4581** -.3056*
Random Effects, IV .2914*** 0.24 0.14
2.017*** 1.94 1.14
Fixed Effects -0.32 -0.35 -0.33
… … …
[-0.33] [-0.42] [-0.4] … … …
Enrollment in grade 1 (enr_t1)
Pooled OLS .3503*** .1758*** 0.03
2.838*** 1.441** .2919**
[0.28] [0.15] [0.03]
[0.31] [0.17] [0.03]
Random Effects 0.09 0.03 0.03
2.838*** 2.08*** .3005***
Fixed Effects -.7513*** -.663*** -.6006***
… … …
[-0.32] [-0.3] [-0.28]
Source: Authors’ estimations based on Combined Quantitative Dataset – School-level sample. Notes: *, **, and *** indicate significance at 10%, 5% and 1% level respectively. The brackets contain the proportion of a standard deviation change in the dependent variable with a one standard deviation increase in the competition measure. The other variables in the specifications included community characteristics (female literacy, district dummy, urban dummy, population growth); explanatory variables (selectivity, school fees, computer room); and other student, teacher and infrastructure variables (enrollment, fraction female and dalit students, school age, repetition and new student admission rates, student to teacher ratio, inadequate desks in the classroom, toilet for teachers, teachers hired privately due to the lack of teachers, fraction teachers who have permanent contracts, fraction teachers with less than a Bachelor’s degree).
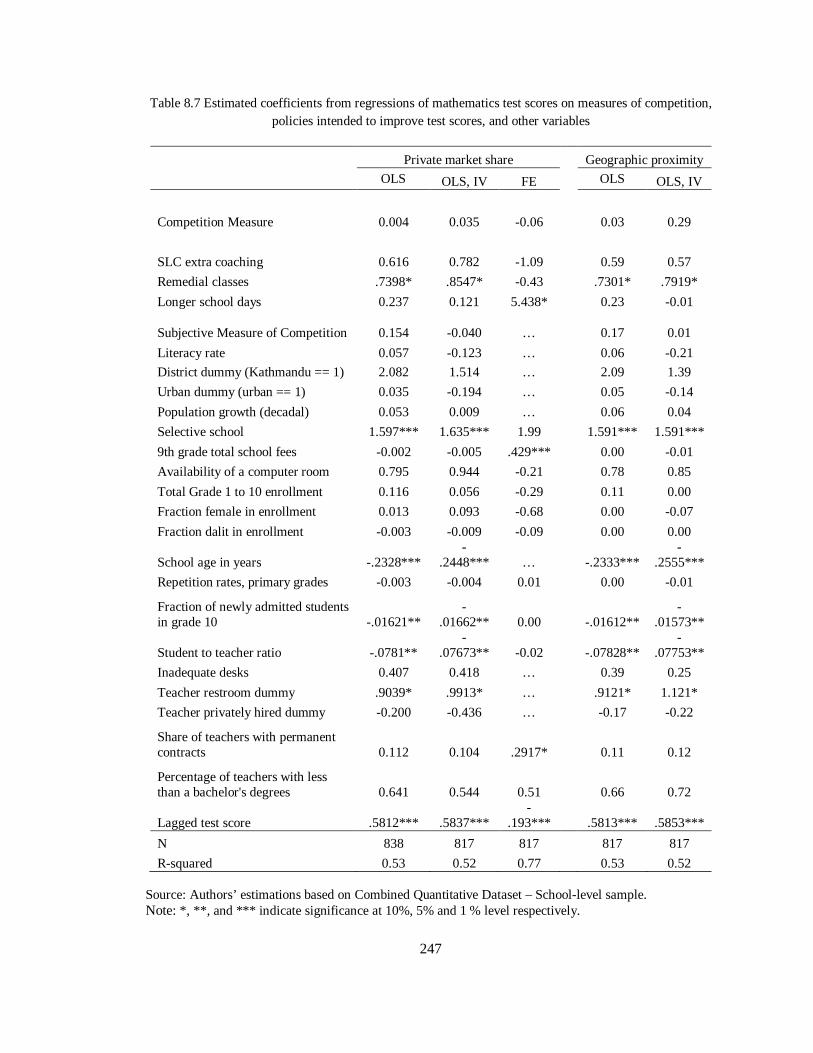
247
Table 8.7 Estimated coefficients from regressions of mathematics test scores on measures of competition, policies intended to improve test scores, and other variables
Private market share Geographic proximity
OLS OLS, IV FE OLS OLS, IV
Competition Measure 0.004 0.035 -0.06 0.03 0.29
SLC extra coaching 0.616 0.782 -1.09 0.59 0.57
Remedial classes .7398* .8547* -0.43 .7301* .7919*
Longer school days 0.237 0.121 5.438* 0.23 -0.01
Subjective Measure of Competition 0.154 -0.040 … 0.17 0.01
Literacy rate 0.057 -0.123 … 0.06 -0.21
District dummy (Kathmandu == 1) 2.082 1.514 … 2.09 1.39
Urban dummy (urban == 1) 0.035 -0.194 … 0.05 -0.14
Population growth (decadal) 0.053 0.009 … 0.06 0.04
Selective school 1.597*** 1.635*** 1.99 1.591*** 1.591***
9th grade total school fees -0.002 -0.005 .429*** 0.00 -0.01
Availability of a computer room 0.795 0.944 -0.21 0.78 0.85
Total Grade 1 to 10 enrollment 0.116 0.056 -0.29 0.11 0.00
Fraction female in enrollment 0.013 0.093 -0.68 0.00 -0.07
Fraction dalit in enrollment -0.003 -0.009 -0.09 0.00 0.00
School age in years -.2328*** -
.2448*** … -.2333*** -
.2555***
Repetition rates, primary grades -0.003 -0.004 0.01 0.00 -0.01
Fraction of newly admitted students in grade 10 -.01621**
-.01662** 0.00 -.01612**
-.01573**
Student to teacher ratio -.0781** -
.07673** -0.02 -.07828** -
.07753**
Inadequate desks 0.407 0.418 … 0.39 0.25
Teacher restroom dummy .9039* .9913* … .9121* 1.121*
Teacher privately hired dummy -0.200 -0.436 … -0.17 -0.22
Share of teachers with permanent contracts 0.112 0.104 .2917* 0.11 0.12
Percentage of teachers with less than a bachelor's degrees 0.641 0.544 0.51 0.66 0.72
Lagged test score .5812*** .5837*** -
.193*** .5813*** .5853***
N 838 817 817 817 817
R-squared 0.53 0.52 0.77 0.53 0.52 Source: Authors’ estimations based on Combined Quantitative Dataset – School-level sample. Note: *, **, and *** indicate significance at 10%, 5% and 1 % level respectively.

248
Table 8.8 Estimated coefficients from regressions of enrollment in grade 1 on measures of competition, policies intended to improve enrollment, and other variables
Private market share
Geographic proximity
OLS FE OLS
Competition Measure 0.036 -.5463*** .3244**
English medium -2.485* -3.26 -2.431*
Adding ties and belts 0.193 -5.20 0.41
lagged test score .07017** -0.0018 .0723**
Subjective Measure of Competition -0.846 … -0.90
Literacy rate -1.122 … -1.19
District dummy (Kathmandu district == 1) 5.166** … 5.041**
Urban dummy (urban == 1) 2.134 … 2.11
Migrant population rate 0.763 … 0.73
Selective school 2.347** 7.05 2.243**
9th grade total school fees 0.018 0.09 0.02
Availability of a computer room 2.116* -2.02 1.969*
Fraction female in enrollment -0.331 -4.41 -0.53
Fraction dalit in enrollment 0.136 0.23 .147*
School age in years -0.019 … -0.02
Repetition rates, primary grades 0.101 0.08 0.10
Student to teacher ratio .2562*** 0.12 .2521***
Teacher privately hired dummy -0.375 … -0.22
Percentage of teachers with less than a bachelor's degrees -3.856 -6.208** -3.72
lagged enrollment .7721*** 0.08 .7701***
N 817 817 817
R-squared 0.80 0.90 0.80
adj R-squared 0.79 0.86 0.79 Source: Authors’ estimations based on Combined Quantitative Dataset – School-level sample. Note: *, **, and *** indicate significance at 10%, 5% and 1 % level respectively.
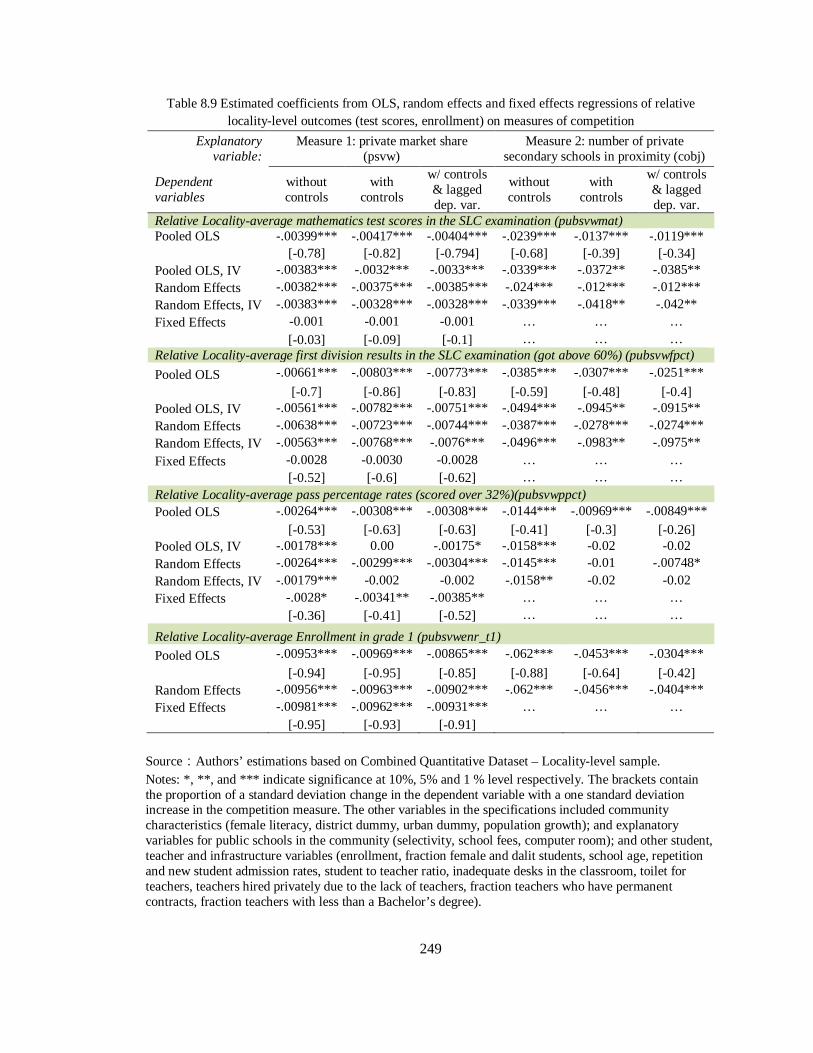
249
Table 8.9 Estimated coefficients from OLS, random effects and fixed effects regressions of relative locality-level outcomes (test scores, enrollment) on measures of competition
Explanatory variable:
Measure 1: private market share (psvw)
Measure 2: number of private secondary schools in proximity (cobj)
Dependent variables
without controls
with controls
w/ controls & lagged dep. var.
without controls
with controls
w/ controls & lagged dep. var.
Relative Locality-average mathematics test scores in the SLC examination (pubsvwmat) Pooled OLS -.00399*** -.00417*** -.00404*** -.0239*** -.0137*** -.0119*** [-0.78] [-0.82] [-0.794] [-0.68] [-0.39] [-0.34] Pooled OLS, IV -.00383*** -.0032*** -.0033*** -.0339*** -.0372** -.0385** Random Effects -.00382*** -.00375*** -.00385*** -.024*** -.012*** -.012*** Random Effects, IV -.00383*** -.00328*** -.00328*** -.0339*** -.0418** -.042** Fixed Effects -0.001 -0.001 -0.001 … … … [-0.03] [-0.09] [-0.1] … … … Relative Locality-average first division results in the SLC examination (got above 60%) (pubsvwfpct)
Pooled OLS -.00661*** -.00803*** -.00773*** -.0385*** -.0307*** -.0251***
[-0.7] [-0.86] [-0.83] [-0.59] [-0.48] [-0.4] Pooled OLS, IV -.00561*** -.00782*** -.00751*** -.0494*** -.0945** -.0915** Random Effects -.00638*** -.00723*** -.00744*** -.0387*** -.0278*** -.0274*** Random Effects, IV -.00563*** -.00768*** -.0076*** -.0496*** -.0983** -.0975**
Fixed Effects -0.0028 -0.0030 -0.0028 … … … [-0.52] [-0.6] [-0.62] … … … Relative Locality-average pass percentage rates (scored over 32%)(pubsvwppct) Pooled OLS -.00264*** -.00308*** -.00308*** -.0144*** -.00969*** -.00849***
[-0.53] [-0.63] [-0.63] [-0.41] [-0.3] [-0.26] Pooled OLS, IV -.00178*** 0.00 -.00175* -.0158*** -0.02 -0.02 Random Effects -.00264*** -.00299*** -.00304*** -.0145*** -0.01 -.00748* Random Effects, IV -.00179*** -0.002 -0.002 -.0158** -0.02 -0.02 Fixed Effects -.0028* -.00341** -.00385** … … … [-0.36] [-0.41] [-0.52] … … …
Relative Locality-average Enrollment in grade 1 (pubsvwenr_t1)
Pooled OLS -.00953*** -.00969*** -.00865*** -.062*** -.0453*** -.0304***
[-0.94] [-0.95] [-0.85] [-0.88] [-0.64] [-0.42] Random Effects -.00956*** -.00963*** -.00902*** -.062*** -.0456*** -.0404*** Fixed Effects -.00981*** -.00962*** -.00931*** … … … [-0.95] [-0.93] [-0.91]
Source:Authors’ estimations based on Combined Quantitative Dataset – Locality-level sample. Notes: *, **, and *** indicate significance at 10%, 5% and 1 % level respectively. The brackets contain the proportion of a standard deviation change in the dependent variable with a one standard deviation increase in the competition measure. The other variables in the specifications included community characteristics (female literacy, district dummy, urban dummy, population growth); and explanatory variables for public schools in the community (selectivity, school fees, computer room); and other student, teacher and infrastructure variables (enrollment, fraction female and dalit students, school age, repetition and new student admission rates, student to teacher ratio, inadequate desks in the classroom, toilet for teachers, teachers hired privately due to the lack of teachers, fraction teachers who have permanent contracts, fraction teachers with less than a Bachelor’s degree).
250
CHAPTER 9
CONCLUSION
I motivated this dissertation project by arguing that the public sector consequences of
private competition remain largely uninvestigated in developing countries. This research gap was
puzzling, since a central justification for school choice advocacy (in developed countries) has
been the expectation that the presence of competition will catalyze public sector reform. On the
other side of the choice debate, skeptics have long contended that school choice is more likely to
lead to more stratification, and that competitive pressures are unlikely to instigate public school
improvements. The growth of private schooling in developing countries has heightened the
global significance of these enduring choice debates.
Through this dissertation, I attempted a comprehensive analysis of the process of
competitive effects in the case of a low-income country that has experienced substantial,
unregulated private sector growth: Nepal. The goal was to provide an in-depth, neutral case study
by triangulating qualitative and quantitative evidence on the public sector’s experiences and
responses to private competition, the factors that determine whether public schools can
productively compete, and the impact competition has had on public school outcomes and the
stratification of the education sector.
I begin the conclusion by integrating the research findings from the four analytical
chapters (Chapters 5 through 8), bearing in mind the conceptual framework and research
questions I posed at the beginning of the dissertation. I then speak to the limitations of the
research and present some of the policy suggestions that result from these findings and
limitations. I end with a discussion of the dissertation’s implications for the global choice debate
and developing country experiences, followed by an outline of some future research possibilities.
251
Integrating the Research Findings
I framed the impact of competition on public schools as a series of interlinked processes.
To reiterate, I argued that experiencing competition was a necessary starting point for public
schools to feel the need to initiate reforms to compete with private schools. If public schools
experience competition, then they would initiate policy actions, signaling their attempts to
improve from their initial conditions. These policy efforts may eventually lead to improvements
in public school outcomes, such as test scores and enrollment. Besides the extent of competition,
public schools’ ability to respond productively to competition would depend on the school’s
personnel and financial resources, the principal’s decision-making control, and the school
officials’ experiences with the existing community, and the political and bureaucratic
environment. In integrating these findings, I argue that the experience of competition needs to be
understood in terms of the historical evolution of privatization and accountability pressures,
bearing in mind the heterogeneity in public school experiences.
The historical and sociopolitical context of Nepal casts a long shadow on the nation’s
public schools’ experience of competition and its consequences on outcomes. In the early phase
of privatization (1980s), the presence of a few private schools was not a significant competitive
pressure on public schools as public and private schools were growing due to mass education
expansion and high fertility rates. In this period, the main impact on public schools was the loss
of high SES students and the influx of middle SES students. After Nepal became a democratic
nation (in the early 1990s), there was a rapid growth of private schools in urban areas. Private
school demand strengthened in the 2000s due to growing national political volatility. Parents
valued private schools as they provided English medium education, had higher high school pass
rates, and seemed to be a better option for the purposes of migration. By the mid-2000s, urban
areas were saturated with private schools that were catering to families of diverse backgrounds.
The political influence in the public education system included politically influenced hiring of

252
teachers and management committee members, which had a deleterious effect on public school
quality. The decades of gradual sorting of higher SES students out of urban area public schools
led to the stigmatization of public schooling as “schooling for the poor.” The stratification of the
education sector is also evident from the outcomes analysis in the two highly privatized districts
– the more highly privatized a local education market, the larger the gap between private and
public school enrollments and test score outcomes. Consistently, the principals of public schools
that were located in localities with high privatization were more likely to agree that public
schools lacked the motivation to reform because of politically appointed teachers, lack of
monitoring support, and the lack of education conscious parents.
However, the analysis of current policies suggests that there may be some signs of a
public school-level turnaround. Some recent government efforts to incentivize public sector
improvements have included a financing reform, which ties public school financing to student
enrollment, and a large scale governance reform, which attempts to decentralize public school
governance to local level school management committees to foster community ownership of
public schools. In recent years, public schools may have begun to feel more competitive
pressures due to falling enrollment, negative portrayals of public schools in the media, and the
new financing mechanism. The policy implementation trends in the highly privatized districts of
Nepal show that there has been a dramatic increase in the past five years in the adoption of
“private-mirroring” policies such as English medium of instruction and adding ties and belts to
school uniforms. While some schools have the capacity to make some of the most sought after
policy changes, many of the public schools’ efforts are marred by bureaucratic and financial
inadequacies, the cancerous politicization of the education system, and a lack of community
support. In terms of outcomes, the recent adoption of these policies does not seem to have
stemmed the enrollment decline in early grades in the public schools. This finding may have one
of two explanations. The stigmatization of public schooling may be so deep rooted that parents

253
are unlikely to consider public schools even when public schools demonstrate improvements.
Alternatively, parents may be opting to “wait and watch” if the policy efforts yield sustained
changes in their neighborhood public schools.
Throughout the dissertation, I also argue that understanding the experience of
competition requires a closer examination of the local and subjective experience of competition.
The subjective experience of competition, as reported by principals in interviews and through
responses to subjective indicators, is based on their experiences given the historical and current
context of public schools and their school’s specific attributes. The in-depth analysis of
subjective experiences help shed light on the differences in public school policies, constraints,
outcomes and local conditions, and also provide evidence that questions strongly held
assumptions.
For instance, a vital assumption behind analyzing how public schools respond to
competition is the notion that private schools may be providing higher quality or more innovative
education that has made them popular to parents, which may be worthy of emulation by public
schools. However, in the course of my interviews, I realized that the majority of the principals
take issue with the presumption that private schools provide better quality. While the majority of
public school principals conceded that private schools produce better test score outcomes, only a
third of the principals agreed that private schools were also better on other indicators of quality.
Most of the bureaucratic officials and public school principals argued that public school students
had far superior noncognitive outcomes, such as sociability and sense of civic responsibility, and
the less tangible cognitive outcomes, such as intellectual flexibility compared to the socially
insular, examination focused private school students. Furthermore, public school officials
attributed better test score outcomes in private schools to more rote learning, narrow curriculum
focus, amenable students, managerial control, and outright cheating practices. Consequently, it is
not surprising that the key policies adopted by public school principals were private “mirroring”
254
policies such as English medium and adding ties and belts to their school uniform that are visibly
attributed to private schools. Furthermore, public schools that had principals who mentioned at
least one private school when asked to list three competing schools, a subjective measure
denoting experience of private competition, were significantly more likely to have implemented
the policies of English medium, adding ties and belts, and adding remedial classes than schools
with principals who did not mention private schools as competition. The responses to the
subjective measure of competition seems to distinguish between public school principals who
believed that they could compete with private schools versus those that did not think that they
could institute policies to compete with private schools.
The analysis of subjective experiences also clearly highlights the heterogeneity of the
public sector. Because of the loose monitoring of government regulations, there is substantial
within-public school heterogeneity in addition to the large differences that may exist between the
public and private education sectors. Some of the “best” public schools, identified by other
public schools and district officials, exhibit many favorable characteristics: they have
entrepreneurial, dynamic principal and management committee leadership, a committed teacher
team, support from the bureaucracy, a focus on schooling quality despite the overwhelming
national political environment, and a reputation built on higher test score outcomes that attracts
higher enrollment. These schools of exceptional quality are “oversubscribed” (Fiske and Ladd,
2001) and are able to take their pick from the students. A more recent government effort
(initiated in 2011) which focuses on improving public school perceptions aims to prioritize
public school graduates to receive the few scholarships provided by the government for higher
education in medicine and engineering. Such reform efforts further help these best schools attract
parents and students who would have otherwise attended private schools.
At the other extreme, there are public schools that experience some combination of the
more unfavorable characteristics: the principals face heavy political influence in decision-
255
making, there is a lack of effective teamwork, they get poor student outcomes and they have no
option but to enroll everyone who comes to the school. While the public schools are expected to
provide access to education to all students, the government financing or technical support
mechanism does not account for the difficulties caused by the differential demographic
composition of the student body. For instance, some of the schools I encountered faced problems
with high enrollment volatility as children of migrant laborers would enroll in the public schools
for short periods of time (less than a year) and then leave with their parents. The education of
migrant children is essential, but properly educating migrant children becomes an additional
burden on public school teachers that is not acknowledged by the government, and is not really
recorded in the school-level statistics either.
The in-depth interviews and school visits provided several examples that demonstrated
how local conditions play a central role in determining the public school experience of
competition. For instance, one of the study schools was a rural school in the remote district of
Dadeldhura. The school was located in a hilly region of the district and was effectively closed off
to nearby populations (a closed education market). The region had a small population but had
two private schools. The public school was near collapse as the private schools prospered.
Furthermore, when the public school officials attempted reform efforts, the principal received a
variety of threats from the community members, including those who joined the public school’s
management community. The principal later realized that many of the community members had
invested in the private schools and were worried that they would earn lower profits if the public
school improved. The decline in status experienced by this regional public school goes against
several long-held assumptions about public sector issues and highlights the need for more
detailed locality-level analysis. Firstly, it demonstrates that the shift of enrollment from public
schools to private schools is not just an urban area phenomenon and that it is important to have
information on the percentage of enrollment lost to private schools rather than just aggregate
256
measures of public and private school market shares in a locality. Secondly, this example
provides a cautionary tale against presuming that public schools will likely benefit if the
community is given more authority over public schools. In the case of this remote school, the
community would likely have been happy to let the public school deteriorate.
Limitations
Despite my best efforts, there are several ways in which the data and analysis could be
improved to better analyze the experience of competition. It is important to take note of these
limitations before trying to interpret these findings for global theoretical or policy discussions.
Several of the data and methodological limitations mentioned below are a result of the lack of
extensive, long-term national data systems.
Data Limitations
I begin with a discussion of the limitations in the primary datasets. The key limitation of
the quantitative primary dataset was the sample size and the lack of more detailed survey
questions. Firstly, I had selected only two districts that represented relatively high privatization
districts to get a sense of their public school responses. In hindsight, it would have been even
more productive to have administered the principal surveys to more districts where private
schooling was a nascent development. Secondly, detailed survey questions would improve the
data on policy responses. For instance, when trying to understand if a public school had
implemented English medium of instruction, a key policy I highlight throughout the study, it
would have been interesting to have a few more survey questions to get at the substantive
variations in the adoption of English teaching within public schools. For instance, a question
could have asked the principals if the school had reduced the workload of the teachers so that
they could be trained in English teaching.
The main limitation of the qualitative dataset was that it was comprised of one-off
interviews with a large group of national, district, local, and school officials and parents. If I had

257
collected at least two rounds of data with a select group of principals, I could have probed further
into their competitive experience with particular schools and the results they saw from
implementing new policies. For instance, I could have better understood the constraints faced by
schools in transitioning to English medium if I could have interviewed the principals in year 1
and then talked to them again in year 2 to gauge how their experiences had evolved in that
period.
In the secondary data, the main limitation was related to data quality. For instance, this
dissertation was the first project to utilize school-level data from the national EMIS system and
the national high-stakes performance indicator databases for school-level analysis. Prior to the
study, these education indicators were only available in reports and had only been used for state-
level and national-level descriptive statistics. As a result, the datasets had quality issues that were
magnified at the school level for the few districts that I was studying. For instance, I could not
utilize a number of the variables of interest, such as infrastructure variables, due to the large
number of missing cases. The task to merge the performance data with the education indicators
data was also riddled with problems. The two datasets were housed and managed by two
different units of the Department of Education. For this analysis, the high-stakes examination
dataset had to be drawn from hard copy books since the OCE did not provide the electronic
datasets. There have been a few assessments to check the reliability and validity of the national
indicators database, which has found that there are a few data discrepancies. Importantly, the
2008 accountability mechanism that links financing to enrollment has apparently incentivized
inflated reporting of school-level enrollments. Similarly, there are questions of the credibility of
the test score performance data, produced by the OCE, since there are reports of systematic
cheating practices in many parts of the country. In addition, the data are not provided at the
student-level and the reports are not scrutinized or checked extensively afterwards by the
schools.
258
Finally, the country has never had a systematic local taxation system, which limits the
information on residential sorting and the socioeconomic status of the parents who send their
children to public or private schools in any locality. The only dataset that collects some
community level information on socioeconomic status is the national living standards survey, but
these are infrequent and are not a census of family incomes in communities. Systematic
historical information on parental socioeconomic status, disaggregated by public and private
schools, would go a long way towards bolstering the argument that many regions in the country
have experienced long-term stratification.
Methodological Limitations
A main set of methodological limitations were related to causal inference. There were
three arguments that could have been improved with causal analysis. It would have been useful
to be able to argue (1) that competition was causing changes in outcomes; (2) that certain policy
changes were caused by private competition; and (3) that certain policy changes were leading to
changes in outcomes. In order to improve the causal inference of the link between competition
and outcomes, I utilized instrumental variable analysis (the lagged number of private schools
from 1982 as the instrument) and fixed effects regression. However, it was not possible to
causally attribute policy changes to increase in private competition, or improvements in
outcomes to policy changes. There were no locality-based differences in policy adoption that
could be exploited to provide the required exogenous variation. Additionally, there were no
implementation records of when the existing accountability mechanism went into effect. A
strength of this study, borne out of these data limitations, is the utilization of a mixed methods
approach. I first utilize historical recall data and interview data to identify the policies that are
most likely to be attributable to competition and influence outcomes. I then analyze whether
public school policy adoption can be systematically linked to the extent of privatization or

259
outcomes. By doing so, I hope to have improved the analysis of the association between
competition measures, policies and school outcomes.
One of the more significant methodological problems is the use of private market share
definition of competition based on a government defined locality in a developing country that
does not have zoning policies for education access. For instance, the locality definition may be
good enough to define a closed market in hilly or mountainous terrain. However, despite the fact
that distance is an important factor in school decision-making (Joshi, 2013b), it is unlikely that
students stick to schools within their locality in dense, urban regions with easy transportation
access. The use of the private market share definition was important as it was the only time-
varying measure of competition available for the study. However, the fact that the definition may
not capture contained local markets is a limitation of the study.
Another main issue of the study is generalizability. The principal survey was
implemented in two urbanizing districts of Nepal, and the interviews were conducted in five
other districts throughout the country. I argue that the study context is not as unique as it may
seem at first glance. For instance, in terms of global relevance, while Nepal is often thought of as
a “small” country because of the neighboring populous giants (India, China, Pakistan and
Bangladesh), the country’s population of 26 million, based on 2011 census estimates, rivals that
of Texas, the second most populous state of the United States. Kathmandu district, one of the
sites of the study, has nearly two million inhabitants. Globally, the Nepal experience is likely to
be particularly relevant for Asian, African and Latin American countries that have experienced
rapid recent private sector growth, and that are land-locked or are emerging from conflict
situations. While the main study is focused on urban regions of the country, the national analysis
and interviews done in remote districts provide evidence that is generalizable to the rural
populations of the country and other South Asian countries.

260
Given the limitations, I utilized different types of data, measures, and methods to argue
that the combined analysis enhances the robustness of the findings. I believe that such an
approach is necessary to provide an in-depth analysis in developing countries.
Policy Implications
Building Better Data Systems
A key policy recommendation is to improve the existing data systems in Nepal with the
express intention of facilitating constructive research and policymaking. The specifics of the data
based recommendation are likely to be relevant for other less researched, low-income developing
countries that are developing EMIS data systems with support from UNESCO and other
multilateral agencies.
In the Nepal case, the first priority should be to integrate and increase the accessibility of
the data that is already being collected. The Nepal EMIS system is already a massive
institutionalized data system that collects information from over 30,000 schools. It is critical to
now take more steps to make the database more accessible for local school-level consumption
and for the research community. As mentioned earlier, various education related data (the data
on education performance, private school records, community indicators, and education
indicators) are scattered in a variety of the education statistics departments. An integrated data
system that focuses on ensuring the quality and availability of the data, after removing
identifiable information, would go a long way in ensuring that experiences of countries like
Nepal are analyzed by the research community. It will also greatly reduce the logistic burdens on
researchers who can then focus on conducting deeper investigations of their questions.
Secondly, there needs to be more data collection efforts using the EMIS system since it
is the only disaggregated national data mechanism that efficiently collects data on a twice yearly
basis in Nepal. The EMIS system should also include sections on instructional and
noninstructional policies, school financing, parental SES, and have a more streamlined and
261
different data system for private schools. Improving databases on policies adopted by schools
will help the policymakers and the schools learn about policies being attempted nationally. The
policy information can then be used to steer schools in the right directions and support schools at
the local level as required. The education databases need to include information on parental SES,
school and village level income to initiate the discussion of poverty based targeting of school
resources. Information on parental SES will also help the government understand the variations
in community level capacity to contribute to the public or private education system. Given the
growing realization of the importance of private schools, there needs to be better data collection
of data on all private schools, including unregistered schools, to understand the real extent and
impact of privatization in developing countries. Since the data system in Nepal was tailored for
data collection on public schools, private school principals report that they feel that the EMIS
system is more of a burden for the private school system than a resource. In order to make the
data system more useful for private schools, there needs to be better targeting of the data
collected from private schools.
Fighting the Perception Battle
A barrier to public school reform that is rarely recognized by the media and
policymakers in Nepal is the fact that public schools have lost the perception battle to private
schools. Given the long-term gradual increase in sorting that lead to the stigmatization of public
schooling, improving public school perception is likely to take a long time. The policy
recommendations focused on improving public school perceptions are likely to be especially
relevant for developing countries which have unregulated choice environments, lack taxation
based zoning, and have seen gradual private sector growth.
One approach to improving public school reputations is to mandate that people who live
in some locality send their children to that school (e.g. through residential zoning) or to require
that teachers send their children to the public schools that employ them. It would be difficult to
262
implement these types of strategies as teachers and other parents may argue that they have the
right to choose, based on their ability to pay. Furthermore, it may be a logistic challenge given
the lack of residential taxation systems that fund education. However, some of the schools in
this study have achieved success using this approach, and some district officials mentioned this
type of strategy as a promising solution for amenable schools in Nepal.
Secondly, given the overwhelming negative perception of public schools, policymakers
should introduce media campaigns to highlight the positive contributions of public schooling. An
important aspect of this campaign would require not just highlighting the top performing public
schools or their historical contributions to nation-building but also shedding light on the
contributions made by public schools to modern society, especially by educating and
empowering the most disadvantaged populations in the nation. Another key policy need to
reduce the negative perceptions of public schools is to ensure that the public schools that are
experiencing the most difficulty receive targeted attention and are either shut down or merged
with another school if the schools are not salvageable. For instance, it is important for
policymakers to be especially aware of the schools that have disharmonious relationships with
the community. The local education officials then can play a role in diffusing these tensions or to
gauge if it would be best to shut down the school.
Other strategies could focus on enhancing the profile of all public schools while
emphasizing a meritocratic environment. For instance, the Nepal government could ensure that
the top 1 to 2% of students of all public secondary schools receive merit-based higher education
opportunities. Many of the interviewed public school principals cited the difficulty faced by poor
but highly capable public school students who were unable to get access to expensive higher
education. While there is room for cream skimming and potential for elite students to rig the
system, at the very least such a policy would not just favor the elite public schools. One way to
lessen the potential for corruption by the elite population would be to mandate that the student
263
have studied at the school for at least two years (secondary level) to be eligible for any
incentives.
Principal’s Role in Improving Quality
Perhaps the most important way to gain parental trust is for the public schools to
demonstrate that they have improved in quality. As demonstrated in the analytical chapters, and
consistent with evidence from the school leadership literature, the principal’s managerial abilities
play a significant role in determining school quality in Nepal. In the context of developing
countries that face strong political interference in education systems, the principals need to be
politically savvy as they have to handle multiple stakeholders and ensure that the school does not
become a job creation agency. These principals also need to ensure that the school team is
motivated to focus on school quality even in an environment that lacks performance-based
accountability.
In Nepal, some of the policymakers I met mentioned that they had discussed partnering
public and private schools to foster an exchange of ideas between these types of schools. It may
be more worthwhile if the district officials attempt to partner the best functioning public schools
with public schools that require special assistance. The worst performing public schools are more
likely to believe that they can benefit from the managerial and professional expertise of well-
known public school principals who function under the same overarching bureaucratic structure.
Bureaucratic Improvements
Public school officials in Nepal mentioned a whole host of bureaucratic rigidities, such
as poorly formulated policies, the lack of implementation of policies, and the lack of adequate
financial supports, as barriers to reform. These types of bureaucratic rigidities are known to be a
significant problem in other developing countries as well as in disadvantaged communities in
developed countries. Among the most policy amenable of the bureaucratic problems in Nepal is
the issue of lack of classroom monitoring by local level officials. District officials can ensure that
264
there is a better alignment of the goals of local officials with the needs of principals and schools
by streamlining local officials’ job requirements so that they can focus more on technical support
to the schools and less on other administrative activities. In developing countries that are mired
in a variety of bureaucratic and political inefficiencies, it is important to try and distinguish
between policy amenable and systemic problems so that incremental gains can made in
improving bureaucratic functioning.
Financing related Recommendations
Most of the focus in developing country finance efforts has been on increasing financing
for basic education from bilateral and multilateral foreign assistance. In the Nepal context, I
realized that there are two other substantive problems that would improve the efficiency of
existing resources. These recommendations are also likely to be relevant for other low-income
developing countries.
Firstly, the financing mechanism in Nepal’s schools is primarily based on teacher salary
needs and student enrollment, and does not take into account the variations in living standards,
public school resource availability and needs. As a result, the fact that schools have their own
funding sources, such as rental income from buildings and land, does not factor substantially into
public school funding distributions. Also, schools that educate more disadvantaged populations
do not receive different amounts of funds that take into account the severe educational
disadvantages that these populations face. Similarly, the only equity related mechanism, the
scholarship quotas for dalit or janjati and girl students, does not utilize any poverty targeting and
hence these funds are likely to be appropriated by the wealthier populations among these
disadvantaged groups. An overarching remedy for all of these problems is to begin the transition
to a more sophisticated financing formula using some locality-level mapping strategies to target
funds better to the least resourced schools. The financing formulae could begin to factor in

265
concentrations of disadvantaged populations, negative peer effects, and migrant populations to
come up with a more equitable mechanism to distribute existing government resources.
A second problem that is at least partially related to financing is the fact that public
schools are free schools. While free public schooling provides equal opportunity access to all
students, many urban district schools are relegated as “schooling for the poor” and face a lack of
community support precisely because education is provided for free in public schools. As a
result, middle class parents mentioned that they would be embarrassed to send their child to free
public schools when there were fee-paying private schools around. They wanted to show that
they could also afford to pay, and that they cared for their child’s education. While controversial,
a solution to this problem is to revisit the free schooling resolution and to improve targeting so
that public schools are accessible to the poor but are not stigmatized as schooling that is only fit
for the poor.
Implications for the Choice Debate
There is an almost unfathomable volume of research and advocacy that has focused on
the pros and cons of allowing alternatives (private schools, charter schools, voucher programs,
magnet schools, home schooling and so on) to the public school system. While most of the
research attention used to focus on the pioneering voucher program in Chile and state specific
experiences in developed countries such as the United States (and to a lesser extent, England,
Australia and New Zealand), the growing awareness of low-fee private schools has brought
developing countries squarely into this debate.
My detailed exploration of the Nepal case has implications for both sides of the global
choice debate. Firstly, the Nepal case’s historical experience suggests that unregulated growth in
privatization is unlikely to automatically incentivize public school improvements. However,
unregulated choice is much more likely to gradually increase the stratification of the education
sector. These findings are consistent with other analyses of systems that have gone through

266
major long-term reforms, such as Chile (Gauri, 1998) and New Zealand (Fiske and Ladd, 2001).
Stratification is also one of the consequences borne out in economic theory (Nechyba, 2009).
At the same time, competitive pressures do seem to incentivize some changes in school
policies, which are a competitive effect as suggested by pro-choice advocates. The Friedman
(1962) argument that public schools will automatically improve as a result of competition has
been eschewed by many researchers and policymakers in the last decade. As a result,
governments have tried to institute reforms to improve school autonomy (governance reforms)
and have incorporated accountability mechanisms alongside school choice. In Nepal, the analysis
of intermediate outcomes (policy adoptions) suggests that competition and accountability
pressures have incentivized some policy changes. In particular, the fact that principals who
perceive private schools as competition are more likely to adopt many private-mirroring policies
compared to public school principals who do not perceive private schools to be competition does
suggest that competitive pressures can incite a response from public schools. The finding that
changes in public school policies do not seem to have led to changes in public school outcomes
may be because the policies have not been instituted for a long enough period. Alternatively, it
could suggest that parents are going to wait until a significant number of public schools can
demonstrate policy successes and stage a perception turnaround.
However, the variations in public school experiences in Nepal suggests that one has to
be cognizant of the fact that accountability mechanisms are not always enough to incentivize
policy changes. In particular, public schools that have experienced stigmatization, face strong
negative community distrust, have poor outcomes, have problems enrolling students, and lack
effective teaching teams and financial supports are likely to not be able to improve their
educational outcomes with accountability pressures alone.
As a result, enduring productive effects of competition will require well-timed
accountability mechanisms based on the understanding that both “too little” and “too much”
267
competition may not be productive for public schools. There are probably two tipping points in
the process. Firstly, there needs to be some private schools for public schools to feel as though
they are competing with a different type of school. If accountability mechanisms are introduced
in the early stages of privatization, as was done for many rural areas and smaller district public
schools, then they may be incentivized to respond with productive changes. However, if the
accountability mechanism is only introduced after decades of stigmatization, or after significant
erosion of public school enrollment, then it may be too late for the public schools to regain
parental trust without major systemic government intervention.
Implications for Developing Countries
The school choice debate in developing countries skews more towards pro-private
research and advocacy because of the well-documented problems with inefficiencies in
developing country bureaucracies, and the growing evidence of poor quality of learning in public
schools. While competitive effects have remained largely uninvestigated in developing countries
and there remain many data problems, most of the large-scale studies in developing countries
have found that private school students have better outcomes than public school students, even
after controlling for a variety of background factors. For instance, in Nepal, Thapa (2012) and
Sharma (2012) have used propensity score matching and careful sample selection procedures
respectively to conclude that private school students have better test score performance
compared to public schools. An important study for the Nepal case is the Thapa (2011)
competitive effects analysis. Thapa (2011) analyzed public school performance by the extent of
competition to conclude that the benefits of competition probably outweigh the negative
stratification effects of competition in Nepal.
My in-depth analysis of the Nepal context suggests that a lot more analysis is needed
before one can make the bold assertion that more private schooling is primarily beneficial for the
education system and student learning in developing countries. While my analysis in Nepal does

268
not suggest that there are no productivity effects of private school growth, there is more
consistent evidence that unregulated private sector growth has caused stratification of the
education system. In developing country contexts, a better understanding of public-private
differences on a fuller set of cognitive and noncognitive outcomes are required before one can
assert that private schools are indeed providing better quality, and that private sector competition
does incentivize better public school outcomes.
Future Research
The dissertation analysis provides several avenues for future research. One promising
area for analysis includes further investigation of how the best public schools are affected by
privatization. An initial exploration of the best public schools, identified by the public schools in
the sample, suggests that the best schools in the district have higher enrollment, better test score
outcomes, and are more optimistic about their ability to stay competitive. An analysis of how the
best schools interact with other public schools and private schools can help further explain the
mechanisms of competitive effects since public schools may be looking to the best public
schools for informal policy guidance, and the best public schools in turn may be motivated by
their competitor private schools.
The investigation of the Nepal context suggests that there needs to be further
investigation of learning differences between public and private schools that are not based on the
high-stakes examination performance. There needs to be more definitive assessments of the
claims by public school principals and bureaucratic officials that public schools provide better
noncognitive outcomes and more long-lasting learning skills compared to private schools. In
addition, there needs to be an investigation of how private schools view the quality differences
between public and private schools. Do private schools also attribute the differences primarily to
their managerial control and the demographic composition of the students? Or, do they believe
that private schools are truly able to provide a better learning environment?
269
Finally, it is also important to analyze how extensive privatization affects the more
disadvantaged populations since stratification is a likely consequence of privatization. Gender
and caste discrimination are highly persistent inequalities in South Asian countries. While girls
and students from disadvantaged castes used to be unable to go to school ten years ago, their
parents’ inability to afford private schools for their education disadvantages them in today’s
society. One of the issues that requires further investigation is to see if the scholarship quota
system, which provides quotas to girls and dalit or janjati (disadvantaged group) students to
attend public schools, is a good solution for improving equity or whether these populations
would be better served with vouchers for private schooling. These areas of investigation
represent just some of the questions that would further illuminate how private school growth has
impacted the education sector’s equity and quality.
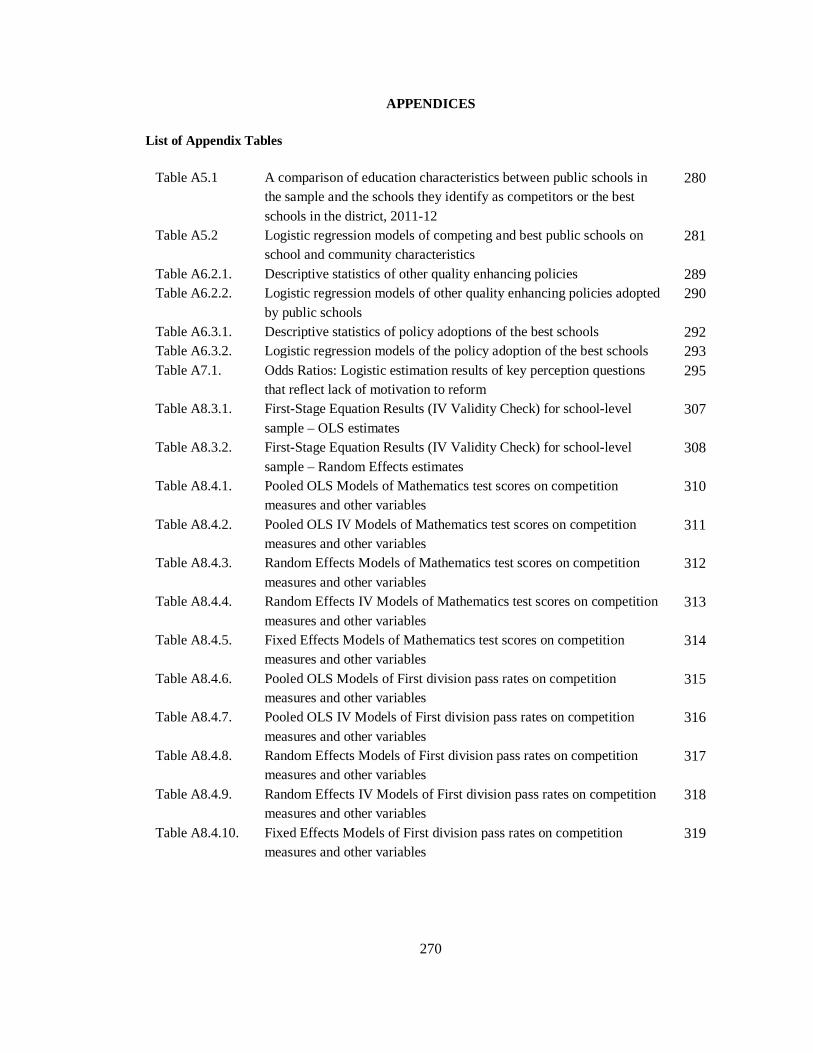
270
APPENDICES
List of Appendix Tables
Table A5.1 A comparison of education characteristics between public schools in the sample and the schools they identify as competitors or the best schools in the district, 2011-12
280
Table A5.2 Logistic regression models of competing and best public schools on school and community characteristics
281
Table A6.2.1. Descriptive statistics of other quality enhancing policies 289 Table A6.2.2.
Logistic regression models of other quality enhancing policies adopted by public schools
290
Table A6.3.1. Descriptive statistics of policy adoptions of the best schools 292 Table A6.3.2. Logistic regression models of the policy adoption of the best schools 293 Table A7.1. Odds Ratios: Logistic estimation results of key perception questions
that reflect lack of motivation to reform 295
Table A8.3.1. First-Stage Equation Results (IV Validity Check) for school-level sample – OLS estimates
307
Table A8.3.2. First-Stage Equation Results (IV Validity Check) for school-level sample – Random Effects estimates
308
Table A8.4.1. Pooled OLS Models of Mathematics test scores on competition measures and other variables
310
Table A8.4.2. Pooled OLS IV Models of Mathematics test scores on competition measures and other variables
311
Table A8.4.3. Random Effects Models of Mathematics test scores on competition measures and other variables
312
Table A8.4.4. Random Effects IV Models of Mathematics test scores on competition measures and other variables
313
Table A8.4.5. Fixed Effects Models of Mathematics test scores on competition measures and other variables
314
Table A8.4.6. Pooled OLS Models of First division pass rates on competition measures and other variables
315
Table A8.4.7. Pooled OLS IV Models of First division pass rates on competition measures and other variables
316
Table A8.4.8. Random Effects Models of First division pass rates on competition measures and other variables
317
Table A8.4.9. Random Effects IV Models of First division pass rates on competition measures and other variables
318
Table A8.4.10. Fixed Effects Models of First division pass rates on competition measures and other variables
319
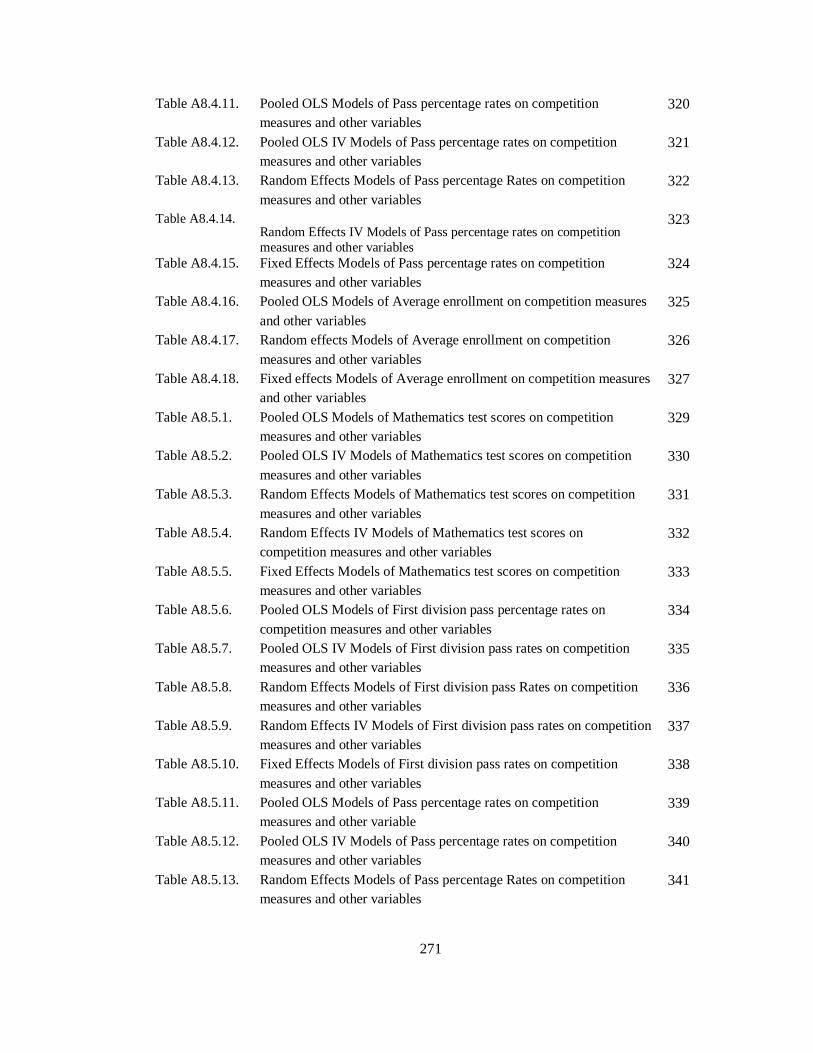
271
Table A8.4.11. Pooled OLS Models of Pass percentage rates on competition measures and other variables
320
Table A8.4.12. Pooled OLS IV Models of Pass percentage rates on competition measures and other variables
321
Table A8.4.13. Random Effects Models of Pass percentage Rates on competition measures and other variables
322
Table A8.4.14. Random Effects IV Models of Pass percentage rates on competition measures and other variables
323
Table A8.4.15. Fixed Effects Models of Pass percentage rates on competition measures and other variables
324
Table A8.4.16. Pooled OLS Models of Average enrollment on competition measures and other variables
325
Table A8.4.17. Random effects Models of Average enrollment on competition measures and other variables
326
Table A8.4.18. Fixed effects Models of Average enrollment on competition measures and other variables
327
Table A8.5.1. Pooled OLS Models of Mathematics test scores on competition measures and other variables
329
Table A8.5.2. Pooled OLS IV Models of Mathematics test scores on competition measures and other variables
330
Table A8.5.3. Random Effects Models of Mathematics test scores on competition measures and other variables
331
Table A8.5.4. Random Effects IV Models of Mathematics test scores on competition measures and other variables
332
Table A8.5.5. Fixed Effects Models of Mathematics test scores on competition measures and other variables
333
Table A8.5.6. Pooled OLS Models of First division pass percentage rates on competition measures and other variables
334
Table A8.5.7. Pooled OLS IV Models of First division pass rates on competition measures and other variables
335
Table A8.5.8. Random Effects Models of First division pass Rates on competition measures and other variables
336
Table A8.5.9. Random Effects IV Models of First division pass rates on competition measures and other variables
337
Table A8.5.10. Fixed Effects Models of First division pass rates on competition measures and other variables
338
Table A8.5.11. Pooled OLS Models of Pass percentage rates on competition measures and other variable
339
Table A8.5.12. Pooled OLS IV Models of Pass percentage rates on competition measures and other variables
340
Table A8.5.13. Random Effects Models of Pass percentage Rates on competition measures and other variables
341
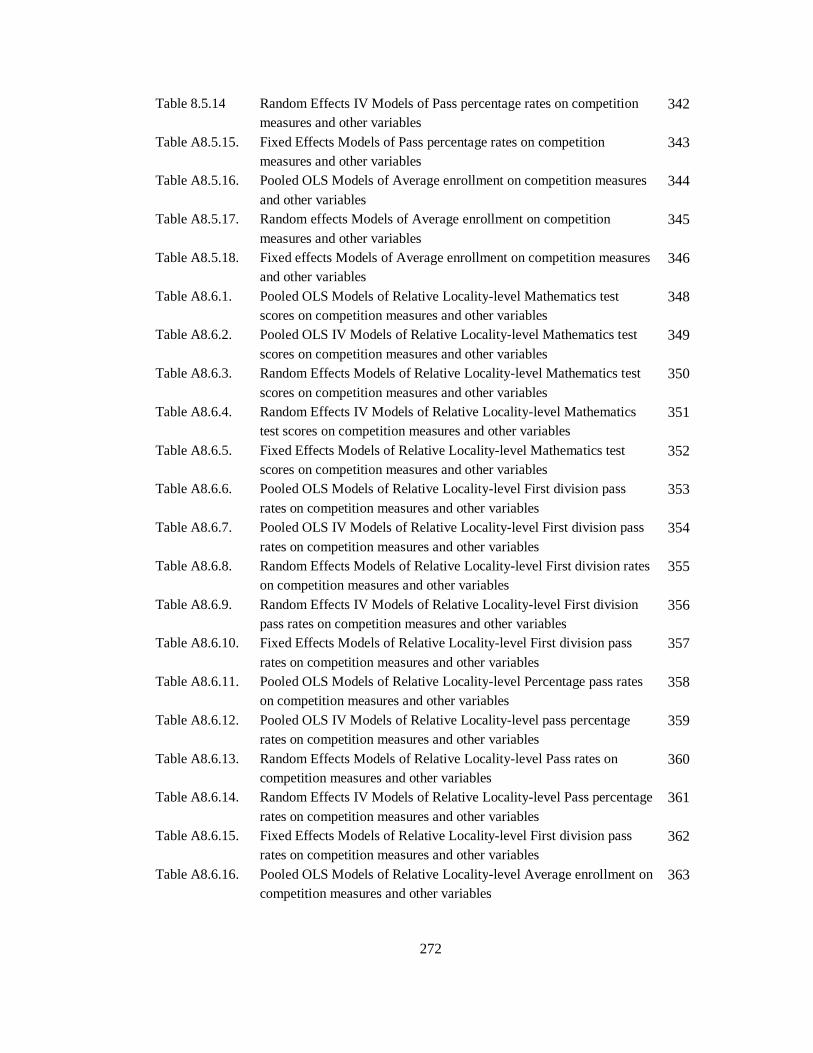
272
Table 8.5.14 Random Effects IV Models of Pass percentage rates on competition measures and other variables
342
Table A8.5.15. Fixed Effects Models of Pass percentage rates on competition measures and other variables
343
Table A8.5.16. Pooled OLS Models of Average enrollment on competition measures and other variables
344
Table A8.5.17. Random effects Models of Average enrollment on competition measures and other variables
345
Table A8.5.18. Fixed effects Models of Average enrollment on competition measures and other variables
346
Table A8.6.1. Pooled OLS Models of Relative Locality-level Mathematics test scores on competition measures and other variables
348
Table A8.6.2. Pooled OLS IV Models of Relative Locality-level Mathematics test scores on competition measures and other variables
349
Table A8.6.3. Random Effects Models of Relative Locality-level Mathematics test scores on competition measures and other variables
350
Table A8.6.4. Random Effects IV Models of Relative Locality-level Mathematics test scores on competition measures and other variables
351
Table A8.6.5. Fixed Effects Models of Relative Locality-level Mathematics test scores on competition measures and other variables
352
Table A8.6.6. Pooled OLS Models of Relative Locality-level First division pass rates on competition measures and other variables
353
Table A8.6.7. Pooled OLS IV Models of Relative Locality-level First division pass rates on competition measures and other variables
354
Table A8.6.8. Random Effects Models of Relative Locality-level First division rates on competition measures and other variables
355
Table A8.6.9. Random Effects IV Models of Relative Locality-level First division pass rates on competition measures and other variables
356
Table A8.6.10. Fixed Effects Models of Relative Locality-level First division pass rates on competition measures and other variables
357
Table A8.6.11. Pooled OLS Models of Relative Locality-level Percentage pass rates on competition measures and other variables
358
Table A8.6.12. Pooled OLS IV Models of Relative Locality-level pass percentage rates on competition measures and other variables
359
Table A8.6.13. Random Effects Models of Relative Locality-level Pass rates on competition measures and other variables
360
Table A8.6.14. Random Effects IV Models of Relative Locality-level Pass percentage rates on competition measures and other variables
361
Table A8.6.15. Fixed Effects Models of Relative Locality-level First division pass rates on competition measures and other variables
362
Table A8.6.16. Pooled OLS Models of Relative Locality-level Average enrollment on competition measures and other variables
363
273
Table A8.6.17. Random Effects Models of Relative Locality-level Average enrollment on competition measures and other variables
364
Table A8.6.18. Fixed effects Models of Locality-level Average enrollment on competition measures and other variables
365
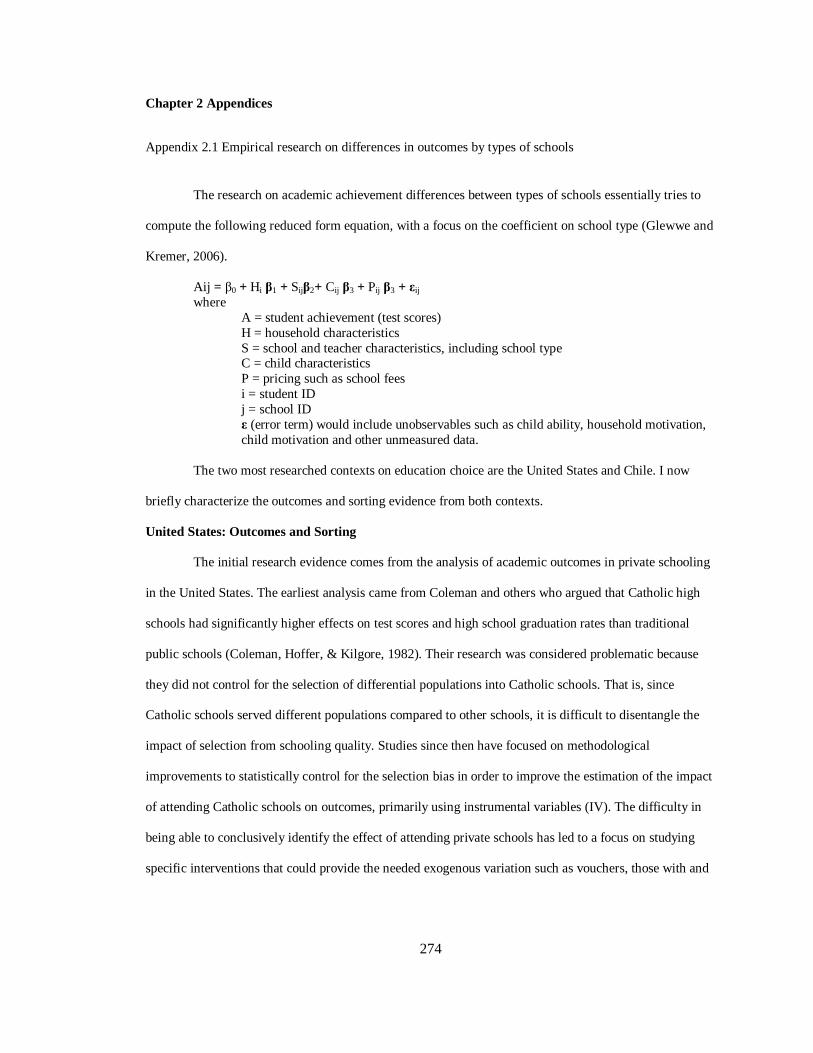
274
Chapter 2 Appendices
Appendix 2.1 Empirical research on differences in outcomes by types of schools
The research on academic achievement differences between types of schools essentially tries to
compute the following reduced form equation, with a focus on the coefficient on school type (Glewwe and
Kremer, 2006).
Aij = β0 + Hi β1 + Sijβ2+ Cij β3 + Pij β3 + εij
where A = student achievement (test scores) H = household characteristics S = school and teacher characteristics, including school type C = child characteristics P = pricing such as school fees i = student ID j = school ID ε (error term) would include unobservables such as child ability, household motivation, child motivation and other unmeasured data.
The two most researched contexts on education choice are the United States and Chile. I now
briefly characterize the outcomes and sorting evidence from both contexts.
United States: Outcomes and Sorting
The initial research evidence comes from the analysis of academic outcomes in private schooling
in the United States. The earliest analysis came from Coleman and others who argued that Catholic high
schools had significantly higher effects on test scores and high school graduation rates than traditional
public schools (Coleman, Hoffer, & Kilgore, 1982). Their research was considered problematic because
they did not control for the selection of differential populations into Catholic schools. That is, since
Catholic schools served different populations compared to other schools, it is difficult to disentangle the
impact of selection from schooling quality. Studies since then have focused on methodological
improvements to statistically control for the selection bias in order to improve the estimation of the impact
of attending Catholic schools on outcomes, primarily using instrumental variables (IV). The difficulty in
being able to conclusively identify the effect of attending private schools has led to a focus on studying
specific interventions that could provide the needed exogenous variation such as vouchers, those with and

275
without experimental design, and also a focus on using more detailed student-level and longitudinal
datasets.
The early voucher programs evidence is based on research from the publicly funded Milwaukee
and Cleveland programs (Witte, 2000; Greene, Peterson & Du, 1998; Zimmer & Bettinger, 2010). The
vast literature on private, voucher and charter literature have concluded that there are mixed to slightly
positive outcomes of education choice in the United States (McEwan, 2000; Miron, Evergreen and
Urschel, 2008). Most of the interventions in the United States have been capped by income eligibility
requirements by design. However, it was demonstrated in Milwaukee’s voucher program that students
were still being selected by ability characteristics, that is, highly motivated or disappointed parents were
the ones who were self-selecting to participate in the program (Chakrabarti, 2008). There has been some
recent evidence that may indicate that charter schools may be attracting middle income families who
would otherwise have gone to private schools (Michigan), and may also be increasing African-American
isolation (Texas) (Zimmer and Buddin, 2010).
Chile: Outcomes and Sorting
In the Chilean case, the main limitation for the empirical work is that the voucher program was
universalized when it was initiated, and therefore it is a nonexperimental intervention. The initial analysis
of private schools in Chile was focused on comparing private and public schools. These studies were
considered limited as they used school-level data, cross-sectional analysis and often could not adequately
correct for selection biases. McEwan (2001) was a significant leap in the literature since it provided a
nuanced utilization of newly available student-level data and data from parental questionnaires that had
been administered for the first time in 1997. Primarily, he attempted to disaggregate the private school
sample, which helped conceptualize the schooling options into more realistic multiple categories. The
empirical strategy was to first estimate a basic regression model without controlling for selectivity, and
then empirically create a selectivity correction based on a multinomial logit model. The analysis pointedly
concluded that conventional public schools were only conclusively less effective than non-voucher, elite
private schools, where the achievement was higher by around 0.5 SD on the mathematics and Spanish

276
tests. Other research (Elacqua, 2010) has built on the methodology to study the effectiveness of different
types of voucher schools.
As a result of the largely unregulated systematic voucher program, research in Chile has also
focused substantially on questions of sorting. Of the studies on systemic effects, Hsieh and Urquiola
(2003, 2006) was an influential study that found that communities that had higher increases in private
school enrollment growth also had lower public school test scores, higher gaps in test scores between elite
private and public schools, and higher SES gaps (income, education) between public and private school
parents. In the study, the authors use municipal level outcomes data for 150 communities from 1982 to
1996. They also utilize interesting variable constructions for studying sorting - they look at relative
outcomes (public school outcomes / all district outcomes) and find that 1 SD private enrollment growth is
associated with decline in relative test scores (0.5 to 0.67 SD) and an increase in relative repetition rates
(0.3 to 0.4 SD). The authors use difference-in-difference approaches, and a range of IVs (urbanization rate,
1982, population, 1982, and years of schooling among adults, 1982). Thus, their research appears to
suggest an overwhelmingly negative effect of competition on public schools through systematic sorting -
public schools lose out due to middle class shift which widen the gap between public and private school
test scores and family characteristics.
While Chile is an important case, it is important to note the limitations of the analysis for Chile’s
voucher program due the nonexperimental nature of the data. The empirical results from Chile’s analysis
can be highly sensitive to methodology. Bellei (2009) demonstrated these sensitivities by using different
definitions of SES and education and different ways of aggregating these variables in different models. For
instance, for different family education controls, Bellei’s model results ranged from favoring private
schools (0.27 SD) to favoring public schools (0.03 SD).
Developing Countries
Much of the outcomes based research on developing countries has studied outcomes using similar
empirical strategies, particularly in comparing public and private schools. For instance, Kingdon (1996,
p.59) notes that many such studies conducted in countries such as India, Tanzania, and Colombia have
consistently shown that private school students scored higher on tests than public school students.

277
Empirical studies that try to address the sample selection bias and the possibility of ability differences
between students in public and private schools such as Jimenez and others (1988, 1991, 1995) on Thailand,
Colombia, Tanzania, the Philippines and the Dominican Republic also arrive at the same conclusions:
private schools are more effective at increasing test scores even after controlling for student, family and
community characteristics (Sharma, 2012).
One of the more significant and positive voucher experiments is the Colombia voucher
experiment, which was evaluated for short and long-term effects (Angrist, Bettinger, Bloom, King &
Kremer, 2002; Angrist, Bettinger & Kremer, 2006). They find that the winners of the voucher lottery were
about 15% more likely to have attended private school, five percentage points less likely to have repeated
a grade, 10 percentage points more likely to have finished 8th grade, and also scored 0.2 SD higher on
achievement tests. These results have been used to highlight that it voucher impacts may be higher in less
developed countries. However, further inspection of the implementation process indicates some
implementation flaws that make these results suspect – for instance, response rates were quite low, and
only about 55% of the voucher winners and 53% of the voucher losers responded; randomness could have
been contaminated as the “win” rates of some schools were much higher, such as some schools where
100% of the applicants had won the voucher, which the authors attribute to political influence. Among the
programs’ other noted issues were that the voucher did not keep pace with tuition, although its potential
consequences for differential attrition were not discussed.
A few of the most recent quantitative studies (Bhatta, 2005; Sharma, 2012; Thapa, 2011) on
Nepal utilize a comprehensive school survey with student-level data conducted in 2004 (Ministry of
Education and Sports (MoES), 2005). All three studies investigate the public-private outcomes gap. These
studies find that even after controlling for school, family, student and community characteristics the
private-public gap remains. These findings hold for a variety of models, including various OLS and
propensity score matched specifications that attempt to control for selection biases.
A few recent studies from South Asia utilized nonexperimental methods, primarily propensity
score matching, to minimize the selection problem and compare similar groups of private and public
school students using large, representative cross-sectional data. Chudgar and Quin (2012) study rural and

278
urban India and find that low-fee private schools are not performing better than public schools. The
authors highlight the heterogeneity of the private sector with this study, and their argument is reminiscent
of McEwan (2001) and Elacqua(2010)’s attempts to disaggregate the private school sample in the Chilean
context. In contrast, Thapa (2012) finds that even after propensity score matching techniques, there is a
positive private school effect in the Nepal context.
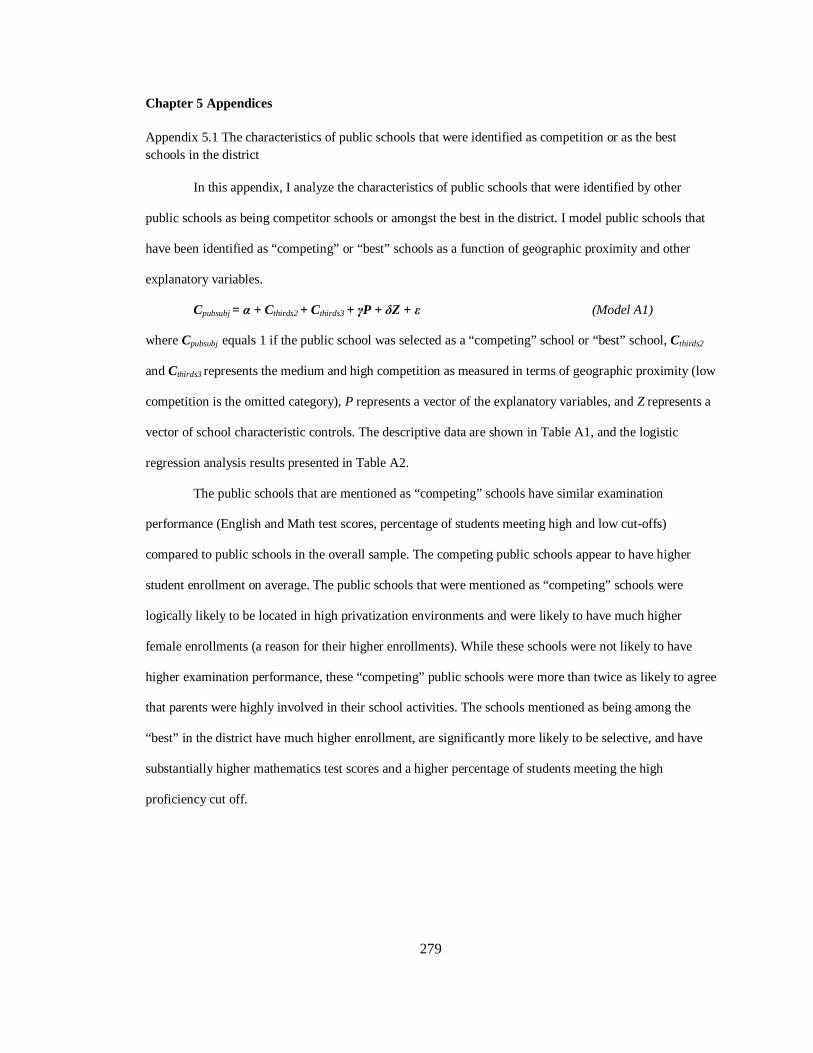
279
Chapter 5 Appendices
Appendix 5.1 The characteristics of public schools that were identified as competition or as the best schools in the district
In this appendix, I analyze the characteristics of public schools that were identified by other
public schools as being competitor schools or amongst the best in the district. I model public schools that
have been identified as “competing” or “best” schools as a function of geographic proximity and other
explanatory variables.
Cpubsubj = α + Cthirds2 + Cthirds3 + γP + δZ + ε (Model A1)
where Cpubsubj equals 1 if the public school was selected as a “competing” school or “best” school, Cthirds2
and Cthirds3 represents the medium and high competition as measured in terms of geographic proximity (low
competition is the omitted category), P represents a vector of the explanatory variables, and Z represents a
vector of school characteristic controls. The descriptive data are shown in Table A1, and the logistic
regression analysis results presented in Table A2.
The public schools that are mentioned as “competing” schools have similar examination
performance (English and Math test scores, percentage of students meeting high and low cut-offs)
compared to public schools in the overall sample. The competing public schools appear to have higher
student enrollment on average. The public schools that were mentioned as “competing” schools were
logically likely to be located in high privatization environments and were likely to have much higher
female enrollments (a reason for their higher enrollments). While these schools were not likely to have
higher examination performance, these “competing” public schools were more than twice as likely to agree
that parents were highly involved in their school activities. The schools mentioned as being among the
“best” in the district have much higher enrollment, are significantly more likely to be selective, and have
substantially higher mathematics test scores and a higher percentage of students meeting the high
proficiency cut off.

280
Table A5.1 A comparison of education characteristics between public schools in the sample and the schools they identify as competitors or the best schools in the district, 2011-12
Competing schools Best schools
Public school identified as competing
school by at least 1 other public school
Public school not chosen as a competing
school
Public school chosen as one of the best schools in the district by at least 1 other public school
Public school not chosen as among the
best schools
N 401 42
479 156
High-stakes outcomes • School-average English test
scores 34.8 32.7
47.7 31.8 • School-average Math test
scores 54.5 54.1
78.5 50.2 • Percentage of students who
secured passing grades (over 32%) 83.3 81.5
97.7 76.1
• Percentage of students who secured first division grades (over 60%) 40.4 35.0
89.1 30.6
Other characteristics
• Total fees in grade 1 (Nepali Rupees) 300 75
800 95
• Total student enrollment 606 363
1179 441
• Enrollment in grade 1 39 29
116 30
Source: Authors’ calculations based on the Combined Quantitative Dataset.
Notes: There were a total of 212 public schools in the sample. Since each school was asked to list up to three competing schools and three best schools, the same public schools could be mentioned more than once. Thus, the 401 competing school list is comprised of 170 separate schools; and the 479 best schools list is comprised of 56 separate schools.

281
Table A5.2 Logistic regression models of competing and best public schools on school and community characteristics
(Estimated odds ratios)
Dependent variable
Public school is mentioned as a
competing school by at least one other public
school
Public school is chosen as one of the best schools in the
district by at least one other public school
Variable name competing best
School examination performance
• Percentage of students who passed the high-stakes examination with a score over 60%, 2010-11 0.997 1.06***
Objective Competition
• Medium number of private secondary schools nearby 0.81 0.97
• High number of private secondary schools nearby 3.25** 0.98
Community level characteristics
• Female literacy rate, 6 years and older, 2001 1.16 1.33
• District dummy (proportion Kathmandu) 0.81 0.44
• Urban dummy (proportion urban) 0.58 1.49
Sorting characteristics
• Whether the school requires an entrance examination for grade 6 admission, 2011-12 0.69 3**
Principal perceptions (1 = agree or strongly agree to the following statements)
• Private schools are better than public schools in overall quality 0.49 .426*
• There is no need to compete with private schools since the competition is really with other public schools 0.44 0.28
• Our teachers who have more than 15 years of experience are excellent 1.26 1.68
• Parents are highly involved in school activities in our school 2.39** 0.90
Other school characteristics
• Total grade 1 to 10 enrollment, 2011-12 1.23** 1.85***
• Percentage female in grade 1 to 10 enrollment, 2011-12 1.59* 2***
• Class size in 6th grade, 2011-12 0.93 .739*
• Whether school has inadequate desks, 2009-10 .395** 0.62
• Whether the school has a computer room, 2011-12 2.17* 3.42***
N 443 635
R-squared 0.20 0.66 Source: Authors’ calculations based on the Combined Quantitative Dataset. Notes: *, **, and *** indicate significance at 10%, 5% and 1 % level respectively. Includes other school characteristics as controls.

282
Appendix 5.2 Some key regulations governing private schooling: requirements and provisions for private school establishment and functioning Process for Opening a Private School
To open a private school one has to apply the procedures and pre-requisites which are legally
based on The Education Act of the Government of Nepal. They have to apply at the related District
education officer (DEO) for approval. In case of pre-primary schools, the application must be produced at
the related DEO at least two months before the start of the education semester. In the case of primary,
lower secondary or high schools, schools that function from Grade 1 through Grade 10, the process has to
be initiated at least three months before the start of the education semester.
Once the application is received, the DEO will verify if the pre-requisites have been fulfilled.
Then, the DEO must approve it and provide the operating certificate 30 days ahead of the starting of the
education semester. The DEO has the authority to approve primary and lower secondary schools (schools
that function from Grade 1 through Grade 8). In case of high schools (those that function from Grade 9
onwards), the request will be forwarded by the District education committee, along with its
recommendation, to the Director of Education at the national level. Then, the Director of Education must
similarly provide the certificate 30 days before the start of the education semester. While providing this
approval, the DEO and the Director of Education will follow the instructions of the Ministry of education
regarding requisite school mapping and the allocable number of the schools.
Who can open a school
A single person can register a company. In the case of an educational guthi (private or public
trust), there must be at least five guthiyars (trustees) running the school.
They need to demonstrate that they have met the following criteria with official documentation.
(1) Demonstrate approval from their community and officials:
• No objection letters from two neighboring schools.
• Endorsement letter from the region’s village development committee or municipality.
• Recommendation from the school supervisor of the relevant region.
(2) Demonstrate adequate financing:

283
• They need to demonstrate that they have a permanent income source to manage the school.
• The schools must have security deposits of the following amounts - Rs.50,000 at the primary
level, Rs.150,000 for a lower secondary level school, and Rs.200,000 for a high school level
school. They must provide a copy of the deposit certificate from the commercial banks (Nepal
Bank, Rastria Banijya Bank or the Agricultural Development Bank) to the District Education
Office.
• If the school is to be operated in a rented house, they need to show that they have a 5-year house
lease contract.
(3) Provide other official documents relevant to school registration:
• The applicant will submit the necessary registration papers (Prabhanda patra and Niyamabali) if
it is registered as a company or as a guthi (trust) school.
• Citizen certificate and education certificates of the school owners.
(4) Other school specific documents:
• The details of their curriculum, text books and teacher teaching manuals
• The details of their fee structures
• Teacher related documents: teacher appointment letters, qualifications, certificates, citizenship
certificates, and teacher licenses
They need to follow these guidelines while operating the school.
On school infrastructure:
• The school must provide adequate furniture per class room.
• The class room size and rooms must be appropriately ventilated and protected from rain and
provide enough lighting
• The size of the school compound should allow all the students to be present at the same time.
• There must be a compound wall surrounding the school
• There should be provision of adequate drinking water supply, and provision of separate toilets for
girls and boys
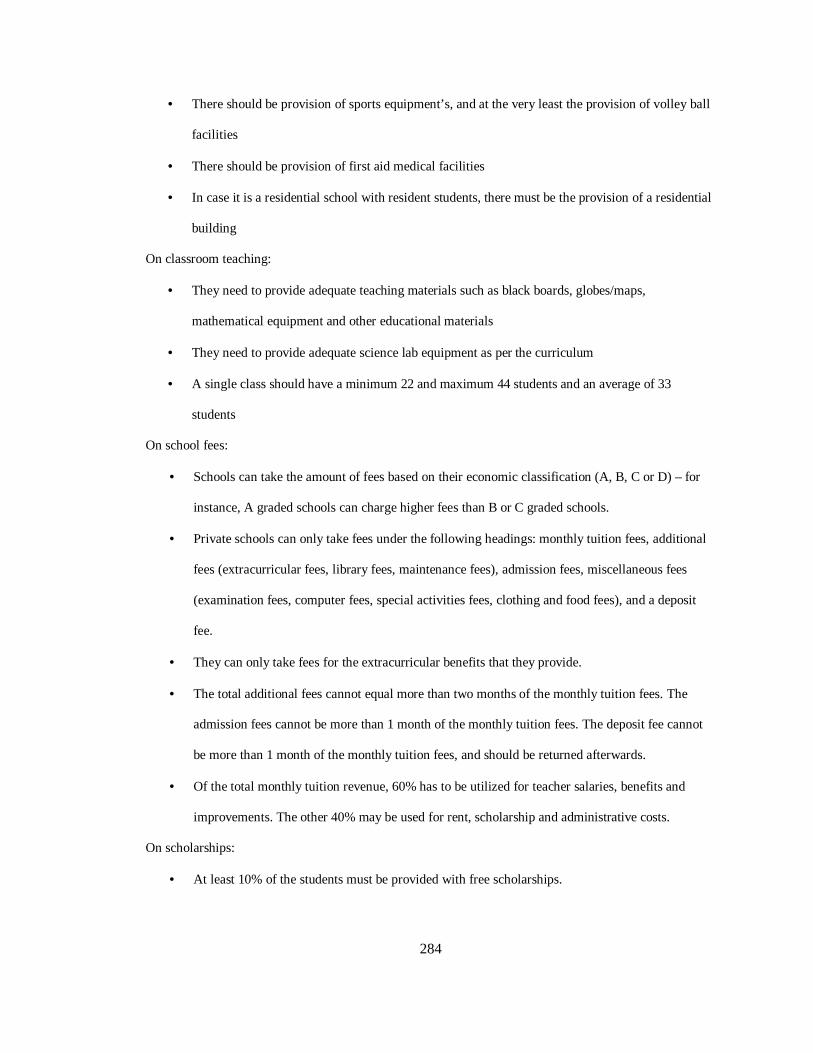
284
• There should be provision of sports equipment’s, and at the very least the provision of volley ball
facilities
• There should be provision of first aid medical facilities
• In case it is a residential school with resident students, there must be the provision of a residential
building
On classroom teaching:
• They need to provide adequate teaching materials such as black boards, globes/maps,
mathematical equipment and other educational materials
• They need to provide adequate science lab equipment as per the curriculum
• A single class should have a minimum 22 and maximum 44 students and an average of 33
students
On school fees:
• Schools can take the amount of fees based on their economic classification (A, B, C or D) – for
instance, A graded schools can charge higher fees than B or C graded schools.
• Private schools can only take fees under the following headings: monthly tuition fees, additional
fees (extracurricular fees, library fees, maintenance fees), admission fees, miscellaneous fees
(examination fees, computer fees, special activities fees, clothing and food fees), and a deposit
fee.
• They can only take fees for the extracurricular benefits that they provide.
• The total additional fees cannot equal more than two months of the monthly tuition fees. The
admission fees cannot be more than 1 month of the monthly tuition fees. The deposit fee cannot
be more than 1 month of the monthly tuition fees, and should be returned afterwards.
• Of the total monthly tuition revenue, 60% has to be utilized for teacher salaries, benefits and
improvements. The other 40% may be used for rent, scholarship and administrative costs.
On scholarships:
• At least 10% of the students must be provided with free scholarships.
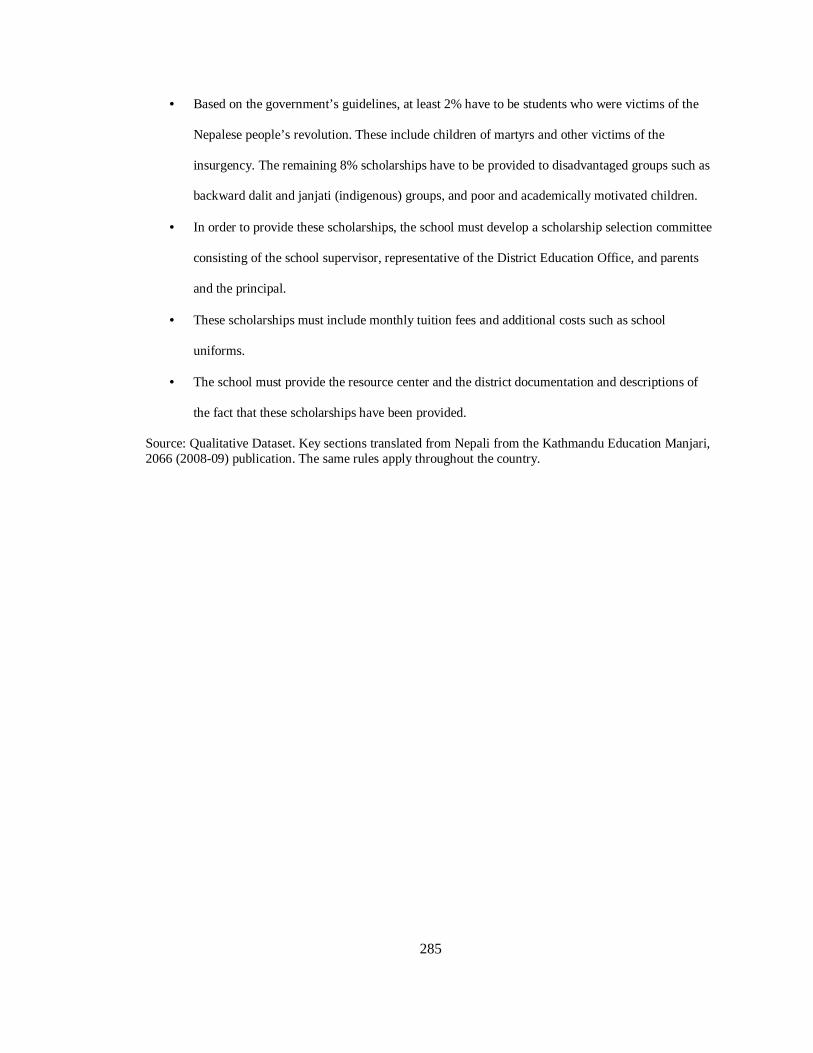
285
• Based on the government’s guidelines, at least 2% have to be students who were victims of the
Nepalese people’s revolution. These include children of martyrs and other victims of the
insurgency. The remaining 8% scholarships have to be provided to disadvantaged groups such as
backward dalit and janjati (indigenous) groups, and poor and academically motivated children.
• In order to provide these scholarships, the school must develop a scholarship selection committee
consisting of the school supervisor, representative of the District Education Office, and parents
and the principal.
• These scholarships must include monthly tuition fees and additional costs such as school
uniforms.
• The school must provide the resource center and the district documentation and descriptions of
the fact that these scholarships have been provided.
Source: Qualitative Dataset. Key sections translated from Nepali from the Kathmandu Education Manjari, 2066 (2008-09) publication. The same rules apply throughout the country.

286
Chapter 6 Appendices
Appendix 6.1 Causal Inference Limitations of the study
The study suffers from causal inference limitations since one cannot conclusively argue that
policy actions are caused by increases in private competition without accurate longitudinal data to trace the
evolution of competition and public school policy adoptions. The only government policy that could
conceivably have incentivized widespread public school responses was the per-child funding (PCF)
accountability mechanism, introduced in 2008, which now ties funding to enrollment. However, detailed
information on the implementation of the PCF mechanism was not available from district education
offices. Given that there were no clear policies that could be used to provide the exogenous variation
required to improve the causal inference of policy adoptions, the paper adopted a mixed methods strategy
to identify the policies that are more likely to be induced by competitive effects.
287
Appendix 6.2 Analysis of the other school policies
The appendix describes the school policies that are less likely to be viewed as responses to private
competition as these are school responses that are not regularly employed by private schools. Nevertheless,
one could argue that these policies could be effects of competition as they could be remedies that were
necessitated in some regions due to the enduring negative effects of long-term privatization. At any rates,
these efforts suggest that public schools are trying to improve from their disadvantaged starting point.
Community expertise and financing
Public schools appear to regularly utilize community experts to help guide their schools,
demonstrating that they have stronger roots in the community than the private schools. The growing
adoption of community financing in recent years, may signal an attempt to make up the shortfall from
government funds or an attempt to improve the schools from within. About 20% of the public schools
regularly conduct events to request community financing support.
Recruiting better teachers
Since teachers are highly important inputs in educational performance, principals were asked if
they had engaged in recruitment strategies to enhance their teacher pools. Interestingly, almost 30% of
Chitwan public schools appear to have recruited teachers, based on reputation, from other schools while
none of the sampled private schools attempted to do so. These findings may be attributed to the fact that
even temporary work as a teacher in public schools may be perceived a means to get into the public system
that may later provide pensions and benefits.
Take attendance twice a day to limit student absenteeism
Public schools may have high student absenteeism due to an inability to maintain a strict
disciplinary environment at the school. A more specific school strategy that is implemented in Nepal’s
schools to curb absenteeism is taking attendance twice a day so that students will not sneak out in the
afternoon. The double attendance strategy is rarely used in private schools, presumably because student
absenteeism is not a common private school problem. The strategy is much more prevalent in Chitwan
district than in Kathmandu district.
Parents monitoring student absenteeism
288
Engaging parents in monitoring student absenteeism is often considered a good non-instructional
activity that would help better engage the parents in schooling. The data indicate that about two-thirds of
public and private schools involve parents in monitoring student absenteeism.

289
Table A6.2.1. Descriptive statistics of other quality enhancing policies (By district and type of school)
All schools Chitwan schools Kathmandu schools
private public private public private public
Sample 1/ 625 1/ 212 87 1/ 67 538 1/ 145
Other quality enhancing policies Regularly request community expertise 0.43 0.71 0.26 0.73 0.45 0.70 Regularly request community financing support 0.00 0.21 0.00 0.27 0.00 0.18 Recruited teachers from other schools 0.13 0.20 0.09 0.28 0.14 0.16 Take attendance twice a day to limit student absenteeism 0.05 0.51 0.00 0.79 0.06 0.38 Parents involved in monitoring student absenteeism 0.65 0.67 0.66 0.69 0.65 0.66
Source: Authors’ calculations based on the Principal Survey.
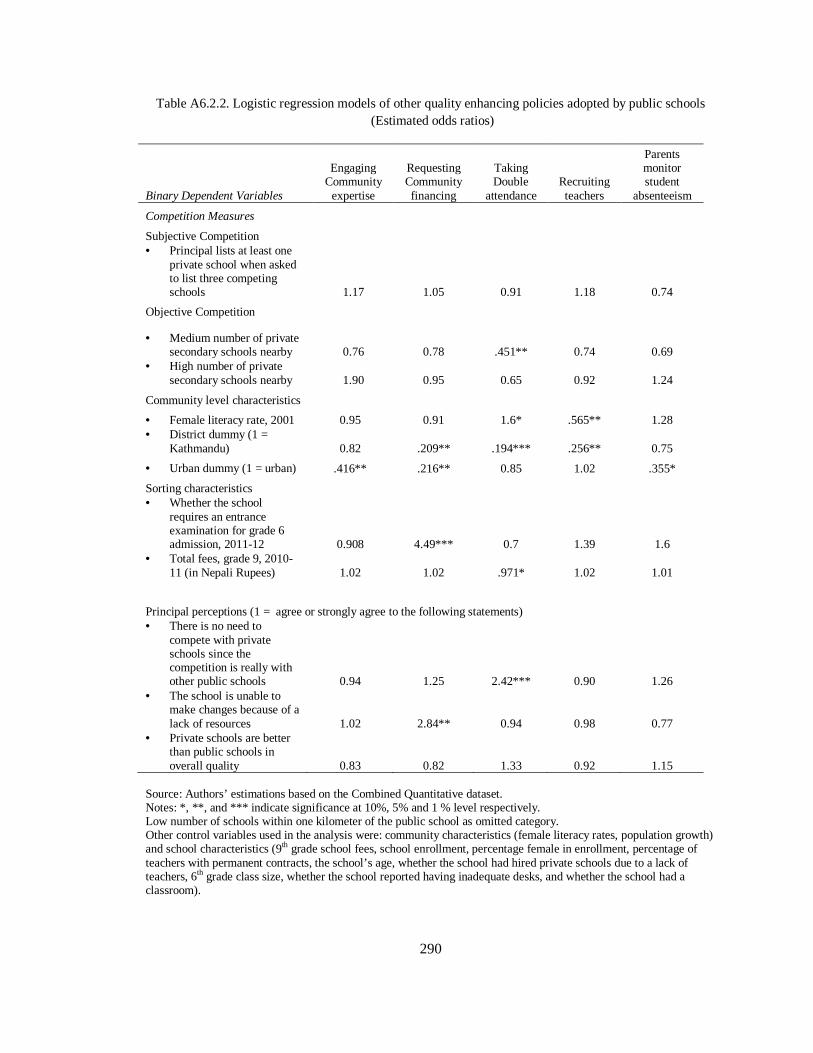
290
Table A6.2.2. Logistic regression models of other quality enhancing policies adopted by public schools (Estimated odds ratios)
Binary Dependent Variables
Engaging Community expertise
Requesting Community financing
Taking Double
attendance Recruiting teachers
Parents monitor student
absenteeism
Competition Measures
Subjective Competition • Principal lists at least one
private school when asked to list three competing schools 1.17 1.05 0.91 1.18 0.74
Objective Competition
• Medium number of private secondary schools nearby 0.76 0.78 .451** 0.74 0.69
• High number of private secondary schools nearby 1.90 0.95 0.65 0.92 1.24
Community level characteristics
• Female literacy rate, 2001 0.95 0.91 1.6* .565** 1.28 • District dummy (1 =
Kathmandu) 0.82 .209** .194*** .256** 0.75
• Urban dummy (1 = urban) .416** .216** 0.85 1.02 .355*
Sorting characteristics • Whether the school
requires an entrance examination for grade 6 admission, 2011-12 0.908 4.49*** 0.7 1.39 1.6
• Total fees, grade 9, 2010-11 (in Nepali Rupees) 1.02 1.02 .971* 1.02 1.01
Principal perceptions (1 = agree or strongly agree to the following statements) • There is no need to
compete with private schools since the competition is really with other public schools 0.94 1.25 2.42*** 0.90 1.26
• The school is unable to make changes because of a lack of resources 1.02 2.84** 0.94 0.98 0.77
• Private schools are better than public schools in overall quality 0.83 0.82 1.33 0.92 1.15
Source: Authors’ estimations based on the Combined Quantitative dataset. Notes: *, **, and *** indicate significance at 10%, 5% and 1 % level respectively. Low number of schools within one kilometer of the public school as omitted category. Other control variables used in the analysis were: community characteristics (female literacy rates, population growth) and school characteristics (9th grade school fees, school enrollment, percentage female in enrollment, percentage of teachers with permanent contracts, the school’s age, whether the school had hired private schools due to a lack of teachers, 6th grade class size, whether the school reported having inadequate desks, and whether the school had a classroom).

291
Appendix 6.3 The competitive response mechanism: follow the lead of the best public schools?
In this appendix, I shed light on policy actions of the best public schools. The argument for
analyzing the what the best public schools are doing is that the majority of normal public schools may be
looking to the best public schools for informal policy guidance. This mechanism is plausible since public
school principals are more likely to interact with each other in meetings regularly held by the district
education offices at the district headquarters or in their local resource centers. Also, it is more likely that
the best public schools in turn may be more aware of the best practices in private schools. The line of
argument would suggest that private schools may potentially have an indirect effect through the best public
schools on the majority of public schools.
I find that the best public schools are much more likely to be actively recruiting students by
advertising on television, developing promotional banners, and going door to door to recruit students than
other public schools. The best public schools were also much more likely to have adopted English medium
of education, require entrance examinations for admission, and regularly get community financing support.
These findings seem logical as the best public schools should be able to selectively take in students as they
may have more applicants than available seats. Similarly, public schools that are doing well are more
likely to have good community support. In addition, even the best public schools have felt the pressures of
private competition and are mirroring private schools by adopting English medium of instruction and
actively recruiting students.

292
Table A6.3.1. Descriptive statistics of policy adoptions of the best schools
Public school was mentioned as one of the best schools in the district by at least one other public school
All other public schools
Sample 479 156 1. Private-Mirroring (visible) strategies
English medium
• Adopted English medium of instruction 0.92 0.72
• Teach in English medium, at least three grades 0.60 0.25
• Recruited teachers for English medium 0.61 0.29
Computer education
• Provided computer education as a subject 0.45 0.41
• Teach computer classes for at least three grades 0.41 0.22
Students keep homework diary 0.49 0.23
Require ties and belts in school uniforms 0.77 0.67
2. Quasi-private instructional strategies
Control over teacher performance
• Provide monetary incentives to teachers 0.71 0.46
• Take disciplinary action for teacher absenteeism 0.17 0.21
SLC coaching classes for weaker students 0.55 0.44
Instructional time
• Add school time missed during strikes 0.55 0.36
• Add school time during strikes, three grades 0.53 0.22
• School partly operational during vacations 0.85 0.48
• Add school time during vacations, three grades 0.42 0.18
• Longer school days 0.72 0.52
• Longer school days, three grades 0.44 0.25
• Extra classes for weaker students 0.58 0.31
• Extra classes for weaker students, three grades 0.16 0.13
3. Quasi-private non-instructional strategies
Admission selectivity
• Take entrance examinations 0.95 0.63
• Require parent interview 0.55 0.42
• Require a special admission fee 0.66 0.38
Promotional efforts
• Advertisements on TV and in newspapers 0.31 0.19
• Developing banners or pamphlets 0.53 0.54
• Go door-to-door to recruit 0.52 0.72
4. Other quality enhancing policies
Regularly request community financing support 0.32 0.19
Take attendance twice a day to limit student absenteeism 0.34 0.52
Source: Authors’ calculations based on the Principal Survey.

293
Table A6.3.2. Logistic regression models of the policy adoption of the best schools (estimated odds ratios)
Binary Dependent Variables
Adopt English medium
Take entrance exams
Advertise on TV or in newspapers
Develop promotional banners
or pamphlets
Go door to door to recruit
Regularly request
community financing
Best School • School was mentioned as one
of the best schools in the district 2.84** 3.44** 6.15*** 3.82* 5.54** 5.25**
Objective Competition • Medium number of private
secondary schools nearby 0.93 0.69 0.96 1.36 2.55 0.44 • High number of private
secondary schools nearby .307** 1.37 1.81 2.60 1.20 1.04
Community level characteristics
• Female literacy rate, 2001 1.13 1.72** 1.07 .536* .45* 0.75 • District dummy (1 =
Kathmandu) .112*** 5.18*** .0192*** 0.41 .0454*
** .00378***
• Urban dummy (1 = urban) 0.65 0.70 3.26 2.53 1.13 .0528*** • Population growth (decadal),
2001 to 2011 1.03 1.10 0.94 1.15* 0.99 1.14***
Sorting characteristics • Whether the school requires an
entrance examination for grade 6 admission, 2011-12 3.5*** … 0.49 0.95 0.54 22.8***
• Total fees, grade 9, 2010-11 (in Nepali Rupees) 1.04* 1.02 1.01 1.00 .962* 1.03
• Percentage dalit (disadvantaged population) in enrollment, 2010-11 .931* 0.97 .921** 1.03
1.13*** 0.97
Principal perceptions (1 = agree or strongly agree to the following statements) • There is no need to compete
with private schools since the competition is really with other public schools .109*** 1.41 3.35 0.47 0.83 1.38
• The school is unable to make changes because of a lack of resources 2.46* 1.14 2.28 1.46 0.78 15.3***
• Private schools are better than public schools in overall quality 0.93 1.73 1.07 0.64 0.53 1.37
N 635 635 635 635 635 635
R-squared 0.41 0.41 0.59 0.43 0.75 0.64
Chi-squared 196 145 708 223 2029 292 Source: Authors’ estimations based on the Combined Quantitative dataset. Note: *, **, and *** indicate significance at 10%, 5% and 1 % level respectively.
294
Chapter 7 Appendices
Appendix A7.1 The perceptions of principals of selective schools, by extent of private competition
In the appendix, I try to disaggregate the perceptions of principals by school selectivity and the
extent of private competition they face. I conduct analyses of the perceptions questions with interaction
effects between the geographic proximity competition measure and school selectivity, and are of the
following form:
Pi = α + β1select + β2Cthirds2 + β3Cthirds3 + β4 select * C thirds2 + β5 select* C thirds3 + γP + δZ + ε (Model 3)
As shown in Table A1, the principals of public schools located in high competition regions but
are not selective are over three times as likely to agree that public schools have problems with politically
appointed teachers, government monitoring, and parents who do not understand the value of education,
compared to non-selective public schools that are located in low competition regions. Principals from
nonselective schools in high competition regions are also substantially more likely to agree that the
government does not do an adequate job monitoring their school’s activities, compared to principals of
nonselective schools in low competition regions. Selective schools in high competition regions are much
more likely than schools in low competition regions to highlight the lack of adequate or appropriate
teachers, compared to selective schools in low competition regions. Thus, while selective school principals
appear to be relatively satisfied with the existent teachers and parents, they recognize the lack of adequate
teachers as a barrier to reform.
The interaction effects analysis suggests that nonselective schools in high competition regions are
relatively much more dissatisfied with the external policy, bureaucratic and political environment, and
their ability to reform given these systemic problems.
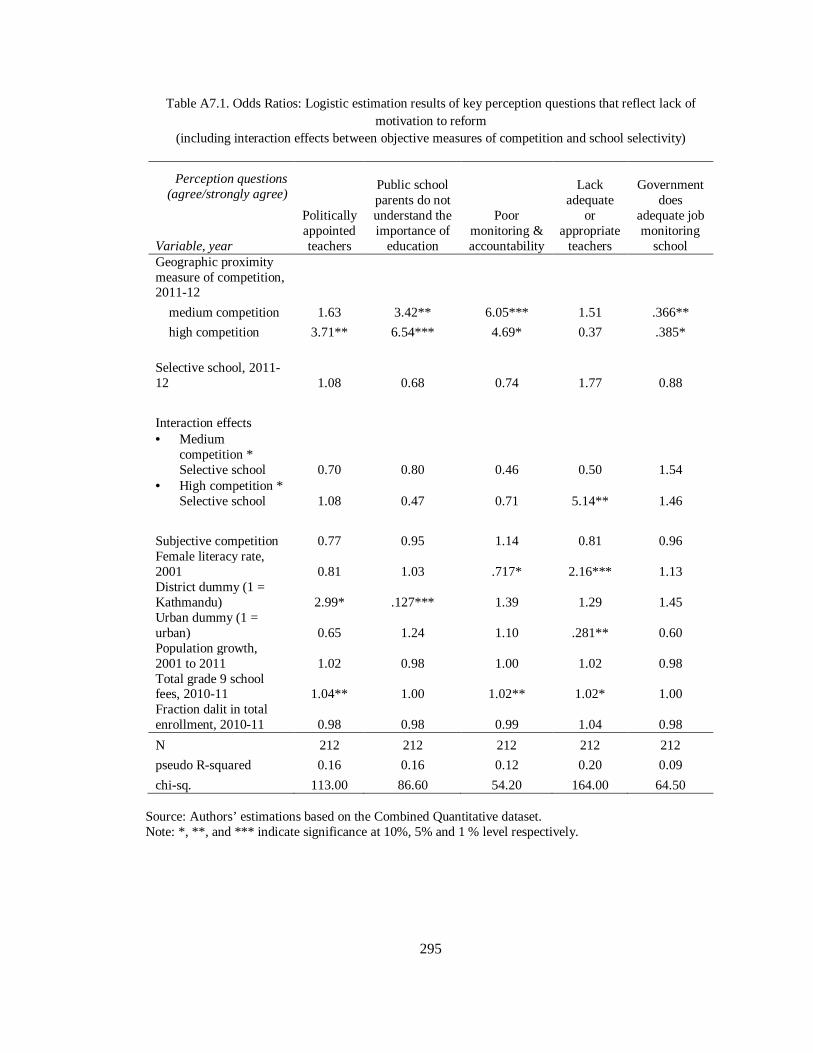
295
Table A7.1. Odds Ratios: Logistic estimation results of key perception questions that reflect lack of motivation to reform
(including interaction effects between objective measures of competition and school selectivity)
Perception questions (agree/strongly agree)
Politically appointed teachers
Public school parents do not understand the importance of
education
Poor monitoring & accountability
Lack
adequate or
appropriate teachers
Government
does adequate job monitoring
school Variable, year Geographic proximity measure of competition, 2011-12
medium competition 1.63 3.42** 6.05*** 1.51 .366**
high competition 3.71** 6.54*** 4.69* 0.37 .385*
Selective school, 2011-12 1.08 0.68 0.74 1.77 0.88
Interaction effects • Medium
competition * Selective school 0.70 0.80 0.46 0.50 1.54
• High competition * Selective school 1.08 0.47 0.71 5.14** 1.46
Subjective competition 0.77 0.95 1.14 0.81 0.96 Female literacy rate, 2001 0.81 1.03 .717* 2.16*** 1.13 District dummy (1 = Kathmandu) 2.99* .127*** 1.39 1.29 1.45 Urban dummy (1 = urban) 0.65 1.24 1.10 .281** 0.60 Population growth, 2001 to 2011 1.02 0.98 1.00 1.02 0.98 Total grade 9 school fees, 2010-11 1.04** 1.00 1.02** 1.02* 1.00 Fraction dalit in total enrollment, 2010-11 0.98 0.98 0.99 1.04 0.98
N 212 212 212 212 212
pseudo R-squared 0.16 0.16 0.12 0.20 0.09
chi-sq. 113.00 86.60 54.20 164.00 64.50 Source: Authors’ estimations based on the Combined Quantitative dataset. Note: *, **, and *** indicate significance at 10%, 5% and 1 % level respectively.

296
Chapter 8 Appendices
Appendix 8.1 Descriptive graphs of dependent variables, competition measures, and explanatory continuous variables
0.0
2.0
4.0
6
20 40 60 80 100 20 40 60 80 100 20 40 60 80 100 20 40 60 80 100
2007 2008 2009 2010
Histogram Kernel density Normal distribution
mat
Graphs by year
Dependent variable - mat0
.01
.02
.03
0 50 100 0 50 100 0 50 100 0 50 100
2007 2008 2009 2010
Histogram Kernel density Normal distribution
fpct
Graphs by year
Dependent variable - fpct
0.0
1.0
2.0
3.0
4
0 50 100 0 50 100 0 50 100 0 50 100
2007 2008 2009 2010
Histogram Kernel density Normal distribution
ppct
Graphs by year
Dependent variable - ppct
0.0
1.0
2
0 100 200 300 0 100 200 300 0 100 200 300 0 100 200 300
2007 2008 2009 2010
Histogram Kernel density Normal distribution
Graphs by year
Dependent variable - enr_t1

297
02
46
.4 .6 .8 1 1.2 .4 .6 .8 1 1.2 .4 .6 .8 1 1.2 .4 .6 .8 1 1.2
2007 2008 2009 2010
Histogram Kernel density Normal distribution
pubsvwmat
Graphs by year
Dependent variable - pubsvwmat
01
23
0 .5 1 1.5 0 .5 1 1.5 0 .5 1 1.5 0 .5 1 1.5
2007 2008 2009 2010
Histogram Kernel density Normal distribution
pubsvwfs
Graphs by year
Dependent variable - pubsvwfs
02
46
8
.4 .6 .8 1 1.2 .4 .6 .8 1 1.2 .4 .6 .8 1 1.2 .4 .6 .8 1 1.2
2007 2008 2009 2010
Histogram Kernel density Normal distribution
pubsvwps
Graphs by year
Dependent variable - pubsvwps
0.5
11.
52
0 .5 1 0 .5 1 0 .5 1 0 .5 1
2007 2008 2009 2010
Histogram Kernel density Normal distribution
pubsvwenr_t1
Graphs by year
Dependent variable - pubsvwenr_t1

298
0.0
05.0
1.0
15.0
2
0 50 100 0 50 100 0 50 100 0 50 100
2007 2008 2009 2010
Histogram Kernel density Normal distribution
psvw
Graphs by year
Competition measures - psvw
0.0
5.1
.15
.2
0 10 20 30 0 10 20 30 0 10 20 30 0 10 20 30
2007 2008 2009 2010
Histogram Kernel density Normal distribution
Graphs by year
Competition measures - cobj
0.0
2.0
4.0
6.0
8
20 40 60 80 20 40 60 80 20 40 60 80 20 40 60 80
2007 2008 2009 2010
Histogram Kernel density Normal distribution
flit
Graphs by year
Explanatory variables - flit
0.0
05.0
1.0
15.0
2
0 100 200 300 0 100 200 300 0 100 200 300 0 100 200 300
2007 2008 2009 2010
Histogram Kernel density Normal distribution
popgr
Graphs by year
Explanatory variables - popgr
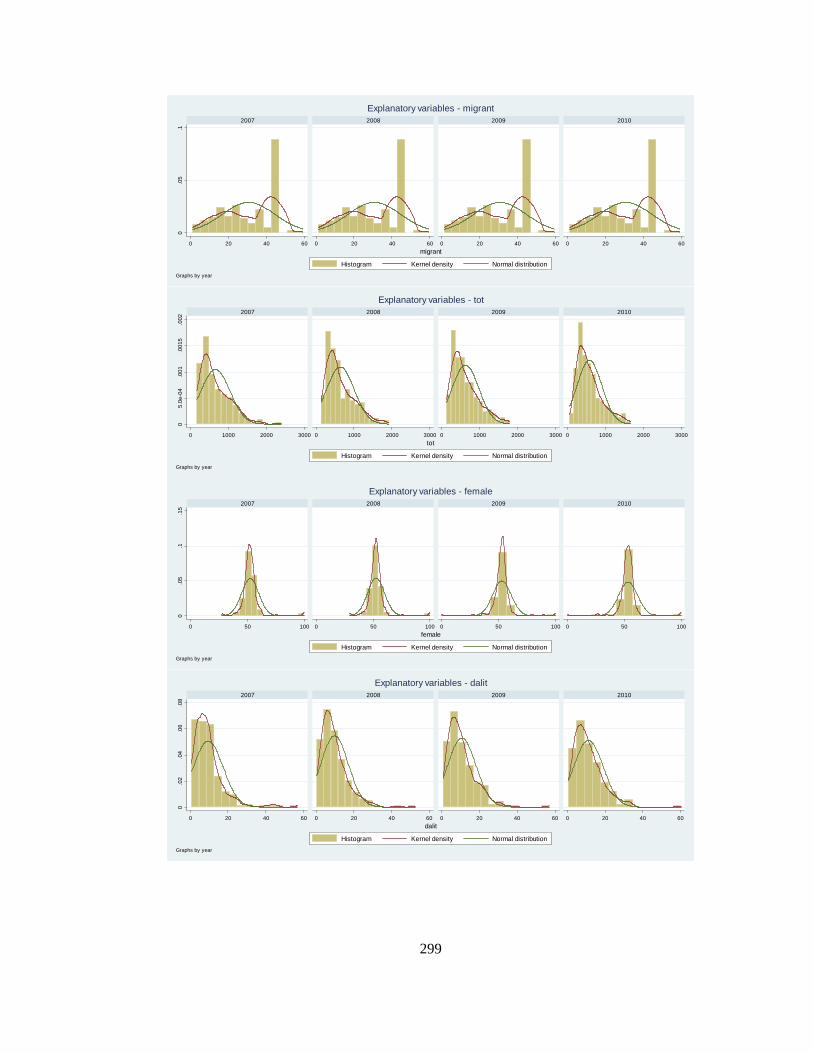
299
0.0
5.1
0 20 40 60 0 20 40 60 0 20 40 60 0 20 40 60
2007 2008 2009 2010
Histogram Kernel density Normal distribution
migrant
Graphs by year
Explanatory variables - migrant
05.
0e-0
4.0
01.0
015
.002
0 1000 2000 3000 0 1000 2000 3000 0 1000 2000 3000 0 1000 2000 3000
2007 2008 2009 2010
Histogram Kernel density Normal distribution
tot
Graphs by year
Explanatory variables - tot
0.0
5.1
.15
0 50 100 0 50 100 0 50 100 0 50 100
2007 2008 2009 2010
Histogram Kernel density Normal distribution
female
Graphs by year
Explanatory variables - female
0.0
2.0
4.0
6.0
8
0 20 40 60 0 20 40 60 0 20 40 60 0 20 40 60
2007 2008 2009 2010
Histogram Kernel density Normal distribution
dalit
Graphs by year
Explanatory variables - dalit

300
02.
0e-0
44.
0e-0
46.
0e-0
4
0 5000 10000 0 5000 10000 0 5000 10000 0 5000 10000
2007 2008 2009 2010
Histogram Kernel density Normal distribution
fees
Graphs by year
Explanatory variables - fees
0.0
1.0
2.0
3.0
4
0 50 100 150 0 50 100 150 0 50 100 150 0 50 100 150
2007 2008 2009 2010
Histogram Kernel density Normal distribution
schage
Graphs by year
Explanatory variables - schage
0.0
5.1
.15
0 20 40 60 0 20 40 60 0 20 40 60 0 20 40 60
2007 2008 2009 2010
Histogram Kernel density Normal distribution
prep
Graphs by year
Explanatory variables - prep
0.0
5.1
.15
0 50 100 0 50 100 0 50 100 0 50 100
2007 2008 2009 2010
Histogram Kernel density Normal distribution
new10
Graphs by year
Explanatory variables - new10
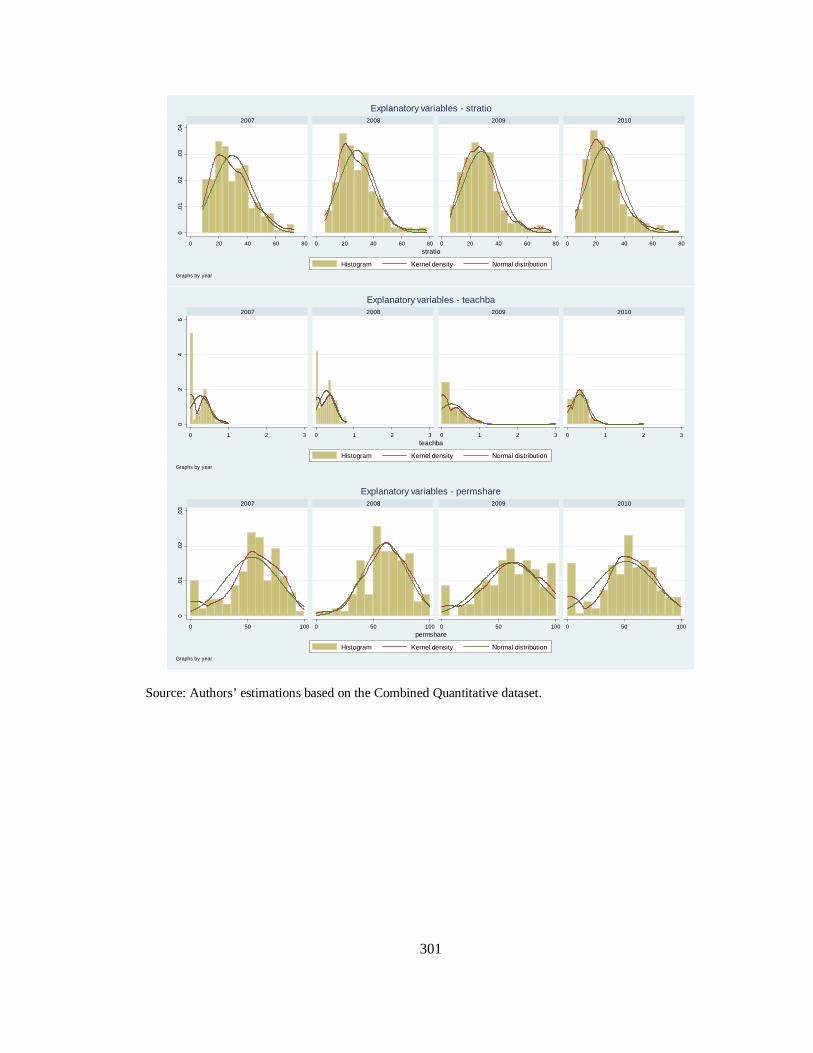
301
Source: Authors’ estimations based on the Combined Quantitative dataset.
0.0
1.0
2.0
3.0
4
0 20 40 60 80 0 20 40 60 80 0 20 40 60 80 0 20 40 60 80
2007 2008 2009 2010
Histogram Kernel density Normal distribution
stratio
Graphs by year
Explanatory variables - stratio
02
46
0 1 2 3 0 1 2 3 0 1 2 3 0 1 2 3
2007 2008 2009 2010
Histogram Kernel density Normal distribution
teachba
Graphs by year
Explanatory variables - teachba
0.0
1.0
2.0
3
0 50 100 0 50 100 0 50 100 0 50 100
2007 2008 2009 2010
Histogram Kernel density Normal distribution
permshare
Graphs by year
Explanatory variables - permshare

302
Appendix 8.2 Potential mechanisms via which policies could affect outcomes
The majority of the 30 interviewed public school principals, and many of the interviewed district
and national level officials, mentioned that they were concerned about poor high-school leaving test score
outcomes and declining enrollments in public schools. Many public school officials were concerned about
enrollment declines which have even led to the merger or collapse of several schools. The principals
suggested that in their schools they mainly faced a problem in primary level enrollment (Grade 1 through
5) and not secondary level enrollment (grade 6 through 10). These public secondary schools had
experienced dramatic declines in enrollment because of the large number of primary private schools.
However, they typically experienced an increase in enrollment going into the secondary level because of
the higher private school fee structure in secondary schooling and the existence of many schools that
existed through primary grades and fed into their secondary school.
There was almost unanimous agreement that they needed to implement certain policies, the
foremost being English medium of instruction, in order to survive in the present climate. Some of the
public school principals suggested that adding English medium of instruction, a key parental demand, had
already affected their enrollment while others mentioned that they were optimistic that these changes will
have an effect soon. Other public school principals suggested that it would be difficult to regain parental
trust without systemic interventions to support their school-level policy improvement efforts. Many
officials, especially in Chitwan, talked about the physical appearance differences between public and
private schools, and how public schools also needed to require students to wear these accessories. Thus,
English medium of instruction and adding ties and belts to school uniforms were considered quick “private
mirroring” interventions that would demonstrate school reform efforts and have quicker effects on
enrollment.
Public school officials also conceded that the school’s test score outcomes have a direct impact on
enrollment. However, they argue that improving test score outcomes is a long-term process, and requires
consistency in school efforts. Despite their acknowledgement that high-school examination outcomes is a
product of the cumulative efforts over the entire school cycle, the public school principals also argued that
private schools had better test scores because of results-oriented teaching. Many public schools talked

303
about how they had implemented coaching classes for the high-stakes examinations or had additional
classes for the key subjects (English, Mathematics and Science). Some of the principals also argued that
providing extra classes throughout the academic cycle and not just before the SLC examinations was a
must for overall improvements in quality.
304
Appendix 8.3 Instrument Variable Validity Check - First Stage Equation Results
The appendix details the specification related tests conducted to check for the instrument’s
validity and whether fixed or random effects are more appropriate for the models. I first assess whether
OLS or 2SLS modeling should be used. As shown in Tabel A8.3.1., The Wu-Hausman F test and the
Durbin-Wu-Hausman chi-sq test have p-values ranging from 0.0 to 0.08 for all competition measures
(psvw, cobj), indicating rejection of the consistency of the OLS and thus providing support for using the
2SLS over the OLS method. The ivendog option computes a test for endogeneity in a regression estimated
via instrumental variables (IV), the null hypothesis for which states that an ordinary least squares (OLS)
estimator of the same equation would yield consistent estimates: that is, any endogeneity among the
regressors would not have deleterious effects on OLS estimates. A rejection of the null indicates that
endogenous regressors' effects on the estimates are meaningful, and instrumental variables techniques are
required. The main problem here is that the “endog” option utilized for the same model with robust and
clustered standard errors leads statistically insignificant tests. This exercise suggests that the OLS model is
consistent over the 2SLS model for the analysis with clustered errors.
The first test of whether the instrument is a valid instrument is the coefficient and statistical
significance of the instrumental variable in the first-stage regression of the competition measures on the
instrumental variable and other explanatory and control variables. As shown in the tables below, the first
stage results of 2SLS equations of the various competition measures show that the coefficient on the
instrumental variable, the number of private schools in 1982, fluctuates from a value of 7.7 to 13.0 for the
private market share measure, and between 0.9 to 1.8 for the geographic proximity measure. The
coefficient is positive and significant at the 1% level for all of the competition measures used in the
analysis, and for all specifications (pooled OLS regressions and random effects regressions, and with or
without control variables).
In a situation where one is only trying to instrument for one endogenous variable, the most
important statistic is the F-statistic from the first-stage regression. The F stat (excluded instruments) is a
test of the excluded instruments in the first-stage regression of the instrumented variable on all the

305
exogenous variables. The F test is a test of whether the excluded IVs are significant (relevant). In all of
the models the calculated value of the F-stat is found to be significant at the 1% level, thus confirming the
power of the instrument used and suggesting that the number of private schools in 1982 is significant in
predicting the private market share that currently exists.
The weak identification tests that are conducted in this analysis are the Kleibergen-Paap rk Wald
F statistic / Cragg-Donald Wald F stat. This test, in combination with the Stock-Yogo critical values of
maximal IV size, can be used to further analyze whether the instrument is weak or not. Some authors
(Baum, Schaffer and Stillman, 2007) have suggested using these statistics in combination with critical
values by Stock and Yogo (2005) or the older rule of thumb, which indicates that the F-stat needs to be at
least 10 for weak identification not to be considered a problem. The pooled OLS and random effects
models’ first-stage regressions produce F-statistics that are much larger than 10. Thus, these tests further
confirm that the instrument is not a weak predictor of the competition measure.
The Kleibergen–Paap underidentification LM and Wald tests – weakly rejects the null hypotheses
that the instruments are inadequate to identify the equation. The weak-instrument-robust inference test
aims to note the effect of the variable in the main two-stage equation. The Anderson and Rubin (1949)
tests the significance of the endogenous regressors in the structural equation being estimated. This is
accomplished by simply substituting the reduced-form equation for the endogenous regressors in the main
model. The null hypothesis tested is that the coefficients β1 of the endogenous regressors X1 in the
structural equation are jointly equal to zero. In these results, the Anderson–Rubin Wald test and Stock–
Wright LM test do not reject their null hypothesis and indicate that the endogenous regressors are not
relevant in the main regression.
The endogeneity test results - for private market share and the objective competition measure, the
test cannot reject the hypothesis that the variable is exogenous. I use the Sargan-Hansen Chi-sq statistic to
assess whether fixed or random effects are preferable for the analysis. I find that the null hypothesis is
rejected, and thus the fixed effects are considered preferable to random effects.
While analyzing the different outcome measures, the equation with enrollment in first grade as an
outcome measure does not seem to support the idea that the competition measure is endogenous in the

306
equation, and thus in need of 2SLS method over OLS. This finding may seem logical because enrollment
may be determined by a lot of other factors including competition, while test scores may have a stronger
relationship with sorting effects of competition. As a result, I do not instrument for the enrollment
measures.

307
Table A8.3.1. First-Stage Equation Results (IV Validity Check) for school-level sample – OLS estimates
competition measure Private market share Geographic proximity
with controls? N Y Y N Y Y
robust and clustering? Y Y N Y Y N
OLS versus 2SLS?
Endogeneity test of endogenous regressors (endog) Chi-sq(1)
0.24 3.52 0.26 3.12
P-val 0.63 0.06 0.61 0.08
Test of endogeneity (ivendog)
Wu-Hausman F test 3.42 3.04
p-val 0.06 0.08
Durbin-Wu-Hausman chi-sq test 3.52 3.12
p-val 0.06 0.08
Test of excluded instruments
F-stat (Angrist-Pischke) 99.31 72.65 85.00 273.77 52.30 52.96
Prob > F 0.00 0.00 0.00 0.00 0.00 0.00
Instrument Validity - First-stage regression results
F-stat 99.45 63.73 51.17 273.77 141.35 37.76
instrument variable coefficient 12.95 7.12 7.12 1.84 0.89 0.89
t-stat 9.97 8.52 9.22 16.55 7.23 7.28
P>|t| 0.00 0.00 0.00 0.00 0.00 0.00
Underidentification test
Kleibergen-Paap rk LM statistic:
Chi-sq(1) 2.15 2.32 1.89 2.48 62.27
P-val 0.14 0.13 0.17 0.12 0.00
Anderson canon. LM statistic 79.32
p-val 0.00
Weak identification test60
Cragg-Donald Wald F stat 363.85 85.00 85.00 343.83 52.96 52.96
Kleibergen-Paap rk Wald F statistic 99.45 72.65 273.77 52.30
Weak-instrument-robust inference (Mathematics score)
Anderson-Rubin Wald test F stat 9.26 0.38 2.42 9.26 0.38 2.42
p-val 0.00 0.54 0.12 0.00 0.54 0.12
Anderson-Rubin Wald test chi-sq 9.38 0.40 2.49 9.38 0.40 2.49
p-val 0.00 0.53 0.11 0.00 0.53 0.11
Stock-Wright LM S statistic 0.94 0.20 2.49 0.94 0.20 2.49
p-val 0.33 0.65 0.11 0.33 0.65 0.11
Source: Authors’ estimations based on the Combined Quantitative dataset.
60 Stock-Yogo ID test for weak identification: 10% maximal IV size = 16.38; 15% maximal IV size = 8.96; 20% maximal IV size = 6.66; 25% maximal IV size = 5.53.
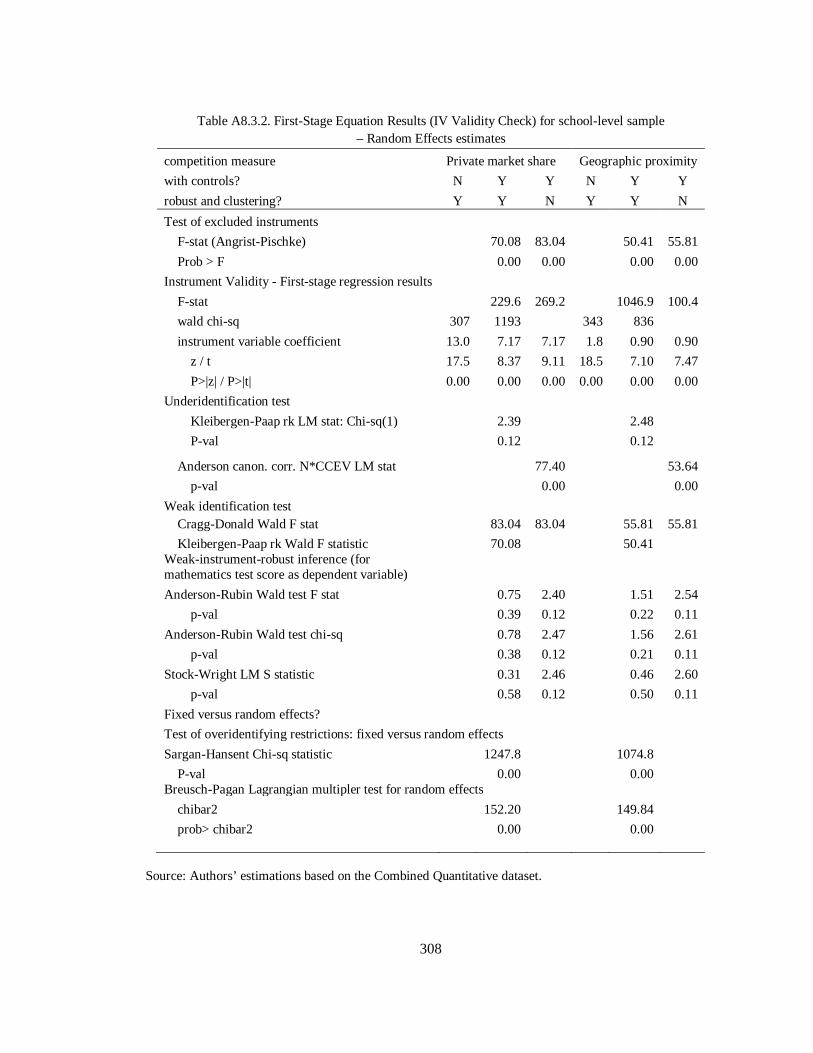
308
Table A8.3.2. First-Stage Equation Results (IV Validity Check) for school-level sample
– Random Effects estimates
competition measure Private market share Geographic proximity
with controls? N Y Y N Y Y
robust and clustering? Y Y N Y Y N
Test of excluded instruments
F-stat (Angrist-Pischke) 70.08 83.04 50.41 55.81
Prob > F 0.00 0.00 0.00 0.00
Instrument Validity - First-stage regression results
F-stat 229.6 269.2 1046.9 100.4
wald chi-sq 307 1193 343 836
instrument variable coefficient 13.0 7.17 7.17 1.8 0.90 0.90
z / t 17.5 8.37 9.11 18.5 7.10 7.47
P>|z| / P>|t| 0.00 0.00 0.00 0.00 0.00 0.00
Underidentification test
Kleibergen-Paap rk LM stat: Chi-sq(1) 2.39 2.48
P-val 0.12 0.12
Anderson canon. corr. N*CCEV LM stat 77.40 53.64
p-val 0.00 0.00
Weak identification test Cragg-Donald Wald F stat 83.04 83.04 55.81 55.81
Kleibergen-Paap rk Wald F statistic 70.08 50.41 Weak-instrument-robust inference (for mathematics test score as dependent variable)
Anderson-Rubin Wald test F stat 0.75 2.40 1.51 2.54
p-val 0.39 0.12 0.22 0.11
Anderson-Rubin Wald test chi-sq 0.78 2.47 1.56 2.61
p-val 0.38 0.12 0.21 0.11
Stock-Wright LM S statistic 0.31 2.46 0.46 2.60
p-val 0.58 0.12 0.50 0.11
Fixed versus random effects?
Test of overidentifying restrictions: fixed versus random effects
Sargan-Hansent Chi-sq statistic 1247.8 1074.8
P-val 0.00 0.00 Breusch-Pagan Lagrangian multipler test for random effects
chibar2 152.20 149.84
prob> chibar2 0.00 0.00
Source: Authors’ estimations based on the Combined Quantitative dataset.

309
Appendix 8.4 Detailed estimation tables of models of school-level outcome measures, competition measures, and other variables
This Appendix presents the detailed estimation results for all the models that were run to produce the summary table 8.6. The estimations in this appendix are based on the Combined Quantitative Dataset – School-level sample.
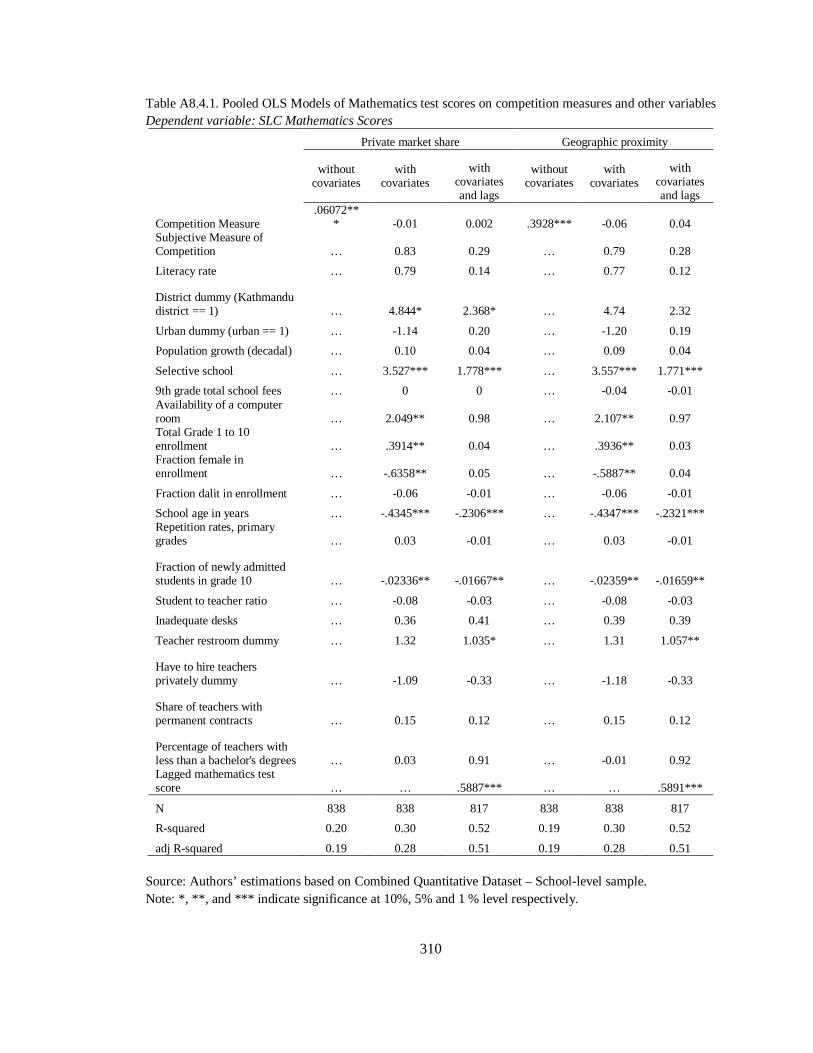
310
Table A8.4.1. Pooled OLS Models of Mathematics test scores on competition measures and other variables Dependent variable: SLC Mathematics Scores
Private market share Geographic proximity
without covariates
with covariates
with covariates and lags
without covariates
with covariates
with covariates and lags
Competition Measure .06072**
* -0.01 0.002 .3928*** -0.06 0.04 Subjective Measure of Competition … 0.83 0.29 … 0.79 0.28
Literacy rate … 0.79 0.14 … 0.77 0.12
District dummy (Kathmandu district == 1) … 4.844* 2.368* … 4.74 2.32
Urban dummy (urban == 1) … -1.14 0.20 … -1.20 0.19
Population growth (decadal) … 0.10 0.04 … 0.09 0.04
Selective school … 3.527*** 1.778*** … 3.557*** 1.771***
9th grade total school fees … 0 0 … -0.04 -0.01 Availability of a computer room … 2.049** 0.98 … 2.107** 0.97 Total Grade 1 to 10 enrollment … .3914** 0.04 … .3936** 0.03 Fraction female in enrollment … -.6358** 0.05 … -.5887** 0.04
Fraction dalit in enrollment … -0.06 -0.01 … -0.06 -0.01
School age in years … -.4345*** -.2306*** … -.4347*** -.2321*** Repetition rates, primary grades … 0.03 -0.01 … 0.03 -0.01
Fraction of newly admitted students in grade 10 … -.02336** -.01667** … -.02359** -.01659**
Student to teacher ratio … -0.08 -0.03 … -0.08 -0.03
Inadequate desks … 0.36 0.41 … 0.39 0.39
Teacher restroom dummy … 1.32 1.035* … 1.31 1.057**
Have to hire teachers privately dummy … -1.09 -0.33 … -1.18 -0.33
Share of teachers with permanent contracts … 0.15 0.12 … 0.15 0.12
Percentage of teachers with less than a bachelor's degrees … 0.03 0.91 … -0.01 0.92 Lagged mathematics test score … … .5887*** … … .5891***
N 838 838 817 838 838 817
R-squared 0.20 0.30 0.52 0.19 0.30 0.52
adj R-squared 0.19 0.28 0.51 0.19 0.28 0.51 Source: Authors’ estimations based on Combined Quantitative Dataset – School-level sample. Note: *, **, and *** indicate significance at 10%, 5% and 1 % level respectively.

311
Table A8.4.2. Pooled OLS IV Models of Mathematics test scores on competition measures and other variables
Dependent variable: SLC Mathematics Scores
Private market share Geographic proximity
without controls
with controls
with controls and
lagged dependent variable
without controls
with controls
with controls and
lagged dependent variable
Competition Measure .1187*** 0.09 0.031 .8197*** 0.75 0.25
Subjective Measure of Competition … 0.17 0.112 … 0.30 0.15
Literacy rate … 0.18 -0.026 … -0.03 -0.10 District dummy (Kathmandu district == 1) … 2.77 1.786 … 2.65 1.73
Urban dummy (urban == 1) … -2.00 -0.021 … -1.90 0.00
Population growth (decadal) … -0.05 0.002 … 0.03 0.03
Selective school … 3.704*** 1.824*** … 3.456** 1.744***
9th grade total school fees … -0.05 -0.008 … -0.05 -0.01
Availability of a computer room … 2.59 1.124 … 2.221** 1.01
Total Grade 1 to 10 enrollment … 0 0 … 0.05 -0.07
Fraction female in enrollment … -0.36 0.130 … -.759* -0.01
Fraction dalit in enrollment … -0.08 -0.016 … -0.06 -0.01
School age in years … -.4758*** -.2406*** … -.5003*** -.246***
Repetition rates, primary grades … 0.02 -0.008 … 0.02 -0.01
Fraction of newly admitted students in grade 10 … -.02494** -.01721** … -.02306** -.01639**
Student to teacher ratio … -0.08 -0.028 … -0.08 -0.03
Inadequate desks … 0.30 0.396 … -0.15 0.24
Teacher restroom dummy … 1.64 1.12** … 1.96 1.227*
Have to hire teachers privately dummy … -2.00 -0.573 … -1.51 -0.42
Share of teachers with permanent contracts … 0.11 0.107 … 0.16 0.12
Percentage of teachers with less than a bachelor's degrees … -0.18 0.842 … 0.14 0.97
Lagged mathematics test score … … .591*** … … .592***
N 838 838 817 838 838 817
R-squared 0.18 0.27 0.52 0.17 0.26 0.52
adj R-squared 0.17 0.25 0.51 0.17 0.24 0.51
Source: Authors’ estimations based on Combined Quantitative Dataset – School-level sample. Note: *, **, and *** indicate significance at 10%, 5% and 1 % level respectively.

312
Table A8.4.3. Random Effects Models of Mathematics test scores on competition measures and other variables
Dependent variable: SLC Mathematics Scores Private market share Geographic proximity
without controls
with controls
with controls &
lagged dependent variable
without controls
with controls
with controls &
lagged dependent variable
Competition Measure .05273** -0.02 0.00 .3851*** -0.03 0.04 Subjective Measure of Competition … 0.99 0.29 … 0.87 0.28
Literacy rate … 0.66 0.14 … 0.56 0.12 District dummy (Kathmandu district == 1) … 4.72* 2.368* … 4.43 2.317* Urban dummy (urban == 1) … -1.25 0.20 … -1.41 0.19 Population growth (decadal) … 0.11 0.04 … 0.09 0.04 Selective school … 3.422*** 1.778*** … 3.446*** 1.771*** 9th grade total school fees … 0 0 … 0.03 -0.01 Availability of a computer room … 0.60 0.98 … 0.64 0.97 Total Grade 1 to 10 enrollment … 0.20 0.04 … 0.18 0.03 Fraction female in enrollment … -0.60 0.05 … -0.56 0.04 Fraction ` in enrollment … -0.06 -0.01 … -0.06 -0.01
School age in years … -.3834*** -.2306*** … -.3899*** -.2321*** Repetition rates, primary grades … 0.02 -0.01 … 0.02 -0.01
Fraction of newly admitted students in grade 10 … -0.01 -.01667** … -0.01 -.01659** Student to teacher ratio … -0.02 -0.03 … -0.02 -0.03
Inadequate desks … 0.16 0.41 … 0.16 0.39
Teacher restroom dummy … 1.57 1.035* … 1.61 1.057** Teacher privately hired dummy … -1.29 -0.33 … -1.48 -0.33
Share of teachers with permanent contracts … .224** 0.12 … .219** 0.12
Percentage of teachers with less than a bachelor's degrees … 0.21 0.91 … 0.20 0.92 Lagged mathematics test score … … .5887*** … … .5891***
N 838 838 817 838 838 817 R-squared (within) 0.41 0.42 0.22 0.41 0.42 0.22
R-squared (overall) 0.20 0.29 0.52 0.19 0.29 0.52 R-squared (between) 0.03 0.18 0.87 0.03 0.18 0.87 Source: Authors’ estimations based on Combined Quantitative Dataset – School-level sample. Note: *, **, and *** indicate significance at 10%, 5% and 1 % level respectively.

313
Table A8.4.4. Random Effects IV Models of Mathematics test scores on competition measures and other variables
Dependent variable: SLC Mathematics Scores Private market share Geographic proximity
without controls
with controls
with controls
and lagged dependent variable
without controls
with controls
with controls
and lagged dependent variable
Competition Measure .1177*** 0.09 0.03 .8121** 0.64 0.25 Subjective Measure of Competition … 0.24 0.11 … 0.44 0.12
Literacy rate … 0.16 -0.03 … -0.17 -0.15 District dummy (Kathmandu district == 1) … 3.08 1.79 … 2.76 1.57 Urban dummy (urban == 1) … -2.03 -0.02 … -1.97 -0.03 Population growth (decadal) … -0.05 0.00 … 0.04 0.03 Selective school … 3.624*** 1.824*** … 3.376*** 1.763** 9th grade total school fees … 0 0 … 0.04 -0.01 Availability of a computer room … 1.993** 1.12 … 0.62 1.04 Total Grade 1 to 10 enrollment … 0.16 -0.02 … -0.04 -0.05 Fraction female in enrollment … -0.37 0.13 … -0.71 -0.01 Fraction dalit in enrollment … -0.07 -0.02 … -0.06 -0.01 School age in years … -.4679*** -.2406** … -.4395* -.2484** Repetition rates, primary grades … 0.02 -0.01 … 0.00 -0.02
Fraction of newly admitted students in grade 10 … -0.02 -0.02 … -0.01 -0.01 Student to teacher ratio … -0.05 -0.03 … -0.02 -0.04 Inadequate desks … 0.23 0.40 … 0.02 0.41 Teacher restroom dummy … 1.702* 1.12 … 2.18 1.21 Teacher privately hired dummy … -2.061* -0.57 … -1.85 -0.42
Share of teachers with permanent contracts … 0.15 0.11 … .2607** 0.15
Percentage of teachers with less than a bachelor's degrees … -0.06 0.84 … 0.46 1.26 Lagged mathematics test score … … .591*** … … .5904***
N 838 838 817 838 838 817
R-squared (within) 0.41 0.40 0.22 0.41 0.42 0.22 R-squared (overall) 0.18 0.27 0.52 0.18 0.26 0.52 R-squared (between) 0.03 0.17 0.86 0.03 0.14 0.86
Source: Authors’ estimations based on Combined Quantitative Dataset – School-level sample. Note: *, **, and *** indicate significance at 10%, 5% and 1 % level respectively.
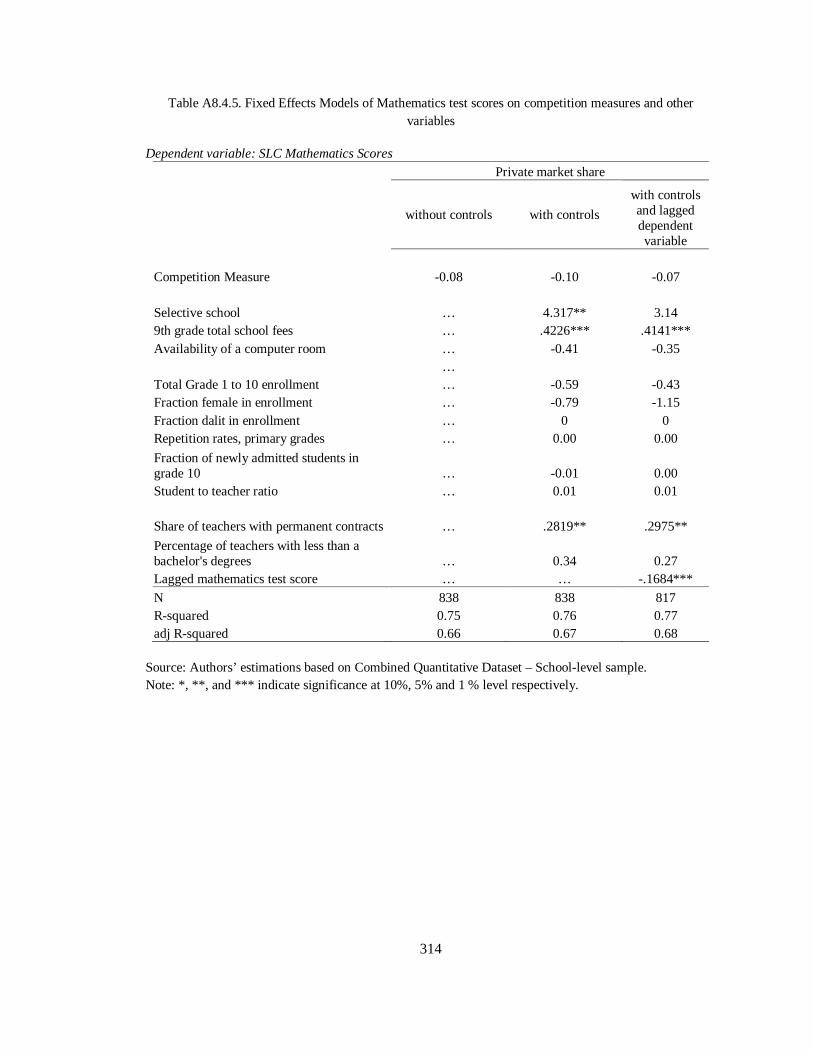
314
Table A8.4.5. Fixed Effects Models of Mathematics test scores on competition measures and other variables
Dependent variable: SLC Mathematics Scores
Private market share
without controls with controls
with controls and lagged dependent variable
Competition Measure -0.08 -0.10 -0.07 Selective school … 4.317** 3.14 9th grade total school fees … .4226*** .4141*** Availability of a computer room … -0.41 -0.35 … Total Grade 1 to 10 enrollment … -0.59 -0.43 Fraction female in enrollment … -0.79 -1.15 Fraction dalit in enrollment … 0 0 Repetition rates, primary grades … 0.00 0.00
Fraction of newly admitted students in grade 10 … -0.01 0.00 Student to teacher ratio … 0.01 0.01
Share of teachers with permanent contracts … .2819** .2975**
Percentage of teachers with less than a bachelor's degrees … 0.34 0.27 Lagged mathematics test score … … -.1684***
N 838 838 817 R-squared 0.75 0.76 0.77 adj R-squared 0.66 0.67 0.68
Source: Authors’ estimations based on Combined Quantitative Dataset – School-level sample. Note: *, **, and *** indicate significance at 10%, 5% and 1 % level respectively.
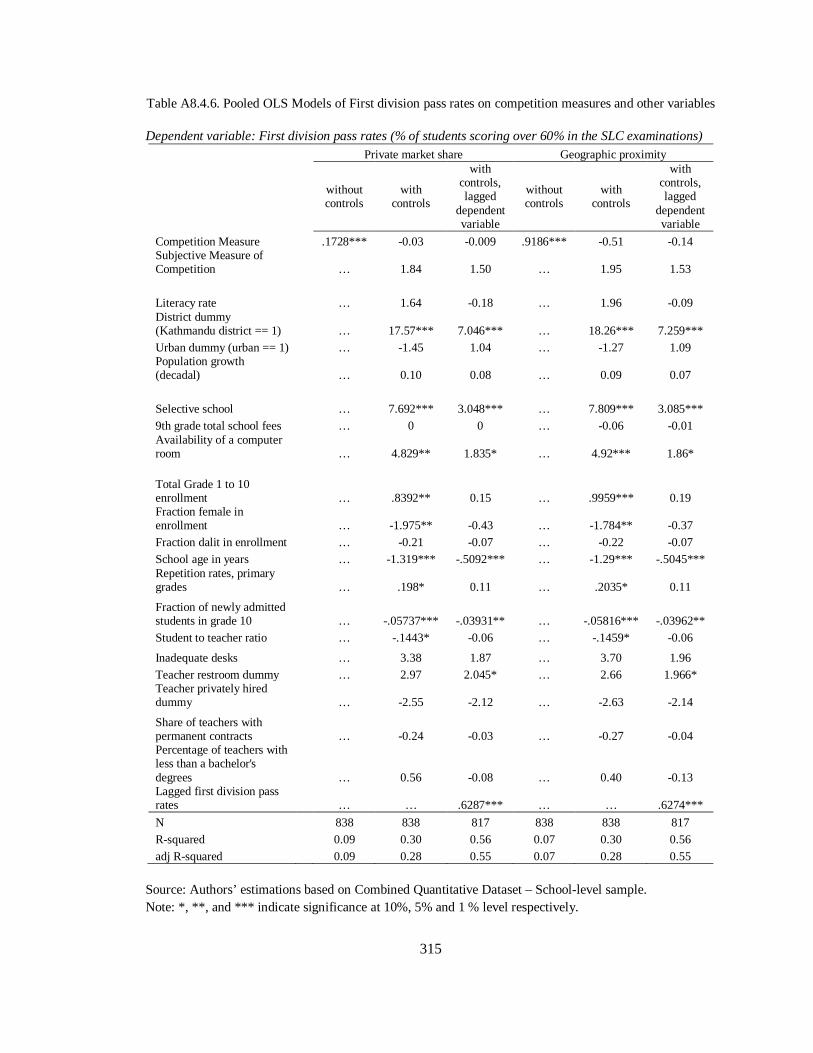
315
Table A8.4.6. Pooled OLS Models of First division pass rates on competition measures and other variables Dependent variable: First division pass rates (% of students scoring over 60% in the SLC examinations)
Private market share Geographic proximity
without controls
with controls
with controls, lagged
dependent variable
without controls
with controls
with controls, lagged
dependent variable
Competition Measure .1728*** -0.03 -0.009 .9186*** -0.51 -0.14 Subjective Measure of Competition … 1.84 1.50 … 1.95 1.53 Literacy rate … 1.64 -0.18 … 1.96 -0.09 District dummy (Kathmandu district == 1) … 17.57*** 7.046*** … 18.26*** 7.259*** Urban dummy (urban == 1) … -1.45 1.04 … -1.27 1.09 Population growth (decadal) … 0.10 0.08 … 0.09 0.07 Selective school … 7.692*** 3.048*** … 7.809*** 3.085*** 9th grade total school fees … 0 0 … -0.06 -0.01 Availability of a computer room … 4.829** 1.835* … 4.92*** 1.86* Total Grade 1 to 10 enrollment … .8392** 0.15 … .9959*** 0.19 Fraction female in enrollment … -1.975** -0.43 … -1.784** -0.37 Fraction dalit in enrollment … -0.21 -0.07 … -0.22 -0.07 School age in years … -1.319*** -.5092*** … -1.29*** -.5045*** Repetition rates, primary grades … .198* 0.11 … .2035* 0.11
Fraction of newly admitted students in grade 10 … -.05737*** -.03931** … -.05816*** -.03962** Student to teacher ratio … -.1443* -0.06 … -.1459* -0.06
Inadequate desks … 3.38 1.87 … 3.70 1.96 Teacher restroom dummy … 2.97 2.045* … 2.66 1.966* Teacher privately hired dummy … -2.55 -2.12 … -2.63 -2.14
Share of teachers with permanent contracts … -0.24 -0.03 … -0.27 -0.04 Percentage of teachers with less than a bachelor's degrees … 0.56 -0.08 … 0.40 -0.13 Lagged first division pass rates … … .6287*** … … .6274***
N 838 838 817 838 838 817 R-squared 0.09 0.30 0.56 0.07 0.30 0.56 adj R-squared 0.09 0.28 0.55 0.07 0.28 0.55
Source: Authors’ estimations based on Combined Quantitative Dataset – School-level sample. Note: *, **, and *** indicate significance at 10%, 5% and 1 % level respectively.
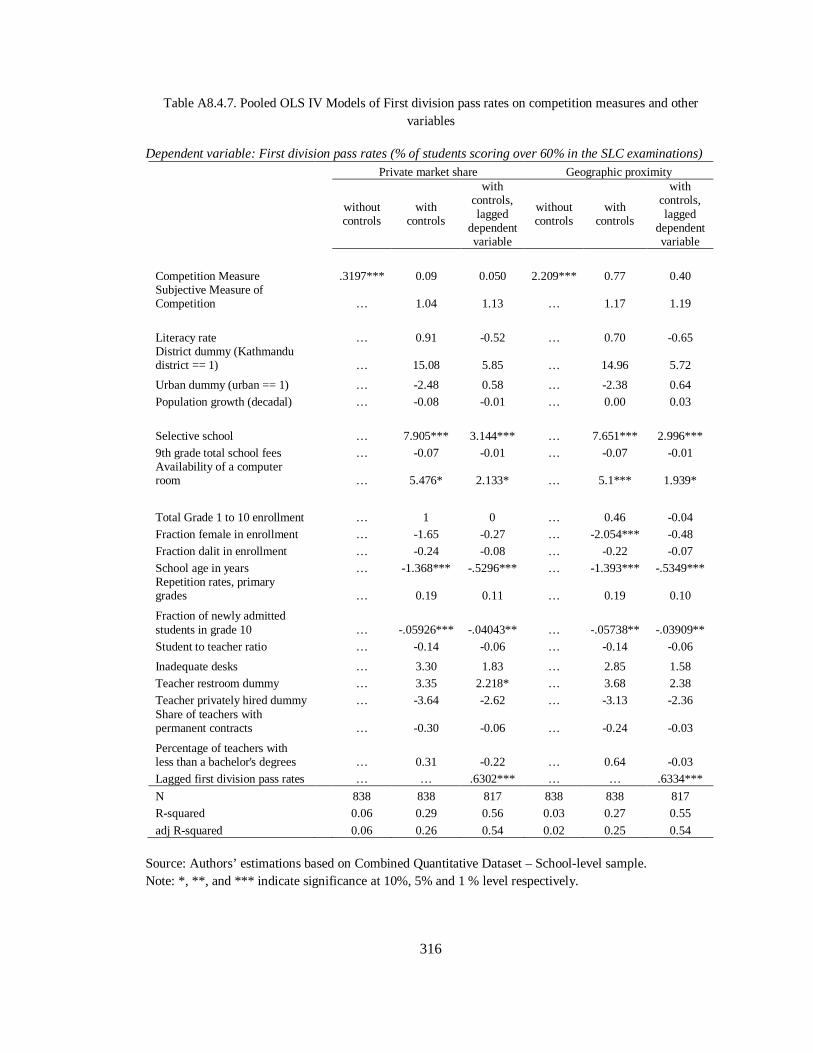
316
Table A8.4.7. Pooled OLS IV Models of First division pass rates on competition measures and other variables
Dependent variable: First division pass rates (% of students scoring over 60% in the SLC examinations)
Private market share Geographic proximity
without controls
with controls
with controls, lagged
dependent variable
without controls
with controls
with controls, lagged
dependent variable
Competition Measure .3197*** 0.09 0.050 2.209*** 0.77 0.40 Subjective Measure of Competition … 1.04 1.13 … 1.17 1.19
Literacy rate … 0.91 -0.52 … 0.70 -0.65 District dummy (Kathmandu district == 1) … 15.08 5.85 … 14.96 5.72
Urban dummy (urban == 1) … -2.48 0.58 … -2.38 0.64 Population growth (decadal) … -0.08 -0.01 … 0.00 0.03
Selective school … 7.905*** 3.144*** … 7.651*** 2.996*** 9th grade total school fees … -0.07 -0.01 … -0.07 -0.01 Availability of a computer room … 5.476* 2.133* … 5.1*** 1.939*
Total Grade 1 to 10 enrollment … 1 0 … 0.46 -0.04 Fraction female in enrollment … -1.65 -0.27 … -2.054*** -0.48 Fraction dalit in enrollment … -0.24 -0.08 … -0.22 -0.07 School age in years … -1.368*** -.5296*** … -1.393*** -.5349*** Repetition rates, primary grades … 0.19 0.11 … 0.19 0.10
Fraction of newly admitted students in grade 10 … -.05926*** -.04043** … -.05738** -.03909** Student to teacher ratio … -0.14 -0.06 … -0.14 -0.06
Inadequate desks … 3.30 1.83 … 2.85 1.58 Teacher restroom dummy … 3.35 2.218* … 3.68 2.38 Teacher privately hired dummy … -3.64 -2.62 … -3.13 -2.36 Share of teachers with permanent contracts … -0.30 -0.06 … -0.24 -0.03
Percentage of teachers with less than a bachelor's degrees … 0.31 -0.22 … 0.64 -0.03 Lagged first division pass rates … … .6302*** … … .6334***
N 838 838 817 838 838 817 R-squared 0.06 0.29 0.56 0.03 0.27 0.55
adj R-squared 0.06 0.26 0.54 0.02 0.25 0.54 Source: Authors’ estimations based on Combined Quantitative Dataset – School-level sample. Note: *, **, and *** indicate significance at 10%, 5% and 1 % level respectively.
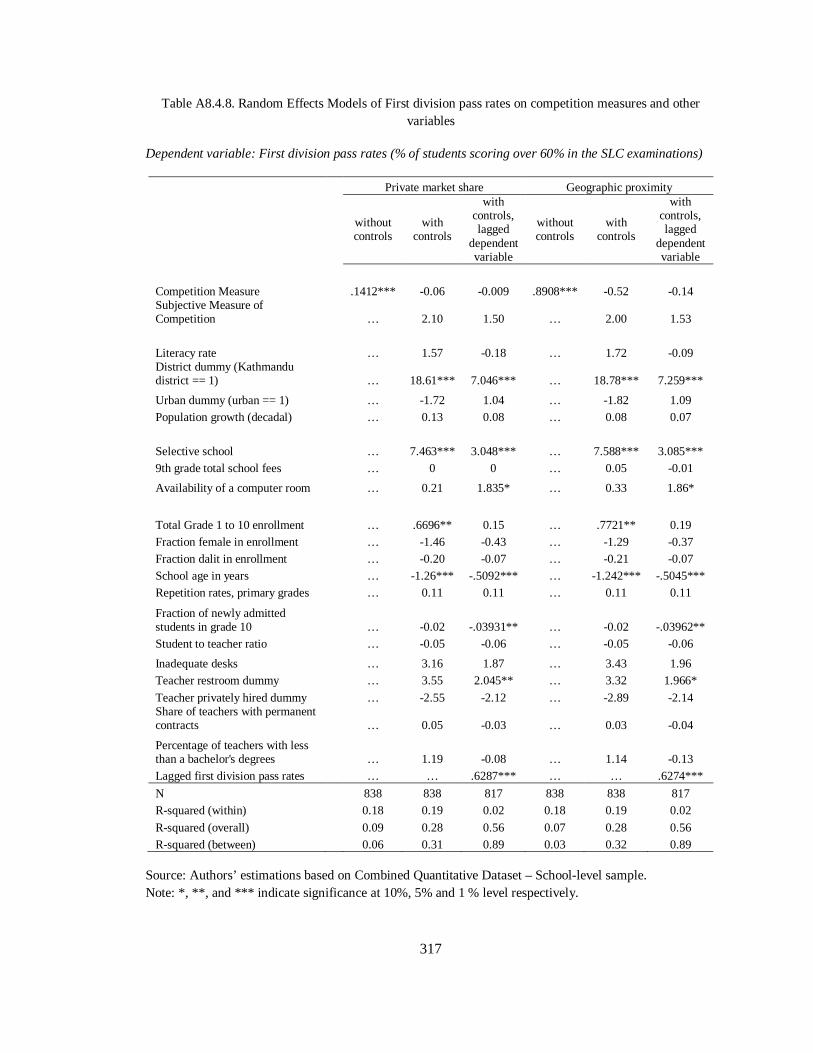
317
Table A8.4.8. Random Effects Models of First division pass rates on competition measures and other variables
Dependent variable: First division pass rates (% of students scoring over 60% in the SLC examinations)
Private market share Geographic proximity
without controls
with controls
with controls, lagged
dependent variable
without controls
with controls
with controls, lagged
dependent variable
Competition Measure .1412*** -0.06 -0.009 .8908*** -0.52 -0.14 Subjective Measure of Competition … 2.10 1.50 … 2.00 1.53
Literacy rate … 1.57 -0.18 … 1.72 -0.09 District dummy (Kathmandu district == 1) … 18.61*** 7.046*** … 18.78*** 7.259***
Urban dummy (urban == 1) … -1.72 1.04 … -1.82 1.09 Population growth (decadal) … 0.13 0.08 … 0.08 0.07
Selective school … 7.463*** 3.048*** … 7.588*** 3.085*** 9th grade total school fees … 0 0 … 0.05 -0.01
Availability of a computer room … 0.21 1.835* … 0.33 1.86*
Total Grade 1 to 10 enrollment … .6696** 0.15 … .7721** 0.19 Fraction female in enrollment … -1.46 -0.43 … -1.29 -0.37 Fraction dalit in enrollment … -0.20 -0.07 … -0.21 -0.07 School age in years … -1.26*** -.5092*** … -1.242*** -.5045*** Repetition rates, primary grades … 0.11 0.11 … 0.11 0.11
Fraction of newly admitted students in grade 10 … -0.02 -.03931** … -0.02 -.03962** Student to teacher ratio … -0.05 -0.06 … -0.05 -0.06
Inadequate desks … 3.16 1.87 … 3.43 1.96 Teacher restroom dummy … 3.55 2.045** … 3.32 1.966*
Teacher privately hired dummy … -2.55 -2.12 … -2.89 -2.14 Share of teachers with permanent contracts … 0.05 -0.03 … 0.03 -0.04
Percentage of teachers with less than a bachelor's degrees … 1.19 -0.08 … 1.14 -0.13 Lagged first division pass rates … … .6287*** … … .6274***
N 838 838 817 838 838 817 R-squared (within) 0.18 0.19 0.02 0.18 0.19 0.02
R-squared (overall) 0.09 0.28 0.56 0.07 0.28 0.56 R-squared (between) 0.06 0.31 0.89 0.03 0.32 0.89
Source: Authors’ estimations based on Combined Quantitative Dataset – School-level sample. Note: *, **, and *** indicate significance at 10%, 5% and 1 % level respectively.
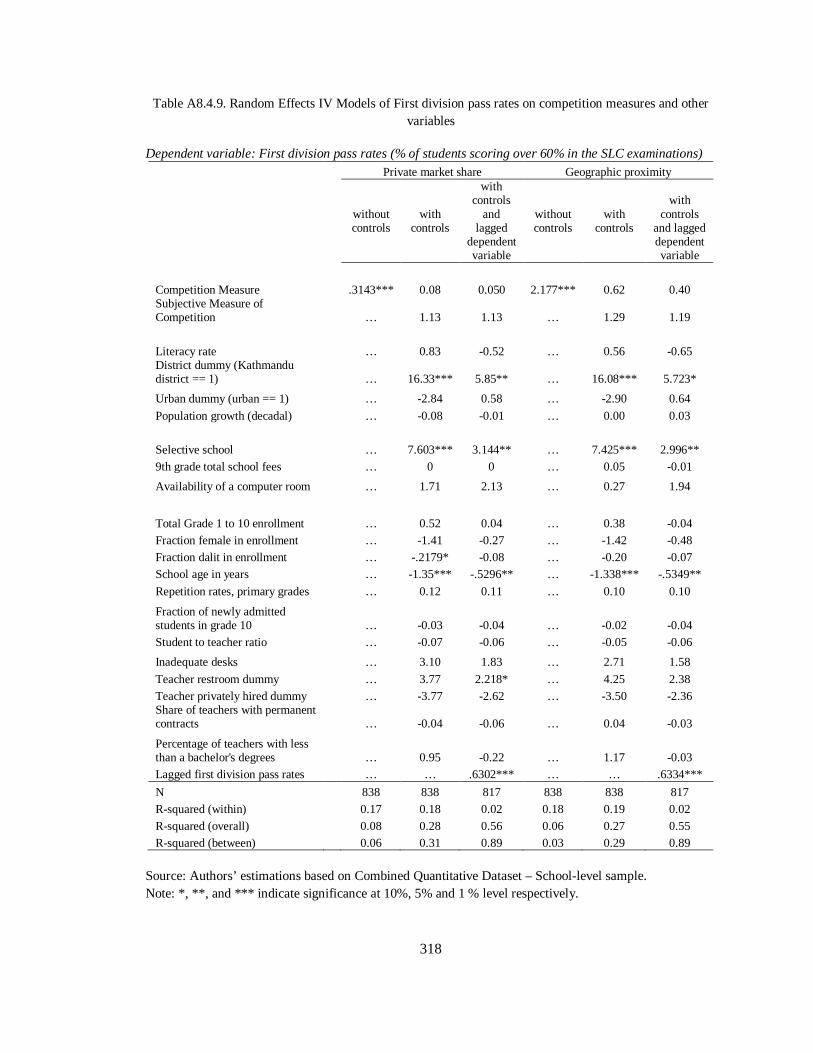
318
Table A8.4.9. Random Effects IV Models of First division pass rates on competition measures and other variables
Dependent variable: First division pass rates (% of students scoring over 60% in the SLC examinations)
Private market share Geographic proximity
without controls
with controls
with controls
and lagged
dependent variable
without controls
with controls
with controls
and lagged dependent variable
Competition Measure .3143*** 0.08 0.050 2.177*** 0.62 0.40 Subjective Measure of Competition … 1.13 1.13 … 1.29 1.19
Literacy rate … 0.83 -0.52 … 0.56 -0.65 District dummy (Kathmandu district == 1) … 16.33*** 5.85** … 16.08*** 5.723*
Urban dummy (urban == 1) … -2.84 0.58 … -2.90 0.64
Population growth (decadal) … -0.08 -0.01 … 0.00 0.03 Selective school … 7.603*** 3.144** … 7.425*** 2.996** 9th grade total school fees … 0 0 … 0.05 -0.01
Availability of a computer room … 1.71 2.13 … 0.27 1.94
Total Grade 1 to 10 enrollment … 0.52 0.04 … 0.38 -0.04 Fraction female in enrollment … -1.41 -0.27 … -1.42 -0.48 Fraction dalit in enrollment … -.2179* -0.08 … -0.20 -0.07 School age in years … -1.35*** -.5296** … -1.338*** -.5349**
Repetition rates, primary grades … 0.12 0.11 … 0.10 0.10
Fraction of newly admitted students in grade 10 … -0.03 -0.04 … -0.02 -0.04 Student to teacher ratio … -0.07 -0.06 … -0.05 -0.06
Inadequate desks … 3.10 1.83 … 2.71 1.58
Teacher restroom dummy … 3.77 2.218* … 4.25 2.38 Teacher privately hired dummy … -3.77 -2.62 … -3.50 -2.36 Share of teachers with permanent contracts … -0.04 -0.06 … 0.04 -0.03
Percentage of teachers with less than a bachelor's degrees … 0.95 -0.22 … 1.17 -0.03 Lagged first division pass rates … … .6302*** … … .6334***
N 838 838 817 838 838 817 R-squared (within) 0.17 0.18 0.02 0.18 0.19 0.02 R-squared (overall) 0.08 0.28 0.56 0.06 0.27 0.55 R-squared (between) 0.06 0.31 0.89 0.03 0.29 0.89
Source: Authors’ estimations based on Combined Quantitative Dataset – School-level sample. Note: *, **, and *** indicate significance at 10%, 5% and 1 % level respectively.
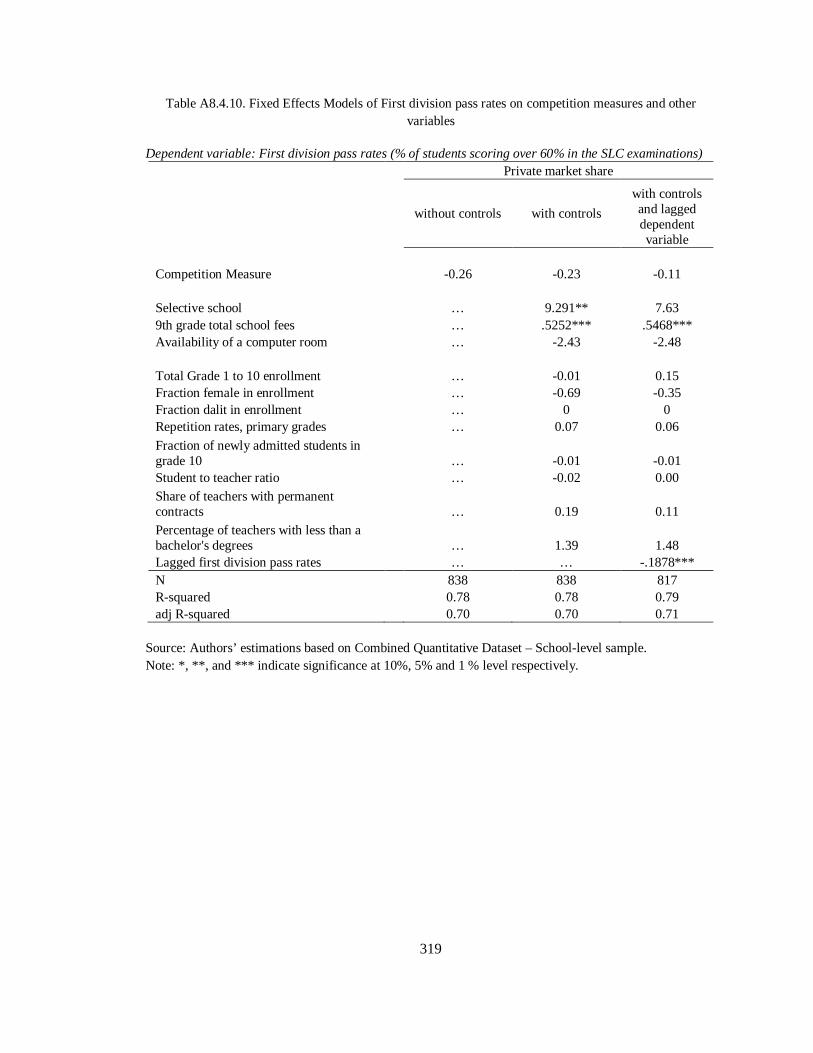
319
Table A8.4.10. Fixed Effects Models of First division pass rates on competition measures and other variables
Dependent variable: First division pass rates (% of students scoring over 60% in the SLC examinations)
Private market share
without controls with controls
with controls and lagged dependent variable
Competition Measure -0.26 -0.23 -0.11 Selective school … 9.291** 7.63 9th grade total school fees … .5252*** .5468*** Availability of a computer room … -2.43 -2.48 Total Grade 1 to 10 enrollment … -0.01 0.15 Fraction female in enrollment … -0.69 -0.35 Fraction dalit in enrollment … 0 0 Repetition rates, primary grades … 0.07 0.06
Fraction of newly admitted students in grade 10 … -0.01 -0.01 Student to teacher ratio … -0.02 0.00 Share of teachers with permanent contracts … 0.19 0.11 Percentage of teachers with less than a bachelor's degrees … 1.39 1.48 Lagged first division pass rates … … -.1878*** N 838 838 817 R-squared 0.78 0.78 0.79 adj R-squared 0.70 0.70 0.71
Source: Authors’ estimations based on Combined Quantitative Dataset – School-level sample. Note: *, **, and *** indicate significance at 10%, 5% and 1 % level respectively.
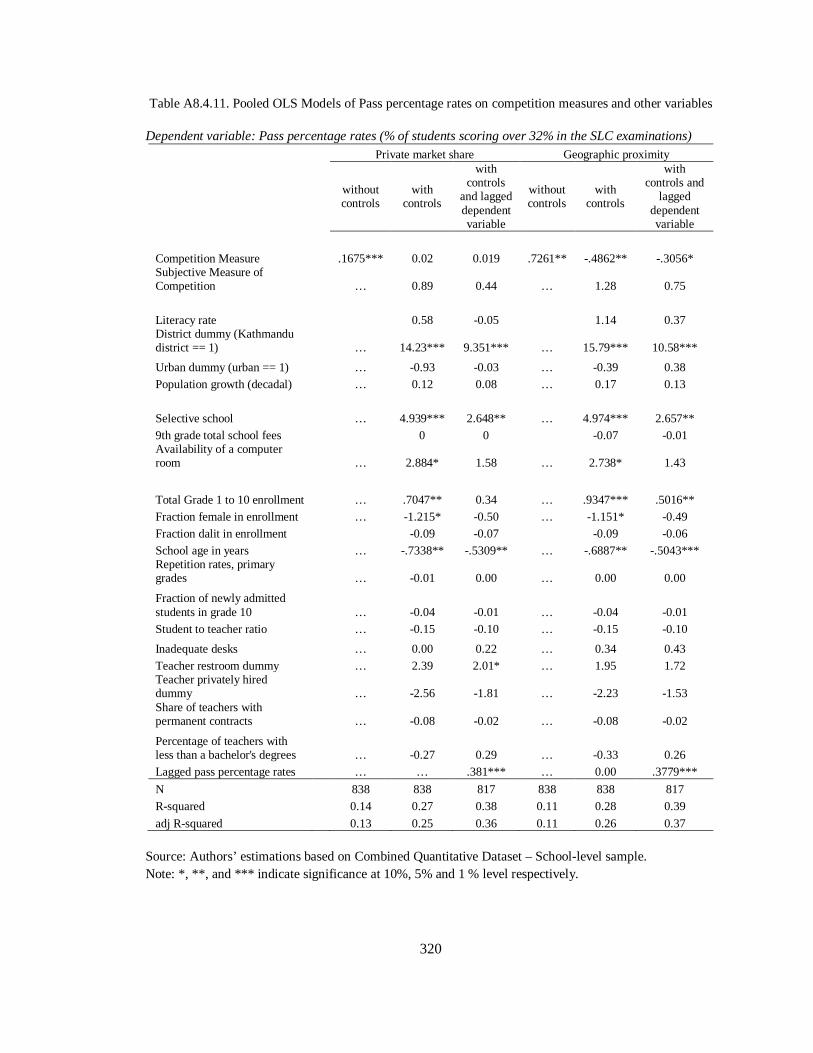
320
Table A8.4.11. Pooled OLS Models of Pass percentage rates on competition measures and other variables Dependent variable: Pass percentage rates (% of students scoring over 32% in the SLC examinations)
Private market share Geographic proximity
without controls
with controls
with controls
and lagged dependent variable
without controls
with controls
with controls and
lagged dependent variable
Competition Measure .1675*** 0.02 0.019 .7261** -.4862** -.3056* Subjective Measure of Competition … 0.89 0.44 … 1.28 0.75
Literacy rate 0.58 -0.05 1.14 0.37 District dummy (Kathmandu district == 1) … 14.23*** 9.351*** … 15.79*** 10.58***
Urban dummy (urban == 1) … -0.93 -0.03 … -0.39 0.38 Population growth (decadal) … 0.12 0.08 … 0.17 0.13
Selective school … 4.939*** 2.648** … 4.974*** 2.657** 9th grade total school fees 0 0 -0.07 -0.01 Availability of a computer room … 2.884* 1.58 … 2.738* 1.43
Total Grade 1 to 10 enrollment … .7047** 0.34 … .9347*** .5016** Fraction female in enrollment … -1.215* -0.50 … -1.151* -0.49 Fraction dalit in enrollment -0.09 -0.07 -0.09 -0.06 School age in years … -.7338** -.5309** … -.6887** -.5043*** Repetition rates, primary grades … -0.01 0.00 … 0.00 0.00
Fraction of newly admitted students in grade 10 … -0.04 -0.01 … -0.04 -0.01 Student to teacher ratio … -0.15 -0.10 … -0.15 -0.10
Inadequate desks … 0.00 0.22 … 0.34 0.43 Teacher restroom dummy … 2.39 2.01* … 1.95 1.72 Teacher privately hired dummy … -2.56 -1.81 … -2.23 -1.53 Share of teachers with permanent contracts … -0.08 -0.02 … -0.08 -0.02
Percentage of teachers with less than a bachelor's degrees … -0.27 0.29 … -0.33 0.26 Lagged pass percentage rates … … .381*** … 0.00 .3779***
N 838 838 817 838 838 817 R-squared 0.14 0.27 0.38 0.11 0.28 0.39
adj R-squared 0.13 0.25 0.36 0.11 0.26 0.37 Source: Authors’ estimations based on Combined Quantitative Dataset – School-level sample. Note: *, **, and *** indicate significance at 10%, 5% and 1 % level respectively.

321
Table A8.4.12. Pooled OLS IV Models of Pass percentage rates on competition measures and other variables
Dependent variable: Pass percentage rates (% of students scoring over 32% in the SLC examinations)
Private market share Geographic proximity
without controls
with controls
with controls & lagged dependent variable
without controls
with controls
with controls &
lagged dependent variable
Competition Measure .2936*** 0.23 0.143 2.028*** 1.89 1.14 Subjective Measure of Competition … -0.47 -0.33 … -0.16 -0.15 Literacy rate -0.67 -0.77 -1.19 -1.11 District dummy (Kathmandu district == 1) … 9.95 6.88 … 9.66 6.55
Urban dummy (urban == 1) … -2.70 -1.01 … -2.44 -0.85 Population growth (decadal) … -0.20 -0.10 … 0.01 0.03 Selective school … 5.304*** 2.879** … 4.681** 2.449* 9th grade total school fees -0.09 -0.02 -0.08 -0.02
Availability of a computer room … 3.997* 2.23 … 3.072** 1.68
Total Grade 1 to 10 enrollment … 0 0 … -0.06 -0.12 Fraction female in enrollment … -0.65 -0.17 … -1.65 -0.80
Fraction dalit in enrollment -0.13 -0.09 -0.08 -0.06 School age in years … -.8192** -.578** … -.8805*** -.5966*** Repetition rates, primary grades … -0.02 -0.01 … -0.03 -0.02
Fraction of newly admitted students in grade 10 … -0.04 -0.02 … -0.03 -0.01 Student to teacher ratio … -0.14 -0.10 … -0.14 -0.09
Inadequate desks … -0.13 0.15 … -1.25 -0.55
Teacher restroom dummy … 3.04 2.382* … 3.85 2.84 Teacher privately hired dummy … -4.42 -2.86 … -3.18 -2.10 Share of teachers with permanent contracts … -0.18 -0.07 … -0.03 0.01
Percentage of teachers with less than a bachelor's degrees … -0.70 0.00 … 0.11 0.58 Lagged pass percentage rates … … .3805*** … … .3931***
N 838 838 817 838 838 817
R-squared 0.11 0.24 0.37 0.06 0.19 0.36 adj R-squared 0.11 0.22 0.35 0.05 0.17 0.33
Source: Authors’ estimations based on Combined Quantitative Dataset – School-level sample. Note: *, **, and *** indicate significance at 10%, 5% and 1 % level respectively.

322
Table A8.4.13. Random Effects Models of Pass percentage Rates on competition measures and other variables
Dependent variable: Pass percentage rates (% of students scoring over 32% in the SLC examinations)
Private market share Geographic proximity
without controls
with controls
with controls & lagged dependent variable
without controls
with controls
with controls &
lagged dependent variable
Competition Measure .1527*** 0.00 0.019 .7096** -.4581** -.3056* Subjective Measure of Competition … 1.10 0.44 … 1.39 0.75 Literacy rate 0.75 -0.05 1.21 0.37 District dummy (Kathmandu district == 1) … 15.03*** 9.351*** … 16.19*** 10.58***
Urban dummy (urban == 1) … -0.90 -0.03 … -0.49 0.38 Population growth (decadal) … 0.12 0.08 … 0.16 0.13
Selective school … 4.785*** 2.648** … 4.849*** 2.657** 9th grade total school fees 0 0 -0.05 -0.01
Availability of a computer room … 1.57 1.58 … 1.55 1.43
Total Grade 1 to 10 enrollment … .5059* 0.34 … .6874** .5016** Fraction female in enrollment … -0.81 -0.50 … -0.75 -0.49 Fraction dalit in enrollment -0.14 -0.07 -0.14 -0.06 School age in years … -.7303*** -.5309** … -.6914** -.5043*** Repetition rates, primary grades … 0.00 0.00 … 0.00 0.00
Fraction of newly admitted students in grade 10 … 0.00 -0.01 … 0.00 -0.01 Student to teacher ratio … -0.09 -0.10 … -0.09 -0.10
Inadequate desks … -0.11 0.22 … 0.19 0.43 Teacher restroom dummy … 2.66 2.01* … 2.29 1.72 Teacher privately hired dummy … -2.44 -1.81 … -2.23 -1.53 Share of teachers with permanent contracts … 0.06 -0.02 … 0.06 -0.02
Percentage of teachers with less than a bachelor's degrees … 0.42 0.29 … 0.39 0.26 Lagged pass percentage rates … … .381*** … … .3779***
N 838 838 817 838 838 817 R-squared (within) 0.20 0.21 0.07 0.20 0.21 0.07
R-squared (overall) 0.14 0.26 0.38 0.11 0.27 0.38 R-squared (between) 0.08 0.31 0.75 0.03 0.32 0.75
Source: Authors’ estimations based on Combined Quantitative Dataset – School-level sample. Note: *, **, and *** indicate significance at 10%, 5% and 1 % level respectively.

323
Table A8.4.14. Random Effects IV Models of Pass percentage rates on competition measures and other variables
Dependent variable: Pass percentage rates (% of students scoring over 32% in the SLC examinations)
Private market share Geographic proximity
without controls
with controls
with controls &
lagged dependent variable
without controls
with controls
with controls &
lagged dependent variable
Competition Measure .2914*** 0.24 0.143 2.017*** 1.94 1.14 Subjective Measure of Competition … -0.43 -0.33 … -0.06 -0.15 … … Literacy rate … -0.65 -0.77 … -1.17 -1.11 District dummy (Kathmandu district == 1) … 10.62*** 6.876** … 10.25** 6.55*
Urban dummy (urban == 1) … -2.87 -1.01 … -2.66 -0.85 Population growth (decadal) … -0.21 -0.10 … -0.01 0.03 Selective school … 5.147*** 2.879** … 4.501** 2.449*
9th grade total school fees … -0.07 -0.02 … -0.05 -0.02
Availability of a computer room … 3 2 … 1.38 1.68 Total Grade 1 to 10 enrollment … 0.20 0.11 … -0.28 -0.12 Fraction female in enrollment … -0.45 -0.17 … -1.00 -0.80 Fraction dalit in enrollment … -0.15 -0.09 … -0.13 -0.06
School age in years … -.8282** -.578** … -.8907** -.5966** Repetition rates, primary grades … -0.01 -0.01 … -0.01 -0.02
Fraction of newly admitted students in grade 10 … -0.01 -0.02 … 0.00 -0.01 Student to teacher ratio … -0.10 -0.10 … -0.07 -0.09
Inadequate desks … -0.26 0.15 … -1.38 -0.55 Teacher restroom dummy … 3.264* 2.382* … 4.31 2.835* Teacher privately hired dummy … -4.533* -2.86 … -3.35 -2.10 Share of teachers with permanent contracts … -0.05 -0.07 … 0.09 0.01
Percentage of teachers with less than a bachelor's degrees … -0.05 0.00 … 0.61 0.58 Lagged pass percentage rates … … .3805*** … … .3931***
N 838 838 817 838 838 817 R-squared (within) 0.41 0.40 0.22 0.41 0.42 0.22 R-squared (overall) 0.18 0.27 0.52 0.18 0.26 0.52 R-squared (between) 0.03 0.17 0.86 0.03 0.14 0.86
Source: Authors’ estimations based on Combined Quantitative Dataset – School-level sample. Note: *, **, and *** indicate significance at 10%, 5% and 1 % level respectively.

324
Table A8.4.15. Fixed Effects Models of Pass percentage rates on competition measures and other variables Dependent variable: Pass percentage rates (% of students scoring over 32% in the SLC examinations)
Private market share
without controls
with controls
with controls and lagged dependent variable
Competition Measure -0.32 -0.35 -0.33 Selective school … 5.93 2.30 9th grade total school fees … 0.31 0.32 Availability of a computer room … -0.85 -0.85 Total Grade 1 to 10 enrollment … -1.08 -0.98 Fraction female in enrollment … 0.30 0.33 Fraction dalit in enrollment … 0 0 Repetition rates, primary grades … -0.01 -0.01 Fraction of newly admitted students in grade 10 … 0.02 0.01 Student to teacher ratio … -0.03 -0.02
Share of teachers with permanent contracts … 0.22 0.21 Percentage of teachers with less than a bachelor's degrees … 1.08 0.96 Lagged pass percentage rates … … -.1996*** N 838 838 817 R-squared 0.64 0.64 0.67 adj R-squared 0.51 0.51 0.54
Source: Authors’ estimations based on Combined Quantitative Dataset – School-level sample. Note: *, **, and *** indicate significance at 10%, 5% and 1 % level respectively.
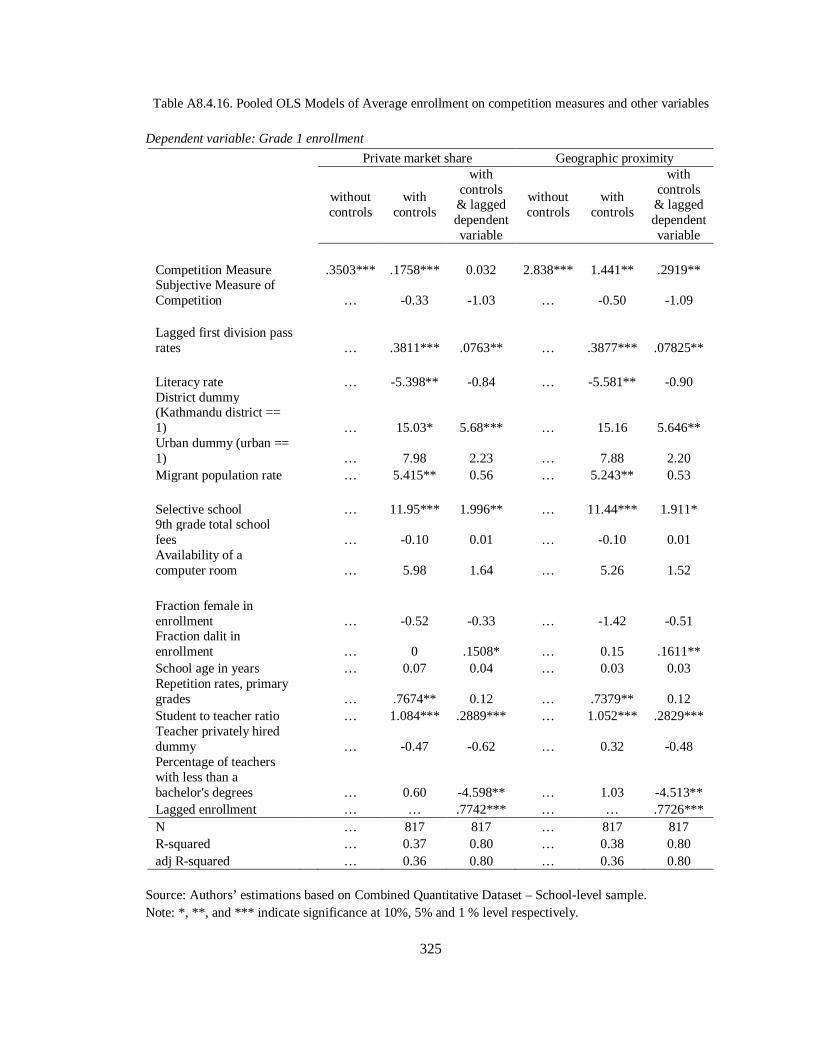
325
Table A8.4.16. Pooled OLS Models of Average enrollment on competition measures and other variables Dependent variable: Grade 1 enrollment
Private market share Geographic proximity
without controls
with controls
with controls & lagged dependent variable
without controls
with controls
with controls & lagged dependent variable
Competition Measure .3503*** .1758*** 0.032 2.838*** 1.441** .2919** Subjective Measure of Competition … -0.33 -1.03 … -0.50 -1.09 Lagged first division pass rates … .3811*** .0763** … .3877*** .07825** Literacy rate … -5.398** -0.84 … -5.581** -0.90 District dummy (Kathmandu district == 1) … 15.03* 5.68*** … 15.16 5.646** Urban dummy (urban == 1) … 7.98 2.23 … 7.88 2.20 Migrant population rate … 5.415** 0.56 … 5.243** 0.53 Selective school … 11.95*** 1.996** … 11.44*** 1.911* 9th grade total school fees … -0.10 0.01 … -0.10 0.01 Availability of a computer room … 5.98 1.64 … 5.26 1.52
Fraction female in enrollment … -0.52 -0.33 … -1.42 -0.51 Fraction dalit in enrollment … 0 .1508* … 0.15 .1611** School age in years … 0.07 0.04 … 0.03 0.03 Repetition rates, primary grades … .7674** 0.12 … .7379** 0.12 Student to teacher ratio … 1.084*** .2889*** … 1.052*** .2829*** Teacher privately hired dummy … -0.47 -0.62 … 0.32 -0.48 Percentage of teachers with less than a bachelor's degrees … 0.60 -4.598** … 1.03 -4.513** Lagged enrollment … … .7742*** … … .7726*** N … 817 817 … 817 817 R-squared … 0.37 0.80 … 0.38 0.80 adj R-squared … 0.36 0.80 … 0.36 0.80
Source: Authors’ estimations based on Combined Quantitative Dataset – School-level sample. Note: *, **, and *** indicate significance at 10%, 5% and 1 % level respectively.
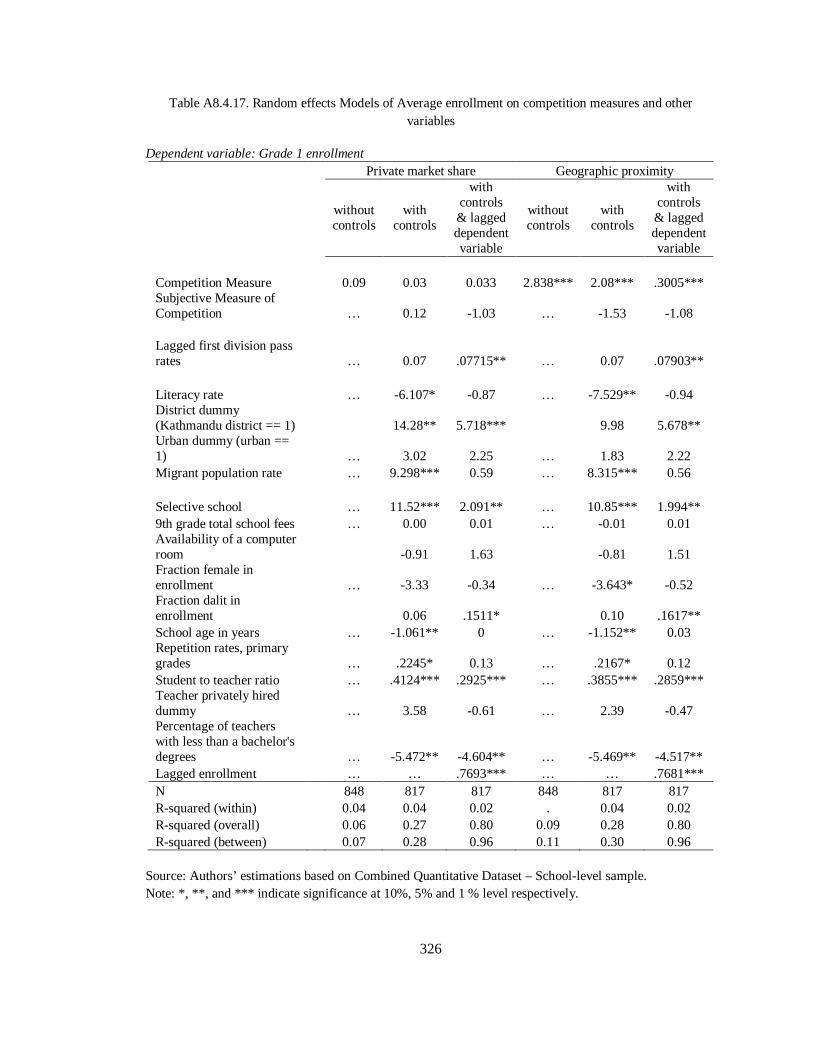
326
Table A8.4.17. Random effects Models of Average enrollment on competition measures and other variables
Dependent variable: Grade 1 enrollment
Private market share Geographic proximity
without controls
with controls
with controls & lagged dependent variable
without controls
with controls
with controls & lagged dependent variable
Competition Measure 0.09 0.03 0.033 2.838*** 2.08*** .3005*** Subjective Measure of Competition … 0.12 -1.03 … -1.53 -1.08 Lagged first division pass rates … 0.07 .07715** … 0.07 .07903** Literacy rate … -6.107* -0.87 … -7.529** -0.94 District dummy (Kathmandu district == 1) 14.28** 5.718*** 9.98 5.678** Urban dummy (urban == 1) … 3.02 2.25 … 1.83 2.22 Migrant population rate … 9.298*** 0.59 … 8.315*** 0.56 Selective school … 11.52*** 2.091** … 10.85*** 1.994** 9th grade total school fees … 0.00 0.01 … -0.01 0.01 Availability of a computer room -0.91 1.63 -0.81 1.51 Fraction female in enrollment … -3.33 -0.34 … -3.643* -0.52 Fraction dalit in enrollment 0.06 .1511* 0.10 .1617** School age in years … -1.061** 0 … -1.152** 0.03 Repetition rates, primary grades … .2245* 0.13 … .2167* 0.12 Student to teacher ratio … .4124*** .2925*** … .3855*** .2859*** Teacher privately hired dummy … 3.58 -0.61 … 2.39 -0.47 Percentage of teachers with less than a bachelor's degrees … -5.472** -4.604** … -5.469** -4.517** Lagged enrollment … … .7693*** … … .7681*** N 848 817 817 848 817 817 R-squared (within) 0.04 0.04 0.02 . 0.04 0.02 R-squared (overall) 0.06 0.27 0.80 0.09 0.28 0.80 R-squared (between) 0.07 0.28 0.96 0.11 0.30 0.96
Source: Authors’ estimations based on Combined Quantitative Dataset – School-level sample. Note: *, **, and *** indicate significance at 10%, 5% and 1 % level respectively.

327
Table A8.4.18. Fixed effects Models of Average enrollment on competition measures and other variables Dependent variable: Grade 1 enrollment
Private market share
without controls with controls
with controls & lagged dependent variable
Competition Measure -.7513*** -.663*** -.6006*** Lagged first division pass rates … 0.01 0.02 Selective school … 8.88 9.209* 9th grade total school fees … 0.05 0.05 Availability of a computer room … -2.58 -2.46 Fraction female in enrollment … -6.03 -5.55 Fraction dalit in enrollment … 0.26 0.27 Repetition rates, primary grades … 0.09 0.09 Student to teacher ratio … 0.10 0.10
Percentage of teachers with less than a bachelor's degrees … -6.291*** -6.243*** Lagged enrollment … … 0.09 N 848 817 817 R-squared 0.90 0.91 0.91 adj R-squared 0.86 0.87 0.87
Source: Authors’ estimations based on Combined Quantitative Dataset – School-level sample. Note: *, **, and *** indicate significance at 10%, 5% and 1 % level respectively.

328
Appendix 8.5 Detailed estimation tables of models of school-level outcome measures, policy responses, and other variables
This Appendix presents the detailed estimation results for all the models that were run that linked policy responses to competition measures. A small set of these results were produced in Tables 8.7 and Table 8.8. The estimations in these tables are based on the Combined Qualitative Dataset, school level sample.
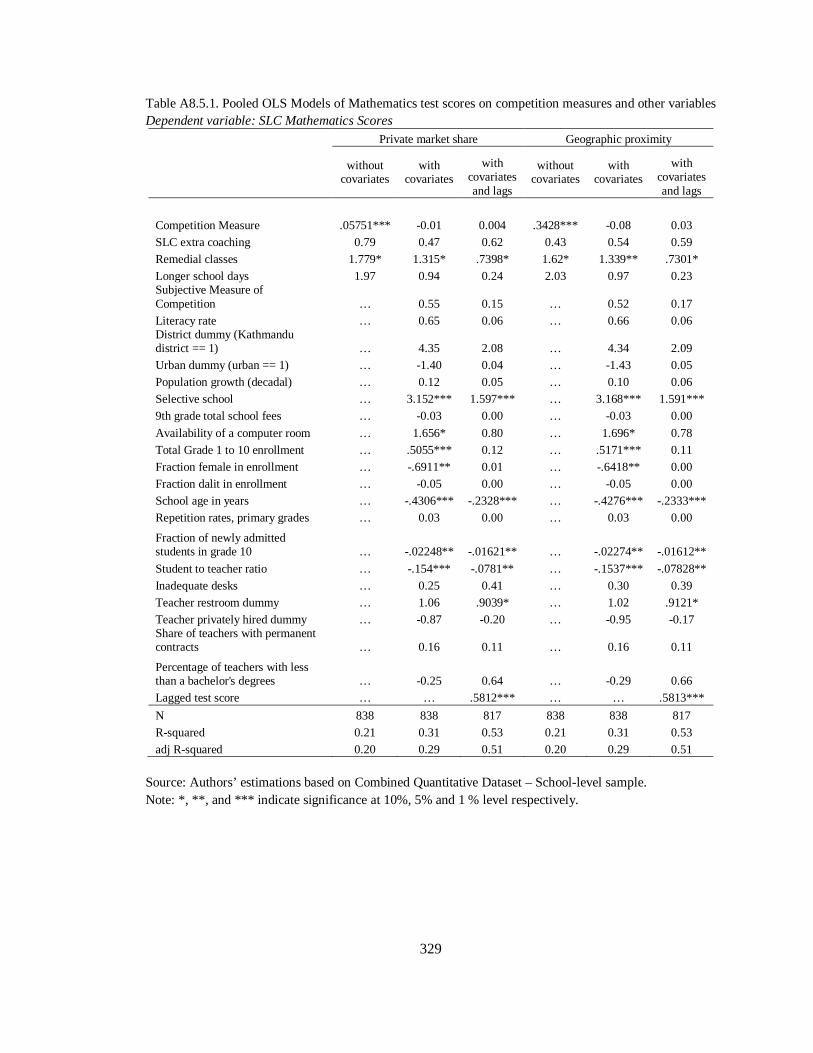
329
Table A8.5.1. Pooled OLS Models of Mathematics test scores on competition measures and other variables Dependent variable: SLC Mathematics Scores
Private market share Geographic proximity
without covariates
with covariates
with covariates and lags
without covariates
with covariates
with covariates and lags
Competition Measure .05751*** -0.01 0.004 .3428*** -0.08 0.03 SLC extra coaching 0.79 0.47 0.62 0.43 0.54 0.59 Remedial classes 1.779* 1.315* .7398* 1.62* 1.339** .7301* Longer school days 1.97 0.94 0.24 2.03 0.97 0.23 Subjective Measure of Competition … 0.55 0.15 … 0.52 0.17 Literacy rate … 0.65 0.06 … 0.66 0.06 District dummy (Kathmandu district == 1) … 4.35 2.08 … 4.34 2.09 Urban dummy (urban == 1) … -1.40 0.04 … -1.43 0.05 Population growth (decadal) … 0.12 0.05 … 0.10 0.06 Selective school … 3.152*** 1.597*** … 3.168*** 1.591*** 9th grade total school fees … -0.03 0.00 … -0.03 0.00
Availability of a computer room … 1.656* 0.80 … 1.696* 0.78 Total Grade 1 to 10 enrollment … .5055*** 0.12 … .5171*** 0.11 Fraction female in enrollment … -.6911** 0.01 … -.6418** 0.00 Fraction dalit in enrollment … -0.05 0.00 … -0.05 0.00 School age in years … -.4306*** -.2328*** … -.4276*** -.2333*** Repetition rates, primary grades … 0.03 0.00 … 0.03 0.00
Fraction of newly admitted students in grade 10 … -.02248** -.01621** … -.02274** -.01612**
Student to teacher ratio … -.154*** -.0781** … -.1537*** -.07828** Inadequate desks … 0.25 0.41 … 0.30 0.39 Teacher restroom dummy … 1.06 .9039* … 1.02 .9121* Teacher privately hired dummy … -0.87 -0.20 … -0.95 -0.17 Share of teachers with permanent contracts … 0.16 0.11 … 0.16 0.11
Percentage of teachers with less than a bachelor's degrees … -0.25 0.64 … -0.29 0.66 Lagged test score … … .5812*** … … .5813***
N 838 838 817 838 838 817 R-squared 0.21 0.31 0.53 0.21 0.31 0.53 adj R-squared 0.20 0.29 0.51 0.20 0.29 0.51
Source: Authors’ estimations based on Combined Quantitative Dataset – School-level sample. Note: *, **, and *** indicate significance at 10%, 5% and 1 % level respectively.
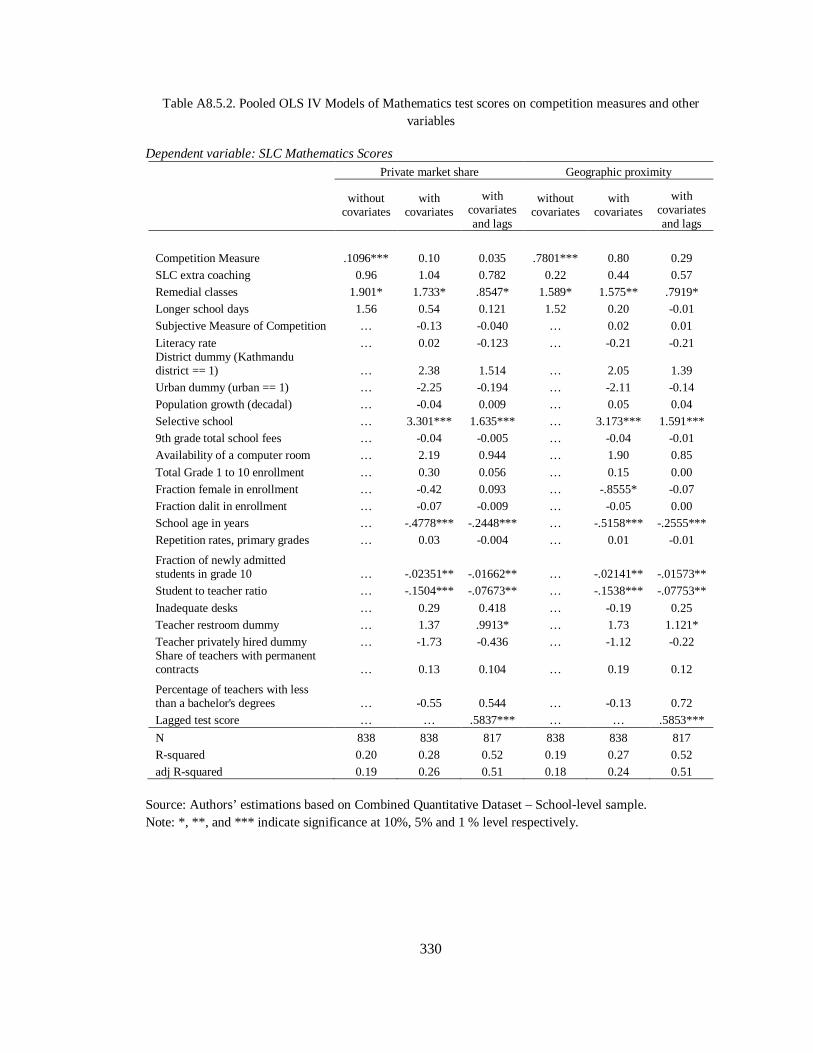
330
Table A8.5.2. Pooled OLS IV Models of Mathematics test scores on competition measures and other variables
Dependent variable: SLC Mathematics Scores
Private market share Geographic proximity
without covariates
with covariates
with covariates and lags
without covariates
with covariates
with covariates and lags
Competition Measure .1096*** 0.10 0.035 .7801*** 0.80 0.29 SLC extra coaching 0.96 1.04 0.782 0.22 0.44 0.57 Remedial classes 1.901* 1.733* .8547* 1.589* 1.575** .7919* Longer school days 1.56 0.54 0.121 1.52 0.20 -0.01 Subjective Measure of Competition … -0.13 -0.040 … 0.02 0.01
Literacy rate … 0.02 -0.123 … -0.21 -0.21 District dummy (Kathmandu district == 1) … 2.38 1.514 … 2.05 1.39 Urban dummy (urban == 1) … -2.25 -0.194 … -2.11 -0.14 Population growth (decadal) … -0.04 0.009 … 0.05 0.04 Selective school … 3.301*** 1.635*** … 3.173*** 1.591*** 9th grade total school fees … -0.04 -0.005 … -0.04 -0.01 Availability of a computer room … 2.19 0.944 … 1.90 0.85
Total Grade 1 to 10 enrollment … 0.30 0.056 … 0.15 0.00 Fraction female in enrollment … -0.42 0.093 … -.8555* -0.07 Fraction dalit in enrollment … -0.07 -0.009 … -0.05 0.00 School age in years … -.4778*** -.2448*** … -.5158*** -.2555*** Repetition rates, primary grades … 0.03 -0.004 … 0.01 -0.01
Fraction of newly admitted students in grade 10 … -.02351** -.01662** … -.02141** -.01573** Student to teacher ratio … -.1504*** -.07673** … -.1538*** -.07753**
Inadequate desks … 0.29 0.418 … -0.19 0.25 Teacher restroom dummy … 1.37 .9913* … 1.73 1.121* Teacher privately hired dummy … -1.73 -0.436 … -1.12 -0.22 Share of teachers with permanent contracts … 0.13 0.104 … 0.19 0.12
Percentage of teachers with less than a bachelor's degrees … -0.55 0.544 … -0.13 0.72 Lagged test score … … .5837*** … … .5853***
N 838 838 817 838 838 817 R-squared 0.20 0.28 0.52 0.19 0.27 0.52 adj R-squared 0.19 0.26 0.51 0.18 0.24 0.51
Source: Authors’ estimations based on Combined Quantitative Dataset – School-level sample. Note: *, **, and *** indicate significance at 10%, 5% and 1 % level respectively.
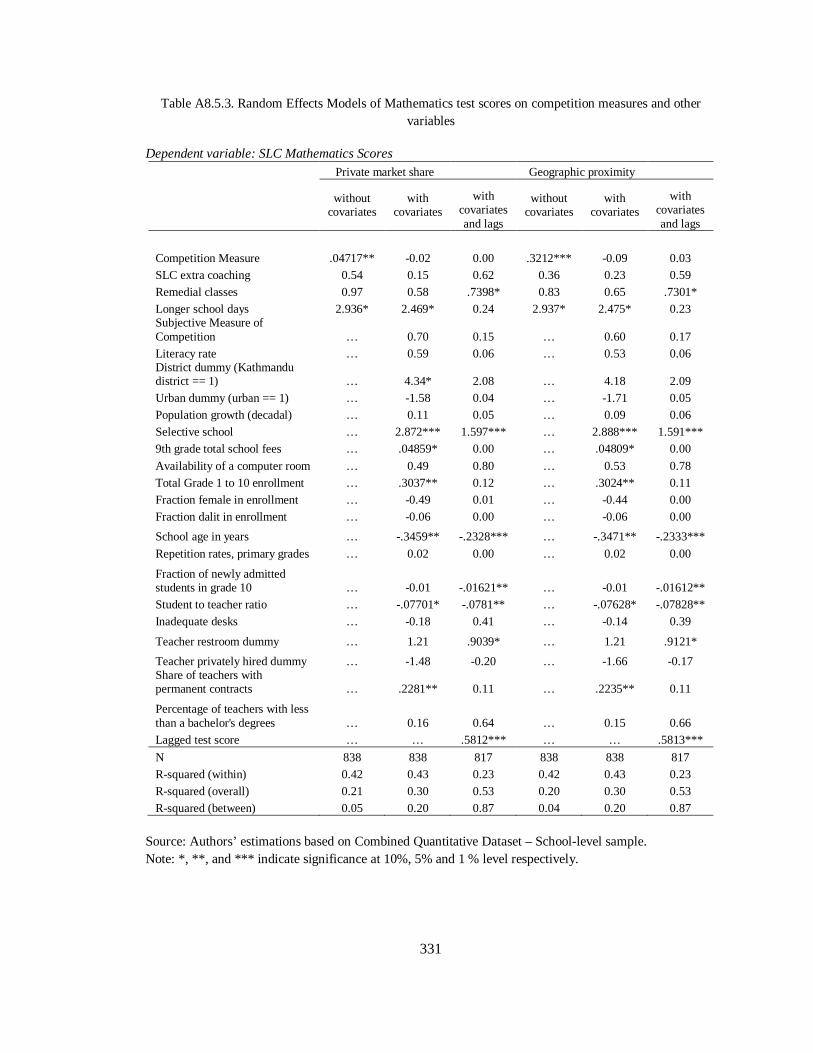
331
Table A8.5.3. Random Effects Models of Mathematics test scores on competition measures and other variables
Dependent variable: SLC Mathematics Scores
Private market share Geographic proximity
without covariates
with covariates
with covariates and lags
without covariates
with covariates
with covariates and lags
Competition Measure .04717** -0.02 0.00 .3212*** -0.09 0.03 SLC extra coaching 0.54 0.15 0.62 0.36 0.23 0.59 Remedial classes 0.97 0.58 .7398* 0.83 0.65 .7301* Longer school days 2.936* 2.469* 0.24 2.937* 2.475* 0.23 Subjective Measure of Competition … 0.70 0.15 … 0.60 0.17 Literacy rate … 0.59 0.06 … 0.53 0.06 District dummy (Kathmandu district == 1) … 4.34* 2.08 … 4.18 2.09 Urban dummy (urban == 1) … -1.58 0.04 … -1.71 0.05 Population growth (decadal) … 0.11 0.05 … 0.09 0.06 Selective school … 2.872*** 1.597*** … 2.888*** 1.591*** 9th grade total school fees … .04859* 0.00 … .04809* 0.00
Availability of a computer room … 0.49 0.80 … 0.53 0.78 Total Grade 1 to 10 enrollment … .3037** 0.12 … .3024** 0.11 Fraction female in enrollment … -0.49 0.01 … -0.44 0.00 Fraction dalit in enrollment … -0.06 0.00 … -0.06 0.00
School age in years … -.3459** -.2328*** … -.3471** -.2333***
Repetition rates, primary grades … 0.02 0.00 … 0.02 0.00
Fraction of newly admitted students in grade 10 … -0.01 -.01621** … -0.01 -.01612** Student to teacher ratio … -.07701* -.0781** … -.07628* -.07828** Inadequate desks … -0.18 0.41 … -0.14 0.39
Teacher restroom dummy … 1.21 .9039* … 1.21 .9121*
Teacher privately hired dummy … -1.48 -0.20 … -1.66 -0.17 Share of teachers with permanent contracts … .2281** 0.11 … .2235** 0.11
Percentage of teachers with less than a bachelor's degrees … 0.16 0.64 … 0.15 0.66 Lagged test score … … .5812*** … … .5813***
N 838 838 817 838 838 817 R-squared (within) 0.42 0.43 0.23 0.42 0.43 0.23 R-squared (overall) 0.21 0.30 0.53 0.20 0.30 0.53 R-squared (between) 0.05 0.20 0.87 0.04 0.20 0.87
Source: Authors’ estimations based on Combined Quantitative Dataset – School-level sample. Note: *, **, and *** indicate significance at 10%, 5% and 1 % level respectively.
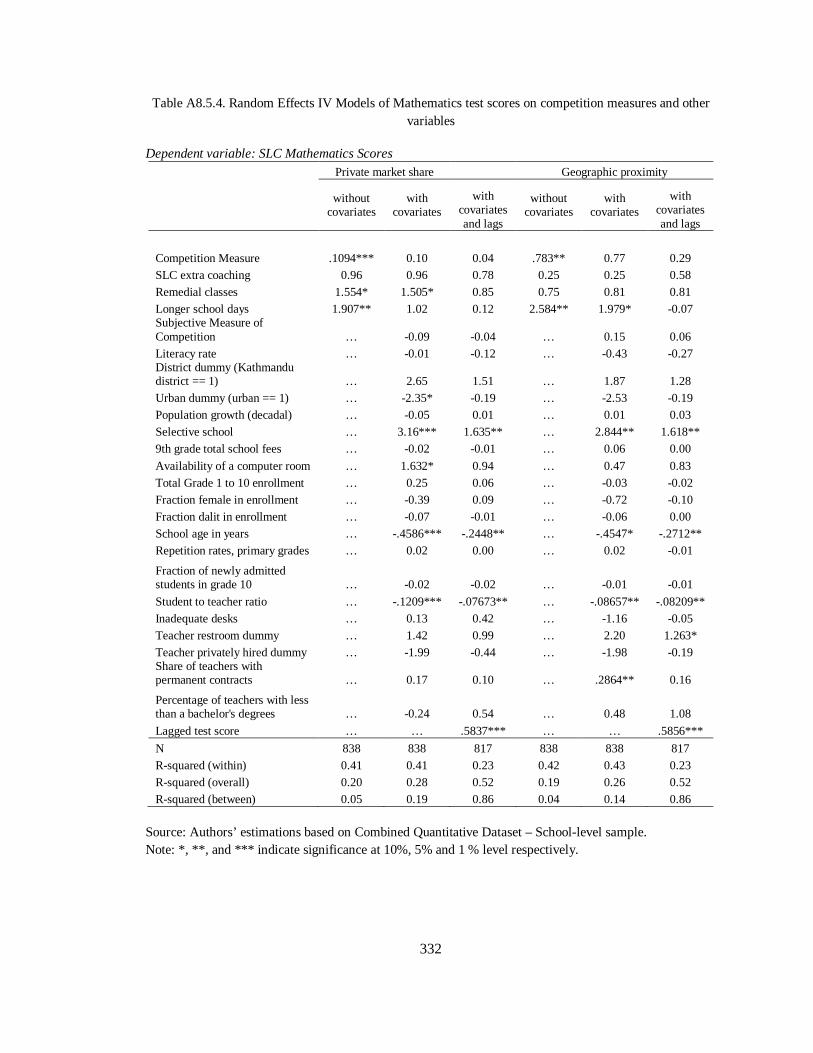
332
Table A8.5.4. Random Effects IV Models of Mathematics test scores on competition measures and other variables
Dependent variable: SLC Mathematics Scores
Private market share Geographic proximity
without covariates
with covariates
with covariates and lags
without covariates
with covariates
with covariates and lags
Competition Measure .1094*** 0.10 0.04 .783** 0.77 0.29 SLC extra coaching 0.96 0.96 0.78 0.25 0.25 0.58 Remedial classes 1.554* 1.505* 0.85 0.75 0.81 0.81 Longer school days 1.907** 1.02 0.12 2.584** 1.979* -0.07 Subjective Measure of Competition … -0.09 -0.04 … 0.15 0.06 Literacy rate … -0.01 -0.12 … -0.43 -0.27 District dummy (Kathmandu district == 1) … 2.65 1.51 … 1.87 1.28 Urban dummy (urban == 1) … -2.35* -0.19 … -2.53 -0.19 Population growth (decadal) … -0.05 0.01 … 0.01 0.03 Selective school … 3.16*** 1.635** … 2.844** 1.618** 9th grade total school fees … -0.02 -0.01 … 0.06 0.00
Availability of a computer room … 1.632* 0.94 … 0.47 0.83 Total Grade 1 to 10 enrollment … 0.25 0.06 … -0.03 -0.02 Fraction female in enrollment … -0.39 0.09 … -0.72 -0.10 Fraction dalit in enrollment … -0.07 -0.01 … -0.06 0.00 School age in years … -.4586*** -.2448** … -.4547* -.2712** Repetition rates, primary grades … 0.02 0.00 … 0.02 -0.01
Fraction of newly admitted students in grade 10 … -0.02 -0.02 … -0.01 -0.01
Student to teacher ratio … -.1209*** -.07673** … -.08657** -.08209** Inadequate desks … 0.13 0.42 … -1.16 -0.05 Teacher restroom dummy … 1.42 0.99 … 2.20 1.263* Teacher privately hired dummy … -1.99 -0.44 … -1.98 -0.19 Share of teachers with permanent contracts … 0.17 0.10 … .2864** 0.16
Percentage of teachers with less than a bachelor's degrees … -0.24 0.54 … 0.48 1.08
Lagged test score … … .5837*** … … .5856***
N 838 838 817 838 838 817 R-squared (within) 0.41 0.41 0.23 0.42 0.43 0.23 R-squared (overall) 0.20 0.28 0.52 0.19 0.26 0.52 R-squared (between) 0.05 0.19 0.86 0.04 0.14 0.86
Source: Authors’ estimations based on Combined Quantitative Dataset – School-level sample. Note: *, **, and *** indicate significance at 10%, 5% and 1 % level respectively.
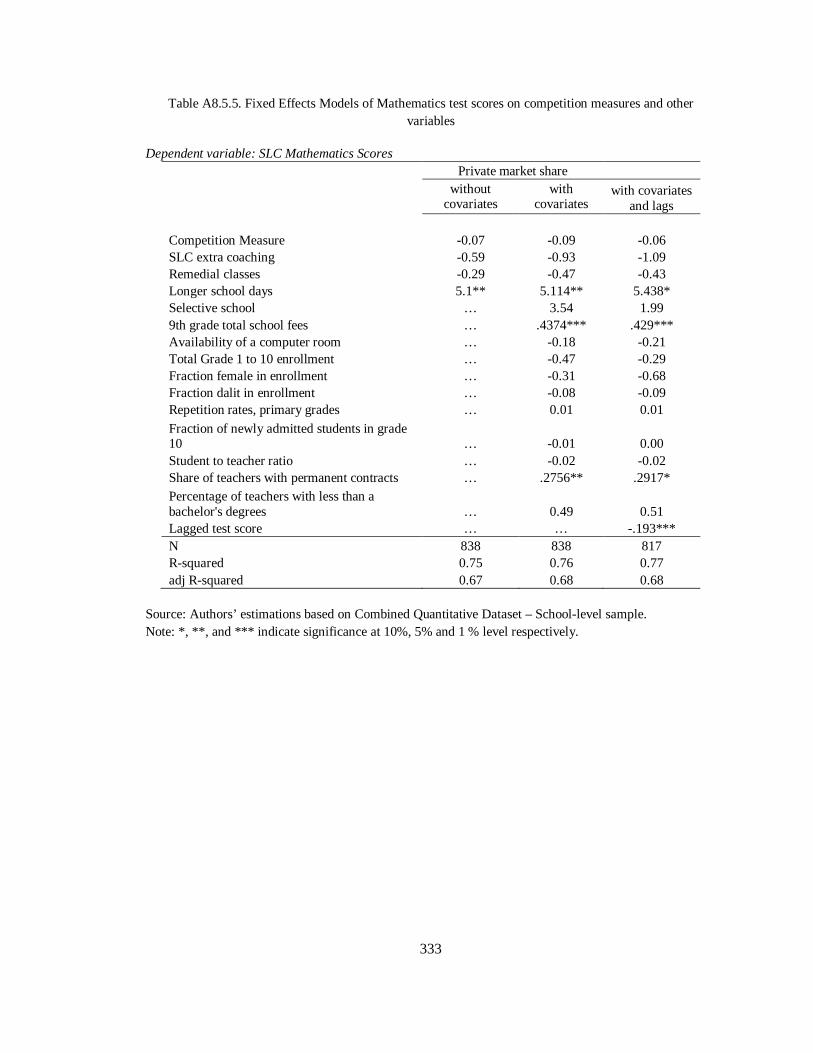
333
Table A8.5.5. Fixed Effects Models of Mathematics test scores on competition measures and other variables
Dependent variable: SLC Mathematics Scores
Private market share
without
covariates with
covariates with covariates
and lags Competition Measure -0.07 -0.09 -0.06 SLC extra coaching -0.59 -0.93 -1.09 Remedial classes -0.29 -0.47 -0.43 Longer school days 5.1** 5.114** 5.438* Selective school … 3.54 1.99 9th grade total school fees … .4374*** .429*** Availability of a computer room … -0.18 -0.21 Total Grade 1 to 10 enrollment … -0.47 -0.29 Fraction female in enrollment … -0.31 -0.68 Fraction dalit in enrollment … -0.08 -0.09 Repetition rates, primary grades … 0.01 0.01
Fraction of newly admitted students in grade 10 … -0.01 0.00 Student to teacher ratio … -0.02 -0.02 Share of teachers with permanent contracts … .2756** .2917* Percentage of teachers with less than a bachelor's degrees … 0.49 0.51 Lagged test score … … -.193*** N 838 838 817 R-squared 0.75 0.76 0.77 adj R-squared 0.67 0.68 0.68
Source: Authors’ estimations based on Combined Quantitative Dataset – School-level sample. Note: *, **, and *** indicate significance at 10%, 5% and 1 % level respectively.

334
Table A8.5.6. Pooled OLS Models of First division pass percentage rates on competition measures and other variables
Dependent variable: First division pass rates (% of students scoring over 60% in the SLC examinations)
Private market share Geographic proximity
without covariates
with covariates
with covariates and lags
without covariates
with covariates
with covariates and lags
Competition Measure .1655*** -0.03 -0.01 .8244*** -0.55 -0.16 SLC extra coaching 1.02 0.25 0.62 0.07 0.48 0.67 Remedial classes 2.87 2.14 1.40 2.43 2.12 1.39 Longer school days 3.93 1.29 0.99 4.28 1.65 1.11 Subjective Measure of Competition … 1.44 1.30 … 1.55 1.35 Literacy rate … 1.45 -0.27 … 1.81 -0.14 District dummy (Kathmandu district == 1) … 17.11*** 7.089*** … 17.95*** 7.423*** Urban dummy (urban == 1) … -1.83 0.77 … -1.66 0.84 Population growth (decadal) … 0.11 0.07 … 0.10 0.07 Selective school … 7.096*** 2.626*** … 7.136*** 2.641*** 9th grade total school fees … -0.04 0.00 … -0.04 0.00
Availability of a computer room … 4.233** 1.46 … 4.265** 1.46 Total Grade 1 to 10 enrollment … .9822*** 0.19 … 1.149*** 0.25 Fraction female in enrollment … -2.05** -0.43 … -1.839** -0.38 Fraction dalit in enrollment … -0.20 -0.05 … -0.21 -0.05 School age in years … -1.305*** -.4827*** … -1.264*** -.4727*** Repetition rates, primary grades … 0.18 0.10 … .1932* 0.11
Fraction of newly admitted students in grade 10 … -.05344*** -.03411** … -.0546*** -.0345**
Student to teacher ratio … -.2386*** -0.09 … -.2378** -0.09 Inadequate desks … 2.91 1.64 … 3.23 1.74 Teacher restroom dummy … 2.52 1.819* … 2.16 1.71 Teacher privately hired dummy … -2.02 -2.01 … -2.16 -2.03 Share of teachers with permanent contracts … -0.18 0.00 … -0.21 0.00
Percentage of teachers with less than a bachelor's degrees … 0.36 -0.45 … 0.17 -0.50
Lagged test score … … .6275*** … … .6258***
N 838 838 817 838 838 817 R-squared 0.10 0.30 0.56 0.09 0.31 0.56 adj R-squared 0.09 0.28 0.55 0.08 0.28 0.55
Source: Authors’ estimations based on Combined Quantitative Dataset – School-level sample. Note: *, **, and *** indicate significance at 10%, 5% and 1 % level respectively.
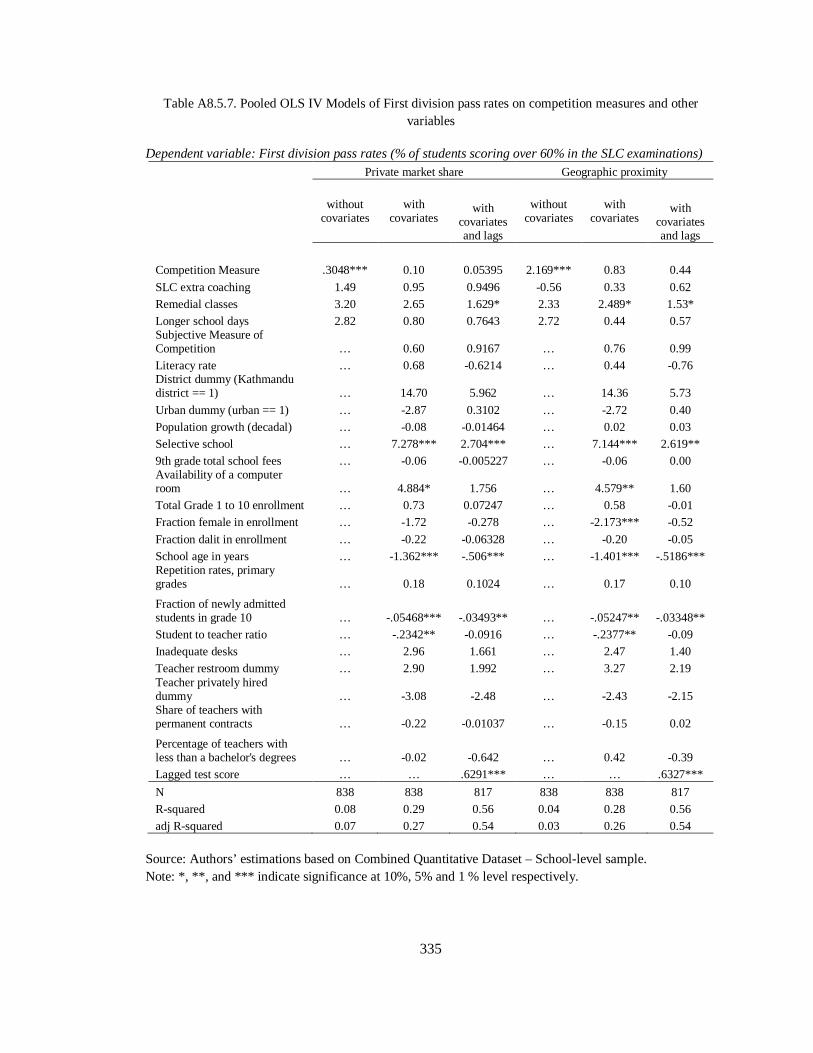
335
Table A8.5.7. Pooled OLS IV Models of First division pass rates on competition measures and other variables
Dependent variable: First division pass rates (% of students scoring over 60% in the SLC examinations)
Private market share Geographic proximity
without covariates
with covariates
with covariates and lags
without covariates
with covariates
with covariates and lags
Competition Measure .3048*** 0.10 0.05395 2.169*** 0.83 0.44
SLC extra coaching 1.49 0.95 0.9496 -0.56 0.33 0.62 Remedial classes 3.20 2.65 1.629* 2.33 2.489* 1.53* Longer school days 2.82 0.80 0.7643 2.72 0.44 0.57 Subjective Measure of Competition … 0.60 0.9167 … 0.76 0.99 Literacy rate … 0.68 -0.6214 … 0.44 -0.76 District dummy (Kathmandu district == 1) … 14.70 5.962 … 14.36 5.73
Urban dummy (urban == 1) … -2.87 0.3102 … -2.72 0.40 Population growth (decadal) … -0.08 -0.01464 … 0.02 0.03 Selective school … 7.278*** 2.704*** … 7.144*** 2.619** 9th grade total school fees … -0.06 -0.005227 … -0.06 0.00 Availability of a computer room … 4.884* 1.756 … 4.579** 1.60 Total Grade 1 to 10 enrollment … 0.73 0.07247 … 0.58 -0.01 Fraction female in enrollment … -1.72 -0.278 … -2.173*** -0.52
Fraction dalit in enrollment … -0.22 -0.06328 … -0.20 -0.05 School age in years … -1.362*** -.506*** … -1.401*** -.5186*** Repetition rates, primary grades … 0.18 0.1024 … 0.17 0.10
Fraction of newly admitted students in grade 10 … -.05468*** -.03493** … -.05247** -.03348** Student to teacher ratio … -.2342** -0.0916 … -.2377** -0.09 Inadequate desks … 2.96 1.661 … 2.47 1.40 Teacher restroom dummy … 2.90 1.992 … 3.27 2.19 Teacher privately hired dummy … -3.08 -2.48 … -2.43 -2.15 Share of teachers with permanent contracts … -0.22 -0.01037 … -0.15 0.02
Percentage of teachers with less than a bachelor's degrees … -0.02 -0.642 … 0.42 -0.39 Lagged test score … … .6291*** … … .6327***
N 838 838 817 838 838 817 R-squared 0.08 0.29 0.56 0.04 0.28 0.56 adj R-squared 0.07 0.27 0.54 0.03 0.26 0.54
Source: Authors’ estimations based on Combined Quantitative Dataset – School-level sample. Note: *, **, and *** indicate significance at 10%, 5% and 1 % level respectively.
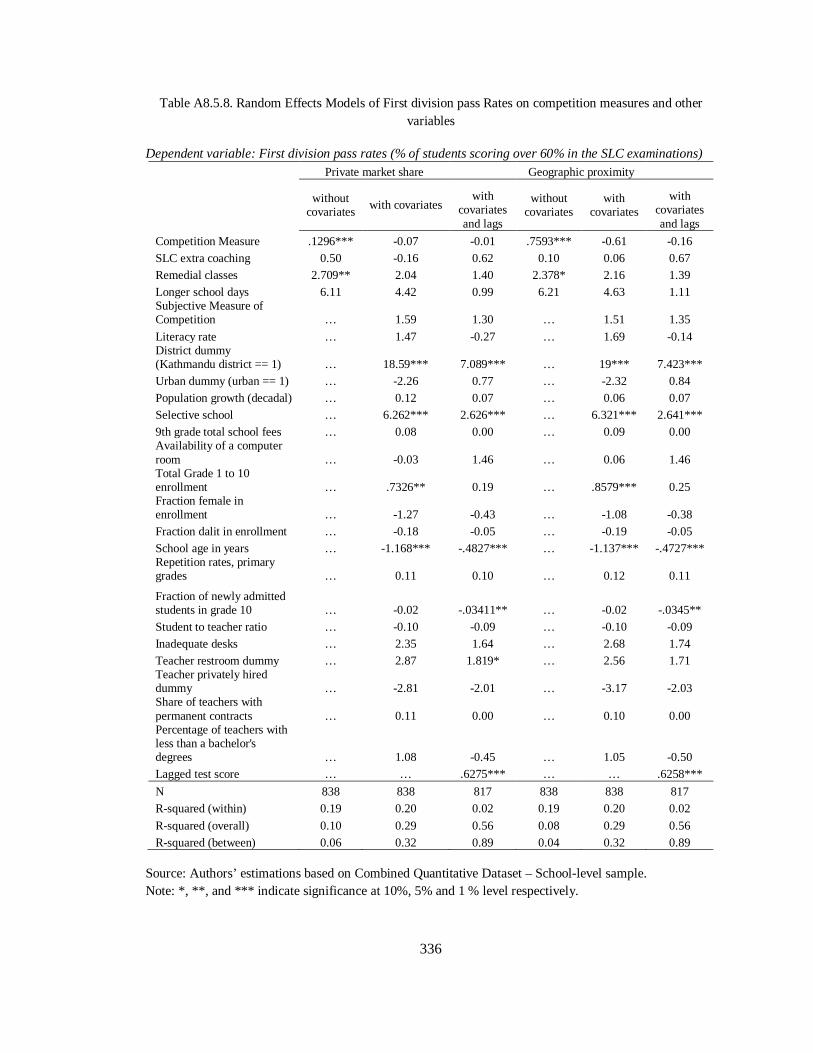
336
Table A8.5.8. Random Effects Models of First division pass Rates on competition measures and other variables
Dependent variable: First division pass rates (% of students scoring over 60% in the SLC examinations)
Private market share Geographic proximity
without covariates
with covariates with
covariates and lags
without covariates
with covariates
with covariates and lags
Competition Measure .1296*** -0.07 -0.01 .7593*** -0.61 -0.16 SLC extra coaching 0.50 -0.16 0.62 0.10 0.06 0.67 Remedial classes 2.709** 2.04 1.40 2.378* 2.16 1.39 Longer school days 6.11 4.42 0.99 6.21 4.63 1.11 Subjective Measure of Competition … 1.59 1.30 … 1.51 1.35
Literacy rate … 1.47 -0.27 … 1.69 -0.14 District dummy (Kathmandu district == 1) … 18.59*** 7.089*** … 19*** 7.423*** Urban dummy (urban == 1) … -2.26 0.77 … -2.32 0.84 Population growth (decadal) … 0.12 0.07 … 0.06 0.07 Selective school … 6.262*** 2.626*** … 6.321*** 2.641*** 9th grade total school fees … 0.08 0.00 … 0.09 0.00 Availability of a computer room … -0.03 1.46 … 0.06 1.46 Total Grade 1 to 10 enrollment … .7326** 0.19 … .8579*** 0.25 Fraction female in enrollment … -1.27 -0.43 … -1.08 -0.38 Fraction dalit in enrollment … -0.18 -0.05 … -0.19 -0.05 School age in years … -1.168*** -.4827*** … -1.137*** -.4727*** Repetition rates, primary grades … 0.11 0.10 … 0.12 0.11
Fraction of newly admitted students in grade 10 … -0.02 -.03411** … -0.02 -.0345** Student to teacher ratio … -0.10 -0.09 … -0.10 -0.09 Inadequate desks … 2.35 1.64 … 2.68 1.74 Teacher restroom dummy … 2.87 1.819* … 2.56 1.71 Teacher privately hired dummy … -2.81 -2.01 … -3.17 -2.03 Share of teachers with permanent contracts … 0.11 0.00 … 0.10 0.00 Percentage of teachers with less than a bachelor's degrees … 1.08 -0.45 … 1.05 -0.50 Lagged test score … … .6275*** … … .6258***
N 838 838 817 838 838 817 R-squared (within) 0.19 0.20 0.02 0.19 0.20 0.02
R-squared (overall) 0.10 0.29 0.56 0.08 0.29 0.56 R-squared (between) 0.06 0.32 0.89 0.04 0.32 0.89
Source: Authors’ estimations based on Combined Quantitative Dataset – School-level sample. Note: *, **, and *** indicate significance at 10%, 5% and 1 % level respectively.
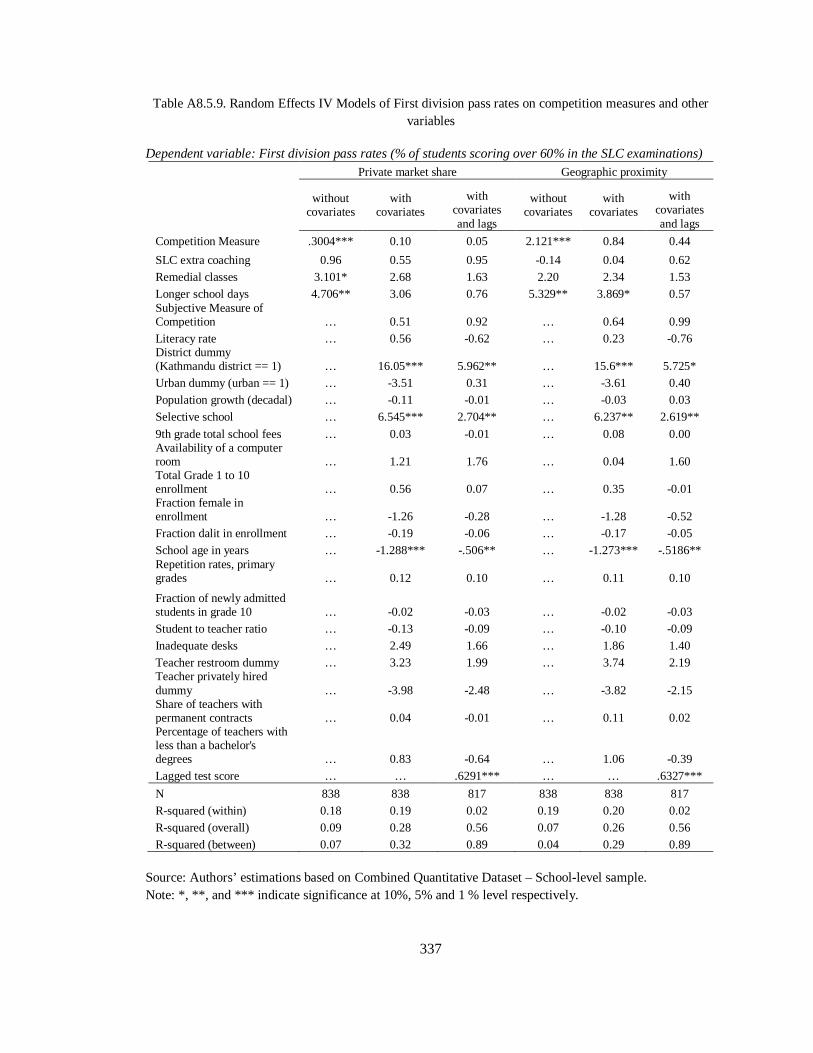
337
Table A8.5.9. Random Effects IV Models of First division pass rates on competition measures and other variables
Dependent variable: First division pass rates (% of students scoring over 60% in the SLC examinations)
Private market share Geographic proximity
without covariates
with covariates
with covariates and lags
without covariates
with covariates
with covariates and lags
Competition Measure .3004*** 0.10 0.05 2.121*** 0.84 0.44
SLC extra coaching 0.96 0.55 0.95 -0.14 0.04 0.62 Remedial classes 3.101* 2.68 1.63 2.20 2.34 1.53 Longer school days 4.706** 3.06 0.76 5.329** 3.869* 0.57 Subjective Measure of Competition … 0.51 0.92 … 0.64 0.99 Literacy rate … 0.56 -0.62 … 0.23 -0.76 District dummy (Kathmandu district == 1) … 16.05*** 5.962** … 15.6*** 5.725* Urban dummy (urban == 1) … -3.51 0.31 … -3.61 0.40 Population growth (decadal) … -0.11 -0.01 … -0.03 0.03 Selective school … 6.545*** 2.704** … 6.237** 2.619**
9th grade total school fees … 0.03 -0.01 … 0.08 0.00 Availability of a computer room … 1.21 1.76 … 0.04 1.60 Total Grade 1 to 10 enrollment … 0.56 0.07 … 0.35 -0.01 Fraction female in enrollment … -1.26 -0.28 … -1.28 -0.52 Fraction dalit in enrollment … -0.19 -0.06 … -0.17 -0.05 School age in years … -1.288*** -.506** … -1.273*** -.5186** Repetition rates, primary grades … 0.12 0.10 … 0.11 0.10
Fraction of newly admitted students in grade 10 … -0.02 -0.03 … -0.02 -0.03 Student to teacher ratio … -0.13 -0.09 … -0.10 -0.09 Inadequate desks … 2.49 1.66 … 1.86 1.40 Teacher restroom dummy … 3.23 1.99 … 3.74 2.19 Teacher privately hired dummy … -3.98 -2.48 … -3.82 -2.15 Share of teachers with permanent contracts … 0.04 -0.01 … 0.11 0.02 Percentage of teachers with less than a bachelor's degrees … 0.83 -0.64 … 1.06 -0.39 Lagged test score … … .6291*** … … .6327***
N 838 838 817 838 838 817 R-squared (within) 0.18 0.19 0.02 0.19 0.20 0.02 R-squared (overall) 0.09 0.28 0.56 0.07 0.26 0.56 R-squared (between) 0.07 0.32 0.89 0.04 0.29 0.89
Source: Authors’ estimations based on Combined Quantitative Dataset – School-level sample. Note: *, **, and *** indicate significance at 10%, 5% and 1 % level respectively.

338
Table A8.5.10. Fixed Effects Models of First division pass rates on competition measures and other variables
Dependent variable: First division pass rates (% of students scoring over 60% in the SLC examinations)
Private market share
without
covariates with
covariates with covariates and
lags Competition Measure -0.24 -0.22 -0.11
SLC extra coaching -0.13 -0.57 -1.21
Remedial classes 2.16 1.70 1.06 Longer school days 9.16 9.11 7.24 Selective school … 6.80 5.44 9th grade total school fees … .5452*** .5701*** Availability of a computer room … -2.17 -2.39 Total Grade 1 to 10 enrollment … -0.07 0.12 Fraction female in enrollment … -0.02 0.27 Fraction dalit in enrollment … -0.20 -0.21 Repetition rates, primary grades … 0.08 0.08 Fraction of newly admitted students in grade 10 … -0.01 -0.01 Student to teacher ratio … -0.03 0.01 Share of teachers with permanent contracts … .2756** .2917*
Percentage of teachers with less than a bachelor's degrees … 2.43 2.50 Lagged test score … … -.2007*** N 838 838 817 R-squared 0.78 0.79 0.79 adj R-squared 0.70 0.71 0.71
Source: Authors’ estimations based on Combined Quantitative Dataset – School-level sample. Note: *, **, and *** indicate significance at 10%, 5% and 1 % level respectively.

339
Table A8.5.11. Pooled OLS Models of Pass percentage rates on competition measures and other variables Dependent variable: Pass percentage rates (% of students scoring over 32% in the SLC examinations)
Private market share Geographic proximity
without covariates
with covariates
with covariates and lags
without covariates
with covariates
with covariates and lags
Competition Measure .161*** 0.01 0.02 .6562** -.5276** -.3202* SLC extra coaching 0.40 0.03 0.45 -0.46 0.03 0.37 Remedial classes 1.34 0.91 1.04 0.92 0.72 0.89 Longer school days 3.07 1.54 0.22 3.58 2.04 0.59 Subjective Measure of Competition … 0.60 0.28 … 0.97 0.59 Literacy rate … 0.44 -0.17 … 1.02 0.27 District dummy (Kathmandu district == 1) … 13.54*** 9.032*** … 15.1*** 10.28*** Urban dummy (urban == 1) … -1.26 -0.18 … -0.77 0.20 Population growth (decadal) … 0.14 0.10 … 0.19 0.15 Selective school … 4.549** 2.415** … 4.531** 2.394** 9th grade total school fees … -0.05 0.00 … -0.04 0.00 Availability of a computer room … 2.34 1.26 … 2.17 1.08 Total Grade 1 to 10 enrollment … .8797*** .4479** … 1.118*** .6232*** Fraction female in enrollment … -1.289** -0.55 … -1.187** -0.53 Fraction dalit in enrollment … -0.08 -0.05 … -0.08 -0.05 School age in years … -.7296*** -.5337*** … -.6723** -.4986*** Repetition rates, primary grades … 0.00 0.00 … 0.01 0.00
Fraction of newly admitted students in grade 10 … -0.03 -0.01 … -0.03 -0.01 Student to teacher ratio … -.2521*** -.1658** … -.2527*** -.1678** Inadequate desks … -0.54 0.06 … -0.25 0.23 Teacher restroom dummy … 1.99 1.73 … 1.53 1.42 Teacher privately hired dummy … -2.23 -1.48 … -2.04 -1.26 Share of teachers with permanent contracts … -0.09 -0.03 … -0.11 -0.04 Percentage of teachers with less than a bachelor's degrees … 0.09 0.48 … 0.02 0.47 Lagged test score … … .3781*** … … .3741***
N 838 838 817 838 838 817 R-squared 0.14 0.28 0.39 0.12 0.28 0.39
adj R-squared 0.14 0.25 0.36 0.11 0.26 0.37 Source: Authors’ estimations based on Combined Quantitative Dataset – School-level sample. Note: *, **, and *** indicate significance at 10%, 5% and 1 % level respectively.
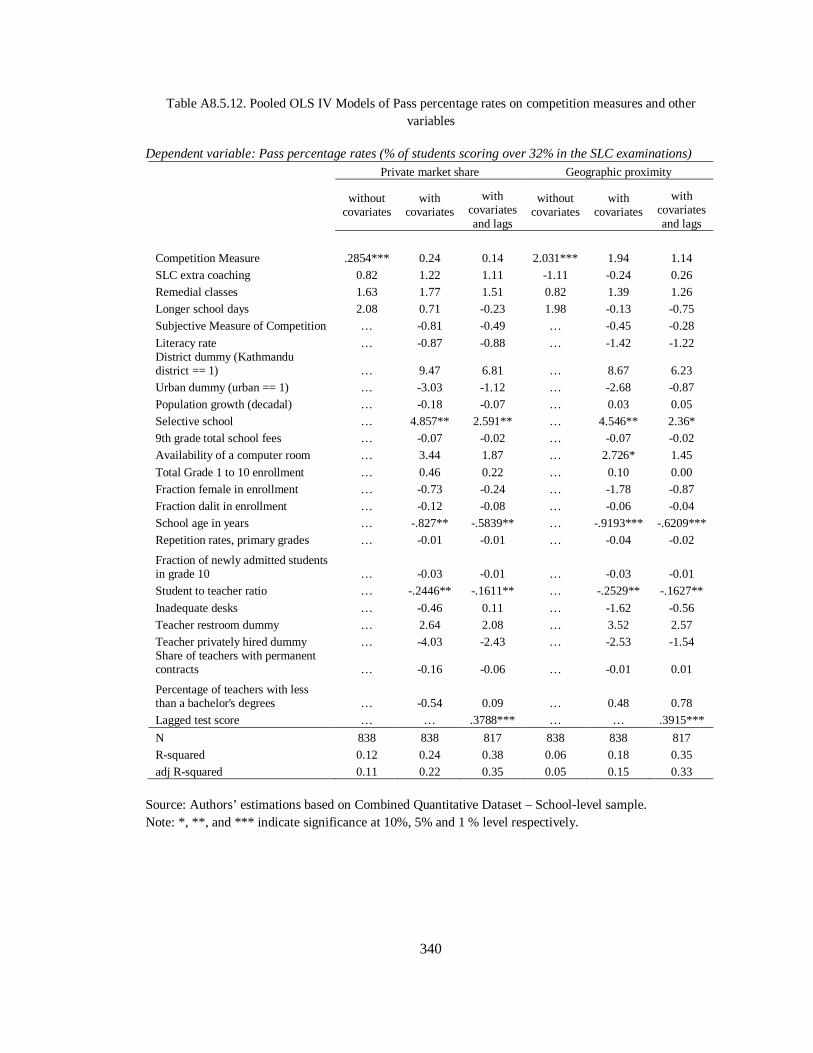
340
Table A8.5.12. Pooled OLS IV Models of Pass percentage rates on competition measures and other variables
Dependent variable: Pass percentage rates (% of students scoring over 32% in the SLC examinations)
Private market share Geographic proximity
without covariates
with covariates
with covariates and lags
without covariates
with covariates
with covariates and lags
Competition Measure .2854*** 0.24 0.14 2.031*** 1.94 1.14 SLC extra coaching 0.82 1.22 1.11 -1.11 -0.24 0.26 Remedial classes 1.63 1.77 1.51 0.82 1.39 1.26 Longer school days 2.08 0.71 -0.23 1.98 -0.13 -0.75 Subjective Measure of Competition … -0.81 -0.49 … -0.45 -0.28
Literacy rate … -0.87 -0.88 … -1.42 -1.22 District dummy (Kathmandu district == 1) … 9.47 6.81 … 8.67 6.23 Urban dummy (urban == 1) … -3.03 -1.12 … -2.68 -0.87 Population growth (decadal) … -0.18 -0.07 … 0.03 0.05 Selective school … 4.857** 2.591** … 4.546** 2.36* 9th grade total school fees … -0.07 -0.02 … -0.07 -0.02 Availability of a computer room … 3.44 1.87 … 2.726* 1.45
Total Grade 1 to 10 enrollment … 0.46 0.22 … 0.10 0.00 Fraction female in enrollment … -0.73 -0.24 … -1.78 -0.87 Fraction dalit in enrollment … -0.12 -0.08 … -0.06 -0.04 School age in years … -.827** -.5839** … -.9193*** -.6209*** Repetition rates, primary grades … -0.01 -0.01 … -0.04 -0.02
Fraction of newly admitted students in grade 10 … -0.03 -0.01 … -0.03 -0.01 Student to teacher ratio … -.2446** -.1611** … -.2529** -.1627**
Inadequate desks … -0.46 0.11 … -1.62 -0.56 Teacher restroom dummy … 2.64 2.08 … 3.52 2.57 Teacher privately hired dummy … -4.03 -2.43 … -2.53 -1.54 Share of teachers with permanent contracts … -0.16 -0.06 … -0.01 0.01
Percentage of teachers with less than a bachelor's degrees … -0.54 0.09 … 0.48 0.78 Lagged test score … … .3788*** … … .3915***
N 838 838 817 838 838 817 R-squared 0.12 0.24 0.38 0.06 0.18 0.35 adj R-squared 0.11 0.22 0.35 0.05 0.15 0.33
Source: Authors’ estimations based on Combined Quantitative Dataset – School-level sample. Note: *, **, and *** indicate significance at 10%, 5% and 1 % level respectively.

341
Table A8.5.13. Random Effects Models of Pass percentage Rates on competition measures and other variables
Dependent variable: Pass percentage rates (% of students scoring over 32% in the SLC examinations) Private market share Geographic proximity
without covariates
with covariates
with covariates and lags
without covariates
with covariates
with covariates and lags
Competition Measure .1427*** 0.00 0.02 .6074** -.5358** -.3202* SLC extra coaching 0.57 0.13 0.45 0.05 0.16 0.37 Remedial classes 1.17 0.77 1.04 0.76 0.69 0.89 Longer school days 4.65 3.27 0.22 5.05* 3.624* 0.59 Subjective Measure of Competition … 0.74 0.28 … 1.02 0.59
Literacy rate … 0.65 -0.17 … 1.16 0.27 District dummy (Kathmandu district == 1) … 14.56*** 9.032*** … 15.81*** 10.28*** Urban dummy (urban == 1) … -1.38 -0.18 … -0.98 0.20 Population growth (decadal) … 0.13 0.10 … 0.16 0.15 Selective school … 4.111** 2.415** … 4.132** 2.394** 9th grade total school fees … -0.02 0.00 … -0.02 0.00 Availability of a computer room … 1.17 1.26 … 1.14 1.08 Total Grade 1 to 10 enrollment … .6457** .4479** … .8487*** .6232*** Fraction female in enrollment … -0.76 -0.55 … -0.65 -0.53 Fraction dalit in enrollment … -0.13 -0.05 … -0.13 -0.05 School age in years … -.6857** -.5337*** … -.635** -.4986*** Repetition rates, primary grades … 0.02 0.00 … 0.02 0.00
Fraction of newly admitted students in grade 10 … 0.00 -0.01 … 0.00 -0.01 Student to teacher ratio … -.173* -.1658** … -.1739* -.1678** Inadequate desks … -0.86 0.06 … -0.55 0.23 Teacher restroom dummy … 2.16 1.73 … 1.73 1.42 Teacher privately hired dummy … -2.60 -1.48 … -2.47 -1.26 Share of teachers with permanent contracts … 0.05 -0.03 … 0.04 -0.04 Percentage of teachers with less than a bachelor's degrees … 0.72 0.48 … 0.69 0.47 Lagged test score … … .3781*** … … .3741***
N 838 838 817 838 838 817
R-squared (within) 0.21 0.21 0.07 0.21 0.21 0.07 R-squared (overall) 0.14 0.27 0.39 0.12 0.28 0.39 R-squared (between) 0.09 0.32 0.75 0.04 0.33 0.75
Source: Authors’ estimations based on Combined Quantitative Dataset – School-level sample. Note: *, **, and *** indicate significance at 10%, 5% and 1 % level respectively.
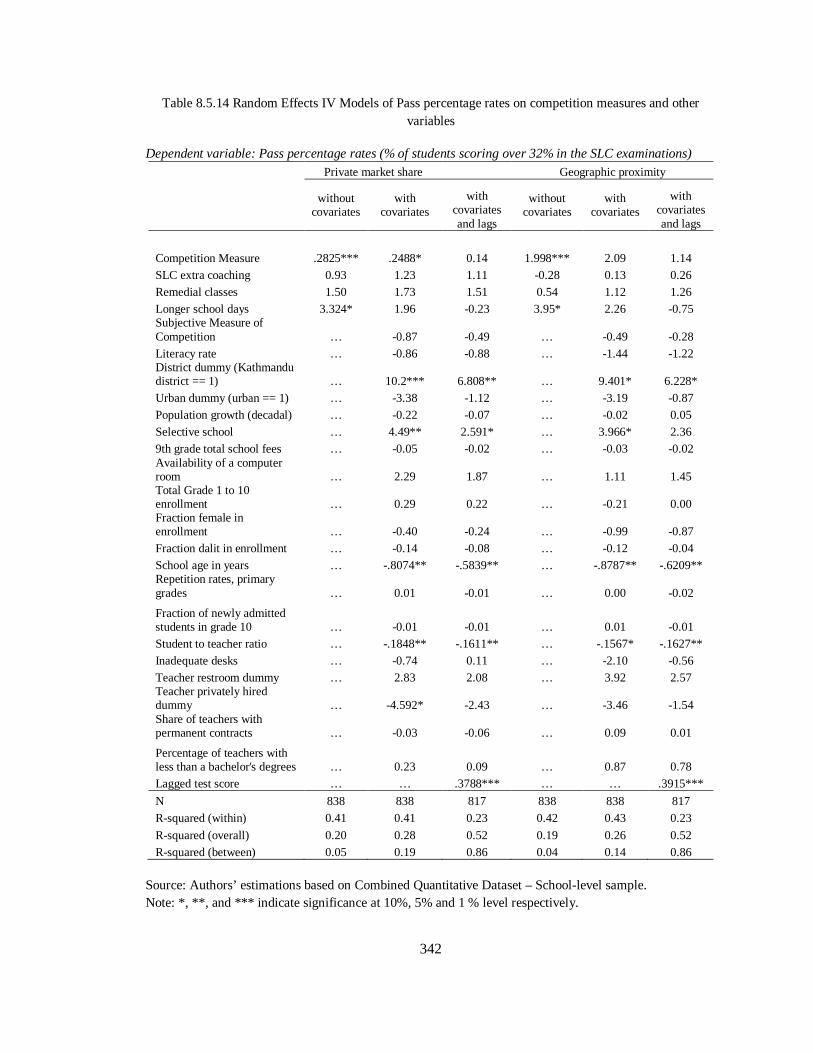
342
Table 8.5.14 Random Effects IV Models of Pass percentage rates on competition measures and other variables
Dependent variable: Pass percentage rates (% of students scoring over 32% in the SLC examinations)
Private market share Geographic proximity
without covariates
with covariates
with covariates and lags
without covariates
with covariates
with covariates and lags
Competition Measure .2825*** .2488* 0.14 1.998*** 2.09 1.14 SLC extra coaching 0.93 1.23 1.11 -0.28 0.13 0.26 Remedial classes 1.50 1.73 1.51 0.54 1.12 1.26 Longer school days 3.324* 1.96 -0.23 3.95* 2.26 -0.75 Subjective Measure of Competition … -0.87 -0.49 … -0.49 -0.28 Literacy rate … -0.86 -0.88 … -1.44 -1.22 District dummy (Kathmandu district == 1) … 10.2*** 6.808** … 9.401* 6.228* Urban dummy (urban == 1) … -3.38 -1.12 … -3.19 -0.87 Population growth (decadal) … -0.22 -0.07 … -0.02 0.05 Selective school … 4.49** 2.591* … 3.966* 2.36 9th grade total school fees … -0.05 -0.02 … -0.03 -0.02 Availability of a computer room … 2.29 1.87 … 1.11 1.45 Total Grade 1 to 10 enrollment … 0.29 0.22 … -0.21 0.00 Fraction female in enrollment … -0.40 -0.24 … -0.99 -0.87 Fraction dalit in enrollment … -0.14 -0.08 … -0.12 -0.04 School age in years … -.8074** -.5839** … -.8787** -.6209** Repetition rates, primary grades … 0.01 -0.01 … 0.00 -0.02
Fraction of newly admitted students in grade 10 … -0.01 -0.01 … 0.01 -0.01 Student to teacher ratio … -.1848** -.1611** … -.1567* -.1627** Inadequate desks … -0.74 0.11 … -2.10 -0.56 Teacher restroom dummy … 2.83 2.08 … 3.92 2.57 Teacher privately hired dummy … -4.592* -2.43 … -3.46 -1.54 Share of teachers with permanent contracts … -0.03 -0.06 … 0.09 0.01
Percentage of teachers with less than a bachelor's degrees … 0.23 0.09 … 0.87 0.78 Lagged test score … … .3788*** … … .3915***
N 838 838 817 838 838 817 R-squared (within) 0.41 0.41 0.23 0.42 0.43 0.23
R-squared (overall) 0.20 0.28 0.52 0.19 0.26 0.52 R-squared (between) 0.05 0.19 0.86 0.04 0.14 0.86
Source: Authors’ estimations based on Combined Quantitative Dataset – School-level sample. Note: *, **, and *** indicate significance at 10%, 5% and 1 % level respectively.
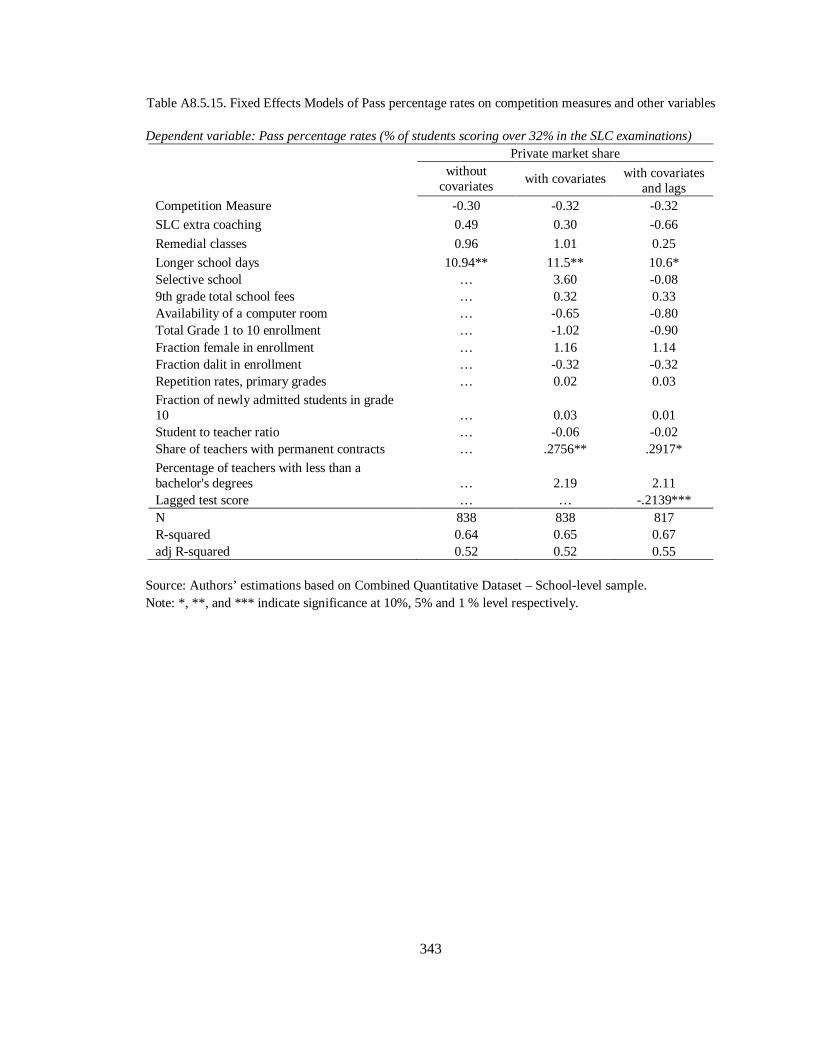
343
Table A8.5.15. Fixed Effects Models of Pass percentage rates on competition measures and other variables Dependent variable: Pass percentage rates (% of students scoring over 32% in the SLC examinations)
Private market share
without
covariates with covariates with covariates
and lags Competition Measure -0.30 -0.32 -0.32
SLC extra coaching 0.49 0.30 -0.66
Remedial classes 0.96 1.01 0.25
Longer school days 10.94** 11.5** 10.6* Selective school … 3.60 -0.08 9th grade total school fees … 0.32 0.33 Availability of a computer room … -0.65 -0.80 Total Grade 1 to 10 enrollment … -1.02 -0.90 Fraction female in enrollment … 1.16 1.14 Fraction dalit in enrollment … -0.32 -0.32 Repetition rates, primary grades … 0.02 0.03 Fraction of newly admitted students in grade 10 … 0.03 0.01 Student to teacher ratio … -0.06 -0.02 Share of teachers with permanent contracts … .2756** .2917*
Percentage of teachers with less than a bachelor's degrees … 2.19 2.11 Lagged test score … … -.2139*** N 838 838 817 R-squared 0.64 0.65 0.67 adj R-squared 0.52 0.52 0.55
Source: Authors’ estimations based on Combined Quantitative Dataset – School-level sample. Note: *, **, and *** indicate significance at 10%, 5% and 1 % level respectively.
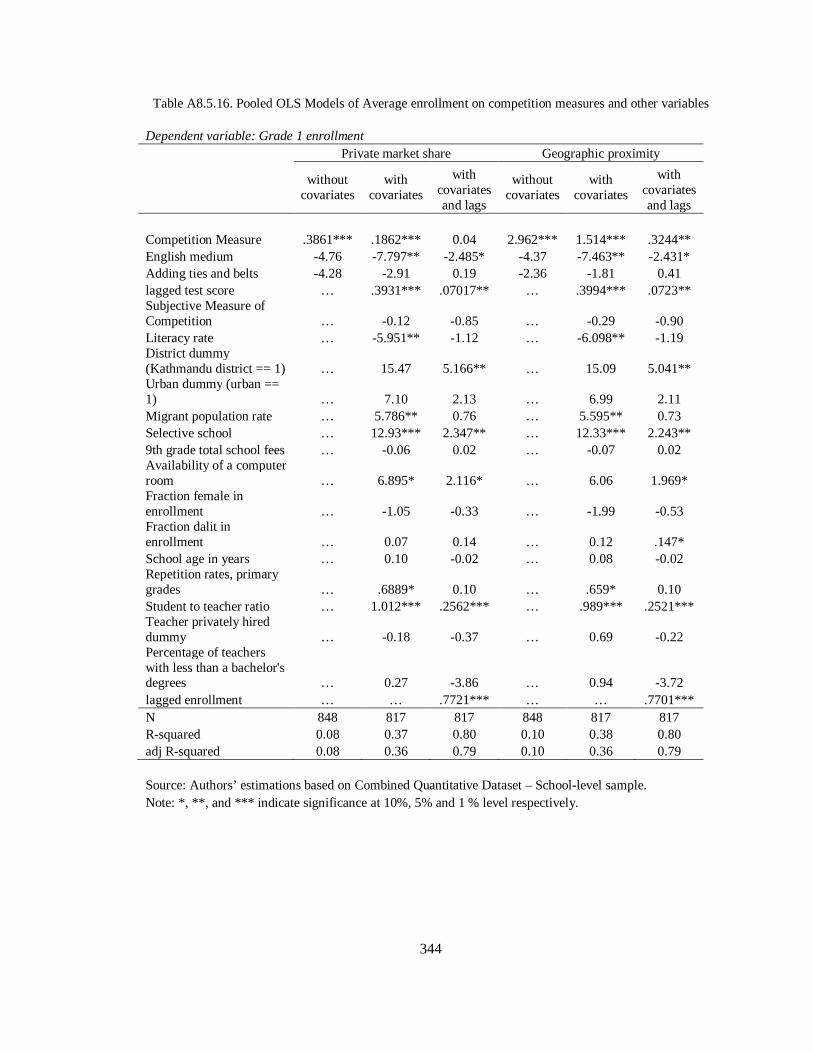
344
Table A8.5.16. Pooled OLS Models of Average enrollment on competition measures and other variables Dependent variable: Grade 1 enrollment Private market share Geographic proximity
without covariates
with covariates
with covariates and lags
without covariates
with covariates
with covariates and lags
Competition Measure .3861*** .1862*** 0.04 2.962*** 1.514*** .3244** English medium -4.76 -7.797** -2.485* -4.37 -7.463** -2.431* Adding ties and belts -4.28 -2.91 0.19 -2.36 -1.81 0.41 lagged test score … .3931*** .07017** … .3994*** .0723** Subjective Measure of Competition … -0.12 -0.85 … -0.29 -0.90 Literacy rate … -5.951** -1.12 … -6.098** -1.19 District dummy (Kathmandu district == 1) … 15.47 5.166** … 15.09 5.041** Urban dummy (urban == 1) … 7.10 2.13 … 6.99 2.11 Migrant population rate … 5.786** 0.76 … 5.595** 0.73 Selective school … 12.93*** 2.347** … 12.33*** 2.243** 9th grade total school fees … -0.06 0.02 … -0.07 0.02 Availability of a computer room … 6.895* 2.116* … 6.06 1.969* Fraction female in enrollment … -1.05 -0.33 … -1.99 -0.53 Fraction dalit in enrollment … 0.07 0.14 … 0.12 .147* School age in years … 0.10 -0.02 … 0.08 -0.02 Repetition rates, primary grades … .6889* 0.10 … .659* 0.10 Student to teacher ratio … 1.012*** .2562*** … .989*** .2521*** Teacher privately hired dummy … -0.18 -0.37 … 0.69 -0.22 Percentage of teachers with less than a bachelor's degrees … 0.27 -3.86 … 0.94 -3.72 lagged enrollment … … .7721*** … … .7701*** N 848 817 817 848 817 817 R-squared 0.08 0.37 0.80 0.10 0.38 0.80 adj R-squared 0.08 0.36 0.79 0.10 0.36 0.79 Source: Authors’ estimations based on Combined Quantitative Dataset – School-level sample. Note: *, **, and *** indicate significance at 10%, 5% and 1 % level respectively.

345
Table A8.5.17. Random effects Models of Average enrollment on competition measures and other variables
Dependent variable: Grade 1 enrollment
Private market share Geographic proximity
without covariates
with covariates
with covariates and lags
without covariates
with covariates
with covariates and lags
Competition Measure 0.15 0.05 0.04 3.031*** 2.104*** .3341** English medium -6.722** -4.828* -2.538* -6.357** -4.706* -2.478* Adding ties and belts -3.80 -5.1* 0.14 -4.43 -4.805* 0.36 lagged test score … 0.07 .07182** … 0.07 .07389** Subjective Measure of Competition … 0.28 -0.84 … -1.22 -0.90 Literacy rate … -6.414* -1.16 … -7.731** -1.23 District dummy (Kathmandu district == 1) … 16.23*** 5.24** … 12.17** 5.108** Urban dummy (urban == 1) … 2.24 2.16 … 1.17 2.13 Migrant population rate … 9.399*** 0.80 … 8.476*** 0.77 Selective school … 12.08*** 2.461** … 11.43*** 2.348** 9th grade total school fees … 0.04 0.02 … 0.02 0.02 Availability of a computer room … -0.61 2.105* … -0.52 1.958* Fraction female in enrollment … -3.96 -0.34 … -4.30 -0.54 Fraction dalit in enrollment … 0.00 0.14 … 0.05 .148* School age in years … -.93** -0.02 … -1.006** -0.02 Repetition rates, primary grades … 0.20 0.10 … 0.20 0.10 Student to teacher ratio … .3582*** .2606*** … .3336*** .2561*** Teacher privately hired dummy … 3.68 -0.37 … 2.72 -0.20 Percentage of teachers with less than a bachelor's degrees … -5.573** -3.897* … -5.526** -3.76 Lagged enrollment … … .7659*** … … .7643*** N 848 817 817 848 817 817 R-squared (within) 0.01 0.04 0.01 0.02 0.04 0.01 R-squared (overall) 0.05 0.28 0.79 0.10 0.29 0.79 R-squared (between) 0.05 0.29 0.96 0.11 0.31 0.96
Source: Authors’ estimations based on Combined Quantitative Dataset – School-level sample. Note: *, **, and *** indicate significance at 10%, 5% and 1 % level respectively.

346
Table A8.5.18. Fixed effects Models of Average enrollment on competition measures and other variables Dependent variable: Grade 1 enrollment
Private market share
without covariates
with covariates
with covariates and
lags
Competition Measure -.7112*** -.5991*** -.5463*** English medium -4.37 -3.18 -3.26 Adding ties and belts -4.23 -5.31 -5.20 lagged test score … 0.00 0.00 Selective school … 6.92 7.05 9th grade total school fees … 0.09 0.09 Availability of a computer room … -2.11 -2.02 Fraction female in enrollment … -4.79 -4.41 Fraction dalit in enrollment … 0.21 0.23 Repetition rates, primary grades … 0.08 0.08 Student to teacher ratio … 0.12 0.12 Percentage of teachers with less than a bachelor's degrees … -6.295** -6.208** lagged enrollment … … 0.08 N 848 817 817 R-squared 0.89 0.90 0.90 adj R-squared 0.85 0.86 0.86
Source: Authors’ estimations based on Combined Quantitative Dataset – School-level sample. Note: *, **, and *** indicate significance at 10%, 5% and 1 % level respectively.
347
Appendix 8.6 Detailed estimation tables of models of relative locality-level outcome measures on competition measures and other variables
This Appendix presents the detailed estimation results for all the models that were run to produce the summary table 8.9. The estimations are based on the Combined Quantitative Dataset, locality-level sample.
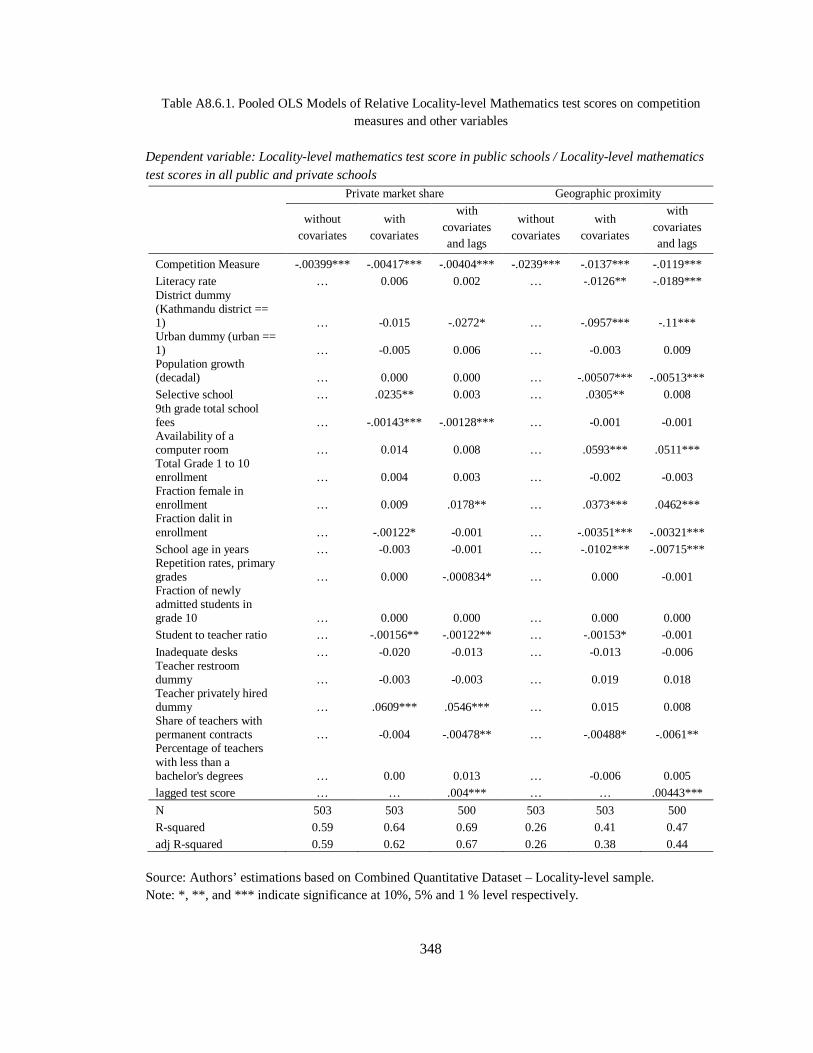
348
Table A8.6.1. Pooled OLS Models of Relative Locality-level Mathematics test scores on competition measures and other variables
Dependent variable: Locality-level mathematics test score in public schools / Locality-level mathematics test scores in all public and private schools
Private market share Geographic proximity
without covariates
with covariates
with covariates and lags
without covariates
with covariates
with covariates and lags
Competition Measure -.00399*** -.00417*** -.00404*** -.0239*** -.0137*** -.0119*** Literacy rate … 0.006 0.002 … -.0126** -.0189*** District dummy (Kathmandu district == 1) … -0.015 -.0272* … -.0957*** -.11*** Urban dummy (urban == 1) … -0.005 0.006 … -0.003 0.009 Population growth (decadal) … 0.000 0.000 … -.00507*** -.00513*** Selective school … .0235** 0.003 … .0305** 0.008 9th grade total school fees … -.00143*** -.00128*** … -0.001 -0.001 Availability of a computer room … 0.014 0.008 … .0593*** .0511*** Total Grade 1 to 10 enrollment … 0.004 0.003 … -0.002 -0.003 Fraction female in enrollment … 0.009 .0178** … .0373*** .0462*** Fraction dalit in enrollment … -.00122* -0.001 … -.00351*** -.00321*** School age in years … -0.003 -0.001 … -.0102*** -.00715*** Repetition rates, primary grades … 0.000 -.000834* … 0.000 -0.001 Fraction of newly admitted students in grade 10 … 0.000 0.000 … 0.000 0.000 Student to teacher ratio … -.00156** -.00122** … -.00153* -0.001
Inadequate desks … -0.020 -0.013 … -0.013 -0.006 Teacher restroom dummy … -0.003 -0.003 … 0.019 0.018 Teacher privately hired dummy … .0609*** .0546*** … 0.015 0.008 Share of teachers with permanent contracts … -0.004 -.00478** … -.00488* -.0061** Percentage of teachers with less than a bachelor's degrees … 0.00 0.013 … -0.006 0.005 lagged test score … … .004*** … … .00443***
N 503 503 500 503 503 500 R-squared 0.59 0.64 0.69 0.26 0.41 0.47 adj R-squared 0.59 0.62 0.67 0.26 0.38 0.44
Source: Authors’ estimations based on Combined Quantitative Dataset – Locality-level sample. Note: *, **, and *** indicate significance at 10%, 5% and 1 % level respectively.
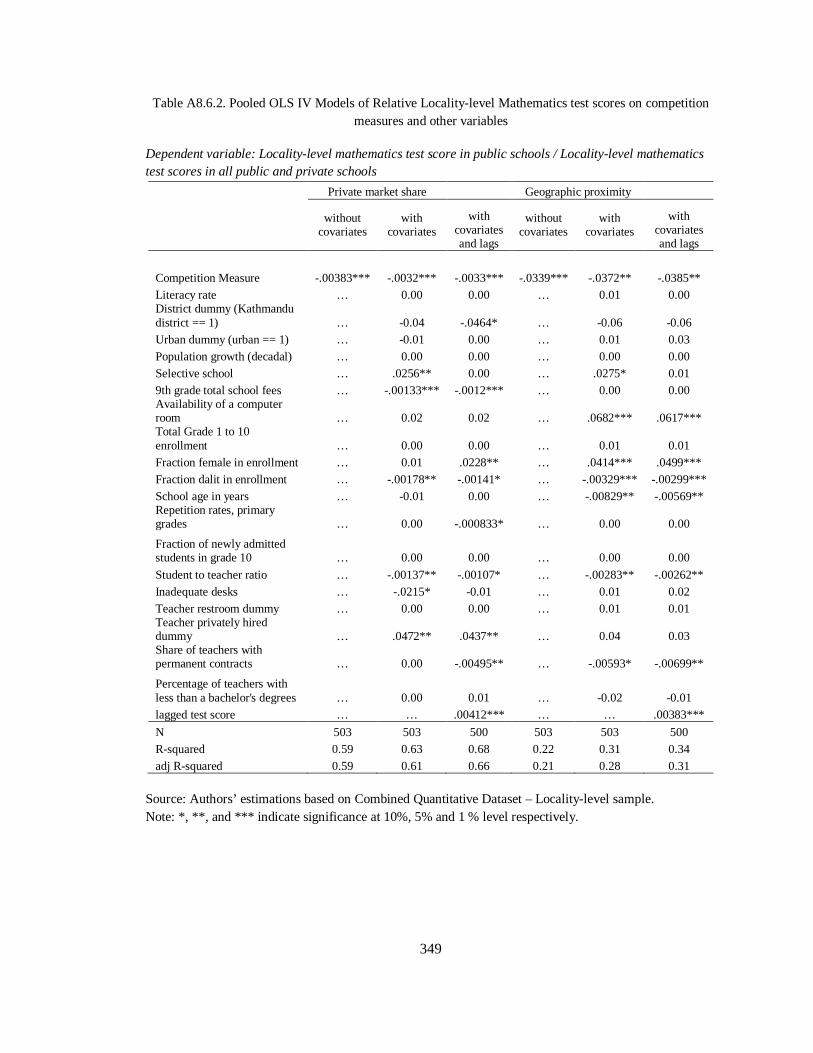
349
Table A8.6.2. Pooled OLS IV Models of Relative Locality-level Mathematics test scores on competition measures and other variables
Dependent variable: Locality-level mathematics test score in public schools / Locality-level mathematics test scores in all public and private schools
Private market share Geographic proximity
without covariates
with covariates
with covariates and lags
without covariates
with covariates
with covariates and lags
Competition Measure -.00383*** -.0032*** -.0033*** -.0339*** -.0372** -.0385** Literacy rate … 0.00 0.00 … 0.01 0.00 District dummy (Kathmandu district == 1) … -0.04 -.0464* … -0.06 -0.06 Urban dummy (urban == 1) … -0.01 0.00 … 0.01 0.03 Population growth (decadal) … 0.00 0.00 … 0.00 0.00 Selective school … .0256** 0.00 … .0275* 0.01 9th grade total school fees … -.00133*** -.0012*** … 0.00 0.00 Availability of a computer room … 0.02 0.02 … .0682*** .0617*** Total Grade 1 to 10 enrollment … 0.00 0.00 … 0.01 0.01 Fraction female in enrollment … 0.01 .0228** … .0414*** .0499*** Fraction dalit in enrollment … -.00178** -.00141* … -.00329*** -.00299*** School age in years … -0.01 0.00 … -.00829** -.00569** Repetition rates, primary grades … 0.00 -.000833* … 0.00 0.00
Fraction of newly admitted students in grade 10 … 0.00 0.00 … 0.00 0.00
Student to teacher ratio … -.00137** -.00107* … -.00283** -.00262** Inadequate desks … -.0215* -0.01 … 0.01 0.02 Teacher restroom dummy … 0.00 0.00 … 0.01 0.01 Teacher privately hired dummy … .0472** .0437** … 0.04 0.03 Share of teachers with permanent contracts … 0.00 -.00495** … -.00593* -.00699**
Percentage of teachers with less than a bachelor's degrees … 0.00 0.01 … -0.02 -0.01 lagged test score … … .00412*** … … .00383***
N 503 503 500 503 503 500 R-squared 0.59 0.63 0.68 0.22 0.31 0.34 adj R-squared 0.59 0.61 0.66 0.21 0.28 0.31
Source: Authors’ estimations based on Combined Quantitative Dataset – Locality-level sample. Note: *, **, and *** indicate significance at 10%, 5% and 1 % level respectively.

350
Table A8.6.3. Random Effects Models of Relative Locality-level Mathematics test scores on competition measures and other variables
Dependent variable: Locality-level mathematics test score in public schools / Locality-level mathematics test scores in all public and private schools
Private market share Geographic proximity
without covariates
with covariates
with covariates and lags
without covariates
with covariates
with covariates and lags
Competition Measure -.00382*** -.00375*** -.00385*** -.024*** -.012*** -.012*** Literacy rate … 0.00 0.00 … -.0169* -.0167* District dummy (Kathmandu district == 1) … -0.03 -0.03 … -.0784*** -.0801*** Urban dummy (urban == 1) … -0.01 0.00 … -0.01 -0.01 Population growth (decadal) … 0.00 0.00 … -.00546** -.00545**
Selective school … 0.02 0.01 … 0.01 0.01 9th grade total school fees … 0.00 0.00 … 0.00 0.00 Availability of a computer room … -0.01 0.00 … 0.00 0.00 Total Grade 1 to 10 enrollment … 0.00 0.00 … 0.00 0.00 Fraction female in enrollment … 0.01 0.01 … 0.02 0.02
Fraction dalit in enrollment … 0.00 0.00 … -.00219* -.00228* School age in years … 0.00 0.00 … -.00942* -.00931* Repetition rates, primary grades … 0.00 0.00 … 0.00 0.00
Fraction of newly admitted students in grade 10 … 0.00 0.00 … 0.00 0.00 Student to teacher ratio … 0.00 0.00 … 0.00 0.00 Inadequate desks … -0.02 -0.02 … -0.02 -0.02
Teacher restroom dummy … 0.00 0.00 … 0.03 0.03 Teacher privately hired dummy … .056** .057** … 0.01 0.01 Share of teachers with permanent contracts … 0.00 0.00 … 0.00 0.00 Percentage of teachers with less than a bachelor's degrees … -0.01 0.00 … -0.01 -0.01
lagged test score … … .00141*** … … 0.00
N 503 503 500 503 503 500 R-squared (within) 0.04 0.05 0.02 0.05 0.07 0.06 R-squared (overall) 0.59 0.63 0.66 0.26 0.37 0.39 R-squared (between) 0.68 0.71 0.76 0.30 0.42 0.44
Source: Authors’ estimations based on Combined Quantitative Dataset – Locality-level sample. Note: *, **, and *** indicate significance at 10%, 5% and 1 % level respectively.

351
Table A8.6.4. Random Effects IV Models of Relative Locality-level Mathematics test scores on competition measures and other variables
Dependent variable: Locality-level mathematics test score in public schools / Locality-level mathematics test scores in all public and private schools
Private market share Geographic proximity
without covariates
with covariates
with covariates and lags
without covariates
with covariates
with covariates and lags
Competition Measure -.00383*** -.00328*** -.00328*** -.0339*** -.0418** -.042** Literacy rate … -0.001 -0.003 … 0.008 0.008 District dummy (Kathmandu district == 1) … -0.036 -0.040 … -0.025 -0.024 Urban dummy (urban == 1) … -0.009 -0.004 … 0.014 0.014 Population growth (decadal) … -0.001 -0.001 … -0.001 -0.001 Selective school … 0.017 0.013 … 0.011 0.012 9th grade total school fees … 0.000 -0.001 … 0.001 0.001 Availability of a computer room … -0.003 0.002 … -0.001 0.001 Total Grade 1 to 10 enrollment … -0.001 -0.001 … 0.003 0.004 Fraction female in enrollment … 0.010 0.015 … 0.019 0.019 Fraction dalit in enrollment … -0.002 -0.001 … -.00212* -.00217*
School age in years … -0.005 -0.004 … -0.006 -0.006 Repetition rates, primary grades … -0.001 -0.001 … 0.000 0.000 Fraction of newly admitted students in grade 10 … 0.000 0.000 … 0.000 0.000 Student to teacher ratio … -0.001 -0.001 … -0.001 -0.001 Inadequate desks … -0.025 -0.020 … 0.000 0.000 Teacher restroom dummy … 0.007 0.005 … 0.021 0.021 Teacher privately hired dummy … .0485* .0477** … 0.041 0.042 Share of teachers with permanent contracts … -0.001 -0.002 … -0.001 -0.001 Percentage of teachers with less than a bachelor's degrees … -0.009 -0.002 … -0.013 -0.014
lagged test score … … .00174*** … … 0.000
N 503 503 500 503 503 500 R-squared (within) 0.04 0.05 0.02 0.05 0.06 0.06 R-squared (overall) 0.59 0.62 0.66 0.26 0.29 0.29 R-squared (between) 0.68 0.71 0.76 0.30 0.33 0.33
Source: Authors’ estimations based on Combined Quantitative Dataset – Locality-level sample. Note: *, **, and *** indicate significance at 10%, 5% and 1 % level respectively.

352
Table A8.6.5. Fixed Effects Models of Relative Locality-level Mathematics test scores on competition measures and other variables
Dependent variable: Locality-level mathematics test score in public schools / Locality-level mathematics test scores in all public and private schools
Private market share
without covariates
with covariates
with covariates and lags
Competition Measure -0.001 -0.001 -0.001 Selective school … -0.009 -0.017 9th grade total school fees … 0.003 0.003 Availability of a computer room … -0.021 -0.022 Total Grade 1 to 10 enrollment … -0.007 -0.007 Fraction female in enrollment … -0.001 -0.007 Fraction dalit in enrollment … -0.001 -0.002 Repetition rates, primary grades … -0.001 -0.001
Fraction of newly admitted students in grade 10 … 0.000 0.000 Student to teacher ratio … 0.000 0.000 Share of teachers with permanent contracts … -0.001 -0.001
Percentage of teachers with less than a bachelor's degrees … -0.010 -0.015 lagged test score … … -.00133** N 503 503 500 R-squared 0.88 0.88 0.89 adj R-squared 0.84 0.84 0.84
Source: Authors’ estimations based on Combined Quantitative Dataset – Locality-level sample. Note: *, **, and *** indicate significance at 10%, 5% and 1 % level respectively.
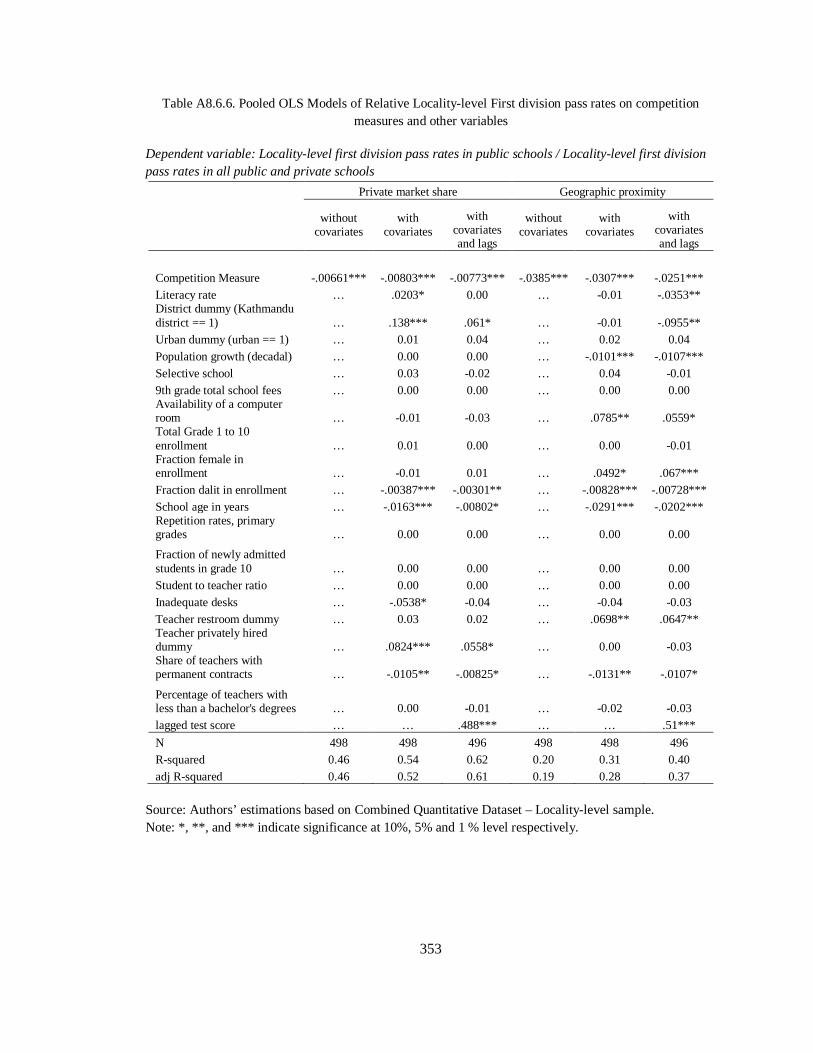
353
Table A8.6.6. Pooled OLS Models of Relative Locality-level First division pass rates on competition measures and other variables
Dependent variable: Locality-level first division pass rates in public schools / Locality-level first division pass rates in all public and private schools
Private market share Geographic proximity
without covariates
with covariates
with covariates and lags
without covariates
with covariates
with covariates and lags
Competition Measure -.00661*** -.00803*** -.00773*** -.0385*** -.0307*** -.0251*** Literacy rate … .0203* 0.00 … -0.01 -.0353** District dummy (Kathmandu district == 1) … .138*** .061* … -0.01 -.0955** Urban dummy (urban == 1) … 0.01 0.04 … 0.02 0.04 Population growth (decadal) … 0.00 0.00 … -.0101*** -.0107*** Selective school … 0.03 -0.02 … 0.04 -0.01 9th grade total school fees … 0.00 0.00 … 0.00 0.00 Availability of a computer room … -0.01 -0.03 … .0785** .0559* Total Grade 1 to 10 enrollment … 0.01 0.00 … 0.00 -0.01 Fraction female in enrollment … -0.01 0.01 … .0492* .067*** Fraction dalit in enrollment … -.00387*** -.00301** … -.00828*** -.00728*** School age in years … -.0163*** -.00802* … -.0291*** -.0202*** Repetition rates, primary grades … 0.00 0.00 … 0.00 0.00
Fraction of newly admitted students in grade 10 … 0.00 0.00 … 0.00 0.00 Student to teacher ratio … 0.00 0.00 … 0.00 0.00 Inadequate desks … -.0538* -0.04 … -0.04 -0.03 Teacher restroom dummy … 0.03 0.02 … .0698** .0647** Teacher privately hired dummy … .0824*** .0558* … 0.00 -0.03 Share of teachers with permanent contracts … -.0105** -.00825* … -.0131** -.0107*
Percentage of teachers with less than a bachelor's degrees … 0.00 -0.01 … -0.02 -0.03 lagged test score … … .488*** … … .51***
N 498 498 496 498 498 496 R-squared 0.46 0.54 0.62 0.20 0.31 0.40 adj R-squared 0.46 0.52 0.61 0.19 0.28 0.37
Source: Authors’ estimations based on Combined Quantitative Dataset – Locality-level sample. Note: *, **, and *** indicate significance at 10%, 5% and 1 % level respectively.

354
Table A8.6.7. Pooled OLS IV Models of Relative Locality-level First division pass rates on competition measures and other variables
Dependent variable: Locality-level first division pass rates in public schools / Locality-level first division pass rates in all public and private schools
Private market share Geographic proximity
without covariates
with covariates
with covariates and lags
without covariates
with covariates
with covariates and lags
Competition Measure -.00561*** -.00782*** -.00751*** -.0494*** -.0945** -.0915** Literacy rate … 0.019 0.000 … 0.043 0.028 District dummy (Kathmandu district == 1) … .133** 0.055 … 0.117 0.054 Urban dummy (urban == 1) … 0.009 0.036 … 0.056 .0768** Population growth (decadal) … -0.001 -0.001 … -0.002 -0.002 Selective school … 0.026 -0.017 … 0.030 -0.007 9th grade total school fees … -0.001 -0.001 … 0.000 0.000 Availability of a computer room … -0.009 -0.026 … .101*** .0825** Total Grade 1 to 10 enrollment … 0.005 0.002 … 0.026 0.024 Fraction female in enrollment … -0.006 0.015 … .0661** .0809*** Fraction dalit in enrollment … -.004** -.00314* … -.00745*** -.00668*** School age in years … -.0166*** -0.008 … -.0254*** -.0185*** Repetition rates, primary grades … 0.001 -0.001 … 0.003 0.001 Fraction of newly admitted students in grade 10 … 0.000 0.000 … -0.001 -0.001 Student to teacher ratio … -0.001 0.000 … -0.004 -0.004 Inadequate desks … -.054* -0.040 … 0.020 0.030 Teacher restroom dummy … 0.031 0.026 … 0.051 0.045 Teacher privately hired dummy … .0792* 0.053 … 0.070 0.048 Share of teachers with permanent contracts … -.0105** -.0083* … -.0144** -.0124* Percentage of teachers with less than a bachelor's degrees … -0.002 -0.008 … -0.061 -0.066 lagged test score … … .49*** … … .409***
N 498 498 496 498 498 496
R-squared 0.45 0.54 0.62 0.19 0.11 0.18 adj R-squared 0.45 0.52 0.61 0.18 0.07 0.14
Source: Authors’ estimations based on Combined Quantitative Dataset – Locality-level sample. Note: *, **, and *** indicate significance at 10%, 5% and 1 % level respectively.
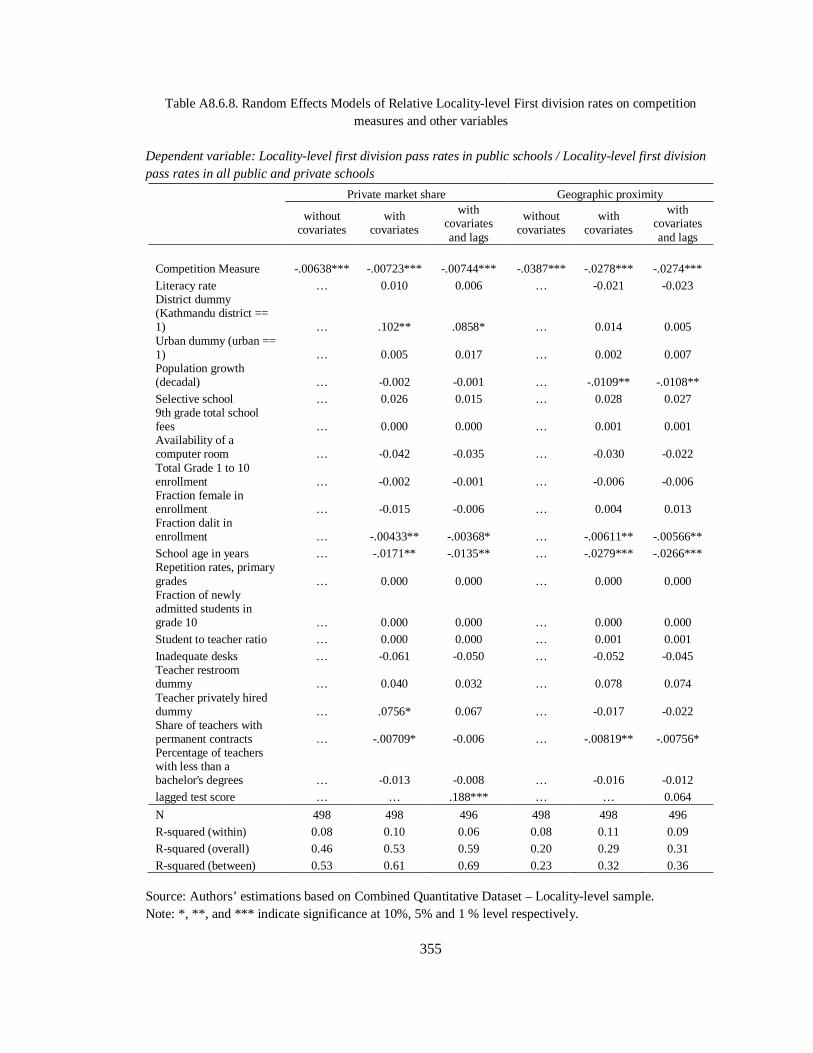
355
Table A8.6.8. Random Effects Models of Relative Locality-level First division rates on competition measures and other variables
Dependent variable: Locality-level first division pass rates in public schools / Locality-level first division pass rates in all public and private schools
Private market share Geographic proximity
without covariates
with covariates
with covariates and lags
without covariates
with covariates
with covariates and lags
Competition Measure -.00638*** -.00723*** -.00744*** -.0387*** -.0278*** -.0274*** Literacy rate … 0.010 0.006 … -0.021 -0.023 District dummy (Kathmandu district == 1) … .102** .0858* … 0.014 0.005 Urban dummy (urban == 1) … 0.005 0.017 … 0.002 0.007 Population growth (decadal) … -0.002 -0.001 … -.0109** -.0108** Selective school … 0.026 0.015 … 0.028 0.027 9th grade total school fees … 0.000 0.000 … 0.001 0.001 Availability of a computer room … -0.042 -0.035 … -0.030 -0.022 Total Grade 1 to 10 enrollment … -0.002 -0.001 … -0.006 -0.006 Fraction female in enrollment … -0.015 -0.006 … 0.004 0.013 Fraction dalit in enrollment … -.00433** -.00368* … -.00611** -.00566** School age in years … -.0171** -.0135** … -.0279*** -.0266*** Repetition rates, primary grades … 0.000 0.000 … 0.000 0.000 Fraction of newly admitted students in grade 10 … 0.000 0.000 … 0.000 0.000 Student to teacher ratio … 0.000 0.000 … 0.001 0.001 Inadequate desks … -0.061 -0.050 … -0.052 -0.045 Teacher restroom dummy … 0.040 0.032 … 0.078 0.074 Teacher privately hired dummy … .0756* 0.067 … -0.017 -0.022 Share of teachers with permanent contracts … -.00709* -0.006 … -.00819** -.00756* Percentage of teachers with less than a bachelor's degrees … -0.013 -0.008 … -0.016 -0.012 lagged test score … … .188*** … … 0.064
N 498 498 496 498 498 496 R-squared (within) 0.08 0.10 0.06 0.08 0.11 0.09 R-squared (overall) 0.46 0.53 0.59 0.20 0.29 0.31 R-squared (between) 0.53 0.61 0.69 0.23 0.32 0.36
Source: Authors’ estimations based on Combined Quantitative Dataset – Locality-level sample. Note: *, **, and *** indicate significance at 10%, 5% and 1 % level respectively.

356
Table A8.6.9. Random Effects IV Models of Relative Locality-level First division pass rates on competition measures and other variables
Dependent variable: Locality-level first division pass rates in public schools / Locality-level first division pass rates in all public and private schools
Private market share Geographic proximity
without covariates
with covariates
with covariates and
lags
without covariates
with covariates
with covariates and lags
Competition Measure -.00563*** -.00768*** -.0076*** -.0496*** -.0983** -.0975** Literacy rate … 0.014 0.007 … 0.046 0.045 District dummy (Kathmandu district == 1) … 0.115 0.087 … 0.153 0.160 Urban dummy (urban == 1) … 0.006 0.020 … 0.053 0.054 Population growth (decadal) … -0.001 -0.001 … -0.002 -0.002 Selective school … 0.026 0.012 … 0.028 0.028 9th grade total school fees … 0.000 -0.001 … 0.001 0.001 Availability of a computer room … -0.041 -0.033 … -0.027 -0.022 Total Grade 1 to 10 enrollment … -0.001 0.000 … 0.010 0.011 Fraction female in enrollment … -0.015 -0.005 … 0.008 0.015 Fraction dalit in enrollment … -.00416* -.00359* … -.00581** -.00519** School age in years … -.0164* -.0128* … -0.021 -.0212* Repetition rates, primary grades … 0.000 0.000 … 0.000 0.000
Fraction of newly admitted students in grade 10 … 0.000 0.000 … 0.000 0.000 Student to teacher ratio … 0.000 0.000 … 0.000 0.000 Inadequate desks … -0.060 -0.049 … -0.012 -0.006 Teacher restroom dummy … 0.037 0.030 … 0.069 0.066 Teacher privately hired dummy … 0.083 0.068 … 0.084 0.078 Share of teachers with permanent contracts … -.00708* -0.006 … -.00749* -.00712* Percentage of teachers with less than a bachelor's degrees … -0.012 -0.007 … -0.017 -0.015 lagged test score … … .218*** … … -0.007
N 498 498 496 498 498 496 R-squared (within) 0.08 0.10 0.06 0.08 0.10 0.10 R-squared (overall) 0.46 0.53 0.60 0.20 0.21 0.21 R-squared (between) 0.53 0.62 0.70 0.22 0.23 0.24
Source: Authors’ estimations based on Combined Quantitative Dataset – Locality-level sample. Note: *, **, and *** indicate significance at 10%, 5% and 1 % level respectively.

357
Table A8.6.10. Fixed Effects Models of Relative Locality-level First division pass rates on competition measures and other variables
Dependent variable: Locality-level first division pass rates in public schools / Locality-level first division pass rates in all public and private schools
Private market share
without
covariates with covariates with covariates
and lags Competition Measure 0.00 -0.003 -0.003 Selective school … 0.026 0.017 9th grade total school fees … 0.004 0.004 Availability of a computer room … -.063* -.0657** Total Grade 1 to 10 enrollment … -0.013 -0.013 Fraction female in enrollment … -0.031 -0.025 Fraction dalit in enrollment … -0.005 -0.003 Repetition rates, primary grades … 0.000 0.000 Fraction of newly admitted students in grade 10 … 0.000 0.000 Student to teacher ratio … 0.001 0.002 Share of teachers with permanent contracts … -.00775* -.00809*
Percentage of teachers with less than a bachelor's degrees … -0.012 -0.011 lagged test score … … -.137* N 498 498 496 R-squared 0.86 0.86 0.87 adj R-squared 0.81 0.81 0.82
Source: Authors’ estimations based on Combined Quantitative Dataset – Locality-level sample. Note: *, **, and *** indicate significance at 10%, 5% and 1 % level respectively.
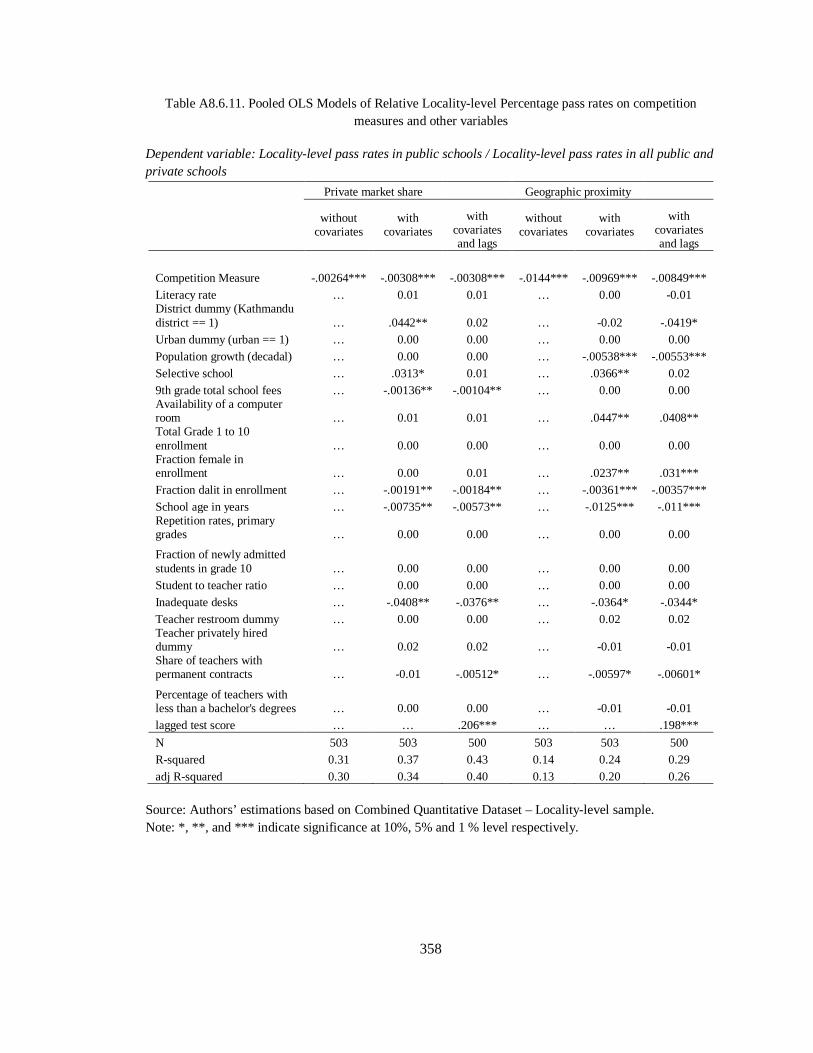
358
Table A8.6.11. Pooled OLS Models of Relative Locality-level Percentage pass rates on competition measures and other variables
Dependent variable: Locality-level pass rates in public schools / Locality-level pass rates in all public and private schools
Private market share Geographic proximity
without covariates
with covariates
with covariates and lags
without covariates
with covariates
with covariates and lags
Competition Measure -.00264*** -.00308*** -.00308*** -.0144*** -.00969*** -.00849*** Literacy rate … 0.01 0.01 … 0.00 -0.01 District dummy (Kathmandu district == 1) … .0442** 0.02 … -0.02 -.0419* Urban dummy (urban == 1) … 0.00 0.00 … 0.00 0.00 Population growth (decadal) … 0.00 0.00 … -.00538*** -.00553*** Selective school … .0313* 0.01 … .0366** 0.02 9th grade total school fees … -.00136** -.00104** … 0.00 0.00 Availability of a computer room … 0.01 0.01 … .0447** .0408** Total Grade 1 to 10 enrollment … 0.00 0.00 … 0.00 0.00 Fraction female in enrollment … 0.00 0.01 … .0237** .031*** Fraction dalit in enrollment … -.00191** -.00184** … -.00361*** -.00357*** School age in years … -.00735** -.00573** … -.0125*** -.011*** Repetition rates, primary grades … 0.00 0.00 … 0.00 0.00
Fraction of newly admitted students in grade 10 … 0.00 0.00 … 0.00 0.00 Student to teacher ratio … 0.00 0.00 … 0.00 0.00 Inadequate desks … -.0408** -.0376** … -.0364* -.0344* Teacher restroom dummy … 0.00 0.00 … 0.02 0.02 Teacher privately hired dummy … 0.02 0.02 … -0.01 -0.01 Share of teachers with permanent contracts … -0.01 -.00512* … -.00597* -.00601*
Percentage of teachers with less than a bachelor's degrees … 0.00 0.00 … -0.01 -0.01 lagged test score … … .206*** … … .198***
N 503 503 500 503 503 500 R-squared 0.31 0.37 0.43 0.14 0.24 0.29 adj R-squared 0.30 0.34 0.40 0.13 0.20 0.26
Source: Authors’ estimations based on Combined Quantitative Dataset – Locality-level sample. Note: *, **, and *** indicate significance at 10%, 5% and 1 % level respectively.

359
Table A8.6.12. Pooled OLS IV Models of Relative Locality-level pass percentage rates on competition measures and other variables
Dependent variable: Locality-level pass rates in public schools / Locality-level pass rates in all public and private schools
Private market share Geographic proximity
without covariates
with covariates
with covariates and lags
without covariates
with covariates
with covariates and lags
Competition Measure -.00178*** -0.002 -.00175* -.0158*** -0.018 -0.020 Literacy rate … -0.001 -0.003 … 0.002 0.001 District dummy (Kathmandu district == 1) … 0.006 -0.013 … -0.002 -0.020 Urban dummy (urban == 1) … -0.004 0.001 … 0.006 0.012 Population growth (decadal) … -0.004 -0.004 … -0.004 -0.004
Selective school … .0346** 0.014 … .0355** 0.017 9th grade total school fees … -.0012** -0.001 … -0.001 -0.001 Availability of a computer room … 0.026 0.021 … .0478** .0453** Total Grade 1 to 10 enrollment … 0.000 0.001 … 0.004 0.005 Fraction female in enrollment … 0.012 .0187* … .0251** .0328***
Fraction dalit in enrollment … -.00281*** -.00262*** … -.00353*** -.00345*** School age in years … -.0103*** -.00822** … -.0118*** -.0102*** Repetition rates, primary grades … 0.000 0.000 … 0.001 0.000
Fraction of newly admitted students in grade 10 … 0.000 0.000 … 0.000 0.000 Student to teacher ratio … 0.000 0.000 … -0.001 -0.001 Inadequate desks … -.0436** -.0398** … -0.028 -0.023
Teacher restroom dummy … 0.014 0.010 … 0.017 0.015 Teacher privately hired dummy … 0.000 0.002 … -0.005 -0.003 Share of teachers with permanent contracts … -.00532* -.00536* … -.00633* -.00648*
Percentage of teachers with less than a bachelor's degrees … -0.002 0.001 … -0.013 -0.013 lagged test score … … .206*** … … .188***
N 503 503 500 503 503 500 R-squared 0.28 0.33 0.40 0.14 0.23 0.27 adj R-squared 0.28 0.30 0.37 0.13 0.19 0.23
Source: Authors’ estimations based on Combined Quantitative Dataset – Locality-level sample. Note: *, **, and *** indicate significance at 10%, 5% and 1 % level respectively.

360
Table A8.6.13. Random Effects Models of Relative Locality-level Pass rates on competition measures and other variables
Dependent variable: Locality-level pass rates in public schools / Locality-level pass rates in all public and private schools
Private market share Geographic proximity
without covariates
with covariates
with covariates and lags
without covariates
with covariates
with covariates and lags
Competition Measure -.00264*** -.00299*** -.00304*** -.0145*** -0.01 -.00748* Literacy rate … 0.01 0.01 … 0.00 0.00 District dummy (Kathmandu district == 1) … .055* 0.04 … 0.01 0.00 Urban dummy (urban == 1) … 0.00 0.00 … -0.01 0.00 Population growth (decadal) … 0.00 0.00 … -.00628** -.00609** Selective school … 0.03 0.02 … 0.03 0.03 9th grade total school fees … 0.00 -.00121* … 0.00 0.00 Availability of a computer room … -0.01 0.00 … 0.00 0.01 Total Grade 1 to 10 enrollment … 0.00 0.00 … 0.00 0.00 Fraction female in enrollment … 0.00 0.01 … 0.01 0.02 Fraction dalit in enrollment … -.00218* -.00201** … -.00338** -.00347*** School age in years … -0.01 -0.01 … -.0121** -.0119** Repetition rates, primary grades … 0.00 0.00 … 0.00 0.00 Fraction of newly admitted students in grade 10 … 0.00 0.00 … 0.00 0.00 Student to teacher ratio … 0.00 0.00 … 0.00 0.00 Inadequate desks … -.0468* -.0435* … -0.05 -0.05 Teacher restroom dummy … 0.01 0.01 … 0.03 0.03 Teacher privately hired dummy … 0.02 0.02 … -0.01 -0.01 Share of teachers with permanent contracts … 0.00 0.00 … 0.00 0.00 Percentage of teachers with less than a bachelor's degrees … 0.01 0.00 … 0.00 0.00 lagged test score … … .106*** … … 0.04
N 503 503 500 503 503 500
R-squared (within) 0.13 0.15 0.10 0.12 0.15 0.13 R-squared (overall) 0.31 0.36 0.41 0.14 0.22 0.25 R-squared (between) 0.41 0.48 0.59 0.15 0.26 0.31
Source: Authors’ estimations based on Combined Quantitative Dataset – Locality-level sample. Note: *, **, and *** indicate significance at 10%, 5% and 1 % level respectively.

361
Table A8.6.14. Random Effects IV Models of Relative Locality-level Pass percentage rates on competition measures and other variables
Dependent variable: Locality-level pass rates in public schools / Locality-level pass rates in all public and private schools
Private market share Geographic proximity
without covariates
with covariates
with covariates and lags
without covariates
with covariates
with covariates and lags
Competition Measure -.00179*** -0.002 -0.002 -.0158** -0.018 -0.019 Literacy rate … 0.001 -0.002 … 0.005 0.005 District dummy (Kathmandu district == 1) … 0.019 -0.005 … 0.026 0.020 Urban dummy (urban == 1) … -0.006 -0.001 … 0.003 0.004 Population growth (decadal) … -0.004 -0.004 … -0.005 -0.005 Selective school … .0325* 0.020 … 0.032 0.032 9th grade total school fees … -0.001 -0.001 … -0.001 -0.001 Availability of a computer room … 0.004 0.016 … 0.002 0.009 Total Grade 1 to 10 enrollment … -0.002 0.000 … -0.001 0.001 Fraction female in enrollment … 0.009 0.016 … 0.015 0.017 Fraction dalit in enrollment … -.0028** -.00268** … -.00333** -.0034** School age in years … -.0101** -.00871** … -.0111** -.0109** Repetition rates, primary grades … 0.000 0.000 … 0.000 0.000 Fraction of newly admitted students in grade 10 … 0.000 0.000 … 0.000 0.000
Student to teacher ratio … 0.001 0.000 … 0.001 0.001 Inadequate desks … -.0483** -.0431** … -0.038 -0.038 Teacher restroom dummy … 0.017 0.012 … 0.024 0.024 Teacher privately hired dummy … 0.001 0.003 … -0.003 -0.001 Share of teachers with permanent contracts … -0.004 -0.005 … -0.003 -0.004 Percentage of teachers with less than a bachelor's degrees … 0.004 0.002 … 0.003 0.000 lagged test score … … .152*** … … 0.026
N 503 503 500 503 503 500 R-squared (within) 0.13 0.14 0.07 0.12 0.14 0.13 R-squared (overall) 0.30 0.33 0.40 0.14 0.21 0.22 R-squared (between) 0.41 0.43 0.61 0.15 0.25 0.28
Source: Authors’ estimations based on Combined Quantitative Dataset – Locality-level sample. Note: *, **, and *** indicate significance at 10%, 5% and 1 % level respectively.
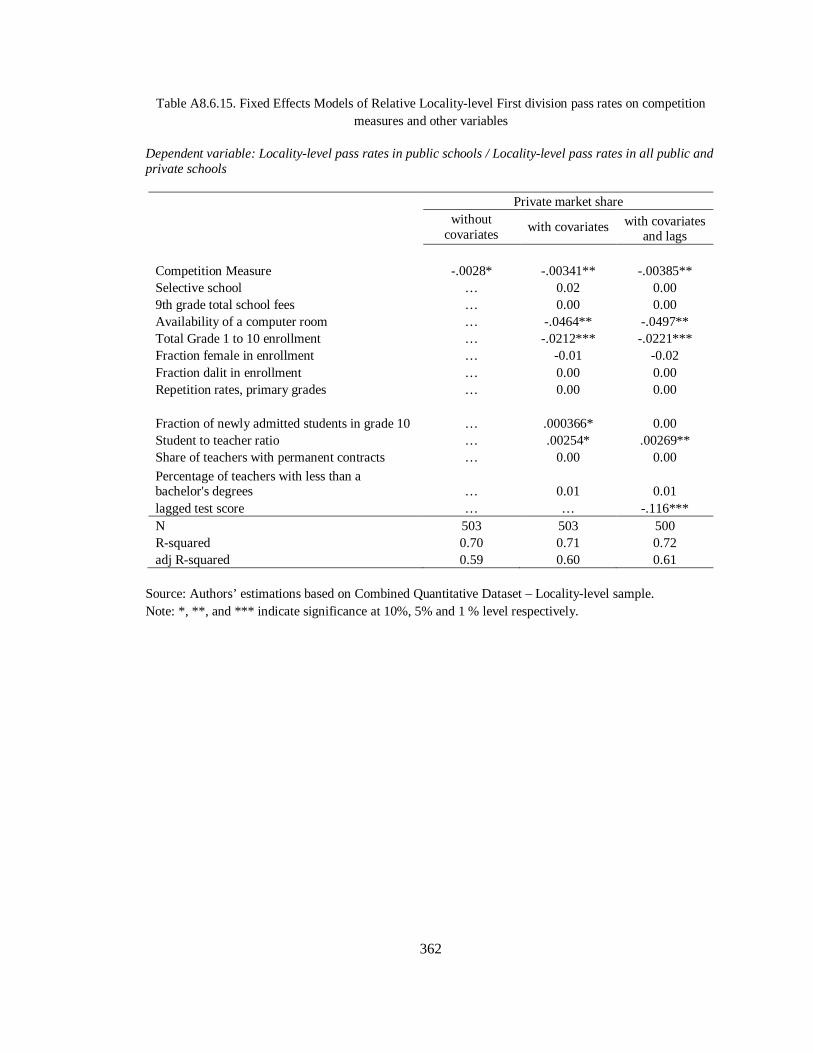
362
Table A8.6.15. Fixed Effects Models of Relative Locality-level First division pass rates on competition measures and other variables
Dependent variable: Locality-level pass rates in public schools / Locality-level pass rates in all public and private schools
Private market share
without
covariates with covariates with covariates
and lags Competition Measure -.0028* -.00341** -.00385** Selective school … 0.02 0.00 9th grade total school fees … 0.00 0.00 Availability of a computer room … -.0464** -.0497** Total Grade 1 to 10 enrollment … -.0212*** -.0221*** Fraction female in enrollment … -0.01 -0.02 Fraction dalit in enrollment … 0.00 0.00 Repetition rates, primary grades … 0.00 0.00
Fraction of newly admitted students in grade 10 … .000366* 0.00 Student to teacher ratio … .00254* .00269** Share of teachers with permanent contracts … 0.00 0.00
Percentage of teachers with less than a bachelor's degrees … 0.01 0.01 lagged test score … … -.116*** N 503 503 500 R-squared 0.70 0.71 0.72 adj R-squared 0.59 0.60 0.61
Source: Authors’ estimations based on Combined Quantitative Dataset – Locality-level sample. Note: *, **, and *** indicate significance at 10%, 5% and 1 % level respectively.
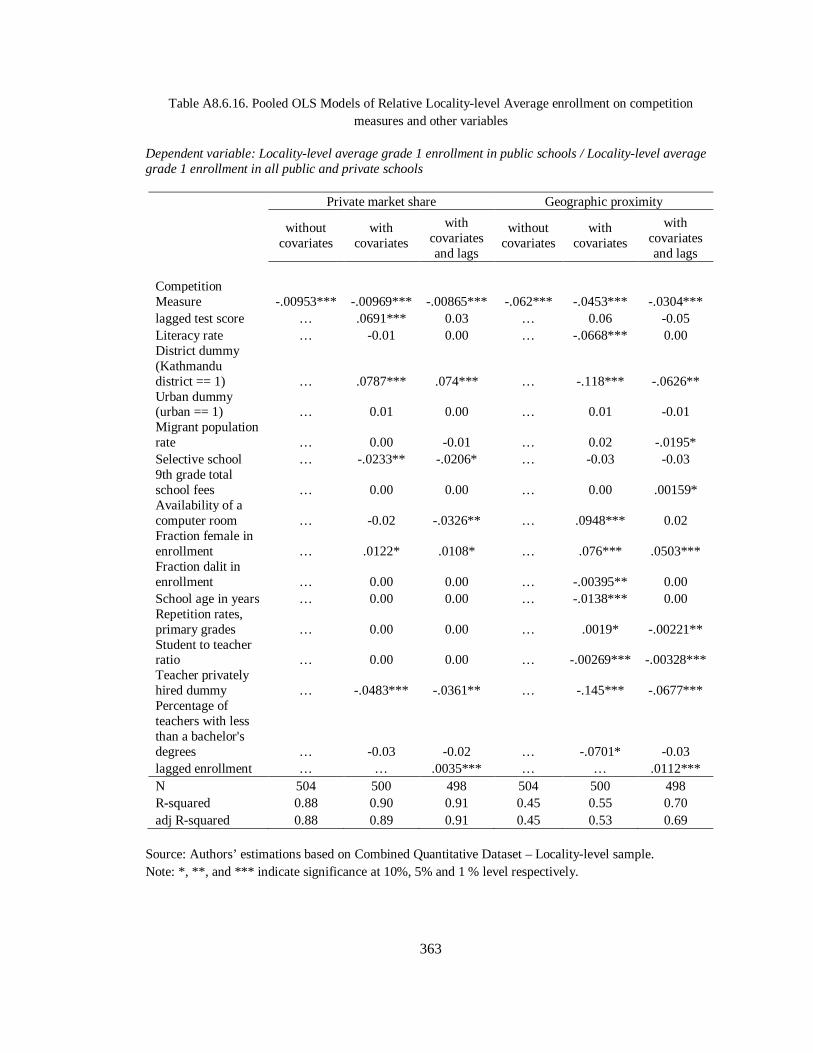
363
Table A8.6.16. Pooled OLS Models of Relative Locality-level Average enrollment on competition measures and other variables
Dependent variable: Locality-level average grade 1 enrollment in public schools / Locality-level average grade 1 enrollment in all public and private schools
Private market share Geographic proximity
without covariates
with covariates
with covariates and lags
without covariates
with covariates
with covariates and lags
Competition Measure -.00953*** -.00969*** -.00865*** -.062*** -.0453*** -.0304*** lagged test score … .0691*** 0.03 … 0.06 -0.05 Literacy rate … -0.01 0.00 … -.0668*** 0.00 District dummy (Kathmandu district == 1) … .0787*** .074*** … -.118*** -.0626** Urban dummy (urban == 1) … 0.01 0.00 … 0.01 -0.01 Migrant population rate … 0.00 -0.01 … 0.02 -.0195* Selective school … -.0233** -.0206* … -0.03 -0.03 9th grade total school fees … 0.00 0.00 … 0.00 .00159* Availability of a computer room … -0.02 -.0326** … .0948*** 0.02 Fraction female in enrollment … .0122* .0108* … .076*** .0503*** Fraction dalit in enrollment … 0.00 0.00 … -.00395** 0.00 School age in years … 0.00 0.00 … -.0138*** 0.00 Repetition rates, primary grades … 0.00 0.00 … .0019* -.00221** Student to teacher ratio … 0.00 0.00 … -.00269*** -.00328*** Teacher privately hired dummy … -.0483*** -.0361** … -.145*** -.0677*** Percentage of teachers with less than a bachelor's degrees … -0.03 -0.02 … -.0701* -0.03 lagged enrollment … … .0035*** … … .0112*** N 504 500 498 504 500 498 R-squared 0.88 0.90 0.91 0.45 0.55 0.70 adj R-squared 0.88 0.89 0.91 0.45 0.53 0.69
Source: Authors’ estimations based on Combined Quantitative Dataset – Locality-level sample. Note: *, **, and *** indicate significance at 10%, 5% and 1 % level respectively.

364
Table A8.6.17. Random Effects Models of Relative Locality-level Average enrollment on competition measures and other variables
Dependent variable: Locality-level average grade 1 enrollment in public schools / Locality-level average grade 1 enrollment in all public and private schools Private market share Geographic proximity
without covariates
with covariates
with covariates and lags
without covariates
with covariates
with covariates and lags
Competition Measure -.00956*** -.00963*** -.00902*** -.062*** -.0456*** -.0404*** lagged test score … 0.012 0.011 … -0.027 -0.019 Literacy rate … -0.011 -0.003 … -.0513** -0.028 District dummy (Kathmandu district == 1) … .0652*** .063*** … -0.024 -0.023 Urban dummy (urban == 1) … 0.003 0.002 … 0.019 0.011 Migrant population rate … 0.002 -0.004 … 0.006 -0.008 Selective school … -0.007 -0.007 … -0.009 -0.007 9th grade total school fees … 0.000 0.000 … 0.001 0.000 Availability of a computer room … 0.004 0.001 … 0.019 0.019 Fraction female in enrollment … -0.003 -0.001 … 0.006 0.011 Fraction dalit in enrollment … 0.000 0.001 … -0.002 0.000 School age in years … 0.001 0.003 … -.0263*** -.0113* Repetition rates, primary grades … 0.000 0.000 … .000944* 0.000 Student to teacher ratio … 0.000 0.000 … .00153** 0.001 Teacher privately hired dummy … -.0508* -.0429* … -.192*** -.141*** Percentage of teachers with less than a bachelor's degrees … -.0395*** -.0324*** … -.043*** -.0284* lagged enrollment … … .00199*** … … .00413***
N 504 500 498 504 500 498 R-squared (within) 0.301 0.309 0.314 . 0.104 0.123 R-squared (overall) 0.881 0.894 0.904 0.452 0.498 0.619 R-squared (between) 0.906 0.917 0.927 0.471 0.515 0.639 Source: Authors’ estimations based on Combined Quantitative Dataset – Locality-level sample. Note: *, **, and *** indicate significance at 10%, 5% and 1 % level respectively.
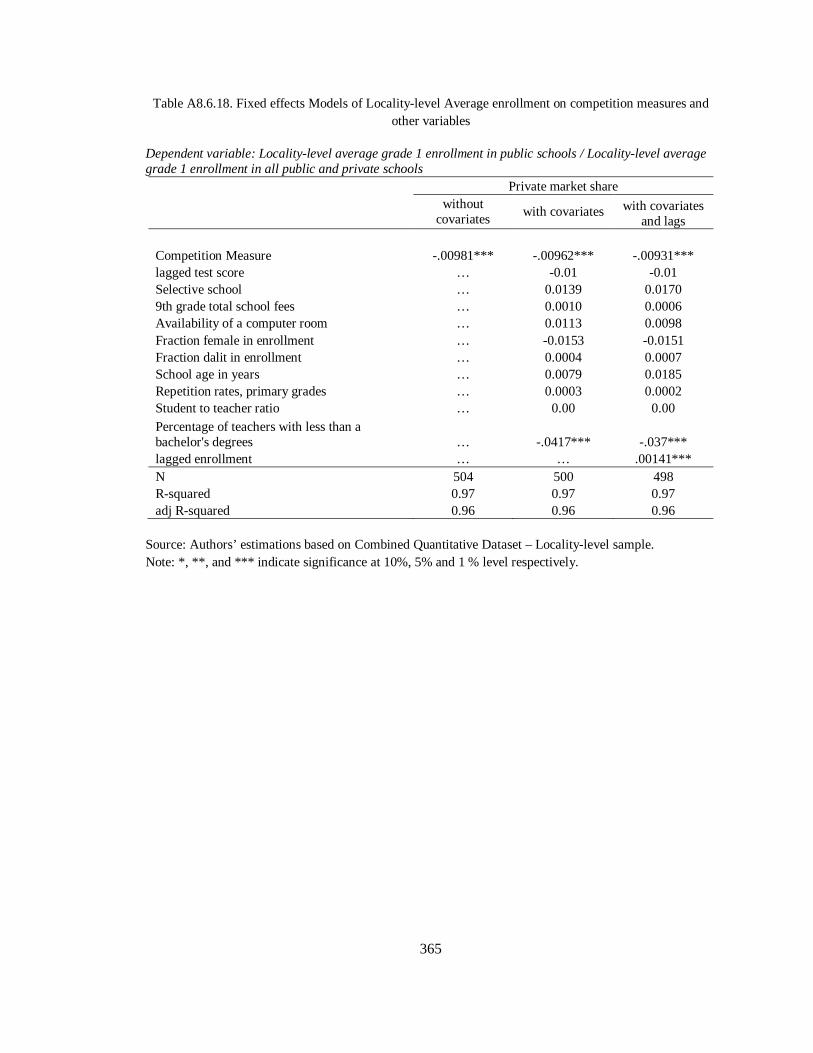
365
Table A8.6.18. Fixed effects Models of Locality-level Average enrollment on competition measures and other variables
Dependent variable: Locality-level average grade 1 enrollment in public schools / Locality-level average grade 1 enrollment in all public and private schools
Private market share
without
covariates with covariates with covariates
and lags Competition Measure -.00981*** -.00962*** -.00931*** lagged test score … -0.01 -0.01 Selective school … 0.0139 0.0170 9th grade total school fees … 0.0010 0.0006 Availability of a computer room … 0.0113 0.0098 Fraction female in enrollment … -0.0153 -0.0151 Fraction dalit in enrollment … 0.0004 0.0007 School age in years … 0.0079 0.0185 Repetition rates, primary grades … 0.0003 0.0002 Student to teacher ratio … 0.00 0.00 Percentage of teachers with less than a bachelor's degrees … -.0417*** -.037*** lagged enrollment … … .00141*** N 504 500 498 R-squared 0.97 0.97 0.97 adj R-squared 0.96 0.96 0.96
Source: Authors’ estimations based on Combined Quantitative Dataset – Locality-level sample. Note: *, **, and *** indicate significance at 10%, 5% and 1 % level respectively.
366
REFERENCES Andrabi, T., Das, J., & Khwaja, A. I. (2008). A dime a day: The possibilities and limits of private
schooling in Pakistan. Comparative Education Review, 52(3), 329-355. Angrist, J., Bettinger, E., & Kremer, M. (2006). Long-term educational consequences of
secondary school vouchers: Evidence from administrative records in Colombia. The American Economic Review, 96(3), 847-862.
Australian Agency for International Development (AUSAID) (2012). Government of Nepal:
Final Mid-Term Evaluation of the School Sector Reform Program (SSRP). Retrieved from: http://www.ausaid.gov.au/publications/pages/list.aspx?country=Nepal.
Belfield, C. & Levin, H. M. (2002). The Effects of Competition between Schools on
Educational Outcomes: A Review for the United States. Review of Educational Research, 72(2), 279-341.
Bellei, C. (2009). The Public-Private School Controversy in Chile. In R. Chakrabarti and P. E.
Peterson (Eds.), School Choice International: Exploring Public-Private Partnerships (pp.165 – 192). Cambridge: MIT Press.
Berends, M., Springer, M.G., Ballou, D., & Walberg, H.W. (Eds.). (2009). Handbook of
Research on School Choice, New York, NY: Taylor and Francis Group. Beteille, T. (2009). Absenteeism, Transfers and Patronage: The Political Economy of Teacher
Labor Markets in India. (Doctoral Dissertation). Retrieved from ProQuest Dissertations and Theses. (Accession Order No. AAT 3382684)
Betts, J. (2009) The Competitive Effects of Charter schools on traditional public schools. In M.
Berends, M. Springer, D. Ballou and H. Walberg (Eds.), Handbook of Research on School Choice (pp. 195 - 208). New York and London: Routledge.
Bhatta, S.D. (2004). A descriptive analysis of the disparities in school performance in the SLC
Exams. SLC Study Report # 1. Kathmandu: The Education Sector Advisory Team, Ministry of Education and Sports, Nepal.
Bhatta, S. D. (2005). Determinants of student performance in the SLC examinations. SLC Study
Report # 13. Prepared for the Ministry of Education and Sports, Nepal, Kathmandu, Nepal.
Bhatta, P. (2009). Education in Nepal: Problems, Reforms and Social Change. Kathmandu,
Nepal: Martin Chautari. Caddell, M. (2007). Private Schools and Political Conflict in Nepal. In: Srivastava, Prachi and
Walford,Geoffrey (Eds.), Private Schooling in Less Economically Developed Countries: Asian and African Perspectives (pp. 187–207). Oxford Studies in Comparative Education. Didcot, UK:Symposium.
Carney, S. & Bista, M. (2009). Community Schooling in Nepal: A Genealogy of Education

367
Reform since 1990, Comparative Education Review, 53 (2), 189-211. Carnoy, M. (1997). Is Privatization through Education Vouchers Really the Answer?. A
Comment on West. The World Bank Research Observer, Vol.12. Carnoy M., Adamson, F., Chudgar, A., Luschei, T.F., & Witte, J.F. (2009). Vouchers and Public
School Performance: A Case Study of the Milwaukee Parental Choice Program. Washington, DC: Economic Policy Institute.
Central Bureau of Education Statistics (CBS) (1997). Nepal Living Standards Survey 1996:
Volumes I and II. Kathmandu: National Planning Commission/ His Majesty’s Government of Nepal.
Central Bureau of Education Statistics (CBS) (2002). National Population Census 2001,
Volumes I and II. Kathmandu, Nepal. Retrieved from: http://sites.google.com/site/nepalcensus/
Central Bureau of Education Statistics (CBS) (2004). Nepal Living Standards Survey 2003/04:
Volumes I and II. Kathmandu: National Planning Commission/ His Majesty’s Government of Nepal.
Central Bureau of Education Statistics (CBS) (2006). Resilience amidst conflict: An assessment
of poverty in Nepal, 1995-96 and 2003-04. Kathmandu: National Planning Commission/ His Majesty’s Government of Nepal.
Central Bureau of Education Statistics (CBS) (2008). District Profiles: Chitwan, Dadeldhura,
Jhapa, Kathmandu, Kavrepalanchowk, Mustang, Sarlahi. Retrieved from: http://cbs.gov.np/wp-content/uploads/2012/District Profiles/
Central Bureau of Education Statistics (CBS) (2011). Nepal Living Standards Survey 2010/11:
Volumes I and II. Kathmandu: National Planning Commission/ Government of Nepal. Central Bureau of Education Statistics (CBS) (2012a). National Population and Housing Census
2011, Volumes I and II. Kathmandu, Nepal. Retrieved from: http://sites.google.com/site/nepalcensus/
Central Bureau of Education Statistics (CBS) (2012b). Poverty in Nepal. Kathmandu: National
Planning Commission/ Government of Nepal. Central Bureau of Education Statistics (CBS) (2013). NLSS I (1995-96), II (2003-04) and III
(2010-11) [Computer Files]. Kathmandu: National Planning Commission/ Government of Nepal.
Chakrabarti R. (2008). Can increasing private school participation and monetary loss in a
voucher program affect public school performance? Evidence from Milwaukee. Journal of Public Economics, 92(5-6), 1371-93.
Chakrabarti, R., & P. E. Peterson. (Eds.). (2009). School Choice International: Exploring Public-
Private Partnerships. Cambridge: MIT Press.
368
Chakrabarti, R. & Roy, J. (2010). The Economics of Parental Choice. In D. Brewer & P.
McEwan (Eds.), Economics of Education (pp. 336 – 342). United Kingdom: Elsevier, Ltd.
Chubb, J. E., & Moe, T. M. (1990). Politics, markets, and America's schools. Washington, DC:
The Brookings Institution. Cohen-Zada, D., & Sander, W. (2008). Religion, religiosity and private school choice:
Implications for estimating the effectiveness of private schools. Journal of Urban Economics, 64(1), 85-100.
Coleman, J., Hoffer, T. & Kilgore, S. (1982). High School Achievement: Public, Catholic and
Private Schools Compared. New York: Basic Books. Contreras,D., Bustos,S., & Sepúlveda, P. (2009). When Schools Are the Ones That Choose:
Policy Analysis of Screening in Chile. In F. Barrera-Osorio, H. A. Patrinos, and Q. Wodon (Eds.), Emerging Evidence on Private Participation in Education: Vouchers and Faith-Based Providers, (pp. 55 – 70).Washington, DC: The World Bank.
Cullen, J. B., & Reback, R. (2006). Tinkering toward accolades: School gaming under a
performance accountability system. NBER Working Paper W12286. Cambridge, MA: National Bureau of Economic Research.
Dang, H. & Rogers, F.H. (2008). The Growing Phenomenon of Private Tutoring: Does It Deepen
Human Capital, Widen Inequalities, or Waste Resources? The World Bank Research Observer, 23(2),161-200.
Deere, D., & Strayer,W. (2001). Putting Schools to the Test: School Accountability, Incentives,
and Behavior. Working Paper 113. College Station, Texas: Texas A&M University, Private Enterprise Research Center.
Dee, T. S. (1998). Competition and the quality of public schools. Economics of Education review,
17(4), 419-427. DiMaggio, P. J., & Powell, W.W. (1983). The iron cage revisited: Institutional isomorphism and
collective rationality in organizational fields. American Sociological Review, 48 (2), 147 – 160.
District Education Office, Kathmandu (DEO, Kathmandu). (2012). Private School Fees and
Establishment Years: Kathmandu [hard copy data]. Kathmandu: Kathmandu District Education Office.
District Education Office, Kathmandu (DEO, Kathmandu). (2012). Private School Ownership
Changes and Location Changes Data: Kathmandu [hard copy data]. Kathmandu: Kathmandu District Education Office.
District Education Office, Kathmandu (DEO, Chitwan). (2012). Private School Fees and
Establishment Years: Chitwan [hard copy data]. Chitwan: Bharatpur District Education

369
Office. Elacqua, G. (2010). School choice in Chile: Markets, politics, and public policy. (Doctoral
Dissertation). Retrieved from ProQuest Dissertations and Theses. (Accession Order No. AAT 3393427)
Elacqua, G., Schneider, M., & Buckley, J. (2006). School choice in Chile: Is it class or the
classroom? Journal of Policy Analysis and Management, 25(3), 577–601. Epple, D., & Romano, R. E. (1998). Competition between Private and Public Schools, Vouchers,
and Peer-Group Effects, American Economic Review, 88(1), 33-62. Figlio, D. N., & Getzler, L.S. (2002). Accountability, Ability and Disability: Gaming the System.
Working Paper W9307. Cambridge, MA: National Bureau of Economic Research. Figlio, D. N., & Hart, C. (2010). Competitive effects of means-tested school vouchers. NBER
Working Paper W16056. Cambridge, MA: National Bureau of Economic Research. Figlio, D. N., & Ladd, H. F. (2008). School accountability and student achievement. Handbook
of research in education finance and policy, pp. 166-182. Figlio, D. N., & Stone, J. A. (2000). Are private schools really better? Research in labor
economics, 18, 115-140. Fiske, E. & Ladd, H. (2000). When Schools Compete: A cautionary tale. Brookings Institution
Press. Friedman, M. (1962). Capitalism and freedom. Chicago: University of Chicago Press. Gauri, V. (1998). School choice in Chile: Two decades of educational reform. Pittsburgh:
University of Pittsburgh Press. Geller, C. R., Sjoquist, D. L., & Walker, M. B. (2006). The effect of private school competition
on public school performance in Georgia. Public finance review, 34(1), 4-32. Glewwe, P., & Kremer, M. (2006). Schools, teachers, and education outcomes in developing
countries. In: Hanushek, E., and Welch, F. (Eds.), Handbook of the Economics of Education, Vol 2 (pp. 943 – 1017) New York: Elsevier.
Governance and Social Development Resource Centre (GSDRC) (2011). State-building, Peace-
building and Service delivery in Fragile and Conflict-affected States: Case Study of Nepal. Retrieved from: http://www.gsdrc.org/docs/open/SD34.pdf.
Government of Nepal (2009). School Sector Reform Plan (2009-2015). Kathmandu: Ministry of
Education. Greene, J. P., Peterson, P. E., & Du, J. (1998). School choice in Milwaukee: A randomized
experiment. In P. E. Peterson & B. C. Hassel (Eds.), Learning from school choice (pp. 335-356). Washington, D.C.: Brookings Institution Press.

370
Hannaway, J., & Hamilton, L. (2008). Performance-Based Accountability Policies: Implications
for School and Classroom Practices. Washington: Urban Institute and RAND Corporation.
Hanushek, E. & Woesmann, L. (2008). The role of cognitive skills in economic development.
Journal of Economic Literature. 46(3) 607-688. Hess, F., Maranto, R., & Milliman, S. (2001). Small districts in big trouble: How four Arizona
school systems responded to charter competition. Teachers College Record, 103(6), 1102–1124.
Hoxby, C. (2003). School choice and school productivity (or could school choice be a tide that
lifts all boats?) In C. Hoxby (Ed.) The Economics of school choice (pp. 287 – 342). Chicago: University of Chicago and NBER press.
Hsieh, C., & Urquiola, M. (2003). When Schools Compete, How Do They Compete? An
Assessment of Chile’s Nationwide School Voucher Program. NBER Working Paper W10008. Cambridge, MA.: National Bureau of Economic Research.
Hsieh, C., & Urquiola, M. (2006). The effects of generalized school choice on achievement and
stratification: Evidence from Chile's voucher program. Journal of Public Economics, 90(8-9), 1477-1503.
International Monetary Fund (IMF) (2011a). Nepal: 2011 Article IV Consultation. IMF Country
Report No. 11/318. Washington: International Monetary Fund. International Monetary Fund (IMF) (2011b). Nepal: Selected Issues. IMF Country Report No.
11/319. Washington: International Monetary Fund. Jacob, B. & Levitt, S. (2004). Rotten apples. Quarterly Journal of Economics, 11 (3) 843 – 878. Jacob, B. (2005). Accountability, incentives and behavior. Journal of Public Economics, 89 (5-6):
761 – 796. Jayachandran, S. (2008). Incentives to teach badly? After-school tutoring in developing countries.
Unpublished Manuscript. Jencks, C. (1970). Giving Parents Money for Schooling: Education Vouchers. Phi Delta Kappan,
49-52. Jimenez, E., & Lockheed, M. E. (1995). Public and private secondary education in developing
countries: A comparative study. World Bank discussion papers no. 309. Washington, DC: The World Bank.
Jimenez, E., Lockheed, M. E., & Paqueo, V. (1991). The relative efficiency of private and public
schools in developing countries. The World Bank Research Observer, 6(2), 205-218. Washington, DC: The World Bank.
371
Jimenez, E., Lockheed, M., & Wattanawaha, N. (1988). The relative efficiency of private and public schools: The case of Thailand. The World Bank Economic Review, 2(2), 139-164. Washington, DC: The World Bank.
Joshi, P. (2013a). Continuing to exercise choice after school selection in Nepal. Invited to revise
and resubmit at the International Journal for Educational Development. Joshi, P. (2013b). The nature of parental choice and schooling engagement in Nepal: Insights
into parent decision-making in local education markets. Invited to revise and resubmit at the National Center for the Study of Privatization in Education Occasional Paper series, Teachers College, Columbia University.
Khan, F. (2005). Who participates in school councils and how? A case study of elementary
schools in Sargodha District, Punjab, Pakistan (Doctoral Dissertation). Retrieved from ProQuest Dissertations and Theses. (Accession Order No. AAT 3176342).
Kingdon, G. (1996). The quality and efficiency of private and public education: A case-study of
urban India. Oxford Bulletin of Economics and Statistics, 58(1), 57-82. Kingdon, G. & Muzammil, M. (2003). The Political Economy of Education in India: Teacher
Politics in Uttar Pradesh. New Delhi: Oxford University Press. Krieg, J. (2007). Are students left behind? The distributional effects of the No Child Left Behind
Act. Education Finance and Policy, 3(2), 250 – 281. Ladd, H. & Fiske, E. (2003). Does Competition Improve Teaching and Learning? Evidence from
New Zealand. Educational Evaluation and Policy Analysis, 25(1) 97-112. Ladd, H. & Zelli, F. (2002). School-based accountability in North Carolina: The responses of
school principals. Education Administration Quarterly, 38(4) 494 – 529. Levin, H.M., 2002. A comprehensive framework for evaluating educational vouchers.
Educational Evaluation and Policy Analysis, 24 (3), 159–174. Leithwood, K., & Jantzi, D. (2005). A review of transformational school leadership research
1996–2005. Leadership and Policy in Schools, 4(3), 177-199. Lubienski, C. & Weitzel, P. (2010). The Charter school experiment. Cambridge, MA: Harvard
Education Press. Maranto, R., S. Milliman, F. Hess, & A. Gresham. (1999). “Do Charter Schools Improve District
Schools? Three Approaches to the Question. In Maranto, Milliman, Hess, & Gresham (Eds.), School Choice in the Real World: Lessons from Arizona Charter Schools (pp. 129-41). Boulder: Westview.
Maranto, R., Milliman, S. & F. Hess. (2010). How traditional public schools respond to
competition: The mitigating role of organizational culture. Journal of School Choice, 4(2), 113-136.
372
Martin Chautari (2013). Political Risks and Ex-Combatants. Martin Chautari Policy Briefs No. 9. Retrieved from: http://martinchautari.org.np/files/policy-brief-9-Eng_ver.pdf.
McEwan, P. J. (2000). The potential impact of large-scale voucher programs. Review of
Educational Research, 70(2), 103-149. McEwan, P. J. (2001). The effectiveness of public, catholic, and non-religious private schools in
Chile’s voucher system. Education Economics, 9(2), 103-128. Meyer, J. W. & Rowan, B. (1977). Institutionalized organizations: Formal structure as myth and
ceremony. American Journal of Sociology, 83, 340-363. Ministry of Education of Nepal (MoE) (2008). Flash I Report 2066 (2008-09). Kathmandu, Nepal. Ministry of Education of Nepal (MoE) (2009). Flash I Report 2066 (2009-10). Kathmandu, Nepal. Ministry of Education of Nepal (MoE) (2010). Flash I Report 2067 (2010-11). Kathmandu, Nepal. Ministry of Education of Nepal (MoE) (2011). Flash I Report 2068 (2011-12). Kathmandu, Nepal. Ministry of Education of Nepal (MoE) (2012a). Flash I Report 2069 (2012-13). Kathmandu, Nepal. Ministry of Education (MoE). (2012b). Flash I and II, 2008-2012 [Computer Files]. Sano Thimi:
Department of Education. Ministry of Education and Sports of Nepal (MoES). (2005). SLC Study Survey 2004 [Computer
file], Kathmandu, Nepal. Ministry of Finance (MoF). (2009). Budget Details for Fiscal Year 2009-10 (Red Book).
Kathmandu: Ministry of Finance. Miron, G. (2010). Performance of Charter Schools and Implications for Policy Makers. In C.
Lubienski and P. Weitzel (Eds.), The Charter School Experiment (pp. 73 – 92). Cambridge, MA: Harvard Education Press.
Miron, G. (2010). Performance of Charter Schools and Implications for Policy Makers. In C.
Lubienski and P. Weitzel (Eds.), The Charter School Experiment (pp. 73 – 92). Cambridge, MA: Harvard Education Press.
Miron, G., Evergreen, S., & Urschel, J. (2008). The impact of school choice reforms on student
achievement. Boulder and Tempe: Education and the Public Interest Center & Education Policy Research Unit. Retrieved from: http://www.epicpolicy.org/files/Choice-08-Miron.pdf.
373
Mohrman, S. A., & Lawler, E. E. (1996). Motivation for school reform. In S. H. Fuhrman & J. A. O’Day (Eds.), Rewards and reform: Creating educational incentives that work (pp. 115–143). San Francisco: Jossey-Bass.
Muralidharan, K., & Kremer, M. (2009). Public and Private schools in India. In Chakrabarti, R.,
Peterson, P. E. (Eds.), School Choice International: Exploring Public-Private Partnerships (pp. 91-110). MIT Press: Cambridge.
Nechyba, T.J. (2009). “Mobilizing the Private Sector in the United States: A Theoretical
Overview.” In R. Chakrabarti and P. E. Peterson (Eds.), School Choice International: Exploring Public-Private Partnerships (pp. 47 – 70). Cambridge: MIT Press.
Ni, Y. (2009). The impact of charter schools on the efficiency of traditional public schools:
Evidence from Michigan. Economics of Education Review, 28(5), 571-584. Ni, Y. & Arsen, D. (2010). The Competitive Effects of Charter Schools on Public School
Districts. In C. Lubienski and P. Weitzel (Eds.), The Charter School Experiment (pp. 93 – 122). Cambridge, MA: Harvard Education Press.
O’Day, J.A. (2002). Complexity, accountability and school improvement. Harvard Education
Review, 72, 293- 321. Office of the Controller of Examinations (OCE). (2009). School-Leaving Certificate Records,
2008 – 09. Sano Thimi, Nepal Office of the Controller of Examinations (OCE). (2010). School-Leaving Certificate Records,
2009-10. Sano Thimi: Office of the Controller of Examinations. Office of the Controller of Examinations (OCE). (2011). School-Leaving Certificate Records,
2010-11. Sano Thimi: Office of the Controller of Examinations. Office of the Controller of Examinations (OCE). (2012). School-Leaving Certificate Records,
2011-12. Sano Thimi: Office of the Controller of Examinations. Padhye, N. (1976). Financing first-level and second-level education in Nepal. Financing
Educational Systems: Specific Case Studies No. 8. Paris: International Institute for Educational Planning.
Payne, A. A. (2010). Competition and Student Performance. In D. Brewer & P. McEwan (Eds.),
Economics of Education (pp. 323 - 328). United Kingdom: Elsevier, Ltd. Plank. D., & Sykes, G. (2003). Choosing Choice: School Choice Policies in International
Perspective. New York: Teachers' College Press. Rai, V. S., Rai, M., Phyak, P., & Rai, N. (2011). Multilingual education in Nepal: Hearsay and
reality. Kathmandu, Nepal: UNESCO. Rofes, E. (1998). How are school districts responding to charter laws and charter schools? A
study of eight states and the District of Columbia. Berkeley, CA: University of

374
California. Rouse, C. E., Hannaway, J., Goldhaber, D., & Figlio, D. N. (2007). Feeling the Florida heat?
How low-performing schools respond to voucher and accountability pressure. NBER Working Paper W13691. Cambridge, MA: National Bureau of Economic Research.
Schneider, M., Teske, P., Marschall, M. (2000). Choosing schools: Consumer choice and the
quality of American schools. Princeton, NJ: Princeton University Press. Sharma, U. (2012). Essays on the Economics of Education in Developing Countries.(Doctoral
Dissertation). Retrieved from ProQuest Dissertations and Theses. (Accession Order No. AAT 3494673). ProQuest LLC.
Srivastava, P., & Walford, G. (2008). Private Schooling in Less Economically Developed
Countries: Asian and African Perspectives. Didcot, Oxon: Symposium Books. Srivastava, P. (2013) (Ed.). Low-fee Private Schooling: aggravating equity or mitigating
disadvantage? Oxford: Symposium Books. Thapa, A. (2011). Does Private School Competition Improve Public School Performance? The
Case of Nepal. (Doctoral Dissertation). Retrieved from ProQuest Dissertations and Theses. (Accession Order No. AAT 3454029)
Thapa, A. (2012). Public and private school performance in Nepal: an analysis using the SLC
examination. Education Economics, (ahead-of-print), 1-16. Thapa, A. (2013). Does Private School Competition Improve Public School Performance? The
Case of Nepal. International Journal of Educational Development 33 (4): 358 – 366. Tooley, J., & Dixon, P. (2005). Private Education is Good for the Poor. CATO Institute,
Washington, D.C. Tyack, D. B. (1974). The one best system: A history of American urban education. Harvard
University Press. Tyack, D. B., & Hansot, E. (1982). Managers of virtue: Public school leadership in America,
1820-1980 (Vol. 5112). New York: Basic Books. UNESCO (2012). Private Share of Primary Enrollment, Low and Lower-Middle Income
Countries [Data file]. Retrieved from Edstats: http://databank.worldbank.org/Data/Views/VariableSelection/SelectVariables.aspx?source=Education Statistics.
Upraity, T. (1962). Financing Elementary Education in Nepal. Eugene: The American-Nepali
Education Foundation. Witte, J. F. (2000). The market approach to education: An analysis of America's first voucher
program. Princeton: Princeton University Press.
375
World Bank (2003). Project appraisal document for a community school support project, human development sector unit, Nepal Office, Nepal.
World Bank (2011). World Development Report 2011. Conflict, Security and Development.
Washington, DC: World Bank. World Bank (2013). World Development Indicators 2013. Available at:
http://databank.worldbank.org/data/views/reports/tableview.aspx. [Accessed July 18, 2013]. World Bank, Washington, DC.
World Economic Forum (WEF) (2011). The Global Competitiveness Report, 2010-11. Geneva:
World Economic Forum. Wood, H. (1959). The Development of Education in Nepal. Education Leadership, 16(7): 429 –
433. Wooldridge, J.M. (2009). Introductory Econometrics: A Modern Approach, third ed. South-
Western Cengage Learning, Ohio. Yadava, Y. P. (2007). Linguistic Diversity in Nepal: Perspectives on Language Policy.
International Seminar on Constitutionalism and Diversity in Nepal (pp. 1-18). Kathmandu, Nepal.
Yin, R. K. (2010). Case study research: Design and methods (4th ed.). Thousand Oaks, CA:
Sage. Zief, S. G., Maynard, R. A., Bradley, M. C., Keefe, C., & Kralik, J. (2005). A Systematic
Review of the Research on Market-Based Choice Plans. Berkeley, CA: MPR Associates. Retrieved from: www.mprinc.com/pubs/pdf/Choice_Plans.pdf
Zimmer, R. & Bettinger, E. (2010). The Efficacy of Educational Vouchers. In D. Brewer & P.
McEwan (Eds.), Economics of Education (pp. 343 – 350). United Kingdom: Elsevier, Ltd.
Zimmer, R. & Buddin, R. (2010). The Economics of Charter Schools. In D. Brewer & P.
McEwan (Eds.), Economics of Education (pp. 329 - 335). United Kingdom: Elsevier, Ltd.