the production and consumption of rubber in 1912
TRANSCRIPT
254 T H E J O U R N A L OF I N D U S T R I A L A-VU ESGI.VEEKI.VG C N E M I S l ’ R 1’ Mar., 19 I 3
None of the American product is exported, with the exception of a negligibly small quantity to contiguous tcrritory to supply pressing requirements. The capital invested in the plate glass industry in this country is about $49,ooo,ooo, the smallest concern in the industry having a capital investment of about $I,OOO,OOO. The average number of men employed directly in the industry is about I I ,000, but those indirectly employed will equal more than twice this number.
The average cost of manufacturing plate glass in the United States in 19 12 was 23.98 cents per square foot without considering depreciation; with depreciation added, but ‘without allowing anything for interest on bonds or capital invested, the cost of plate glass per square foot was 28.45 cents. In 1909, the same cost figures were 28.16 cents and 33.71 cents, respectively. A comparison of the foregoing costs, before deducting depreciation or any interest on bonds or capital, with the average selling prices for the same periods, shows that all glass under five feet was sold a t a large loss, while the margin of profit on glass over five feet was but 1.81 cents per square foot in 1909 and 4.66 cents in 1912. If we include depreciation, there existed on sales of plate glass over five square feet an actual loss in 1909 and but 0.19 cent profit per square foot in 1912.
The production of plate glass throughout the world is estima. ted a t ~z~ ,ooo ,ooo square feet, a little less than one-half of which is produced and consumed in this country. The pro- ducing countries in Europe are Belgium, Germany, Austria, France, England, Italy, Spain, and Russia; but Belgium pro- duces more glass than any of the other countries, a t the lowcst cost, and exports 9 j per cent. of its product. The production of all but two of the European plate glass factories is curtailed and prices are fixed under a trust combination; each factory is said to have a capacity of 45 to 50 per cent. more than their present production. Since the organization of the International Convention abroad, the plate glass manufacturers of Europe have prospered and many improvements in machinery have been made, particularly in polishing machines. At present the cost of manufacturing plate glass in Belgium is $1.06 to $1.25 per square meter (10.76 square feet), and rough glass is being manufactured a t a cost of less than $0.48 j per square meter.
The American plate glass manufacturers are not associated with the European syndicate and consequently the latter has established a low range of prices for the American market. It can undersell competitors in any market in the world and then recoup its losses by adding them to the price of platc glass in markets that i t controls, and is in an immediate position to makc a strong invasion of the American market.
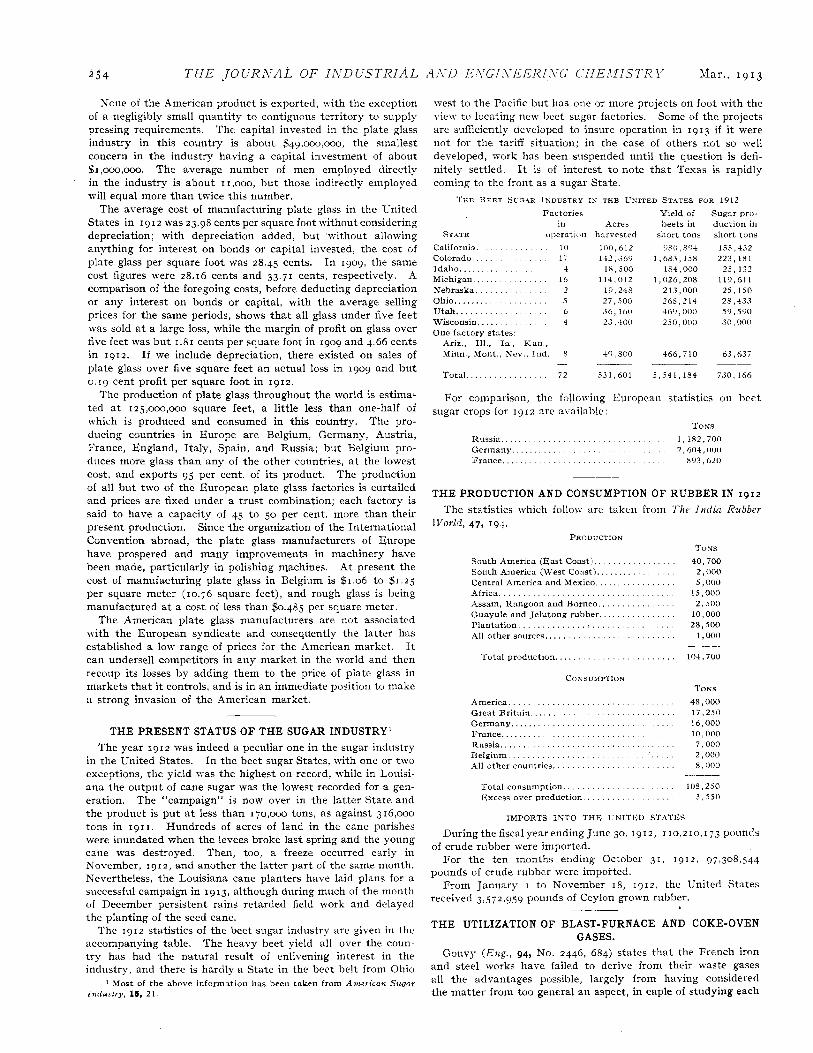
THE PRESENT STATUS OF THE SUGAR INDUSTRY’ The year 1912 was indeed a peculiar one in the sugar industry
in the United States. In the beet sugar States, with one or two exceptions, the yield was the highest on record, while in Louisi- ana the output of cane sugar was the lowest recorded for a gen- eration. The “campaign” is now over in the latter State and the product is put a t less than 170,000 tons, as against 316,000 tons in 191 I . Hundreds of acres of land in the cane parishes were inundated when the levees broke last spring and the young cane was destroyed. Then, too, a freeze occurred early in November, 1912, and another the latter part of the same month. Nevertheless, the Louisiana cane planters have laid plans for a successful campaign in 1913, although during much of the month of December persistent rains retarded field work and delayed the planting of the seed cane.
The 1912 statistics of the beet sugar industry arc given in the accompanying table. The heavy beet yield all over the coun- try has had the natural result of enlivening interest in the industry, and therc is hardly a State in the bcct belt from Ohio
1 Most of the above information has been taken from American S u g a r ladus try , 16, 21
west to the Pacific but has one or more projects on foot with the view to locating new beet sugar factories. Some of the projects are sufficiently developed to insure operation in 1913 if i t were not for the tariff situation; in the case of others not so well developed, work has been suspended until the question is defi- nitely settled. It is of interest to note that Texas is rapidly coming to the front as a sugar State.
T H E B E E T S U G A R Ih’DUSTRY I X T H E U N I T E D S T A T E S FOR 1912
Factories Yield of Sugar pro- in Acres beets in duction in
STATE opcration harvested short tons short tons California . . . . . . . . . . 10 100,612 980,894 155,432
Idaho.. . . . . . . . . . . . . 4 18,500 m , n o o 25,132 Michigan. . . . . . . . . . . 1 G 114, 012 I , 026, 208 1 1 9 ~ 6 1 L Nebraska.. . . . . . . . . . . 2 19,248 2 13 , nnn 2.5, 1 s o
Utah . . . . . . . . . . . . . . . . . . 6 36, 1 0 0 469, 000 5 0 , 51)O
Wisconsin 4 23, 400 One factory states:
Colorado. . . . . . . 17 142,369 1,683,1 .5Y 223,181
27, ,500 268,214 28,433
250, 000 30 , 000 . . . . . . . . . . . . . .
Ariz.. Ill., Ia., Kan., Minn., Mont., Nev., Ind. Y 4 9 , son 466,710 63,637
Total. . . . . . . . . . . . . . . . . 72 531,601 5,541,151 730,166
For comparison, the following European statistics on liect
- ___ ____ __
sugar crops for 1012 are available: T O N S
Russia. , . . . . . . . . . . . . . . . . . . . . . . 1,182,iOi) Gennany. . . . . . . . . . . . . . . . . . . . . . 2 , 6 0 4 , 0 0 0 I h n c e . . . . . . . . . . . . . . . . . . . . . . . . . . . . 891,620
THE PRODUCTION AND CONSUMPTION O F RUBBER I N 1912 The statistics which follow are taken from The I n t l z c ~ Rubber
LVorld, 47, 194. PRODUCTION
T o w South America (East Coast). . . . . . . . . . . . . . . . South America (West Coast). . . . . . . . . . . . . . . . . Central America and Mexico., . . . . . . . . . . . . . . . Africa . . . . . . . . . . . . . . . . . . . . . . . . . . . . . . . . . . . Assam, Rangoon and Borneo. . . . . . . . . . . . . . . . Guayule and Jelutong rubber. . . . . . . . . . . . . . . . Plantation . . . . . . . . . . . . . . . . . . . . . . . . . . . . . . . . All other sources., . . . . . . . . . . . . . . . . . . . . . . . . .
40, i on 2, o m 5, no0
io,nnn 2 8 , son
1, non
15,000 2,500
,. I otal production.. . . . . . . . . . . . . . . . . . . . . . . . 104,700
COXSUMPTION TONS
America . . . . . . . . . . . . . . . . . . . . . . . . . . . . . . . . . Great Britain. . . . . . . . . . . . . . . . . . . . . . . . . . . Germany. . . . . . . . . . . . . . . . . . . . . . . . . . . . . . . . 1:rance. . . . . . . . . . . . . . . . . . . . . . . . . . . . . . . . . . . . Russia.. . . . . . . . . . . . . . . . . . . . . . . . . . . . . Belgium. . . . . . . . . . . . . . . . . . . . . . . . . . All other countries.. . . . . . . . . . . . . . . . . . .
Totnl consumption. . . . . . . . . . . . . . . . . . . . . Excess over production . . . . . . . . . . . . . . . .
48, non
16,000 in,nnn 7,000 2, nnn 8, no0
108,250
17,250
_-- 3,550
IMPORTS IXTO THE UNITED STATES
During the fiscal yearending June 30, 1912, 110,210,173 pounds
For the ten months ending October 31, 1912, 97,308,544
From January I to November 18, 1912, the United States
of crude rubber were imported.
pounds of crude rubber were imported.
received 3,572,959 pounds of Ceylon grown rubber.
THE UTILIZATION O F BLAST-FURNACE AND COKE-OVEN GASES.
Gouvy (Eng., 94, No. 2446, 684) statcs that the French iron and steel works have failed to derivc from their waste gases all the advantages possible, largely from having considerecl the matter from too general an aspect, in caple of studying each