the problem with lidar is that there is too much of it....process of extracting equivalent ground...
TRANSCRIPT

The Problem with LiDAR is that there is too much of it !!!
• Kent Galloway, P.E., CRITIGEN
CRITIGEN
ESRI User Conference 2015

Brief Biographical Summary Kent Galloway
• Professional registered Civil Engineer. • Couple plus decades with CH2M HILL a large Civil Engineering
consulting firm. • Six year with Critigen, a Geospatial consulting firm. • Served as the in house go to person for DTM models, LiDAR
data sets, other 3d models, GIS, and CAD applications for environmental, water, and transportation projects.
• Currently works with a data gathering and Geospatial data processing group at Critigen.

How do you handle large LiDAR Data Sets? • Throw it out!!! At least most of it anyway. (Data
Thinning)
• (Actually, keep all the original LAS files, but consider creating thinned data sets of the Bare Earth Ground for use in various Digital Terrain Modeling packages (DTM).
• Use good tools such as ESRI Terrain Data Set, ESRI LiDAR viewer/ manager (LASD), and third party LiDAR tools.

Definitions
• LiDAR - Light Detection And Ranging • Filtering – the process of separating LiDAR data into bare earth
ground classification and into other classifications such as vegetation, buildings and water. Private firms that have LiDAR sensors almost always do Filtering. (Always necessary)
• Thinning, Pyramids, Reduced Resolution Data Sets– the process of extracting equivalent ground models from the LiDAR using fewer data points. (Different firms specialize in thinning, post processing, and data analysis.)
• LAS – Main LiDAR file format. Ask for and keep these!

Example Terrain Data Set
Boxes show LAS file Locations
• LAS tiles are typically 1000
to 10,000 foot square tiles. • The most common size is
5000 foot square or 1000 to 2000 meters square.
• One of the main uses of LiDAR is to model the Ground!

DTMs, Point Counts, and Data Thinning
• 5000’ by 5000’ LAS files have 1 to 40 million Ground Points or more, with twice to 4 times total points. Ground Point densities range from 1 to 20 or more per square meter.
• Tradition DTMs collected with stereo aerial photogrammetric methods have 0.02 to 0.2 Ground Points per square meter.
• LiDAR can have up to 1000 times as many points as other methods • CAD DTMS such as Inroads, GEOPAK, CAICE, or Civil 3d are
limited to about 2 million points. • ESRI format TIN files are limited to about 5 to 10 million points. • ESRI version 10 Terrain – Unlimited? Practical limits are 100 to 500
LAS tiles or 100 million to a billion points.

Why use ESRI Terrain?
• If ESRI Terrain will handle so many point why thin the data? – (You may not need or want to thin the data. ) If you thin the data, the main reasons are Improved performance and Export to other formats/users.
• ESRI Terrain provides very good options for thinning/ pyramiding of the data and exporting original or thinned data sets to TIN or point formats.
• Other thinning to consider are Gridding the data and thinning directly in the LAS files using third party applications.

One way of comparing the results of thinned LiDAR data is to compare contours.
Original LiDAR contours Orange, Thinned other colors

Thinning Considerations • 5 to 25 % remaining of
the original ground data is achievable.
• If you can push accuracy, more thinning is possible.
• If you add break lines more thinning is possible without the loss of accuracy.
• From an accuracy standpoint, a statistical methods of comparing thinning is better.
Alogorithm Number of Points Percent
3,228,095 100.0%
1.1 759,763 23.5%
1.2 790,719 24.5%
1.3 465,742 14.4%
2.2 1,402,587 43.4%
2.3 923,205 28.6%
2.4 948,763 29.4%
2.5 1,859,939 57.6%
2.6 680,131 21.1%
2.7 668,199 20.7%
2.8 958,406 29.7%
2.9 730,882 22.6%
2.95 457,967 14.2%

How Do you use ESRI Terrain to thin LiDAR data? • There are two thinning /
pyramiding options: • Window size (faster to create) • Z tolerance – much more
accurate. Once created performs just as well.

LiDAR Terrain made from a Single LAS Tile (1500 meters, 2d edge)


Compare Thinning Statistically (Using ESRI Terrain / Grid)

Statistically Accuracy of Thinning (Using ESRI Terrain / Grid) Method Z Scale Diff Grid Ground Points Percent Std Dev Min Max Mean
None 3,463,724 100.0% meters meters meters metersZ Tolerance 0.10 1000 dZ_0p1 1,866,752 53.9% 0.045 -1.9 1.0 0.000Z Tolerance 0.20 2000 dZ_0p2 922,311 26.6% 0.079 -1.9 1.1 0.000Z Tolerance 0.30 3000 dZ_0p3 508,801 14.7% 0.110 -2.3 1.4 -0.001Z Tolerance 0.40 4000 dZ_0p4 294,443 8.5% 0.141 -2.3 1.4 -0.001Z Tolerance 0.45 4500 dZ_0p45 226,747 6.5% 0.156 -2.1 2.8 -0.001Z Tolerance 0.50 5000 dZ_0p5 176,656 5.1% 0.170 -2.1 2.8 0.000Z Tolerance 0.60 6000 dZ_0p6 110,533 3.2% 0.197 -2.1 2.8 0.001
Windows Z Min W #Windows Z Min 1 500 dZmin_1 1,580,777 45.6% 0.072 -2.4 1.1 -0.018Windows Z Min 2 1000 dZmin_2 649,864 18.8% 0.125 -2.4 1.8 -0.052Windows Z Min 3 1500 dZmin_3 360,609 10.4% 0.159 -2.7 2.0 -0.078Windows Z Min 4 2500 dZmin_4 201,201 5.8% 0.223 -7.3 16.3 -0.097Windows Z Min 6 3000 dZmin_6 115,550 3.3% 0.344 -17.3 29.6 -0.125Windows Z Min 8 5000 dZmin_8 62,001 1.8% 0.506 -35.2 27.2 -0.150

Thinned Z tolerance 0.4 LiDAR over Unthinned LiDAR

Compare Thinning Statistically (third party LAS software) (ESRI Terrain thinning Shows Better Standard Deviations)
Algorithm Ground PointsPercent Std Dev Min Max Mean3,463,724 100.0% meters meters meters meters
1.1 367,900 10.6% 0.136 -1.5 1.5 -0.0011.2 288,293 8.3% 0.150 -1.5 1.8 -0.0011.3 227,227 6.6% 0.164 -1.5 1.8 0.0001.4 298,475 8.6% 0.148 -1.4 1.8 0.0021.5 330,000 9.5% 0.139 -1.4 1.3 0.0011.6 420,530 12.1% 0.125 -1.5 1.3 0.001
2.1 418,267 12.1% 0.179 -2.9 3.3 -0.0022.2 713,928 20.6% 0.162 -3.2 3.1 -0.0042.3 245,793 7.1% 0.237 -3.1 3.9 -0.0072.4 120,735 3.5% 0.259 -3.0 3.1 0.0032.5 119,107 3.4% 0.320 -3.7 4.7 -0.0052.6 71,528 2.1% 0.349 -3.7 4.6 -0.008

LiDAR Ground points & Contours at LAS Tile 2D Edge

LiDAR Terrain with Clipped Difference Grid for Edge Statistics

Statistically Accuracy of Thinning (ESRI Terrain / Grid) with Edge Ground Points Percent Std Dev Min Max Mean Clip_St D Clip_Min Clip_Max
3,463,724 100.0% meters meters meters meters meters meters meters1,866,752 53.9% 0.045 -1.9 1.0 0.000 0.045 -1.9 1.0
922,311 26.6% 0.079 -1.9 1.1 0.000 0.079 -1.9 1.1508,801 14.7% 0.110 -2.3 1.4 -0.001 0.110 -1.6 1.4294,443 8.5% 0.141 -2.3 1.4 -0.001 0.141 -1.6 1.4226,747 6.5% 0.156 -2.1 2.8 -0.001 0.156 -1.6 1.4176,656 5.1% 0.170 -2.1 2.8 0.000 0.170 -1.6 1.4110,533 3.2% 0.197 -2.1 2.8 0.001 0.197 -1.6 1.4
1,580,777 45.6% 0.072 -2.4 1.1 -0.018 0.073 -2.4 1.1649,864 18.8% 0.125 -2.4 1.8 -0.052 0.125 -2.4 1.3360,609 10.4% 0.159 -2.7 2.0 -0.078 0.159 -2.7 1.4201,201 5.8% 0.223 -7.3 16.3 -0.097 0.190 -2.9 1.8115,550 3.3% 0.344 -17.3 29.6 -0.125 0.234 -3.4 2.5
62,001 1.8% 0.506 -35.2 27.2 -0.150 0.289 -3.3 2.5

Same Contours with 3d Edge from Terrain Data Set
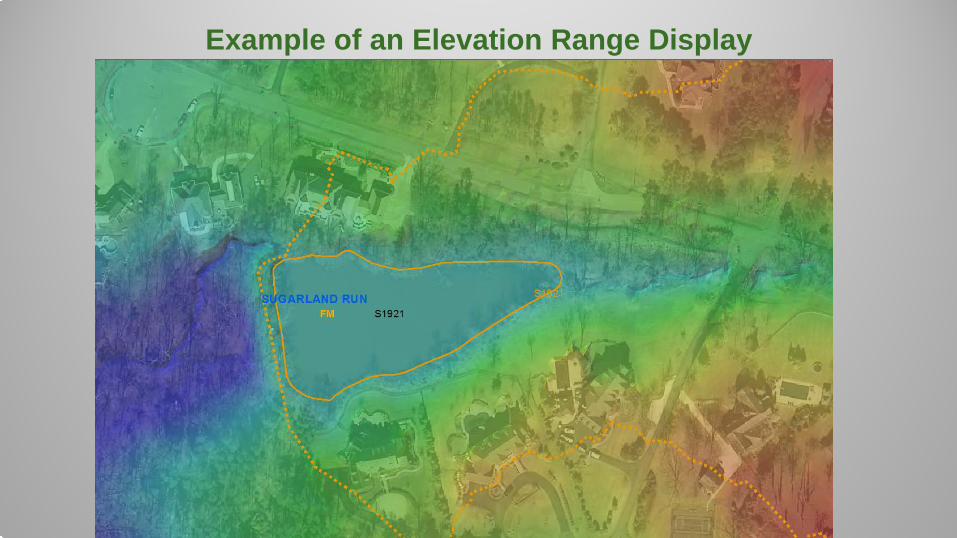
Example of an Elevation Range Display
Summary • There are many options for Data Thinning with the ESRI Terrain. • What is the Future of the Terrain? LASD? Wish list? • Dynamic Elevation Range display based on the maximum and
minimum screen DTM elevations. • ESRI Terrain thinning algorithms to work on LAS files. • Direct support of LAS in Terrain. • Improvements to functionality of Terrain so we do not have to jump
to other external Civil / DTM/ design packages including improvements to profiles and cross sections, horizontal and vertical alignments, and corridor design.
• Questions? • [email protected]