the preserve master plan eir - civiclive
TRANSCRIPT

The Preserve Master Plan EIR
H:\Client (PN-JN)\0576\05760012\FEIR.3.03\5.7-Transportation.doc 5.7-1 Transportation and Circulation
5.7 TRANSPORTATION AND CIRCULATION
5.7.1 INTRODUCTION
The information derived for this section is based upon existing circulation plans, the proposed Specific Plan, and a traffic analysis prepared by Urban Crossroads, dated July 16, 2002 and supplemented July 29, 2002. The traffic analysis includes the project area and surrounding vicinity, based upon the requirements of the City of Chino and the San Bernardino County Congestion Management Program (CMP). The analysis has been updated from the original May 17, 2001 traffic impact analysis to address San Bernardino Associated Governments (SANBAG) staff comments related to absorption and traffic modeling assumptions related to the project. The revised EIR Section 5.7 and Traffic Impact Analysis report in Appendix C are based on specific direction provided by SANBAG staff in order to satisfy the County’s Congestion Management Program (CMP). Key changes in response to SANBAG requirements include a modified project trip distribution and specific recognition of project generated heavy truck traffic.
5.7.2 EXISTING CONDITIONS
Study Area and Methodology
A revised traffic analysis was completed by Urban Crossroads, Inc. on July 16, 2002 and supplemented on July 29, 2002 for the proposed project. The analysis was prepared consistent with the requirements of the City of Chino and the San Bernardino Association of Governments (SANBAG). SANBAG has adopted a Congestion Management Program (CMP) to analyze traffic impacts. The CMP requires an analysis of selected roadways within five (5) miles of the project boundaries. In this instance the selected roadways include the following Freeways, Expressways, and roadways: SR-91, I-15 Freeway, SR-83, SR-60, SR-17, SR-142, Edison Ave., Riverside Drive, Walnut Ave. Central Ave., Mountain Ave., and Archibald Ave.
The report divided the analysis into four (4) separate time frames, including: Existing Conditions-2001; Project Interim Year-2010, CMP Horizon Year-2020, and General Plan Buildout. The 2020 Horizon Year, with project traffic volumes, was based upon the subregional travel demand model used by San Bernardino County, referred to as the Comprehensive Transportation Plan (CTP). The average daily traffic volume forecasts were determined using the growth increment approach from the CTP traffic model for Year 1994 and Year 2020. A linear growth condition was then extrapolated between the 1994 and 2020 conditions. The Interim Year 2010 with Project traffic volumes were interpolated from the Year 2020 with Project traffic volumes using the applicable proportion of future growth.
The Preserve Master Plan EIR
H:\Client (PN-JN)\0576\05760012\FEIR.3.03\5.7-Transportation.doc 5.7-2 Transportation and Circulation
The analysis determined the level of service (LOS) consistent with the 1997 Highway Capacity Manual (HCM). The HCM defines LOS as a qualitative measure that describes operational conditions within a traffic stream, generally in terms of such factors as speed and travel time, freedom to maneuver, traffic interruptions, comfort and convenience, and safety. The criteria used to evaluate the traffic flow vary based upon the type of roadway and whether the traffic flow is considered to be uninterrupted or interrupted.
The definitions of LOS for uninterrupted flow, which is a flow that is unrestrained by the existence of traffic control devices, are as follows:
• LOS “A” represents free flow. Individual users are virtually unaffected by the presence of others in the traffic stream.
• LOS “B” is in the range of stable flow, but the presence of other users in the traffic stream begins to be noticeable. Freedom to select desired speeds is relatively unaffected, but there is a slight decline in the freedom to maneuver.
• LOS “C” is in the range of stable flow, but marks the beginning of the range of flow in which the operation of individual users becomes significantly affected by interactions with others in the traffic stream.
• LOS “D” represents high-density but stable flow. Speed and freedom to maneuver are severely restricted, and the driver experiences a generally poor level of comfort and convenience.
• LOS “E” represents operating conditions at or near the capacity level. All speeds are reduced to a low, but relatively uniform value. Small increases in flow will cause breakdowns in traffic movement.
• LOS “F” is used to define forced or breakdown flow. This condition exists wherever the amount of traffic approaching a point exceeds the amount that can traverse the point. Queues form behind such locations.
The level of service for interrupted traffic flow (flow restrained by the existence of traffic signals and other traffic control devices) differs slightly depending on the type of traffic control. The level of service is typically dependent on the quality of traffic flow at the intersections along a roadway. The HCM methodology expresses the level of service at an intersection in terms of delay time for the various intersection approaches. The HCM uses different procedures depending on the type of intersection control. The level of service is defined in terms of average delay for the various intersection analysis methodologies as noted below.
The Preserve Master Plan EIR
H:\Client (PN-JN)\0576\05760012\FEIR.3.03\5.7-Transportation.doc 5.7-3 Transportation and Circulation
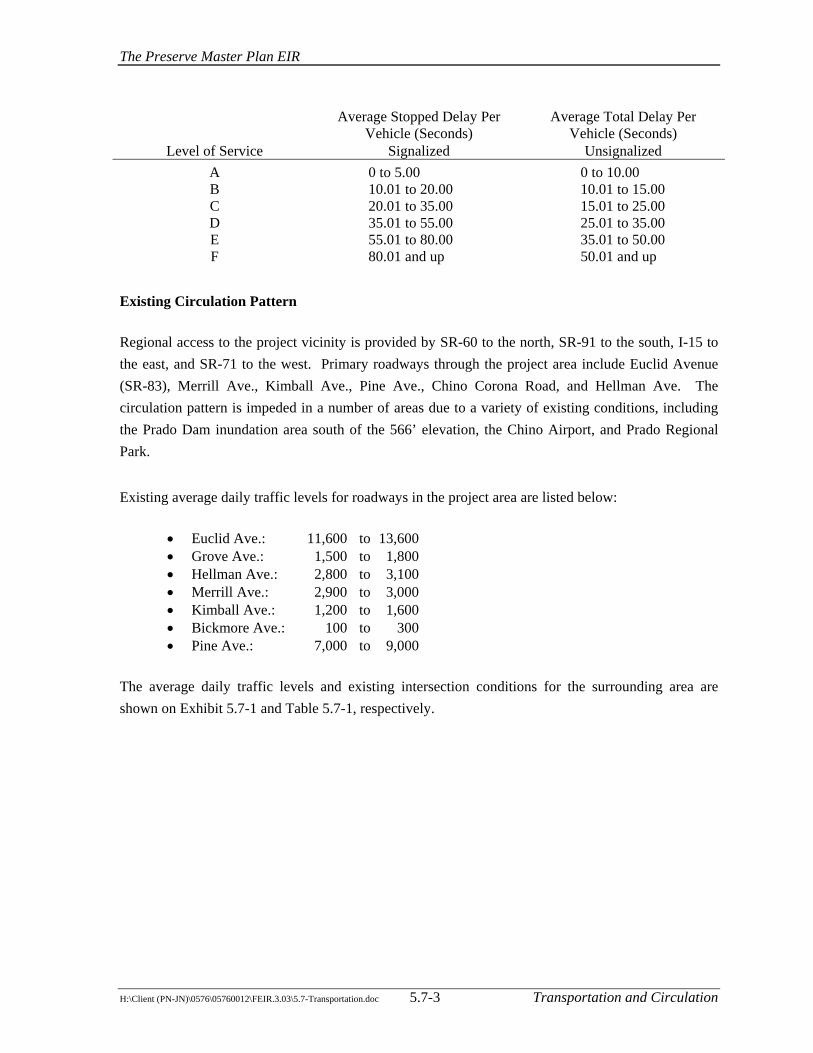
Average Stopped Delay Per Vehicle (Seconds)
Average Total Delay Per Vehicle (Seconds)
Level of Service Signalized Unsignalized A 0 to 5.00 0 to 10.00 B 10.01 to 20.00 10.01 to 15.00 C 20.01 to 35.00 15.01 to 25.00 D 35.01 to 55.00 25.01 to 35.00 E 55.01 to 80.00 35.01 to 50.00 F 80.01 and up 50.01 and up
Existing Circulation Pattern
Regional access to the project vicinity is provided by SR-60 to the north, SR-91 to the south, I-15 to the east, and SR-71 to the west. Primary roadways through the project area include Euclid Avenue (SR-83), Merrill Ave., Kimball Ave., Pine Ave., Chino Corona Road, and Hellman Ave. The circulation pattern is impeded in a number of areas due to a variety of existing conditions, including the Prado Dam inundation area south of the 566’ elevation, the Chino Airport, and Prado Regional Park.
Existing average daily traffic levels for roadways in the project area are listed below:
• Euclid Ave.: 11,600 to 13,600 • Grove Ave.: 1,500 to 1,800 • Hellman Ave.: 2,800 to 3,100 • Merrill Ave.: 2,900 to 3,000 • Kimball Ave.: 1,200 to 1,600 • Bickmore Ave.: 100 to 300 • Pine Ave.: 7,000 to 9,000
The average daily traffic levels and existing intersection conditions for the surrounding area are shown on Exhibit 5.7-1 and Table 5.7-1, respectively.
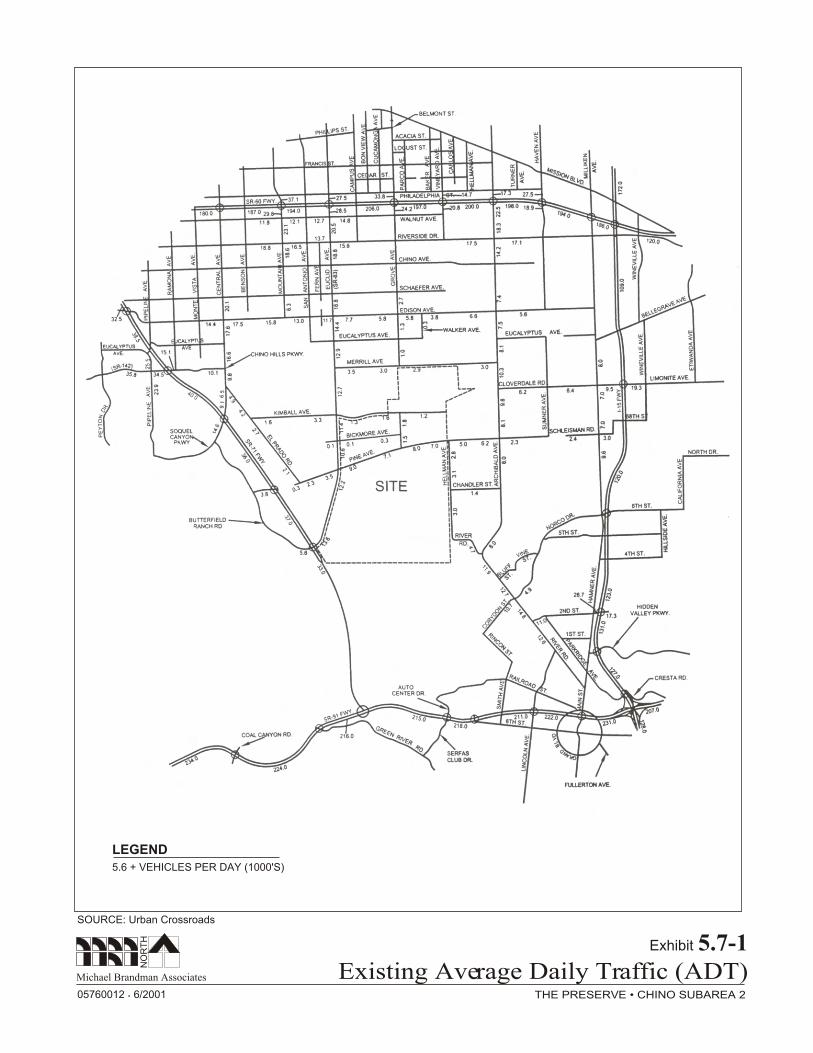
LEGEND
5.6 + VEHICLES PER DAY (1000'S)
THE PRESERVE • CHINO SUBAREA 2
Michael Brandman Associates
05760012 6/2001 •
NO
RT
H
Existing Average Daily Traffic (ADT)Exhibit 5.7-1
SOURCE: Urban Crossroads

The Preserve Master Plan EIR
H:\Client (PN-JN)\0576\05760012\FEIR.3.03\5.7-Transportation.doc 5.7-5 Transportation and Circulation
TABLE 5.7-1 EXISTING CONDITIONS INTERSECTION ANALYSIS
Intersection Approach Lanes1 North-Bound South-Bound East-Bound West-Bound
Delay2
(Secs.) Level of Service
Intersection
Tra
ffic
C
ontr
ol3
L T R L T R L T R L T R AM PM AM PM
Pipeline Ave. (NS) at: Chino Hills Pkwy. (EW) TS 1 2 0 1 2 0 1 3 1 1 2 1 45.4 64.4 D E
SR-71 Fwy. SB Ramps (NS) at: Chino Hills Pkwy. (EW) TS 0 0 0 1.5 0.5 1>> 0 4 1 1 2 0 9.4 9.6 A A Soquel Canyon Pkwy. (EW) TS 0 0 0 1.5 0 0.5 0 3 1>> 0 3 1>> 8.6 11.5 A B Pine Ave. (EW) TS 0 0 0 1 0 1 0 1 1 1 2 0 8.3 12.8 A B Euclid Ave. (EW) TS 1 0 1 1.5 0.5 1 0 2 1 1 2 0 17.7 17.1 B B
SR-71 Fwy. NB Ramps (NS) at: Chino Hills Pkwy. (EW) TS 1.5 1.5 0 0 0 0 2 2 0 0 2 1 12.9 12.1 B B Soquel Canyon Pkwy. (EW) TS 1.5 0 0.5 0 0 0 0 3 1>> 0 3 1>> 12.0 10.8 B B Pine Ave. (EW) AWS 2 0 0 0 0 0 2 0 0 0 0 0 8.8 8.6 A A Euclid Ave. (EW) TS 2 0 1>> 0 0 0 0 2 1>> 1 2 0 8.2 8.6 A A
Central Ave. (NS) at: Edison Ave. (EW) TS 1 2 1 1 2 1 1 2 0 1 2 1 31.4 31.4 C C Chino Hills Pkwy. (EW) TS 1 2 1 1 2 1 1.5 0.5 1 1 2 1 22.9 22.9 C C El Prado Rd. (EW) CSS 0 1 1 1 2 0 0 0 0 1 0 1 17.2 29.2 C D
El Prado Rd. (NS) at: Kimball Ave. (EW) CSS 1 1 0 1 1 1 1 1 0 1 1 0 12.6 12.7 B B Pine Ave. (EW) CSS 0 0 0 0 1 0 0 1 0 0 1 0 9.7 9.9 A A
Mountain Ave. (NS) at: SR-60 Fwy. WB Ramps (EW) TS 1 2 0 0 2 1 0 0 0 1 0 1 37.2 20.5 D C SR-60 Fwy. EB Ramps (EW) TS 0 2 1 1 2 0 1.5 0 0.5 0 0 0 23.4 --4 C F Walnut Ave. (EW) TS 1 2 1 1 2 1 1 1 1 1 1 1 -- 17.4 F B Riverside Dr. (EW) TS 1 2 0 1 2 1 1 2 1 1 2 1 25.1 29.7 C C Edison St. (EW) TS 0 0 0 1 0 1 1 2 0 0 2 1 14.4 11.6 B B
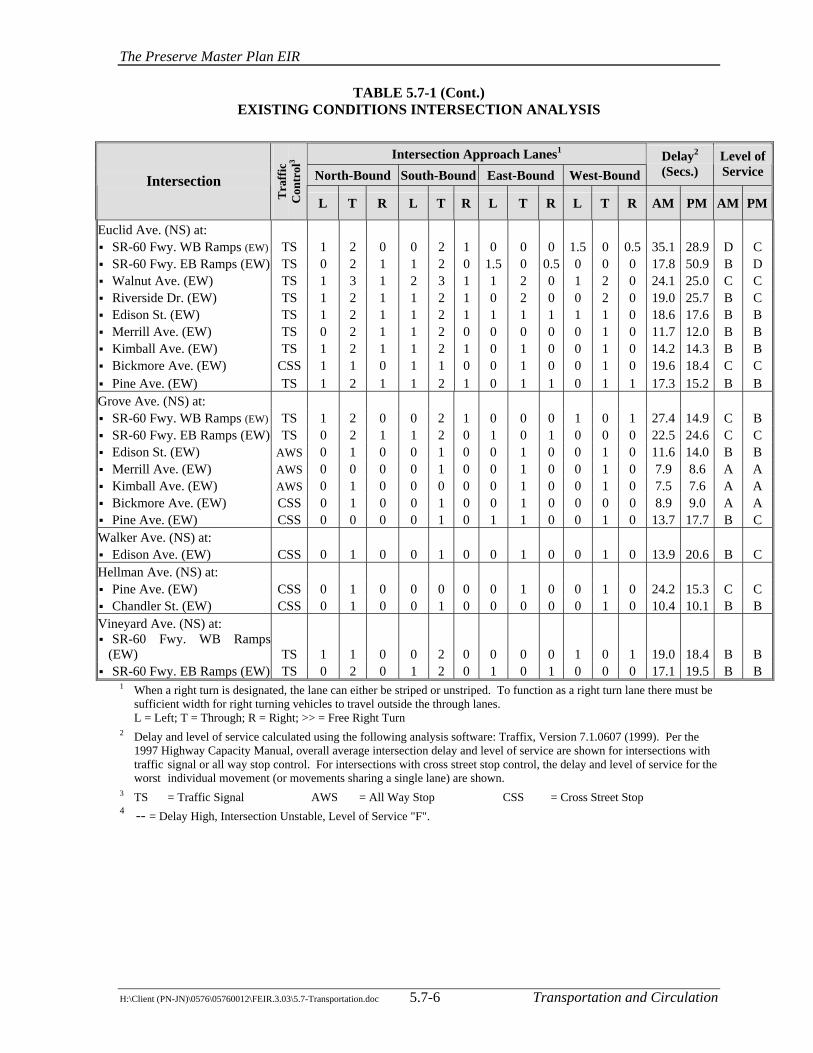
1 When a right turn is designated, the lane can either be striped or unstriped. To function as a right turn lane there must be sufficient width for right turning vehicles to travel outside the through lanes. L = Left; T = Through; R = Right; >> = Free Right Turn
2 Delay and level of service calculated using the following analysis software: Traffix, Version 7.1.0607 (1999). Per the 1997 Highway Capacity Manual, overall average intersection delay and level of service are shown for intersections with traffic signal or all way stop control. For intersections with cross street stop control, the delay and level of service for the worst individual movement (or movements sharing a single lane) are shown.
3 TS = Traffic Signal AWS = All Way Stop CSS = Cross Street Stop 4 -- = Delay High, Intersection Unstable, Level of Service "F".
The Preserve Master Plan EIR
H:\Client (PN-JN)\0576\05760012\FEIR.3.03\5.7-Transportation.doc 5.7-6 Transportation and Circulation
TABLE 5.7-1 (Cont.) EXISTING CONDITIONS INTERSECTION ANALYSIS
Intersection Approach Lanes1 North-Bound South-Bound East-Bound West-Bound
Delay2
(Secs.) Level of Service
Intersection
Tra
ffic
C
ontr
ol3
L T R L T R L T R L T R AM PM AM PM
Euclid Ave. (NS) at: SR-60 Fwy. WB Ramps (EW) TS 1 2 0 0 2 1 0 0 0 1.5 0 0.5 35.1 28.9 D C SR-60 Fwy. EB Ramps (EW) TS 0 2 1 1 2 0 1.5 0 0.5 0 0 0 17.8 50.9 B D Walnut Ave. (EW) TS 1 3 1 2 3 1 1 2 0 1 2 0 24.1 25.0 C C Riverside Dr. (EW) TS 1 2 1 1 2 1 0 2 0 0 2 0 19.0 25.7 B C Edison St. (EW) TS 1 2 1 1 2 1 1 1 1 1 1 0 18.6 17.6 B B Merrill Ave. (EW) TS 0 2 1 1 2 0 0 0 0 0 1 0 11.7 12.0 B B Kimball Ave. (EW) TS 1 2 1 1 2 1 0 1 0 0 1 0 14.2 14.3 B B Bickmore Ave. (EW) CSS 1 1 0 1 1 0 0 1 0 0 1 0 19.6 18.4 C C Pine Ave. (EW) TS 1 2 1 1 2 1 0 1 1 0 1 1 17.3 15.2 B B
Grove Ave. (NS) at: SR-60 Fwy. WB Ramps (EW) TS 1 2 0 0 2 1 0 0 0 1 0 1 27.4 14.9 C B SR-60 Fwy. EB Ramps (EW) TS 0 2 1 1 2 0 1 0 1 0 0 0 22.5 24.6 C C Edison St. (EW) AWS 0 1 0 0 1 0 0 1 0 0 1 0 11.6 14.0 B B Merrill Ave. (EW) AWS 0 0 0 0 1 0 0 1 0 0 1 0 7.9 8.6 A A Kimball Ave. (EW) AWS 0 1 0 0 0 0 0 1 0 0 1 0 7.5 7.6 A A Bickmore Ave. (EW) CSS 0 1 0 0 1 0 0 1 0 0 0 0 8.9 9.0 A A Pine Ave. (EW) CSS 0 0 0 0 1 0 1 1 0 0 1 0 13.7 17.7 B C
Walker Ave. (NS) at: Edison Ave. (EW) CSS 0 1 0 0 1 0 0 1 0 0 1 0 13.9 20.6 B C
Hellman Ave. (NS) at: Pine Ave. (EW) CSS 0 1 0 0 0 0 0 1 0 0 1 0 24.2 15.3 C C Chandler St. (EW) CSS 0 1 0 0 1 0 0 0 0 0 1 0 10.4 10.1 B B
Vineyard Ave. (NS) at: SR-60 Fwy. WB Ramps (EW) TS 1 1 0 0 2 0 0 0 0 1 0 1 19.0 18.4 B B
SR-60 Fwy. EB Ramps (EW) TS 0 2 0 1 2 0 1 0 1 0 0 0 17.1 19.5 B B 1 When a right turn is designated, the lane can either be striped or unstriped. To function as a right turn lane there must be
sufficient width for right turning vehicles to travel outside the through lanes. L = Left; T = Through; R = Right; >> = Free Right Turn
2 Delay and level of service calculated using the following analysis software: Traffix, Version 7.1.0607 (1999). Per the 1997 Highway Capacity Manual, overall average intersection delay and level of service are shown for intersections with traffic signal or all way stop control. For intersections with cross street stop control, the delay and level of service for the worst individual movement (or movements sharing a single lane) are shown.
3 TS = Traffic Signal AWS = All Way Stop CSS = Cross Street Stop 4 -- = Delay High, Intersection Unstable, Level of Service "F".

The Preserve Master Plan EIR
H:\Client (PN-JN)\0576\05760012\FEIR.3.03\5.7-Transportation.doc 5.7-7 Transportation and Circulation
TABLE 5.7-1 (Cont.) EXISTING CONDITIONS INTERSECTION ANALYSIS
Intersection Approach Lanes1 North-Bound South-Bound East-Bound West-Bound
Delay2
(Secs.) Level of Service
Intersection
Tra
ffic
C
ontr
ol3
L T R L T R L T R L T R AM PM AM PM
Archibald Ave. (NS) at: SR-60 Fwy. WB Ramps (EW) TS 1 3 0 0 4 0 0 0 0 1 0 1 21.8 17.2 C B
SR-60 Fwy. EB Ramps (EW) TS 0 4 0 1 3 0 1 0 1 0 0 0 15.6 22.8 B C Riverside Dr. (EW) TS 1 3 0 1 3 0 1 2 1 1 1 1 27.5 50.1 C D Edison Ave. (EW) TS 1 2 1 1 2 1 1 2 0 1 2 0 19.4 19.8 B B Merrill Ave. (EW) CSS 1 1 0 0 1 0 0 1 0 0 0 0 13.1 15.5 B C Cloverdale Rd. (EW) TS 0 1 0 1 1 0 0 0 0 1 0 1 13.0 15.4 B B Pine Ave. (EW) TS 1 1 0 1 1 0 1 1 0 1 1 0 31.1 24.4 C C River Rd. (EW) CSS 1 1 0 0 1 1 1 0 1 0 0 0 34.1 18.8 D C
River Rd. (NS) at: Corydon St. (EW) TS 1 1 1 1 2 0 1 1 1 1 1 1 28.6 28.0 C C Second St. (EW) TS 1 2 1 1 2 1 1 1 1 1 1 0 35.2 26.0 D C
Haven Ave. (NS) at: SR-60 Fwy. WB Ramps (EW) TS 2 3 0 0 3 1 0 0 0 1 0 1>> 10.8 9.2 B A
SR-60 Fwy. EB Ramps (EW) TS 0 3 0 2 3 0 2 0 1 0 0 0 16.3 14.5 B B Hamner Ave. (NS) at: Cloverdale Rd. (EW) TS 1 1 1 1 1 1 0 1 1 0 1 1 26.0 23.2 C C Schleisman Rd. (EW) CSS 1 1 0 1 1 0 0 1 0 0 1 0 --4 41.8 F E
I-15 Fwy. SB Ramps (NS) at: Limonite Ave. (EW) TS 0 0 0 1 0 1 0 2 1 1 2 0 15.2 17.4 B B Second St. (EW) TS 0 0 0 1 0 1 0 2 0 1 2 0 15.6 17.1 B B
I-15 Fwy. NB Ramps (NS) at: Limonite Ave. (EW) TS 0.5 0 1.5 0 0 0 1 2 0 0 2 1 14.7 15.0 B B Second St. (EW) TS 1 0 1 0 0 0 1 1 0 0 1 0 43.4 33.6 D C
Lincoln Ave. (NS) at: Pomona Rd. (EW) TS 2 2 0 1 2 0 0 1 1> 1 1 0 29.4 44.1 C D SR-91 EB Ramps (EW) TS 1 2 1 1 2 0 0 1 0 0 1 1 18.6 20.4 B C
1 When a right turn is designated, the lane can either be striped or unstriped. To function as a right turn lane there must be sufficient width for right turning vehicles to travel outside the through lanes. L = Left; T = Through; R = Right; >> = Free Right Turn
2 Delay and level of service calculated using the following analysis software: Traffix, Version 7.1.0607 (1999). Per the 1997 Highway Capacity Manual, overall average intersection delay and level of service are shown for intersections with traffic signal or all way stop control. For intersections with cross street stop control, the delay and level of service for the worst individual movement (or movements sharing a single lane) are shown.
3 TS = Traffic Signal AWS = All Way Stop CSS = Cross Street Stop 4 -- = Delay High, Intersection Unstable, Level of Service "F".

The Preserve Master Plan EIR
H:\Client (PN-JN)\0576\05760012\FEIR.3.03\5.7-Transportation.doc 5.7-8 Transportation and Circulation
Existing Service Levels
Exhibit 5.7-1 identified the existing average daily traffic. Intersections within the study area currently operate at LOS “D” or better during the peak hours, except for the following intersections that operate at LOS “E” or “F”:
• Pipeline Ave. (NS) at Chino Hills Parkway (EW). • Mountain Ave. (NS) at SR-60 Freeway EB Ramps (EW). • Mountain Ave. (NS) at Walnut Ave. (EW). • Hamner Ave. (NS) at Schleisman Road (EW).
Traffic signals currently appear to be warranted at the following study area intersections:
• Central Ave. (NS) at El Prado Road (EW) • Hellman Ave. (NS) at Pine Ave. (EW) • Archibald Ave. (NS) at Merrill Ave. (EW) • Archibald Ave. (NS) at River Road (EW) • Hamner Ave. (NS) at Schleisman (EW)
Existing Master Circulation Plans
The City of Chino General Plan Circulation Element delineates the future roadway pattern for the current City limits, but extends into only a portion of the project area (see Exhibit No. 5.7-2). The streets within or adjacent to the project area, Euclid Ave. and Merrill Ave., are designated on the City’s of Chino General Plan as Expressway and Secondary roadways, respectively. The balance of the study area is located within a number of other jurisdictions, including the Cities of Chino Hills, Ontario, Corona, and Norco. A portion of the area lying north and east of the project site is within the unincorporated area of San Bernardino County and the Eastvale area of Riverside County, respectively. The traffic report in Appendix C identifies the roadway systems within these areas.
Existing Transit Services
Bus Service
Regular fixed route transit service is not provided within the project area. Bus transit in the vicinity of the project area is provided by Omnitrans, which operates transit systems within most San Bernardino County jurisdictions and some communities in Riverside County. Existing bus service is provided by Omnitrans on four outlying routes on hourly headways as follows: 1) Route 62 N. Upland—Chino Town Square, 2) Route 63 N. Ontario Civic Center—Chino Town Square, 3) Route 65 Montclair-Chino Hills, and 4) Route 72 Chino—Chino Hills.

THE PRESERVE • CHINO SUBAREA 2
Michael Brandman Associates
MAP NOT TO SCALENO
RT
H
Circulation Element City of ChinoExhibit 5.7-2
05760012 06/2001 •
SCALE IN FEET
6000 3000 0 6000
GRAND AVE.
EUCALYPTUS
CHINO HILLS PKWY.
CALIFORNIA INSTITUTIONFOR MEN
CY
PR
ES
S C
HA
NN
EL
MERRILL AVE.
EL P
RAD
O R
D.
SR
71
SR
71
CHINO AIRPORT
KIMBALL AVE.G
RO
VE
A
VE
.
EUCALYPTUS AVE.
SITE
*
EDISON AVE.
SCHAEFER AVE.
CHINO AVE.
RIVERSIDE DR.
WALNUT AVE.
EU
CL
ID A
VE
.
FE
RN
A
VE
.
SA
N A
NT
ON
IO A
VE
.
MO
NT
E V
ISTA
A
VE
.
BE
NS
ON
A
VE
.
CE
NT
RA
L A
VE
.
MO
NT
E V
ISTA
AV
E.
RA
MO
NA
AV
E.
PIP
EL
INE
AV
E.
EA
ST
EN
D A
VE
.
RE
SE
RV
OIR
A
VE
.
PHILLIPS BLVD.
FRANCIS AVE.
PHILADELPHIC ST.
POMONA FWY SR 60
CH
INO
CR
EE
K
8
8
8
8
8
8
8
8
8
8
8
8
Freeway
Expressway
Major (6 Lanes Except Where Noted As 8)
Primary
Secondary
SOURCE: Urban Crossroads and City of Chino
SO
UT
HE
RN
PA
CIF
IC R
R

The Preserve Master Plan EIR
H:\Client (PN-JN)\0576\05760012\FEIR.3.03\5.7-Transportation.doc 5.7-10 Transportation and Circulation
Rail Service
The only rail service near the project area is commuter rail service, referred to as Metrolink, which is provided by the Southern California Regional Rail Authority. The Southern California Regional Rail Authority (Metrolink) currently operates four commuter rail lines on weekdays surrounding the Chino Basin: 1) the San Bernardino Line (13 inbound, 13 outbound), 2) the Riverside Line (6 inbound, 6 outbound), 3) the Inland Empire-Orange County Line (5 inbound, 5 outbound), and the Riverside-Fullerton—Los Angeles Line (2 inbound, 2 outbound). This service operates primarily during peak hours and connects the Downtown Riverside Station with the Downtown Los Angeles station using the Union Pacific rail line. One of the intermediate stations along this route is the East Ontario Station, located north of the project area, near Mission Boulevard and Haven Avenue.
The California High Speed Rail Commission is evaluating a potential high speed rail line that approximates I-10 and SR-60 between Los Angeles and Ontario, and I-15 between Ontario and San Diego as part of a statewide system.
Other Relevant Transportation Studies
The Four Corners Study Final Report (June 2000) is a long-range transportation planning study of the needs in a broad area encompassed by SR-57 to the west, SR-60 to the north, I-15 to the east, and SR-91 to the south. The Four Corners Study Area is characterized by topographic constraints, few major roadways, and well-documented transportation needs. The area is strategically located as a ‘gateway’ from the Inland Empire to Orange and Los Angeles counties.
The study identifies a number of committed transportation and circulation improvements by the year 2005. These include, but are not limited to: 1) upgrades to the SR 71 freeway between SR-60 and SR-83 (Euclid Avenue), 2) addition of lanes to SR-71 between SR-83 and SR-91, 3) addition of HOV lanes to SR-60 west from I-15 to Los Angeles County, and 4) addition of auxiliary lanes to SR-91 between SR-71 and SR-241 (Eastern Tollway). These committed improvements are included in the SCAG regional circulation network used in the Traffic Impact Analysis in the proposed project EIR. The SCAG 2020 traffic model used in the EIR traffic analysis allocates trip to the regional network based upon land use data included in adopted SCAG forecasts. Employment centers in Los Angeles County and Orange County to the west and southwest are anticipated to be significant trip destinations for new residents, as are employment centers in Ontario and San Bernardino County to the northeast.
The Four Corners Study identifies a 47% increase in trip growth between the Inland Empire and Orange/Los Angeles counties (i.e. through the Four Corners Study Area) from 1997 to 2020. This trip growth is consistent with growth included in the SCAG traffic model utilized in the Traffic Impact

The Preserve Master Plan EIR
H:\Client (PN-JN)\0576\05760012\FEIR.3.03\5.7-Transportation.doc 5.7-11 Transportation and Circulation
Analysis for the proposed project EIR. The ability to accommodate this trip growth is severely constrained by the limited number of existing east-west routes, including SR-91, SR-60, SR-142 (Carbon Canyon Road), and Grand Avenue.
The study identifies four broad alternatives to accommodate this regional trip growth: 1) maximize highway capacity; 2) maximize transit ridership; 3) add new roads and toll lanes; and 4) implement the Regional Transportation Plan. Key principles relied upon in defining a set of recommended improvements for the study area included the following: 1) Relieve inter-county congestion; 2) provide travel options; 3) identify feasible solutions and improvements with realistic costs; 4) protect the quality of life; 5) avoid shifting traffic problems; 6) minimize significant environmental impacts; and 6) demonstrate sensitivity to landowner concerns. Key policy recommendations of the study include: 1) Support Metrolink improvements; 2) use demographic forecasts that are compatible with transportation infrastructure; 3) provide incentives for employment in Inland Empire, and housing in Los Angeles/Orange counties; and 4) support Intelligent Transportation Systems (ITS), Transit-Oriented Development (TOD) and High-Occupancy Travel (HOT) lanes.
As an outgrowth of the Four Corners Study process, a Four Corners Policy Committee of representatives from participating and affected agencies has been established, and a list of fifty-three (53) active transportation projects has been identified within the study area. In the vicinity of the proposed project, the Four Corners Study specifically identifies Pine Avenue/Schleisman Avenue/Arlington Boulevard as a prospective corridor for intercounty transportation in the CTP being developed by SANBAG. The status and priorities of active projects on the list are monitored through the Policy Committee meeting process. The Four Corners Study circulation network, including committed and recommended improvements, was accounted for in the Traffic Impact Analysis for the proposed project.
5.7.3 THRESHOLDS OF SIGNIFICANCE
Thresholds of significance for traffic levels are separated into areas deemed deficient and those identified as significant. The term deficiency relates to the operational level below which traffic movement is no longer considered acceptable. The City of Chino General Plan indicates that peak hour intersection operations of LOS “D” or better are generally acceptable. Any operation below that, such as LOS “E” or “F” is considered inadequate or deficient.
For freeway facilities the San Bernardino CMP defines deficient as any freeway segment operating or projected to operate at LOS “F”, unless the segment is identified explicitly in the CMP document. Another way of viewing this is that by maintaining an LOS of “E” or better and allowing the continued existence of LOS “F”, as identified in the CMP, an acceptable level of service is achieved.

The Preserve Master Plan EIR
H:\Client (PN-JN)\0576\05760012\FEIR.3.03\5.7-Transportation.doc 5.7-12 Transportation and Circulation
Significant impact is a CEQA related term and not addressed directly in the CMP document. A traffic impact is considered significant if it meets both of the following criteria:
• It contributes measurable traffic to, and;
• It substantially and adversely changes the level of service at any off-site location projected to experience deficient operations under foreseeable cumulative conditions, where feasible improvements consistent with the City of Chino General Plan cannot be constructed.
5.7.4 PROJECT IMPACTS
Analytical Process
The proposed project would result in the conversion of existing agricultural and dairy uses to a mixture of residential, commercial, business park, industrial, airport-related uses, and public facilities. A determination of the proposed project’s traffic impact was evaluated using the following process:
• Determine trip generation rates. • Determine trip distribution patterns. • Assign or allocate traffic on area roadways/freeways.
The traffic impact analysis is summarized in this section, and included in Appendix C of this EIR. The impact analysis represents a “worst-case” analysis in that potential reductions in daily and peak hour vehicle trips attributable to the planned transit system for the project are not accounted for in the analysis.
Generation Rates
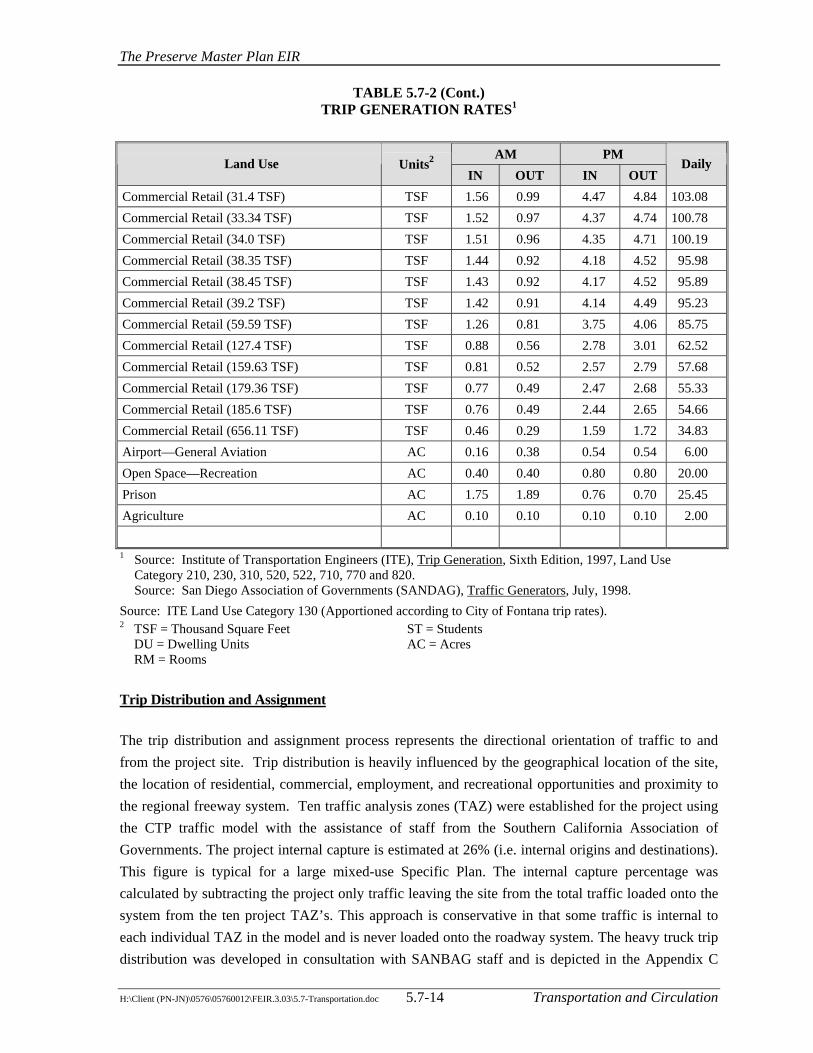
The traffic generation rates for each type of land use are displayed in Table 5.7-2.
The projected level of development for the Interim Year (2010) will generate a total of approximately 71,499 trip-ends per day with 5,722 vehicles per hour during the AM peak hour and 7,793 vehicles per hour during the PM peak hour. The heavy truck vehicle volumes (included in the totals) are 1,254 trip-ends per day with 70 vehicles per hour during the AM peak hour. For Buildout conditions, development is estimated to generate a total of approximately 244,930 trip-ends per day with 18,993 vehicles per hour during the AM peak hour and 25,911 vehicles per hour during the PM peak hour. The heavy truck vehicle volumes (included in the totals) are 3,633 trip-ends per day with 202 vehicles per hour during the AM peak hour.

The Preserve Master Plan EIR
H:\Client (PN-JN)\0576\05760012\FEIR.3.03\5.7-Transportation.doc 5.7-13 Transportation and Circulation
TABLE 5.7-2 TRIP GENERATION RATES1
AM PM Land Use Units2
IN OUT IN OUT Daily
Light Industrial (Auto) TSF 0.68 0.14 0.18 0.70 5.81 Light Industrial (2&3 Axle Trucks) TSF 0.03 0.01 0.01 0.03 0.63 Light Industrial (4+ Axle Trucks) TSF 0.02 0.01 - - 0.52 Light Industrial (Total) TSF 0.73 0.16 0.19 0.73 6.96 Single-Family Detached Residential DU 0.19 0.56 0.65 0.36 9.57 Multi-Family Attached Residential DU 0.07 0.37 0.36 0.18 5.86 Hotel RM 0.34 0.22 0.32 0.29 8.23 Elementary School ST 0.17 0.12 0.01 0.01 1.02 Jr. High School ST 0.26 0.20 0.08 0.08 1.45 Office (11.6 TSF) TSF 2.54 0.35 1.35 6.60 21.88 Office (18.5 TSF) TSF 2.31 0.32 0.92 4.49 19.63 Office (31.4 TSF) TSF 2.08 0.28 0.62 3.03 17.36 Office (34.79 TSF) TSF 2.03 0.28 0.58 2.82 16.95 Office (37.79 TSF) TSF 2.00 0.27 0.55 2.67 16.63 Office (38.3 TSF) TSF 1.99 0.27 0.54 2.65 16.58 Office (39.36 TSF) TSF 1.98 0.27 0.53 2.60 16.48 Office (64.86 TSF) TSF 1.79 0.24 0.40 1.95 14.67 Office (75.0 TSF) TSF 1.74 0.24 0.37 1.81 14.19 Office (140.6 TSF) TSF 1.53 0.21 0.29 1.40 12.26 Office (177.74 TSF) TSF 1.46 0.20 0.27 1.30 11.61 Office (184.7 TSF) TSF 1.45 0.20 0.26 1.29 11.51 Office (224.1 TSF) TSF 1.39 0.19 0.25 1.22 11.01 Commercial Retail (6.7 TSF) TSF 2.90 1.86 7.56 8.19 178.92 Commercial Retail (10.0 TSF) TSF 2.47 1.58 6.59 7.14 155.09 Commercial Retail (10.8 TSF) TSF 2.39 1.53 6.42 6.96 150.88 Commercial Retail (16.12 TSF) TSF 2.04 1.30 5.61 6.07 130.78 Commercial Retail (18.5 TSF) TSF 1.93 1.23 5.35 5.80 124.51 Commercial Retail (21.8 TSF) TSF 1.80 1.15 5.06 5.48 117.42 Commercial Retail (24.49 TSF) TSF 1.72 1.10 4.86 5.27 112.64 Commercial Retail (25.05 TSF) TSF 1.70 1.09 4.83 5.23 111.74 Commercial Retail (30.38 TSF) TSF 1.58 1.01 4.52 4.90 104.30
1 Source: Institute of Transportation Engineers (ITE), Trip Generation, Sixth Edition, 1997, Land Use Category 210, 230, 310, 520, 522, 710, 770 and 820. Source: San Diego Association of Governments (SANDAG), Traffic Generators, July, 1998.
Source: ITE Land Use Category 130 (Apportioned according to City of Fontana trip rates). 2 TSF = Thousand Square Feet ST = Students
DU = Dwelling Units AC = Acres RM = Rooms
The Preserve Master Plan EIR
H:\Client (PN-JN)\0576\05760012\FEIR.3.03\5.7-Transportation.doc 5.7-14 Transportation and Circulation
TABLE 5.7-2 (Cont.) TRIP GENERATION RATES1
AM PM Land Use Units2
IN OUT IN OUT Daily
Commercial Retail (31.4 TSF) TSF 1.56 0.99 4.47 4.84 103.08 Commercial Retail (33.34 TSF) TSF 1.52 0.97 4.37 4.74 100.78 Commercial Retail (34.0 TSF) TSF 1.51 0.96 4.35 4.71 100.19 Commercial Retail (38.35 TSF) TSF 1.44 0.92 4.18 4.52 95.98 Commercial Retail (38.45 TSF) TSF 1.43 0.92 4.17 4.52 95.89 Commercial Retail (39.2 TSF) TSF 1.42 0.91 4.14 4.49 95.23 Commercial Retail (59.59 TSF) TSF 1.26 0.81 3.75 4.06 85.75 Commercial Retail (127.4 TSF) TSF 0.88 0.56 2.78 3.01 62.52 Commercial Retail (159.63 TSF) TSF 0.81 0.52 2.57 2.79 57.68 Commercial Retail (179.36 TSF) TSF 0.77 0.49 2.47 2.68 55.33 Commercial Retail (185.6 TSF) TSF 0.76 0.49 2.44 2.65 54.66 Commercial Retail (656.11 TSF) TSF 0.46 0.29 1.59 1.72 34.83 Airport—General Aviation AC 0.16 0.38 0.54 0.54 6.00 Open Space—Recreation AC 0.40 0.40 0.80 0.80 20.00 Prison AC 1.75 1.89 0.76 0.70 25.45 Agriculture AC 0.10 0.10 0.10 0.10 2.00
1 Source: Institute of Transportation Engineers (ITE), Trip Generation, Sixth Edition, 1997, Land Use Category 210, 230, 310, 520, 522, 710, 770 and 820. Source: San Diego Association of Governments (SANDAG), Traffic Generators, July, 1998.
Source: ITE Land Use Category 130 (Apportioned according to City of Fontana trip rates). 2 TSF = Thousand Square Feet ST = Students
DU = Dwelling Units AC = Acres RM = Rooms
Trip Distribution and Assignment
The trip distribution and assignment process represents the directional orientation of traffic to and from the project site. Trip distribution is heavily influenced by the geographical location of the site, the location of residential, commercial, employment, and recreational opportunities and proximity to the regional freeway system. Ten traffic analysis zones (TAZ) were established for the project using the CTP traffic model with the assistance of staff from the Southern California Association of Governments. The project internal capture is estimated at 26% (i.e. internal origins and destinations). This figure is typical for a large mixed-use Specific Plan. The internal capture percentage was calculated by subtracting the project only traffic leaving the site from the total traffic loaded onto the system from the ten project TAZ’s. This approach is conservative in that some traffic is internal to each individual TAZ in the model and is never loaded onto the roadway system. The heavy truck trip distribution was developed in consultation with SANBAG staff and is depicted in the Appendix C

The Preserve Master Plan EIR
H:\Client (PN-JN)\0576\05760012\FEIR.3.03\5.7-Transportation.doc 5.7-15 Transportation and Circulation
Traffic Impact Study. To evaluate impacts and to comply with existing CMP requirements 63 intersections and 35 freeway segments were analyzed. Please refer to the Appendix C for detailed information on turning movements and distribution patterns.
The project area and surrounding vicinity consists primarily of agriculture related uses. Future development, including that proposed by the project, will transform the area and add a number of new roadways and intersections. As such, the traffic study also analyzed a number of future intersections for review beyond those that currently exist, which include the following:
• Hellman Ave. and Merrill Ave. • Hellman Ave. and Kimball Ave. • Vineyard Ave. and Edison Ave. • I-15 Freeway SB Ramps (NS) and Galena Street. • I-15 Freeway NB Ramps (NS) at Galena Street.
Proposed Circulation Plan
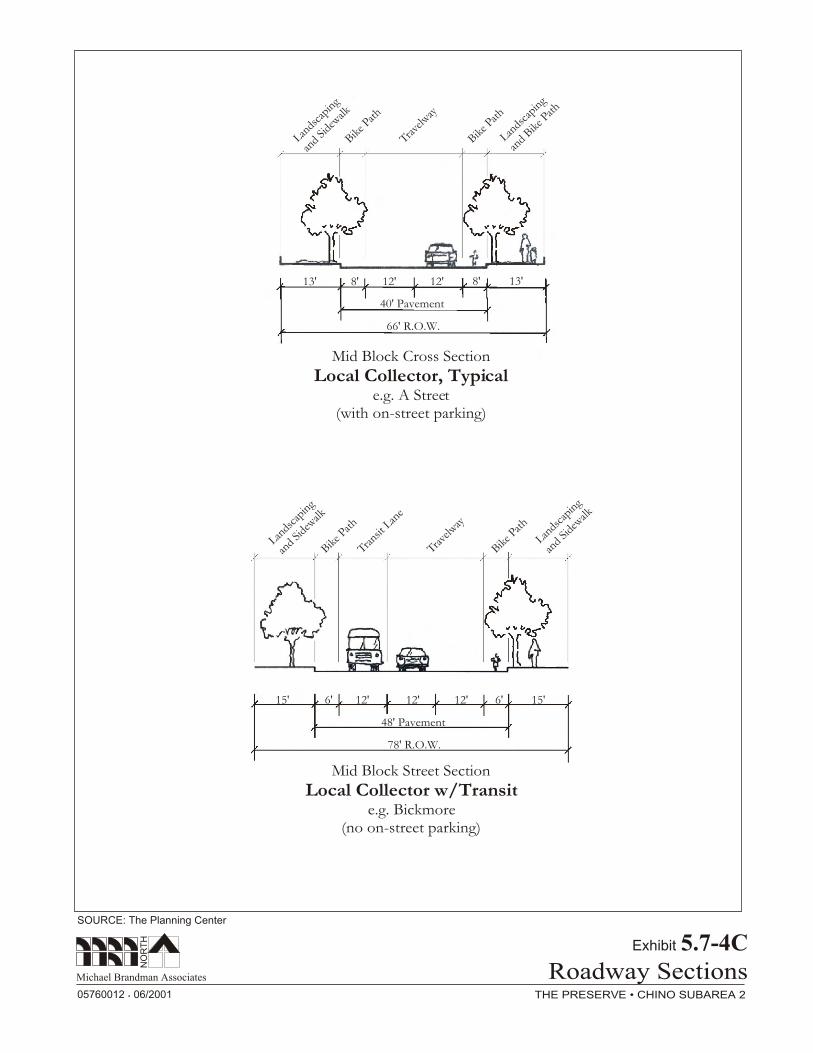
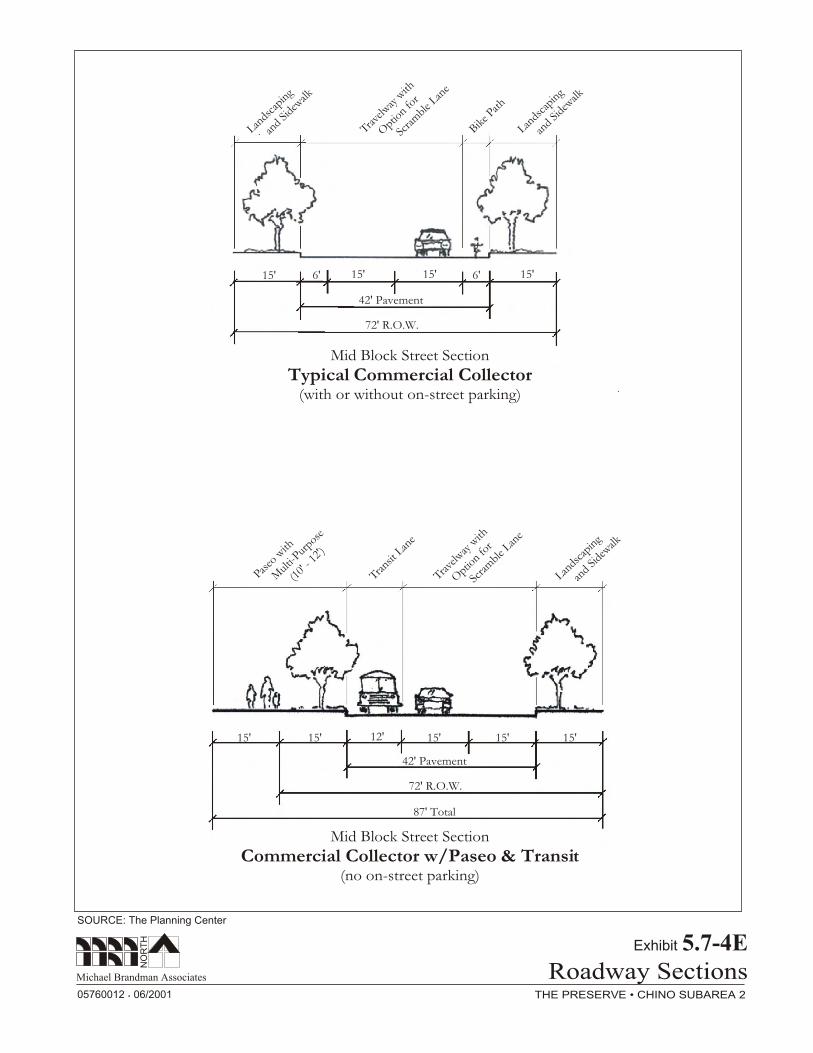
The Specific Plan provides the following planned major roadways and circulation system characteristics as contained in Exhibits 5.7-3 and 5.7-4:
• Euclid Ave.: 200 feet right of way (Expressway, 8 lanes)
• Hellman Ave. (from north of Kimball Ave. south to River Road): 104 feet right of way with Paseo (Primary Arterial 4 lanes)
• Hellman Ave. (extending from north of Kimball Ave. to near Merrill Ave.): 104 feet right of way with Paseo (Primary Arterial 4 lanes)
• Pine Ave.: 122 feet right of way with Paseo (Major Arterial 6 lanes)
• Merrill Ave.: 88 feet right of way (Secondary Arterial 4 lanes)
• Kimball Ave.: 104 feet right of way with Paseo (Primary Arterial with 4 lanes)
Impacts on Level of Service
Impacts on the level of service have been separated into the following categories:
• Without Project: The portion of the future traffic attributable to regional development without the proposed project.
• With Project: The combined portion attributable to regional development and the proposed project.

SOURCE: The Planning Center
THE PRESERVE • CHINO SUBAREA 2
Michael Brandman Associates
MAP NOT TO SCALENO
RT
H
Circulation PlanExhibit 5.7-3
05760012 06/2001 •
SCALE IN FEET
6000 3000 0 6000

SOURCE: The Planning Center
THE PRESERVE • CHINO SUBAREA 2
Michael Brandman Associates
MAP NOT TO SCALENO
RT
H
Roadway SectionsExhibit 5.7-4A
05760012 06/2001 •
SCALE IN FEET
6000 3000 0 6000
15'
Lands
capi
ng
Mid Block Street Section
Major Arterial (expressway)Euclid Ave. between Kimball & Pine Avenues
(no on-street parking)
Mult
ipur
pose T
rail
Lands
capi
ng
Tra
velw
ay
Lands
cape
d
M
edian
Trave
lway
Lands
capi
ng
Mult
ipur
pose
T
rail
Lands
capi
ng
8' 10 10'
*turn lanes assumedas necessary in medians
12' 12' 12' 12' 64' Median 12' 12' 12' 12' 10' 8' 10 15'
15' Average(35' Min.)
50' Average 48' Pavement
200' R.O.W.
48' Pavement
20'
Paseo
with
m
ulti-p
urpos
e
(10
' - 12
')
Mid Block Street Section
Major Arterial w/ Paseoe.g. Pine Avenue
(no on-street parking)
Trave
lway
Lands
cape
d
M
edian
Trave
lway
Paseo
with
M
ulti-p
urpos
e
(10
' - 12
')
10' 14' 12' 12' 26' Median
102' Pavement
122' R.O.W.
162' Total
12' 12' 14' 10' 20'easement

THE PRESERVE • CHINO SUBAREA 2
Michael Brandman Associates
SOURCE: The Planning Center
NO
RT
H
Roadway SectionsExhibit 5.7-4B
05760012 06/2001 •
SCALE IN FEET
6000 3000 0 6000
Lands
cape
d
Med
ian
Trave
lway
Paseo
With multi-purpose trail(10'-12')
Easement20'26'14'14' 12'14'12' 12'
Lands
capi
ng
12'
Trave
lway
Lands
capi
ng
20' 12' 12' 20'
64' Pavement
88' R.O.W.
Mid Block Street Section
Arterial(no on-street parking)
124' Total
66' PavementMedian
104' R.O.W.
Mid Block Street Section
Primary Arterial w/Paseoe.g. Kimball or Hellman(no on-street parking)
Lands
capi
ng
Trave
lway
12'
THE PRESERVE • CHINO SUBAREA 2
Michael Brandman Associates
SOURCE: The Planning Center
NO
RT
H
Roadway SectionsExhibit 5.7-4C
05760012 06/2001 •
SCALE IN FEET
6000 3000 0 6000
Lands
capi
ng
and
Sidew
alk
13'
Mid Block Cross Section
Local Collector, Typicale.g. A Street
(with on-street parking)
Mid Block Street Section
Local Collector w/Transite.g. Bickmore
(no on-street parking)
8' 12' 12' 8' 13'
Bike P
ath
Trave
lway
Bike P
ath
Lands
capi
ng
and
Bike P
ath
40' Pavement
66' R.O.W.
Lands
capi
ng
and
Sidew
alk
15'
Bike P
ath
Trans
it Lan
e
Trave
lway
Bike P
ath
Lands
capi
ng
and
Sidew
alk
6' 12' 12' 12' 6' 15'
48' Pavement
78' R.O.W.

THE PRESERVE • CHINO SUBAREA 2
Michael Brandman Associates
SOURCE: The Planning Center
NO
RT
H
Roadway SectionsExhibit 5.7-4D
05760012 06/2001 •
SCALE IN FEET
6000 3000 0 6000
15'
Mid Block Street Section
Local Collector w/Paseo & Transit(with or without on-street parking)
Paseo
with
M
ulti-p
urpos
e
(10
' - 12
')
13' 14' 12' 14' 13'
40' Pavement
Lands
capi
ng
an
d Sid
ewalk
Opt
ion
for M
edian
o
r Scr
ambl
e Lan
e
Trave
lway
Lands
capi
ng
an
d Sid
ewalk
Paseo
with
M
ulti-p
urpos
e
(10
' - 12
')
Lands
capi
ng
an
d Sid
ewalk
Mid Block Street Section
Local Collector w/Paseoe.g. Loop Road
(with or without on-street parking)
Trans
it Lan
e
Trave
lway
Opt
ion
for M
edian
o
r Scr
ambl
e Lan
e
Trave
lway
52' Pavement
93' Total
15' 13' 14' 12' 14' 12' 13'
81' Total
66' R.O.W.
78' R.O.W.
THE PRESERVE • CHINO SUBAREA 2
Michael Brandman Associates
SOURCE: The Planning Center
NO
RT
H
Roadway SectionsExhibit 5.7-4E
05760012 06/2001 •
SCALE IN FEET
6000 3000 0 6000
15'
Lands
capi
ng
an
d Sid
ewalk
Mid Block Street Section
Typical Commercial Collector(with or without on-street parking)
Trave
lway
with
O
ptio
n fo
r
Scr
ambl
e Lan
e
Bike P
ath
Lands
capi
ng
an
d Sid
ewalk
6' 15' 15' 6' 15'
42' Pavement
72' R.O.W.
15'
Paseo
with
M
ulti-P
urpos
e
(10
' - 12
')
Lands
capi
ng
an
d Sid
ewalk
Trans
it Lan
e
Trave
lway
with
O
ptio
n fo
r
Scr
ambl
e Lan
e
15' 12' 15' 15' 15'
42' Pavement
72' R.O.W.
Mid Block Street Section
Commercial Collector w/Paseo & Transit(no on-street parking)
87' Total

THE PRESERVE • CHINO SUBAREA 2
Michael Brandman Associates
SOURCE: The Planning Center
NO
RT
H
Roadway SectionsExhibit 5.7-4F
05760012 06/2001 •
SCALE IN FEET
6000 3000 0 6000
Lands
capi
ng
an
d Sid
ewalk
Mid Block Street Section
Commercial Collector w/Paseo(no on-street parking)
15'
Trave
lway
with
O
ptio
n fo
r
Scr
ambl
e Lan
e
Paseo
with
M
ulti-p
urpos
e
(10
' - 12
')
15' 15' 15' 15'
30' Pavement
60' R.O.W.
75' Total
14'
M
ulti-p
urpos
e
Sid
ewalk
A
ngled
Par
king
T
rave
lway
A
ngled
Par
king
M
ulti-P
urpos
e
Sid
ewalk
18' 12' 12' 18' 14'
88' R.O.W.
Main Street Collector (no on-street parking)
Mid Block Street Section
Typical Local ResidentialGeneral Access within a Tract
(with on-street parking)
Lands
capi
ng
an
d Sid
ewalk
12' 8' 10' 8' 12'10'
36' Pavement
60' R.O.W.
Bike P
ath
Trave
lway
Bike P
ath
Lands
capi
ng
an
d Sid
ewalk

The Preserve Master Plan EIR
H:\Client (PN-JN)\0576\05760012\FEIR.3.03\5.7-Transportation.doc 5.7-23 Transportation and Circulation
Future Impacts—Without Project Traffic Conditions
Interim Year-2010 traffic projections have been interpolated between Year 2020 traffic volumes and existing traffic volumes utilizing a proportionate share of the future growth increment. For Interim Year-2010 Without Project traffic conditions, traffic signals are projected to be warranted at the following intersections:
• SR-71 Freeway NB Ramps (NS) at Pine Ave. (EW). • El Prado Road (NS) at Kimball Ave. (EW). • Grove Ave. (NS) at Edison Ave. (EW). • Walker Ave. (NS) at Edison Ave. (EW). • I-15 Freeway SB Ramps (NS) at Galena Street (EW). • I-15 Freeway NB Ramps (NS) at Galena Street (EW).
For Year 2020 Without Project traffic conditions, a traffic signal is projected to be at the intersection of Vineyard Ave. (NS) at Edison Ave. (EW). Roadway improvements for Interim Year (2010) and Year 2020 are identified in the traffic report contained in Appendix C.
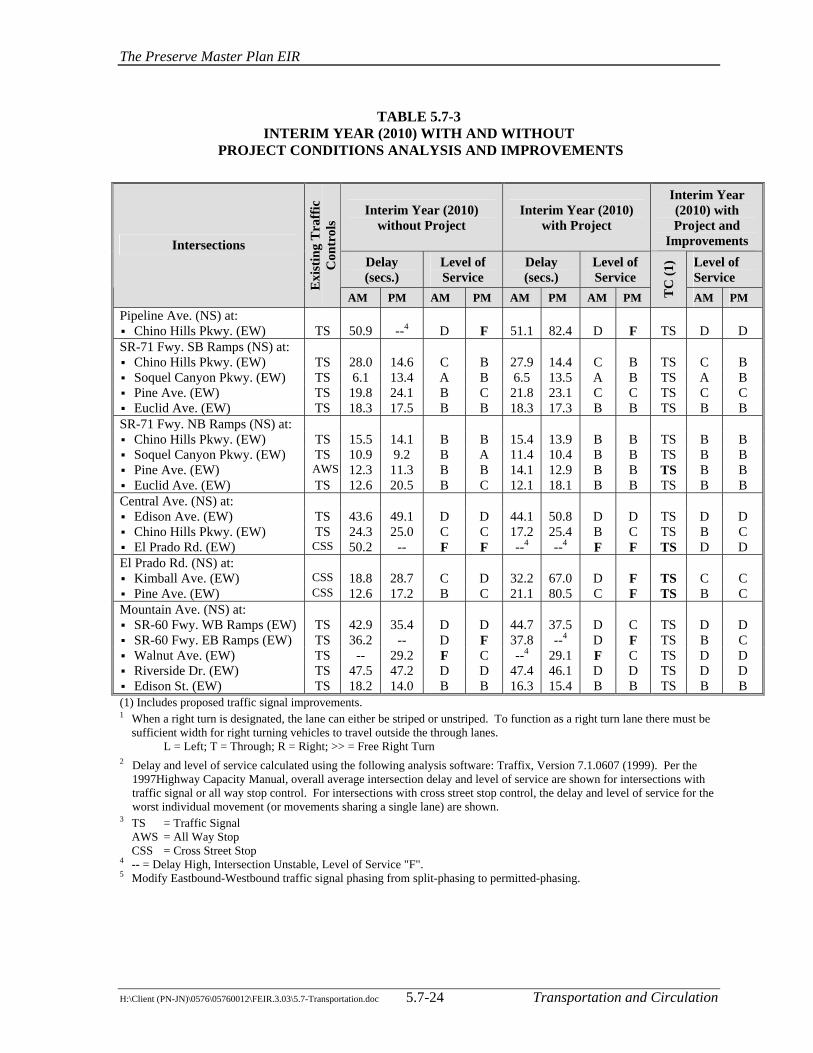
Level of Service
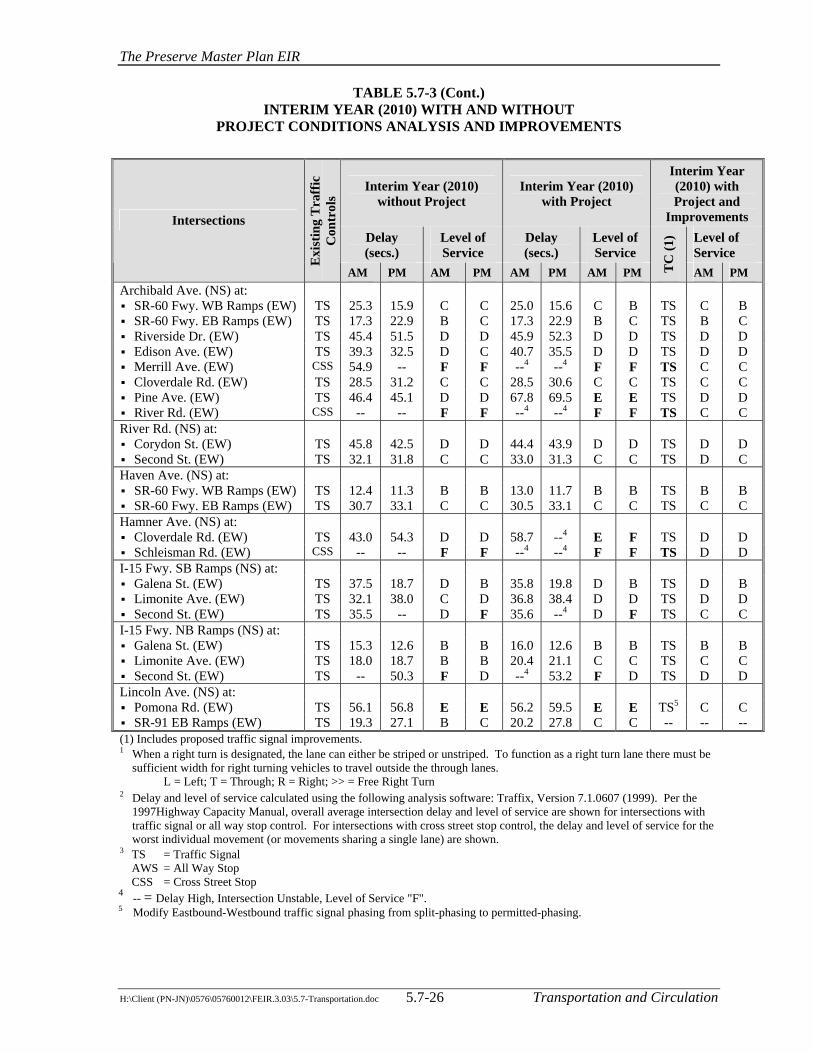
Fifteen intersections are projected to be at LOS “E” or “F” for the Interim Year (2010) Without Project. Table 5.7-3 highlights the study area intersections that are projected to experience LOS “E” or “F” operations during the peak hours without the project and are, therefore, deficient based upon the City of Chino General Plan. The “With Project” and “with Project and Improvements” proposed conditions are also displayed to provide a comparison of project impacts. Table 5.7-4 highlights conditions for the year 2020. By the Year 2020, 35 intersections are projected to be at LOS “E” or “F” Without Project.
The Preserve Master Plan EIR
H:\Client (PN-JN)\0576\05760012\FEIR.3.03\5.7-Transportation.doc 5.7-24 Transportation and Circulation
TABLE 5.7-3 INTERIM YEAR (2010) WITH AND WITHOUT
PROJECT CONDITIONS ANALYSIS AND IMPROVEMENTS
Interim Year (2010) without Project
Interim Year (2010) with Project
Interim Year (2010) with Project and
Improvements Delay (secs.)
Level of Service
Delay (secs.)
Level of Service
Level of Service
Intersections
Exi
stin
g T
raff
ic
Con
trol
s
AM PM AM PM AM PM AM PM TC
(1)
AM PM Pipeline Ave. (NS) at: Chino Hills Pkwy. (EW) TS 50.9 --4 D F 51.1 82.4 D F TS D D
SR-71 Fwy. SB Ramps (NS) at: Chino Hills Pkwy. (EW) TS 28.0 14.6 C B 27.9 14.4 C B TS C B Soquel Canyon Pkwy. (EW) TS 6.1 13.4 A B 6.5 13.5 A B TS A B Pine Ave. (EW) TS 19.8 24.1 B C 21.8 23.1 C C TS C C Euclid Ave. (EW) TS 18.3 17.5 B B 18.3 17.3 B B TS B B
SR-71 Fwy. NB Ramps (NS) at: Chino Hills Pkwy. (EW) TS 15.5 14.1 B B 15.4 13.9 B B TS B B Soquel Canyon Pkwy. (EW) TS 10.9 9.2 B A 11.4 10.4 B B TS B B Pine Ave. (EW) AWS 12.3 11.3 B B 14.1 12.9 B B TS B B Euclid Ave. (EW) TS 12.6 20.5 B C 12.1 18.1 B B TS B B
Central Ave. (NS) at: Edison Ave. (EW) TS 43.6 49.1 D D 44.1 50.8 D D TS D D Chino Hills Pkwy. (EW) TS 24.3 25.0 C C 17.2 25.4 B C TS B C El Prado Rd. (EW) CSS 50.2 -- F F --4 --4 F F TS D D
El Prado Rd. (NS) at: Kimball Ave. (EW) CSS 18.8 28.7 C D 32.2 67.0 D F TS C C Pine Ave. (EW) CSS 12.6 17.2 B C 21.1 80.5 C F TS B C
Mountain Ave. (NS) at: SR-60 Fwy. WB Ramps (EW) TS 42.9 35.4 D D 44.7 37.5 D C TS D D SR-60 Fwy. EB Ramps (EW) TS 36.2 -- D F 37.8 --4 D F TS B C Walnut Ave. (EW) TS -- 29.2 F C --4 29.1 F C TS D D Riverside Dr. (EW) TS 47.5 47.2 D D 47.4 46.1 D D TS D D Edison St. (EW) TS 18.2 14.0 B B 16.3 15.4 B B TS B B
(1) Includes proposed traffic signal improvements. 1 When a right turn is designated, the lane can either be striped or unstriped. To function as a right turn lane there must be
sufficient width for right turning vehicles to travel outside the through lanes. L = Left; T = Through; R = Right; >> = Free Right Turn
2 Delay and level of service calculated using the following analysis software: Traffix, Version 7.1.0607 (1999). Per the 1997Highway Capacity Manual, overall average intersection delay and level of service are shown for intersections with traffic signal or all way stop control. For intersections with cross street stop control, the delay and level of service for the worst individual movement (or movements sharing a single lane) are shown.
3 TS = Traffic Signal AWS = All Way Stop CSS = Cross Street Stop
4 -- = Delay High, Intersection Unstable, Level of Service "F". 5 Modify Eastbound-Westbound traffic signal phasing from split-phasing to permitted-phasing.

The Preserve Master Plan EIR
H:\Client (PN-JN)\0576\05760012\FEIR.3.03\5.7-Transportation.doc 5.7-25 Transportation and Circulation
TABLE 5.7-3 (Cont.) INTERIM YEAR (2010) WITH AND WITHOUT
PROJECT CONDITIONS ANALYSIS AND IMPROVEMENTS
Interim Year (2010) without Project
Interim Year (2010) with Project
Interim Year (2010) with Project and
Improvements Delay (secs.)
Level of Service
Delay (secs.)
Level of Service
Level of Service
Intersections
Exi
stin
g T
raff
ic
Con
trol
s
AM PM AM PM AM PM AM PM TC
(1)
AM PM Euclid Ave. (NS) at: SR-60 Fwy. WB Ramps (EW) TS 41.5 40.9 D D 46.1 47.6 D D TS D D SR-60 Fwy. EB Ramps (EW) TS 33.7 -- C F 34.9 --4 C F TS C D Walnut Ave. (EW) TS 22.9 25.2 C C 21.6 23.5 C C TS C C Riverside Dr. (EW) TS 35.2 38.7 D D 32.1 42.7 C D TS C D Edison St. (EW) TS 35.7 32.2 D C 39.5 40.1 C D TS D D Merrill Ave. (EW) TS 21.7 74.8 C B 19.2 12.1 B B TS B B Kimball Ave. (EW) TS 25.7 26.4 C C 41.9 --4 D F TS D D Bickmore Ave. (EW) CSS -- -- F F --4 --4 F F TS C D Pine Ave. (EW) TS 40.3 30.2 D C 51.3 37.6 D D TS D D
Grove Ave. (NS) at: SR-60 Fwy. WB Ramps (EW) TS 40.6 28.5 D C 42.4 30.3 D C TS D C SR-60 Fwy. EB Ramps (EW) TS 41.5 51.0 D D 41.5 52.5 D D TS D D Edison St. (EW) AWS --4 -- F F --4 --4 F F TS D D Merrill Ave. (EW) AWS 16.4 26.4 C D 18.9 36.3 C E TS C D Kimball Ave. (EW) AWS 10.5 13.8 B B --4 --4 F F TS C C Bickmore Ave. (EW) CSS 33.4 -- D F 72.5 --4 F F TS A A Pine Ave. (EW) CSS 15.6 20.5 C C 76.4 --4 F F TS C B
Walker Ave. (NS) at: Edison Ave. (EW) CSS 37.8 -- E F 77.9 --4 F F TS B C
Hellman Ave. (NS) at: Merrill Ave. (EW) TS 32.8 36.4 C C 35.7 40.6 D D TS D D Kimball Ave. (EW) TS 46.6 33.8 D D 48.5 --4 D F TS D D Pine Ave. (EW) CSS -- -- F F --4 --4 F F TS D D Chandler St. (EW) CSS 28.6 28.0 D D --4 --4 F F TS B C
Vineyard Ave. (NS) at: SR-60 Fwy. WB Ramps (EW) TS 31.4 30.6 C C 31.6 32.3 C C TS C C SR-60 Fwy. EB Ramps (EW) TS 27.7 40.6 C D 27.5 41.3 C D TS C D
(1) Includes proposed traffic signal improvements. 1 When a right turn is designated, the lane can either be striped or unstriped. To function as a right turn lane there must be
sufficient width for right turning vehicles to travel outside the through lanes. L = Left; T = Through; R = Right; >> = Free Right Turn
2 Delay and level of service calculated using the following analysis software: Traffix, Version 7.1.0607 (1999). Per the 1997Highway Capacity Manual, overall average intersection delay and level of service are shown for intersections with traffic signal or all way stop control. For intersections with cross street stop control, the delay and level of service for the worst individual movement (or movements sharing a single lane) are shown.
3 TS = Traffic Signal AWS = All Way Stop CSS = Cross Street Stop
4 -- = Delay High, Intersection Unstable, Level of Service "F". 5 Modify Eastbound-Westbound traffic signal phasing from split-phasing to permitted-phasing.
The Preserve Master Plan EIR
H:\Client (PN-JN)\0576\05760012\FEIR.3.03\5.7-Transportation.doc 5.7-26 Transportation and Circulation
TABLE 5.7-3 (Cont.) INTERIM YEAR (2010) WITH AND WITHOUT
PROJECT CONDITIONS ANALYSIS AND IMPROVEMENTS
Interim Year (2010) without Project
Interim Year (2010) with Project
Interim Year (2010) with Project and
Improvements Delay (secs.)
Level of Service
Delay (secs.)
Level of Service
Level of Service
Intersections
Exi
stin
g T
raff
ic
Con
trol
s
AM PM AM PM AM PM AM PM TC
(1)
AM PM Archibald Ave. (NS) at: SR-60 Fwy. WB Ramps (EW) TS 25.3 15.9 C C 25.0 15.6 C B TS C B SR-60 Fwy. EB Ramps (EW) TS 17.3 22.9 B C 17.3 22.9 B C TS B C Riverside Dr. (EW) TS 45.4 51.5 D D 45.9 52.3 D D TS D D Edison Ave. (EW) TS 39.3 32.5 D C 40.7 35.5 D D TS D D Merrill Ave. (EW) CSS 54.9 -- F F --4 --4 F F TS C C Cloverdale Rd. (EW) TS 28.5 31.2 C C 28.5 30.6 C C TS C C Pine Ave. (EW) TS 46.4 45.1 D D 67.8 69.5 E E TS D D River Rd. (EW) CSS -- -- F F --4 --4 F F TS C C
River Rd. (NS) at: Corydon St. (EW) TS 45.8 42.5 D D 44.4 43.9 D D TS D D Second St. (EW) TS 32.1 31.8 C C 33.0 31.3 C C TS D C
Haven Ave. (NS) at: SR-60 Fwy. WB Ramps (EW) TS 12.4 11.3 B B 13.0 11.7 B B TS B B SR-60 Fwy. EB Ramps (EW) TS 30.7 33.1 C C 30.5 33.1 C C TS C C
Hamner Ave. (NS) at: Cloverdale Rd. (EW) TS 43.0 54.3 D D 58.7 --4 E F TS D D Schleisman Rd. (EW) CSS -- -- F F --4 --4 F F TS D D
I-15 Fwy. SB Ramps (NS) at: Galena St. (EW) TS 37.5 18.7 D B 35.8 19.8 D B TS D B Limonite Ave. (EW) TS 32.1 38.0 C D 36.8 38.4 D D TS D D Second St. (EW) TS 35.5 -- D F 35.6 --4 D F TS C C
I-15 Fwy. NB Ramps (NS) at: Galena St. (EW) TS 15.3 12.6 B B 16.0 12.6 B B TS B B Limonite Ave. (EW) TS 18.0 18.7 B B 20.4 21.1 C C TS C C Second St. (EW) TS -- 50.3 F D --4 53.2 F D TS D D
Lincoln Ave. (NS) at: Pomona Rd. (EW) TS 56.1 56.8 E E 56.2 59.5 E E TS5 C C SR-91 EB Ramps (EW) TS 19.3 27.1 B C 20.2 27.8 C C -- -- --
(1) Includes proposed traffic signal improvements. 1 When a right turn is designated, the lane can either be striped or unstriped. To function as a right turn lane there must be
sufficient width for right turning vehicles to travel outside the through lanes. L = Left; T = Through; R = Right; >> = Free Right Turn
2 Delay and level of service calculated using the following analysis software: Traffix, Version 7.1.0607 (1999). Per the 1997Highway Capacity Manual, overall average intersection delay and level of service are shown for intersections with traffic signal or all way stop control. For intersections with cross street stop control, the delay and level of service for the worst individual movement (or movements sharing a single lane) are shown.
3 TS = Traffic Signal AWS = All Way Stop CSS = Cross Street Stop
4 -- = Delay High, Intersection Unstable, Level of Service "F". 5 Modify Eastbound-Westbound traffic signal phasing from split-phasing to permitted-phasing.

The Preserve Master Plan EIR
H:\Client (PN-JN)\0576\05760012\FEIR.3.03\5.7-Transportation.doc 5.7-27 Transportation and Circulation
Future Impacts—With Project Traffic Conditions
Project traffic volumes on study area roadway segments were determined by generating project trips and manually routing the traffic through the roadway network. Trips were assigned to each individual roadway link occurring along a specific route. The accumulation of traffic assigned to each roadway link represents the project traffic volume for that link.
For the Interim Year (2010) With Project traffic conditions, traffic signals are projected to be warranted at the following intersections:
• El Prado Road (NS) at Pine Ave. (EW). • Euclid Ave. (NS) at Bickmore Ave. (EW). • Grove Ave. (NS) at Merrill Ave. (EW). • Grove Ave. (NS) at Kimball (EW). • Grove Ave. (NS) at Bickmore Ave. (EW). • Grove Ave. (NS) at Pine Ave. (EW). • Hellman Ave. (NS) at Merrill Ave. (EW). • Hellman Ave. (NS) at Kimball Ave. (EW). • Hellman Ave. (NS) at Chandler Street (EW).
No additional traffic signals are required for Year 2020 With Project scenario. Roadway improvements for Interim Year (2010), Year 2020 and Buildout conditions are identified in the traffic report contained in Appendix C. Buildout project average daily traffic volumes are shown on Exhibit 5.7-5.
Level of Service
25 intersections are projected to be at LOS “E” or “F” With Project for the Interim Year (2010). By the Year 2020, 42 intersections are projected to be at LOS “E” or “F” With Project. Table 5.7-4 highlights the study area intersections that are projected to experience LOS “E” or “F” operations during the peak hours for the Buildout with project condition and are, therefore, deficient based upon the criteria within the City of Chino General Plan.

SOURCE: URBAN CROSSROADS
THE PRESERVE • CHINO SUBAREA 2
Michael Brandman Associates
MAP NOT TO SCALENO
RT
H Buildout ProjectAverage Daily Traffic (ADT)
Exhibit 5.7-5
05760012 7/2002 •
SCALE IN FEET
6000 3000 0 6000
SOURCE: URBAN CROSSROADS

The Preserve Master Plan EIR
H:\Client (PN-JN)\0576\05760012\FEIR.3.03\5.7-Transportation.doc 5.7-29 Transportation and Circulation
Table 5.7-4 BUILDOUT WITH AND WITHOUT
PROJECT CONDITIONS ANALYSIS AND IMPROVEMENTS
Year 2020 Without Project Buildout With Project
Buildout With Project and
Improvements Delay (secs.)
Level of Service
Delay (secs.)
Level of Service
Level of Service
Intersections
Exi
stin
g T
raff
ic
Con
trol
s
AM PM AM PM AM PM AM PM TC
(1)
AM PM Pipeline Ave. (NS) at: Chino Hills Pkwy. (EW) TS 56.6 --4 E F 56.5 --4 E F TS D D
SR-71 Fwy. SB Ramps (NS) at: Chino Hills Pkwy. (EW) TS 30.4 18.4 C B 39.6 96.9 D F TS B B Soquel Canyon Pkwy. (EW) TS 4.7 17.3 A B 7.3 17.4 A B TS A B Pine Ave. (EW) TS 28.7 27.4 C C --4 45.5 F D TS D D Euclid Ave. (EW) TS 19.3 17.2 B B 18.6 17.2 B B TS B B
SR-71 Fwy. NB Ramps (NS) at: Chino Hills Pkwy. (EW) TS 17.3 15.2 C B 20.2 18.6 C B TS C C Soquel Canyon Pkwy. (EW) TS 10.8 10.0 B A 11.3 14.9 B B TS B B Pine Ave. (EW) AWS 12.0 16.6 B C --4 --4 F F TS D D Euclid Ave. (EW) TS 15.9 16.7 B B 11.6 18.8 B B TS B B
Central Ave. (NS) at: Edison Ave. (EW) TS 52.7 -- D F 49.9 --4 D F TS D D Chino Hills Pkwy. (EW) TS 27.4 30.4 C C 19.9 31.0 B C TS B C El Prado Rd. (EW) CSS -- -- F F --4 --4 F F TS D D
El Prado Rd. (NS) at: Kimball Ave. (EW) CSS -- -- F F --4 --4 F F TS D D Pine Ave. (EW) CSS 23.0 -- C F --4 --4 F F TS C D
Mountain Ave. (NS) at: SR-60 Fwy. WB Ramps (EW) TS 46.9 38.3 D C --6 45.4 F D TS D C SR-60 Fwy. EB Ramps (EW) TS 35.9 -- C F 41.9 --4 D F TS C C Walnut Ave. (EW) TS -- 29.2 F B --4 28.9 F C TS D D Riverside Dr. (EW) TS 51.8 59.0 D E 51.5 56.3 D E TS D D Edison St. (EW) TS 23.6 17.5 C B 26.7 20.4 C C TS C C
(1) Includes proposed traffic signal improvements. 1 When a right turn is designated, the lane can either be striped or unstriped. To function as a right turn lane there must be
sufficient width for right turning vehicles to travel outside the through lanes. L = Left; T = Through; R = Right; >> = Free Right Turn
2 Delay and level of service calculated using the following analysis software: Traffix, Version 7.1.0607 (1999). Per the 1997Highway Capacity Manual, overall average intersection delay and level of service are shown for intersections with traffic signal or all way stop control. For intersections with cross street stop control, the delay and level of service for the worst individual movement (or movements sharing a single lane) are shown.
3 TS = Traffic Signal AWS = All Way Stop CSS = Cross Street Stop
4 -- = Delay High, Intersection Unstable, Level of Service "F". 5 Modify Eastbound-Westbound traffic signal phasing from split-phasing to permitted-phasing.

The Preserve Master Plan EIR
H:\Client (PN-JN)\0576\05760012\FEIR.3.03\5.7-Transportation.doc 5.7-30 Transportation and Circulation
TABLE 5.7-4 (Cont.) BUILDOUT WITH AND WITHOUT
PROJECT CONDITIONS ANALYSIS AND IMPROVEMENTS
Year 2020 Without Project Buildout With Project
Buildout With Project and
Improvements Delay (secs.)
Level of Service
Delay (secs.)
Level of Service
Level of Service
Intersections
Exi
stin
g T
raff
ic
Con
trol
s
AM PM AM PM AM PM AM PM TC
(1)
AM PM Euclid Ave. (NS) at: SR-60 Fwy. WB Ramps (EW) TS -- 45.8 F D --4 --4 F F TS D D SR-60 Fwy. EB Ramps (EW) TS 35.9 -- C F --4 --4 F F TS C C Walnut Ave. (EW) TS 35.9 31.9 C D 22.1 28.6 C C TS C C Riverside Dr. (EW) TS 36.9 -- D F 39.6 --4 D F TS D D Edison St. (EW) TS -- -- F F --4 --4 F F TS D D Merrill Ave. (EW) TS 21.3 13.5 C B --4 --4 F F TS D B Kimball Ave. (EW) TS 25.5 55.8 B E --4 --4 F F TS C D Bickmore Ave. (EW) CSS -- -- F F --4 --4 F F TS B B Pine Ave. (EW) TS -- -- F F --4 --4 F F TS D D
Grove Ave. (NS) at: SR-60 Fwy. WB Ramps (EW) TS -- 37.1 F D --4 35.9 F D TS C C SR-60 Fwy. EB Ramps (EW) TS 48.0 --4 D F 48.9 --4 D F TS C C Edison St. (EW) AWS -- -- F F --4 --4 F F TS D D Merrill Ave. (EW) AWS 12.9 21.6 B C 12.9 22.8 B C TS B B Kimball Ave. (EW) AWS 9.1 13.5 A B --4 --4 F F TS B D Bickmore Ave. (EW) CSS -- -- F F --4 60.2 F F TS B B Pine Ave. (EW) CSS 62.2 -- F F --4 --4 F F TS C C
Walker Ave. (NS) at: Edison Ave. (EW) CSS -- -- F F --4 --4 F F TS C D
Hellman Ave. (NS) at: Merrill Ave. (EW) TS 31.1 40.0 C D --4 --4 F F TS D D Kimball Ave. (EW) TS 49.7 -- D F --4 --4 F F TS D D Pine Ave. (EW) CSS -- -- F F --4 --4 F F TS D D Chandler St. (EW) CSS -- -- F F --4 --4 F F TS D D
Vineyard Ave. (NS) at: SR-60 Fwy. WB Ramps (EW) TS 37.4 36.7 D D 35.8 45.3 D D TS D D SR-60 Fwy. EB Ramps (EW) TS 28.6 -- C F 28.7 --4 C F TS C D Edison Ave. (EW) TS 15.3 18.5 B B 22.2 28.4 C C TS C C
(1) Includes proposed traffic signal improvements 1 When a right turn is designated, the lane can either be striped or unstriped. To function as a right turn lane there must be
sufficient width for right turning vehicles to travel outside the through lanes. L = Left; T = Through; R = Right; >> = Free Right Turn
2 Delay and level of service calculated using the following analysis software: Traffix, Version 7.1.0607 (1999). Per the 1997Highway Capacity Manual, overall average intersection delay and level of service are shown for intersections with traffic signal or all way stop control. For intersections with cross street stop control, the delay and level of service for the worst individual movement (or movements sharing a single lane) are shown.
3 TS = Traffic Signal AWS = All Way Stop CSS = Cross Street Stop
4 -- = Delay High, Intersection Unstable, Level of Service "F". 5 Modify Eastbound-Westbound traffic signal phasing from split-phasing to permitted-phasing.

The Preserve Master Plan EIR
H:\Client (PN-JN)\0576\05760012\FEIR.3.03\5.7-Transportation.doc 5.7-31 Transportation and Circulation
TABLE 5.7-4 (Cont.) YEAR 2020 WITH AND WITHOUT
PROJECT CONDITIONS ANALYSIS AND IMPROVEMENTS
Year 2020 Without Project Buildout With Project
Buildout With Project and
Improvements Delay (secs.)
Level of Service
Delay (secs.)
Level of Service
Level of Service
Intersections
Exi
stin
g T
raff
ic
Con
trol
s
AM PM AM PM AM PM AM PM TC
(1)
AM PM Archibald Ave. (NS) at: SR-60 Fwy. WB Ramps (EW) TS 24.9 14.6 C B 23.0 28.4 C B TS C B SR-60 Fwy. EB Ramps (EW) TS 17.5 27.1 B C 17.4 24.4 B C TS B C Riverside Dr. (EW) TS 49.6 56.2 D E --4 --4 F F TS D D Edison Ave. (EW) TS 64.9 56.3 D E --4 --4 F F TS D D Merrill Ave. (EW) CSS -- -- F F --4 --4 F F TS C C Cloverdale Rd. (EW) TS 31.0 41.5 C D --4 --4 F F TS D D Pine Ave. (EW) TS 53.3 44.2 D D --4 --4 F F TS D C River Rd. (EW) CSS -- -- F E --4 --4 F F TS D C
River Rd. (NS) at: Corydon St. (EW) TS 50.9 51.1 D D -- --4 F F TS D D Second St. (EW) TS 34.9 31.0 C C 45.7 36.5 D D TS D D
Haven Ave. (NS) at: SR-60 Fwy. WB Ramps (EW) TS 17.1 16.1 B B 18.0 17.8 B B TS C C SR-60 Fwy. EB Ramps (EW) TS 36.1 -- D F 36.7 --4 D F TS C D
Hamner Ave. (NS) at: Cloverdale Rd. (EW) TS 47.0 -- D F --4 --4 F F TS D D Schleisman Rd. (EW) CSS -- -- F F --4 --4 F F TS D D
I-15 Fwy. SB Ramps (NS) at: Galena St. (EW) TS 46.8 -- D F 56.3 --4 E F TS D C Limonite Ave. (EW) TS 36.2 41.6 D D --4 43.4 F D TS D D Second St. (EW) TS -- -- F F --4 --4 F F TS C C
I-15 Fwy. NB Ramps (NS) at: Galena St. (EW) TS 28.5 14.7 C B 43.1 14.4 D B TS D C Limonite Ave. (EW) TS 17.8 19.4 B B 26.0 29.6 C C TS C C Second St. (EW) TS -- 58.3 F E --4 --4 F F TS D D
Lincoln Ave. (NS) at: Pomona Rd. (EW) TS --4 --4 F F --4 --4 F F TS5 D C SR-91 EB Ramps (EW) TS 21.7 41.2 C D 26.1 48.0 C D -- -- --
(1) Includes proposed traffic signal improvements 1 When a right turn is designated, the lane can either be striped or unstriped. To function as a right turn lane there must be
sufficient width for right turning vehicles to travel outside the through lanes. L = Left; T = Through; R = Right; >> = Free Right Turn
2 Delay and level of service calculated using the following analysis software: Traffix, Version 7.1.0607 (1999). Per the 1997Highway Capacity Manual, overall average intersection delay and level of service are shown for intersections with traffic signal or all way stop control. For intersections with cross street stop control, the delay and level of service for the worst individual movement (or movements sharing a single lane) are shown.
3 TS = Traffic Signal AWS = All Way Stop CSS = Cross Street Stop
4 -- = Delay High, Intersection Unstable, Level of Service "F". 5 Modify Eastbound-Westbound traffic signal phasing from split-phasing to permitted-phasing.

The Preserve Master Plan EIR
H:\Client (PN-JN)\0576\05760012\FEIR.3.03\5.7-Transportation.doc 5.7-32 Transportation and Circulation
Roadway Improvements
A cumulative listing of all project related roadway and signal improvements to be provided for post-2020 buildout conditions, including the proposed project, is contained in Table 5.7-5. This list identifies all the improvements necessary to meet Year 2020 With Project traffic demands, excluding freeway improvements which are discussed in the section below. The timing of the improvements are identified in the traffic report in Appendix C.
TABLE 5.7-5 BUILDOUT WITH PROJECT CONDITIONS
SUMMARY OF INTERSECTION AND ROADWAY IMPROVEMENTS
Intersection/Segment Improvement
Pipeline Ave. (NS) at:
Chino Hills Pkwy. (EW) Second EB Left Turn Lane Second WB Left Turn Lane EB Right-Turn Overlap Phasing Third WB Through Lane WB Right-Turn Overlap Phasing
SR-71 Fwy. SB Ramps (NS) at:
Chino Hills Pkwy. (EW) Pine Ave. (EW)
Third WB Through Lane Second EB Through Lane
SR-71 Fwy. NB Ramps (NS) at:
Pine Ave. (EW) Traffic Signal Second EB Through Lane
Lincoln Avenue (NS) at:
Pomona Road (EW) Traffic Signal Phasing Modification Restripe two existing SB through lanes to an exclusive right turn lane and a shared through-right lane
Restripe SB approach to include two through lanes
SB free-right turn lane

The Preserve Master Plan EIR
H:\Client (PN-JN)\0576\05760012\FEIR.3.03\5.7-Transportation.doc 5.7-33 Transportation and Circulation
TABLE 5.7-5 (Cont.)
BUILDOUT WITH PROJECT CONDITIONS SUMMARY OF INTERSECTION AND ROADWAY IMPROVEMENTS
Intersection/Segment Improvement
Central Ave. (NS) at:
Edison Ave. (EW) NB Right-Turn Overlap Phasing Second EB Left Turn Lane Second WB Left Turn Lane EB Right Turn Lane
El Prado Rd. (EW) Traffic Signal Second NB Through Lane Second SB Left Turn Lane
El Prado Rd. (NS) at:
Kimball Road (EW) Traffic Signal NB Right Turn Lane
Pine Ave. (EW) Traffic Signal EB Left Turn Lane SB Left Turn Lane Second EB Through Lane WB Right Turn Lane
Mountain Ave. (NS) at:
SR-60 Fwy. WB Ramps (EW) SR-60 Freeway EB Ramps (EW)
WB All-Way Lane Second SB Left Turn Lane EB All-Way Lane Restripe EB All-Way Lane to a Second EB Left Turn Lane
Second EB Right Turn Lane
Walnut Ave. (EW) Second WB Through Lane Second EB Through Lane
Riverside Dr. (EW) NB Right Turn Lane Second SB Left Turn Lane
Euclid Avenue (NS) at:
SR-60 Freeway WB Ramps (EW) SR-60 Freeway EB Ramps (EW)
WB All-Way Lane Second NB Right Turn Lane Restripe EB All-Way Lane to a Shared Through & Right Turn Lane
EB free-Right Turn Lane Second EB Left Turn Lane

The Preserve Master Plan EIR
H:\Client (PN-JN)\0576\05760012\FEIR.3.03\5.7-Transportation.doc 5.7-34 Transportation and Circulation
TABLE 5.7-5 (Cont.) BUILDOUT WITH PROJECT CONDITIONS
SUMMARY OF INTERSECTION AND ROADWAY IMPROVEMENTS
Intersection/Segment Improvement
Riverside Drive (EW) Third NB Through Lane Second SB Left Turn Lane Third SB Through Lane SB Right-Turn Overlap Phasing EB Left Turn Lane WB Left Turn Lane
Edison Street (EW) Third NB Though Lane Third SB Through Lane Second EB Left Turn Lane Second & Third EB Through Lanes (2) Second WB Through Lane
Merrill Avenue (EW) Third NB Through Lane Third SB Through Lane
Kimball Avenue (EW) NB Right-Turn Overlap Phasing EB Left Turn Lane First & Second WB Left Turn Lanes (2) WB Right Turn Lane Third & Fourth NB Through Lanes (2) Second SB Left Turn Lane Third SB Through Lane Second EB Left Turn Lane Second EB Through Lane EB Right Turn Lane Second WB Through Lane WB Right-Turn Overlap Phasing
Bickmore Avenue (EW) Traffic Signal Second NB Through Lane Second SB Through Lane Third NB Through Lane NB Right Turn Lane Second SB Left Turn Lane Third SB Through Lane First & Second WB Left Turn Lanes (2) WB Right Turn Lane

The Preserve Master Plan EIR
H:\Client (PN-JN)\0576\05760012\FEIR.3.03\5.7-Transportation.doc 5.7-35 Transportation and Circulation
TABLE 5.7-5 (Cont.) BUILDOUT WITH PROJECT CONDITIONS
SUMMARY OF INTERSECTION AND ROADWAY IMPROVEMENTS
Intersection/Segment Improvement
Pine Avenue (EW) Third & Fourth NB Through Lanes (2) NB free-Right Turn Lane Second SB Left Turn Lane Third SB Through Lane First & Second EB Left Turn Lanes (2) Second & Third EB Through Lanes (2) First, Second & Third WB Left Turn Lanes (3) Second & Third WB Through Lanes (2) WB free-Right Turn Lane
Grove Avenue (NS) at:
SR-60 Freeway WB Ramps (EW) Westbound All-Way Lane
SR-60 Freeway EB Ramps (EW) Second EB Left Turn Lane Second EB Right Turn Lane
Edison Street (EW) Traffic Signal NB Left Turn Lane SB Left Turn Lane EB Left Turn Lane Second EB Through Lane WB Left Turn Lane Second WB Through Lane Second NB Through Lane Second SB Through Lane
Merrill Avenue (EW) EB Left Turn Lane
Kimball Avenue (EW) Traffic Signal NB Left Turn Lane WB Left Turn Lane Second EB Through Lane Second WB Through Lane
Bickmore Avenue (EW) Traffic Signal NB Left Turn Lane SB Left Turn Lane EB Left Turn Lane WB Left Turn Lane

The Preserve Master Plan EIR
H:\Client (PN-JN)\0576\05760012\FEIR.3.03\5.7-Transportation.doc 5.7-36 Transportation and Circulation
TABLE 5.7-5 (Cont.) BUILDOUT WITH PROJECT CONDITIONS
SUMMARY OF INTERSECTION AND ROADWAY IMPROVEMENTS
Intersection/Segment Improvement
Pine Avenue (EW) Traffic Signal Second EB Through Lane SB Left Turn Lane Second WB Through Lane
Walker Avenue (NS) at:
Edison Street (EW) Traffic Signal NB Left Turn Lane SB Left Turn Lane EB Left Turn Lane Second EB Through Lane WB Left Turn Lane Second WB Through Lane NB Right Turn Lane NB Right-Turn Overlap Phasing EB Right Turn Lane
Hellman Avenue (NS) at:
Merrill Avenue (EW) Second NB Through Lane NB Right Turn Lane Second SB Through Lane Second WB Left Turn Lane
Kimball Avenue (EW) Second SB Through Lane Second NB Left Turn Lane Second NB Through Lane NB Right Turn Lane Second SB Left Turn Lane SB Right Turn Lane Second EB Left Turn Lane Second EB Through Lane EB Right Turn Lane Second WB Left Turn Lane Second WB Through Lane
Pine Avenue (EW) Traffic Signal NB Left Turn Lane Second NB Through Lane SB Left Turn Lane Second SB Through Lane

The Preserve Master Plan EIR
H:\Client (PN-JN)\0576\05760012\FEIR.3.03\5.7-Transportation.doc 5.7-37 Transportation and Circulation
TABLE 5.7-5 (Cont.) BUILDOUT WITH PROJECT CONDITIONS
SUMMARY OF INTERSECTION AND ROADWAY IMPROVEMENTS
Intersection/Segment Improvement
EB Left Turn Lane Second EB Through Lane WB Left Turn Lane Second WB Through Lane Second NB Left Turn Lane NB Right Turn Lane Second SB Left Turn Lane SB Right Turn Lane Second EB Left Turn Lane EB Right Turn Lane Second WB Left Turn Lane WB Right Turn Lane NB Right-Turn Overlap Phasing SB Right-Turn Overlap Phasing Third EB Through Lane Third WB Through Lane
Chandler Street (EW) Traffic Signal NB Left Turn Lane SB Left Turn Lane EB Left Turn Lane WB Left Turn Lane Second NB Through Lane Second SB Left Turn Lane Second SB Through Lane Second EB Through Lane Second WB Through Lane
Vineyard Avenue (NS) at:
SR-60 Freeway EB Ramps (EW) EB All-Way Lane
Archibald Avenue (NS) at:
Riverside Drive (EW) Second EB Left Turn Lane SB Right-Turn Overlap Phasing Second WB Through Lane

The Preserve Master Plan EIR
H:\Client (PN-JN)\0576\05760012\FEIR.3.03\5.7-Transportation.doc 5.7-38 Transportation and Circulation
TABLE 5.7-5 (Cont.) BUILDOUT WITH PROJECT CONDITIONS
SUMMARY OF INTERSECTION AND ROADWAY IMPROVEMENTS
Intersection/Segment Improvement
Edison Avenue (EW) Second NB Left Turn Lane NB Right-Turn Overlap Phasing EB Right Turn Lane EB Right-Turn Overlap Phasing Second WB Left Turn Lane
Merrill Avenue (EW) Traffic Signal SB Left Turn Lane EB Left Turn Lane Second NB Through Lane Second SB Through Lane WB Left Turn Lane
Cloverdale Road (EW) NB Left Turn Lane Second NB Through Lane Second SB Through Lane First & Second EB Left Turn Lanes (2) Second EB Through Lane Second WB Through Lane
Pine Avenue (EW) Second SB Through Lane Second EB Through Lane Second NB Through Lane Second WB Through Lane
River Road (EW) Traffic Signal EB free-Right Turn Lane Second SB Through Lane
River Road (NS) at:
Corydon Street (EW) SB Right Turn Lane Second EB Left Turn Lane Second EB Through Lane Second NB Through Lane
Haven Avenue (NS) at:
SR-60 Freeway EB Ramps (EW) NB free-Right Turn Lane Restripe Second EB Left Turn Lane to an All-Way Lane

The Preserve Master Plan EIR
H:\Client (PN-JN)\0576\05760012\FEIR.3.03\5.7-Transportation.doc 5.7-39 Transportation and Circulation
TABLE 5.7-5 (Cont.) BUILDOUT WITH PROJECT CONDITIONS
SUMMARY OF INTERSECTION AND ROADWAY IMPROVEMENTS
Intersection/Segment Improvement
Hamner Avenue (NS) at:
Cloverdale Road (EW) Second EB Through Lane WB Left Turn Lane Second NB Through Lane Second SB Through Lane EB Left Turn Lane Second WB Through Lane NB Right-Turn Overlap Phasing Second SB Left Turn Lane Second WB Left Turn Lane
Schleisman Road (EW) Traffic Signal EB Left Turn Lane WB Left Turn Lane Second NB Through Lane Second SB Through Lane NB Right Turn Lane SB Right Turn Lane Second WB Left Turn Lane
I-15 Freeway SB Ramps (NS) at:
Gelena Street (EW) Second EB Right Turn Lane
Limonite Avenue (EW) Second SB Right Turn Lane
Second Street (EW) First & Second EB Right Turn Lanes (2) Second SB Right Turn Lane
I-15 Freeway NB Ramps (NS) at:
Second Street (EW) WB Right Turn Lane NB All-Way Lane
Hellman Avenue
Eucalyptus Avenue to Merrill Avenue Construct 2 Lanes (0.6 Miles)
Kimball Avenue
Hellman Avenue to Archibald Avenue Construct 2 Lanes (1.1 Miles)
Pine Avenue
SR-71 Freeway to El Prado Road Construct 2 Lanes (0.6 Miles)

The Preserve Master Plan EIR
H:\Client (PN-JN)\0576\05760012\FEIR.3.03\5.7-Transportation.doc 5.7-40 Transportation and Circulation
Freeway Improvements
The traffic report included an analysis of 35 freeway segments based upon the San Bernardino County CMP. The proposed project traffic study identified the number of general use and high occupancy traffic lanes required to accommodate the proposed project and other future development (See Tables 5.7-6 and 5.7-7). Providing the number of lanes necessary to provide an adequate level of service for all segments (except those on the SR-91 which are currently under study by the Counties of Riverside, San Bernardino, and Orange) is based upon obtaining adequate funding. A portion of the traffic generated by the proposed project will contribute toward the need to expand these freeway segments. To offset this impact, a project “fair-share’ contribution has been identified in the traffic report in Appendix C per CMP requirements. See Appendix C for the number and proportional distribution of traffic for these segments. (Fair share costs set forth in Appendix C are estimates only, and do not include possible credits, reimbursements, or other revenue sources.)
Community Transit System
An integral part of the Specific Plan is its emphasis on an interactive development project that allows easy mobility within and beyond the project boundaries. One component of the project’s access and mobility involves the potential use of a transit system, consisting of an on-site transit system connected with a regional bus service. The on-site system is envisioned as a one-way, continuous loop on dedicated or prioritized travel lanes. The system would provide transit stops to serve major features, such as the Community Core and areas of higher density residential development. The transit stops are also intended to serve as connection points with the regional transit system and bus service. The Specific Plan has designed roadway cross-sections to include future transit, and has suggested various locations for the placement of transit stops, with their ultimate location to be determined at a later date by the City of Chino. (See Exhibit 5.7-6)
The transit plan is conceptual at this time and will require further study to properly evaluate the potential impact it may have upon traffic patterns, vehicle trip reduction land use, and air quality. The system should significantly reduce the number of vehicle trips within the proposed plan area and in the region, thereby providing a beneficial effect. The City of Chino and Omnitrans have been actively seeking funds to complete a Transit Feasibility Study for the project area.

SOURCE: The Planning Center
THE PRESERVE • CHINO SUBAREA 2
Michael Brandman Associates
MAP NOT TO SCALENO
RT
H
Potential Transit SystemExhibit 5.7-6
05760012 6/2001 •
SCALE IN FEET
6000 3000 0 6000

The Preserve Master Plan EIR
H:\Client (PN-JN)\0576\05760012\FEIR.3.03\5.7-Transportation.doc 5.7-42 Transportation and Circulation
TABLE 5.7-6 CMP FREEWAY MAINLINE AM PEAK HOUR OPERATIONAL
ANALYSIS (YEAR 2020)
Model Lanes Year 2020
W/O Project Year 2020 W/Project
Free
way
Segment Limits ExistingCount Existing Future
Gro
wth
In
crem
ent
0.38
Futu
re
Fore
cast
Gen. Use HOV
Cap
acity
Pr
ojec
t T
rips
Trips VOL/CAP LOS Trips
VOL/CAP LOS
Jurupa St. to SR-60 Fwy. 13,466 16,366 22,931 2,495 15,961 4 0 8,800 436 15,615 1.77 F 16,036 1.82 F SR-60 Fwy. to Galena St. 8,534 7,973 15,658 2,920 11,454 3 0 6,600 610 11,108 1.68 F 11,125 1.69 F Galena St. to Limonite Ave. 8,534 7,973 14,062 2,314 10,848 3 0 6,600 462 10,617 1.61 F 10,636 1.61 F Limonite Ave. to 6th St. 9,395 8,984 13,362 1,664 11,059 3 0 6,600 16 10,982 1.66 F 11,020 1.67 F 6th St. to 2nd St. 9,630 8,976 13,471 1,708 11,338 3 0 6,600 14 11,261 1.71 F 11,381 1.72 F 2nd St. to Hidden Valley Pkwy. 10,256 8,536 11,093 972 11,228 4 0 8,800 138 11,073 1.26 F 11,434 1.30 F Hidden Valley Pkwy. to SR-91 Fwy. 9,943 8,536 11,093 972 10,915 4 0 8,800 138 10,760 1.22 F 11,121 1.26 F I-
15 F
wy.
SB
SR-91 Fwy. to Magnolia Ave. 2,510 4,984 13,063 3,070 5,580 4 0 8,800 40 5,503 0.63 C 5,417 0.62 C Magnolia Ave. to SR-91 Fwy. 10,021 15,990 24,969 3,412 13,433 3 0 6,600 171 13.318 2.02 F 12,966 1.96 F SR-91 Fwy. to Hidden Valley Pkwy. 2,490 9,490 18,323 3,357 5,847 4 0 8,800 131 5,616 0.64 C 5,559 0.63 C Hidden Valley Pkwy. to 2nd St. 2,569 9,490 18,323 3,357 5,926 4 0 8,800 131 5,695 0.65 C 5,638 0.64 C 2nd St. to 6th St. 2,412 8,165 18,348 3,870 6,282 3 0 6,600 79 6,167 0.93 D 6,144 0.93 D 6th St. to Limonite Ave. 2,353 8,672 20,499 4,494 6,847 3 0 6,600 24 6,732 1.02 F 6,732 1.02 F Limonite Ave. to Galena St. 2,137 8,264 20,962 4,825 6,962 3 0 6,600 83 6,807 1.03 F 6,896 1.04 F Galena St. to SR-60 Fwy. 2,137 8,264 19,542 4,286 6,423 3 0 6,600 116 6,191 0.94 E 6,439 0.98 E I-
15 F
wy.
NB
SR-60 Fwy. to Jurupa St. 3,373 10,248 17,479 2,748 6,121 4 0 8,800 104 5,889 0.67 C 6,306 0.72 C Van Buren Blvd. to I-15 Fwy. 5,428 14,635 25,785 4,237 9,665 3 1 8,200 601 9,089 1.11 F 9,588 1.17 F I-15 Fwy. to Milliken Ave. 8,413 13,853 29,699 6,021 14,434 3 1 8,200 428 13,858 1.69 F 14,322 1.75 F Milliken Ave. to Haven Ave. 8,775 19,448 37,112 6,712 15,487 4 1 10,400 462 14,911 1.43 F 15,702 1.51 F Haven Ave. to Archibald Ave. 8,956 19,448 36,255 6,387 15,343 4 1 10,400 463 14,882 1.43 F 15,587 1.50 F Archibald Ave. to Vineyard Ave. 9,046 19,068 36,600 6,662 15,708 4 1 10,400 498 15,247 1.47 F 16,035 1.54 F Vineyard Ave. to Grove Ave. 8,911 18,968 36,256 6,569 15,480 4 1 10,400 298 15,134 1.46 F 15,787 1.52 F Grove Ave. to Euclid Ave. (SR-83) 9,092 19,292 37,037 6,743 15,835 4 1 10,400 412 15,334 1.47 F 16,086 1.55 F Euclid Ave. (SR-83) to Mountain Ave. 8,775 20,746 38,159 6,617 15,392 4 1 10,400 222 15,160 1.46 F 15,673 1.51 F Mountain Ave. to Central Ave. 8,458 20,349 37,818 6,638 15,096 4 1 10,400 307 14,787 1.42 F 15,405 1.48 F
SR-6
0 Fw
y. W
B
Central Ave. to Ramona Ave. 8,142 19,959 37,814 6,785 14,927 4 1 10,400 291 14,618 1.41 F 15,669 1.51 F

The Preserve Master Plan EIR
H:\Client (PN-JN)\0576\05760012\FEIR.3.03\5.7-Transportation.doc 5.7-43 Transportation and Circulation
TABLE 5.7-6 (Cont.) CMP FREEWAY MAINLINE AM PEAK HOUR OPERATIONAL
ANALYSIS (YEAR 2020)
Model Lanes Year 2020
W/O Project Year 2020 W/Project
Free
way
Segment Limits ExistingCount Existing Future
Gro
wth
In
crem
ent
0.38
Futu
re
Fore
cast
Gen. Use HOV
Cap
acity
Proj
ect
Tri
ps
Trips VOL/CAP LOS Trips
VOL/CAP LOS
Ramona Ave. to Central Ave. 3,504 8,639 16,760 3,086 6,590 4 1 10,400 186 6,129 0.59 C 6,605 0.64 C Central Ave. to Mountain Ave. 3,641 8,839 16,312 2,840 6,481 4 1 10,400 230 6,020 0.58 C 6,526 0.63 C Mountain Ave. to Euclid Ave. (SR-83) 3,777 9,649 16,478 2,595 6,372 4 1 10,400 252 6,026 0.58 C 6,412 0.62 C Euclid Ave. (SR-83) to Grove Ave. 3,913 9,191 15,591 2,432 6,345 4 1 10,400 177 5,882 0.57 C 6,426 0.62 C Grove Ave. to Vineyard Ave. 3,835 8,432 14,339 2,245 6,080 4 1 10,400 28 5,848 0.56 C 6,217 0.60 C Vineyard Ave. to Archibald Ave. 3,894 7,880 13,913 2,293 6,187 4 1 10,400 25 5,878 0.57 C 6,336 0.61 C Archibald Ave. to Haven Ave. 3,855 7,172 13,752 2,500 6,355 4 1 10,400 39 6,046 0.58 C 6,502 0.63 C Haven Ave. to Milliken Ave. 3,777 7,172 13,092 2,250 6,027 4 1 10,400 48 5,640 0.54 B 6,173 0.59 C Milliken Ave. to I-15 Fwy. 3,621 3,458 6,304 1,081 4,702 3 1 8,200 46 4,315 0.53 B 4,681 0.57 C
SR-6
0 Fw
y. E
B
I-15 Fwy. to Van Buren Blvd. 2,336 5,756 9,060 1,256 3,592 3 1 8,200 59 3,205 0.39 B 3,599 0.44 B Chino Ave. to Grand Ave. 1,823 1,799 14,167 4,700 6,523 3 1 8,200 398 5,947 0.73 C 6,125 0.75 C Grand Ave. to Chino Hills Pkwy. (SR-142) 2,160 1,510 9,609 3,078 5,238 3 1 8,200 364 4,662 0.57 C 4,866 0.59 C Chino Hills Pkwy. (SR-142) to Ramona Ave. 2,244 1,991 7,257 2,001 4,245 3 1 8,200 321 3,669 0.45 B 3,892 0.47 B Ramona Ave. to Soquel Canyon Pkwy. 2,244 1,991 7,257 2,001 4,245 3 1 8,200 321 3,669 0.45 B 3,892 0.47 B Soquel Canyon Pkwy. to Pine Ave. 2,020 1,799 10,229 3,203 5,223 2 1 6,000 336 4,531 0.76 C 4,922 0.82 D Pine Ave. to Euclid Ave. (SR-83) 2,076 1,998 9,544 2,867 4,943 2 1 6,000 28 4,712 0.79 D 4,656 0.78 D SR
-71
Fwy.
SB
Euclid Ave. (SR-83) to SR-91 Fwy. 1,851 2,822 10,373 2,869 4,720 2 0 4,400 342 3,869 0.88 D 4,764 1.08 F SR-91 Fwy. to Euclid Ave. (SR-83) 752 3,434 10,187 2,566 3,318 2 0 4,400 459 2,050 0.47 B 3,293 0.75 C Euclid Ave. (SR-83) to Pine Ave. 844 2,750 8,889 2,333 3,177 2 1 6,000 39 3,022 0.50 B 3,288 0.55 C Pine Ave. to Soquel Canyon Pkwy. 821 3,091 10,069 2,652 3,473 2 1 6,000 370 3,009 0.50 B 3,659 0.61 C Soquel Canyon Pkwy. to Ramona Ave. 912 2,223 9,845 2,896 3,808 3 1 8,200 344 3,421 0.42 B 4,133 0.50 B Ramona Ave. to Chino Hills Pkwy. (SR-142) 912 2,223 8,057 2,217 3,129 3 1 8,200 344 2,742 0.33 A 3,451 0.42 B Chino Hills Pkwy. (SR-142) to Grand Ave. 878 1,910 11,007 3,457 4,335 3 1 8,200 326 3,948 0.48 B 4,663 0.57 C SR
-71
Fwy.
NB
Grand Ave. to Chino Ave. 741 1,682 13,192 4,374 5,115 3 1 8,200 290 4,728 0.58 C 5,288 0.64 C

The Preserve Master Plan EIR
H:\Client (PN-JN)\0576\05760012\FEIR.3.03\5.7-Transportation.doc 5.7-44 Transportation and Circulation
TABLE 5.7-6 (Cont.) CMP FREEWAY MAINLINE AM PEAK HOUR OPERATIONAL
ANALYSIS (YEAR 2020)
Model Lanes Year 2020
W/O Project Year 2020 W/Project
Free
way
Segment Limits ExistingCount Existing Future
Gro
wth
In
crem
ent
0.38
Futu
re
Fore
cast
Gen. Use HOV
Cap
acity
Proj
ect
Tri
ps
Trips VOL/CAP LOS Trips
VOL/CAP LOS
McKinley St. to I-15 Fwy. 9,074 19,487 32,677 5,012 14,086 4 1 10,400 174 13,855 1.33 F 13,784 1.33 F I-15 Fwy. to Main St. 10,126 30,165 45,418 5,796 15,922 4 1 10,400 265 15,807 1.52 F 15,866 1.53 F Main St. to West Grand Blvd. 9,424 28,466 42,892 5,482 14,906 4 1 10,400 149 14,791 1.42 F 14,668 1.41 F West Grand Blvd. to Lincoln Ave. 9,731 28,816 46,303 6,645 16,376 4 1 10,400 155 16,261 1.56 F 15,924 1.53 F Lincoln Ave. to Maple St. 9,249 28,289 46,360 6,867 16,116 4 1 10,400 244 16,001 1.54 F 16,295 1.57 F Maple St. to Serfas Club Dr. 9,556 28,932 52,839 9,085 18,641 4 1 10,400 255 18,526 1.78 F 18,573 1.79 F Serfas Club Dr. to SR-71 Fwy. 9,424 30,235 56,670 10,045 19,469 4 1 10,400 279 19,354 1.86 F 19,435 1.87 F SR-71 Fwy. to Green River Rd. 9,468 29,253 56,354 10,298 19,766 4 2 12,000 425 18,992 1.58 F 19,949 1.66 F Green River Rd. to Coal Canyon Rd. 9,819 30,953 60,231 11,126 20,945 4 2 12,000 419 20,171 1.68 F 21,085 1.76 F
SR-9
1 Fw
y. W
B
Coal Canyon Rd. to Gypsum Canyon Rd. 10,257 28,154 65,743 14,284 24,541 4 2 12,000 416 23,767 1.98 F 22,667 1.89 F Gypsum Canyon Rd. to Coal Canyon Rd. 6,544 9,404 20,542 4,232 10,776 4 2 12,000 287 9,623 0.80 D 10,647 0.89 D Coal Canyon Rd. to Green River Rd. 6,264 8,798 20,251 4,352 10,616 4 2 12,000 290 9,463 0.79 D 10,518 0.88 D Green River Rd. to SR-71 Fwy. 6,041 9,402 20,940 4,384 10,425 4 2 12,000 313 9,272 0.77 C 10,354 0.86 D SR-71 Fwy. to Serfas Club Dr. 6,013 9,772 21,444 4,435 10,448 4 1 10,400 47 10,371 1.00 E 10,234 0.98 E Serfas Club Dr. to Maple St. 6,097 9,857 21,020 4,242 10,339 4 1 10,400 48 10,262 0.99 E 10,113 0.97 E Maple St. to Lincoln Ave. 5,901 9,563 19,815 3,896 9,797 4 1 10,400 44 9,720 0.93 D 9,598 0.92 D Lincoln Ave. to West Grand Blvd. 6,208 8,793 18,869 3,829 10,037 4 1 10,400 11 9,960 0.96 E 9,868 0.95 E West Grand Blvd. to Main St. 6,013 9,682 19,888 3,878 9,891 4 1 10,400 11 9,814 0.94 E 9,753 0.94 E Main St. to I-15 Fwy. 6,460 10,839 22,229 4,328 10,788 4 1 10,400 11 10,711 1.03 F 10,870 1.05 F
SR-9
1 Fw
y. E
B
I-15 Fwy. to McKinley St. 5,789 10,214 14,165 1,501 7,290 4 1 10,400 58 7,135 0.69 C 7,317 0.70 C
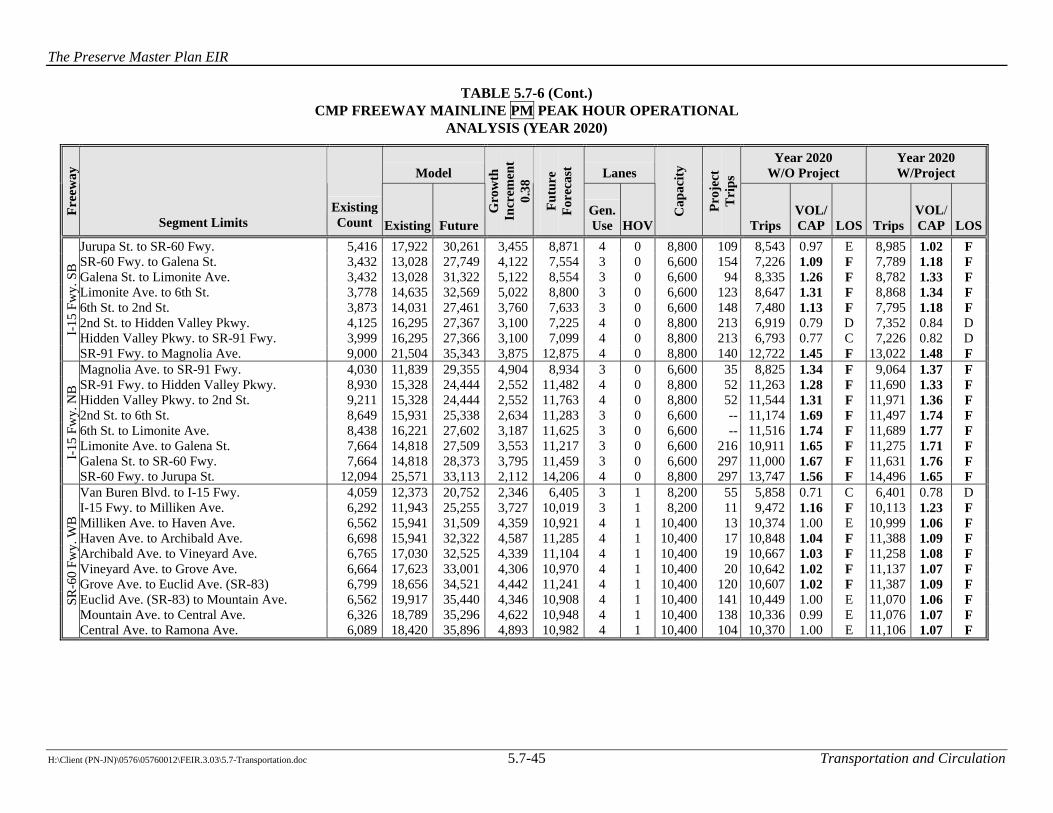
The Preserve Master Plan EIR
H:\Client (PN-JN)\0576\05760012\FEIR.3.03\5.7-Transportation.doc 5.7-45 Transportation and Circulation
TABLE 5.7-6 (Cont.) CMP FREEWAY MAINLINE PM PEAK HOUR OPERATIONAL
ANALYSIS (YEAR 2020)
Model Lanes Year 2020
W/O Project Year 2020 W/Project
Free
way
Segment Limits ExistingCount Existing Future
Gro
wth
In
crem
ent
0.38
Futu
re
Fore
cast
Gen. Use HOV
Cap
acity
Proj
ect
Tri
ps
Trips VOL/CAP LOS Trips
VOL/CAP LOS
Jurupa St. to SR-60 Fwy. 5,416 17,922 30,261 3,455 8,871 4 0 8,800 109 8,543 0.97 E 8,985 1.02 F SR-60 Fwy. to Galena St. 3,432 13,028 27,749 4,122 7,554 3 0 6,600 154 7,226 1.09 F 7,789 1.18 F Galena St. to Limonite Ave. 3,432 13,028 31,322 5,122 8,554 3 0 6,600 94 8,335 1.26 F 8,782 1.33 F Limonite Ave. to 6th St. 3,778 14,635 32,569 5,022 8,800 3 0 6,600 123 8,647 1.31 F 8,868 1.34 F 6th St. to 2nd St. 3,873 14,031 27,461 3,760 7,633 3 0 6,600 148 7,480 1.13 F 7,795 1.18 F 2nd St. to Hidden Valley Pkwy. 4,125 16,295 27,367 3,100 7,225 4 0 8,800 213 6,919 0.79 D 7,352 0.84 D Hidden Valley Pkwy. to SR-91 Fwy. 3,999 16,295 27,366 3,100 7,099 4 0 8,800 213 6,793 0.77 C 7,226 0.82 D I-
15 F
wy.
SB
SR-91 Fwy. to Magnolia Ave. 9,000 21,504 35,343 3,875 12,875 4 0 8,800 140 12,722 1.45 F 13,022 1.48 F Magnolia Ave. to SR-91 Fwy. 4,030 11,839 29,355 4,904 8,934 3 0 6,600 35 8,825 1.34 F 9,064 1.37 F SR-91 Fwy. to Hidden Valley Pkwy. 8,930 15,328 24,444 2,552 11,482 4 0 8,800 52 11,263 1.28 F 11,690 1.33 F Hidden Valley Pkwy. to 2nd St. 9,211 15,328 24,444 2,552 11,763 4 0 8,800 52 11,544 1.31 F 11,971 1.36 F 2nd St. to 6th St. 8,649 15,931 25,338 2,634 11,283 3 0 6,600 -- 11,174 1.69 F 11,497 1.74 F 6th St. to Limonite Ave. 8,438 16,221 27,602 3,187 11,625 3 0 6,600 -- 11,516 1.74 F 11,689 1.77 F Limonite Ave. to Galena St. 7,664 14,818 27,509 3,553 11,217 3 0 6,600 216 10,911 1.65 F 11,275 1.71 F Galena St. to SR-60 Fwy. 7,664 14,818 28,373 3,795 11,459 3 0 6,600 297 11,000 1.67 F 11,631 1.76 F I-
15 F
wy.
NB
SR-60 Fwy. to Jurupa St. 12,094 25,571 33,113 2,112 14,206 4 0 8,800 297 13,747 1.56 F 14,496 1.65 F Van Buren Blvd. to I-15 Fwy. 4,059 12,373 20,752 2,346 6,405 3 1 8,200 55 5,858 0.71 C 6,401 0.78 D I-15 Fwy. to Milliken Ave. 6,292 11,943 25,255 3,727 10,019 3 1 8,200 11 9,472 1.16 F 10,113 1.23 F Milliken Ave. to Haven Ave. 6,562 15,941 31,509 4,359 10,921 4 1 10,400 13 10,374 1.00 E 10,999 1.06 F Haven Ave. to Archibald Ave. 6,698 15,941 32,322 4,587 11,285 4 1 10,400 17 10,848 1.04 F 11,388 1.09 F Archibald Ave. to Vineyard Ave. 6,765 17,030 32,525 4,339 11,104 4 1 10,400 19 10,667 1.03 F 11,258 1.08 F Vineyard Ave. to Grove Ave. 6,664 17,623 33,001 4,306 10,970 4 1 10,400 20 10,642 1.02 F 11,137 1.07 F Grove Ave. to Euclid Ave. (SR-83) 6,799 18,656 34,521 4,442 11,241 4 1 10,400 120 10,607 1.02 F 11,387 1.09 F Euclid Ave. (SR-83) to Mountain Ave. 6,562 19,917 35,440 4,346 10,908 4 1 10,400 141 10,449 1.00 E 11,070 1.06 F Mountain Ave. to Central Ave. 6,326 18,789 35,296 4,622 10,948 4 1 10,400 138 10,336 0.99 E 11,076 1.07 F
SR-6
0 Fw
y. W
B
Central Ave. to Ramona Ave. 6,089 18,420 35,896 4,893 10,982 4 1 10,400 104 10,370 1.00 E 11,106 1.07 F

The Preserve Master Plan EIR
H:\Client (PN-JN)\0576\05760012\FEIR.3.03\5.7-Transportation.doc 5.7-46 Transportation and Circulation
TABLE 5.7-6 (Cont.) CMP FREEWAY MAINLINE PM PEAK HOUR OPERATIONAL
ANALYSIS (YEAR 2020)
Model Lanes Year 2020
W/O Project Year 2020 W/Project
Free
way
Segment Limits ExistingCount Existing Future
Gro
wth
In
crem
ent
0.38
Futu
re
Fore
cast
Gen. Use HOV
Cap
acity
Proj
ect
Tri
ps
Trips VOL/CAP LOS Trips
VOL/CAP LOS
Ramona Ave. to Central Ave. 8,329 29,307 55,383 7,301 15,630 4 1 10,400 528 15,193 1.46 F 16,369 1.57 F Central Ave. to Mountain Ave. 8,653 29,248 53,743 6,859 15,512 4 1 10,400 554 15,075 1.45 F 16,383 1.58 F Mountain Ave. to Euclid Ave. (SR-83) 8,977 29,547 53,675 6,756 15,733 4 1 10,400 396 15,405 1.48 F 16,533 1.59 F Euclid Ave. (SR-83) to Grove Ave. 9,301 27,867 51,225 6,540 15,841 4 1 10,400 548 15,164 1.46 F 16,375 1.57 F Grove Ave. to Vineyard Ave. 9,116 26,880 48,922 6,172 15,288 4 1 10,400 286 14,829 1.43 F 15,730 1.51 F Vineyard Ave. to Archibald Ave. 9,255 26,835 49,599 6,374 15,629 4 1 10,400 505 15,017 1.44 F 16,025 1.54 F Archibald Ave. to Haven Ave. 9,162 27,357 49,598 6,227 15,389 4 1 10,400 490 14,777 1.42 F 15,593 1.50 F Haven Ave. to Milliken Ave. 8,977 27,357 51,368 6,723 15,700 4 1 10,400 683 14,935 1.44 F 15,861 1.53 F Milliken Ave. to I-15 Fwy. 8,607 12,761 28,347 4,364 12,971 3 1 8,200 653 12,206 1.49 F 12,792 4.56 F
SR-6
0 Fw
y. E
B
I-15 Fwy. to Van Buren Blvd. 5,553 19,958 37,300 4,856 10,409 3 1 8,200 653 9,644 1.18 F 10,236 1.25 F Chino Ave. to Grand Ave. 1,038 2,443 25,295 6,399 7,437 3 1 8,200 248 6,890 0.84 D 7,218 0.88 D Grand Ave. to Chino Hills Pkwy. (SR-142) 1,230 2,850 21,060 5,099 6,329 3 1 8,200 289 5,782 0.71 C 6,415 0.78 C Chino Hills Pkwy. (SR-142) to Ramona Ave. 1,278 3,275 16,763 3,777 5,055 3 1 8,200 289 4,508 0.55 C 5,121 0.62 C Ramona Ave. to Soquel Canyon Pkwy. 1,278 3,275 16,764 3,777 5,055 3 1 8,200 290 4,508 0.55 C 5,120 0.62 C Soquel Canyon Pkwy. to Pine Ave. 1,150 4,216 17,603 3,748 4,898 2 1 6,000 320 4,242 0.71 C 4,847 0.81 D Pine Ave. to Euclid Ave. (SR-83) 1,182 3,798 15,393 3,247 4,429 2 1 6,000 290 4,210 0.70 C 4,389 0.73 C SR
.-71
Fwy.
SB
Euclid Ave. (SR-83) to SR-91 Fwy. 1,054 4,912 17,098 3,412 4,466 2 0 4,400 405 2,784 0.63 C 4,016 0.91 D SR-91 Fwy. to Euclid Ave. (SR-83) 1,886 4,882 16,826 3,344 5,230 2 0 4,400 282 4,028 0.92 D 5,345 1.21 F Euclid Ave. (SR-83) to Pine Ave. 2,115 3,202 14,782 3,242 5,357 2 1 6,000 539 5,051 0.84 D 5,368 0.89 D Pine Ave. to Soquel Canyon Pkwy. 2,057 3,153 16,024 3,604 5,661 2 1 6,000 525 4,744 0.79 D 5,447 0.91 D Soquel Canyon Pkwy. to Ramona Ave. 2,286 3,211 14,053 3,036 5,322 3 1 8,200 539 4,557 0.56 C 5,093 0.62 C Ramona Ave. to Chino Hills Pkwy. (SR-142) 2,286 3,211 11,574 2,342 4,628 3 1 8,200 539 3,863 0.47 B 4,378 0.53 B Chino Hills Pkwy. (SR-142) to Grand Ave. 2,200 2,187 15,751 3,798 5,998 3 1 8,200 552 5,233 0.64 C 5,726 0.70 C SR
-71
Fwy.
NB
Grand Ave. to Chino Ave. 1,857 2,532 21,985 5,447 7,304 3 1 8,200 565 6,539 0.80 D 7,156 0.87 D

The Preserve Master Plan EIR
H:\Client (PN-JN)\0576\05760012\FEIR.3.03\5.7-Transportation.doc 5.7-47 Transportation and Circulation
TABLE 5.7-6 (Cont.) CMP FREEWAY MAINLINE PM PEAK HOUR OPERATIONAL
ANALYSIS (YEAR 2020)
Model Lanes Year 2020
W/O Project Year 2020 W/Project
Free
way
Segment Limits ExistingCount Existing Future
Gro
wth
In
crem
ent
0.38
Futu
re
Fore
cast
Gen. Use HOV
Cap
acity
Proj
ect
Tri
ps
Trips VOL/CAP LOS Trips
VOL/CAP LOS
McKinley St. to I-15 Fwy. 5,375 20,028 30,497 2,931 8,306 4 1 10,400 108 8,087 0.78 D 8,313 0.80 D I-15 Fwy. to Main St. 5,998 24,484 45,773 5,961 11,959 4 1 10,400 11 11,850 1.14 F 11,757 1.13 F Main St. to West Grand Blvd. 5,583 21,906 40,888 5,315 10,898 4 1 10,400 11 10,789 1.04 F 10,717 1.03 F West Grand Blvd. to Lincoln Ave. 5,764 22,364 41,553 5,373 11,137 4 1 10,400 11 11,028 1.06 F 10,935 1.05 F Lincoln Ave. to Maple St. 5,479 18,712 43,158 6,845 12,324 4 1 10,400 46 12,215 1.17 F 12,164 1.17 F Maple St. to Serfas Club Dr. 5,661 21,517 47,249 7,205 12,866 4 1 10,400 56 12,757 1.23 F 12,744 1.23 F Serfas Club Dr. to SR-71 Fwy. 5,583 21,921 48,130 7,339 12,922 4 1 10,400 62 12,813 1.23 F 12,836 1.23 F SR-71 Fwy. to Green River Rd. 5,609 21,242 47,874 7,457 13,066 4 2 12,000 329 11,537 0.96 E 13,152 1.10 F Green River Rd. to Coal Canyon Rd. 5,816 20,597 49,341 8,048 13,864 4 2 12,000 306 12,335 1.03 F 13,794 1.15 F
SR-9
1 Fw
y. W
B
Coal Canyon Rd. to Gypsum Canyon Rd. 6,076 21,408 50,578 8,168 14,244 4 2 12,000 299 12,715 1.06 F 13,773 1.15 F Gypsum Canyon Rd. to Coal Canyon Rd. 10,257 40,718 96,183 15,530 25,787 4 2 12,000 446 24,694 2.06 F 23,920 1.99 F Coal Canyon Rd. to Green River Rd. 9,819 43,002 88,953 12,866 22,685 4 2 12,000 452 21,592 1.80 F 22,895 1.91 F Green River Rd. to SR-71 Fwy. 9,468 41,332 82,969 11,658 21,126 4 2 12,000 457 20,033 1.67 F 21,602 1.80 F SR-71 Fwy. to Serfas Club Dr. 9,424 42,042 83,498 11,608 21,032 4 1 10,400 316 20,879 2.01 F 20,762 2.00 F Serfas Club Dr. to Maple St. 9,556 41,001 77,282 10,159 19,715 4 1 10,400 300 19,562 1.88 F 19,804 1.90 F Maple St. to Lincoln Ave. 9,249 39,237 67,807 8,000 17,249 4 1 10,400 290 17,096 1.64 F 17,208 1.65 F Lincoln Ave. to West Grand Blvd. 9,731 37,865 63,657 7,222 16,953 4 1 10,400 113 16,800 1.62 F 16,771 1.61 F West Grand Blvd. to Main St. 9,424 40,048 59,957 5,575 14,999 4 1 10,400 110 14,846 1.43 F 14,913 1.43 F Main St. to I-15 Fwy. 10,126 42,040 65,006 6,430 16,556 4 1 10,400 110 16,403 1.58 F 16,228 1.56 F
SR-9
1 Fw
y. E
B
I-15 Fwy. to McKinley St. 9,074 28,887 46,663 4,977 14,051 4 1 10,400 189 13,745 1.32 F 13,835 1.33 F
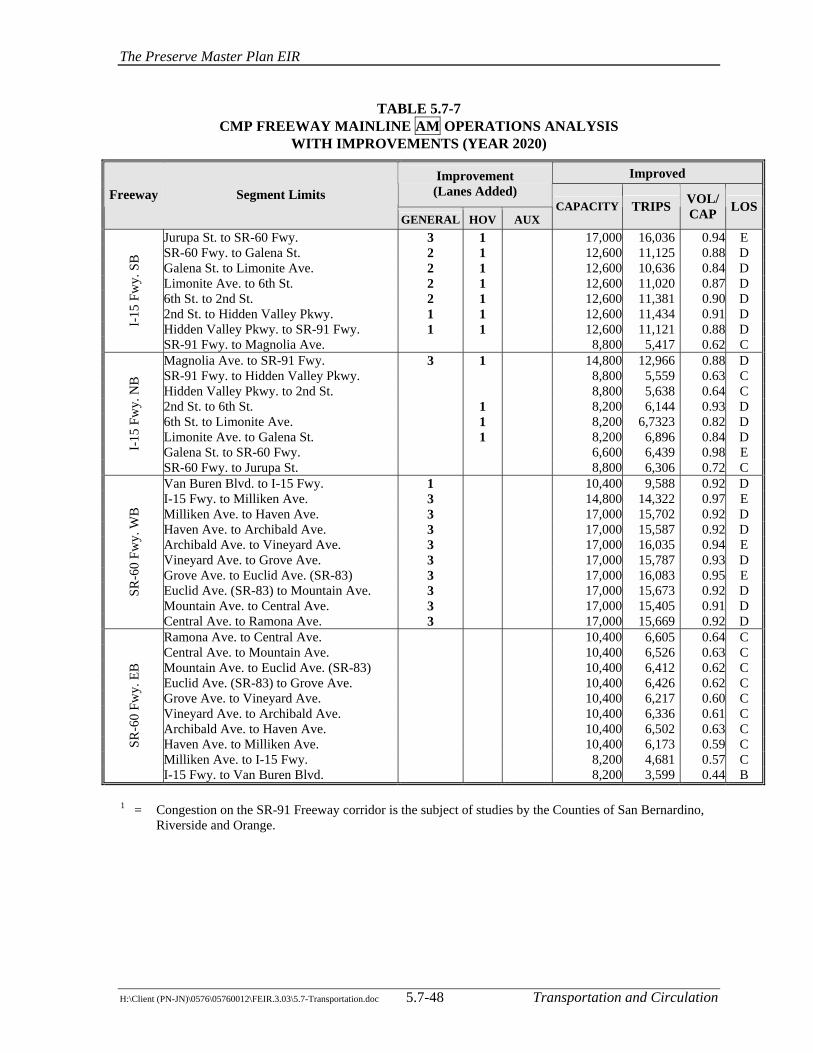
The Preserve Master Plan EIR
H:\Client (PN-JN)\0576\05760012\FEIR.3.03\5.7-Transportation.doc 5.7-48 Transportation and Circulation
TABLE 5.7-7 CMP FREEWAY MAINLINE AM OPERATIONS ANALYSIS
WITH IMPROVEMENTS (YEAR 2020)
Improved Improvement (Lanes Added) Freeway Segment Limits
GENERAL HOV AUX CAPACITY TRIPS VOL/
CAP LOS
Jurupa St. to SR-60 Fwy. 3 1 17,000 16,036 0.94 E SR-60 Fwy. to Galena St. 2 1 12,600 11,125 0.88 D Galena St. to Limonite Ave. 2 1 12,600 10,636 0.84 D Limonite Ave. to 6th St. 2 1 12,600 11,020 0.87 D 6th St. to 2nd St. 2 1 12,600 11,381 0.90 D 2nd St. to Hidden Valley Pkwy. 1 1 12,600 11,434 0.91 D Hidden Valley Pkwy. to SR-91 Fwy. 1 1 12,600 11,121 0.88 D I-
15 F
wy.
SB
SR-91 Fwy. to Magnolia Ave. 8,800 5,417 0.62 C Magnolia Ave. to SR-91 Fwy. 3 1 14,800 12,966 0.88 D SR-91 Fwy. to Hidden Valley Pkwy. 8,800 5,559 0.63 C Hidden Valley Pkwy. to 2nd St. 8,800 5,638 0.64 C 2nd St. to 6th St. 1 8,200 6,144 0.93 D 6th St. to Limonite Ave. 1 8,200 6,7323 0.82 D Limonite Ave. to Galena St. 1 8,200 6,896 0.84 D Galena St. to SR-60 Fwy. 6,600 6,439 0.98 E I-
15 F
wy.
NB
SR-60 Fwy. to Jurupa St. 8,800 6,306 0.72 C Van Buren Blvd. to I-15 Fwy. 1 10,400 9,588 0.92 D I-15 Fwy. to Milliken Ave. 3 14,800 14,322 0.97 E Milliken Ave. to Haven Ave. 3 17,000 15,702 0.92 D Haven Ave. to Archibald Ave. 3 17,000 15,587 0.92 D Archibald Ave. to Vineyard Ave. 3 17,000 16,035 0.94 E Vineyard Ave. to Grove Ave. 3 17,000 15,787 0.93 D Grove Ave. to Euclid Ave. (SR-83) 3 17,000 16,083 0.95 E Euclid Ave. (SR-83) to Mountain Ave. 3 17,000 15,673 0.92 D Mountain Ave. to Central Ave. 3 17,000 15,405 0.91 D
SR-6
0 Fw
y. W
B
Central Ave. to Ramona Ave. 3 17,000 15,669 0.92 D Ramona Ave. to Central Ave. 10,400 6,605 0.64 C Central Ave. to Mountain Ave. 10,400 6,526 0.63 C Mountain Ave. to Euclid Ave. (SR-83) 10,400 6,412 0.62 C Euclid Ave. (SR-83) to Grove Ave. 10,400 6,426 0.62 C Grove Ave. to Vineyard Ave. 10,400 6,217 0.60 C Vineyard Ave. to Archibald Ave. 10,400 6,336 0.61 C Archibald Ave. to Haven Ave. 10,400 6,502 0.63 C Haven Ave. to Milliken Ave. 10,400 6,173 0.59 C Milliken Ave. to I-15 Fwy. 8,200 4,681 0.57 C
SR-6
0 Fw
y. E
B
I-15 Fwy. to Van Buren Blvd. 8,200 3,599 0.44 B 1 = Congestion on the SR-91 Freeway corridor is the subject of studies by the Counties of San Bernardino,
Riverside and Orange.

The Preserve Master Plan EIR
H:\Client (PN-JN)\0576\05760012\FEIR.3.03\5.7-Transportation.doc 5.7-49 Transportation and Circulation
TABLE 5.7-7 (Cont.) CMP FREEWAY MAINLINE AM OPERATIONS ANALYSIS
WITH IMPROVEMENTS (YEAR 2020)
Improved Improvement (Lanes Added) Freeway Segment Limits
GENERAL HOV AUX CAPACITY TRIPS VOL/
CAP LOS
Chino Ave. to Grand Ave. 8,200 6,125 0.75 C Grand Ave. to Chino Hills Pkwy. (SR-142) 8,200 4,866 0.59 C Chino Hills Pkwy. (SR-142) to Ramona Ave. 8,200 3,892 0.47 B Ramona Ave. to Soquel Canyon Pkwy. 8,200 3,892 0.47 B Soquel Canyon Pkwy. to Pine Ave. 6,000 4,922 0.82 D Pine Ave. to Euclid Ave. (SR-83) 6,000 4,656 0.78 D SR
-71
Fwy.
SB
Euclid Ave. (SR-83) to SR-91 Fwy. 1 6,000 4,764 0.79 D SR-91 Fwy. to Euclid Ave. (SR-83) 4,400 3,293 0.75 C Euclid Ave. (SR-83) to Pine Ave. 6,000 3,288 0.55 C Pine Ave. to Soquel Canyon Pkwy. 6,000 3,659 0.61 C Soquel Canyon Pkwy. to Ramona Ave. 8,200 4,133 0.50 B Ramona Ave. to Chino Hills Pkwy. (SR-142) 8,200 3,451 0.42 B Chino Hills Pkwy. (SR-142) to Grand Ave. 8,200 4,663 0.57 C SR
-71
Fwy.
NB
Grand Ave. to Chino Ave. 8,200 5,288 0.64 C McKinley St. to I-15 Fwy. --1 -- 10,400 13,784 1.33 F I-15 Fwy. to Main St. -- -- 10,400 15,866 1.53 F Main St. to West Grand Blvd. -- -- 10,400 14,668 1.41 F West Grand Blvd. to Lincoln Ave. -- -- 10,400 15,924 1.53 F Lincoln Ave. to Maple St. -- -- 10,400 16,295 1.57 F Maple St. to Serfas Club Dr. -- -- 10,400 18,573 1.79 F Serfas Club Dr. to SR-71 Fwy. -- -- 10,400 19,435 1.87 F SR-71 Fwy. to Green River Rd. -- -- 12,000 19,949 1.66 F Green River Rd. to Coal Canyon Rd. -- -- 12,000 21,085 1.76 F
SR-9
1 Fw
y. W
B
Coal Canyon Rd. to Gypsum Canyon Rd. -- -- 12,000 22,667 1.89 F Gypsum Canyon Rd. to Coal Canyon Rd. -- -- 12,000 10,647 0.89 D Coal Canyon Rd. to Green River Rd. -- -- 12,000 10,518 0.88 D Green River Rd. to SR-71 Fwy. -- -- 12,000 10,354 0.86 D SR-71 Fwy. to Serfas Club Dr. -- -- 10,400 10,234 0.98 E Serfas Club Dr. to Maple St. -- -- 10,400 10,113 0.97 E Maple St. to Lincoln Ave. -- -- 10,400 9,598 0.92 D Lincoln Ave. to West Grand Blvd. -- -- 10,400 9,868 0.95 E West Grand Blvd. to Main St. -- -- 10,400 9,753 0.94 E Main St. to I-15 Fwy. -- -- 10,400 10,870 1.05 F
SR-9
1 Fw
y. E
B
I-15 Fwy. to McKinley St. -- -- 10,400 7,317 0.70 C 1 = Congestion on the SR-91 Freeway corridor is the subject of studies by the Counties of San Bernardino,
Riverside and Orange.

The Preserve Master Plan EIR
H:\Client (PN-JN)\0576\05760012\FEIR.3.03\5.7-Transportation.doc 5.7-50 Transportation and Circulation
TABLE 5.7-7 (Cont.) CMP FREEWAY MAINLINE PM OPERATIONS ANALYSIS
WITH IMPROVEMENTS (YEAR 2020)
Improved Improvement (Lanes Added) Freeway Segment Limits
GENERAL HOV AUX CAPACITY TRIPS VOL/
CAP LOS
Jurupa St. to SR-60 Fwy. 1 10,400 8,985 0.86 D SR-60 Fwy. to Galena St. 1 8,200 7,789 0.95 E Galena St. to Limonite Ave. 1 1 10,400 8,782 0.84 D Limonite Ave. to 6th St. 1 1 10,400 8,868 0.85 D 6th St. to 2nd St. 1 8,200 7,795 0.95 E 2nd St. to Hidden Valley Pkwy. 8,800 7,352 0.84 D Hidden Valley Pkwy. to SR-91 Fwy. 8,800 7,226 0.82 D I-
15 F
wy.
SB
SR-91 Fwy. to Magnolia Ave. 2 1 14,800 13,022 0.88 D Magnolia Ave. to SR-91 Fwy. 1 1 10,400 9,064 0.87 D SR-91 Fwy. to Hidden Valley Pkwy. 1 1 12,600 11,690 0.93 D Hidden Valley Pkwy. to 2nd St. 1 1 12,600 11,971 0.95 E 2nd St. to 6th St. 2 1 12,600 11,497 0.91 D 6th St. to Limonite Ave. 2 1 12,600 11,689 0.93 D Limonite Ave. to Galena St. 2 1 12,600 11,275 0.89 D Galena St. to SR-60 Fwy. 2 1 12,600 11,631 0.92 D I-
15 F
wy.
NB
SR-60 Fwy. to Jurupa St. 2 1 14,800 14,496 0.98 E Van Buren Blvd. to I-15 Fwy. 8,200 6,401 0.78 D I-15 Fwy. to Milliken Ave. 1 10,400 10,113 0.97 E Milliken Ave. to Haven Ave. 1 12,600 10,999 0.87 D Haven Ave. to Archibald Ave. 1 12,600 11,388 0.90 D Archibald Ave. to Vineyard Ave. 1 12,600 11,258 0.89 D Vineyard Ave. to Grove Ave. 1 12,600 11,137 0.88 D Grove Ave. to Euclid Ave. (SR-83) 1 12,600 11,387 0.90 D Euclid Ave. (SR-83) to Mountain Ave. 1 12,600 11,070 0.88 D Mountain Ave. to Central Ave. 1 12,600 11,076 0.88 D
SR-6
0 Fw
y. W
B
Central Ave. to Ramona Ave. 1 12,600 11,106 0.88 D Ramona Ave. to Central Ave. 3 17,000 16,369 0.96 E Central Ave. to Mountain Ave. 3 17,000 16,383 0.96 E Mountain Ave. to Euclid Ave. (SR-83) 3 17,000 16,533 0.97 E Euclid Ave. (SR-83) to Grove Ave. 3 17,000 16,375 0.96 E Grove Ave. to Vineyard Ave. 3 17,000 15,730 0.93 D Vineyard Ave. to Archibald Ave. 3 17,000 16,025 0.94 E Archibald Ave. to Haven Ave. 3 17,000 15,593 0.92 D Haven Ave. to Milliken Ave. 3 17,000 15,861 0.93 D Milliken Ave. to I-15 Fwy. 3 14,800 12,792 0.86 D
SR-6
0 Fw
y. E
B
I-15 Fwy. to Van Buren Blvd. 1 10,400 10,236 0.81 D Chino Ave. to Grand Ave. 8,200 7,218 0.88 D Grand Ave. to Chino Hills Pkwy. (SR-142) 8,200 6,415 0.78 D Chino Hills Pkwy. (SR-142) to Ramona Ave. 8,200 5,121 0.62 C Ramona Ave. to Soquel Canyon Pkwy. 8,200 5,120 0.62 C Soquel Canyon Pkwy. to Pine Ave. 6,000 4,847 0.81 D Pine Ave. to Euclid Ave. (SR-83) 6,000 4,389 0.73 C SR
-71
Fwy.
SB
Euclid Ave. (SR-83) to SR-91 Fwy. 1 6,000 4,016 0.91 D 1 = Congestion on the SR-91 Freeway corridor is the subject of studies by the Counties of San Bernardino,
Riverside and Orange.

The Preserve Master Plan EIR
H:\Client (PN-JN)\0576\05760012\FEIR.3.03\5.7-Transportation.doc 5.7-51 Transportation and Circulation
TABLE 5.7-7 (Cont.) CMP FREEWAY MAINLINE PM OPERATIONS ANALYSIS
WITH IMPROVEMENTS (YEAR 2020)
Improved Improvement (Lanes Added) Freeway Segment Limits
GENERAL HOV AUX CAPACITY TRIPS VOL/
CAP LOS
SR-91 Fwy. to Euclid Ave. (SR-83) 1 6,000 5,345 0.89 D Euclid Ave. (SR-83) to Pine Ave. 6,000 5,368 0.89 D Pine Ave. to Soquel Canyon Pkwy. 6,000 5,447 0.91 D Soquel Canyon Pkwy. to Ramona Ave. 8,200 5,093 0.62 C Ramona Ave. to Chino Hills Pkwy. (SR-142) 8,200 4,378 0.53 B Chino Hills Pkwy. (SR-142) to Grand Ave. 8,200 5,726 0.70 C SR
-71
Fwy.
NB
Grand Ave. to Chino Ave. 8,200 7,156 0.87 D McKinley St. to I-15 Fwy. --1 -- 10,400 8,313 0.80 D I-15 Fwy. to Main St. -- -- 10,400 11,757 1.13 F Main St. to West Grand Blvd. -- -- 10,400 10,717 1.03 F West Grand Blvd. to Lincoln Ave. -- -- 10,400 10,935 1.05 F Lincoln Ave. to Maple St. -- -- 10,400 12,164 1.17 F Maple St. to Serfas Club Dr. -- -- 10,400 12,744 1.23 F Serfas Club Dr. to SR-71 Fwy. -- -- 10,400 12,836 1.23 F SR-71 Fwy. to Green River Rd. -- -- 12,000 13,152 1.10 F Green River Rd. to Coal Canyon Rd. -- -- 12,000 13,794 1.15 F
SR-9
1 Fw
y. W
B
Coal Canyon Rd. to Gypsum Canyon Rd. -- -- 12,000 13,773 1.15 F Gypsum Canyon Rd. to Coal Canyon Rd. -- -- 12,000 23,920 1.99 F Coal Canyon Rd. to Green River Rd. -- -- 12,000 22,895 1.91 F Green River Rd. to SR-71 Fwy. -- -- 12,000 21,602 1.80 F SR-71 Fwy. to Serfas Club Dr. -- -- 10,400 20,762 2.00 F Serfas Club Dr. to Maple St. -- -- 10,400 19,804 1.90 F Maple St. to Lincoln Ave. -- -- 10,400 17,208 1.65 F Lincoln Ave. to West Grand Blvd. -- -- 10,400 16,771 1.61 F West Grand Blvd. to Main St. -- -- 10,400 14,913 1.43 F Main St. to I-15 Fwy. -- -- 10,400 16,228 1.56 F
SR-9
1 Fw
y. E
B
I-15 Fwy. to McKinley St. -- -- 10,400 13,835 1.33 F 1 = Congestion on the SR-91 Freeway corridor is the subject of studies by the Counties of San Bernardino,
Riverside and Orange.


The Preserve Master Plan EIR
H:\Client (PN-JN)\0576\05760012\FEIR.3.03\5.7-Transportation.doc 5.7-53 Transportation and Circulation
5.7.5 CUMULATIVE IMPACTS
The cumulative impacts were previously identified for the Buildout with Project traffic conditions analysis that combined future traffic without the project with traffic generated by the proposed project. The proposed project will contribute to significant and cumulative adverse traffic conditions at Buildout.
5.7.6 MITIGATION MEASURES
T-1 Notification: Since the project contributes significant traffic to a State Highway (I-15 Freeway, SR-71 Freeway, SR-60 Freeway, and SR-91 Freeway), and it also contributes significant traffic to roadway segments serving CMP intersections within the jurisdictions of the City of Chino Hills, City of Ontario, County of San Bernardino, City of Norco, City of Corona, and the County of Riverside, the City of Chino shall notify the Congestion Management Agency (SANBAG), the California Department of Transportation (Caltrans), the City of Chino Hills, City of Ontario, County of San Bernardino, City of Norco, City of Corona, and the County of Riverside in accordance with CMP requirements. Each of these agencies must be provided with a copy of the CMP traffic study, once the document is accepted by the City of Chino.
T-2 The proposed project shall construct or otherwise provide for all internal roadway improvements. The provision of such improvements shall be phased to address the incremental impacts of individual development projects.
T-3 The City of Chino shall work cooperatively through SCAG and SANBAG to develop regional/subregional projects and identify regional transportation funding needed to minimize future freeway deficiencies. The City will actively participate in other future regional and/or subregional efforts to reduce freeway congestion.
T-4 The City of Chino shall participate in planning efforts to develop subregional and/or regional transportation facilities based on equitable cost sharing programs among cities and counties.
T-5 The City of Chino shall provide traffic operations and traffic systems management (TSM) improvements, including signal system coordination, automated traffic control, Smart Corridors, intelligent transportation systems, and other measures.
T-6 Individual development projects shall be reviewed by the City for integration of trip reduction measures, travel demand management (TDM) strategies and alternative transportation modes, consistent with the Specific Plan.
The Preserve Master Plan EIR
H:\Client (PN-JN)\0576\05760012\FEIR.3.03\5.7-Transportation.doc 5.7-54 Transportation and Circulation
T-7 In the initial phases of development, the City of Chino shall require that a Transit Feasibility Study be prepared of the proposed project transit system. The feasibility study should address the timing of transit development vis-a-vis development phasing, and the interface with future regional transit works. To respond to potential issues related to the development of such a system, the following actions must be undertaken:
• Identify the various funding mechanisms associated with the construction and operation of the system.
• Require each proposed project to provide adequate right of way for such a system and construct the required infrastructure.
• Establish design criteria and an evaluation process for determining transit stop locations that ensure pedestrian access prior to tentative map approval.
• Operational issues, such as the future management of the system, may be deferred until the appropriate time, based upon discussions with current regional transit providers.
T-8 The City of Chino shall contact appropriate transit agencies to encourage an expansion of transit services up to and within the project area.
T-9 Traffic studies shall be required as deemed necessary by the City Engineer. Each study will identify the timing, and extent of required improvements to adequately evaluate future traffic impacts of individual projects needed to mitigate the impacts of such development.
5.7.7 LEVEL OF SIGNIFICANCE AFTER MITIGATION
Outside of state and federal funding sources, and application of San Bernardino County’s Proposition “A” half-cent sales tax, no mechanisms are currently in place for local contributions to needed freeway improvements on a project-by-project basis. Similarly, no mechanisms or interagency agreements exist to address full funding and construction of offsite intersection improvements needed by cumulative projects and regional growth. The project will provide for the full cost or in-lieu construction of road improvements within the boundaries of the plan area, including the proportionate share of costs associated with impacts of other regional traffic. With implementation of the identified mitigation measures, cumulative traffic impacts will be reduced, but not to less than significant levels.