the presenilin 1 ∆e9 mutation gives enhanced basal … · 4 hydrolysis of phosphoinositides (pi)...
TRANSCRIPT

1
The presenilin 1 ∆E9 mutation gives enhanced basal phospholipase C
activity and a resultant increase in intracellular calcium concentrations.
Angel Cedazo-Mínguez*1, Bogdan O. Popescu*1, Maria Ankarcrona1,2, Takeshi
Nishimura2 and Richard F. Cowburn1,2.
1. Karolinska Institutet. Neurotec, Section of Experimental Geriatrics,
NOVUM, KFC, 141 86 Huddinge, Sweden.
2. Karolinska Institutet. Neurotec, Section of Experimental Geriatrics, KASPAC,
NOVUM, 141 57 Huddinge, Sweden.
*These authors contributed equally to the work.
Address correspondence to:
Angel Cedazo-Mínguez
Karolinska Institutet, Neurotec,
Section of Experimental Geriatrics
Novum, KFC, plan 4
S-141 86 Huddinge, Sweden
Phone: +46 8 585 83751
FAX: +46 8 585 83880
e-mail: [email protected]
Running title: Presenilin 1 ∆E9 mutation enhances PLC activity.
Copyright 2002 by The American Society for Biochemistry and Molecular Biology, Inc.
JBC Papers in Press. Published on July 16, 2002 as Manuscript M112117200 by guest on Septem
ber 22, 2018http://w
ww
.jbc.org/D
ownloaded from

2
Summary
We studied effects of the familial Alzheimer's disease (FAD) presenilin 1 (PS1) exon
9 deletion (PS1-∆E9) mutation on basal and carbachol-stimulated phosphoinositide (PI)
hydrolysis and intracellular Ca2+ concentrations ([Ca2+]i) in human SH-SY5Y
neuroblastoma cells. We demonstrate that PS1-∆E9 cells have an enhanced basal PI
hydrolysis and [Ca2+]i as compared with both wild type PS1 (PS1-WT) and non-
transfected (NT) cells. Both were reversed by the phospholipase C (PLC) inhibitor
neomycin. The PS-1∆E9 related high basal [Ca2+]i was also reversed by xestospongin C
confirming that this effect was inositol trisphosphate receptor (IP3R)-mediated. Carbachol
gave a greater stimulation of [Ca2+]i in PS1-∆E9 cells that took longer to return to basal as
compared to responses seen in NT and PS1-WT cells. This long tail-off effect seen in
PS1-∆E9 cells after carbachol stimulation was reversed by xestospongin C and dantrolene
suggesting that it was mediated by IP3R and ryanodine receptor amplification of Ca2+.
Ruthenium red only reduced carbachol peak elevations of [Ca2+]i in NT and PS1-WT
cells and not in PS1-∆E9 cells. No significant between cell type differences were seen for
basal and carbachol stimulated [Ca2+]i with either ryanodine or the endoplasmic reticulum
Ca2+ ATP-ase inhibitor cyclopiazonic acid. Immunostaining experiments revealed that for
all the cell types PS1 is present at the plasma membrane and co-localises with N-
cadherin, a component of the cell-cell adhesion complex. Immunoblotting of cell extracts
for PLC-β1 showed that compared to NT and PS1-WT cells, the PS1-∆E9 transfectants
gave a relative increase in levels of the calpain generated N-terminal fragment (100 kDa)
over full length (150 kDa) PLC-β1. Our results suggest that the PS1-∆E9 mutation causes
upstream changes in PI signalling with enhanced basal PLC activity as a primary effect
that leads to a higher [Ca2+]i. This may provide a novel mechanism by which the PS1-∆E9
mutation sensitises cells to apoptotic stimuli and enhanced Aβ generation.
by guest on September 22, 2018
http://ww
w.jbc.org/
Dow
nloaded from

3
1. Introduction
Mutations in the presenilin 1 (PS1) gene on chromosome 14 account for a large
proportion of the early onset familial cases of Alzheimer’s disease (FAD) (1). Two
pathogenic mechanisms have been proposed by which PS1 mutations cause FAD. One
mechanism involves altered proteolytic processing of the amyloid precursor protein
(APP). Fibroblasts from PS1 mutation bearing individuals, brains from mice
overexpressing mutant PS1, as well as cells transfected with FAD-linked PS1 variants, all
produce a greater proportion of longer, more fibrillogenic forms of β-amyloid (Aβ) (2, 3,
4). Several recent studies have shown that PS1 plays an important role in regulating the γ-
secretase cleavage of APP (5, 6, 7) and it has been hypothesised that PS could in fact be
the γ-secretase enzyme (8).
A second mechanism proposes that PS1 mutations make cells more vulnerable to
undergo death by apoptosis. Guo et al, showed that the PS1 L286V mutation increases the
vulnerability of PC12 cells to apoptosis induced by Aβ (9) and nerve growth factor
withdrawal (10). The pro-apoptotic effects of PS1 have been shown to involve increases
in intracellular Ca2+ concentration ([Ca2+]i) and peroxide levels under conditions of
oxidative and excitotoxic stress (9, 10). Hippocampal neurons from L286V PS1 mutant
knockin mice are more vulnerable to excitotoxicity associated with increased [Ca2+]i
levels (10). These data are in accordance with older reports showing that bradykinin
stimulated fibroblasts from FAD patients have higher [Ca2+]i than fibroblasts from age-
matched controls (11, 12). Dysregulation of [Ca2+]i may be of importance in the
pathogenesis of AD, since it has also been shown to contribute to enhanced Aβ
generation (13) and tau protein hyperphosphorylation (14).
A large proportion of Ca2+ mobilisation and regulation in neurons can be attributable
to cholinergic neurotransmission (15). Activation of phospholipase C (PLC) results in
by guest on September 22, 2018
http://ww
w.jbc.org/
Dow
nloaded from

4
hydrolysis of phosphoinositides (PI) to give formation of the second messengers inositol
1,4,5 trisphosphate (IP3) and diacylglycerol (DAG). Whilst IP3 releases Ca2+ from
intracellular stores, DAG activates protein kinase C (PKC) (for review see 16).
Cholinergic stimulation of PI hydrolysis has been shown to be severely impaired in brain
tissue from AD subjects (for review, see 17). In addition, two molecules that play an
essential role in AD, namely Aβ and apolipoprotein E4, have both been shown to disrupt
acetylcholine muscarinic receptor stimulated PI hydrolysis in vitro (18, 19).
Recent studies from Leissring and colleagues have provided some insight into the
mechanisms by which PS1 mutations affect Ca2+ signalling. Using Xenopus oocytes
loaded with caged IP3, they demonstrated that PS1 modulates the IP3 mediated Ca2+
release from internal stores and that this was enhanced in cells expressing the PS1
M146V mutation (20, 21). PS1 effects on Ca2+ signalling were suggested to be owing to
an abnormal elevation of Ca2+ within the endoplasmic reticulum (ER) rather than to
perturbations in either the number or activity of IP3-activated Ca2+ release channels (22).
At present, the effects of PS1 mutations on cholinergic signalling processes upstream of
the IP3 receptor have not been determined.
A previous report by Moerman and Barger (23) showed that the PS1-L286V
mutation dampened glutamate-induced Ca2+ responses mediated by α-amino-3-hydroxy-
5-methyl-4-isoxazolepropionic acid receptors in human NT2 neuroblastoma cells. This
study suggested that PS1 mutations may alter upstream neurotransmission processes with
resultant consequences for survival at the cellular level and for cognition at the
physiological level.
To test the hypothesis that FAD-linked PS1 mutations influence muscarinic receptor-
stimulated signalling, we used SH-SY5Y neuroblastoma cells stably transfected with
either wild type PS1 (PS1-WT) or the FAD causing exon 9 deletion mutation of PS1
by guest on September 22, 2018
http://ww
w.jbc.org/
Dow
nloaded from

5
(PS1-∆E9) to compare basal and carbachol stimulated PI hydrolysis and [Ca2+]i. SH-
SY5Y neuroblastoma cells have been extensively used as a neuronal model to study PI
hydrolysis (for review see 24). We also examined downstream effects of the PS1-∆E9
mutation on Ca2+ release from the endoplasmic reticulum (ER) through IP3 receptors
(IP3R), ryanodine receptors (RyR) and Ca2+-transporting ATP-ases under basal conditions
and following acetylcholine muscarinic receptor stimulation.
by guest on September 22, 2018
http://ww
w.jbc.org/
Dow
nloaded from

6
2. Materials and methods
Materials
Chemicals and isotopes were purchased from the following companies: myo [2-3H]
inositol (10 Ci / mmol) from NEN, Du Pont, Europe. Carbamylcholine chloride
(carbachol), DOWEX 1X8-200 (chloride form), ruthenium red, ryanodine, dantrolene,
cyclopiazonic acid, and probenecid were from Sigma-Aldrich, Sweden. Neomycin
(neomycin sulfate) and xestospongin C, were from Calbiochem-Novabiochem
(Darmstadt, Germany). Fluo-3 acetoxymethyl (AM) ester and Pluronic F-127 were
purchased from Molecular Probes (Europe BV, The Netherlands).
All other chemicals were standard laboratory reagents.
Cell Culture
Human SH-SY5Y neuroblastoma cells stably transfected with either PS1-WT or the
PS1-∆E9 mutation were established in our lab as described previously (25).
SH-SY5Y neuroblastoma cells were cultured at 37°C, 5% CO2, in Minimum
essential medium (MEM) with Earle´s salts containing 10% Foetal Calf Serum (FCS), 2
mM L-Glutamine, 100 units/ml penicillin, 100 µg/ml streptomycin. Transfected cells
were additionally supplemented with 200 µg/ml geneticin. All cell culture supplies were
purchased from GIBCO-BRL, Life Technologies (European Division).
Immunoblot analysis
The expression of PS1 in non-transfected (NT) and transfected cell lines was checked
by Western blotting as previously described (25). To obtain cell extracts, cells were
by guest on September 22, 2018
http://ww
w.jbc.org/
Dow
nloaded from
7
washed twice with ice-cold Ca2+- and Mg2+- free phosphate buffered saline (PBS),
harvested with a cell-scraper and collected by 3000 rpm centrifugation for 3 min. Pellets
were resuspended in 100 µl of lysis buffer (20 mM Tris-HCl, 137 mM NaCl, 2 mM
EDTA, 2% Nonidet P-40, 2% Triton-X100 and 400 µg/ml protease inhibitors-Complete
TM mini, Boehringer Mannheim, Germany) and centrifuged at 11000 rpm for 10 min at
4°C. Samples were stored at -20°C until use. Protein amounts in cell extracts were
quantified by the Protein assay kit (Pierce, Rockford, IL, USA). Equivalent amounts of
protein were separated by SDS-PAGE using 10% or 7% acrylamide gels for the PS-1 or
PLC expression analyses respectively. Proteins were transferred onto Hybond ECL
nitrocellulose membranes (Amersham, UK) by trans-blot Electrophoretic Transfer for 4 h
at a constant current of 200 mA. After blocking for 1 h using 5% (w/v) dried milk in Tris-
buffered solution containing 0.1% Tween-20 (TBS-t) the membranes were incubated
overnight with the first antibody at the following concentrations; 1:2000 (PS1 antibody),
1:1000 (PLC-β1 and PLC-γ antibodies; Transduction Laboratories, Lexington, KY,
USA). The membranes were washed in TBS-t for 15 min and then three times for 5 min.
The secondary antibody (anti-rabbit or anti-mouse horseradish peroxidase linked)
(Amershan Life Science, UK) diluted in blocking solution (1:2000) was added to the
membranes for 1 h at room temperature. The membranes were then washed as described
above, plus a further wash of 1 h. Bound antibody was detected by the ECL method
(Amersham, UK) after exposure to Hyper film MP (Amersham, UK). The relative density
of immunoreactive bands on Western blots was calculated from the optical density
multiplied by the area of the selected band, following acquisition of the blot image
through Image Master (Pharmacia Biotech, Sweden).
by guest on September 22, 2018
http://ww
w.jbc.org/
Dow
nloaded from
8
PI hydrolysis assay
Cells were cultured until 75-80 % confluence in 75 cm2 flasks. One day prior to the
experiment, cells were changed to serum free media containing 5 µCi/ml myo [2-3H]
inositol and incubated for 24 h. PI hydrolysis was measured as described previously (19).
Cells were harvested by scraping with a rubber policeman in 4 ml PBS. Contents were
centrifuged at 1500 rpm for 15 min. Pellets were washed twice with 37°C PBS and re-
suspended in 3 ml 37°C Krebs-Henseleit bicarbonate buffer containing 10 mM LiCl
(KHB/Li), gassed with 5% CO2 / 95% O2 and centrifuged again (15 000 rpm, 15 min).
Cell pellets were re-suspended in 210 µl KHB/Li, regassed and 50 µl added to glass
centrifuge tubes containing 250 µl KHB/Li buffer with or without 100 µM carbachol. The
tubes were incubated at 37°C under an atmosphere of 5% CO2 / 95% O2 with gentle
agitation for 25 min. Incubations were stopped by adding 940 µl of chloroform: methanol
(1:2). Tubes were incubated on ice for 30 min and phases separated by adding 310 µl
chloroform and 310 µl water followed by vortexing and centrifugation. 750 µl of the
aqueous phase were removed and labelled inositol phosphates (IPs) separated from [3H]
myoinositol by DOWEX chromatography, as described by Berridge (26). The chloroform
phase was extracted with 75 µl HCl and tubes were vortexed again for 20 s, followed by 5
min centrifugation. The chloroform phase was removed, placed into scintillation vials and
allowed to evaporate before determination of “lipid dpm” by scintillation spectroscopy.
Results were expressed as dpm IPs / (dpm IPs + dpm lipid). This unit is independent of
the number of cells aliquoted in each tube and upon the degree of labelling of inositol
phospholipids (27).
For the treatments with neomycin, one day prior to the experiment cells were
changed to serum free media containing 5 µCi/ml myo [2-3H] inositol, and incubated for
by guest on September 22, 2018
http://ww
w.jbc.org/
Dow
nloaded from

9
21 h. The medium was then replaced with that containing neomycin (500 µM) plus 5
µCi/ml myo [2-3H] inositol for 3 hr prior to PI hydrolysis measures.
Intracellular calcium measurements
Intracellular Ca2+ concentrations were essentially determined as previously described
(28). In brief, cells were loaded with medium containing 5 µM Fluo-3 AM ester, 0.5%
(V/V) Pluronic F-127 and 1 mM of the organic anion-transport inhibitor probenecid (90
min in the dark, at room temperature). After loading, cells were incubated for 120 min in
MEM without phenol red with 1 mM probenecid in the dark, at room temperature, to
allow intracellular esterases to decompose the Fluo-3 AM ester. For the measurements of
basal [Ca2+]i, the medium was removed and Ca2+ and Mg2+ free PBS added. Basal [Ca2+]i
was measured repeatedly during 10 min at 37 ºC to certify that a steady state of [Ca2+]i
was obtained. Preliminary experiments showed that for all three cell types, basal [Ca2+]i
in the absence of treatments was steady during the entire incubation time courses used
(data not shown). Neomycin, ruthenium red, ryanodine, and cyclopiazonic acid were
added in PBS at indicated concentrations at 37 ºC for the 10 min when basal [Ca2+]i was
measured. Xestospongin C and dantrolene were added at indicated concentrations in
MEM without phenol red during the 120 min of incubation time and in PBS for the 10
minutes when basal [Ca2+]i was measured. The PBS was then removed and 100 µM
carbachol in PBS solution at 37 ºC added (100 µl to each well). Carbachol was present for
all subsequent [Ca2+]i measures. Fluorescence was measured by a CytoFluor Series 4000
multi-well plate reader (PerSeptive Biosystems GmbH, Wiesbaden, Germany), the
excitation and emission wavelengths being 485 and 530 nm, respectively. Slit widths
were 20 nm for both excitation and emission. Apparent [Ca2+]i corresponding to
fluorescent value F was calculated with the formula: [Ca2+]i = Kd (F-Fmin)/(Fmax-F), where
by guest on September 22, 2018
http://ww
w.jbc.org/
Dow
nloaded from

1 0
Kd for Fluo-3-Ca2+ was taken as 390 nm, as indicated by the manufacturer’s protocol
(Molecular Probes, Europe BV, The Netherlands). Fmin was determined by measuring the
signal of the unloaded cells and Fmax was determined by addition to the cells of a 100 mM
CaCl2 buffer containing 1% (V/V) Triton-X 100.
Immunocytochemistry and confocal microscopy
Cells grown on cover-slips were fixed at 4°C in 2% paraformaldehyde + 0.2%
glutaraldehyde for 20 min and subsequently rinsed in PBS (3 x 10 min). Cells were
permeabilised with 0.2 % Triton X-100 in PBS for 10 min and then 10 % goat-serum
was added for 30 min to block unspecific binding of antibodies. Cells were incubated
over-night at 4°C with primary antibodies diluted in 10 % serum. Polyclonal anti PS1 N-
terminal antibody was diluted 1:500 and monoclonal anti α-N-cadherin antibody was
diluted 1:500. Next day cells were rinsed in PBS (3 x 10 min) before incubation with
anti-mouse antibody conjugated to Alexa green (1:400 dilution) and anti-rabbit antibody
conjugated to cy3 (1:1000 dilution) in PBS + 0.3% Triton X-100 for 1h in the dark.
Finally cells were rinsed in PBS (3 x 10 min) and mounted in glycerol:PBS 1:1 on glass-
slides.
Fluorescence images were excited using the 488 nm line of a krypton laser and the
543 nm line of a helium-neon laser on a Bio-Rad Radiance Plus confocal microscope.
Cy3 fluorescence was collected using a HQ 590/70 emission filter (red) and Alexa green
was collected with a HQ 515/30 emission filter (green).
Statistical analyses.
Analyses of differences were carried out by ANOVA followed by Fisher’s PLSD
post-hoc test. A value of p<0.05 was considered statistically significant.
by guest on September 22, 2018
http://ww
w.jbc.org/
Dow
nloaded from

1 1
3. Results
PS1 expression in transfected cell lines
SH-SY5Y neuroblastoma cells stably transfected to express moderate levels of PS1-
WT and PS1-∆E9 were established previously in our lab (25). The expression of PS1 in
these cell lines was confirmed by sequencing and checked by immunoblotting using a
PS1 N-terminal antiserum. The pattern of PS1 expression was similar as reported before
(25). NT cells were found to express very low levels of PS1 holoprotein, most of PS1
being identified as approximately 28 kDa band corresponding to endogenous PS1 N-
terminal fragment (NTF). PS1-WT cells (clones 1-1 and 1-14) showed accumulation of
full length PS1 (48 kDa) as well as of NTF. PS1-∆E9 cells (clones 1-2 and 2-4) lack the
cleavage site where the physiological proteolytic cleavage occurs (site between residues
291 and 299), and showed accumulation of a truncated full-length protein and a reduced
endogenous NTF consistent with the deletion of the cleavage region (Figure 1). Both WT
and mutant clones showed similar PS1 mRNA levels following transfection (25). The 1-2
clone of PS1-∆E9 cells shows the highest levels of truncated holoprotein and lower levels
of endogenous NTF indicative of higher expression, as compared to the 2-4 clone.
Effects of the PS1-∆E9 mutation on basal and carbachol stimulated PI hydrolysis.
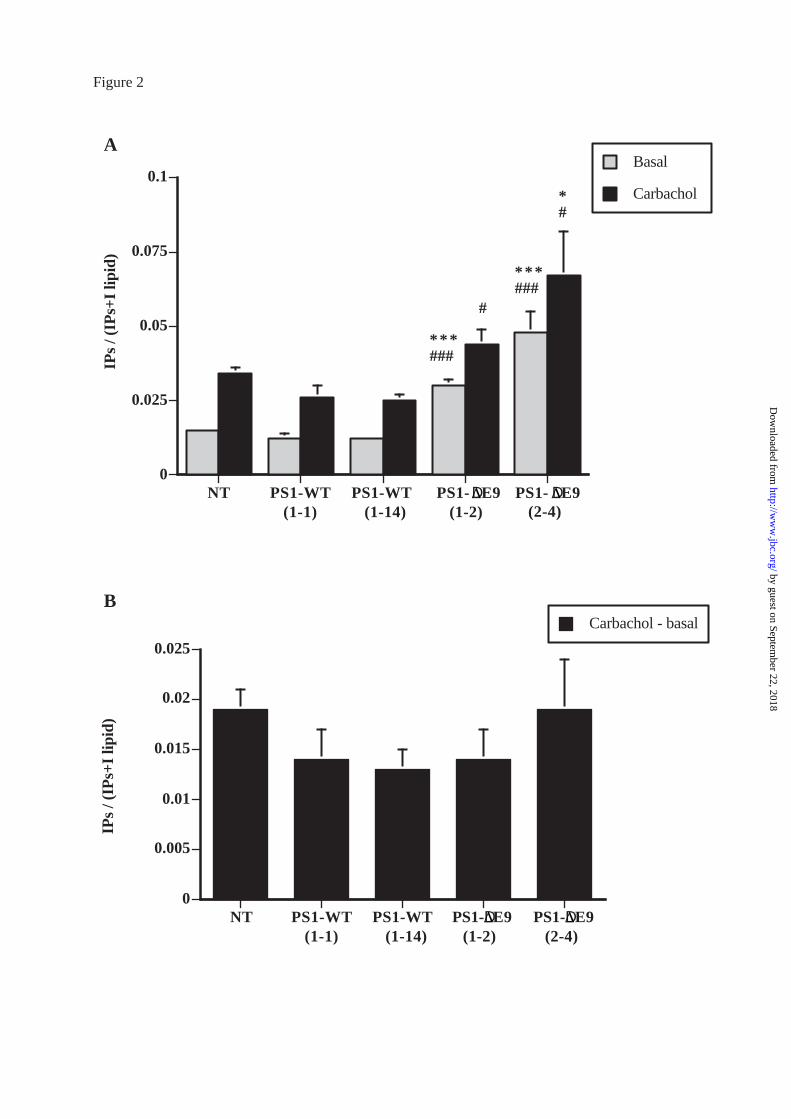
Figure 2A shows that basal PI hydrolysis was significantly higher in both clones of
PS1-∆E9 cells (1-2 and 2-4) as compared to NT and to both clones of PS1-WT cells (1-1
and 1-14). Carbachol (100 µM) stimulated PI hydrolysis was significantly higher in both
clones of PS1-∆E9 cells as compared to both clones of PS1-WT cells (Figure 2A). The
clone 2-4 of PS1-∆E9 cells also showed a significantly higher carbachol stimulated PI
hydrolysis as compared to NT cells.
by guest on September 22, 2018
http://ww
w.jbc.org/
Dow
nloaded from

1 2
However, analysis of the carbachol stimulated PI hydrolysis as the difference from
basal did not show significant differences between any of the three cell types (Figure 2B).
Effects of the PS1-∆E9 mutation on basal and carbachol stimulated intracellular Ca2+
concentrations.
Basal [Ca2+]i (values given for time 0 before addition of carbachol) was similar in NT
(36.2 ± 1.3 nM) and in PS1-WT cells (36.1 ± 0.9 nM; and 38.6 ± 1.2 nM, respectively for
clones 1-1 and 1-14). The PS1-∆E9 transfected cells showed significantly higher basal
[Ca2+]i (58.6 ± 3.2 nM and 65.1 ± 3.2 nM, respectively for clones 1-2 and 2-4) as
compared with both NT and both clones of PS1-WT cells (p<0.001; ANOVA, Fisher's
post-hoc test) (Figure 3).
Treatment of cells with 100 µM carbachol gave a rapid peak elevation of [Ca2+]i.
Peak elevations were found at approximately 30 sec after addition of carbachol. No
significant differences were found for peak [Ca2+]i elevations between PS1-WT (64.0 ±
3.6 nM and 73.0 ± 2.33 nM, respectively for clones 1-1 and 1-14) and NT cells (65.1 ±
3.3 nM). The PS1-∆E9 clones showed a carbachol induced peak [Ca2+]i elevation of 105.4
± 3.9 nM (clone 1-2) and 133.6 ± 12.4 nM (clone 2-4). These values were statistically
significantly higher than those seen for both NT and both clones of PS1-WT cells
(p<0.001; ANOVA, Fisher's post-hoc test). [Ca2+]i returned to basal after approximately
120 sec in NT and PS1-WT cells. In contrast, the PS1-∆E9 cells showed a long tail-off
effect where [Ca2+]i was still significantly higher than basal even at 5 min after addition
of carbachol (p<0.01; ANOVA, Fisher's post-hoc test) (Figure 3).
For subsequent experiments of PI hydrolysis and [Ca2+]i measurements we selected
the 1-1 clone of PS1-WT and the 1-2 clone of PS1-∆E9. The 1-2 clone of PS1-∆E9 gave
by guest on September 22, 2018
http://ww
w.jbc.org/
Dow
nloaded from

1 3
lower basal and carbachol stimulated PI and [Ca2+] responses as compared to the 2-4
clone and was chosen so as to avoid potential ceiling effects.
Neomycin reversal of basal PI hydrolysis and [Ca2+]i in PS1-∆E9 cells to levels seen in
PS1-WT cells.
An enhanced high basal PI hydrolysis could lead to a rise in [Ca2+]i. Alternatively,
high [Ca2+]i could activate various PLC isoforms thereby resulting in an enhanced PI
hydrolysis. To investigate the relationship between PLC activity and [Ca2+]i, we treated
cells with neomycin, an inhibitor of PLC (29), and then determined both basal and
carbachol stimulated PI hydrolysis and [Ca2+]i.
Pre-treatment for 3 h with neomycin (500 µM) gave drastic reductions of both basal
and carbachol stimulated PI hydrolysis in all cell lines. Neomycin (500 µM) decreased
the high basal and carbachol stimulated PI hydrolysis seen in PS1-∆E9 cells to the same
level as for PS1-WT and NT cells (Figure 4A).
Neomycin (100 and 500 µM), treatment for 10 min before carbachol stimulation did
not affect basal [Ca2+]i in either NT or PS1-WT cells. In contrast, both neomycin
concentrations significantly reduced basal [Ca2+]i in PS1-∆E9 cells (to 43.9 ± 1.0 nM and
39.8 ± 1.3 nM, for 100 µM and 500 µM, neomycin respectively) (Figure 4B). Neomycin
(500 µM) completely reversed the significantly higher basal [Ca2+]i in PS1-∆E9 cells to
levels comparable to those seen in NT and PS1-WT cells (Figure 4B).
Neomycin treatment also significantly reduced the carbachol elevation of [Ca2+]i in
all cell lines (to 55.4 ± 4.9 nM, 52.0 ± 5.9 nM and 84.7 ± 6.2 nM in NT, PS1-WT and
PS1-∆E9 cells, respectively for 100 µM neomycin and to 52.7 ± 4.1 nM, 46.9 ± 5.0 nM
and 71.1 ± 4.2 nM in NT, PS1-WT and PS1-∆E9 cells, respectively for 500 µM
neomycin). The neomycin (both 100 µM and 500 µM) reduction of carbachol stimulated
by guest on September 22, 2018
http://ww
w.jbc.org/
Dow
nloaded from

1 4
[Ca2+]i seen in PS1-∆E9 cells did not come down to the same level as seen for either NT
(p<0.05; ANOVA, Fisher's post-hoc test) or PS1-WT cells (p<0.01; ANOVA, Fisher's
post-hoc test) (Figure 4B).
Regulation of intracellular Ca2+ pools in NT, PS1-WT and PS1-∆E9 cells.
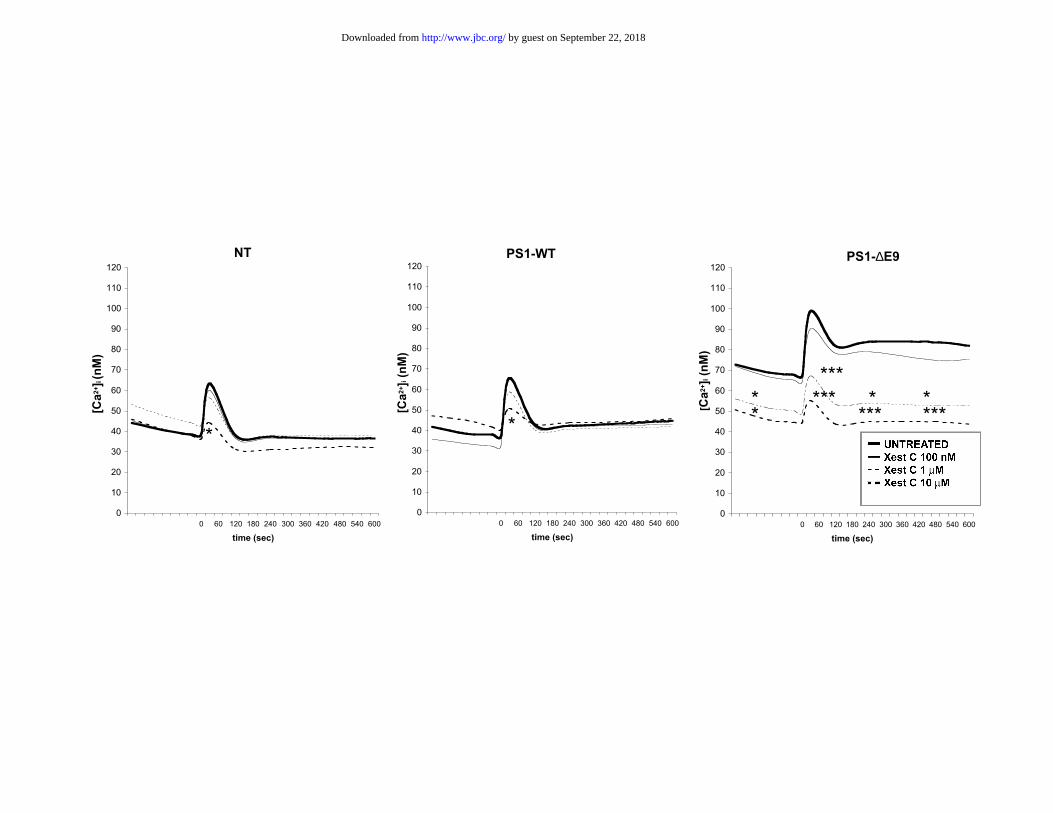
Xestospongin C, a specific antagonist of IP3R (30), did not induce significant
changes of basal [Ca2+]i in either NT or PS1-WT cells. In contrast, for PS1-∆E9 cells
xestospongin C gave a significant reduction of basal [Ca2+]i to the levels seen in NT and
PS1-WT cells (to 49.0 ± 1.5 nM and to 44.2 ± 1.2 nM for 1 µM and 10 µM, respectively)
(Figure 5). Xestospongin C (10 µM) significantly reduced the carbachol elevation of
[Ca2+]i in NT and PS1-WT cells to levels approaching basal [Ca2+]i (to 44.1 ± 3.5 nM in
NT and to 50.5 ± 3.0 nM in PS1-WT cells). In PS1-∆E9 cells, xestospongin C gave a
dose-dependent reduction of the carbachol elevation of [Ca2+]i (to 67.1 ± 5.3 nM and to
53.3 ± 3.7 nM respectively for 1 and 10 µM xestospongin C). These reduced levels were
similar to those seen in NT and PS1-WT cells (Figure 5). Both 1 and 10 µM xestospongin
C treatments also abolished the long tail-off effect on [Ca2+]i seen in PS1-∆E9 cells after
carbachol stimulation (Figure 5).
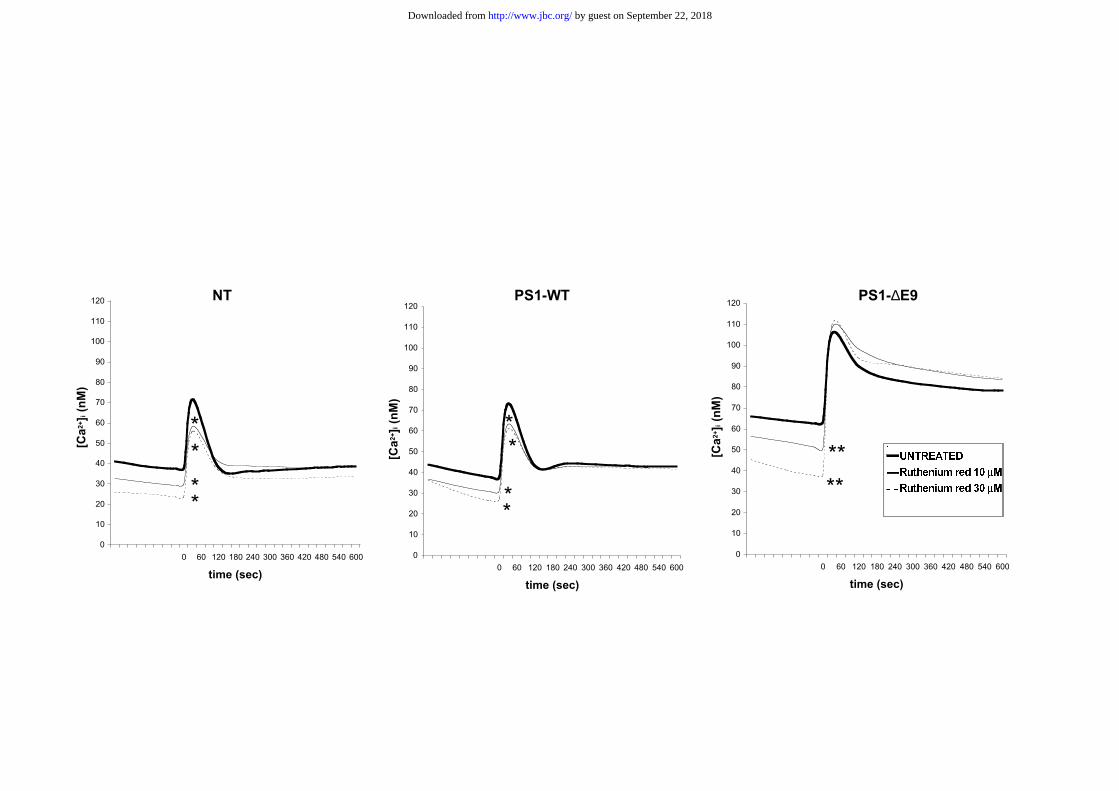
Ruthenium red, a ryanodine receptor and mitochondrial uniporter competitive
antagonist gave a reduction of basal [Ca2+]i in all cell lines in a dose-dependent manner
(to 28.2 ± 2.2 nM, 28.3 ± 1.7 nM and 50.5 ± 3.9 nM in NT, PS1-WT and PS1-∆E9 cells,
respectively, for 10 µM ruthenium red and to 22.9 ± 3.8 nM, 25.1 ± 2.8 nM and 37.3 ±
1.8 nM in NT, PS1-WT and PS1-∆E9 cells, respectively for 30 µM ruthenium red)
(Figure 6). Basal [Ca2+]i in PS1-∆E9 cells remained significantly higher as compared with
both NT and PS1-WT cells (p<0.01; ANOVA, Fisher's post-hoc test) after treatment with
both concentrations of ruthenium red (Figure 6).
by guest on September 22, 2018
http://ww
w.jbc.org/
Dow
nloaded from

1 5
Both ruthenium red concentrations significantly reduced carbachol peak elevations of
[Ca2+]i in NT and PS1-WT cells, but not in PS1-∆E9 cells (Figure 6).
Treatment of the cells with ryanodine (either 1 µM and 10 µM) for 10 min did not
induce significant changes in either basal or carbachol stimulated [Ca2+]i levels in any of
the cell lines (Figure 7).
Combined treatment with 10 µM ryanodine and 30 µM ruthenium red decreased
basal [Ca2+]i in all cell lines to similar levels seen with 30 µM ruthenium red alone (to
27.9 ± 6.4 nM, 26.8 ± 2.7 nM, 44.2 ± 3.1 nM in NT, PS1-WT and PS1-∆E9 cells,
respectively) (Figures 6 and 7). None of the cell lines showed changes in carbachol peak
elevations of [Ca2+]i after 10 µM ryanodine + 30 µM ruthenium red (Figure 7).
Dantrolene, a specific blocker of RyR (31), used at concentrations of 100 nM, 1 µM
and 10 µM did not induce any significant changes of basal [Ca2+]i in NT and PS1-WT
cells (Figure 8). In contrast, in PS1-∆E9 cells both 1 µM and 10 µM dantrolene
significantly reduced basal [Ca2+]i (to 52.7 ± 2.5 nM and 54. 8 ± 2.0 nM respectively).
Basal [Ca2+]i in PS1-∆E9 cells was still significantly higher than that for either NT or
PS1-WT (p<0.01; ANOVA, Fisher's post-hoc test) after treatment with both dantrolene
concentrations (Figure 8). Ten µM dantrolene significantly reduced the carbachol-
induced peak of [Ca2+]i in NT and PS1-WT cells, but not in PS1-∆E9 cells. Dantrolene
treatment of PS1-∆E9 cells abolished the long tail-off effect on [Ca2+]i seen after
carbachol stimulation (Figure 8).
Cyclopiazonic acid (CPA, 10 µM and 30 µM), an ER Ca2+ ATP-ase inhibitor, did not
significantly change basal [Ca2+]i in any of the cell lines, even though a tendency towards
an increase was seen in PS1-∆E9 cells at early time points (Figure 9). CPA treatment did
not affect carbachol elevation of [Ca2+]i in any of the cell lines (Figure 9).
by guest on September 22, 2018
http://ww
w.jbc.org/
Dow
nloaded from
1 6
PLC levels in NT, PS1-WT and PS1-∆E9 cells.
To determine whether the enhanced basal PI hydrolysis seen in PS1-∆E9 cells was
due to increased PLC levels, we investigated the expression of PLC-β1 and PLC-γ
isoenzymes in NT, PS1-WT and PS1-∆E9 cells. PLC-β1 is the β-isoform most widely
expressed in the brain and primary neurons and which is at highest concentrations in brain
areas affected in AD. PLC-γ is also expressed in brain where it is concentrated in
astroglia. In addition to its function in PI hydrolysis, PLC-γ is involved in regulating PI-3
kinase activity and therefore contributes to the regulation of anti-apoptotic pathways (for
review, see 16).
The monoclonal N-terminal PLC-β1 antibody recognised two groups of
inmunoreactive bands at approximately 150 and 100 kDa (Figure 10A). The 150 kDa
molecular weight band represents full length PLC-β1, whereas the 100 kDa band
represents the N-terminal fragment of PLC-β1 after proteolytic cleavage by calpain (32).
Densitometric analysis of the blots showed that 150 kDa full length PLC-β1 was
decreased in PS1-∆E9 cells, as compared with both NT and PS1-WT cells (Figure 10B).
In contrast, both the PS1-WT and PS1-∆E9 cells showed a significantly higher level of
the 100 kDa fragment as compared to NT cells.
The monoclonal PLC-γ antibody recognised one band at approximately 148 kDa. No
differences in PLC-γ expression were seen between NT, PS1-WT and PS1-∆E9 cells
(Figure 10A).
Localization of PS1 in NT, PS1-WT and PS1-∆E9 cells.
PS1 is known to be principally localised in the Golgi apparatus and the endoplasmic
reticulum. Recent reports have shown that PS1 is also localised at the plasma membrane
where it has been shown to form complexes with components of the cadherin-catenin cell
by guest on September 22, 2018
http://ww
w.jbc.org/
Dow
nloaded from

1 7
to cell adhesion system (33, 34, 35). To determine whether PS1 was also found at the
plasma membrane in the cells used in our study, we performed double immunostaining
experiments with anti N-terminal PS1 and anti N-cadherin antibodies and examined cells
with laser scanning confocal microscopy. In agreement with previous reports (34, 35)
confluent cells from both NT as well as PS1-WT and PS1-∆E9 transfected cell lines
showed a granular PS1 immunofluorescence pattern that was strong at sites of cell to cell
contact (Figure 11, first column). As expected, immunoreactivity of N-cadherin, a
component of the cell adhesion system, was found concentrated at the plasma membrane
at sites of cell-cell contact (Figure 11, second column). Two-color immunofluorescence
of PS1 and N-cadherin also showed co-localisation of these proteins at sites of cell to cell
contact (Figure 11, yellow).
by guest on September 22, 2018
http://ww
w.jbc.org/
Dow
nloaded from

1 8
4. Discussion
Mutations in PS1 account for the majority of FAD cases. Either an altered APP
processing leading to a more abundant production of more amyloidogenic forms of Aβ (2,
3, 4) or an increased susceptibility to apoptosis (9, 10) have been described as the putative
mechanisms responsible for the association of PS1 mutations and FAD. The pro-apoptotic
effects of PS1 have been demonstrated to involve disturbances in [Ca2+]i (9, 10).
Cholinergic signalling is one of the major sources of Ca2+ regulation and
redistribution in neuronal cells (for review, see 15) and it is well known to be impaired in
AD (17). In the present paper we investigated the possibility that PS1 mutations could
influence acetylcholine muscarinic receptor-mediated PI hydrolysis and Ca2 +
homeostasis. To this end, we chose to study the PS1-∆E9 mutation, this having been
previously shown by us to give an increased basal [Ca2+]i when transfected into SH-
SY5Y cells (28).
We demonstrated that both basal PI hydrolysis and basal [Ca2+]i were greatly
increased in PS1-∆E9 as compared with both PS1-WT and NT cells. Neomycin, a PLC
inhibitor, was able to reduce both high basal PI hydrolysis and high basal [Ca2+]i in PS1-
∆E9 cells. The high basal [Ca2+]i in PS1-∆E9 cells came down to a level comparable to
those seen in NT and PS1-WT cells following neomycin treatment. This suggests that
high basal [Ca2+]i in PS1-∆E9 cells was due to a high PLC activity and not the opposite
way round. The specific IP3R blocker xestospongin C also reduced basal [Ca2+]i in PS1-
∆E9 cells to the levels of NT and PS1-WT cells. Together this data is consistent with a
mechanism whereby the PS1-∆E9 mutation increases basal PLC activity to raise the
levels of IP3 available to gate Ca2+ release via IP3Rs.
The specific RyR antagonist dantrolene also decreased basal [Ca2+]i only in PS1-∆E9
cells, but not down to a level similar to that for NT and PS1-WT cells. This result
by guest on September 22, 2018
http://ww
w.jbc.org/
Dow
nloaded from
1 9
suggests that a component of the increased basal [Ca2+]i in PS1-∆E9 cells due to
enhanced PLC activity is mediated via RyRs.
Previous studies on Ca2+ regulation in cells containing PS1 mutations have focused
on Ca2+ release from the endoplasmic reticulum. Guo et al (9, 36) showed that PC12 cells
overexpressing the PS1-L286V mutation have greater Ca2+ responses to bradykinin,
carbachol (9) and thapsigargin (36). Also, Chan et al showed enhanced Ca2+ responses to
caffeine both in PC12 cells over expressing the PS1-L286V mutation and in primary
cortical neurons from PS1-M146V knockin mice (37). Neither the L286V or M146V PS1
point mutations were shown to affect basal [Ca2+]i (9, 36, 37). More recently, Leissring
and colleagues showed that the PS1-M146V mutation enhances IP3 mediated Ca2+
signalling in Xenopus oocytes (20, 21, 22).
The mechanism by which the PS1-∆E9 mutation increases basal PI hydrolysis is
currently unclear. PS1 is enriched in the Golgi apparatus and endoplasmic reticulum (38).
We show here that PS1 is also present at the plasma membrane, where it colocalised with
N-cadherin, a component of the cell-cell adhesion system. This is in agreement with
previous reports (33, 34, 35), where cell surface PS1 has been suggested to regulate cell-
cell adhesion and synaptic contacts (35). Others have shown that PS1 can stabilise
cadherin-catenin complexes to stimulate Ca2+ dependent cell to cell adhesion (39).
However, PS1-∆E9 mutants failed to stabilise cadherin-catenin complexes and stimulate
cell-cell adhesion (39). Interestingly, the γ isoform of PLC can be activated by integrins
(40, 41), another component of the cell to cell adhesion complex, and integrin functions
in cell adhesion and signalling have been shown to be regulated by the Ca2+ dependent
enzyme calpain (42, 43). We showed that, compared to NT and PS1-WT cells, the PS1-
∆E9 transfectants gave a relative increase in levels of the calpain generated N-terminal
fragment (100 kDa) over full length (150 kDa) PLC-β1. Both full length PLC-β1 and N-
by guest on September 22, 2018
http://ww
w.jbc.org/
Dow
nloaded from

2 0
terminal fragment have been shown to possess catalytic activity in purified enzyme
preparations (32). However, it is currently unknown as to which of these contributes most
to cellular PI hydrolysis. The C-terminal region of PLC-β1 is responsible for the
membrane association of the enzyme (44) with the 150 kDa full length protein being
present in the particulate fraction. In contrast, the 100 kDa protein is mainly cytosolic
(45) and is more active but also less stable than full length PLC-β1 (32). From such data
it is tempting to speculate that the enhanced basal PI hydrolysis seen in PS1-∆E9 cells
occurs due to a mutation related disruption of the cell adhesion complex resulting in
dysregulated PLC.
The PS1-∆E9 cells treated with carbachol gave [Ca2+]i responses that were relatively
increased as compared to NT and PS1-WT cells. Carbachol stimulated [Ca2+]i responses
in PS1-∆E9 cells also had a long tail-off effect, even after treatment with the PLC
inhibitor neomycin. This would suggest that in addition to the effect on PLC activity the
PS1-∆E9 mutation also affects some other downstream process of Ca2+ signal
amplification. One mechanism could be that the ability of Ca2+ itself to induce Ca2+
release through IP3R or RyR is higher in PS1-∆E9 cells. Both IP3R and RyR have been
described in SH-SY5Y neuroblastoma cells (46). A recent report has shown that PC12
cells transfected with the L286V or M146V PS1 mutations and cortical neurons from
PS1-M146V knock-in mouse have increased levels of type 3 RyR (37). We showed that
the specific IP3R blocker xestospongin C decreased the carbachol stimulated [Ca2+]i in all
cell types to similar levels and also abolished the long tail-off effect seen in PS1-∆E9
cells. The carbachol induced long tail-off effect on [Ca2+]i found in PS1-∆E9 cells was
also reduced by dantrolene treatments. Therefore, the long tail-off effect seen following
carbachol stimulation of [Ca2+]i in PS1-∆E9 cells likely occurred due to Ca2+ signal
amplification via IP3R and RyR. This effect was not seen with the less specific RyR and
by guest on September 22, 2018
http://ww
w.jbc.org/
Dow
nloaded from

2 1
mitochondrial uniporter competitive antagonist ruthenium red. Interestingly, both
dantrolene (10 µM) and ruthenium red (10 and 30 µM) only reduced carbachol peak
elevations of [Ca2+]i in NT and PS1-WT cells but not in PS1-∆E9 cells. Since no
consistent changes of basal [Ca2+]i were seen with the CPA treatment, it is suggested that
the ER Ca2+ ATP-ase is not involved in the mechanism of action of the PS1-∆E9
mutation.
We previously reported that PS1-∆E9 cells show higher [Ca2+]i than PS1-WT cells
not only under basal conditions but also during and after exposure to the Ca2+ ionophore
A23187, suggesting that PS1-∆E9 also alters Ca2+ buffering when facing high [Ca2+]i
(28). The PS1-∆E9 mutation has also been shown to suppress capacitative Ca2+ entry
(CCE) in SH-SY5Y cells following depletion of acetylcholine muscarinic receptor
coupled intracellular Ca2+ stores (47). A suppression of CCE has also been reported in
SH-SY5Y and CHO cells transfected with the PS1-M146L mutation where it was also
shown that this mutation increased IP3 mediated Ca2+ release from the ER (48).
Leissring and co-workers (20, 21, 22) reported that Xenopus oocytes carrying the
PS1-M146V mutation show a greater IP3 mediated Ca2+ release than cells carrying PS1-
WT. In addition, they showed that the Ca2+ binding protein calsenilin decreased IP3
mediated Ca2+ release in both PS1-WT and PS1-M146V transfected cells to the same
level (49). The fact that calsenilin has been demonstrated to bind the C-terminus of PS
(50) suggests that this region may mediate PS1 effects on [Ca2+]i. In our model, we used
the PS1-∆E9 mutation that lacks the cleavage site for physiological proteolytic processing
of PS1 (51). Therefore, the effects that we observed on [Ca2+]i are likely mediated by
mechanisms not involving the C-terminal fragment of PS1. The idea that the PS1-∆E9
mutation has cellular effects distinct from those of other FAD PS1 mutations is supported
indirectly by data showing that the brains of Alzheimer’s disease cases due to the PS1-
by guest on September 22, 2018
http://ww
w.jbc.org/
Dow
nloaded from

2 2
∆E9 mutation show unique amyloid plaque pathology with few neuritic changes and little
glial cell activation (52).
In summary, the present study examined a variety of potential cellular mechanisms
by which the FAD linked PS1-∆E9 mutation could alter Ca2+ signalling under basal
conditions and following acetylcholine muscarinic receptor stimulation. We demonstrated
that PS1-∆E9 cells have an enhanced basal PLC activity that leads to increased basal
[Ca2+]i. Enhanced basal PLC activity leading to a higher [Ca2+]i may be a mechanism by
which the PS1-∆E9 mutation sensitises cells to apoptotic stimuli (24, 28) and enhanced
Aβ generation (53). In addition and in agreement with previous reports, our results also
suggest that IP3R- and RyR-mediated Ca2+ amplification is disturbed by PS1 mutations.
by guest on September 22, 2018
http://ww
w.jbc.org/
Dow
nloaded from

2 3
Acknowledgements
This research was supported by grants from Alzheimerfonden, Åke Wiberg and
Gamla Tjänarinnor foundations, the World Bank and Romanian Government (CNCSIS-
C253/2000).
by guest on September 22, 2018
http://ww
w.jbc.org/
Dow
nloaded from

2 4
References
[1]. Hardy, J. (1997) Trends Neurosci. 20, 154-9.
[2]. Scheuner, D., Eckman, C., Jensen, M., Song, X. M., Citron, M., Suzuki, N., Bird, T.
D., Hardy, J., Hutton, M., Kukull, W., Larson, E., Levy-Lahad, E., Viitanen, M.,
Peskind, E., Poorkaj, P., Schellenberg, G., Tanzi, R., Wasco, W., Lannfelt, L., Selkoe,
D. and Younkin S. (1996) Nat. Med. 2, 864–870.
[3]. Borchelt, D. R., Thinakaran, G., Eckman, C. B., Lee, M. K., Davenport, F.,
Ratovitsky, T., Prada, C.-H., Kim, G., Seekins, S., Yager, D., Slunt, H. H., Wang, R.,
Seeger, M., Levey, A. I., Gandy, S. E., Copeland, N. G., Jenkins, N. A., Price, D. L.,
Younkin, S. G. and Sisodia, S. S. (1996) Neuron 17, 1005–1013.
[4]. Duff, K., Eckman, C., Zehr, C., Yu, X., Prada, C.-M., Perez-Tur, J., Hutton, M., Buee,
L., Harigaya, Y., Yager, D., Morgan, D., Gordon, M. N., Holcomb, L., Refolo, L.,
Zenk, B., Hardy, J. and Younkin, S. (1996) Nature 383, 710–713.
[5]. Murphy, M. P., Uljon, S. N., Fraser, P. E., Fauq, A., Lookingbill, H. A., Findlay, K.
A., Smith, T. E., Lewis, P. A., McLendon, D. C., Wang, R. and Golde, T. E. (2000) J.
Biol. Chem. 275, 26277-84.
[6]. Zhang, Z., Nadeau, P., Song, W., Donoviel, D., Yuan, M., Bernstein, A. and Yankner,
B.A. (2000) Nat. Cell. Biol. 2, 463-5.
[7]. Esler, W. P., Kimberly, W. T., Ostaszewski, B. L., Diehl, T. S., Moore, C. L., Tsai, J.
Y., Rahmati, T., Xia, W., Selkoe, D. J. and Wolfe, M. S. (2000) Nat. Cell. Biol. 2, 428-
34.
[8]. Wolfe, M. S., Xia, W., Ostaszewski, B. L., Diehl, T. S., Kimberly, W. T. and Selkoe,
D. J. (1999) Nature 398, 513-7.
[9]. Guo, Q., Sopher, B. L., Furukawa, K., Pham, D. G., Robinson, N., Martin, G. M. and
Mattson, M. P. (1997) J. Neurosci. 17, 4212–4222.
[10]. Guo, Q., Fu, W., Sopher, B. L., Miller, M. W., Ware, C. B., Martin, G. M. and
Mattson, M. P. (1999) Nat. Med. 5, 101–106.
by guest on September 22, 2018
http://ww
w.jbc.org/
Dow
nloaded from

2 5
[11]. Ito, E., Oka, K., Etcheberrigaray, R., Nelson, T. J., McPhie, D. L., Tofel-Grehl, B.,
Gibson, G. E. and Alkon, D. L. (1994) Proc. Natl. Acad. Sci. U. S. A. 91, 534-8.
[12]. Peterson, C., Ratan, R. R., Shelanski, M. L. and Goldman, J.E. (1986) Proc. Natl.
Acad. Sci. U. S. A. 83, 7999-8001.
[13]. Querfurth, H. W., Jiang, J., Geiger, J. D. and Selkoe, D. J. (1997) J. Neurochem. 69,
1580-1591.
[14]. Mattson, M. P., Engle, M. G. and Rychlik, B. (1991) Mol. Chem. Neuropathol. 15,
117-42.
[15]. Berridge, M. J. (1998) Neuron 21, 13–26.
[16]. Rebecchi, M. J., and Pentyala, S. N. (2000) C. Physiol. Rev. 80, 1291-335 (2000).
[17]. Jope, R. S., Song, L., and Powers, R. E. (1997) Neurobiol. Aging 18, 111-120.
[18]. Kelly, J. F., Furukawa, K., Barger, S. W., Rengen, M. R., Mark, R. J., Blanc, E. M.
and Roth, G. S. (1996) Proc. Natl. Acad. Sci. U. S. A. 93, 6753-8.
[19]. Cedazo-Minguez, A. and Cowburn, R. F. (2001) FEBS Lett. 504, 45-9.
[20]. Leissring, M. A., Paul, B. A., Parker, I., Cotman, C. W. and LaFerla, F. M. (1999) J.
Neurochem. 72, 1061–1068.
[21]. Leissring, M. A., Akbari, Y., Fanger, C. M., Cahalan, M. D., Mattson, M. P. and
LaFerla, F. M. (2000) J. Cell. Biol. 149, 793–798.
[22]. Leissring, M.A., LaFerla, F. M., Callamaras N. and Parker, I. (2001) Neurobiol. Dis. 8,
469-78.
[23]. Moerman, A. M. and Barger, S. W. (1999) J. Neurosci. Res. 157, 962-7.
[24]. Fisher, S. K. (1995) Eur. J. Pharmacol. 288, 231-50.
[25]. Tanii, H., Ankarcrona, M., Flood, F., Nilsberth, C., Mehta, N. D., Perez-Tur, J.,
Winblad, B., Benedikz, E. and Cowburn, R.F. (2000) Neuroscience 95, 593-601.
[26]. Berridge, M. J. (1982) Cell Calcium 3, 385-97.
by guest on September 22, 2018
http://ww
w.jbc.org/
Dow
nloaded from

2 6
[27]. Fowler, C. J, Court, J. A, Tiger, G., Bjorklund, P. E. and Candy, J. M. (1987)
Pharmacol. Toxicol. 60, 274-9.
[28]. Popescu, B. O., Cedazo-Minguez, A., Popescu, L. M., Winblad, B., Cowburn, R. F.
and Ankarcrona, M. (2001) J. Neurosci. Res. 66, 122-34.
[29]. Schacht, J. (1976) J. Acoust. Soc. Am. 59, 940-4.
[30]. Gafni, J., Munsch, J. A., Lam, T. H., Catlin, M. C., Costa, L. G., Molinski, T. F. and
Pessah, I. N. (1997) Neuron 19, 723-33.
[31]. Zhao, F., Li, P., Chen, S. R., Louis, C. F. and Fruen, B. R. (2001) J. Biol. Chem. 276,
13810-6.
[32]. Park, D., Jhon, D. Y., Lee, C. W., Lee, K. H. and Rhee, S. G. (1993) J. Biol. Chem.
268, 4573-6.
[33]. Beher, D., Elle, C., Underwood, J., Davis, J.B., Ward, R., karrane, E., Masters, C.L.,
Beyreuther, K. and Multhaup, G. (1999) J. Neurochem. 72, 1564-1573.
[34]. Schwarzman, A.L., Singh, N., Tsiper, M., Gregori, L. Dranovsky, A., Vitek, M.P.,
glabe, C.G., St George-Hyslop, P.H. and Goldgaber, D. (1999) Proc. Natl. Acad. Sci.
U.S.A. 96, 7932-7937.
[35]. Georgakopolous, A., Marambaud, P., Efthimiopoulos, S., Shioi, J., Cui, W., Li, H-C.,
Schütte, M., Gordon, R., Holstein, G.R., Martinelli, G., Mehta, P., Friedrich, Jr, V.L
and Robakis, N.K. (1999) Mol. Cell 4, 893-902.
[36]. Guo, Q., Furukawa, K., Sopher, B. L., Pham, D. G., Xie, J., Robinson, N., Martin, G.
M., and Mattson, M. P. (1996) Neuroreport 8, 379–383.
[37]. Chan, S. L., Mayne, M, Holden, C. P. Geiger, J. D. and Mattson, M. P. (2000) J. Biol.
Chem. 275, 18195-18200.
[38]. Kovacs, D. M., Fausett, H. J., Page, K. J., Kim, T. W., Moir, R. D., Merriam, D. E.,
Hollister, R. D., Hallmark, O. G., Mancini, R., Felsenstein, K. M., Hyman, B. T.,
Tanzi, R. E. and Wasco, W. (1996) Nat. Med. 2, 224-9.
by guest on September 22, 2018
http://ww
w.jbc.org/
Dow
nloaded from

2 7
[39]. Baki, L., Marambaud, P., Efthimiopoulos, S., Georgakopoulos, A., Wen, P., Cui, W.,
Shioi, J., Koo, E., Ozawa, M., Friedrich, V. L. Jr. and Robakis, N. K. (2001) Proc.
Natl. Acad. Sci. U. S. A.. 98, 2381-6.
[40]. Wrenn, R. W., Creazzo, T. L. and Herman, L. E. (1996) Biochem. Biophys. Res.
Commun. 226, 876-82.
[41]. Vossmeyer, D., Hofmann, W., Loster, K., Reutter, W. and Danker, K. (2002) J. Biol.
Chem. 277, 4636-43.
[42]. Leitinger, B., McDowall, A., Stanley, P. and Hogg, N. (2000) Biochim. Biophys. Acta
1498, 91-98.
[43]. Sato, K. and Kawashima, S. (2001) Biol. Chem. 382, 743-751.
[44]. Kim, C. G., Park D. and Rhee, S. G. (1996) J. Biol. Chem. 271, 21187-92.
[45]. Kolasa, K., Parsons, D. S., Harrell, L. E. (2000) Neuroscience 99, 25-31
[46]. Mackrill, J. J., Challiss, R. A., O'connell, D. A., Lai, F. A. and Nahorski, S. R. (1997)
Biochem. J. 327, 251-8.
[47]. Smith, I. F., Boyle, J. P., Vaughan, P. F. T., Pearson, H.A., Cowburn, R. F. and Peers,
C. S. (2002) Brain Res. In press.
[48]. Yoo, A. S., Cheng, I., Chung, S., Grenfell, T. Z., Lee, H., Pack-Chung, E., Handler,
M., Shen, J., Xia, W., Tesco, G., Saunders, A. J., Ding, K., Frosch, M. P., Tanzi, R. E.
and Kim, T. W. (2000) Neuron 27, 561-72.
[49]. Leissring, M. A., Yamasaki, T. R., Wasco, W., Buxbaum, J. D.,Parker, I., and LaFerla,
F. M. (2000) Proc. Natl. Acad. Sci.U. S. A. 97, 8590–8593.
[50]. Buxbaum, J. D., Choi, E. K., Luo, Y., Lilliehook, C., Crowley, A. C., Merriam, D. E.
and Wasco, W. (1998) Nat. Med. 4, 1177–1181.
[51]. Thinakaran, G., Borchelt, D.R., Lee, M.K., Slunt, H.H., Spitzer, L., Kim, G.,
Ratovitsky, T., Davenport, F., Nordstedt, C., Seeger, M., Hardy, J., Levey, A.I.,
by guest on September 22, 2018
http://ww
w.jbc.org/
Dow
nloaded from

2 8
Gandy, S.E., Jenkins, N.A., Copeland, N.G., Price, D.L. and Sisodia, S.S. (1996)
Neuron 17, 181-190.
[52]. Mann, D.M., Takeuchi, A., Sato, S., Cairns, N.J., Lantos, P.L., Rossor, M.N., Haltia,
M., Kalimo, H. and Iwatsubo, T. (2001) Neuropathol. Appl. Neurobiol. 27, 189-96
[53]. Mehta, N.D., Refolo, L.M., Eckman, C., Sanders, S., Yager, D., Perez-Tur, J.,
Younkin, S., Duff, K., Hardy, J. and Hutton, M. (1998) Ann. Neurol. 43, 256-8.
by guest on September 22, 2018
http://ww
w.jbc.org/
Dow
nloaded from

2 9
FIGURE LEGENDS.
FIGURE 1.
Presenilin 1 expression in control and transfected cell lines.
Immunoblotting of PS1 expression in non-transfected (NT), PS1 wild type (PS1-WT
clones 1-1 and 1-14) , and PS1 exon 9 deletion mutation (PS1-∆E9 clones 1-2 and 2-4)
stably transfected human SH-SY5Y neuroblastoma cells.
by guest on September 22, 2018
http://ww
w.jbc.org/
Dow
nloaded from

3 0
FIGURE 2
Effects of the PS1-∆E9 mutation on basal and carbachol-stimulated PI hydrolysis.
Histograms show means ± SEM of at least 8 independent experiments. Data is given
for two PS1-WT clones (1-1 and 1-14) and two PS1-∆E9 clones (1-2 and 2-4). Figure 2A
shows basal and carbachol (100 µM)-stimulated PI hydrolysis. Figure 2B shows the
differences (Carbachol-stimulated minus Basal). Statistical analysis of the results was
carried out using ANOVA followed by Fisher’s post-hoc test. ***, p<0.001 as compared
with values for NT cells. #, p<0.05; ###, p<0.001 as compared with PS1-WT cells.
by guest on September 22, 2018
http://ww
w.jbc.org/
Dow
nloaded from

3 1
FIGURE 3
Effects of the PS1-∆E9 mutation on basal and carbachol-stimulated intracellular
Ca2+ concentrations.
Basal [Ca2+]i was measured repeatedly during 15 minutes to certify that a steady state
of Fluo-3 loading was obtained. The graph shows [Ca2+]i measurements 4 min prior to
addition of carbachol (100 µM) (time 0). Basal [Ca2+]i levels were significantly higher in
both clones of PS1-∆E9 cells (1-2 and 2-4) as compared to both NT (***:p<0,001;
ANOVA, Fisher's post hoc) and both clones of PS1-WT cells (1-1 and 1-14) (###:p<0,001;
ANOVA, Fisher's post hoc). After treatment with 100 µM carbachol, peak elevations of
[Ca2+]i were found after approximately 30 sec. Peak [Ca2+]i was significantly higher in
PS1-∆E9 cells as compared with NT (***:p<0,001; ANOVA, Fisher's post hoc) and PS1-
WT (###:p<0,001; ANOVA, Fisher's post hoc) cells. In NT and PS1-WT cells [Ca2+]i
returned to basal levels after approximately 120 seconds following addition of carbachol.
In contrast, a long tail-off effect was found in PS1-∆E9 cells. Data are expressed as
means of 14 independent experiments. The value from each experiment is the mean of
measurements from 6 cell wells.
by guest on September 22, 2018
http://ww
w.jbc.org/
Dow
nloaded from

3 2
FIGURE 4
Neomycin reverses basal PI hydrolysis and intracellular Ca2+ levels in PS1-∆E9 cells
to those of NT and PS1-WT cells.
Figure 4A: Pre-treatment (3 h) with 500 µM neomycin drastically reduced both basal
and carbachol (100 µM)-stimulated PI hydrolysis in NT, PS1-WT (clone 1-1) and PS1-
∆E9 cells (clone 1-2). Histograms show means ± SEM of 3 independent experiments.
Statistical analysis of the results was carried out using ANOVA followed by Fisher’s
post-hoc test. *, p<0.05; ***, p<0.001 as compared with NT cells. #, p<0.05; ###, p<0.001
compared with PS1-WT cells.
Figure 4B: Pretreatment for 10 minutes with neomycin (100 and 500 µM) did not
affect basal [Ca2+]i levels in either NT or PS1-WT cells. In contrast, in PS1-∆E9 cells,
both neomycin concentrations significantly reduced basal [Ca2+]i to levels comparable to
those seen in NT and PS1-WT cells. Neomycin treatment also significantly reduced the
carbachol elevation of [Ca2+]i in all cell types (*: p<0.05; ANOVA, Fisher's post-hoc
test), but the neomycin (both 100 µM and 500 µM) reduction of carbachol stimulated
[Ca2+]i seen in PS1-∆E9 cells did not come down to the same level as for either NT.
(p<0.05; ANOVA, Fisher's post-hoc test) or PS1-WT cells (p<0.01; ANOVA, Fisher's
post-hoc test for comparison to untreated cells). Data are expressed as means of at least 4
independent experiments. The value from each experiment is the mean of measurements
from 6 cell wells.
by guest on September 22, 2018
http://ww
w.jbc.org/
Dow
nloaded from

3 3
FIGURE 5
Xestospongin C reduces PS1-∆E9 mutation-related increase in basal and carbachol
intracellular Ca2+ to similar levels seen in NT, PS1-WT cells.
Xestospongin C (1 µM and 10 µM) reduced basal and carbachol stimulated [Ca2+]i in
PS1-∆E9 cells (clone 1-2) to similar levels at those seen in both NT and PS1-WT cells
(clone 1-1). Xestospongin C (10 µM) also significantly reduced carbachol peak elevations
of [Ca2+]i in NT and PS1-WT cells (clone 1-1). Significances are shown for comparisons
with untreated cells (*: p<0.05; ***: p<0.001; ANOVA, Fisher's post-hoc test). Data are
expressed as means of at least 3 independent experiments. The value from each
experiment is the mean of measurements from 6 cell wells.
by guest on September 22, 2018
http://ww
w.jbc.org/
Dow
nloaded from

3 4
FIGURE 6
Effects of rutheniun red on basal and carbachol increased intracellular Ca2+ levels in
NT, PS1-WT and PS1-∆E9 cells.
Ruthenium red (10 µM and 30 µM) reduced basal [Ca2+]i levels in all cell lines (*:
p<0.05; ***: p<0.001; ANOVA, Fisher's post-hoc test for comparisons with untreated
cells). Basal [Ca2+]i in PS1-∆E9 cells (clone 1-2) was significantly higher as compared
with both NT and PS1-WT (clone 1-1) (p<0.01; ANOVA, Fisher's post-hoc test) even
after treatment with both concentrations of ruthenium red. Both ruthenium red
concentrations significantly reduced carbachol peak elevations of [Ca2+]i in NT and PS1-
WT cells (clone 1-1) (*: p<0.05; ANOVA, Fisher's post-hoc test) but not in PS1-∆E9
cells (clone 1-2). Data are expressed as means of at least 4 independent experiments. The
value from each experiment is the mean of measurements from 6 cell wells.
by guest on September 22, 2018
http://ww
w.jbc.org/
Dow
nloaded from

3 5
FIGURE 7
Effects of ryanodine and ryanodine plus ruthenium red on basal and carbachol
increased intracellular Ca2+ levels in NT, PS1-WT and PS1-∆E9 cells.
Ryanodine (1 µM and 10 µM) treatment for 10 minutes did not induce significant
changes in either basal or carbachol stimulated [Ca2+]i in either NT, PS1-WT (clone 1-1)
or PS1-∆E9 cells (clone 1-2). Combined treatment with 10 µM ryanodine and 30 µM
ruthenium red decreased basal [Ca2+]i levels in all cell lines to similar levels seen with 30
µM ruthenium red alone. None of the cell lines showed changes in carbachol peak
elevations of [Ca2+]i after 10 µM ryanodine + 30 µM ruthenium red. Data are expressed as
means of at least 4 independent experiments. The value from each experiment is the mean
of measurements from 6 cell wells. *, p<0.05; **: p<0.01; ANOVA, Fisher's post-hoc
test for comparisons with untreated cells.
by guest on September 22, 2018
http://ww
w.jbc.org/
Dow
nloaded from
3 6
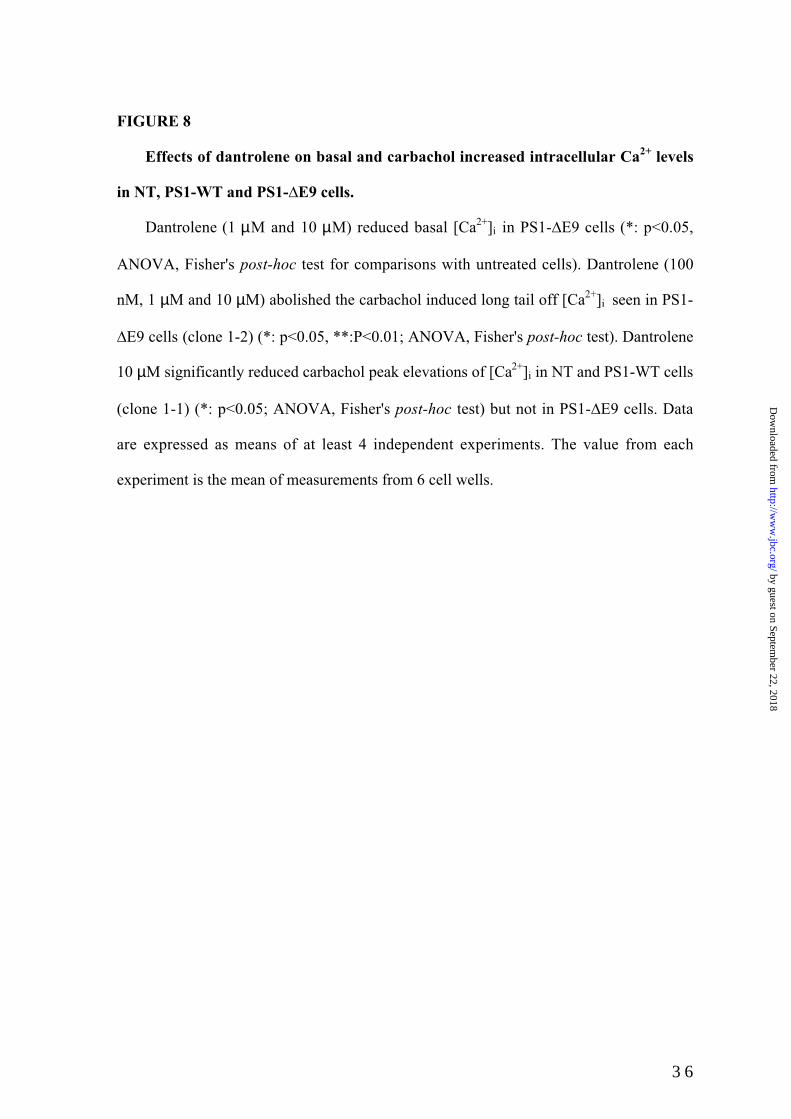
FIGURE 8
Effects of dantrolene on basal and carbachol increased intracellular Ca2+ levels
in NT, PS1-WT and PS1-∆E9 cells.
Dantrolene (1 µM and 10 µM) reduced basal [Ca2+]i in PS1-∆E9 cells (*: p<0.05,
ANOVA, Fisher's post-hoc test for comparisons with untreated cells). Dantrolene (100
nM, 1 µM and 10 µM) abolished the carbachol induced long tail off [Ca2+]i seen in PS1-
∆E9 cells (clone 1-2) (*: p<0.05, **:P<0.01; ANOVA, Fisher's post-hoc test). Dantrolene
10 µM significantly reduced carbachol peak elevations of [Ca2+]i in NT and PS1-WT cells
(clone 1-1) (*: p<0.05; ANOVA, Fisher's post-hoc test) but not in PS1-∆E9 cells. Data
are expressed as means of at least 4 independent experiments. The value from each
experiment is the mean of measurements from 6 cell wells.
by guest on September 22, 2018
http://ww
w.jbc.org/
Dow
nloaded from

3 7
FIGURE 9
Lack of effects of CPA on basal and carbachol increased intracellular Ca2+ levels in
NT, PS1-WT and PS1-∆E9 cells.
Cyclopiazonic acid (CPA, 10 µM and 30 µM), did not induce any significant change
of either basal [Ca2+]i or carbachol elevation of [Ca2+]i in any of the cell lines. Data are
expressed as means of at least 4 independent experiments. The value from each
experiment is the mean of measurements from 6 cell wells.
by guest on September 22, 2018
http://ww
w.jbc.org/
Dow
nloaded from

3 8
FIGURE 10
PLC levels in NT, PS1-WT and PS1-∆E9 cells
Figure 10A shows an immunoblot for PLC-β1 and PLC γ expression in NT, PS1-WT
(clone 1-1), and PS1-∆E9 cells (clone 1-2). The monoclonal N-terminal PLC-β1 antibody
recognised two inmunoreactive bands at approximately 150 and 100 kDa. Densitometric
analyses of the bands obtained for 3 separate blots of PLC-β1 (means ± SEM) are shown
in Figure 10B. Statistical analysis of the results was carried out using ANOVA followed
by Fisher’s post-hoc test. *, p<0.05 and ***, p<0.001 as compared with values for NT
cells. ###, p<0.001 as compared to PS1-WT cells.
by guest on September 22, 2018
http://ww
w.jbc.org/
Dow
nloaded from

3 9
FIGURE 11
Localisation of PS1 in the plasma membrane in complex with N-cadherin.
Confocal micrographs of NT, PS1-WT (clone 1-1) and PS1-∆E9 cells (clone 1-2)
double stained with anti N-terminal PS1 and anti-N-cadherin antibodies. PS1
immunofluorescence showed a cytosolic granular pattern that was also strong at sites of
cell to cell contact (red). N-cadherin, immunofluorescence was concentrated at the plasma
membrane (green). Superimposed images showed co-localization of both PS1 and N-
cadherin at the level of the plasma membrane (yellow). A: NT (bar = 11.3 µm); B: PS1-
WT (bar = 11.3 µm); C: PS1-∆E9 (bar = 11.3 µm); D: PS1-∆E9 (bar = 43.6 µm)
by guest on September 22, 2018
http://ww
w.jbc.org/
Dow
nloaded from

50 kDa
30 kDa
PS1-WT PS1- E9 (1-1) (1-14) (1-2) (2-4)
Figure 1
NT ∆
by guest on September 22, 2018
http://ww
w.jbc.org/
Dow
nloaded from
0
0.025
0.05
0.075
0.1
NT PS1-WT (1-1)
PS1-WT (1-14)
PS1- (1-2)
E9
Carbachol
Basal
D E9
#
***###
0
0.005
0.01
0.015
0.02
0.025
NT PS1-WT (1-1)
PS1-WT (1-14)
E9 (1-2)
E9 (2-4)
Carbachol - basal
PS1-D
IPs
/ (IP
s+I
lipid
)
D
PS1-D
***###
*#
IPs
/ (IP
s+I
lipid
)
Figure 2
A
B
PS1- (2-4)
∆∆
∆ ∆
by guest on September 22, 2018
http://ww
w.jbc.org/
Dow
nloaded from

0
10
20
30
40
50
60
70
80
90
100
110
120
130
140
150
0 60 120 180 240 300 360 420 480 540 600
time (sec)
[Ca2+
] i (n
M)
PS1-∆E9 (2-4)
NTPS1-WT (1-1)
***### ***
###***###
***###
***### ***
###***###
***###
PS1-∆E9 (1-2)
PS1-WT (1-14)
by guest on September 22, 2018
http://ww
w.jbc.org/
Dow
nloaded from

0
0.01
0.02
0.03
0.04
0.05
0.06
NT NT +
Neomycin
PS1-WT PS1-WT+
Neomycin
PS1-D E9 PS1-D E9+
Neomycin
Carbachol
Basal
***###
*#
IPs
/ (IP
s+I
lipid
)
∆∆
3 5
by guest on September 22, 2018
http://ww
w.jbc.org/
Dow
nloaded from

0
10
20
30
40
50
60
70
80
90
100
110
120
0 60 120 180 240 300 360 420 480 540 600
time (sec)
[Ca2
+]i
(nM
)
*
0
10
20
30
40
50
60
70
80
90
100
110
120
0 60 120 180 240 300 360 420 480 540 600
time (sec)
[Ca2
+]i
(nM
)
**
* ****
*********
0
10
20
30
40
50
60
70
80
90
100
110
120
0 60 120 180 240 300 360 420 480 540 600
time (sec)
[Ca2
+]i
(nM
)
*
PS1-WTNT PS1-∆E9
by guest on September 22, 2018http://www.jbc.org/Downloaded from
0
10
20
30
40
50
60
70
80
90
100
110
120
0 60 120 180 240 300 360 420 480 540 600
time (sec)
[Ca2
+]i
(nM
)
**
**
0
10
20
30
40
50
60
70
80
90
100
110
120
0 60 120 180 240 300 360 420 480 540 600
time (sec)
[Ca2
+]i
(nM
)
**
**
0
10
20
30
40
50
60
70
80
90
100
110
120
0 60 120 180 240 300 360 420 480 540 600
time (sec)
[Ca2
+]i
(nM
)
**
**
NT PS1-WT PS1-∆E9
by guest on September 22, 2018http://www.jbc.org/Downloaded from

0
10
20
30
40
50
60
70
80
90
100
110
120
0 60 120 180 240 300 360 420 480 540 600
time (sec)
[Ca2
+ ]i (
nM
)
*
0
10
20
30
40
50
60
70
80
90
100
110
120
0 60 120 180 240 300 360 420 480 540 600
time (sec)
[Ca2
+ ]i (
nM
)
**
0
10
20
30
40
50
60
70
80
90
100
110
120
0 60 120 180 240 300 360 420 480 540 600
time (sec)
[Ca2
+ ]i (
nM
)
*
PS1-WTNT PS1-∆E9
by guest on September 22, 2018http://www.jbc.org/Downloaded from

0
10
20
30
40
50
60
70
80
90
100
110
120
0 60 120 180 240 300 360 420 480 540 600
time (sec)
[Ca2
+]i
(nM
)
*
0
10
20
30
40
50
60
70
80
90
100
110
120
0 60 120 180 240 300 360 420 480 540 600
time (sec)
[Ca2
+]i
(nM
)
*
* *
*
*
* * *
0
10
20
30
40
50
60
70
80
90
100
110
120
0 60 120 180 240 300 360 420 480 540 600
time (sec)
[Ca2
+]i
(nM
)
*
PS1-WTNT PS1-∆E9
*****
by guest on September 22, 2018http://www.jbc.org/Downloaded from

0
10
20
30
40
50
60
70
80
90
100
110
120
0 60 120 180 240 300 360 420 480 540 600
time (sec)
[Ca2
+]i
(nM
)
0
10
20
30
40
50
60
70
80
90
100
110
120
0 60 120 180 240 300 360 420 480 540 600
time (sec)
[Ca2
+]i
(nM
)
0
10
20
30
40
50
60
70
80
90
100
110
120
0 60 120 180 240 300 360 420 480 540 600
time (sec)
[Ca2
+]i
(nM
)
NT PS1-WT PS1-∆E9
by guest on September 22, 2018http://www.jbc.org/Downloaded from

NT NT PS1- PS1- PS1- PS1- WT D E9 WT D E9
150
100
PLC- 1 PLC-
0
1
2
3
4
5
O.D
NT PS1-WT PS1 -DE9
100 kDa
150 kDa
***###
* ***
A
B
Figure 10
b g
by guest on September 22, 2018
http://ww
w.jbc.org/
Dow
nloaded from
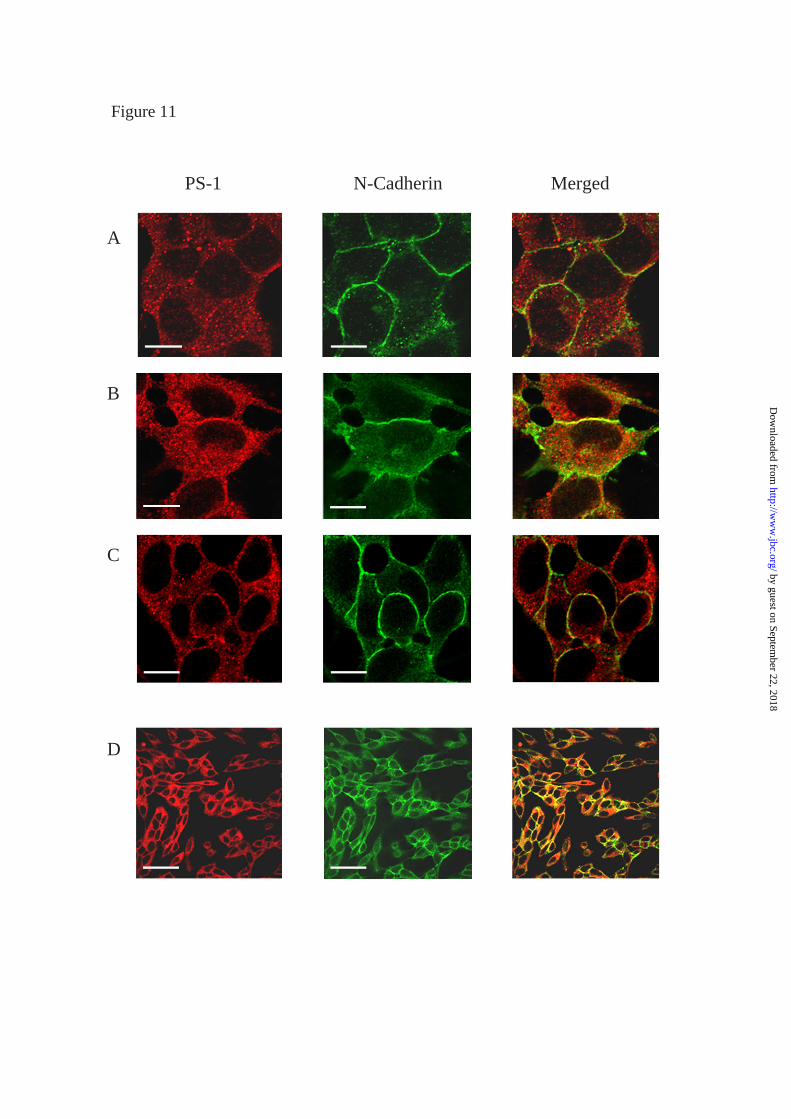
Figure 11
A
B
C
D
PS-1 N-Cadherin Merged
by guest on September 22, 2018
http://ww
w.jbc.org/
Dow
nloaded from

and Richard F. CowburnAngel Cedazo-Minguez, Bogdan O. Popescu, Maria Ankarcrona, Takeshi Nishimura
activity and a resultant increase in intracellular calcium concentrationsThe presenilin 1 {capital delta}E9 mutation gives enhanced basal phospholipase C
published online July 16, 2002J. Biol. Chem.
10.1074/jbc.M112117200Access the most updated version of this article at doi:
Alerts:
When a correction for this article is posted•
When this article is cited•
to choose from all of JBC's e-mail alertsClick here
by guest on September 22, 2018
http://ww
w.jbc.org/
Dow
nloaded from