the preparatory survey on north lima …open_jicareport.jica.go.jp/pdf/12047429_01.pdf · 3.2...
TRANSCRIPT

CR(3)GED
11-161
Republic of Peru Servicio de Agua Potable y Alcantarillado de Lima
THE PREPARATORY SURVEY ONNORTH LIMA METROPOLITAN
AREA WATER SUPPLY ANDSEWERAGE OPTIMIZATION
PROJECT (II)
FINAL REPORT
September 2011
JAPAN INTERNATIONAL COOPERATIONAGENCY
NIPPON KOEI CO., LTDNIPPON KOEI LATIN-AMERICA and the
CARIBBEAN CO., LTD

Exchange Rate (June, 2010) USD 1.00 = JPY 91.10 PEN 1.00 = JPY 32.383 USD 1.00 = PEN 2.838 JPY: Japanese Yen (¥) PEN: Nuevo Soles (S/.) USD: US Dollars ($)

VENTANILLA
CALLAO
LIMA NORTE IV
LIMA NORTE II
LIMA NORTE III
LIMA NORTE I
ANCON
CARABAYLLO
SAN JUAN DE LURIGANCHO
ATE
COMAS
LURIGANCHO
LA MOLINA
PUENTE PIEDRA
LIMA
SAN MARTIN DE PORRES
LOS OLIVOS
SANTA ROSA
RIMAC
EL AGUSTINO
SANT
IAGO D
E SUR
CO
INDE
PEND
ENCI
A
SAN BORJA
SANTA ANITA
SAN ISIDRO
SAN MIGUEL
LA VICTORIA
MIRAFLORES
PACH
ACAM
AC
BELLAVISTA
LINCE
BREÑ
A
SAN LU
IS
PUEBLO LIBRE
JESUS MARIA
LA PERLA
RIO RIMA C
RIO
CHILL
O N
RIO SURCO
RIO CHILL
ON
OCEANO PACIFICO
260000
260000
280000
280000
8660
000
8660
000
8680
000
8680
000
8700
000
8700
000
·
LEGEND
PROJECTS GSNSedapal
LIMA NORTE ILIMA NORTE IILIMA NORTE IIILIMA NORTE IV
DISTRICT BOUNDARYGREEN AREABLOCKSRIVERS
COAST
2.5 0 2.51.25 km
1:200,000Projection: UTMDatum: WGS-84
Zone: 18 sur
³
OCEANO PACIFICO
2600 00
2600 00
2900 00
2900 00
3200 00
3200 00
8630
000
8630
000
8660
000
8660
000
8690
000
8690
000
8720
000
8720
000
³
Location of Study Area inMetropolitan Lima
PROYECTO :
SERVICIO DE AGUA POTABLE Y ALCANTARILLADO DE LIMAREPUBLICA DEL PERU
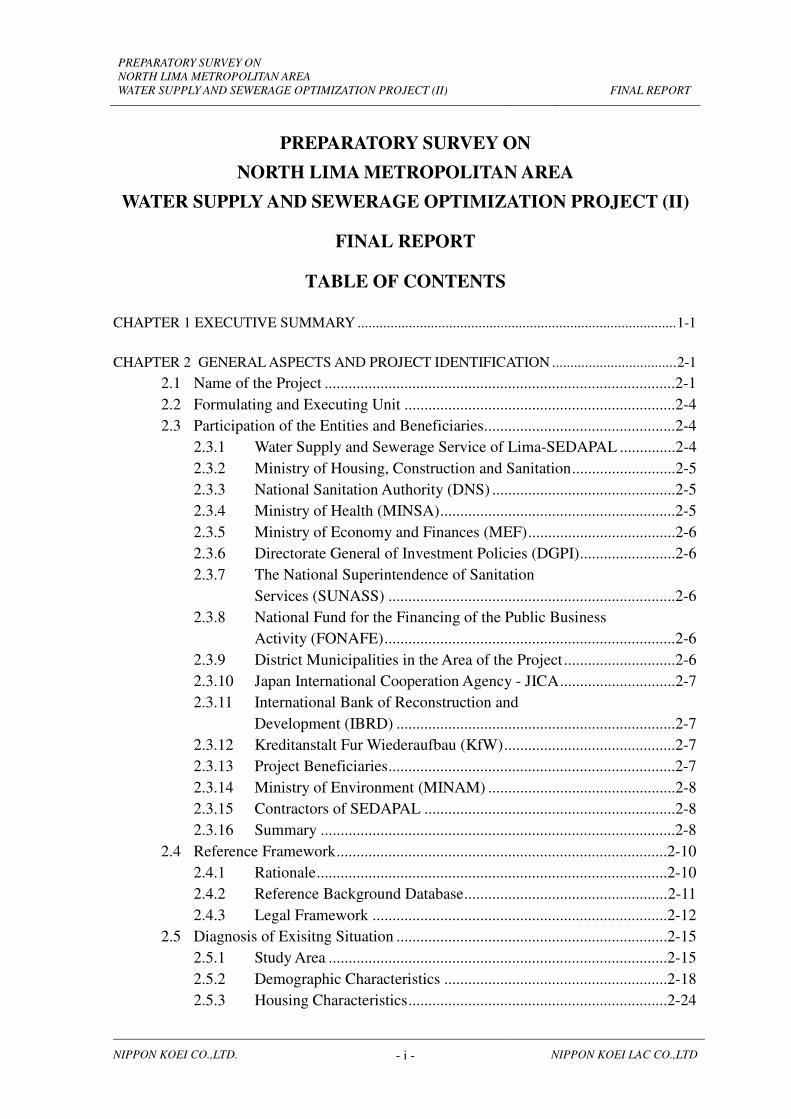
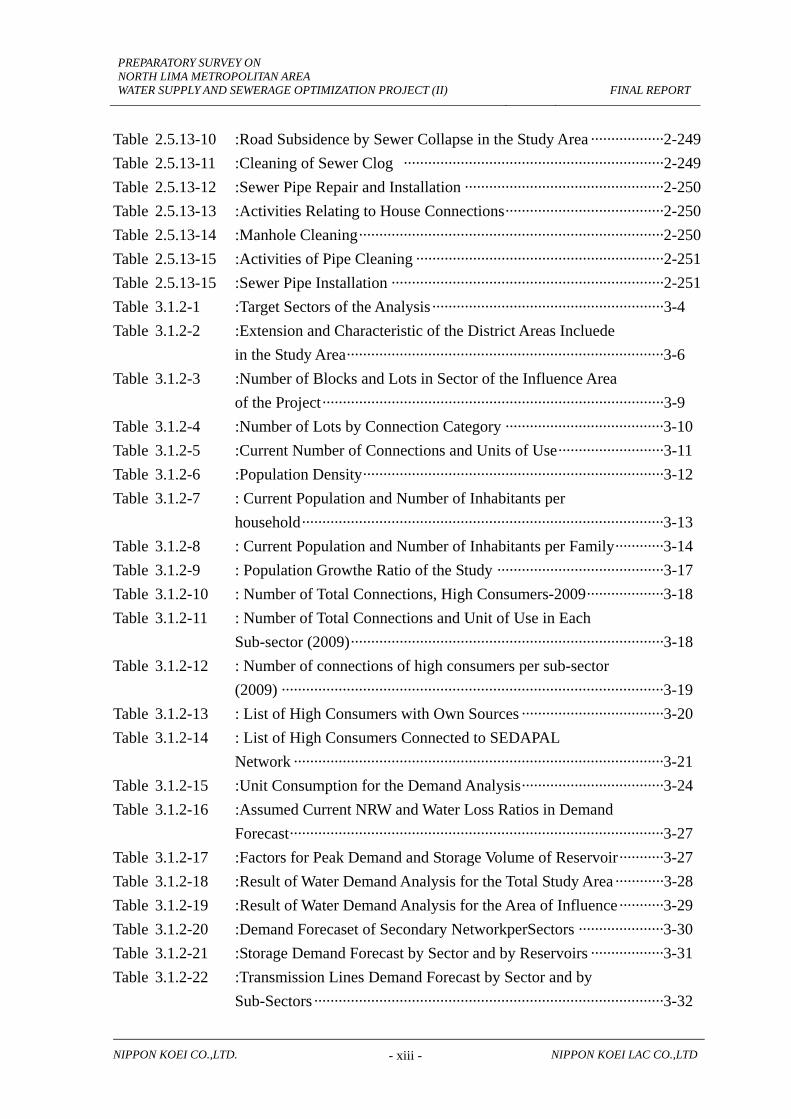
GRAFICO 2.1.1-1: AREA DEL PROYECTO DE OPTIMIZACION DEAGUA Y ALCANTARILLADO EN LIMA NORTE
FIGURE 2.1.1-1: PROJECT AREA OF LIMA NORTE WATER SUPPLY AND SEWERAGE OPTIMIZATION PROJECT
PREPARATORY SURVEY ON
NORTH LIMA METROPOLITAN AREA
WATER SUPPLY AND SEWERAGE OPTIMIZATION PROJECT (II)
FINAL REPORT
NIPPON KOEI CO.,LTD. - i - NIPPON KOEI LAC CO.,LTD
PREPARATORY SURVEY ON
NORTH LIMA METROPOLITAN AREA
WATER SUPPLY AND SEWERAGE OPTIMIZATION PROJECT (II)
FINAL REPORT
TABLE OF CONTENTS
CHAPTER 1 EXECUTIVE SUMMARY ....................................................................................... 1-1
CHAPTER 2 GENERAL ASPECTS AND PROJECT IDENTIFICATION .................................. 2-1
2.1 Name of the Project ........................................................................................2-1
2.2 Formulating and Executing Unit ....................................................................2-4
2.3 Participation of the Entities and Beneficiaries ................................................2-4
2.3.1 Water Supply and Sewerage Service of Lima-SEDAPAL ..............2-4
2.3.2 Ministry of Housing, Construction and Sanitation ..........................2-5
2.3.3 National Sanitation Authority (DNS) ..............................................2-5
2.3.4 Ministry of Health (MINSA) ...........................................................2-5
2.3.5 Ministry of Economy and Finances (MEF) .....................................2-6
2.3.6 Directorate General of Investment Policies (DGPI) ........................2-6
2.3.7 The National Superintendence of Sanitation
Services (SUNASS) ........................................................................2-6
2.3.8 National Fund for the Financing of the Public Business
Activity (FONAFE) .........................................................................2-6
2.3.9 District Municipalities in the Area of the Project ............................2-6
2.3.10 Japan International Cooperation Agency - JICA .............................2-7
2.3.11 International Bank of Reconstruction and
Development (IBRD) ......................................................................2-7
2.3.12 Kreditanstalt Fur Wiederaufbau (KfW) ...........................................2-7
2.3.13 Project Beneficiaries ........................................................................2-7
2.3.14 Ministry of Environment (MINAM) ...............................................2-8
2.3.15 Contractors of SEDAPAL ...............................................................2-8
2.3.16 Summary .........................................................................................2-8
2.4 Reference Framework ...................................................................................2-10
2.4.1 Rationale ........................................................................................2-10
2.4.2 Reference Background Database ................................................... 2-11
2.4.3 Legal Framework ..........................................................................2-12
2.5 Diagnosis of Exisitng Situation ....................................................................2-15
2.5.1 Study Area .....................................................................................2-15
2.5.2 Demographic Characteristics ........................................................2-18
2.5.3 Housing Characteristics .................................................................2-24
PREPARATORY SURVEY ON
NORTH LIMA METROPOLITAN AREA
WATER SUPPLY AND SEWERAGE OPTIMIZATION PROJECT (II)
FINAL REPORT
NIPPON KOEI CO.,LTD. - ii - NIPPON KOEI LAC CO.,LTD
2.5.4 Social Characteristics ....................................................................2-27
2.5.5 Economic Characteristics .............................................................2-38
2.5.6 Results of Socioeconomic Survey .................................................2-45
2.5.7 Topographic and Geotechnical Characteristics .............................2-78
2.5.8 Diagnosis of Existing Infrastructure – Water Supply ....................2-82
2.5.9 Diagnosis of Existing Infrastructure – Sewerage System ..........2-156
2.5.10 Diagnosis of Existing Condition of
Non-revenue Water and Hourly Consumption ............................2-201
2.5.11 Diagnosis of Economic-Financial Situation ................................2-210
2.5.12 Institutional Aspects and Legal Framwork ..................................2-230
2.5.13 Diagnosis of Operation and Maintenance Aspect .......................2-245
2.5.14 Identification of Problems – Needs and Constraints ...................2-253
2.6 Objective and Purpose of the Project ..........................................................2-257
CHAPTER 3 FORMULATION AND EVALUATION ......................................................3-1
3.1 Demand Analysis ............................................................................................3-1
3.1.1 Target Design Period .......................................................................3-1
3.1.2 Water Supply ...................................................................................3-1
3.1.3 Sewerage .......................................................................................3-43
3.2 Supply Analysis ............................................................................................3-54
3.2.1 Water Supply .................................................................................3-54
3.2.2 Sewerage .......................................................................................3-63
3.3 Demand – Supply Balance ............................................................................3-74
3.3.1 Water Supply .................................................................................3-74
3.3.2 Sewerage .......................................................................................3-85
3.4 Technical Solutions against the Problems ....................................................3-86
3.4.1 Consideration of Technical Solutions ................................................ 3-86
3.4.2 Conceptual Plan of Sectorization and Automation of
Water Distribution System ............................................................3-93
3.4.3 Modification of Boudaries of Sectors and Sub-sectors ...............3-103
3.4.4 Upgrading of Primary Network ................................................... 3-110
3.4.5 Improvement of Reservoirs and Pumping Stations ..................... 3-115
3.4.6 Improvement of Secondary Network ..........................................3-130
3.4.7 House Connection Improvement and
Micrometer Installations ..............................................................3-144
3.4.8 Improvement of Wells .................................................................3-148
3.4.9 Installation of SCADA System ....................................................3-152
3.4.10 Improvement of Sewerage Networks ..........................................3-155
3.4.11 Improvement of SEDAPAL’s Business
Management Capacity .................................................................3-160
3.4.12 Formulation of the Project ...........................................................3-165
3.5 Costs………. ..............................................................................................3-205
PREPARATORY SURVEY ON
NORTH LIMA METROPOLITAN AREA
WATER SUPPLY AND SEWERAGE OPTIMIZATION PROJECT (II)
FINAL REPORT
NIPPON KOEI CO.,LTD. - iii - NIPPON KOEI LAC CO.,LTD
3.5.1 Costs in the “without” Project situation ......................................3-205
3.5.2 Costs in the “with” project situation ............................................3-218
3.5.3 Operation and Maintenance Incremental Costs ...........................3-245
3.5.4 Project Components and Construction Packages ........................3-250
3.6 Project Benefits ...........................................................................................3-255
3.6.1 Benefits in a “Without Project” Situation....................................3-255
3.6.2 Benefits in a “With Project” Situation .........................................3-256
3.7 Social Evaluation (Economic Evaluation) ..................................................3-269
3.7.1 Social Evaluation Methodology ..................................................3-269
3.7.2 General Considerations ...............................................................3-270
3.7.3 Results of the Social Evaluation ..................................................3-270
3.8 Private Evaluation (Financial Evaluation) ..................................................3-274
3.8.1 Economic Evaluation ..................................................................3-274
3.8.2 Financial Evaluation ....................................................................3-276
3.9 Sensitivity Analysis ....................................................................................3-282
3.10 Risk Analysis ..............................................................................................3-284
3.11 Sustainability Analysis................................................................................3-287
3.11.1 Institutional Agreements Foreseen
for the Operation and Maintenance Phases .................................3-287
3.11.2 Legislative Framework Necessary
for Project Execution and Operation ...........................................3-289
3.11.3 Management Capacity of the Organization in Charge of the Project
During Investment and Operation Stages. ...................................3-289
3.11.4 Availability of Resources and Financing .....................................3-290
3.11.5 Beneficiaries´ Capacity to Pay ....................................................3-291
3.11.6 Participation of the Beneficiaries ................................................3-292
3.12 Environmental Assessment .........................................................................3-293
3.12.1 Introduction .................................................................................3-293
3.12.2 Legal Framework ........................................................................3-293
3.12.3 Institutional Framework ..............................................................3-293
3.12.4 Environmental Assessment Procedures in Peru ..........................3-294
3.12.5 Environmental Check List ...........................................................3-296
3.12.6 Environmental Diagnostics .........................................................3-304
3.12.7 Initial Environmental Assessment ...............................................3-304
3.13 Organization and Managenent for Implementation ....................................3-312
3.14 Implementation Plan ...................................................................................3-317
3.14.1 Pre-investment completion activities ..........................................3-317
3.14.2 Consulting services activities ......................................................3-317
3.14.3 Pre-construction activities ...........................................................3-318
3.14.4 Construction activities .................................................................3-320
3.14.5 Operations Startup Activities .......................................................3-320

PREPARATORY SURVEY ON
NORTH LIMA METROPOLITAN AREA
WATER SUPPLY AND SEWERAGE OPTIMIZATION PROJECT (II)
FINAL REPORT
NIPPON KOEI CO.,LTD. - iv - NIPPON KOEI LAC CO.,LTD
3.14.6 Physical and financial goals ........................................................3-320
3.15 Financing Plan ............................................................................................3-324
3.15.1 JICA Funding ..............................................................................3-324
3.15.2 IBRD Funding .............................................................................3-325
3.15.3 KfW Funding ...............................................................................3-325
3.15.4 Project Funding Scheme ..............................................................3-325
3.15.5 Debt Service for Loans ................................................................3-328
3.16 Logframe .....................................................................................................3-330
3.17 Baseline for Impact Assessment .................................................................3-332

PREPARATORY SURVEY ON NORTH LIMA METROPOLITAN AREA WATER SUPPLY AND SEWERAGE OPTIMIZATION PROJECT (II)
FINAL REPORT
NIPPON KOEI CO.,LTD. - v - NIPPON KOEI LAC CO.,LTD
SUPPORTING REPORTS Appendix-A Field Survey
A1 Topographic Survey A2 Geotechnical Survey A3 Well and Groundwater Survey A4 Structural Survey A5 Network Condition Survey A5.1 Water Supply Network A5.2 Sewer Network A6 Mechanical and Electrical Survey A7 Social Survey A8 Archeological Survey
Appendix-B Study and Analysis B1 Water Demand Forecast B2 Hydraulic Calculation B2.1 Water Supply Network B2.2 Sewer Network B3 SCADA B4 Cost Estimate B5 Environmental Impact Assessment B6 Risk Analysis B7 Economic Evaluation
Appendix-C Drawings C1 Water Supply Network C2 Sewer Network
Appendix-D Others D1 Correspondence

PREPARATORY SURVEY ON NORTH LIMA METROPOLITAN AREA WATER SUPPLY AND SEWERAGE OPTIMIZATION PROJECT (II)
FINAL REPORT
NIPPON KOEI CO.,LTD. - vi - NIPPON KOEI LAC CO.,LTD
List of Tables Table 1.3.1-1 : Target Sectors of the Analysis ························································ 1-2 Table 1.3.1-2 : Water demand for the influence area of the Project ························ 1-3 Table 1.3.2-1 : Condition of Supply Analysis ························································ 1-5 Table 1.3.3-1 : Supply after Modification of Distribution Area of the
Influence Area ·················································································· 1-6 Table 1.3.3-2 : Supply-Demand Analysis for Reservoir Storage ···························· 1-7 Table 1.3.3-3 : Supply-Demand Balance in Secondary Networks ·························· 1-8 Table 1.3.3-4 : Supply-Demand Balance for Sewarage in the Project Area ··········· 1-9 Table 1.4.3-1 : Quantity of Construction Works in Primary Network ···················· 1-13 Table 1.4.3-2 : Quantity of Construction Works in the Reservoirs and
Pumping Stations ············································································· 1-14 Table 1.4.3-3 : List of the Reservoirs and Pumping Stations in the Project ············ 1-15 Table 1.4.3-4 : Quantity of Construction Works in the Wells ································· 1-15 Table 1.4.3-5 : Wells in the Project ········································································ 1-16 Table 1.4.3-6 : Quantity of Target Facilities for SCADA System in Water
Supply Facilities ·············································································· 1-16 Table 1.4.3-7 : Properties for Pipes to be Considered for Renwal ·························· 1-17 Table 1.4.3-8 : Summary of the Planned Upgraded and Revewed Pipes in
the Project ························································································ 1-18 Table 1.4.3-9 : Secondary Networks and Accessories of Water Supply ················· 1-19 Table 1.4.3-10 : Number of House Connections to be Renewed in the
Project ······························································································ 1-20 Table 1.4.3-11 : Quantity of Construction Works in the House Connections
and Micrometers ·············································································· 1-20 Table 1.4.3-12 : Compaarative Costs for Pipe Installation Methods ························ 1-21 Table 1.4.3-13 : Renewal of secondary networks of sewerage and
connections ······················································································ 1-21 Table 1.4.3-14 : Equuipment of Maintenance Works to be Purchased in the
Project ······························································································ 1-21 Table 1.4.3-15 : Summary of works of water supply and sewerage of the
project ······························································································ 1-22 Table 1.5-1 : Project Investment Costs ································································ 1-24 Table 1.7-1 : Evaluation results of the water supply project································ 1-26 Table 1.7-2 : Per Capita Investment in Sewerage Secondary Networks
and Connections ··············································································· 1-26 Table 1.10-1 : Environmental Impact Assesment Matrix ······································ 1-31

PREPARATORY SURVEY ON NORTH LIMA METROPOLITAN AREA WATER SUPPLY AND SEWERAGE OPTIMIZATION PROJECT (II)
FINAL REPORT
NIPPON KOEI CO.,LTD. - vii - NIPPON KOEI LAC CO.,LTD
Table 1.10-2 : Environmental Mitigation Plan ······················································ 1-31 Table 1.10-3 : EMP Cost Estimates (Preliminary) ················································ 1-32 Table 1.12-1 : Package and Duration of Works Construction and
Equipment Supply ··········································································· 1-35 Table 1.12-2 : Financial Progress of the Projet Component ································· 1-38 Table 1.12-3 : Physical Progress of the Project Components ································ 1-39 Table 1.13-1 : Phroject Funding Scheme by Source ············································· 1-41 Table 1.14-1 : Log Frame Matrix ·········································································· 1-41 Table 2.3.16-1 :Interests,Identified Prblems and Commitments of the
Involved Parties ··············································································· 2-9 Table 2.5.1-1 :Populated Areas in the Districts within the Area of
Influence ·························································································· 2-16 Table 2.5.2-1 :2007 Urban Population Structure by Gender ·································· 2-19 Table 2.5.2-2 :2007 Urban Population Structure by Age ········································ 2-19 Table 2.5.2-3 :Nominally Registered Population in Censuses and
Population Growth of Region of Lima and Callao in 1940-2007 ································································································· 2-20
Table 2.5.2-4 :Population and Growth Rate in the Vicinity of the Study Area ································································································· 2-21
Table 2.5.2-5 :Urban Population and Household in the Vicinity of the Study Area ······················································································· 2-22
Table 2.5.2-6 :Life Expectancy at Birth in 2005 ···················································· 2-23 Table 2.5.2-7 :Demographic Indicators in Region of Lima and Callao by
Five-year Perios ··············································································· 2-24 Table 2.5.3-1 :Number of Dwellings-Urban Area in 2007 ····································· 2-24 Table 2.5.3-2 :Number of Blocks and Plots by Sectors in the Study Area
(in units). ·························································································· 2-25 Table 2.5.3-3 :Dwelling Tenure Regime ································································ 2-26 Table 2.5.3-4 :Dwelling Construction Materials ···················································· 2-26 Table 2.5.3-5 :Utility Service Availability (%) ······················································· 2-27 Table 2.5.4-1 :Child mortality by Selected Characteristics in 2004-2006 ·············· 2-27 Table 2.5.4-2 :Hospitals,Health Care Centers and Health Care Posts in
2008 ································································································· 2-28 Table 2.5.4-3 :Ministry of Health Staff in the Health Care Facilities in
2007 ································································································· 2-29

PREPARATORY SURVEY ON NORTH LIMA METROPOLITAN AREA WATER SUPPLY AND SEWERAGE OPTIMIZATION PROJECT (II)
FINAL REPORT
NIPPON KOEI CO.,LTD. - viii - NIPPON KOEI LAC CO.,LTD
Table 2.5.4-4 :Major Groups of Diseases that Cause Morbidity, as Registered by External Care in 2007 and 2008 (Carabayllo, Los olivos, Puente Piedra, San Martín and Comas) ························· 2-29
Table 2.5.4-5 :Major Groups of Diseases that Cause Morbidity, as Registered by External Care in 2007 and 2008 (Callao and Ventanilla) ························································································ 2-30
Table 2.5.4-6 :Children <5 YEARS OLD – Case tendencies and Influence Rate (per 1,000 persons) ·················································· 2-30
Table 2.5.4-7 :Illiteracy Rate in Lima Region in 1995-2015 ·································· 2-31 Table 2.5.4-8 :Literacy Condition in the Districts in the vicinity of the
Study Area ······················································································· 2-32 Table 2.5.4-9 :Educational Institutes in 2008* ······················································· 2-33 Table 2.5.4-10 :Schools,Classes,Students and Teachers in 2008* ···························· 2-34 Table 2.5.4-11 :Schools,Classes,Students and Teachers in 2008* ···························· 2-35 Table 2.5.4-12 :Average per Capita Monthly Expenditures in 2007
(Constant soles at Metropolitan Lima Prices) ·································· 2-36 Table 2.5.4-13 :Poverty Map at District Level in 2007 ············································ 2-36 Table 2.5.5-1 :Working Population Distribution in 2007 ······································· 2-38 Table 2.5.5-2 :Employment Category among the Population in the Study
Area in 2007 ···················································································· 2-39 Table 2.5.5-3 :Employment by Sector in 2007 ······················································· 2-39 Table 2.5.5-4 :Gross Family Income Levels ·························································· 2-41 Table 2.5.5-5 :Monthly per Capital Income Levels ················································ 2-41 Table 2.5.5-6 :Dwellings with Potable Water Supply-Urban Area ························· 2-42 Table 2.5.5-7 :Potable Water Connections in 2009 ················································ 2-42 Table 2.5.5-8 :Dwellings with Sewerage Service-District Urban Area in
2009 ································································································· 2-43 Table 2.5.5-9 :Sewerage Connections of the 7 Districts ········································· 2-43 Table 2.5.5-10 :Transportation Means per Household, Owned by the
Family (*) ························································································ 2-44 Table 2.5.6-1 : Samples of survey by districts and sectors ····································· 2-46 Table 2.5.6-2 :Survey Samples by Sectors and Supply Type ································· 2-48 Table 2.5.6-3 :Monthly Family Incomes and Expenditures by Sector with
SEDAPAL Water Service ································································· 2-52 Table 2.5.6-4 :Monthly Family Incomes and Expenditures by Sector
without SEDAPAL Water Service ···················································· 2-53

PREPARATORY SURVEY ON NORTH LIMA METROPOLITAN AREA WATER SUPPLY AND SEWERAGE OPTIMIZATION PROJECT (II)
FINAL REPORT
NIPPON KOEI CO.,LTD. - ix - NIPPON KOEI LAC CO.,LTD
Table 2.5.6-5 :Illness Related to Poor Water and Sewerage Service in Areas with SEDAPAL Sevice ·························································· 2-54
Table 2.5.6-6 :Illness Related to Poor Water and Sewerage Service in Areas without SEDAPAL Service ···················································· 2-54
Table 2.5.6-7 :Average Monthly Water Consumption and Payments in Areas with SEDAPAL Service ························································· 2-55
Table 2.5.6-8 :Problems with Water Service for Household by District in Areas with SEDAPAL Service ························································· 2-57
Table 2.5.6-9 :Service Problems Observed Outside the Home in Areas with SEDAPAL Service ··································································· 2-58
Table 2.5.6-10 :Use of Electric Pump to Propel Water to an Elevated Tank in Areas with SEDAPAL Service ····················································· 2-59
Table 2.5.6-11 :Average Monthly Water Consumption and Payment in Areas with SEDAPAL Service ························································· 2-61
Table 2.5.6-12 :Use of Electric Pumps to Lift Water to an Elevated Tank ··············· 2-62 Table 2.5.6-13 :Description of SEDAPAL Service ·················································· 2-63 Table 2.5.6-14 : Perception of Water Service Supplied (Tap, Well, or Tank
Truck) ······························································································ 2-63 Table 2.5.6-15 :Problems with Household Sewer Pipes in Areas with
SEDAPAL Service ··········································································· 2-65 Table 2.5.6-16 :Sewerage Service Problems Outside the Home in Areas
with SEDAPAL Service ··································································· 2-66 Table 2.5.6-17 :Problems with the Excreta Disposal System in Areas with
SEDAPAL Service ··········································································· 2-68 Table 2.5.6-18 :Maintenance Cost for Waste Management System ························· 2-68 Table 2.5.6-19 :Perception of Sewerage Service (provided by SEDAPAL) ············· 2-69 Table 2.5.6-20 :Perception of Sewerage System provided by SEDAPAL ················ 2-70 Table 2.5.6-21 :Payment Affordability in SEDAPAL Service Area ························· 2-72 Table 2.5.6-22 :Payment Affordability in Area without SEDAPAL Service ··········· 2-72 Table 2.5.6-23 :Willingness to Pay for Better Water and Sewerage Service ··········· 2-74 Table 2.5.6-24 :Maximum Willingness to Pay (WTP) in Areas with 24
Hour SEDAPAL Service ································································ 2-74 Table 2.5.6-25 :Result of WTP Questions in Areas with Less than 24 Hour
Service (Comas 2) ·········································································· 2-75 Table 2.5.6-26 :Willingness to Pay for the Project According to Type of
Household (In S/. ) ········································································· 2-76

PREPARATORY SURVEY ON NORTH LIMA METROPOLITAN AREA WATER SUPPLY AND SEWERAGE OPTIMIZATION PROJECT (II)
FINAL REPORT
NIPPON KOEI CO.,LTD. - x - NIPPON KOEI LAC CO.,LTD
Table 2.5.6-27 :Result of WTP Questions in Areas without SEDAPAL Service (Comas 2) ········································································· 2-76
Table 2.5.7-1 :Validation of SEDAPAL Data ························································· 2-79 Table 2.5.8-1 :Correspondence of Proposed Sectors and Sub Sectors with
Original Sectors ············································································· 2-83 Table 2.5.8-2 :Original Sectors in the Study Area with Valve Pits at Their
Entrance ························································································· 2-87 Table 2.5.8-3 :Records of Incidents ····································································· 2-96 Table 2.5.8-4 :Capacity and Actual Production of WTPs and Wells of
SEDAPAL ······················································································ 2-101 Table 2.5.8-5 : Outline of the Projects for Production Mentioned
in the 2009 Master Plan ································································· 2-103 Table 2.5.8-6 : Sectors to be covered by the Huachipa WTP in the Study
Area (Distribution Area of Huachipa WTP) ···································· 2-104 Table 2.5.8-7 : Length of Existing Primary Pipeline by Sectors in the
Study Area ······················································································ 2-106 Table 2.5.8-8 :Main Trunks in the Study Area ····················································· 2-107 Table 2.5.8-9 :Inflow pressures to Sectors – La Atarjea – Los Olivos
Main ······························································································· 2-110 Table 2.5.8-10 :Reservoirs and Pumping Stations in the Study Area and
their Existing Conditions ································································· 2-112 Table 2.5.8-11 :List of Reservoirs to be Rehabilitated ············································· 2-115 Table 2.5.8-12 :Elictromechanical Facilities Conditions of Reservoirs ··················· 2-116 Table 2.5.8-13 :Pumping Station ·············································································· 2-117 Table 2.5.8-14 :Electromechanical Elements Conditions ········································· 2-117 Table 2.5.8-15 :List of Wells in the Study Area Zone ·············································· 2-121 Table 2.5.8-16 :Existing Wells to be Rehabilitated in the Study Area ······················ 2-122 Table 2.5.8-17 :Electromechanical Characteristics of Wells ···································· 2-125 Table 2.5.8-18 :Existing Valve Pits ········································································ 2-126 Table 2.5.8-19 :Major Components for Automation of Valve Pits ·························· 2-127 Table 2.5.8-20 :Lengths of Existing Secondary Pipes by Sector and
Material ··························································································· 2-128 Table 2.5.8-21 :Numbers of the Accessoris by Sector ············································ 2-130 Table 2.5.8-22 :Length of Secondary Pipe by Age ·················································· 2-132 Table 2.5.8-23 :Length of AC Pipe by Age ····························································· 2-133 Table 2.5.8-24 :Length of PVC Pipe by Age ··························································· 2-134

PREPARATORY SURVEY ON NORTH LIMA METROPOLITAN AREA WATER SUPPLY AND SEWERAGE OPTIMIZATION PROJECT (II)
FINAL REPORT
NIPPON KOEI CO.,LTD. - xi - NIPPON KOEI LAC CO.,LTD
Table 2.5.8-25 : Length of Pipe by Diameter and Material ····································· 2-135 Table 2.5.8-26 : Worst Four Sectors in Ratios of Incidents on Secondary
Pipes ······························································································· 2-141 Table 2.5.8-27 : Four Sectors with Old Asbestos Pipes ··········································· 2-141 Table 2.5.8-28 : Non Revenue Water Ratio and Pipe Conditions in Five
Sectorized Area ················································································ 2-142 Table 2.5.8-29 : Length of Pipes with Problems ······················································ 2-145 Table 2.5.8-30 : Number of Samples by Pipe Material and Age ······························ 2-146 Table 2.5.8-31 : Categories and Numbers of House Connections by
District ····························································································· 2-149 Table 2.5.8-32 : Status of Micrometer Installation in the Study Area ······················ 2-150 Table 2.5.8-33 :Target Facilities of SCADA Diagnosis ··········································· 2-154 Table 2.5.9-1 :Drainage Area and Wastewater Treatment ····································· 2-158 Table 2.5.9-2 :Drainage Sub-areas ······································································· 2-160 Table 2.5.9-3 :Length of Primary Sewers by Material ········································ 2-164 Table 2.5.9-4 :Length of Primary Sewers by Age ·············································· 2-165 Table 2.5.9-5 :Length of Primary Sewers by Type of Material ····························· 2-166 Table 2.5.9-6 :Length of Primary Sewers by Age ················································· 2-166 Table 2.5.9-7 :Length of Primary Sewers by Type of Material ····························· 2-167 Table 2.5.9-8 :Length of Primary Sewers by Type of Material ····························· 2-167 Table 2.5.9-9 :Piping in the Study Area ································································ 2-168 Table 2.5.9-10 :Drainage Area Distribution of Pipes by Type of Material in
the Study Area ················································································· 2-171 Table 2.5.9-11 :Drainage Area Distribution of Pipes by Type of Material in
the Study Area ················································································· 2-172 Table 2.5.9-12 :Drainage Area Distribution of Pipes by Type of Material in
the Study Area ················································································· 2-174 Table 2.5.9-13 :Drainage Area Distribution of Pipes by Age in the
Implementation Area ······································································· 2-179 Table 2.5.9-14 :Calculation of Corrosion through field study ································ 2-184 Table 2.5.9-15 :Classification by Type of Incidents, 2006-2009 ···························· 2-186 Table 2.5.9-16 :Repeated Incidents per Street in June 2009 ··································· 2-188 Table 2.5.9-17 :Incidents of per Pipe Collapse ······················································· 2-191 Table 2.5.9-18 :Definition of Pipe Condition based on Incidents by
Collapse ·························································································· 2-191 Table 2.5.9-19 :Exploration Pits ············································································· 2-196 Table 2.5.9-20 :Exploration Pits ············································································· 2-196
PREPARATORY SURVEY ON NORTH LIMA METROPOLITAN AREA WATER SUPPLY AND SEWERAGE OPTIMIZATION PROJECT (II)
FINAL REPORT
NIPPON KOEI CO.,LTD. - xii - NIPPON KOEI LAC CO.,LTD
Table 2.5.9-21 :Exploration Pits ············································································· 2-196 Table 2.5.10-1 :NRWs in Monitored Sectors and North Lima Area ························ 2-202 Table 2.5.10-2 :Estimated Ratio of Technical Loss ················································· 2-205 Table 2.5.11-1 :General Assessment ······································································ 2-211 Table 2.5.11-2 :Statement of Profits and Losses ··················································· 2-212 Table 2.5.11-3 :Cash Flow ···················································································· 2-214 Table 2.5.11-4 :Financial and Management Indicators ········································· 2-216 Table 2.5.11-5 : Investment and Financing ··························································· 2-217 Table 2.5.11-6 : Investments Program for the Five-Year Period 2009-2013 ··········· 2-218 Table 2.5.11-7 : Retributions for Private Participation Projects ······························· 2-219 Table 2.5.11-8 : Financial Sources ··········································································· 2-219 Table 2.5.11-9 : Projection of Operating Expense ··················································· 2-220 Table 2.5.11-10 : Projection of Revenues ·································································· 2-220 Table 2.5.11-11 : Program of Investments for the Five-year Period 2010-
2014 ································································································· 2-222 Table 2.5.11-12 : Financial Sources ·········································································· 2-223 Table 2.5.11-13 : Projection of Operating Expense ·················································· 2-223 Table 2.5.11-14 : Projection of Revenues ································································· 2-223 Table 2.5.11-15 : Tariff Increase ··············································································· 2-224 Table 2.5.11-16 : Weighted Average Cost of Capital ················································ 2-227 Table 2.5.12-1 :Distribution of Active Workers by Occupational Group ··············· 2-234 Table 2.5.12-2 :Work Productivity Index ······························································· 2-235 Table 2.5.12-3 :Summary of Teams Involved in Project Formulation,
Execution and Operation ································································· 2-237 Table 2.5.12-4 :Available Equipment (1) ································································· 2-240 Table 2.5.12-5 :Available Equipment (2) ································································· 2-243 Table 2.5.12-6 :Available Equipment (3) ································································· 2-243 Table 2.5.13-1 :Summary of Operation and Maintenance Procedure ······················ 2-245 Table 2.5.13-2 :Leakages in Water Networks 2009 ················································· 2-246 Table 2.5.13-3 :Pipe Maintenance Activities 2009 ·················································· 2-246 Table 2.5.13-4 :Activities Involving House Connections 2009 ······························· 2-246 Table 2.5.13-5 :Pipe Installation and Replacement ················································ 2-247 Table 2.5.13-6 :Activities Relating to Valves 2009 ················································ 2-247 Table 2.5.13-7 :Activities Relating to Water Supply Accesories 2009 ··················· 2-247 Table 2.5.13-8 :Underground Leakage Survey (1997 2009) ·································· 2-248 Table 2.5.13-9 :Meter Replacemente ····································································· 2-248
PREPARATORY SURVEY ON NORTH LIMA METROPOLITAN AREA WATER SUPPLY AND SEWERAGE OPTIMIZATION PROJECT (II)
FINAL REPORT
NIPPON KOEI CO.,LTD. - xiii - NIPPON KOEI LAC CO.,LTD
Table 2.5.13-10 :Road Subsidence by Sewer Collapse in the Study Area ·················· 2-249 Table 2.5.13-11 :Cleaning of Sewer Clog ································································ 2-249 Table 2.5.13-12 :Sewer Pipe Repair and Installation ················································· 2-250 Table 2.5.13-13 :Activities Relating to House Connections ······································· 2-250 Table 2.5.13-14 :Manhole Cleaning ··········································································· 2-250 Table 2.5.13-15 :Activities of Pipe Cleaning ····························································· 2-251 Table 2.5.13-15 :Sewer Pipe Installation ··································································· 2-251 Table 3.1.2-1 :Target Sectors of the Analysis ························································· 3-4 Table 3.1.2-2 :Extension and Characteristic of the District Areas Incluede
in the Study Area ·············································································· 3-6 Table 3.1.2-3 :Number of Blocks and Lots in Sector of the Influence Area
of the Project ···················································································· 3-9 Table 3.1.2-4 :Number of Lots by Connection Category ······································· 3-10 Table 3.1.2-5 :Current Number of Connections and Units of Use ·························· 3-11 Table 3.1.2-6 :Population Density ·········································································· 3-12 Table 3.1.2-7 : Current Population and Number of Inhabitants per
household ························································································· 3-13 Table 3.1.2-8 : Current Population and Number of Inhabitants per Family ············ 3-14 Table 3.1.2-9 : Population Growthe Ratio of the Study ········································· 3-17 Table 3.1.2-10 : Number of Total Connections, High Consumers-2009 ··················· 3-18 Table 3.1.2-11 : Number of Total Connections and Unit of Use in Each
Sub-sector (2009) ············································································· 3-18 Table 3.1.2-12 : Number of connections of high consumers per sub-sector
(2009) ······························································································ 3-19 Table 3.1.2-13 : List of High Consumers with Own Sources ··································· 3-20 Table 3.1.2-14 : List of High Consumers Connected to SEDAPAL
Network ··························································································· 3-21 Table 3.1.2-15 :Unit Consumption for the Demand Analysis ··································· 3-24 Table 3.1.2-16 :Assumed Current NRW and Water Loss Ratios in Demand
Forecast···························································································· 3-27 Table 3.1.2-17 :Factors for Peak Demand and Storage Volume of Reservoir ··········· 3-27 Table 3.1.2-18 :Result of Water Demand Analysis for the Total Study Area ············ 3-28 Table 3.1.2-19 :Result of Water Demand Analysis for the Area of Influence ··········· 3-29 Table 3.1.2-20 :Demand Forecaset of Secondary NetworkperSectors ····················· 3-30 Table 3.1.2-21 :Storage Demand Forecast by Sector and by Reservoirs ·················· 3-31 Table 3.1.2-22 :Transmission Lines Demand Forecast by Sector and by
Sub-Sectors ······················································································ 3-32

PREPARATORY SURVEY ON NORTH LIMA METROPOLITAN AREA WATER SUPPLY AND SEWERAGE OPTIMIZATION PROJECT (II)
FINAL REPORT
NIPPON KOEI CO.,LTD. - xiv - NIPPON KOEI LAC CO.,LTD
Table 3.1.2-23 :Sector Inlet Pipes Demand Forecast by Sub-Sectors ······················· 3-33 Table 3.1.2-24 :Water Connections Demand Forecast by Sub-Sectors ····················· 3-34 Table 3.1.2-25 : Demand Forecast of SecondaryNetworkper Sectors ······················ 3-38 Table 3.1.2-26 : Storage Demand Forecast by Sector and by Reservoirs ················· 3-39 Table 3.1.2-27 : Transmission Lines Demand Forecast by Sector and by
Sub-Sectors ······················································································ 3-40 Table 3.1.2-28 : Sector Inlet Pipes Demand Forecast by Sub.Sectors ······················ 3-41 Table 3.1.2-29 : Water Connections Demand Forecast by Sub-Sectors ···················· 3-42 Table 3.1.3-1 :Hydraulic Modeling Results Length of Pipe in km ························· 3-45 Table 3.1.3-2 :Sewerage Connections by Categories According to
Drainage Areas ················································································· 3-45 Table 3.1.3-3 :Total Sewerage Flow ······································································ 3-46 Table 3.1.3-4 :Demand for Pipes ··········································································· 3-47 Table 3.1.3-5 :Sewerage Demand by Drainage Area ·············································· 3-47 Table 3.1.3-6 :Hydraoulic Capacity of Reservoirs Overflow Discharge
Collectors ························································································· 3-51 Table 3.2.1-1 :Capacity and Current Production of SEDAPAL WTPs and
Wells ································································································ 3-55 Table 3.2.1-2 :Water Demand Forecast in Area of Influence of Huachipa
WTP of Lima Norte I Project ··························································· 3-57 Table 3.2.1-3 :Conditions of Supply Analysis ························································ 3-58 Table 3.2.1-4 : Result of Supply Analysis for the Area of Influence ······················ 3-59 Table 3.2.1-5 : Storage Supply ··············································································· 3-60 Table 3.2.1-6 : Primary Networks Supply in the Study Area ·································· 3-61 Table 3.2.1-7 : Transmission Lines Supply to Sectors ··········································· 3-61 Table 3.2.1-8 : Pumping Lines Supply in Sectors ·················································· 3-61 Table 3.2.1-9 : Secondary Distribution Network Supply ······································· 3-62 Table 3.2.2-1 : CSN Pipe Replacement Alternatives in the Study Area ·················· 3-64 Table 3.2.2-2 : Sewerage Network Supply ····························································· 3-65 Table 3.3.1-1 : Supply after Modification of Distribution Area ····························· 3-77 Table 3.3.1-2 : Supply-Demand Analysis for Reservoir Storage ···························· 3-79 Table 3.3.1-3 : Supply-Demand Balance of Main Networks ·································· 3-80 Table 3.3.1-4 : Supply-Demand Balance in Secondary Networks ·························· 3-81 Table 3.3.1-5 : Supply-Demand Balance in Transmission Lines per
Sectors ····························································································· 3-82 Table 3.3.1-6 : Supply-Demand Balance in Inlet to Sectors Pipes per Sub-
Sector ······························································································· 3-83

PREPARATORY SURVEY ON NORTH LIMA METROPOLITAN AREA WATER SUPPLY AND SEWERAGE OPTIMIZATION PROJECT (II)
FINAL REPORT
NIPPON KOEI CO.,LTD. - xv - NIPPON KOEI LAC CO.,LTD
Table 3.3.1-7 : Supply-Demand Balance in Water Connection per Sub-Sector ······························································································· 3-84
Table 3.3.2-1 : Supply-Demand Balance for Sewerage ·········································· 3-85 Table 3.4.1-1 : Estimation of Water Loss in Secondary Networks and
House Connections ·········································································· 3-88 Table 3.4.1-2 :Estimation of NRW Ratio after Projects ········································· 3-90 Table 3.4.1-3 :Comparison of Alternatives of Execution Level of
Technical Solutions ·········································································· 3-91 Table 3.4.2-1 : Summary of Sectors and Sub-sectors in the Study ························· 3-96 Table 3.4.2-2 : Definition of Sector and Sub-Sector ·············································· 3-97 Table 3.4.2-3 : Function of Sector and Sub-Sector Proposed in Perfil
compared with Japanese Case ·························································· 3-98 Table 3.4.4-1 : Pressure Reduction Valves in the Study Area ································· 3-114 Table 3.4.4-2 : Quantity of Construction Works in the Primary Network ·············· 3-115 Table 3.4.5-1 : Sub-sectors Which Do Not Satisfy the National Standard ············ 3-117 Table 3.4.5-2 : Evaluation of the Capacities of Reservoirs based on
Demand in 2025 ·············································································· 3-118 Table 3.4.5-3 : Assumed Consumption in the Dynamic Analysis of the
Reservoirs ······················································································· 3-119 Table 3.4.5-4 : Evaluation of the Capacities of the Reservoirs to Regulate
the Pressure ····················································································· 3-120 Table 3.4.5-5 : Types of Construction Works of Reservoirs and Pumping
Stations ··························································································· 3-122 Table 3.4.5-6 : Equipment Required in a Reservoir ·············································· 3-126 Table 3.4.5-7 : Quantity of Construction Works in the Reservoirs and
Pumping Stations ··········································································· 3-127 Table 3.4.5-8 : List of the Reservoirs and Pumping Stations in the Project ··········· 3-128 Table 3.4.6-1 : Planned New Pipes in the Project (km) ········································· 3-132 Table 3.4.6-2 : Pipes to be Upgraded based on the Hydraulic Calculation ············· 3-133 Table 3.4.6-3 : Priorities for Pipes to be Considered for Renewal ························· 3-136 Table 3.4.6-4 : Summary of the Planned Upgraded and Renewed Pipes in
the Project ······················································································· 3-137 Table 3.4.6-5 : Pipes for Upgrade and Renewal ···················································· 3-138 Table 3.4.6-6 : Selection of Pipe Material for Secondary Networks ····················· 3-140 Table 3.4.6-7 : Quantity of Construction Works in the Secondary
Networks ························································································· 3-144

PREPARATORY SURVEY ON NORTH LIMA METROPOLITAN AREA WATER SUPPLY AND SEWERAGE OPTIMIZATION PROJECT (II)
FINAL REPORT
NIPPON KOEI CO.,LTD. - xvi - NIPPON KOEI LAC CO.,LTD
Table 3.4.7-1 : Number of House Connections to be Renewed in the Project ····························································································· 3-146
Table 3.4.7-2 : Selection of House Connection Types ··········································· 3-147 Table 3.4.7-3 : Number of Micrometers to be Installed by Sector ························ 3-148 Table 3.4.7-4 : Quantity of Construction Works in the House Connections
and Micrometers ············································································ 3-148 Table 3.4.8-1 : Wells in the Project ····································································· 3-149 Table 3.4.8-2 : Quantity of Construction Works in the Wells ······························ 3-153 Table 3.4.9-1 : Quantity of Target Facilities for SCADA System ························· 3-154 Table 3.4.10-1 : Comparative Costs for Pipe Installation Methods ·························· 3-156 Table 3.4.10-2 : Pipes, Manholes, and House Connections that will be
rehabilitated By Drainage Areas ····················································· 3-158 Table 3.4.11-1 : Equipment for Maintenance Works to be Purchased in the
Project ······························································································ 3-161 Table 3.4.12-1 :Scope of the Project ········································································ 3-165 Table 3.4.12-2 :Supporting Main Pipe ····································································· 3-166 Table 3.4.12-3 :Transmision Line – Sector 83A ······················································ 3-168 Table 3.4.12-4 :Pumping Line – Sector 83A ···························································· 3-169 Table 3.4.12-5 :Reservoirs Rehabilitation – Sector 83A ········································· 3-169 Table 3.4.12-6 :Rehabilitation of secondary networks – Sector 83A ······················· 3-170 Table 3.4.12-7 : Transmission Line Installation - Sector 83B ·································· 3-172 Table 3.4.12-8 : Reservoirs Rehabilitation - Sector 83B ·········································· 3-12 Table 3.4.12-9 :Reservoirs Rehabilitation – Sector 83B ········································· 3-172 Table 3.4.12-10 : Transmission Line Installation - Sector 84A ·································· 3-173 Table 3.4.12-11 : Pumping Line Installation - Sector 84AB ······································ 3-174 Table 3.4.12-12 : Reservoirs Rehabilitation - Sector 84A ·········································· 3-174 Table 3.4.12-13 : Secondary Networks Rehabilitation - Sector 84A ·························· 3-174 Table 3.4.12-14 : Transmission Line Installation - Sector 84B ·································· 3-175 Table 3.4.12-15 : Pumping Line Installation - Sector 84B ········································· 3-176 Table 3.4.12-16 : Reservoirs Rehabilitation - Sector 84B ·········································· 3-176 Table 3.4.12-17 : Secondary Networks Rehabilitation - Sector 84B 4B ···················· 3-177 Table 3.4.12-18 : Transmission Line Installation - Sector 85A ·································· 3-177 Table 3.4.12-19 : Pumping Line Installation - Sector 85A ········································· 3-178 Table 3.4.12-20 : Reservoirs Rehabilitation - Sector 85A ·········································· 3-180 Table 3.4.12-21 : Secondary Networks Rehabilitation - Sector 85A ·························· 3-180 Table 3.4.12-22: : Transmission Line Installation - Sector 85B ·································· 3-181 Table 3.4.12-23 : Pumping Line Installation - Sector 85B ········································· 3-181
PREPARATORY SURVEY ON NORTH LIMA METROPOLITAN AREA WATER SUPPLY AND SEWERAGE OPTIMIZATION PROJECT (II)
FINAL REPORT
NIPPON KOEI CO.,LTD. - xvii - NIPPON KOEI LAC CO.,LTD
Table 3.4.12-24 : Reservoirs Rehabilitation - Sector 85B ·········································· 3-181 Table 3.4.12-25 : Secondary Networks Rehabilitation - Sector 85B ·························· 3-182 Table 3.4.12-26 : Transmission Line Installation - Sector 85C ·································· 3-182 Table 3.4.12-27 : Reservoirs Rehabilitation - Sector 85C ·········································· 3-183 Table 3.4.12-28 : Secondary Networks Rehabilitation - Sector 85C ·························· 3-183 Table 3.4.12-29 : Transmission Line Installation - Sector 212A ································ 3-183 Table 3.4.12-30 : Pumping Line Installation - Sector 212A ······································· 3-184 Table 3.4.12-31 : Reservoirs Rehabilitation - Sector 212A ········································ 3-185 Table 3.4.12-32 : Secondary Networks Rehabilitation - Sector 212A ························ 3-186 Table 3.4.12-33 : Transmission Line Installation - Sector 212B ································ 3-187 Table 3.4.12-34 : Pumping Line Installation - Sector 212B ······································· 3-187 Table 3.4.12-35 : Rehabilitación de Reservorios - Sector 212B ································· 3-187 Table 3.4.12-36 : Secondary Networks Rehabilitation - Sector 212B ························ 3-188 Table 3.4.12-37 : Reservoirs Rehabilitation - Sector 213 ··········································· 3-189 Table 3.4.12-38 : Secondary Networks Rehabilitation - Sector 213 ··························· 3-190 Table 3.4.12-39 : Transmission Line Installation - Sector 259 ··································· 3-191 Table 3.4.12-40 : Pumping Line Installation - Sector 259 ·········································· 3-191 Table 3.4.12-41 : Rehabilitación de Reservorio - Sector 259 ····································· 3-191 Table 3.4.12-42 : Secondary Networks Rehabilitation - Sector 259 ··························· 3-192 Table 3.4.12-43 : Inlet to Sector Pipes Installation - Sector 345 ································ 3-193 Table 3.4.12-44 : Secondary Networks Rehabilitation - Sector 346 ··························· 3-194 Table 3.4.12-45 :Inlet Pipes to Network Installation – Sector 212B ·························· 3-194 Table 3.4.12-46 : Secondary Networks Rehabilitation - Sector 348A ························ 3-195 Table 3.4.12-47 : Secondary Networks Rehabilitation - Sector 348B ························ 3-196 Table 3.4.12-48 : Transmission Line Installation - Sector 349A ································ 3-196 Table 3.4.12-49 : Pumping Line Installation - Sector 349A ······································· 3-197 Table 3.4.12-50 : Reservoirs Rehabilitation - Sector 349A ········································ 3-197 Table 3.4.12-51 : Secondary Networks Rehabilitation - Sector 349A ························ 3-198 Table 3.4.12-52 : Pumping Line Installation - Sector 349B ······································· 3-199 Table 3.4.12-53 : Reservoirs Rehabilitation - Sector 349B ········································ 3-199 Table 3.4.12-54 : Secondary Networks Rehabilitation - Sector 349B ························ 3-200 Table 3.4.12-55 : Secondary Networks Rehabilitation - Sector 350 ··························· 3-201 Table 3.4.12-56 : Reservoirs Rehabilitation - Sector 351 ··········································· 3-201 Table 3.4.12-57 : Secondary Networks Rehabilitation - Sector 351 7 ························ 3-202 Table 3.4.12-58 : Secondary Networks Rehabilitation - Sector 368A ························ 3-203 Table 3.4.12-59 : Secondary Networks Rehabilitation - Sector 369A ························ 3-203 Table 3.5.1-1 : costs per water supply processes ··················································· 3-207
PREPARATORY SURVEY ON NORTH LIMA METROPOLITAN AREA WATER SUPPLY AND SEWERAGE OPTIMIZATION PROJECT (II)
FINAL REPORT
NIPPON KOEI CO.,LTD. - xviii - NIPPON KOEI LAC CO.,LTD
Table 3.5.1-2 : Costs per commercial and administrative activity processes ························································································· 3-208
Table 3.5.1-3 : Unit costs per sewerage system activity processes ························ 3-209 Table 3.5.1-4 : Production of portable water and waste water volume of
SEDAPAL························································································ 3-210 Table 3.5.1-5 : Cost of Equipment for network maintenance of Comas
"without project" (Distribution in primary network) ························ 3-211 Table 3.5.1-6 : Cost of Equipment for network maintenance of Comas
"without project" (Distribution insecondary network) ····················· 3-212 Table 3.5.1-7 : Cost of Equipment for network maintenance of Comas
"without project" (Primary network of waste water collection) ························································································ 3-212
Table 3.5.1-8 : Cost of Equipment for network maintenance of Comas "without project" (Secondary network of waste water collection) ························································································ 3-213
Table 3.5.1-9 : Connections, Consumption, Water Demand and Waste Water Quantity without Project ························································ 3-213
Table 3.5.1-10 : Production, distribution, commercialization, and administration costs for the “without” Project water supply system ···························································································· 3-214
Table 3.5.1-11 : Collection, commercialization, and administration costs for sewerage, “without” Project ······················································· 3-215
Table 3.5.1-12 : Production, distribution, commercialization, and administration costs for the “without” Project water supply system ······························································································ 3-216
Table 3.5.1-13 : Collection, commercialization, and administration costs for sewerage, “without” Project ····················································· 3-217
Table 3.5.2-1 : Cost Components ··········································································· 3-219 Table 3.5.2-2 : Social intervention ewtimated cost Reference budget ···················· 3-224 Table 3.5.2-3 : Project Investment Costs ································································ 3-227 Table 3.5.2-4 : Project Investment Costs ································································ 3-228 Table 3.5.2-5 : Project Investment Schedule ·························································· 3-229 Table 3.5.2-6 : “with” Project situation – Unit cost by potable water
process ····························································································· 3-231 Table 3.5.2-7 : “With” Project situation - Unit costs per commercial and
administrative activity processes ······················································ 3-232

PREPARATORY SURVEY ON NORTH LIMA METROPOLITAN AREA WATER SUPPLY AND SEWERAGE OPTIMIZATION PROJECT (II)
FINAL REPORT
NIPPON KOEI CO.,LTD. - xix - NIPPON KOEI LAC CO.,LTD
Table 3.5.2-8 : “With” project situation - Unit costs per sewerage system activity processes ································································· 3-233
Table 3.5.2-9 : O&M Costs for water distribution in secondary networks of North Management Comas Office, “without” Project (Secondary Network) ····································································· 3-234
Table 3.5.2-10 : O&M Costs for water distribution in secondary networks of North Management Comas Office, “with” Project (Secondary Network) ····································································· 3-234
Table 3.5.2-11 : O&M Costs for secondary networks collection of North Management Comas Office - “without” Project (Wastewater Collection Secondary Network) ·································· 3-235
Table 3.5.2-12 : O&M Costs for secondary networks collection of North Management Comas Office - “with” Project (Wastewater Collection Secondary Network) ······················································· 3-235
Table 3.5.2-13 : Consumption, Demand “without” and “with” Project, and Reclaimed Water Volume ························································ 3-238
Table 3.5.2-14 : Production, distribution, commercialization, and administration costs for the “with” Project water supply system ······························································································ 3-239
Table 3.5.2-15 : Collection, commercialization, and administration costs for sewerage, “with” Project ···························································· 3-240
Table 3.5.2-16 : Production, distribution, commercialization, and administration costs for the “with” Project water supply system ······························································································ 3-241
Table 3.5.2-17 : Collection, commercialization, and administration costs for sewerage, “with” Project ···························································· 3-241
Table 3.5.2-18 : Summary of O&M Total Cost of the Water and Sewerage System “With” and “Without” Project ············································· 3-241
Table 3.5.2-19 : Summary of O&M Total Cost of the Water and Sewerage System “With” and “Without” Project ············································· 3-241
Table 3.5.2-20 : Additional Cost of Commercialization and Administration due to Reclaimed Water ································································· 3-241
Table 3.5.3-1 : Operation and Maintenance Incremental Cost of the Water Supply and Sewerage System ·························································· 3-246
Table 3.5.3-2 : Operation and Maintenance Incremental Cost of the Water Supply and Sewerage System ·························································· 3-247
PREPARATORY SURVEY ON NORTH LIMA METROPOLITAN AREA WATER SUPPLY AND SEWERAGE OPTIMIZATION PROJECT (II)
FINAL REPORT
NIPPON KOEI CO.,LTD. - xx - NIPPON KOEI LAC CO.,LTD
Table 3.5.3-3 : Detailed Incremental Cost (Saving) of O&M of the Water Supply and Sewerage System ·························································· 3-248
Table 3.5.3-4 : Detailed Incremental Cost (Saving) of Operation and Maintenance of the Water Supply and Sewerage System ················· 3-249
Table 3.5.4-1 : Package List of Secondary Network Works ··································· 3-251 Table 3.5.4-2 : Project Components of Package-A: General Works ······················· 3-252 Table 3.5.4-3 : Project Component of Package-B-1: General Works ····················· 3-252 Table 3.5.4-4 : Project Component of Package-C: O&M Equipment····················· 3-253 Table 3.6.2-1 : Consumption and Service Hours in Project Sectors ······················· 3-254 Table 3.6.2-2 : Price and Consumption ·································································· 3-259 Table 3.6.2-3 : Demand Without and With Project, and Reclaimed Water
Volume ····························································································· 3-262 Table 3.6.2-4 : Willingness to Pay for a Better Potable Water and
Sewerage Service ············································································· 3-265 Table 3.6.2-5 : Economic Benefits for Water Supply and Sewerage in the
Project ······························································································ 3-267 Table 3.7.3-1 : Economic Evaluation of Water Supply in the Project ···················· 3-271 Table 3.7.3-2 : Per Capita Investment in Sewerage Secondary Networks
and Connections ·············································································· 3-272 Table 3.7.3-3 : Economic Evaluation for Sewerage in the Project (Cost –
Effectiveness Index) ········································································ 3-273 Table 3.8.2-1 : Basic Data for Income Calculation, 1/2 ········································ 3-277 Table 3.8.2-1 : Basic Data for Income Calculation, 2/2 ········································ 3-277 Table 3.8.2-2 : Economic Evaluation for Basic Data for Income
Calculation, 1/2 ··············································································· 3-278 Table 3.8.2-2 : Economic Evaluation for Basic Data for Income
Calculation, 1/2 ··············································································· 3-279 Table 3.8.2-3 : Financial Evaluation for the Project, 1/2 ······································· 3-280 Table 3.8.2-3 : Financial Evaluation for the Project, 2/2 ······································· 3-281 Table 3.9.1-1 : Variation 1- Decrease of Benefits ·················································· 3-282 Table 3.9.1-2 : Variation 1- Increase of Costs ······················································· 3-282 Table 3.9.1-3 : Variation 1- Decrease of Beneficiaries and Increase of
Costs ······························································································· 3-283 Table 3.9.1-4 : Variation 1- Decrease in Revenue ················································· 3-284 Table 3.9.1-5 : Variation 1- Increase of Costs ························································ 3-284 Table 3.10.1-1 : Results of the Simulation ······························································· 3-284 Table 3.12.5-1 : Environmental Check List for Water Supply ·································· 3-297

PREPARATORY SURVEY ON NORTH LIMA METROPOLITAN AREA WATER SUPPLY AND SEWERAGE OPTIMIZATION PROJECT (II)
FINAL REPORT
NIPPON KOEI CO.,LTD. - xxi - NIPPON KOEI LAC CO.,LTD
Table 3.12.5-2 : Environmental Check List for Sewer Network ······························ 3-300 Table 3.12.7-1 : Environmental Impact Assessment Matrix ····································· 3-306 Table 3.12.7-2 : Environmental Mitigation Plan ······················································ 3-308 Table 3.12.7-3 : Necessary Considerations for Contractor toAsbestos
Cement Pipe Removal and Dispose ················································· 3-311 Table 3.12.7-4 : EMP Cost Estimates (Preliminary) ················································ 3-311 Table 3.14.4-1 : Duration of Works Construction and Equipment Supply ··············· 3-320 Table 3.14.6-1 : Condition of Pipe Installation and Rehabilitation Works ··············· 3-321 Table 3.14.6-2 : Physical and Financial Progress of the Project
Components ····················································································· 3-322 Table 3.14.6-3 : Physical Progress of the Project Components ································ 3-323 Table 3.15.4-1 : Project Funding Scheme by Source ··············································· 3-327 Table 3.15.4-2 : Project Funding Scheme by Cooperation Agency Sources ············ 3-328 Table 3.15.5-1 : JICA Loan Debt Service ······························································· 3-329 Table 3.15.5-2 : IBRD Loan Debt Service ······························································ 3-329 Table 3.15.5-3 : KfW Loan Debt Service ································································ 3-329 Table 3.16.1-1 : Log Frame Matrix ········································································· 3-330 Table 3.17.1-1 : Baseline for Project Impact Evaluation ········································· 3-332
List of Figures Figure 1.3.1-1 : Distributed Water Classification and Presumed Water Loss
Ratio in Demand Analysis ································································ 1-4 Figure 1.3.1-2 : Result of Water Demand Analysis for the Total Study Area ··········· 1-4 Figure 1.3.3-1 : Supply-Demand Analysis on Water Production ····························· 1-5 Figure 2.1.1-1 :Project Area of Lima Norte Water Supply and Sewerage
Optimization Project ········································································ 2-3 Figure 2.5.1-1 :Location of Study Area ··································································· 2-16 Figure 2.5.2-1 :Population and Its Increase Ratio in Lima and Callao ····················· 2-20 Figure 2.5.2-2 :Number of Migration of Lima and Callao ······································· 2-22 Figure 2.5.6-1 :Sectors with and without SEDAPAL Service-Survey
Application ······················································································ 2-49 Figure 2.5.6-2 :Monthly Family Incomes and Expenditures by Sector with
SEDAPAL Water Service ································································· 2-51 Figure 2.5.6-3 :Monthly Family Incomes and Expenditures by Sector
without SEDAPAL Water Service ···················································· 2-52
PREPARATORY SURVEY ON NORTH LIMA METROPOLITAN AREA WATER SUPPLY AND SEWERAGE OPTIMIZATION PROJECT (II)
FINAL REPORT
NIPPON KOEI CO.,LTD. - xxii - NIPPON KOEI LAC CO.,LTD
Figure 2.5.6-4 :Average Monthly Water Consumption and Payment by Sector in Areas with SEDAPAL Service ·········································· 2-55
Figure 2.5.6-5 :Main Perceived Water Service Problems in Areas with SEDAPAL Service ··········································································· 2-56
Figure 2.5.6-6 :Water Service Problems Observed Outside the Home in Areas with SEDAPAL Service ························································· 2-58
Figure 2.5.6-7 :Household Water Supply Source by District in Areas with SEDAPAL Service ··········································································· 2-59
Figure 2.5.6-8 :Water Service Problems Observed in the Home in Areas with SEDAPAL Service ··································································· 2-60
Figure 2.5.6-9 :Water Service Problems Observed Outside the Home in Areas without SEDAPAL Service ···················································· 2-61
Figure 2.5.6-10 :Perception of SEDAPAL Service ···················································· 2-62 Figure 2.5.6-11 :Rating of Service Quality of Water Supplied (Tap, Well, or
Tank Truck) ······················································································ 2-63 Figure 2.5.6-12 :Problems with Household Sewer Pipes in Areas with
SEDAPAL Service ·········································································· 2-64 Figure 2.5.6-13 :Sewage Service Problems Outside the Home in Areas with
SEDAPAL Service ·········································································· 2-65 Figure 2.5.6-14 :Elimination of Excreta in Areas with SEDAPAL Service ·············· 2-66 Figure 2.5.6-15 :Elimination of Waste Water in Areas without SEDAPAL
Service ···························································································· 2-67 Figure 2.5.6-16 :Problems with the Waste Disposal System Outside the
Home in Areas with SEDAPAL Service ·········································· 2-67 Figure 2.5.6-17 :Perception of Sewerage Service Provided by SEDAPAL ··············· 2-68 Figure 2.5.6-18 :General Perception of Sewerage System provided by
SEDAPAL ····················································································· 2-69 Figure 2.5.6-19 :Opinion about Payment for Water and Sewerage Service ·············· 2-70 Figure 2.5.6-20 :General Opinion about the Amount Paid for Existing Water
Service ····························································································· 2-70 Figure 2.5.6-21 :Accumulation of Additional WTP for Better Service ······················ 2-74 Figure 2.5.6-22 :Accumulation of Additional WTP for Better Service
(Comas 2) ························································································ 2-74 Figure 2.5.6-23 :Accumulation of Additional WTP for Better Service
(Comas 2) ························································································ 2-75 Figure 2.5.8-1 :Location of Water Treatment Plants in relation to the Study
Area ································································································· 2-83

PREPARATORY SURVEY ON NORTH LIMA METROPOLITAN AREA WATER SUPPLY AND SEWERAGE OPTIMIZATION PROJECT (II)
FINAL REPORT
NIPPON KOEI CO.,LTD. - xxiii - NIPPON KOEI LAC CO.,LTD
Figure 2.5.8-2 : Water Supply System in the Study Area ········································ 2-84 Figure 2.5.8-3 : Configuration of Current Water Supply System in the
Study Area ······················································································ 2-85 Figure 2.5.8-4 :Locations of Valve Pits at the Entrances of the Monitored
Sectors ··························································································· 2-88 Figure 2.5.8-5 : Water Flow at Entrances of Monitored Sectors ····························· 2-89 Figure 2.5.8-6 :Water Pressure at Entrances of Monitored Sectors Before
Pressure Control ············································································· 2-92 Figure 2.5.8-7 :Water Pressure at Entrances of Monitored Sectors After
Pressure Control ············································································· 2-93 Figure 2.5.8-8 :Water Pressure in the Secondary Networks Measured by
Portable Sensor ············································································· 2-94 Figure 2.5.8-9 :Incidents in Distribution Pipes ····················································· 2-97 Figure 2.5.8-10 : Incidents in Connection Pipes ····················································· 2-98 Figure 2.5.8-11 : Water Service Hours ··································································· 2-99 Figure 2.5.8-12 : Distribution Area of Huachipa WTP ············································ 2-103 Figure 2.5.8-13 : Plan for Main Trunk from Huachipa WTP ···································· 2-109 Figure 2.5.8-14 : Distribution of Pipes by Material ·················································· 2-134 Figure 2.5.8-15 :Distribution of Pipes by Age ·························································· 2-135 Figure 2.5.8-16 :Distribution of AC Pipes by Age ···················································· 2-136 Figure 2.5.8-17 :Distribution of PVC Pipe by Age ·················································· 2-137 Figure 2.5.8-18 : Increase of Accidents and Deterioration of Strength of AC
Pipe ································································································ 2-138 Figure 2.5.8-19 :Non Revenue Water Ration in Five Sectorized Area ······················ 2-139 Figure 2.5.8-20 :Works and Studies in Progress in the Study Area ···························· 2-146 Figure 2.5.8-21 :House Connections with or without Micrometers ··························· 2-149 Figure 2.5.8-22 :Planned Infrastructure for the Integration of SCADA
system ······························································································ 2-155 Figure 2.5.9-1 :Existing Drainage Area ·································································· 2-157 Figure 2.5.9-2 :Future Sewerage System ································································· 2-159 Figure 2.5.9-3 :Existing Primary Sewer and Drainage Sub- Areas ·························· 2-162 Figure 2.5.9-4 :Distribution of Sewerage Pipes in the Study Area, by Type
of Material ····················································································· 2-169 Figure 2.5.9-5 :On-going Sewerage Works and Studies in Progress in the
Stuey Area ······················································································ 2-170 Figure 2.5.9-6 : Secondary Sewerage Network in the Influence Area by
Type of Material ·············································································· 2-173

PREPARATORY SURVEY ON NORTH LIMA METROPOLITAN AREA WATER SUPPLY AND SEWERAGE OPTIMIZATION PROJECT (II)
FINAL REPORT
NIPPON KOEI CO.,LTD. - xxiv - NIPPON KOEI LAC CO.,LTD
Figure 2.5.9-7 :Distribution of Simple Concrete Pipes in the Influecnce Area by Age ···················································································· 2-175
Figure 2.5.9-8 :Location of Projects by Drainage Areas ·········································· 2-177 Figure 2.5.9-9 :Location of Evaluated Manholes in the Intervention Area,
by Degree of Corrosion ··································································· 2-180 Figure 2.5.9-10 :Inspection to Manholes with High H2S Level in the
Project Area ···················································································· 2-182 Figure 2.5.9-11 :Evaluation of H2S ········································································· 2-183 Figure 2.5.9-12 :Operational Incidents Involving Clogs, House Connection
Repairs and Deteriorations on Sewerage Secondary Networks ························································································ 2-187
Figure 2.5.9-13 :Flow Diagram for Collapses ························································· 2-189 Figure 2.5.9-14 :Operational Incidents Involving Collapse on Sewerage
Secondary Networks ······································································ 2-190 Figure 2.5.9-15 :Test Pits Location in the Project Area ············································ 2-195 Figure 2.5.9-16 :Collector rehabilitation in Sub Sector 85B-3 ·································· 2-199 Figure 2.5.10-1 :Categorization of Produced Water and Definition of NRW ············· 2-201 Figure 2.5.10-2 :Hourly Consumption of Monitored Sectors ································· 2-204 Figure 2.5.10-3 :NRW Ratio and Technical Loss Ratio of the Monitored
Sector ······························································································· 2-206 Figure 2.5.10-4 :Result of Analysis on NRW and Target of the Project ···················· 2-207 Figure 2.5.10-5 :Projected Hourly Consumption in Case of 20% of
Technical Loss ················································································ 2-209 Figure 2.5.10-6 :Projected Hourly Consumption in Case of 20% Technical
Loss and Number of Unit of Use (Domestic and Multi family) ·························································································· 2-209
Figure 2.5.12-1 :SEDAPAL’s S.A Overall Organization Chart July 2010 ·············· 2-236 Figure 2.5.14-1 :Cause - Effect Tree ······································································· 2-256 Figure 2.6-1 :Means and Goals Tree ···································································· 2-259 Figure 2.6-2 :Fundamental Means Tree ································································ 2-260 Figure 3.1.2-1 :Distribution Area of Huachipa WTP ············································· 3-2 Figure 3.1.2-2 : Influence Area of Huachipa WTP in the Study ····························· 3-3 Figure 3.1.2-3 : Behavior of the growth rates in Lima and Callao
Provinces ························································································ 3-15 Figure 3.1.2-4 : Category of Distributed Water and Presumed Ratio of
WaterLoss in Demand Analysis ····················································· 3-26 Figure 3.1.2-5 : Result of Water Demand Analysis for the Total Study Area ··········· 3-30

PREPARATORY SURVEY ON NORTH LIMA METROPOLITAN AREA WATER SUPPLY AND SEWERAGE OPTIMIZATION PROJECT (II)
FINAL REPORT
NIPPON KOEI CO.,LTD. - xxv - NIPPON KOEI LAC CO.,LTD
Figure 3.1.2-6 : Result of Water Demand Analysis for the Area of Influence ·························································································· 3-32
Figure 3.2.1-1 : Distribution Area of La Atarjea and Chillón WTPs ························ 3-55 Figure 3.2.2-1 : Intervention Area ··········································································· 3-70 Figure 3.3.1-1 : Supply–Demand Analysis on Water Production ····························· 3-74 Figure 3.3.1-2 : Alternatives for Water Distribution Area of Huachipa
WTP ································································································· 3-76 Figure 3.3.1-3 : Result of Supply-Demand Analysis after Modification of
Distribution Area (Option-1) ···························································· 3-78 Figure 3.4.1-1 : Failures and Causes of the Water Supply System,
and Technical Solutions to be Included in the Project ······················ 3-86 Figure 3.4.1-2 : Reduction of Technical Loss Volume by Renewal of
Secondary Networks or House Connections ···································· 3-89 Figure 3.4.1-3 : Reduction of NRW in the Four Cases ··········································· 3-90 Figure 3.4.1-4 : Estimation of Effect of the Project ················································ 3-92 Figure 3.4.2-1 : Structure of Distribution Network Proposed in the Perfil
and in Typical Japanese Case ·························································· 3-97 Figure 3.4.2-2 : Proposed Structure of Water Distribution Network in the
Study ······························································································ 3-100 Figure 3.4.2-3 :Modification of the Distribution Network in the Study ················· 3-101 Figure 3.4.3-1 : Division of Sectors and Sub-sectors in the Study ························· 3-104 Figure 3.4.3-2 : Modification of Sector Boundaries ··············································· 3-105 Figure 3.4.3-3 : Modification of Sector and Sub-sector Boundaries in Los
Olivos ····························································································· 3-106 Figure 3.4.3-4 : Modification of Sector and Sub-sector Boundaries in
Comas and Collique ········································································ 3-107 Figure 3.4.4-1 : Proposed Scheme of the Water Supply System ····························· 3-111 Figure 3.4.5-1 : Dynamic Analysis of Water Storage of the Reservoirs ·················· 3-121 Figure 3.4.5-2 : Typical Preliminary Design of Reservoir ······································ 3-124 Figure 3.4.5-3 : Reservoir Operation Plan ····························································· 3-125 Figure 3.4.5-4 : Locations of the Reservoirs and Pumping Stations in the
Project ···························································································· 3-129 Figure 3.4.6-1 : Concept of Network Pipe and Service Pipe ································· 3-130 Figure 3.4.6-2 : Procedure of Upgrading and Renewal Plan of Secondary
Networks ························································································ 3-131 Figure 3.4.6-3 : Determination of Pipes for Renewal ············································ 3-136

PREPARATORY SURVEY ON NORTH LIMA METROPOLITAN AREA WATER SUPPLY AND SEWERAGE OPTIMIZATION PROJECT (II)
FINAL REPORT
NIPPON KOEI CO.,LTD. - xxvi - NIPPON KOEI LAC CO.,LTD
Figure 3.4.6-4 : Definition of Water Supply Pipes to be Renewed ························ 3-138 Figure 3.4.6-5 : Pre-locators Configuration Scheme ··············································· 3-141 Figure 3.4.7-1 : Typical Connection Layout ························································· 3-145 Figure 3.4.8-1 : Well System Scheme ·································································· 3-150 Figure 3.4.8-2 : Locations of the Wells to be Improved and the Reservoirs
to be Connected to the Wells ························································· 3-151 Figure 3.4.10-1 : Sewerage Secondary Networks of Simple Concrete
Manholes and Test Pits in the Influence Area ·································· 3-159 Figure 3.5.4-1 : Packages of Secondary Network Works ········································· 3-250 Figure 3.6.2-1 : Demand Curve ··············································································· 3-261 Figure 3.6.2-2 : Consumption, Demand “With” and “Without” Project and
Reclaimed Water Volume ································································· 3-264 Figure 3.10.1-1 : Probable Distribution of the Social NPV ······································· 3-285 Figure 3.10.1-2 : Chart of the Sensitivity of the Variables ········································· 3-286 Figure 3.10.1-3 : Correlation of the Variables ··························································· 3-286 Figure 3.12.4-1 : Evaluation Procedure for Environmental Impact ··························· 3-295 Figure 3.13.1-1 : PROMESAL Flow Chart ······························································· 3-315 Figure 3.13.1-2 : Role of Actors for Project Implementation (Investment
Phase) ······························································································ 3-316 Figure 3.13.1-3 : Role of Actors for Project Implementation (Operation
Phase) ······························································································ 3-316 Figure 3.14.3-1 : Planned Schedule of Pre-Construction Stage ································· 3-319

PREPARATORY SURVEY ON
NORTH LIMA METROPOLITAN AREA
WATER SUPPLY AND SEWERAGE OPTIMIZATION PROJECT (II)
FINAL REPORT
NIPPON KOEI CO.,LTD. - xxvi - NIPPON KOEI LAC CO.,LTD
ABBREVIATIONS
AC Asbestos Cement
CEI Cost-Effectiveness Index
CSN Simple Standardized Concrete
DGPM General Directorate of Multi-Annual Programs in the Public Sector
DI Ductile Iron
DIGESA General Directorate for Environmental Health
DNS National Sanitation Directorate
EIA Environmental Impact Assessment
FOFO Gulvanizd Iron
F/S Feasibility Study
GSN North Services Services Management Office
HDPE High Density Polyethylene
IADB Inter-American Development Bank
IBRD International Bank for Reconstruction and Development
INEI National Statistics and Information Institute
IRR Internal Rate of Return
JFC Japan Finance Corporation
JICA Japan International Cooperation Agency
KfW Kreditanstalt für Wiederaufbau, KfW Bankengruppe
m.a.s.l. meters above sea level
MEF Ministry of Economy and Finances
MPO Master Plan for Optimization
MVCS Ministry of Housing, Construction, and Sanitation
MWV Marginal Water Value
NDPD National Directorate of Public Debt
NPV Net Present Value
NRW Non-Revenue Water
O&M Operation and Maintenance
ODA Official Development Assistance
OMA Office for Environmental Affairs
OPI Programming and Investments Office
PAHO Panamerican Health Organization
PAPT Water for All Program
PIP Public Investment Projects
PROMESAL Program of Sanitation Improvement in Marginal Areas of Lima
PVC Polyvinyl chloride
QMD Daily Maximum Quantity
QMH Hourly Maximum Quantity
PVC Present Value of Costs
RNE National Sanitation Standard
SCADA Supervisory Control and Data Acquisition
SEDAPAL Lima Water and Sanitation Service
SIAC Integrated Commercial Management System
SNIP National Public Investment System
SUNASS National Sanitation Services Superintendency
VAT Value Added Tax
WACC Weighted Average Costo of Capital
PREPARATORY SURVEY ON
NORTH LIMA METROPOLITAN AREA
WATER SUPPLY AND SEWERAGE OPTIMIZATION PROJECT (II)
FINAL REPORT
NIPPON KOEI CO.,LTD. - xxvii - NIPPON KOEI LAC CO.,LTD
WPI Wholesale Price Index
WTP Willingness to Pay
WTP Water Treatment Plant
WWTP Waste Water Treatment Plant

FEASIBILITY STUDY ON
NORTH LIMA METROPOLITAN AREA
WATER SUPPLY AND SEWERAGE OPTIMIZATION PROJECT (II)
FINAL REPORT
NIPPON KOEI CO.,LTD. 1-1 NIPPON KOEI LAC CO.,LTD
CHAPTER 1 EXECUTIVE SUMMARY
1.1 Name of the Project
“Optimization of the Infrastructure of the Water Supply and Sewerage Systems: Sectorization, Rehabilitation of Networks and Updating of the Cadastre of the North Service Management Office – Area of Influence of the Huachipa Plant – Areas of Drainage of the Sewers: Oquendo, Sinchi Roca, Puente Piedra and Sectors 83, 84, 85 and 212”
1.2 Project Purpose
(1) Realize Continuous Water Supply for Current and Future Demand in the Project Area
• To guarantee the measures to convey water from the Huachipa WTP, that has just started its operation, to the Project area through primary pipes.
• To provide the measures to convey water from the existing wells for emergency purpose in draught season to the Project area through primary pipes (gravity pipes and/or pumping lines).
(2) Improve Operation and Control of Water Supply System
• To sectorize the water supply system in the Project Area with macrometers and pressure control values for better operation.
• To bring the water supply facilities of the Project area under SCADA system for efficient operation and exact control.
• To rehabilitate reservoirs in order to bring them into proper working condition for better control of water pressure.
• To replace water supply pipes not having enough capacity to meet future water demand.
(3) Realize the Target of 25 % for NRW Ratio
• To replace inappropriate water supply distribution pipes (due to age and material damaging) and the pipes that certainty are causing water leakage in order to reduce technical water loss.
• To replace house connections in order to reduce technical water loss mainly caused by water leakage and commercial water loss mainly caused by illegal consumption.
• To install micrometers for exact registration of water consumption for exact and fair tariff collection and monitoring of NRW.
(4) Improve Service Level of Sewerage
• To identify and replace sewers those are in bad condition in order to reduce clogs and collapses.
• To replace sewer pipes not having enough capacity to meet future demand after the construction of Taboada Wastewater Treatment Plant
(5) Improve the Operation and Maintenance Management of SEDAPAL
• To provide necessary equipment for operation and maintenance of water supply and sewerage for improved facilities´ maintenance of SEDAPAL.
• To improve cadastre system of SEDAPAL, in the study area, for more efficient and preventive maintenance work.

FEASIBILITY STUDY ON
NORTH LIMA METROPOLITAN AREA
WATER SUPPLY AND SEWERAGE OPTIMIZATION PROJECT (II)
FINAL REPORT
NIPPON KOEI CO.,LTD. 1-2 NIPPON KOEI LAC CO.,LTD
• To establish a new team for planning of preventive maintenance to ensure a long-term vision and policy of SEDAPAL’s facility maintenance utilizing the improved and updated cadastre system; the team should have the power to request sufficient budget for the implementation of maintenance works in order to maintain the proper function of the existing facilities.
1.3 Supply – Demand Balance of the Project
1.3.1 Demand Analysis
Future demand is analyzed for each sub-sector. It is summarized in two ways: i) water demand of the total study area, and ii) water demand in the water distribution area of the Huachipa Water Treatment Plant (hereinafter “Area of Influence”).
Table 1.3.1-1: Target Sectors of the Analysis
District Sectors included in the
Influence Area*1
Sectors not included in the
Influence Area*1
Callao 259 256, (258)*2
Ventanilla - (260, 261, 262, 263, 264, 265, 266)*2
Carabayllo 350, 351 -
Comas 345, 346, 347, 348A, 348B, 349A, 349B
-
Los Olivos 83A, 83B, 84A, 84B, 85A, 85B, 85C
-
Puente Piedra 368A, 368B, 369A, 369B, 370
361, 368B, 369B, 370
S.M. de Porres 212A, 212B, 213 (251, 252)*2, 253, (254, 257)*2, (255)*2
Total Number 22 19
*1: Some original sectors are proposed to be divided into new sectors in the Study. *2: Sectors without existing networks Source: JICA Study Team
The total water demand for the influence area of the Project is shown in Table 1.3.1-2
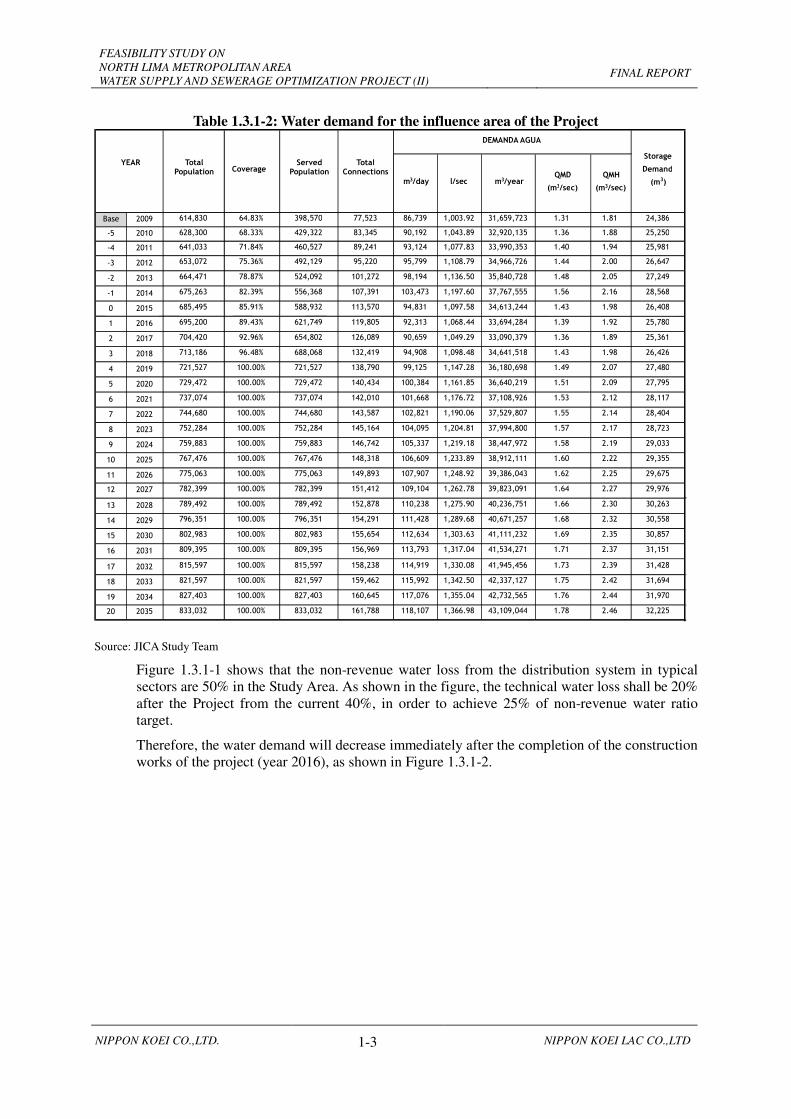
FEASIBILITY STUDY ON
NORTH LIMA METROPOLITAN AREA
WATER SUPPLY AND SEWERAGE OPTIMIZATION PROJECT (II)
FINAL REPORT
NIPPON KOEI CO.,LTD. 1-3 NIPPON KOEI LAC CO.,LTD
Table 1.3.1-2: Water demand for the influence area of the Project
Source: JICA Study Team
Figure 1.3.1-1 shows that the non-revenue water loss from the distribution system in typical sectors are 50% in the Study Area. As shown in the figure, the technical water loss shall be 20% after the Project from the current 40%, in order to achieve 25% of non-revenue water ratio target.
Therefore, the water demand will decrease immediately after the completion of the construction works of the project (year 2016), as shown in Figure 1.3.1-2.
Base 2009 614,830 64.83% 398,570 77,523 86,739 1,003.92 31,659,723 1.31 1.81 24,386 -5 2010 628,300 68.33% 429,322 83,345 90,192 1,043.89 32,920,135 1.36 1.88 25,250 -4 2011 641,033 71.84% 460,527 89,241 93,124 1,077.83 33,990,353 1.40 1.94 25,981 -3 2012 653,072 75.36% 492,129 95,220 95,799 1,108.79 34,966,726 1.44 2.00 26,647 -2 2013 664,471 78.87% 524,092 101,272 98,194 1,136.50 35,840,728 1.48 2.05 27,249 -1 2014 675,263 82.39% 556,368 107,391 103,473 1,197.60 37,767,555 1.56 2.16 28,568 0 2015 685,495 85.91% 588,932 113,570 94,831 1,097.58 34,613,244 1.43 1.98 26,408 1 2016 695,200 89.43% 621,749 119,805 92,313 1,068.44 33,694,284 1.39 1.92 25,780 2 2017 704,420 92.96% 654,802 126,089 90,659 1,049.29 33,090,379 1.36 1.89 25,361 3 2018 713,186 96.48% 688,068 132,419 94,908 1,098.48 34,641,518 1.43 1.98 26,426 4 2019 721,527 100.00% 721,527 138,790 99,125 1,147.28 36,180,698 1.49 2.07 27,480 5 2020 729,472 100.00% 729,472 140,434 100,384 1,161.85 36,640,219 1.51 2.09 27,795 6 2021 737,074 100.00% 737,074 142,010 101,668 1,176.72 37,108,926 1.53 2.12 28,117 7 2022 744,680 100.00% 744,680 143,587 102,821 1,190.06 37,529,807 1.55 2.14 28,404 8 2023 752,284 100.00% 752,284 145,164 104,095 1,204.81 37,994,800 1.57 2.17 28,723 9 2024 759,883 100.00% 759,883 146,742 105,337 1,219.18 38,447,972 1.58 2.19 29,033 10 2025 767,476 100.00% 767,476 148,318 106,609 1,233.89 38,912,111 1.60 2.22 29,355 11 2026 775,063 100.00% 775,063 149,893 107,907 1,248.92 39,386,043 1.62 2.25 29,675 12 2027 782,399 100.00% 782,399 151,412 109,104 1,262.78 39,823,091 1.64 2.27 29,976 13 2028 789,492 100.00% 789,492 152,878 110,238 1,275.90 40,236,751 1.66 2.30 30,263 14 2029 796,351 100.00% 796,351 154,291 111,428 1,289.68 40,671,257 1.68 2.32 30,558 15 2030 802,983 100.00% 802,983 155,654 112,634 1,303.63 41,111,232 1.69 2.35 30,857 16 2031 809,395 100.00% 809,395 156,969 113,793 1,317.04 41,534,271 1.71 2.37 31,151 17 2032 815,597 100.00% 815,597 158,238 114,919 1,330.08 41,945,456 1.73 2.39 31,428 18 2033 821,597 100.00% 821,597 159,462 115,992 1,342.50 42,337,127 1.75 2.42 31,694 19 2034 827,403 100.00% 827,403 160,645 117,076 1,355.04 42,732,565 1.76 2.44 31,970 20 2035 833,032 100.00% 833,032 161,788 118,107 1,366.98 43,109,044 1.78 2.46 32,225
Total Connections
QMH
(m 3/sec)m3/day l/sec m3/year QMD
(m 3/sec)
YEAR
Total Population
Coverage Served
Population
Storage
Demand
(m3)
DEMANDA AGUA

FEASIBILITY STUDY ON
NORTH LIMA METROPOLITAN AREA
WATER SUPPLY AND SEWERAGE OPTIMIZATION PROJECT (II)
FINAL REPORT
NIPPON KOEI CO.,LTD. 1-4 NIPPON KOEI LAC CO.,LTD
PresentAfter
Project
Metered Legal Revenue
Consumption35% 75%
Non-metered Legal Revenue
Consumption15% 0%
Legal Non-revenue
Consumption
Metered&Non-metered Legal
Non-revenue Consumption
Error of Meter
Illegal Consumption
Loss in Distribution 35-40% 20%
Loss at Connections
and Meters
Loss at Reservoirs
and Others
Rev
enu
e W
ater
Co
mm
erci
al
Lo
ss
No
n-r
even
ue
Wat
er
Wat
er L
oss
Non-technical Loss
Technical Loss
Tec
hn
ical
Lo
ss
10-15% 5%
To
tal
Pro
du
ctio
n Leg
al C
on
sum
pti
on
Legal Revenue
Consumption
Rev
enu
e W
ater
[Asssumption of Loss]
Before Project: 40%
After Project: 20%
NRW: 50% NRW: 25%
1/ water loss assumed in the demand analysis of the Project (in case of sub-sector it is 50% ANF ratio) Source: JICA Study Team
Figure 1.3.1-1: Distributed Water Classification and Presumed Water Loss Ratio
in Demand Analysis
0.00
0.50
1.00
1.50
2.00
2.50
3.00
3.50
2010 2015 2020 2025 2030 2035
Year
Dai
ly M
axim
um
Vo
lum
e (m
3/s
)
Demanda de la Área Total del Estudio
Source: JICA Study Team
Figure 1.3.1-2: Water Demand Analysis for the Influence Area with the Project
The amount of sewage discharged into the sewerage networks is assumed to be 80% of the water demand, according to the National Sanitation Standards (Reglamento Nacional de Estructuras, or RNE); this is the standard technical parameter that will be kept same throughout the project horizon.
Decreased by reduction
of water loss
Completion of Construction: 2015

FEASIBILITY STUDY ON
NORTH LIMA METROPOLITAN AREA
WATER SUPPLY AND SEWERAGE OPTIMIZATION PROJECT (II)
FINAL REPORT
NIPPON KOEI CO.,LTD. 1-5 NIPPON KOEI LAC CO.,LTD
1.3.2 Supply Analysis
The total supply of Lima Norte I and Lima Norte II is 2.9m3/s, coming from Huachipa WTP as shown in Table 1.3.2-1.
Table 1.3.2-1: Conditions of Supply Analysis
Conditions Supply Remarks
Production for Lima Norte Area
Huachipa WTP
2.9 m3/s
La Atarjea WTP
- To be considered if the supply of the Huachipa WTP is not enough
Chillón WTP
-
Wells 0.0 m3/s Not to be counted as usual water source; for emergency purposes only.
Supply to Lima Norte I from Huachipa WTP
1.31 m3/s in 2030
See Table 3.2.1-2
Source: JICA Study Team
1.3.3 Supply – Demand Balance
Production
Supply-Demand analysis of water requirement can be found by comparing water production with the water demand in the Area of Influence. After detecting the demand and balance, water will be supplied from other WTP to the Project Area of Influence. In Figure 1.3.3-1 is shown the supply-demand analysis of water production.
0.00
0.50
1.00
1.50
2.00
2.50
3.00
2010 2015 2020 2025 2030 2035Year
Dai
ly M
axim
um
Vo
lum
e (m3
/s)
Oferta/Demanda de Lima Norte I from Huachipa
Oferta de Lima Norte II from Huachipa
Demanda con Proyect (Perdidas = 20%)
Source: JICA Study Team
Figure 3.3.1-1: Supply–Demand Analysis on Water Production
Deficit from the Huachipa WTP to the Area of Influence will be 0.24m3/s in 2035. After evaluation of three options conceived, the recommended option (option 1)suggested to exclude Sectors 83A, 83B, 84B, 212A, 212B, and 213 (total water demand is 0.4m3/s in 2035) and

FEASIBILITY STUDY ON
NORTH LIMA METROPOLITAN AREA
WATER SUPPLY AND SEWERAGE OPTIMIZATION PROJECT (II)
FINAL REPORT
NIPPON KOEI CO.,LTD. 1-6 NIPPON KOEI LAC CO.,LTD
transfer them to the La Atarjea WTP distribution area. The water balance under this option is presented in Table 1.3.3-1.
Table 1.3.3-1: Supply after Modification of Distribution Area of the Influence Area
Year
Demand
(m3/s) Supply (m3/s)
Deficit (m3/s) Demand
of Lima
North II
Huachipa WPP Atarjea WPP Total
Supply to
Lima North
II
Supply to
Lima North
Supply to
Lima North I
Supply to
Lima North II
Supply to
Lima North II
Base 2009 1.31 2.90 1.00 1.90 0.00 1.90 -
0 2015 1.43 2.90 1.07 1.83 0.40 2.23 0.80
1 2016 1.39 2.90 1.09 1.81 0.40 2.21 0.82
5 2020 1.51 2.90 1.15 1.75 0.40 2.15 0.64
10 2025 1.60 2.90 1.23 1.67 0.40 2.07 0.47
15 2030 1.69 2.90 1.31 1.59 0.40 1.99 0.30
20 2035 1.78 2.90 1.36 1.54 0.40 1.94 0.16
Source: JICA Study Team
Reinforcement matrix (Huachipa Los olivos)
Water offer for the northern Lima area (Lima Norte I and Lima Norte II projects) will be assured via a service optimization, by reducing the NAFW (Non – accounted for water) indicator (physical losses), thus, the saved water will be used to cover the future demand under the same current source conditions. However, according to SEDAPAL’s Master Plan, there are two source increase projects: (i) the Chillón River source will be enhanced via a dam that would store water in high water (rainy) season for its later use during the low water (dry) season, and (ii) the Rímac River source will be enhanced via water transfer from the Mantaro River source as a supplement to the Marca I and III projects.
In spite of this , the vulnerability analysis shows that the occurence of a failure in one of the water treatment plants or in the relevant facilities would endanger the water supply for the northern area (including the Lima Norte II project); therefore, it is necessary that SEDAPAL has viable alternatives for a probable rationing management.
Subsequently, it is necessary that the Northern Branch main trunks are interconnected to the Atarjea, Los Olivos, and Chillón – Comas main trunks; therefore, a reinforced distribution backbone interconnecting the main trunks could be built.
Storage in Reservoirs
The supply-demand analysis of reservoir storage can be found by comparing reservoir capacity and required volume of storage for each sub-sector in the final year of the design period, which is 2035. Table 1.3.3-2 shows the result of the analysis which indicates that the capacities of reservoirs are not enough for seven sub-sectors.

FEASIBILITY STUDY ON
NORTH LIMA METROPOLITAN AREA
WATER SUPPLY AND SEWERAGE OPTIMIZATION PROJECT (II)
FINAL REPORT
NIPPON KOEI CO.,LTD. 1-7 NIPPON KOEI LAC CO.,LTD
Table 1.3.3-2: Supply-Demand Analysis for Reservoir Storage
Subsector Reservoir
Suplí-Demand Balance in 2035
Evaluation Demand
(m3)
Suplí
(m3)
Deficit
(m3)
83A-1 Villa Sol R-1 516 1,300 784 OK
83A-2 Villa del Norte R-1 910 1,800 890 OK
83B-1 Parque del Naranja R-1 465 1,400 935 OK
83B-2 Cueto Fernandini R-1 1,370 1,500 130 OK
84A-1 Olivos de Pro R-1 962 1,500 538 OK
84A-2 Programa Confraternidad R-2 664 1,600 936 OK
84B-1 Programa Confraternidad R-1 863 1,600 737 OK
84B-2 Comite Aposte 413 500 87 OK
85A Puerta de Pro R-1 728 1,100 372 OK
85B-1 Rio Santa R-1 536 570 34 OK
85B-2 Pro 2,055 1,400 -655 NG
85B-3 Santa Luisa R-1 301 500 199 OK
85C Pro 638 500 -138 NG
212A-1 Virgin de las Nieves R-4 839 1,500 661 OK
212A-2 Virgin del Rosario R-1 534 1,200 666 OK
212B-1 Rosario del Norte R-3 427 1,200 773 OK
212B-2 Jazmines de Naranja R-2 383 1,200 817 OK
213-1 Vipol Naranjal R-1 783 1,900 1,117 OK
213-2 Cerro eo Choclo R-2 62 100 38 OK
213-3 Cerro eo Choclo R-1 75 100 25 OK
259 Márquez R-522 744 1,200 456 OK
346-1 El Manantial R-1, R-2 234 2,200 1,966 OK
346-2 El Pinar R-1 592 1,200 608 OK
347-1 San Felipe R-1 550 670 120 OK
347-2 LA Alborada R-2, R-1 540 2,400 1,860 OK
348A Collique R-1 352 1,100 748 OK
348B-1 Collique R-2 624 1,500 876 OK
348B-2 RE-01 103 100 -3 NG
349A-1 Collique R-3 608 1,100 492 OK
349A-2 Nueva Esperanza R-1 205 400 195 OK
349A-3 Collique R-4 354 1,000 646 OK
349B-1 Collique R-5 309 800 491 OK
349B-2 Collique R-6 375 800 425 OK
349B-3 Collique R-7, R-8 283 650 367 OK
350-1 Santa Isabel R-1 1,411 1,400 -11 NG
350-2 Santa Isabel R-2 1,408 1,500 92 OK
351-1 Los Angeles R-1 355 400 45 OK
351-2 Los Angeles R-2, R-3 255 250 -5 NG
351-3 Los Angeles R-4 83 100 17 OK
361 La Canpitania Parma Gallinazo PR-1
1,085 1,000 -85 OK
368A-1 RPA-6 970 2,000 1,030 OK
368A-2 RPA-1 199 500 301 OK
368B RPA 1,300 2,650 1,350 OK
369A RPA-7 La Ensenada 989 3,000 2,011 OK
369B Laderas del Chillon 1,256 1,050 -206 NG
370 Shangrila R-1 CR-128 725 1,000 275 OK
Source: JICA Study Team

FEASIBILITY STUDY ON
NORTH LIMA METROPOLITAN AREA
WATER SUPPLY AND SEWERAGE OPTIMIZATION PROJECT (II)
FINAL REPORT
NIPPON KOEI CO.,LTD. 1-8 NIPPON KOEI LAC CO.,LTD
Primary and Secondary Networks
Table 1.3-3-3 shows supply – demand balance of secondary networks which have deficits. Its implementation is required in present Project.
Table 1.3.3-3: Supply-Demand Balance in Secondary Networks
(Km)
SSector Demand Supply Balance
83 A 34.12 15.41 18.71
83 B 49.28 19.07 30.21
84 A 60.90 49.27 11.63
84 B 45.78 33.02 12.76
85 A 18.89 13.59 5.30
85 B 26.81 15.21 11.60
85 C 18.64 6.48 12.16
212 A 53.39 47.06 6.33
212 B 29.11 26.55 2.56
213 41.09 32.77 8.32
259 16.06 12.19 3.87
345 13.58 13.37 0.21
346 26.84 24.07 2.77
347 53.09 47.89 5.20
348 A 8.10 5.85 2.25
348 B 22.04 16.62 5.42
349 A 31.47 17.46 14.01
349 B 28.33 14.84 13.49
350 78.17 21.32 56.85
351 7.07 6.08 0.99
368 A 29.13 26.81 2.32
369 A 26.77 25.21 1.56
Total 718.66 490.14 228.52
Source: JICA Study Team
Secondary Collectors
Supply – demand balance for sewerage is shown in Table 1.3.3-4 which has deficit. Its implementation is required in present Project.

FEASIBILITY STUDY ON
NORTH LIMA METROPOLITAN AREA
WATER SUPPLY AND SEWERAGE OPTIMIZATION PROJECT (II)
FINAL REPORT
NIPPON KOEI CO.,LTD. 1-9 NIPPON KOEI LAC CO.,LTD
Table 1.3.3-4: Supply-Demand Balance for Sewerage
in the Project Area
Drainage area Demand of pipes
(Km)
Supply of pipes
in good condition
(Km)
Balance
(Km)
A16 7.52 7.52
A18 11.53 11.53
A19 5.73 5.73
AD-0 1.70 1.70
AD-01B 0.95 0.95
AD-A1 30.31 20.84 9.47
AD-A2 24.16 21.22 2.94
AD-AG1 4.68 3.72 0.96
AD-AG2 29.91 6.04 23.87
AD-AG3 12.13 1.33 10.80
AD-AG4 26.44 14.39 12.05
ADC-1 10.08 8.57 1.51
ADC-2 13.52 11.50 2.02
ADC-3 4.97 4.22 0.75
ADC-4 6.91 5.87 1.04
ADC-5 13.70 11.65 2.05
ADC-6 11.38 9.67 1.71
AD-CA1 8.80 8.80
AD-CA3 0.82 0.82
AD-CH1 32.03 10.28 21.75
AD-CH2 12.58 6.57 6.01
AD-CH3 21.88 2.30 19.58
AD-CH4 30.87 30.87
AD-CO1 20.84 2.85 17.99
AD-CO2 26.83 23.58 3.25
AD-M1 13.32 7.45 5.87
AD-N1 24.57 7.43 17.14
AD-N2 23.53 3.28 20.25
AD-P2 0.46 0.46
AD-PL1 22.18 18.85 3.33
AD-PL2 22.59 19.57 3.02
AD-R1 14.81 2.32 12.49
AD-R2 17.36 2.57 14.79
AD-T1 14.54 4.57 9.97
AD-T2 6.61 6.26 0.35
AD-T3 0.04 0.03 0.01
AD-T4 12.54 6.35 6.19
AD-T5 10.06 5.03 5.03
AD-T6 2.61 1.31 1.30
PT1 22.99 22.99
PT2 6.59 6.59
PT3 13.00 13.00
PT4 11.70 11.70
PT5 8.78 8.78
PT6 25.44 25.44
PT7 7.54 7.54
SA-57 0.03 0.03
Total 651.56 414.07 237.49
Source: JICA Study Team
1.4 Technical description of the project
1.4.1 Beneficiaries
Project’s area of influence is framed within the boundaries of the Comas, Carabyllo, Los Olivos, Puente Piedra, San Martin de Porres, Callao, and Ventanilla districts.
Total population in the Study Area is 622,650, and population in the area of influence or
FEASIBILITY STUDY ON
NORTH LIMA METROPOLITAN AREA
WATER SUPPLY AND SEWERAGE OPTIMIZATION PROJECT (II)
FINAL REPORT
NIPPON KOEI CO.,LTD. 1-10 NIPPON KOEI LAC CO.,LTD
benefited population with water supply service is 398,570 in the “base” year (2009); served population (89.4 %) in year “1” (2016) is projected to be 621,749 (119,805 connections.)
Based on the diagnostics of the current water supply and sewerage systems, only 64 % of the population in the entire study area and 64.8 % of the population in the study’s area of influence, have water supply services.
1.4.2 Diagnosis
SEDAPAL has two water treatment plants, which are the La Atarjea Water Treatment Plant (La Atarjea WTP) and the Chillón Water Treatment Plant (Chillón WTP).
At present, the area with existing network within the Study Area is receiving water supply from the two WTPs mentioned above and also from the wells. Water distribution system from La Atarjea WTP is mainly supplying water to central and southern part of the Study area, which includes the districts of Callao, Los Olivos and San Martín de Porres. The water distribution system from Chillón WTP, on the other hand, is mainly supplying water to the northern part of the Study area, which includes the districts of Comas, Carabayllo and Puente Piedra. Besides, both distribution networks are interconnected each other in order to balance the production in the case some of them is not enough.
In this Study, 23 wells were identified that can be used after rehabilitation, in the event of amajor drought. This selection is based on the closeness of these wells to the reservoirs to be rehabilitated. From these 23 wells, 12 have complete pumping equipment, 5 have partial pumping equipment, and 6 have no equipment at all. Likewise, it is noticed that 3 wells are operating, 10 are used as reserve or emergency backup, and 10 wells are not operating due to their low quality water production.
In the study area, 26 of all 41 sectors have existing secondary water supply networks, and these are located in the Comas, Carabayllo, San Martín de Porres, Los Olivos, and Callao districts. Elevations in these areas range between 5.00 m.a.s.l. and 565 m.a.s.l. Total length of secondary networks in the study area is 773.45 km (between DN 50 mm and DN 315 mm.) There are four (4) types of pipes according to their materials, namely: Asbestos cement (AC), steel, ductile iron (FoFo) and Vinyl polychloride (PVC.). Prevailing materials are AC (46.73 %) and PVC (53.10 %). Out of all pipes, 12.9 % are over 25 years old, and 34. 6 % are less than 10 years old.
Secondary sewerage networks in the study area are made up of approximately 652 km of pipes with diameters ranging between 110 and 315 mm. Pipe materials are basically simple or plain concrete (67.7 %) and PVC (32.2 %). It must be pointed out that PVC pipes were not installed until year 2000 (so they are around 10 years old); simple concrete pipes are older, with ages ranging between 10 and 50 years old.
Problems in the water supply system
Based on the water supply and sewerage service diagnoses, current service rendering conditions within the project scope have found to show some deficiencies, as a result of the following problems:
(1) High Non Revenue Water Ratio
• The non-revenue water ratio in the entire Lima North Area is 50%. These ratios are much higher than the other areas of Lima, which are 35.1% in the Central Lima Area and 27.5 % in the South Lima Area.
• Within the non-revenue water ratio (50%), 40% is estimated to be the technical loss and the remaining 10% is the commercial loss ratio.
• In order to reduce the NRW ratio to 25%, it will be necessary to reduce the technical loss
FEASIBILITY STUDY ON
NORTH LIMA METROPOLITAN AREA
WATER SUPPLY AND SEWERAGE OPTIMIZATION PROJECT (II)
FINAL REPORT
NIPPON KOEI CO.,LTD. 1-11 NIPPON KOEI LAC CO.,LTD
ratio to 20% and the commercial loss ratio to 5%.
(2) Many Incidents
• Incidents in distribution networks and house connections, such as water leakage to the ground and settlement of pavement are reported.
(3) Non Continuous Water Supply Service
• There are some areas where 24-hour continuous water supply service has not been realized, such as sectors 348 and 349 (Comas) where the service continuity is between 3 and 7 hours, and for sector 259 (Márquez) the service hours are only 12.
Causes of mentioned problems of the water supply services are explained as below:
• Water pressures in primary networks tend to be continuously very high in Los Olivos, which can cause damage on pipe and water leakage.
• In some areas, water pressures in secondary networks are also too high, even in the sectors with pressure control valves; this is caused by the high pressure of primary networks.
• Existing water treatment plants (WTPs) cannot always satisfy the demand because the production of the WTPs is reduced significantly in the dry season.
• Electromechanical equipment of reservoirs and pumping stations are not operating properly, besides, some of them are out of service.
• Many of the 23 wells to be used for emergency purposes do not have pumping equipment or are not equipped required for suitable operation.
• Only 11 original sectors have valve pits for control of inflow to the sectors. In addition, only five of them can be controlled or monitored automatically, which is not sufficient for proper operation of the water supply system.
• There are some pipes with unsuitable pipe materials such as steel pipe, galvanized iron pipe and a type of PVC pipe (referred as “ITINTEC”).
• Some pipes are not satisfying the technical requirements of minimum earth cover, supporting bed, compaction and backfilling.
• Some pipes in Collique are seriously clogged by sediments derived from groundwater.
• AC pipes, which account for 47% of the total pipe length, may start to cause many incidents in the future, as 50% of them were installed more than 20 years ago.
• Many incidents that result in water leakage occur in house connections, especially at the corporation with the distribution pipes.
• None of the reservoirs have any equipment required for SCADA operation. Currently, all valves are manually operated.
• None of the wells have any equipment required for SCADA operation. Power panel boards are in very poor conditions: they lack electronic starters with speed variations. Some of the wells have incomplete panel boards with old technology that lacks Ethernet communications. All valves are manually operated.
Problems in the Sewerage System
The major problems identified for the secondary sewers are:
• Large numbers of incidents like clogs and collapses have been recorded in recent years

FEASIBILITY STUDY ON
NORTH LIMA METROPOLITAN AREA
WATER SUPPLY AND SEWERAGE OPTIMIZATION PROJECT (II)
FINAL REPORT
NIPPON KOEI CO.,LTD. 1-12 NIPPON KOEI LAC CO.,LTD
• Hydro Jet cleaning equipment could not be used for maintenance in some areas, because deteriorated pipes are easy to be broken by high pressure water flow.
The causes of above problems are identified as below:
• Some simple concrete pipes are very old; therefore, their life spam has already been completed.
• Evidence of serious corrosion in highest zones of the study areas was found.
• Visual inspection of pipes shows medium to serious damages in several areas.
• H2S gas in most of sampled manholes was found; existence of gas is directly related to decomposition of the pipe.
• In some cases manhole caps are missing.
• Low slope inclination causes the flow slowing down, waste water increase and the production of corrosive gas, consequently pipe decomposition.
• Besides, pipes damage caused by aging, pipes have been damaged more than expected because of lack of preventive maintenance (at the present, only corrective maintenance has been carrying out).
1.4.3 Alternative of Solution
(1) General works on the water supply system
Primary networks
Primary pipes shall be designed so that the Study Area can receive water supply from the Huachipa WTP and supply to the proposed sectors and sub-sectors.
Table 1.4.3-1 shows the construction items proposed for the primary networks (gravity pressure and pumping lines) to offer suitable conditions for water transportation from the Huachipa WTP to the project area through primary pipes.

FEASIBILITY STUDY ON
NORTH LIMA METROPOLITAN AREA
WATER SUPPLY AND SEWERAGE OPTIMIZATION PROJECT (II)
FINAL REPORT
NIPPON KOEI CO.,LTD. 1-13 NIPPON KOEI LAC CO.,LTD
Table 1.4.3-1: Quantity of Construction Works in the Primary Network
Item Units Quantity Remarks
Gravity Pipes (primary)
DN 700 mm m 1,538.49
Pipes are DI because of its
higher strength than PVC
DN 450 mm m 744.83
DN 400 mm m 3,148.97
DN 350 mm m 1,595.11
DN 300 mm m 963.37
DN 250 mm m 6,358.14
DN 200 mm m 6,860.69
DN 150 mm m 2,196.35
SUB TOTAL m 23,405.95
Pumping lines (from wells to reservoirs)
DN 150 mm. m 5,338.05
DN 200 mm m 8,042.23
DN 250 mm m 2,823.64
DN 300 mm m 937.49
SUB TOTAL m 17,141.41
TOTAL 40,547.36
Valve pits
DN 200-700 mm Units 0 Valves for sectors are to be installed at the reservoirs (valves for sector)
Valve pits
DN 300 mm Units 14 3 sluice valves in each pit (pressure reduction)
Air valve DN 50-150 mm Units 40
Purge valve DN 100-150 mm Units 25
Source: JICA Study Team
Reservoirs and pumping stations
Target rehabilitation and upgrading works include 27 reservoirs, 3 pumping stations locating beside the reservoirs and 1 independent pumping station. Among the 3 reservoirs with pumping stations, though 2 reservoirs have already been rehabilitated by SEDAPAL, but the pumping stations still need to be rehabilitated.
Table 1.4.3-2 shows the construction works for the reservoirs and pumping stations. Table 1.4.3-3 shows the list of reservoirs and pumping stations.
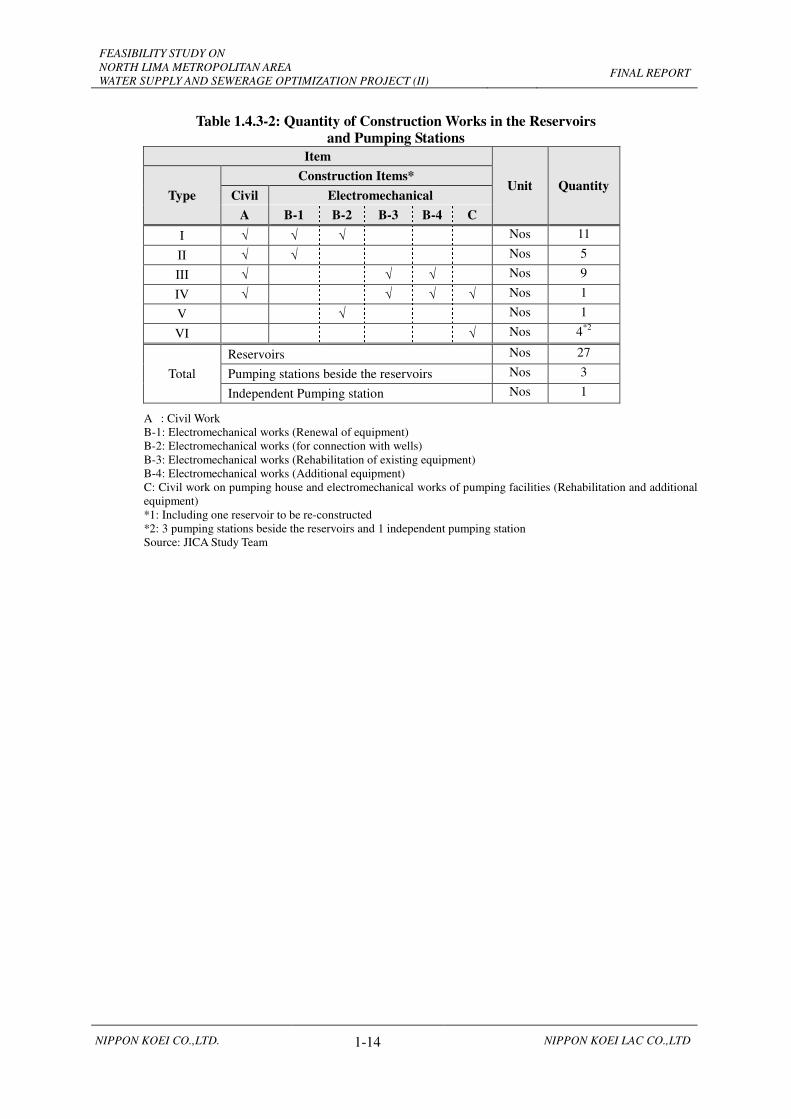
FEASIBILITY STUDY ON
NORTH LIMA METROPOLITAN AREA
WATER SUPPLY AND SEWERAGE OPTIMIZATION PROJECT (II)
FINAL REPORT
NIPPON KOEI CO.,LTD. 1-14 NIPPON KOEI LAC CO.,LTD
Table 1.4.3-2: Quantity of Construction Works in the Reservoirs
and Pumping Stations
Item
Unit Quantity Type
Construction Items*
Civil Electromechanical
A B-1 B-2 B-3 B-4 C
I √ √ √ Nos 11
II √ √ Nos 5
III √ √ √ Nos 9
IV √ √ √ √ Nos 1
V √ Nos 1
VI √ Nos 4*2
Total
Reservoirs Nos 27
Pumping stations beside the reservoirs Nos 3
Independent Pumping station Nos 1
A : Civil Work B-1: Electromechanical works (Renewal of equipment) B-2: Electromechanical works (for connection with wells) B-3: Electromechanical works (Rehabilitation of existing equipment) B-4: Electromechanical works (Additional equipment) C: Civil work on pumping house and electromechanical works of pumping facilities (Rehabilitation and additional equipment) *1: Including one reservoir to be re-constructed *2: 3 pumping stations beside the reservoirs and 1 independent pumping station Source: JICA Study Team

FEASIBILITY STUDY ON
NORTH LIMA METROPOLITAN AREA
WATER SUPPLY AND SEWERAGE OPTIMIZATION PROJECT (II)
FINAL REPORT
NIPPON KOEI CO.,LTD. 1-15 NIPPON KOEI LAC CO.,LTD
Table 1.4.3-3: List of the Reservoirs and Pumping Stations in the Project
Source: JICA Study Team
Wells
Table 1.4.3-4 shows works proposed for the wells that would operate in emergency situations, such as low water (dry) seasons, in the Project area. Table 1.4.3-5 shows the list of wells.
Table 1.43-4: Quantity of Construction Works in the Wells Item Unit Quantity Remarks
Electromechanical equipment renewal
Nos 3 Operating wells
Electromechanical equipment renewal, pumping house rehabilitation
Nos 20 Non-operating well
Source: JICA Study Team
Type Component*
R-800 VILLA SOL R-1 1300 Inoperativo I A, B-1, B-2 R-801 VILLA DEL NORTE R-1 1800 Inoperativo II A, B-1
R-996 PARQUE DEL NARANJAL R-1 1400 Inoperativo II A, B-1
- CUETO FERNANDINI R-1 1500 Inoperativo II A, B-1
- OLIVOS DE PRO R-1 1500 Inoperativo I A, B-1, B-2 - PROGRAMA CONFRATERNIDAD R-2 1600 Inoperativo I A, B-1, B-2 - PROGRAMA CONFRATERNIDAD R-1 1600 Inoperativo I A, B-1, B-2 - COMITÉ APOSTE 500 Inoperativo I A, B-1, B-2 - PATRIA NUEVA R-1 70 En operación III A, B-3, B-4
R-805 PUERTA DE PRO R-1 1100 Inoperativo I A, B-1, B-2 - RIO SANTA R-1 570 Inoperativo I A, B-1, B-2
R-997 PRO 1900 Inoperativo II A, B-1
R-802 SANTA LUISA R-1 500 Inoperativo II A, B-1
R-986 VIRGEN DE LAS NIEVES R-4 1500 Inoperativo I A, B-1, B-2 - VIRGEN DEL ROSARIO R-1 1200 Inoperativo I A, B-1, B-2 - ROSARIO DEL NORTE R-3 1200 Inoperativo I A, B-1, B-2 - JAZMINES DE NARANJAL R-2 1200 Inoperativo I A, B-1, B-2
CR-243 VIPOL NARANJAL R-1 1900 En operación III A, B-3, B-4 - CERRO EL CHOCLO R-2 100 En operación III A, B-3, B-4 - CERRO EL CHOCLO R-1 100 En operación III A, B-3, B-4
R-522 MARQUEZ R-522 1200 En operación III A, B-3, B-4 CR-76** Cisterna - En operación VI C
R-927 NVA. ESPERANZA R-1 400 En operación III A, B-3, B-4 R-924 COLLIQUE R-4 1000 En operación VI C
R-925 COLLIQUE R-5 800 En operación VI C
R-926 COLLIQUE R-6 800 En operación IV A, B-3, B-4, C
R-820 COLLIQUE R-7 550 En operación III A, B-3, B-4 RP-3 LOS ANGELES R-3 100 En operación III A, B-3, B-4 RP-4 LOS ANGELES R-4 100 En operación III A, B-3, B-4 RP-2 Cerro Oquendo 5000 Inoperativo V B-2
*
**
- A-1: Civil works B-1: Electromechanical works (Renewal of equipment) B-2: Electromechanical works (for connetion to wells) B-3: Electromechanical works (Rehabilitation of existing equipment)
B-4: Electromechanical works (Additional equipment) C : Civil works in pumping house and electromechanical works of pumping facilities (Rehabilitation and additional equipment)Independent pumping station
349B-2
349B-3
351-2 351-3
259
349A-2
349A-3
349B-1
212B-2
213-1 213-2 213-3
85B-3
212A-1
212A-2
212B-1
84B-2
85A 85B-1
85B-2, 85C
83B-2
84A-1
84A-2
84B-1
Project*
83A-1
83A-2
83B-1
Sub-Sector Code/NameVolume
(m3)
Present Condition

FEASIBILITY STUDY ON
NORTH LIMA METROPOLITAN AREA
WATER SUPPLY AND SEWERAGE OPTIMIZATION PROJECT (II)
FINAL REPORT
NIPPON KOEI CO.,LTD. 1-16 NIPPON KOEI LAC CO.,LTD
Table 1.4.3-5: Wells in the Project
No. Code Status* Reservoir
Name Sub-sector
1 423 A Villa Sol R-1 83A-1
2 474 A Villa Sol R-1 83A-1
3 498 A Villa Sol R-1 83A-1
4 720 A Olivos de Pro R-1 84A-1
5 691 B Programa Confraternidad 2 84A-2
6 692 C Programa Confraternidad 2 84A-2
7 693 A Programa Confraternidad 2 84A-2
8 695 A Programa Confraternidad 1 84B-1
9 694 C Programa Confraternidad 1 84B-1
10 618 A Comité Aposte 84B-2
11 716 A Comité Aposte 84B-2
12 696 C Comité Aposte 84B-2
13 351 A Puerta de Pro R-1 85A
14 717 C Puerta de Pro R-1 85A
15 704 A Rio Santa R-1 85B-1
16 280 C Rio Santa R-1 85B-1
17 687 A Virgen de Las Nievas R-4 212A-1
18 727 B Virgen del Rosario R-1 212A-2
19 728 B Virgen del Rosario R-1 212A-2
20 729 B Virgen del Rosario R-1 212A-2
21 689 C Rosario del Norte R-3 212B-1
22 688 B Jazmines de Naranjal R-2 212B-2
23 569 D Cerro Oquendo RP-2 - *: A: With Complete Pumping Equipment, B: With Partial Equipment, C: Without Pumping Equipment, D: Operating Source: JICA Study Team
Facilities for SCADA System
Table 1.4.3-6 shows the facilities (reservoirs, pumping stations, wells, and pressure reducer valves) that are proposed to operate under the SCADA system in the Project; this will result not only an efficient operation and accurate checking but also they will get integrated to SEDAPAL’s system.

FEASIBILITY STUDY ON
NORTH LIMA METROPOLITAN AREA
WATER SUPPLY AND SEWERAGE OPTIMIZATION PROJECT (II)
FINAL REPORT
NIPPON KOEI CO.,LTD. 1-17 NIPPON KOEI LAC CO.,LTD
Table 1.4.3-6: Quantity of Works for Target Facilities for SCADA System in
Water Supply Facilities
Item Unit Quantity Remarks
(1) Reservoirs
-Installation of equipment Nos 26 All reservoirs except for Cerro Oquendo and Patria Nueva to be rehabilitated in the Project, and Collique-8
-Integration to the system* Nos 65 All reservoirs related to the Project Area
(2) Pumping Stations
-Installation of equipment and integration to the system
Nos 4 CR-76, Collique R-4, CR-96 (Collique R-5), Collique R-6
(3) Wells
-Installation of equipment and integration to the system
Nos 23 Including 1 renewal (569)
(4) Pressure Reducing Valves
-Installation of equipment and integration to the system
Nos 11 5 new valve pits and 6 existing valve pits without equipment
-Integration to the system*1 Nos 14 Including 3 existing valve pits to be rehabilitated (84A, 212A&B, and 213)
*1: Facilities integrated to the SCADA system to start operation under the system Source: JICA Study Team
(2) Secondary networks of water supply
Priorities for Pipes to be Renewed
Priorities and quantities for pipes to be renewed are presented in Table 1.4.3-7.
As a conclusion of the Study, it is proposed to replace at least 15 % of secondary pipes by a priority order, for achieving to NRW percentage of 25 % (Project goal). In this sense, renewal of pipes under Categories A, B, and C (1st and 2nd priority) would not be enough to meet the non revenue water reduction goal (especially the technical loss reductions.) This situation could change if Category D (3rd priority) is included (AC pipes over 25 years old). With Category D inclusive, it represents an accumulated percentage of 23.15% of total pipe renewal.
Table 1.4.3-7: Priorities for Pipes to be Considered for Renewal
Priority Category
Quantity
Each Category Accumulation
Length*1
(km) %
*2
Length*1
(km) %
*2
1 A B
Pipes without enough capacity. Pipes with material problems and Pipes with installation problems
35.60 4.60% 35.60 4.60%
2 C Network pipes of AC 75.54 9.77% 111.14 14.37%
3 D AC pipes over 25 years old 67.88 8.78% 179.02 23.15%
4 E AC pipes between 15 and 25years old
94.08 12.16% 273.10 35.31%
*1: Pipes that can belong to multiple categories rank in a higher priority category, so that double counting is avoided.
*2: Percentage against the total pipe length (773.45 km)
Source: JICA Study Team
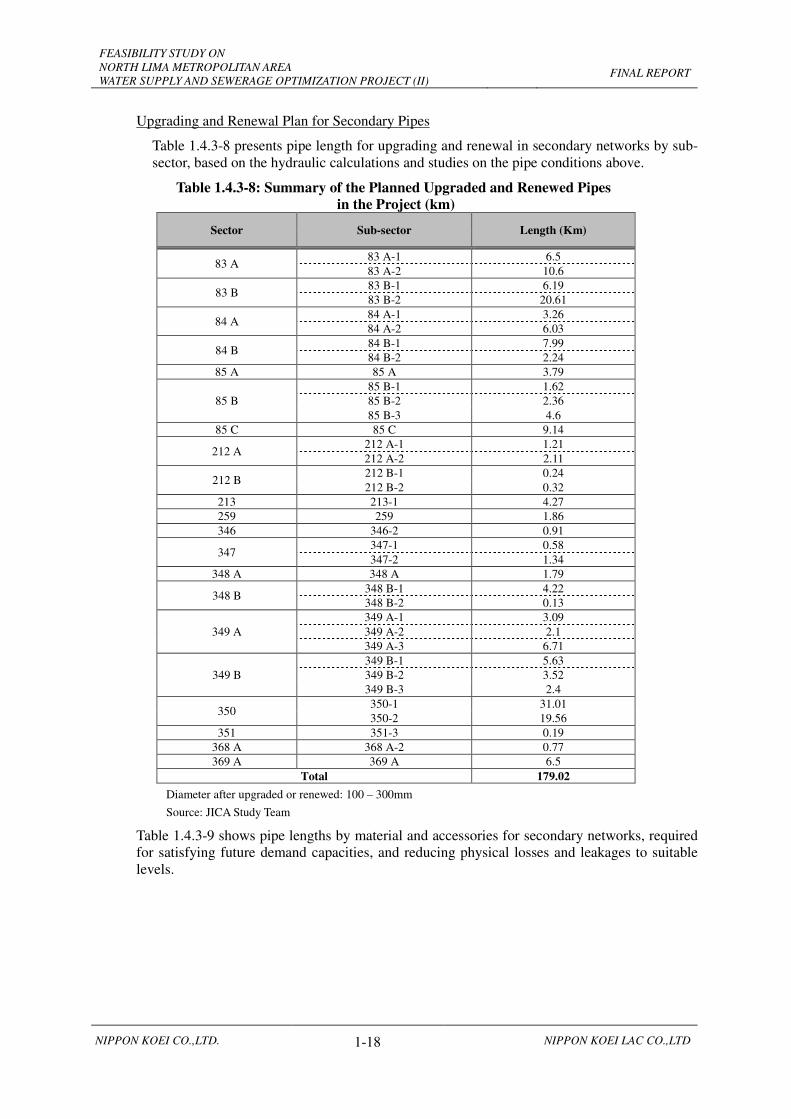
FEASIBILITY STUDY ON
NORTH LIMA METROPOLITAN AREA
WATER SUPPLY AND SEWERAGE OPTIMIZATION PROJECT (II)
FINAL REPORT
NIPPON KOEI CO.,LTD. 1-18 NIPPON KOEI LAC CO.,LTD
Upgrading and Renewal Plan for Secondary Pipes
Table 1.4.3-8 presents pipe length for upgrading and renewal in secondary networks by sub-sector, based on the hydraulic calculations and studies on the pipe conditions above.
Table 1.4.3-8: Summary of the Planned Upgraded and Renewed Pipes
in the Project (km)
Sector Sub-sector Length (Km)
83 A 83 A-1 6.5
83 A-2 10.6
83 B 83 B-1 6.19
83 B-2 20.61
84 A 84 A-1 3.26
84 A-2 6.03
84 B 84 B-1 7.99
84 B-2 2.24
85 A 85 A 3.79
85 B
85 B-1 1.62
85 B-2 2.36
85 B-3 4.6
85 C 85 C 9.14
212 A 212 A-1 1.21
212 A-2 2.11
212 B 212 B-1 0.24
212 B-2 0.32
213 213-1 4.27
259 259 1.86
346 346-2 0.91
347 347-1 0.58
347-2 1.34
348 A 348 A 1.79
348 B 348 B-1 4.22
348 B-2 0.13
349 A
349 A-1 3.09
349 A-2 2.1
349 A-3 6.71
349 B
349 B-1 5.63
349 B-2 3.52
349 B-3 2.4
350 350-1 31.01
350-2 19.56
351 351-3 0.19
368 A 368 A-2 0.77
369 A 369 A 6.5
Total 179.02
Diameter after upgraded or renewed: 100 – 300mm
Source: JICA Study Team
Table 1.4.3-9 shows pipe lengths by material and accessories for secondary networks, required for satisfying future demand capacities, and reducing physical losses and leakages to suitable levels.
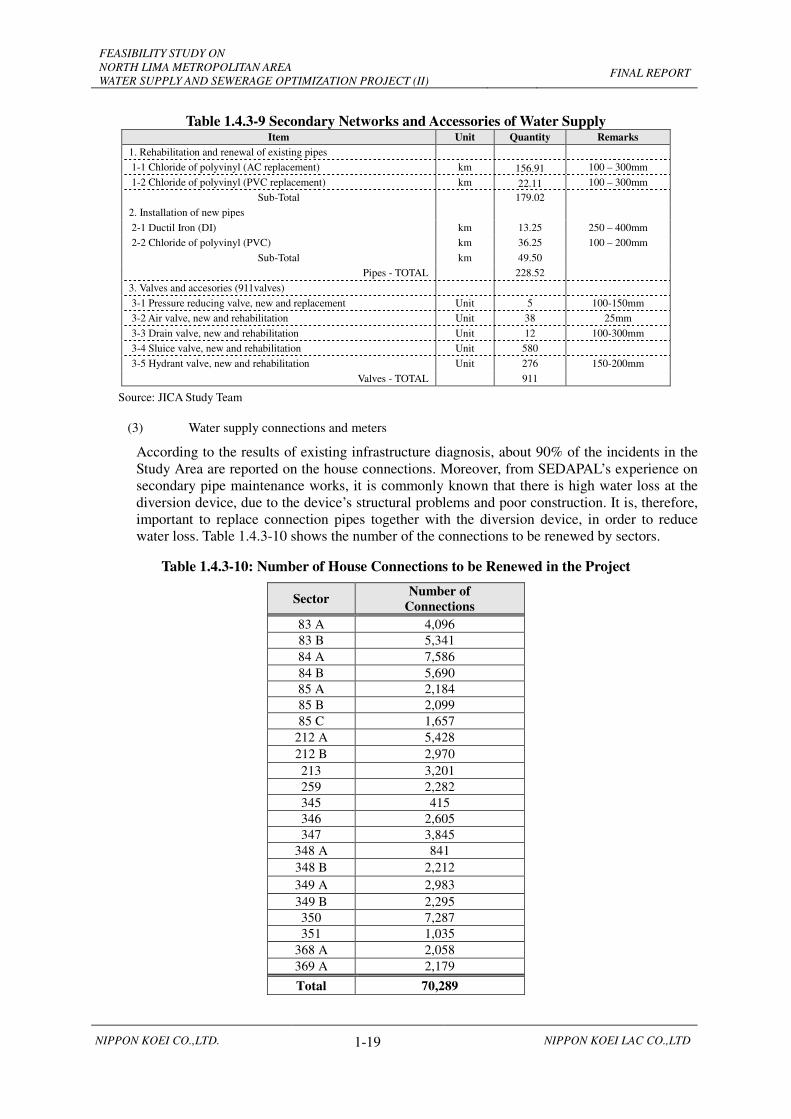
FEASIBILITY STUDY ON
NORTH LIMA METROPOLITAN AREA
WATER SUPPLY AND SEWERAGE OPTIMIZATION PROJECT (II)
FINAL REPORT
NIPPON KOEI CO.,LTD. 1-19 NIPPON KOEI LAC CO.,LTD
Table 1.4.3-9 Secondary Networks and Accessories of Water Supply Item Unit Quantity Remarks
1. Rehabilitation and renewal of existing pipes
1-1 Chloride of polyvinyl (AC replacement) km 156.91 100 – 300mm
1-2 Chloride of polyvinyl (PVC replacement) km 22.11 100 – 300mm
Sub-Total 179.02
2. Installation of new pipes
2-1 Ductil Iron (DI) km 13.25 250 – 400mm
2-2 Chloride of polyvinyl (PVC) km 36.25 100 – 200mm
Sub-Total km 49.50
Pipes - TOTAL 228.52
3. Valves and accesories (911valves)
3-1 Pressure reducing valve, new and replacement Unit 5 100-150mm
3-2 Air valve, new and rehabilitation Unit 38 25mm
3-3 Drain valve, new and rehabilitation Unit 12 100-300mm
3-4 Sluice valve, new and rehabilitation Unit 580
3-5 Hydrant valve, new and rehabilitation Unit 276 150-200mm
Valves - TOTAL 911
Source: JICA Study Team
(3) Water supply connections and meters
According to the results of existing infrastructure diagnosis, about 90% of the incidents in the Study Area are reported on the house connections. Moreover, from SEDAPAL’s experience on secondary pipe maintenance works, it is commonly known that there is high water loss at the diversion device, due to the device’s structural problems and poor construction. It is, therefore, important to replace connection pipes together with the diversion device, in order to reduce water loss. Table 1.4.3-10 shows the number of the connections to be renewed by sectors.
Table 1.4.3-10: Number of House Connections to be Renewed in the Project
Sector Number of
Connections
83 A 4,096
83 B 5,341
84 A 7,586
84 B 5,690
85 A 2,184
85 B 2,099
85 C 1,657
212 A 5,428
212 B 2,970
213 3,201
259 2,282
345 415
346 2,605
347 3,845
348 A 841
348 B 2,212
349 A 2,983
349 B 2,295
350 7,287
351 1,035
368 A 2,058
369 A 2,179
Total 70,289

FEASIBILITY STUDY ON
NORTH LIMA METROPOLITAN AREA
WATER SUPPLY AND SEWERAGE OPTIMIZATION PROJECT (II)
FINAL REPORT
NIPPON KOEI CO.,LTD. 1-20 NIPPON KOEI LAC CO.,LTD
Source: JICA Study Team
Table1.4.3-11 presents a summary of number of connections to be renewedby type of material; therefore, it is equal to the number of house meters to be installed.
Table 1.4.3-11: Quantity of Construction Works
in the House Connections and Micrometers
Item Unit Quantity Remarks
House Connection Renewals (PVC, 15-25mm)
Nos 54,031 Average pipe length per connection is 6m.
House Connection Renewals (PE, 15-25mm)
Nos 16,258 Average pipe length per connection is 6m.
Total Nos 70,289 See Table 1.4.3-10
Micrometer Installations (Type B: Multiple Flow Type)
Nos 10,537 Sectors 259, 345, 348 A and B, 349 A and B, 350 and 351
Source: JICA Study Team
4) Improvement of Sewerage Networks
For sewerage pipe replacement, lacks of hydraulic capacity of pipes and deteriorations of the pipes by corrosion have been considered as evaluation tools.
Two methods of pipe construction has been proposed:
• Tunnel method, or “without trench” method.
• Traditional method, or “with trench” method.
Table 1.4.3-12 shows the comparative costs per meter of replaced pipe for both the methods. This includes construction of new manholes or rehabilitation of existing ones.
Table 1.4.3-12: Comparative Costs for Pipe Installation Methods
Description
Cost (Soles) per one meter installation
Re-position of Pavement
(m)
Pipes and Accessories Ø 200 mm
(m)
Installation of Pipes and
Accessories Ø 200 mm
(m)
Provisional Works
(m)
New Manhol
es (m)
Rehabilitated Manholes
(m)
Total (m)
“Without Trench” Method
256.61 16.7 16.7 290.01
“With Trench” Method
54.89 29.00 50.17 16.70 52.8 203.56
Source: JICA Study Team
Table 1.4.3-13 shows the length of secondary collectors to be renewed, by execution method, as well as the number of connections and manholes needed to satisfy future demand of wastewater collection capacity and to reduce clogs and collapses.
Table 1.4.3-13: Renewal of secondary networks of sewerage and connections
Category Unit Quantity Remarks
1. Renewal of existing pipes (PVC) km 237.49 1/ 200-300 mm
1.1 With trench (30%) km 71.21 200-300 mm 1.2 Without trench (70%) km 166.28 200-300 mm
2. Connections and manholes
2-1 Connections Nos 33,736
2-2 Manholes (from 1.5 m to 3 m depth) Nos 4, 717 3,302 new and
1,415 rehabilitated
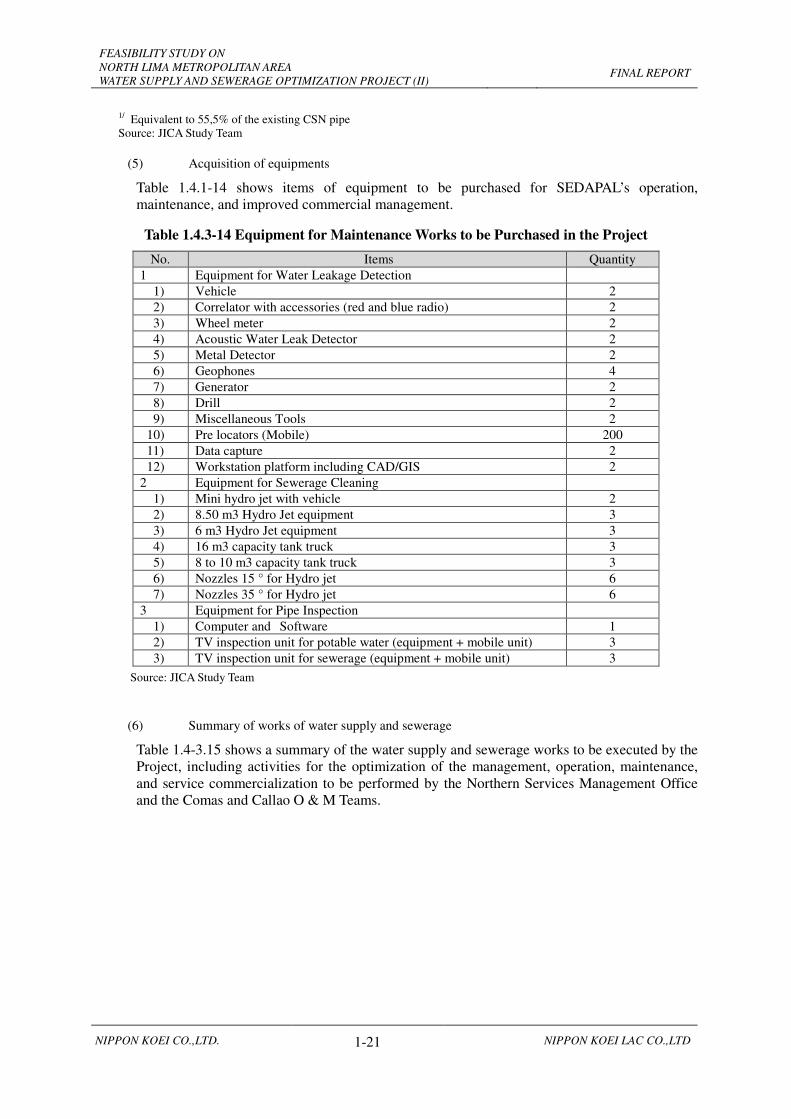
FEASIBILITY STUDY ON
NORTH LIMA METROPOLITAN AREA
WATER SUPPLY AND SEWERAGE OPTIMIZATION PROJECT (II)
FINAL REPORT
NIPPON KOEI CO.,LTD. 1-21 NIPPON KOEI LAC CO.,LTD
1/ Equivalent to 55,5% of the existing CSN pipe Source: JICA Study Team
(5) Acquisition of equipments
Table 1.4.1-14 shows items of equipment to be purchased for SEDAPAL’s operation, maintenance, and improved commercial management.
Table 1.4.3-14 Equipment for Maintenance Works to be Purchased in the Project
No. Items Quantity
1 Equipment for Water Leakage Detection
1) Vehicle 2
2) Correlator with accessories (red and blue radio) 2
3) Wheel meter 2
4) Acoustic Water Leak Detector 2
5) Metal Detector 2
6) Geophones 4
7) Generator 2
8) Drill 2
9) Miscellaneous Tools 2
10) Pre locators (Mobile) 200
11) Data capture 2
12) Workstation platform including CAD/GIS 2
2 Equipment for Sewerage Cleaning
1) Mini hydro jet with vehicle 2
2) 8.50 m3 Hydro Jet equipment 3
3) 6 m3 Hydro Jet equipment 3
4) 16 m3 capacity tank truck 3
5) 8 to 10 m3 capacity tank truck 3
6) Nozzles 15 ° for Hydro jet 6
7) Nozzles 35 ° for Hydro jet 6
3 Equipment for Pipe Inspection
1) Computer and Software 1
2) TV inspection unit for potable water (equipment + mobile unit) 3
3) TV inspection unit for sewerage (equipment + mobile unit) 3
Source: JICA Study Team
(6) Summary of works of water supply and sewerage
Table 1.4-3.15 shows a summary of the water supply and sewerage works to be executed by the Project, including activities for the optimization of the management, operation, maintenance, and service commercialization to be performed by the Northern Services Management Office and the Comas and Callao O & M Teams.

FEASIBILITY STUDY ON
NORTH LIMA METROPOLITAN AREA
WATER SUPPLY AND SEWERAGE OPTIMIZATION PROJECT (II)
FINAL REPORT
NIPPON KOEI CO.,LTD. 1-22 NIPPON KOEI LAC CO.,LTD
Table 1.4.3-15: Summary of Works of the Project 1/
No Item and Specifications Unit Quantity
I. Optimization of Water Supply System
I-1
Development of primary network
- Primary pipes (Ductile Iron Pipe, 150-700mm) km 40.55
- Pressure reducing valve pit Unit 14
I-2
Improvement of reservoirs and pumping stations
- Rehabilitation of reservoirs Unit 27
- Rehabilitation of pumping stations Unit 4
I-3
Improvement of secondary networks
- Upgrading and renewal of existing pipes km 179.02
- Installation of new pipes km 49.50
I-4
Rehabilitation of house connections and installation of micrometers
- Renewal of existing house connections (PVC, PE) Unit 70,289
- Installation of micrometers Unit 10,537
I-5 Rehabilitation of wells Unit 23
I-6
Introduction of SCADA
- Reservoirs Unit 26
- Pumping stations Unit 4
- Wells Unit 23
- Pressure reducing valve pit Unit 11
II. Optimization of Sewerage System
- Upgrading and renewal of existing simple concrete pipes km 237.49
(PVC, 100-350mm)
- Rehabilitation of manholes Unit 1,415
- Construction of new manholes Unit 3,302
- Renewal of house connections (PVC) Unit 33,736
III. Optimization of Business Management of SEDAPAL
III-1
Procurement of equipment for maintenance work
- Equipment for water leakage detection Unit 2
(Acoustic water leakage detector and leakage detection system)
- Equipment for Sewer cleaning (Hydro jet and Tank Truck) Unit 8
- Equipment for Pipe inspection (TV inspection unit) Unit 6
III-2
Improvement of information management system
- Inventory survey Unit 1
- Support on upgrading information management system Unit 1
III-3 Establishment of new team for preventive maintenance Unit 1 *: Including activities for the optimization of SEDAPAL management Source: JICA Study Team

FEASIBILITY STUDY ON
NORTH LIMA METROPOLITAN AREA
WATER SUPPLY AND SEWERAGE OPTIMIZATION PROJECT (II)
FINAL REPORT
NIPPON KOEI CO.,LTD. 1-23 NIPPON KOEI LAC CO.,LTD
1.5 Cost of the project
Investment costs are made up of the following items:
• Potable water general works
• Rehabilitation of reservoirs, pumping stations, and wells
• Rehabilitation and/or renewal of secondary networks and connections, and water supply network sectorization
• Potable water automation and control system
• Rehabilitation and/or renewal of secondary network and sewerage manholes
• Operation and maintenance equipment
• Activities for environmental mitigation, social intervention, and updating of facility technical cadastre
• Engineering consultancy services to prepare works, detailed design study, procurement of equipment, assistance during biddings, and supervision of works
General expenses, (14.2%), contractor’s profit (10%), and General Sales Tax (18%), as well as administration costs to be incurred in by the ‘project executing unit’, are also included.
Project total cost that includes all the above mentioned items, amounts S/. 497,644 thousand (JPY 15,922 million = USD 175,350 thousand), as shown in Table 1.5-1.
Investment makeup is as follows:
1) Water supply general works : 6.1%
2) Rehabilitation of reservoirs, pumping stations, and wells : 5.7%
3) Water supply automation and control system : 2.1%
4) Rehabilitation and/or renewal of water secondary networks : 27.1%
5) Rehabilitation and/or renewal of sewerage secondary networks : 22.5%
6) Equipment for operation and maintenance : 3.7%
7) Environmental mitigation, social intervention, and technical cadastre : 4.3%
8) Engineering consultancy services : 12.1%
9) Project administration : 1.2%
10) IGV (General Sales Tax) : 15.3%
Project implementation has been foreseen for the 2012 – 2016 period.

FEASIBILITY STUDY ON
NORTH LIMA METROPOLITAN AREA
WATER SUPPLY AND SEWERAGE OPTIMIZATION PROJECT (II)
FINAL REPORT
NIPPON KOEI CO.,LTD. 1-24 NIPPON KOEI LAC CO.,LTD
Table 1.5-1: Project Investment Costs
(Currencies at market prices, as of June 2010)
Nuevos Soles US $
1 GENERAL WORKS 23,539,637 8,294,446
1.1 PRELIMINARY AND PROVISIONAL WORKS glb 631,298 222,445
1.2 PRIMARY PIPELINES NETWORK FOR WATER SUPPLY 22,908,339 8,072,001
1.2.1 PAVEMENT WORKS m 33,249 1,843,095 649,434
1.2.2 PIPE AND ACCESSORIES SUPPLY m 40,547 13,399,884 4,721,594
1.2.3 PIPE AND ACCESSORIES INSTALLATION m 40,547 4,779,138 1,683,981
1.2.4 VALVE PIT AND ACCESORIES INSTALLATION AND SUPPLY glb 2,886,222 1,016,992
2 REHABILITATION OF RESERVOIR,PUMPING STATION AND WELLS 22,168,652 7,811,364
2.1 WATER SUPPLY 22,168,652 7,811,364
2.1.1 EQUIPMENT AND REHABILITATION OF RESERVOIR Unit 27 9,281,135 3,270,308
2.1..2 EQUIPMENT AND REHABILITATION OF PUMPING STATION Unit 4 2,114,539 745,081
2.1.3 EQUIPMENT AND REHABILITATION OF WELLS Unit 23 10,772,979 3,795,976
3 AUTOMATION AND CONTROL SYSTEM 8,281,770 2,918,171
3.1 AUTOMATION AND CONTROL SYSTEM FOR WATER SUPPLY glb 8,281,770 2,918,171
4 SECONDARY PIPELINES NETWORK FOR WATER SUPPLY 105,045,527 37,013,928
4.1 PRELIMINARY AND PROVISIONAL WORKS glb 4,751,212 1,674,141
4.2 REHABILITATION OF SECONDARY NETWORK (TRENCH METHOD) 40,484,608 14,265,190
4.2.1 PAVEMENT WORKS m 187,386 8,804,955 3,102,521
4.2.2 PIPE AND ACCESSORIES SUPPLY m 228,520 13,235,465 4,663,659
4.2.3 PIPE AND ACCESSORIES INSTALLATION (AC-PVC) m 156,910 9,963,816 3,510,858
4.2.4 PIPE AND ACCESSORIES INSTALLATION (PVC-PVC) m 22,110 1,151,897 405,883
4.2.5 INSTALLATION OF DI PIPES AND ACCESORIES m 49,500 3,119,749 1,099,277
4.2.6 SUPPLY AND INSTALLATION OF VALVE PIT glb 4,208,727 1,482,991
4.3 REHABILITATION OF HOUSE CONNECTION Unit 70,289 52,895,975 18,638,469
4.4 PROVISIONAL CONNECTIONS glb - 5,498,191 1,937,347
4.5 MICROMETER SUPPLY AND INSTALLATION Unit 10,537 1,415,541 498,781
5 SECONDARY PIPELINES NETWORK FOR SEWERAGE 87,236,647 30,738,776
5.1 PRELIMINARY AND PROVISIONAL WORKS glb 5,469,777 1,927,335
5.2 REHABILITATION OF SECONDARY NETWORK (TRENCH METHOD) 30,791,225 10,849,621
5.2.1 PAVEMENT WORKS m 136,350 7,577,391 2,669,976
5.2.2 PIPE AND ACCESSORIES SUPPLY m 166,280 4,894,960 1,724,792
5.2.3 PIPE AND ACCESSORIES INSTALLATION m 166,280 8,358,623 2,945,251
5.2.4 MANHOLE REHABILITATION Unit 1,415 1,181,129 416,184
5.2.5 MANHOLE CONSTRUCTION Unit 3,302 8,779,122 3,093,419
5.3 REHABILITATION OF SECONDARY NETWORK (TRENCH-LES METHOD) m 71,210 15,318,999 5,397,815
5.4 REHABILITATION OF HOUSING CONNECTION Unit 33,736 31,296,410 11,027,629
5.5 PROVISIONAL CONNECTIONS glb 4,360,236 1,536,376
6 EQUIPMENTS FOR O&M 14,164,385 4,990,974
6.1 EQUIPMENT FOR PREVENTIVE MAINTENANCE glb 1,619,245 570,558
6.2 HYDROJET FOR SEWERAGE CLEANING glb 11,191,738 3,943,530
6.3 EQUIPMENT FOR LEAKAGE REDUCTION glb 1,353,402 476,886
7 ENVIRONMENTAL IMPACT MITIGATION, SOCIAL INTERVENTION AND TECHNICAL CADASTRE 16,587,379 5,844,742
7.1 ENVIRONMENTAL MITIGATION glb 3,521,631 1,240,885
7.2 SOCIAL INTERVENTION glb 6,728,560 2,370,881
7.3 TECHNICAL CADASTRE glb 6,337,188 2,232,977
DIRECT COST 277,023,997 97,612,402
INDIRECT COST
GENERAL EXPENSES 39,218,946 13,819,220
PROFITS 27,702,400 9,761,240
SUBTOTAL 66,921,346 23,580,460
CONSTRUCTION COST 343,945,342 121,192,862
INTANGIBLES
DETAIL DESIGN 21,153,035 7,453,501
SUPERVISION 33,549,625 11,821,573
ENVIRONMENTAL IMPACT ASSESMENT 272,731 96,100
ENVIRONMENTAL MONITORING 3,344,132 1,178,341
ADMINISTRATION COSTS 5,602,530 1,974,112
SUBTOTAL 63,922,053 22,523,627
SUBTOTAL 407,867,396 143,716,489
VAT(18%) 73,416,131 25,868,968
TOTAL 481,283,527 169,585,457
ITEM
Total Cost
QuantityUnitDESCRIPTION
Source: JICA study team and detailed budget Appendix B4

FEASIBILITY STUDY ON
NORTH LIMA METROPOLITAN AREA
WATER SUPPLY AND SEWERAGE OPTIMIZATION PROJECT (II)
FINAL REPORT
NIPPON KOEI CO.,LTD. 1-25 NIPPON KOEI LAC CO.,LTD
1.6 Project Benefits
For the Project, the following benefits have been identified:
• Resource savings from minor water pipes and connection repairs, as well as insurance payments for accidents in the pipelines and connections.
• Decrease in technical water loss in networks and connections (water reclamation).
• Higher water consumption in the restricted sectors.
• Postponement of water source and yield investments
• A better supply quality, continuity, and pressure to the current population, increased willingness to pay (WTP) for a better potable water service.
• Incorporation of new users
1.7 Social Evaluation of the project �Economic Evaluation�
Cost – Benefit methodology is applied in order to carry out the Project´s social evaluation. Net Present Value (NPV) and Internal Rate of Return (IRR) are used as profitability indicators. A social discount rate of 10% was used for cost and benefit updating, as defined by MEF (Appendix SNIP 10 – Evaluation Parameters), as well as a minimum social performance rate for public investment projects.
In addition to the cost – effectiveness methodology, the investment per capita cost at market prices is also applied for the sewerage system (secondary networks, house connections) in the Project.
Steps taken for social cost and benefit identification include:
• Comparison between the “with” and “without” project situations.
• Distinction between costs, incremental benefits (increased consumption), maintenance cost savings, insurance payments for accidents on pipes and connections, and benefits for reclaimed water volume (avoided costs related to marginal reductions in technical water loss).
Conversion of costs and benefits from market prices to social prices was carried out, using factors suggested by the DNS (Appendix B.)
Through this procedure, an economic cash flow at social prices was set up to identify net social benefits for the project evaluation period.
A list of the pre-conditions and assumptions for analysis is shown below:
• The water supply and sewerage project evaluation period is 20 years (2016 – 2035.) The investment phase should be completed in the third quarter of 2016.
• “Cost – Benefit” methodology is used for water supply project evaluation. “Cost – Effectiveness” methodology will be applied for the sewerage project.
• Benefits are taken into account for the social flow, as only the last quarter of 2016 and on a whole annual basis for the remaining years (2017 – 2035).
• Economic benefits derived from an increased willingness to pay by the existing users are as follows: 70 % for the water supply service and 30 % from the sewerage service. This makeup will prevail at the current rates for these services.
• All costs and benefits are expressed at social prices as of June 2010, and for market price

FEASIBILITY STUDY ON
NORTH LIMA METROPOLITAN AREA
WATER SUPPLY AND SEWERAGE OPTIMIZATION PROJECT (II)
FINAL REPORT
NIPPON KOEI CO.,LTD. 1-26 NIPPON KOEI LAC CO.,LTD
conversion to social prices, factors suggested by DNS were used.
• Water network infrastructure has an economic life span of 50 years. Therefore, the project will carry on generating net benefits for the next 30 years after the end of 20 years evaluation period. However, the social flow has taken into account the future benefits’ updated value for the next 10 years only, as a conservative measure.
• A social discount rate of 10.0 % is used to calculate NPV.
• Investment cost per capita (market price) is calculated for the sewerage project (secondary networks and connections), for comparison purposes with the reference value shown in Appendix SNIP 09 (Parameters and Technical Regulations for Formulation purposes – urban area sanitation projects.)
• Costs for future potable water and sewerage connections are not incremental to the Project. Therefore, they are not taken into account for social flow.
Results of the Social Evaluation
Water supply project
From the net flow of the economic evaluation, a net present value (NPV) can be obtained amounting to S/. 41.5 million, as well as a 12.8% internal rate of return (IRR) that exceeds the discount rate used for the updating of total flow.
Table 1.7-1: Evaluation results of the water supply project (Nuevos soles at social prices of June 2010)
Indicator Annual Total Benefits Total Investment and
Reposition of Equipments Net Flow
Present Value (10%) 224,105,182 182,571,816 41,533,366
IRR 12.8%
Source: JICA Study Team
Sewerage project
Table 3.7.3-2 shows that the investment value per capita for the Project (networks and connections) is US$ 205. This value is slightly less compared to the reference value in Appendix SNIP 09“Sewerage network and connection extension without primary works,” which amounts to USD $224 / inhabitant in urban areas; therefore, the proposed investment is acceptable.
Table 1.7-2: Per Capita Investment in Sewerage Secondary Networks and Connections (Nuevos Soles at Market Prices of June 2010)
Concept Units Networks and connections
Investment (networks) (S/.) 125,266,795
Investment (connections) (S/.) 52,238,962
Average beneficiary population (networks) inhabitants 569,005
Beneficiary population (Connections) inhabitants 144,244
S/. per capita investment (networks) S/. inhab 220
S/. per capita investment (Conections) S/.inhab. 362
S/. per capita total investment S/. inhab 582
US$ per capita investment US$/inhab 205
Per capita cost – urban area US$/inhab. 224 Source: JICA Study Team

FEASIBILITY STUDY ON
NORTH LIMA METROPOLITAN AREA
WATER SUPPLY AND SEWERAGE OPTIMIZATION PROJECT (II)
FINAL REPORT
NIPPON KOEI CO.,LTD. 1-27 NIPPON KOEI LAC CO.,LTD
1.8 Private Evaluation (Financial Evaluation)
Financial evaluations were carried out in order to measure the impact of the Project´s investments on the economic-financial situation, under the following assumptions: i) income and incremental cost generation within the project scope, and ii) loan conditions and terms from each and every funding agency that will participate in the funding of project execution.
The following assumptions are taken into account for the preparation of the financial cash flow in the evaluation period:
Income
Income generated by the service-providing company in the ”with” project situation comes from the billing of potable water and sewerage services for a larger volume of available potable water to be supplied to other sectors close to the project area. The larger volume of water available to SEDAPAL is the volume of water reclaimed as a result of a decrease in technical losses, both in the network and the connections; this reclaimed volume is 20 % of the total water demand for the project.
The annual calculation of reclaimed water volume is the difference in the total demand (thousands of cubic meters per year), between the “with” and “without” project situations throughout the evaluation period for the project (20 years). It is assumed that 75% of the reclaimed water will be billed to the users in other distribution areas close to the project area.
In order to obtain the income from reclaimed potable water and sewerage, billing amount was multiplied with the average rate1 of S/. 2.43 / m3. This tariff is updated with the tariff increases as approved by SUNASS in June 2010; specifically the increases are 2.0 % in 2011 and 2.0 % in 2012. This tariff is kept consistent throughout the 2016 – 2035 evaluation period.
Collection has a 98 % average effectiveness, and a 2 % average default.
Income for new future potable water and sewerage connections and their relevant billing is not incremental to the project. Therefore, it is not included in the economic flow.
Costs / Expenditures
Costs in the “with” project situation have mainly considered as decreased costs in maintenance and repair of the water and sewerage network and connections. This minimizes operational corrective maintenance interventions by SEDAPAL, as well as insurance payments for any accidents caused by water networks and connections that mainly affect people’s homes These costs represent cost reductions (resource savings) for the utility in terms of cash flow.
Reclaimed water commercialization costs have been taken into account (incremental costs), including charges for sewerage. These costs in the “with” project situation should be taken by SEDAPAL, as a larger volume of water is required to supply areas close to the project.
SUNASS input for sanitation service regulation was also taken into account. This input represents 1 % of the incremental income.
Project investments have been taken into account, in compliance with the works execution schedule. Re-investment of equipment of control, electrical mechanic, leakage, collector cleaning also has been considered.
1 Average combined tariff for potable water and sewerage of S/. 2.43/m3 as of June 2010 (including fixed charges), Gerencia de Desarrollo e Investigación (Development and Research Management), SEDAPAL 2010.
FEASIBILITY STUDY ON
NORTH LIMA METROPOLITAN AREA
WATER SUPPLY AND SEWERAGE OPTIMIZATION PROJECT (II)
FINAL REPORT
NIPPON KOEI CO.,LTD. 1-28 NIPPON KOEI LAC CO.,LTD
Considerations and Evaluation Results
The project evaluation period is 20 years (2016-2035). The works detailed design will be prepared in 2012 and 2013; works will be executed in 2013, 2014, 2015, and 2016 (third quarter.
A 3.92 % WACC was used for the economic and financial net flow updating, as calculated by SUNASS, for SEDAPAL’s use in its Tariff Study during the 2010 – 2014 period.
All incomes and costs are shown at prices as of June 2010.
All incomes and costs are shown without including Sales Tax (VAT).
Fixed assets (water supply and sewerage networks that are made operational by SEDAPAL after they have been incorporated to SEDAPAL), have a 50 – year depreciation period, and intangibles have a 5 – year depreciation period, according to SEDAPAL accounting practices. Therefore, by 2035 (year 20), at the completion of the project evaluation period, as assets will still operative; therefore, SEDAPAL will continue raising net income (after taking away distribution and commercialization costs) for rendering sanitation services.
In this sense, an updated value for future net consistent income has been taken into account for the financial evaluation, throughout the next 10 – year period, at a 3.92 % discount rate. This value is shown as an income in 2035 (year 20).
The project financial evaluation normal results show a positive net present value (NPV) of S/. 19.7 million, and a 4.4% economic internal rate of return (EIRR) against a 3.92 % discount rate. Therefore, the project is economically feasible to SEDAPAL.
Net flow of the economic evaluation and disbursements from the international cooperation funding agencies, such as JICA and KfW, have been taken into account for the financial evaluation. Financial conditions for loans, as well as the amounts and the debt service (interests, amortization of the principal, and commissions for non – disbursed balances) are also considered. These amounts are part of the funding flow for the project financial evaluation during the project evaluation period.
The project’s financial evaluation with consideration of possible funding conditions results show that SEDAPAL improves its position, resulting in a positive financial net present value (FNPV) of S/.34.4 million and a financial internal rate of return (FIRR) of 6.5%, against a 3.92 % discount rate, mainly as a result of the financial leverage generated by the favorable financial conditions for the bank loans.
1.9 Sustainability
In order to guarantee the success of the Project and achieve the desired benefits throughout the project planning period, a sustainability analysis is carried out, which is defined as the ability of a Public Investment Project to maintain the acceptable flow level of net benefits throughout its planning period. This can be expressed in quantitative and qualitative terms upon evaluation of the institutional, legal, economic, technical, environmental, and socio-cultural aspects, among others.
It is SEDAPAL´s responsibility to carry out the monitoring of the feasibility study until project viability has been obtained, and it also must ask the Ministry of Economy and Finances to manage the financing from entities of the funding cooperation (JICA, IBRD and KfW) and to provide the corresponding contracts between the Ministry of Economy and Finances, in representation of the Peruvian Government, and the cooperating agency.
The Executing Unit in the investment stage of the project is the Sanitation Improvement Program Team in the Marginal Areas of Lima (PROMESAL: Equipo del Programa de
Mejoramiento Sanitario de las Áreas Marginales de Lima), an office that depends functionally

FEASIBILITY STUDY ON
NORTH LIMA METROPOLITAN AREA
WATER SUPPLY AND SEWERAGE OPTIMIZATION PROJECT (II)
FINAL REPORT
NIPPON KOEI CO.,LTD. 1-29 NIPPON KOEI LAC CO.,LTD
on the General Management Department of SEDAPAL. This Team has the technical capacity and the management capacity for the administration and supervision of development for all activities during project implementation; this development is foreseen to begin once the Project viability has been declared, and after the signing of loan contracts with the funding entities (JICA, IBRD, and KfW).
In addition to the physical works, social monitoring and environmental education activities will be developed which will be proposed from the results of the feasibility study and successful experiences of SEDAPAL in other projects; this costs have been included in the project costs.
The North Services Management Department shall be in charge of the operation of the project infrastructure; its objective is to render sanitation services once the facilities have been received from the contractors, and it is responsible for the operation and maintenance of these facilities, using the necessary technical, logistic, and installed capacities. Purchase of collector cleansing equipment, leakage detection equipment, and portable residual chlorine control equipment has been contemplated as part of the project investment. These equipments will be used to support the operation and maintenance of the water supply and sewerage services. In this way, SEDAPAL’s capacity in the project operation phase will be strengthened.
For the execution of the project, there are numerous international engineering consultant firms in the Peruvian market with sufficient experience in the sanitation sector who can elaborate the technical works file; as well as international contractors for the specialized execution of sanitation works, especially the renovation of sewerage networks and water supply sectorization.
The resources required for the operation and maintenance of the rehabilitated and improved infrastructure shall be covered by the revenue collected from the water and sanitation services and the resources saved due to lower maintenance costs and payment of disaster insurance for breakages of the water supply networks that usually, prejudices the users.
The JICA Study Team carried out a socio-economic study through a survey by sampling in the households that have continuous (24 hour) water service and those that have restricted water service (less than 12 hours). According to the results of said study, the families are willing to pay for a better service. The households that do not have water service 24 hours a day are willing to pay an average of S/. 8.18 per month. On the other hand, the families that have water service rationed by hours are willing to pay an average of S/. 13.57 per month.
In this study, the analysis was also carried out for the users´ capacity to pay for the water and sewerage service against the norm set by the international organizations; which indicate that the amount to pay should not exceed 5% of the available income of the families benefited by the project.
The average family income according to the socio-economic survey information in the project zone is S/. 1,019 soles monthly, meaning that the average estimated capacity to pay for water and sewerage service is a maximum of S/. 51.0 per month including VAT. Currently, the families are bearing fees of S/. 42.90 for water and sewerage services with an estimated consumption of 17.90 cubic meters per month (consumption of 142 L/d/inhab). This amount is sufficiently under 5% of the average family income.
The beneficiaries do not participate in the design or the formulation of the project. In the execution stage, they shall participate by means within their reach, collaborating with the normal development of the construction processes and complying with the pertinent indications and recommendations, as well as participating with interest in the campaigns for publication and in the anticipated social intervention. At the same time, they shall participate in the operation stage, making good use of the services and installations, as well as appropriately fulfilling the payment of the fees and making reports and operative complaints that help the Operation and Maintenance teams in Comas and Callao to optimize the scope of their

FEASIBILITY STUDY ON
NORTH LIMA METROPOLITAN AREA
WATER SUPPLY AND SEWERAGE OPTIMIZATION PROJECT (II)
FINAL REPORT
NIPPON KOEI CO.,LTD. 1-30 NIPPON KOEI LAC CO.,LTD
operational duties.
1.10 Environmental Impact
In compliance with the effective requirements and procedures in Perú, activities for the project’s environmental approval have been started. On behalf of SEDAPAL (the project proponent), a request has been submitted to the Ministry of Housing, Construction, and Sanitation’s Environmental Office (OMA, in Spanish) on July 23rd, 2010 for an initial request and environmental classification. On October 6, 2010, OMA classified this Project as a Category II project that involves a semi-detailed EIA requirement. Based on the classification given to the project, the EIA’s ToR was prepared. During the detail design stage, with the approval from National Sanitation Directorate (DNS, in Spanish), DNS -authorized and -registered environmental consultants will carry out the Environmental Impact Assessment (EIA). After its successful evaluation, DNS will approve EIA.
A preliminary environmental evaluation was also carried out. This preliminary evaluation stated that the project’s overall environmental impact is positive, as it ensures a water supply and sewage collection that are safe and reliable. There are a few negative impacts, though, but these are temporary, they occur during the construction phase, and their mitigations are easily executable.
An impact matrix has been prepared to evaluate potential impact. A total of 18 environmental parameters were evaluated against 17 activities. The matrix is shown in Table 1.10-1.

FEASIBILITY STUDY ON
NORTH LIMA METROPOLITAN AREA
WATER SUPPLY AND SEWERAGE OPTIMIZATION PROJECT (II)
FINAL REPORT
NIPPON KOEI CO.,LTD. 1-31 NIPPON KOEI LAC CO.,LTD
Table 1.10-1: Environmental Impact Assessment Matrix
������������� ���� �� � ��� � �������������� � ������� ��� ��� ��� ���� ��� � ��������� �������� ����������� ���������� � �������
��� ����������� ���������� � �������� ���� �� ����������� ���������� � ������ ���������� � �� ���
� �������� ��� � ��������� ��� � ������ �� �������������������� ���� �� ���� ��� ������ �� ���������� �� �� ������ ���������� ���������� ��� ������� ��� � ������ �� ������� ������ ����������!"#$%$&'($") "% (*++'$) , - . / 0 0 , - - . . . - / - - -1+"2$") 3 3 3 3 3 3 3 3 3 3 3 3 3 3 3 3 345'6$(7 "% 2"$6 , / . / / - , / - - - . - / - 0 -89'):* "% 52* "% 2"$6 3 3 3 3 3 3 3 3 3 3 3 3 3 3 3 3 345'6$(7 "% 25+%'&* ;'(*+ 3 3 3 3 3 3 3 3 3 3 3 3 3 3 3 3 345'6$(7 "% :+"5)#;'(*+ 3 3 3 3 3 3 3 3 3 3 3 3 3 3 3 3 3<*)*+'($") "% ='+($&6*2 - 0 . . , / , > . . - . - / . , -<*)*+'($") "% :'2 - 0 . . , / , / . . - . - / . , -<*)*+'($") "% )"$2* . . - - 0 , , / . . . ? . . . / .@6"+' 8"A*+':* "% =6')(2 3 3 3 3 3 3 3 3 3 3 3 3 3 3 3 3 3@'5)' B$+# 6$%* 3 3 3 3 3 3 3 3 3 3 3 3 3 3 3 3 3C'7 "% 6$%* . ? D ? . . . , - ? - ? . / / 0 .E5F6$& 2*&5+$(7 ')# 9*'6(9 . / . ? - . - > / 3 3 3 3 - - 0 31G=6"7G*)( 2*&5+$(7 ')# 9*'6(9 . 0 . - 0 - 0 > / . . . . / / 0 .<*)*+'($") "% *G=6"7G*)( - / . . 0 / 0 / / - - - . / / . .1&")"G7 #7)'G$& H"(9*+*&")"G$& '&($A$($*2I ? / ? . 0 / 0 - . ? ? . . - / . .J*2(9*($&2 !"#$%$&'($") "% 6')#2&'=* . . 3 3 0 , , . . . . ? 3 . . / 3856(5+'6 J+&9'*"6":$&'6 K")*2 - 0 3 3 - 3 - / 3 3 - 3 3 / 3 - 3
L*&")#'+7 )*(;"+M ')# 9"52*&"))*&($")2 "% 2*;*+':*E+"N*&( '&($A$($*2 3 8")2(+5&($") =9'2*
O����������� ������O �� ����
<*)*+'6 ;"+M2 "% ="('F6* ;'(*+ P*9'F$6$('($") "% +*2*+A"$+2Q=5G=$): 2('($")2 ')# ;*662
����� � ������ ���R� ��� ��� ��� � ���
��S������
L*&")#'+7 )*(;"+M ')# 9"52* &"))*&($")2 "% ="('F6*;'(*+Q +*2*+A"$+2 T 2*&("+
Source: JICA Study Team
Also a preliminary Environmental Management Plan (EMP) was prepared which consist of the following: i) Prevention, Mitigation and/or Correction Program, ii) Monitoring Program and iii) Cost Estimates for implementation of EMP.
The mitigation plan against the negative impacts is given in Table 1.10-2.
Table 1.10-2: Environmental Mitigation Plan
Environmental Impact Mitigation Measure Proposed
1. Air pollution due to
dust and exhaust gas
� Put a moistened canvas over the surplus soil materials stored on site before they
are transported to the authorized disposal site.
� Adequately moisten the unpaved roadways and areas where daily Project activities
may stir up dust. This moistening should take place at least twice a day, and more
frequently when prevailing atmospheric conditions require it, which shall be
decided and reprogrammed by the Supervisor.
� Perform periodic maintenance on machinery, vehicles and equipment utilized in
order to guarantee it is in good condition and to reduce the emission of gases.
2. Pollution from
Asbestos piping
� The removal, transportation and final disposal of asbestos cement piping shall be
performed by a DIGESA certified agency.
3. Increase in noise
levels due to project
activities
� The equipment and machinery shall have constant maintenance to ensure proper
operation condition. The equipment should be used in such a time frame ensuring
minimum disruption.

FEASIBILITY STUDY ON
NORTH LIMA METROPOLITAN AREA
WATER SUPPLY AND SEWERAGE OPTIMIZATION PROJECT (II)
FINAL REPORT
NIPPON KOEI CO.,LTD. 1-32 NIPPON KOEI LAC CO.,LTD
Environmental Impact Mitigation Measure Proposed
� If necessary, a sound barrier should be installed.
4. Possible change in soil
quality
� Implement a collection system for waste generated in each of the worksites and
machine yards.
� Install systems to manage and dispose of grease and oils. For this, it will be
necessary to comply with the established solid waste program.
� The soils contaminated by hydrocarbon, etc. should be removed immediately and
properly disposed.
5. Public disturbances
due to project
activities.
� Inform the public about the type of machinery that will be used and the hours they
will be running.
� Take steps to coordinate and conciliate with inhabitants living near the worksite,
through the use of flyers and official reports, with relation to the activities that will
take place, with a timeline that will not affect the public’s normal activities.
� To ensure minimum disruption to vehicular and pedestrian traffic, proper traffic
sign must be placed.
� Movement of trucks should be planned not to coincide with rush hour traffic.
6. Occupational Health
and Safety risks
(accidents)
� Follow the Occupational Health and Safety Regulations, S.D. Nº 009-2005-TR
(article 20).
� Provide all work personnel with personal protective gear according to the
activities, especially for those workers dedicated to drilling the tunnel and
transporting asbestos material.
� Train work personnel about safety regulations for each activity to be carried out.
� Establish a work schedule that guarantees the performance and mental stability of
personnel.
� Implement environmental measures proposed in the Contingency Program in the
case of the occurrence of work accidents, before, during and after the event.
� Carry out constant inspections of the support structures and the trench interior in
the zones with identified slope instabilities.
� Fence in the work area and do not allow access to unauthorized persons.
� Establish medical services and a first aid kit.
7. Improvement in local
economy
� Maintain the policy of informing the local population about employment.
� Establish a rotating schedule for hiring personnel.
8. Liquid and solid
waste management
� The final disposal of the effluents from the portable bathrooms used by the
workers during Project construction shall be carried out properly.
� Solid waste generated should be collected and disposed properly.
9. Archeological Site � Plan should be prepared to safeguard and implement the plan.
Source: JICA Study Team
EMP costs which also include monitoring for protection of archaeological sites, are shown in Table 1.10-3.
Table 1.10-3: EMP Cost Estimates (Preliminary)
Major Items Estimated Cost (in N. Soles)
Preventive measures 1,845,520
Wastes management 79,240
Monitoring Program 1,596,870
Total 3,521,630
Miscellaneous 500,000
Total 4,021,630
Source: JICA Study Team

FEASIBILITY STUDY ON
NORTH LIMA METROPOLITAN AREA
WATER SUPPLY AND SEWERAGE OPTIMIZATION PROJECT (II)
FINAL REPORT
NIPPON KOEI CO.,LTD. 1-33 NIPPON KOEI LAC CO.,LTD
1.11 Organization and Administration for Project Implementation
For the organization and management of Project implementation, the following stakeholders participate with the roles described below:
SEDAPAL: The Executing Unit of the Project shall be PROMESAL, the Team that depends directly on the General Management Department, and shall have the duty of technical, financial, and contractual administration of the project, in internal coordination with the line and support Management Departments and the SEDAPAL Teams, and in external coordination with JICA and KfW for the payment of loans; as well as the National Directorate of Public Debt (NDPD), a line organization of the Ministry of Economy and Finances for the control of the payment of external loans and its respective services for the corresponding debts.
Through the Management and Selection Processes Control Team, SEDAPAL shall contract a Consultant firm for the elaboration of the technical works file for the project, which includes the development of the administrative requirements for the tendering of works and supplies, according to the number of lots required by the Implementation Plan. In the same way, this Team shall provide public tendering to contracting firms for the execution of works; as well as the acquisition of goods (equipment for the operation and maintenance works).
The North Services Management Team (GSN) and the Callao and Comas operation and maintenance teams shall have active responsibility in the investment phase and direct responsibility in the operation phase.
FONAFE: The unit in charge of regulating SEDAPAL´s business activity in the pre-investment phase is the OPI FONAFE, whose responsibility includes approving the feasibility study of the project and requesting the declaration of viability from the DGPI (Dirección General de Políticas de Inversiones, or General Directorate of Investment Policies). In the investment phase, it shall give its opinion with respect to the results of the technical works file before beginning of the execution of project works.
Ministry of Economy and Finances (MEF): Through the DGPI, it shall declare project viability, and it shall give its opinion before the approval on the conditions of the external debt operations with JICA, KfW and IBRD. Likewise, through the NDPD (National Directorate of Public Debt), it shall negotiate the loans with JICA, KfW and IBRD, and it shall give its opinion before the approval on conditions of the external debt operations with said organizations; later, it shall sign loan contracts for the financing of the project with JICA, KfW and IBDR in representation of the Republic of Peru.
In the investment phase, the DGPI shall give its opinion with respect to the results of the technical works file before the beginning of execution.
During the investment phase, the NDPD shall control the payment of loans and respective debt services in the operation phase of the project.
Ministry of Housing, Construction, and Sanitation: Through the OPI Vivienda, it shall give its opinion regarding the project´s feasibility study before declaration of project viability by the DGPI. Likewise, it will ratify the legal devices for the approval of the debt operation with JICA and KfW.
In the investment phase, through the National Sanitation Directorate (Dirección Nacional de Saneamiento, or DNS), it shall issue the corresponding directorial resolution approving the Environmental Impact Study, whose study level shall be according to the Classification approved by said directorate.
In the operation phase, it shall regulate as appropriate in order to improve the quality of the water and sewerage services.
SUNASS: In the operation phase, it is the regulatory body for the sanitation services rendered
FEASIBILITY STUDY ON
NORTH LIMA METROPOLITAN AREA
WATER SUPPLY AND SEWERAGE OPTIMIZATION PROJECT (II)
FINAL REPORT
NIPPON KOEI CO.,LTD. 1-34 NIPPON KOEI LAC CO.,LTD
by SEDAPAL, approving the Master Plan for Optimization and developing the Tariff Study for the approval of the Tariff Formula (adjustment or increase) and the Tariff Structure and Management Goals for the five-year period from 2015 to 2019, which shall include the project investments.
Japan International Cooperation Agency – JICA: It is an organization for Japan official development assistance. This agency financed the pre-feasibility study (perfil) and this feasibility study. Once project viability has been declared by the authorities in the Peruvian Government, it shall negotiate and sign the Loan Contract with the Ministry of Economy and Finances for the partial funding of project execution.
In the investment phase, it shall make the payments to SEDAPAL for the development of the technical file and execution of works. Likewise, before the contracts are signed for consultant, works, and acquisition of goods, it shall grant the non-objection for the awarding of the corresponding successful bids.
International Bank for Reconstruction and Development – IBRD: The IBRD is one of the institutions of the World Bank. Once project viability has been declared by the authorities in the Peruvian Government, it shall negotiate and sign the Loan Contract with the Ministry of Economy and Finances for the partial funding of project execution.
In the investment phase, it shall make the payments to SEDAPAL for the development of the technical file and execution of works. Likewise, before the contracts are signed for consultant, works, and acquisition of goods, it shall grant the non-objection for the awarding of the corresponding successful bids.
Kreditanstalt Fur Wiederaufbau Bankengruppe-KfW: It is an organization of the German official financial cooperation. Once project viability has been declared by authorities in the Peruvian Government, KfW shall negotiate and sign the Loan Contract with the Ministry of Economy and Finances for the partial funding of project execution.
In the investment phase, it shall make the payments to SEDAPAL for the execution of works. Likewise, before the contracts are signed for works and acquisition of goods, it shall grant the non-objection for the awarding of the corresponding successful bids.
1.12 Implementation Plan
(1) Pre-investment activities
The pre-investment phase activities include: i) an evaluation of the feasibility study carried out by the SNIP entities (EPI SEDAPAL, OPI FONAFE, OPI VIVIENDA, and DGPI), that will lead to the declaration of Project viability, ii) a funding agreement between MEF and the cooperating agencies that would fund the Project (JICA, IBRD, and KfW), as well as the resource transfer agreements between MEF and SEDAPAL.
It is foreseen that the feasibility study is completed and approved by SEDAPAL by March 2011, and that the Project’s viability is stated in September 2011
(2) Consulting services activities
Breakdown of these activities is as follows: i) call for international consultancy firm pre-qualification and relevant short listing, ii) invitation to submit technical and financial bids, iii) evaluation of bids, iv) contract awarding and subscription, with approval from the funding agency (agencies).
Once the consulting contract has been subscribed, the consultancy firm will develop the following activities:

FEASIBILITY STUDY ON
NORTH LIMA METROPOLITAN AREA
WATER SUPPLY AND SEWERAGE OPTIMIZATION PROJECT (II)
FINAL REPORT
NIPPON KOEI CO.,LTD. 1-35 NIPPON KOEI LAC CO.,LTD
• Development of the Detailed Design study2 of the works and equipments for Packages A, C, and B, including a TV camera inspection to the sewerage networks. Detailed Design study completion and approval for packages A and C are scheduled for March, 2013, and for package B, for September 2013. It includes presentation of SNIP-15 format to OPI-FONAFE and DGPI3.
• Preparation of pre-qualification and works tender and equipment procurement for Packages A, C, and B.
• Assistance to SEDAPAL in the works bidding and equipment procurement process (answering to queries, bid evaluations, contract negotiations)
• Works supervision during the construction, as well as environmental monitoring, social intervention, and the updating of the technical cadastre of the facilities (the consultancy firm(s) will prepare the as-built drawings for the works.)
(3) Pre-construction activities
Pre-construction activities include the following: i) preparation of the Works technical file, preparation of the pre-qualification, works bidding, and equipment purchase documents, ii) call to public tender for works and equipment in Packages A, C, and B, iii) bid evaluations, iv) granting and subscription of works and equipment procurement contracts, with approval from the funding agency (agencies.)
Pre-construction activities must be completed for Packages A and C in November 2013, and for Package B, in June 2014.
(4) Construction activities
Construction period for this Project is estimated at 36 months, of the expected start is December 2013, and should be completed by the end of December 2016, as shown in Table 1.12-1. It includes as-built drawing submitting activities (laying out drawings), and the liquidation of the relevant contracts.
(5) Operations Startup Activities
Operations startup for the Project works to be carried out by the Comas and Callao Network Operation and Maintenance Teams is foreseen for December 2015, for Package A works, and December 2016, for Package B works.
Table 1.12-1: Packages and Duration of Works Construction and Equipment Supply
Package Type of Bid Duration Start End
Package-A: General Works Primary Networks, Reservoirs, Pumping Stations, Wells and SCADA system
24 months
January 2013
December 2015
Package-B-1 to B-5: Water supply and sewerage secondary Networks
30 months July 2014
December 2016
Package-C: Procurement of O&M Equipment
9 months
January 2013
September 2014
Source: JICA Study Team
2 It includes: descriptive memory, technical specifications, works execution drawings, quantifications, works budget, works budget
determination date, reference value, Price analysis, appraised Works progress calendar, polynomial formulas, topography, soil study,
geological study, environmental impact study, archaeological remains study, and other studies. 3 Consistency report between detail design and feasibility study (Article 24.2 of SNIP regulation (R.D N° 003-2011-EF/68.01
FEASIBILITY STUDY ON
NORTH LIMA METROPOLITAN AREA
WATER SUPPLY AND SEWERAGE OPTIMIZATION PROJECT (II)
FINAL REPORT
NIPPON KOEI CO.,LTD. 1-36 NIPPON KOEI LAC CO.,LTD
(6) Physical and financial goals
Figure 1.12-1 and Table 1.12-3,4 show the financial and physical progress schedule by packages during the implementation period.
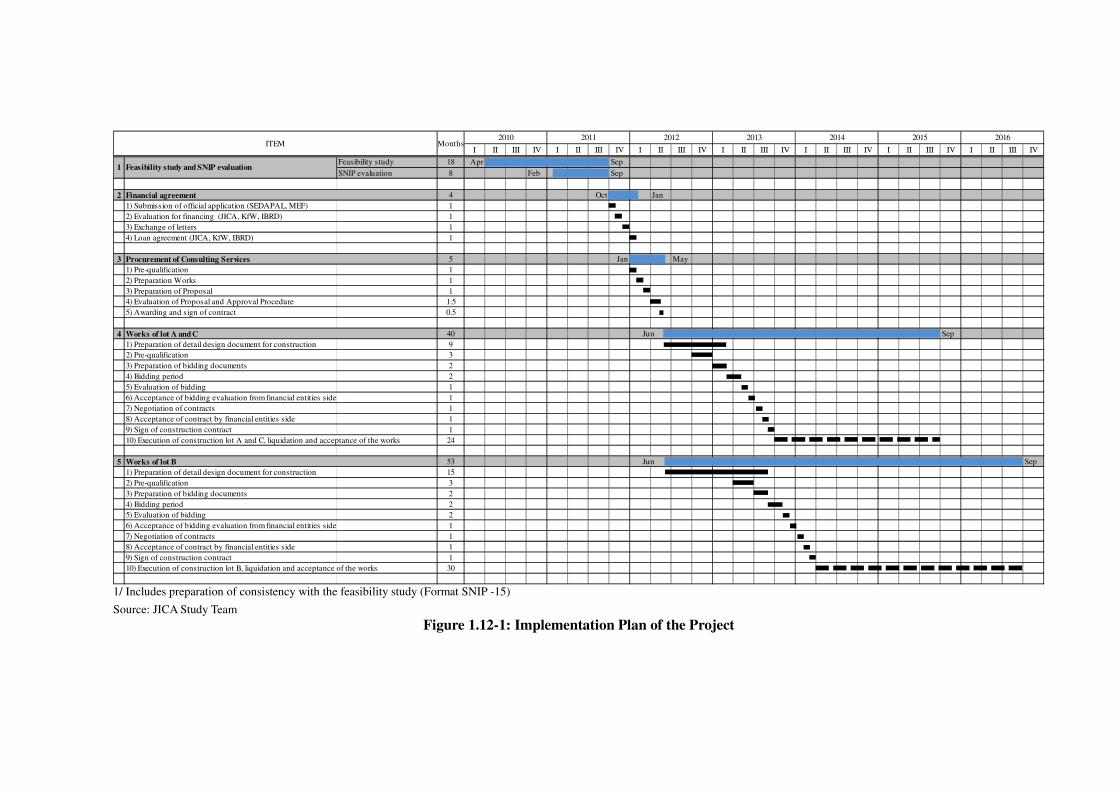
I II III IV I II III IV I II III IV I II III IV I II III IV I II III IV I II III IV
Feasibility study 18 Apr Sep
SNIP evaluation 8 Feb Sep
2 Financial agreement 4 Oct Jan
1) Submission of official application (SEDAPAL, MEF) 1
2) Evaluation for financing (JICA, KfW, IBRD) 1
3) Exchange of letters 1
4) Loan agreement (JICA, KfW, IBRD) 1
3 Procurement of Consulting Services 5 Jan May
1) Pre-qualification 1
2) Preparation Works 1
3) Preparation of Proposal 1
4) Evaluation of Proposal and Approval Procedure 1.5
5) Awarding and sign of contract 0.5
4 Works of lot A and C 40 Jun Sep
1) Preparation of detail design document for construction 9
2) Pre-qualification 3
3) Preparation of bidding documents 2
4) Bidding period 2
5) Evaluation of bidding 1
6) Acceptance of bidding evaluation from financial entities side 1
7) Negotiation of contracts 1
8) Acceptance of contract by financial entities side 1
9) Sign of construction contract 1
10) Execution of construction lot A and C, liquidation and acceptance of the works 24
5 Works of lot B 53 Jun Sep
1) Preparation of detail design document for construction 15
2) Pre-qualification 3
3) Preparation of bidding documents 2
4) Bidding period 2
5) Evaluation of bidding 2
6) Acceptance of bidding evaluation from financial entities side 1
7) Negotiation of contracts 1
8) Acceptance of contract by financial entities side 1
9) Sign of construction contract 1
10) Execution of construction lot B, liquidation and acceptance of the works 30
ITEM Months2010 2011 2012 2013 2014 2015 2016
1 Feasibility study and SNIP evaluation
1/ Includes preparation of consistency with the feasibility study (Format SNIP -15)
Source: JICA Study Team
Figure 1.12-1: Implementation Plan of the Project
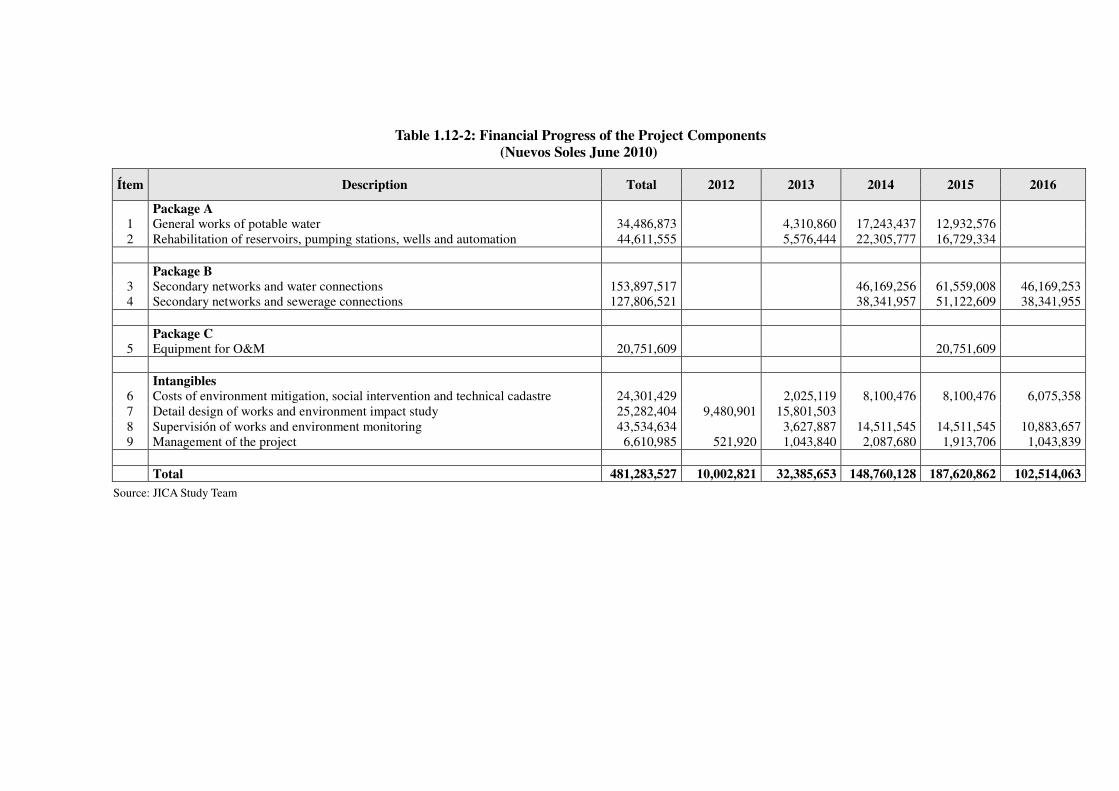
Table 1.12-2: Financial Progress of the Project Components
(Nuevos Soles June 2010)
Ítem Description Total 2012 2013 2014 2015 2016
Package A
1 General works of potable water 34,486,873 4,310,860 17,243,437 12,932,576 2 Rehabilitation of reservoirs, pumping stations, wells and automation 44,611,555 5,576,444 22,305,777 16,729,334
Package B 3 Secondary networks and water connections 153,897,517 46,169,256 61,559,008 46,169,253 4 Secondary networks and sewerage connections 127,806,521 38,341,957 51,122,609 38,341,955
Package C 5 Equipment for O&M 20,751,609 20,751,609
Intangibles 6 Costs of environment mitigation, social intervention and technical cadastre 24,301,429 2,025,119 8,100,476 8,100,476 6,075,358 7 Detail design of works and environment impact study 25,282,404 9,480,901 15,801,503 8 Supervisión of works and environment monitoring 43,534,634 3,627,887 14,511,545 14,511,545 10,883,657 9 Management of the project 6,610,985 521,920 1,043,840 2,087,680 1,913,706 1,043,839
Total 481,283,527 10,002,821 32,385,653 148,760,128 187,620,862 102,514,063
Source: JICA Study Team

Table 1.12-3: Physical progress of the Project components 1/
Ítem Description Total Unit 2012 2013 2014 2015 2016
Package A
1 General works of potable water
1.1 Primary network of water pipes (trench method) 40,547 m 5,068 20,274 15,205
2 Rehabilitation de reservoirs, pumping stations, wells and automatization
2.1 Equipment and rehabilitation of reservoirs 27 Unit 3 13 10
2.2 Equipment and rehabilitation of pumping stations 4 Unit 1 2 1
2.3 Equipment and rehabilitation of wells 23 Unit 3 11 9
2.4 Automation and contro – potable water Global % 12% 50% 38%
Package B
3 Secondary networks and water connections
3.1 Rehabilitation of secondary network of potable water (trench method) 228,520 m 68,560 91,414 68,546
3.2 Rehabilitation of house connections – potable water 70,289 Unit 21,087 28,116 21,087
3.3 Provisional connections of water Global % 30% 40% 30%
3.4 Suplí and installation of micrometers 10,537 Unit 3,161 4,215 3,161
4 Secondary network and sewerage connections
4.1 Rehabilitation of secondary network of sewerage (trench method) 166,280 m 49,950 66,600 49,730
4.2 Rehabilitation of secondary network of sewerage (jacking method) 71,210 m 21,402 28,536 21,272
4.3 Rehabilitation of house connections – sewerage 33,736 Unit 10,121 13,494 10,121
4.4 Provisional connections of sewerage Global % 30% 40% 30%
Package C
5 Equipment for O&M Global % 100%
Intangibles
6 Costs of environmental mitigation, social intervention and technical cadastre Global % 8% 33% 33% 25%
7 Detail design for works and environmental impact study Global % 37% 63%
8 Supervisión of works and environmental monitoring Global % 8% 33% 33% 25%
9 Management of the project Global % 8% 16% 32% 29% 16%
1/ Most representative components of works
Source: JICA Study Team
FEASIBILITY STUDY ON
NORTH LIMA METROPOLITAN AREA
WATER SUPPLY AND SEWERAGE OPTIMIZATION PROJECT (II)
FINAL REPORT
NIPPON KOEI CO.,LTD. 1-40 NIPPON KOEI LAC CO.,LTD
1.13 Funding
Funding for project execution foresees the use of resources from the Japanese Government financial cooperation through JICA, the International Bank for Reconstruction and Development (IBRD), and the German Government financial cooperation through the KfW Bankengruppe. These agencies are to sign agreements with SEDAPAL and the Peruvian Government (PG).
Financial conditions for a JICA loan would expected to be as follows:
• Interest rate: 1.40 % annual.
• Commission charges: 0.10 % annual.
(for undisbursed balances)
• Charges for outlay period extensions: 0.20% of the undisbursed amount multiplied times the number of years.
• Debt repayment period: 18 years
• Grace period: 6 years
Financial conditions for an IBRD loan would be as follows:
• Interest rate: LIBOR (6 months) + fixed spread.
• Commission charges: 0.35 % annual (with a 0.50 % discount).
(for undisbursed balances)
• Debt repayment period: 10 years
• Grace period: 5 years
Financial conditions for a KfW loan would be as follows:
• Interest rate: 5.46 % annual.
• Commission charges: 0.25 % annual.
(for undisbursed balances)
• Debt repayment period: 12 years
• Grace period: 3 years.
Proposed funding scheme for the project is shown in Table 1.13-1. It is noted that 82,6% of the project total cost will be funded with resources from JICA, IBRD, and KfW, and the remaining 17,4% will be funded by SEDAPAL’s own resources. The funding makeup by agencies is as follows: JICA accounting for 47,2%, which is equal to a loan amounting to 80.0 million US Dollars (7,264.1 million Yens), IBRD accounting for 17.7%, which is equal to 30 million US Dollars, KfW accounting for 17.7%, which is equal to 30 million US Dollars (24.6 million Euros); the remaining would be covered by SEDAPAL’s own resources. Average exchange rates3 for the currencies used are effective as of June 30th, 2010.
3 Exchange rate for purchase – sale of 1 USD = S/. 2,838 = Yen 90,80 = Euros 0,819, Bank and Insurance Companies Superintendent’s Office (SBS) – Perú, June, 2010.

FEASIBILITY STUDY ON
NORTH LIMA METROPOLITAN AREA
WATER SUPPLY AND SEWERAGE OPTIMIZATION PROJECT (II)
FINAL REPORT
NIPPON KOEI CO.,LTD. 1-41 NIPPON KOEI LAC CO.,LTD
Table 1.13-1: Project Funding Scheme by Source
(Currencies as of June 2010)
Source 2012 2013 2014 2015 2016 Total
USD % USD % USD % USD % USD % USD %
SEDAPAL 614,893 17.4% 1,990,811 17.4% 9,144,581 17.4% 11,533,428 17.4% 6,301,744 17.4% 29,585,457 17.4%
JICA 2,909,709 82.6% 5,383,214 47.2% 24,727,234 47.2% 31,186,750 47.2% 15,793,094 43.7% 80,000,000 47.2%
BIRF 2,018,705 17.7% 9,272,713 17.7% 11,695,031 17.7% 7,013,551 19.4% 30,000,000 17.7%
KfW 2,018,705 17.7% 9,272,713 17.7% 11,695,031 17.7% 7,013,551 19.4% 30,000,000 17.7%
Total 3,524,602 100% 11,411,435 100% 52,417,240 100% 66,110,240 100% 36,121,939 100% 169,585,457 100%
Source: JICA Study Team
1.14 Log Frame
The Log Frame matrix shows a consistency between the Project goal and the solution that is being set out; in addition, it shows results indicators that will allow for measuring the Project impact.
Table 1.14-1: Log Frame Matrix
Narrative Summary of Objectives Objectively verifiable indicators Means of
Verification Assumptions
EN
D To improve quality of life for
population in the Project’s area of influence
By year 5, 100 % of the population are content with the water supply and sewerage service quality offered by SEDAPAL
Project impact evaluation survey
No social problems in the areas around SEDAPAL’s scope
PU
RP
OS
E
To successfully offer a suitable water supply, sewerage, and operational management service in the project’s area of influence
By year 2 after implementation, total number of claims (both commercial and operative) have an 80 % decrease in the area of influence.
SEDAPAL Statistical Annual Report.
No external factors (disasters) that affect / deteriorate the infrastructure
CO
MP
ON
EN
TS
Water supply service improvement
• Technical or physical losses show up to a 25 % decrease in operation year 1, and up to a 20 % decrease during the remaining years of the project horizon (2035)
• Service continuity is on a 24-hour basis and with sufficient pressure for all sectors by operation year 1.
• Operative claims for breakages and water leakage have an 80 % decrease by operation year 2 of the Project
Annual report from the Leakage Control and Reduction Team, the Commercial Management Team, and the Network Operation and Maintenance Team in Callao and Comas
Operative budgets are allotted for water network operation, and system is interconnected to the Huachipa WTP distribution system
Wastewater collection service improvement
Clogs in networks and connections decrease down to 0.5 interventions per km by year 5 of the Project implementation. Operative claims for clogs and overflows have an 80 % decrease by year 5 of the Project implementation.
Annual report from the Network Operation and Maintenance Team in Callao and Comas
Budgets for Project operation are available, and primary collection and wastewater final disposal systems show no operational problems
The North Services Management (GSN) develops an efficient water supply and sewerage service management in the project’s area of influence
By year 1 of Project operation, the North Services Management has 100 % budgeted resources and maintenance equipment to develop a suitable preventative maintenance management. In this way, the Leakage Control and Reduction Team carries out all water leakage detection and control actions.
SEDAPAL Statistical Annual Report
Economic resources and staff available for Project operation
AC
TIV
ITIE
S
General works and rehabilitation for reservoirs, pumping stations, and Wells
• Installation of DI primary distribution pipes, DN 150 mm to DN 700 mm, 40.55 Km and 107 pressure reducing valves, air valves, purge valves and sluice valves.
• Cost: S/. 34.5 million.
Works appraisal and liquidation report
Economic resources available for Project execution

FEASIBILITY STUDY ON
NORTH LIMA METROPOLITAN AREA
WATER SUPPLY AND SEWERAGE OPTIMIZATION PROJECT (II)
FINAL REPORT
NIPPON KOEI CO.,LTD. 1-42 NIPPON KOEI LAC CO.,LTD
Rehabilitation for reservoirs, pumping stations, and Wells
Civil, hydraulic Works, equipment and rehabilitation for pumping stations, including automation and hydraulic equipment for 27 reservoirs, 4 pumping stations and 23 wells. Cost: S/. 32.5million
Works appraisal and liquidation report
Economic resources are available for Project execution
Potable water supply system
rehabilitation (secondary networks,
connection, and meters)
• Rehabilitation of 179.02 Km of pipes, installation of inlet to sector pipes pf 49.50 Km of, DN 100 mm to DN 400 mm, 228.52 km, including pressure reducing valves, air valves, drain valves and hydrants.
• Renewal of 70,289 connections
• Installation of 10,537 new meters Cost: S/. 153.9 million
Works appraisal and liquidation report
Economic resources are available for Project execution.
Automation and Control System • Automation and control – potable
water Cost: S/. 12.1 million
Valuation and liquidation of works
Available economic resources for the execution of the project
Wastewater collection system
rehabilitation (sewerage secondary
networks and house connections).
• Rehabilitation and/or renewal of existing sewerage networks in 237.49 Km, PVC, DN 200 to DN 400 mm: 166.28 km (trench) and 71.21 km PVC (trench- less).
• 3,302 new manholes installation and 1,415 manholes rehabilitation
• Renewal of 33,736 connections Cost: S/. 127.8million
Works appraisal and liquidation report.
Economic resources are available for Project execution.
Water supply and sewerage
operation and maintenance team
• Procurement of 2 mini hydro jet equipments, with vehicle, 6 hydro jet equipments, 6 m3 to 8 m3 with a tank truck for sewerage cleaning
• Procurement of 3 mobile equipment for TV camera inspection to sewerage networks.
• Water supply leakage detection equipment: 2 leakage location correlators, 4 geophones, and 200 mobile pre-locators and an equipped vehicle
• Computer equipment. Cost: S/. 20.8million
Equipment Reception (Handover) and Contract liquidation report.
Economic resources are available for Project procurement of equipment
Environmental mitigation, social
intervention, and facility cadastre
• Mitigation measures during Works construction phase.
• Environmental monitoring and follow-up during construction .
• Archaeological monitoring during construction
• Social awareness raising to population during Works execution.
• Technical cadastre to facilities, includes as-built drawings
Cost: S/. 24.3 million
Monthly report on environmental monitoring, archaeological remains, and social intervention programs.
As-built drawings, records, and descriptive memory.
Economic resources are available for Project execution. Population and municipalities participate actively.
a) Technical file includes
environmental and
archaeological remains studies.
b) Works supervision and
environmental monitoring and
follow-up.
c) Project management.
• Detailed design studies for works, includes EIA and CIRA.
Cost: S/. 25.0 million
• Supervision of works and environmental monitoring
• Social monitoring Cost: S/. 43.9 millones
• Project administration, technical, and financial management
Cost: S/. 6.6 million
Approval reports of detailed design studies for Works and procurement of equipment
Works supervision approval report
Project management report
Economic resources are available for Project execution The Executing Unit continues as an entity depending on General Management Office
Source: JICA Study Team
1.15 Conclussions and recommendations
• The project’s objective is to successfully accomplish a suitable water supply, sewerage, and operational management service in the Study area, as part of SEDAPAL’s Northern

FEASIBILITY STUDY ON
NORTH LIMA METROPOLITAN AREA
WATER SUPPLY AND SEWERAGE OPTIMIZATION PROJECT (II)
FINAL REPORT
NIPPON KOEI CO.,LTD. 1-43 NIPPON KOEI LAC CO.,LTD
Services Management performance goals. Improvement in the study area could become a management model and could be implemented in all areas of Northern Services Management.
• In that sense, the best method must be made of the commissioning of the Huachipa WTP; in this way, the project will optimize the distribution system’s operational control and will reduce technical losses towards the 20 % goal in the project’s operation year 2.
• The Project includes improving and renewing 179.02 km (22.1 % of the existing network’s total length) of water supply secondary networks, as well as installing 49.55 km of new pipelines, 70,289 connections and 10,537 new meters. It also includes installing 40,5 km of primary networks, and rehabilitating reservoirs (27), pumping stations (4), and wells (23). This involves civil works, installation of electromechanical equipment, automation, and SCADA system control.
• Renewal of 237.49 km (36.5 % of the existing network’s total length) has been foreseen for secondary sewerage networks. 30 % of this renewal will use the pipe jacking /pipe blasting method and 70 % will use the open cut method. Renewal of 33,736 connections is also foreseen.
• Total Project cost, all components included, amounts to S/. 481,284 thousand (JPY 15,398 million = USD 169,585 thousand).
• With regard to the project’s economic (social) evaluation results: NPV is S/. 41,5 million, and IRR is 12,8%. Investment value per capita for the project (networks and connections) is USD 205. This value is lightly less than compared to the reference value of USD 224 / inhabitant in urban areas as mentioned in SNIP Attachment 09 “Sewerage Network and Connection Extension without Primary Works”. Therefore, proposed investment for project is acceptable.
• Financial evaluation results, from SEDAPAL’s point of view, involve an ENPV of S/. /. 19.7 million and an IRR of 4.4% against a 3.92 % discount rate. Therefore, the project is financially viable for SEDAPAL. The project’s financial evaluation with possible funding conditions results show that SEDAPAL’s position would improve, with a FNPV of S/. 34.4 million, and an IRR of 6.5% against a 3.92 % discount rate. This is basically the result of the financial leverage generated by the favorable financial conditions from bank loans.
• Project implementation is expected to be start from 2012, and works should be completed by 2016. Operation is foreseen to be started around the last quarter of 2016.
• Project execution funding is foreseen to be based on resources from the Government of Japan’s financial cooperation, via JICA, the International Bank for Reconstruction and Development (IBRD), and the Government of Germany’s financial cooperation via KfW Bankengruppe. All of these agencies are to sign agreements with SEDAPAL and the Peruvian Government (PG).
• Proposed funding scheme for the Project will involve resources from JICA (USD 80 million), IBRD (USD 30 million), KfW (USD 30 million), and the remaining amount that is equal to 17,4% (USD 29.6 million) will come from SEDAPAL’s own resources.
• Project viability is recommended to be granted, as this feasibility study has proven that the Project is both socially and commercially profitable; and this is compatible with the sanitation sector policy alignments.

FEASIBILITY STUDY ON NORTH LIMA METROPOLITAN AREA WATER SUPPLY AND SEWERAGE OPTIMIZATION PROJECT (II)
FINAL REPORT
NIPPON KOEI CO.,LTD. 2-1 NIPPON KOEI LAC CO.,LTD
CHAPTER 2 GENERAL ASPECTS AND PROJECT IDENTIFICATION
2.1 Name of the Project
The name of the JICA Study is “North Lima Metropolitan Area Water Supply and Sewerage Optimization Project (II)”. This is equivalent to the Feasibility Study (F/S) for the Project, which is officially named by the Peruvian authority as “Optimization of the Infrastructure of the Water Supply and Sewerage Systems: Sectorization, Rehabilitation of Networks and Updating of the Cadastre of the North Service Management Office – Area of Influence of the Huachipa Plant – Areas of Drainage of the Sewers: Oquendo, Sinchi Roca, Puente Piedra and Sectors 83, 84, 85 and 212”.
In the last few years, SEDAPAL, the entity responsible for water supply and sewerage in Lima, has been developing projects and executing works aimed at the rehabilitation and improvement of the water supply and sewerage networks, including the sectorization of the water distribution network, for an efficient system operation that results in better client service.
In 1995, works under the project “Rehabilitation of the Water Supply and Sewerage System” were executed in different districts of Lima and Callao through the Loan Agreement 3811-PE between the Republic of Peru and the International Bank for Reconstruction and Development (IBRD, part of the World Bank group) and the Loan Agreement PE-P11 between the Republic of Peru and the Overseas Economic Cooperation Fund of Japan (OECF) (now the Japan International Cooperation Agency – JICA). However, many areas still have systems that present operational problems and considerable technical losses of water.
To provide better services, SEDAPAL has regional administrations and one of them is North Service Department (GSN), which focuses on the northern Lima area. Within the strategy of SEDAPAL to have enough production capacity and assure an adequate service for the growing population of northern part of Metropolitan Lima, projects for the north area of the city are being developed, such as the construction of the Huachipa Water Treatment Plant (WTP) and the construction of the North Brunch transmission pipe (Ramal Norte). These are being financed by the Japan Bank for International Cooperation (JBIC - now JICA).
However, within the administrative area of the North Service Department (GSN) of SEDAPAL, the levels of non revenue water (NRW) reach around 50%. This situation must be reversed to optimize the projects aim to increase supply, such as the Huachipa WTP. Due to this reason, network optimization turns out to be very urgent. In order to address this problem on a more localized basis, GSN divided its administrative zone into 4 parts, calling Lima Norte I, II, III and IV. The boundaries of these 4 zones are shown in Figure 2.1.1-1.
In September 2009, the Peruvian Government and the JICA signed a loan agreement for 5,550 million Japanese Yens (approximately 50 million dollars), which will allow SEDAPAL to finance the works of replacement, improvement and optimization of the old water supply and sewerage networks of Lima Norte I area. This area includes the drainage area of the Comas-

FEASIBILITY STUDY ON NORTH LIMA METROPOLITAN AREA WATER SUPPLY AND SEWERAGE OPTIMIZATION PROJECT (II)
FINAL REPORT
NIPPON KOEI CO.,LTD. 2-2 NIPPON KOEI LAC CO.,LTD
Chillón primary sewer. The project will benefit approximately 380 thousand inhabitants of the districts of Comas, Independencia, San Martin de Porres and Los Olivos.
The above-mentioned loan will finance the consultancy services for the detail designs (project files, as called by the Peruvian authority) and the supervision of works, as well as part of the investment. The total cost of the project is approximately 200 million dollars; and the remaining portion will be financed by the KfW of Germany, the World Bank and the SEDAPAL.
The Lima Norte I covers only part of the total GSN area and it was realized that there are other parts within the GSN area that also requires network rehabilitation, replacement and network optimization. In response to the Peruvian Government request, JICA agreed to finance a pre investment study for the Lima Norte II area at the level of pre Feasibility Study (Pre F/S, called Perfil by the Peruvian authority) named “Optimization of the Infrastructure of the Water Supply and Sewerage Systems: Sectorization, Rehabilitation of Networks and Updating of the Cadastre of the North Service Management Office – Area of Influence of the Huachipa Plant – Areas of Drainage of the Sewers: Oquendo, Sinchi Roca, Puente Piedra and Sectors 83, 84, 85 and 212”. A contract for consultancy was signed between JICA and a consultant on March 30, 2009, thus commencing the second stage of optimization within GSN area. The first draft of this study was ready by September, 2009. After several scrutiny conducted by various agencies and subsequent revision and updating, the then DGPM (currently renamed as Directorate General of Investment Policies, DGPI under the Ministry of Economy and Finance, MEF) approved the Perfil Study and authorized the preparation of F/S on February 28, 2011. Concurrently, the Peruvian Government requested JICA to carry out a Feasibility Study Project for the Lima Norte II area at the level of F/S (this Study). JICA agreed to this request and a contract was signed on December 17, 2009. JICA entrusted the Study to the consultant Nippon Koei and the field work has been started from April, 2010. The Final Report of this JICA Study will also serve as the basis of the F/S report of the Project.
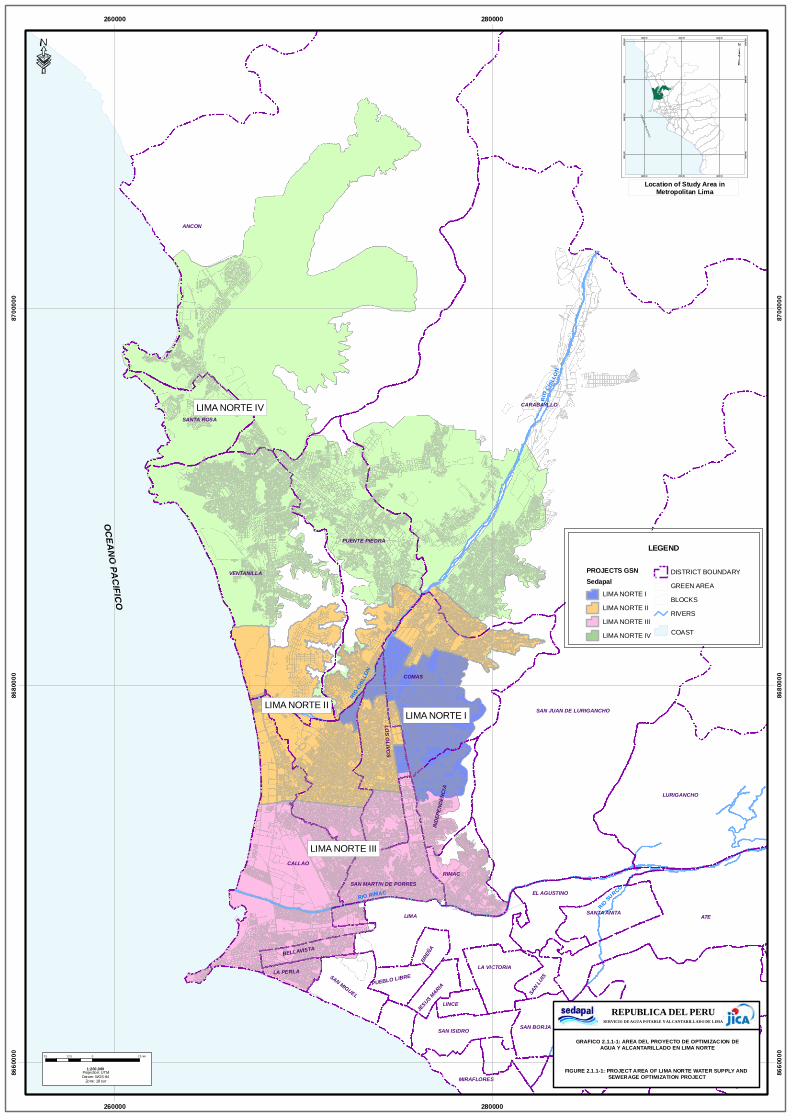
VENTANILLA
CALLAO
LIMA NORTE IV
LIMA NORTE II
LIMA NORTE III
LIMA NORTE I
ANCON
CARABAYLLO
SAN JUAN DE LURIGANCHO
ATE
COMAS
LURIGANCHO
LA MOLINA
PUENTE PIEDRA
LIMA
SAN MARTIN DE PORRES
LOS OLIVOS
SANTA ROSA
RIMAC
EL AGUSTINO
SANT
IAGO D
E SUR
CO
INDE
PEND
ENCI
A
SAN BORJA
SANTA ANITA
SAN ISIDRO
SAN MIGUEL
LA VICTORIA
MIRAFLORES
PACH
ACAM
AC
BELLAVISTA
LINCE
BREÑ
A
SAN LU
IS
PUEBLO LIBRE
JESUS MARIA
LA PERLA
RIO RIMA C
RIO
CHILL
O N
RIO SURCO
RIO CHILL
ON
OCEANO PACIFICO
260000
260000
280000
280000
8660
000
8660
000
8680
000
8680
000
8700
000
8700
000
·
LEGEND
PROJECTS GSNSedapal
LIMA NORTE ILIMA NORTE IILIMA NORTE IIILIMA NORTE IV
DISTRICT BOUNDARYGREEN AREABLOCKSRIVERS
COAST
2.5 0 2.51.25 km
1:200,000Projection: UTMDatum: WGS-84
Zone: 18 sur
³
OCEANO PACIFICO
2600 00
2600 00
2900 00
2900 00
3200 00
3200 00
8630
000
8630
000
8660
000
8660
000
8690
000
8690
000
8720
000
8720
000
³
Location of Study Area inMetropolitan Lima
PROYECTO :
SERVICIO DE AGUA POTABLE Y ALCANTARILLADO DE LIMAREPUBLICA DEL PERU
GRAFICO 2.1.1-1: AREA DEL PROYECTO DE OPTIMIZACION DEAGUA Y ALCANTARILLADO EN LIMA NORTE
FIGURE 2.1.1-1: PROJECT AREA OF LIMA NORTE WATER SUPPLY AND SEWERAGE OPTIMIZATION PROJECT

FEASIBILITY STUDY ON NORTH LIMA METROPOLITAN AREA WATER SUPPLY AND SEWERAGE OPTIMIZATION PROJECT (II)
FINAL REPORT
NIPPON KOEI CO.,LTD. 2-4 NIPPON KOEI LAC CO.,LTD
2.2 Formulating and Executing Unit
The executing unit for the Project is SEDAPAL. It was originally created as the Water Supply and Sewerage Company of Lima in 1855, for the administration of the water supply and sewerage services for the city of Lima. In 1962 it became COSAL (Sanitation Corporation of Lima), which changed its legal name to ESAL (Sanitation Company of Lima) in 1971. In 1981 this was transformed into SEDAPAL (Water Supply and Sewerage Service of Lima), which is currently in operation. SEDAPAL is in charge of the 49 districts that constitute the city of Metropolitan Lima and the Constitutional Province of Callao. Out of these, SEDAPAL provides total service to 46 districts while it provides partial service to 3 districts. The names and address of the responsible persons for this Project are given below.
Name of the Formulating Unit : Servicio de Agua Potable y Alcantarillado de
Lima - SEDAPAL Sector : Fondo Nacional de Financiamiento de la
Actividad Empresarial del Estado - FONAFE
Name of the responsible officer : Ing. Samuel Trujillo - Manager of Development and Research
Address : Autopista Ramiro Priale Nº 210 – El Agustino Phone Number : 317-3018 / 317-3019 Fax : 317-3406 Email : [email protected] Name of the Executing Units : Servicio de Agua Potable y Alcantarillado de
Lima – SEDAPAL Sector : Fondo Nacional de Financiamiento de la
Actividad Empresarial del Estado - FONAFE
Name of the responsible officer : Econ. Jorge José Barco Martínez - Gerente General
Address : Autopista Ramiro Priale Nº 210 – El Agustino Phone Number : 317-3121 / 317-3007 Fax : 317-3406 Email : [email protected]
2.3 Participation of the Relevant Entities and Beneficiaries
In this section, the interests and problems are identified for the entities directly involved in relation to the Project.
2.3.1 Water Supply and Sewerage Service of Lima - SEDAPAL
SEDAPAL is an autonomous organization of the Ministry of Housing, Construction and Sanitation and its main purpose is to provide water supply and sanitation services in the Metropolitan Lima. SEDAPAL is also responsible to promote the system sustainability, expand the coverage, and improve the quality of the service.

FEASIBILITY STUDY ON NORTH LIMA METROPOLITAN AREA WATER SUPPLY AND SEWERAGE OPTIMIZATION PROJECT (II)
FINAL REPORT
NIPPON KOEI CO.,LTD. 2-5 NIPPON KOEI LAC CO.,LTD
As the sanitation service rendering company, its main mission is to contribute to the improvement of the living standard of the population. In addition it is also responsible for:
• Administrating the water resources.
• Collecting and disposing of wastewaters.
• Preserving the environment .
• Promoting, facilitating and financing the construction of water supply and sewerage systems in its area of influence.
• Formulating and approving the pre investment studies, as well as supervising the implementation of the water supply and sewerage facilities.
• Facilitating the financial resources for the development of the capacity building and organization of the community.
• Assuring the timely supply of safe water to the coverage population.
2.3.2 Ministry of Housing, Construction and Sanitation
This is the regulatory entity regarding housing, urban development, construction of infrastructure and sanitation. This ministry is in charge of promoting the sustainability of the water supply and sewerage network, the expansion of the coverage, and the improvement of the service quality in coordination with the regional and local governments. In addition, this ministry is in charge of formulating the relevant plans and programs. Through its Office of Planning and Budget (Office of Investment Programming), it evaluates and approves the pre investment studies of the sector and requests the Ministry of Economy and Finances (MEF) to authorize subsequent study or investment following National Public Investment System (SNIP) guideline which was prepared by MEF in 2000.
Since the present Project involves external loan finance, this ministry shall seek the approval and Declaration of Viability of the Project from the General Directorate of Investment Policies under the (MEF).
2.3.3 National Sanitation Authority (DNS)
As a line organization of the Vice Ministry of Construction and Sanitation (VMCS), this department is in charge of policies, plans, programs and norms related to the sanitation services, with the purpose of expanding the coverage and improving the service quality of water supply, sewerage, and excreta disposal. It also reviews and approves the environmental impact studies for the projects of Housing, Construction and Sanitation.
2.3.4 Ministry of Health (MINSA)
The Ministry of Health has the mission of protecting personal dignity, promoting health, preventing diseases and assuring integral health care for all population of the country, through their representative establishments (local health authorities), such as health care centers and health care posts. Moreover, this ministry regularly monitors the water quality through

FEASIBILITY STUDY ON NORTH LIMA METROPOLITAN AREA WATER SUPPLY AND SEWERAGE OPTIMIZATION PROJECT (II)
FINAL REPORT
NIPPON KOEI CO.,LTD. 2-6 NIPPON KOEI LAC CO.,LTD
processes conducted by the Directorate General of Environmental Health (DIGESA) and others. They also participate in the formulation of sanitary policies in agreement with the relevant public sectors.
2.3.5 Ministry of Economy and Finances (MEF)
This ministry has the objective of optimizing the public economic and financial activities, establish the macro economic activity and accomplish the sustainable economic growth of the country. This ministry, through the Directorate General of Investment Policies (DGPI), is entitled to approve the pre investment study at the level of Pre F/S (Perfil) and authorize the development of the pre investment study at the level of Feasibility, or, if it is the case, declares the viability of the Project.
In the framework of the Project, MEF participates as the guarantor of the external funds to be arranged, for example from JICA and/or World Bank.
2.3.6 Directorate General of Investment Policies (DGPI)
This is the line organization in charge of directing, integrating, following up and evaluating public investments including the programming of such public investment, and the promotion of integral development in relatively underdeveloped areas. Furthermore, this office is in charge of declaring the viability of projects to be financed with external loans and recommending their execution for both public investments and private finance.
2.3.7 The National Superintendence of Sanitation Services (SUNASS)
SUNASS is a decentralized public organization under the Cabinet Ministry. It is the regulating entity of the sanitation sector with administrative, functional, technical, economic and financial autonomy. It carries out the functions of supervising, regulating, controlling, penalizing and resolving controversies and claims from the users, in accordance with the scopes and limitations established by law. The scope of SUNASS includes both public and private utilities.
2.3.8 National Fund for the Financing of the Public Business Activity (FONAFE)
FONAFE is a public company under the MEF, created by Act No. 27170, in charge of regulating and directing public business activities. This organization supports and coordinates the financing of investment projects. The Programming and Investment Office (OPI) of FONAFE, in the framework of SNIP, will be in charge of evaluating the pre investment studies and requesting the DGPI of MEF to approve the Perfil and authorize the preparation of the pre investment study at the level of Feasibility, or, if it is the case, to declare the viability of the Project.
2.3.9 District Municipalities in the Area of the Project
The districts municipalities in the area of the Project (Carabayllo, Comas, Los Olivos, Puente Piedra, San Martín de Porres, Callao and Ventanilla) participate in the framework of their

FEASIBILITY STUDY ON NORTH LIMA METROPOLITAN AREA WATER SUPPLY AND SEWERAGE OPTIMIZATION PROJECT (II)
FINAL REPORT
NIPPON KOEI CO.,LTD. 2-7 NIPPON KOEI LAC CO.,LTD
authority and responsibility as described in Act N° 27972 – Ley Orgánica de Municipalidades en Materia de Saneamiento, Salubridad y Salud (Organic Act of Municipalities, on Sanitation, Health and Health care); Article 80 Item 4.1: “Administrar y reglamentar directamente o por concesión el servicio de agua potable, alcantarillado y desagüe”. (Administrate and regulate the water supply and sewerage services, directly or by concession)
2.3.10 Japan International Cooperation Agency - JICA
JICA is in charge of executing the technical cooperation program of the Japanese government, and financing investments and consultancy services for the development of economic and social infrastructure, as well as for the protection of the environment and the conservation of natural resources. This cooperation is defined as government to government. Since its creation in 1974, JICA has been supporting the socio-economic development and the development of human resource in developing countries including Peru.
In the context of the Project, JICA contributed for the Pre F/S investigation. JICA is also contributing this Study with both financal and technical expertise, and this Study will serve as the F/S for the Project. For the execution, JICA is expected to provide considerable support by providing a financial loan under preferential conditions, besides the technical assistance for the adequate implementation of the Project.
2.3.11 International Bank of Reconstruction and Development (IBRD)
The International Bank for Reconstruction and Development (IBRD) aims to reduce poverty in middle-income and creditworthy poorer countries by promoting sustainable development through loans, guarantees, risk management products, and analytical and advisory services. IBRD provides loans to governments and public companies, always with a government (or sovereign) guarantee of reimbursement. The funds for these loans come, mainly, from bonds issued by the World Bank in the global capital market – usually between US$12 and 15 billion per year.
In the context of the Project, it is expected that IBRD will contribute in the execution.
2.3.12 Kreditanstalt Fur Wiederaufbau (KfW)
The aim of Kreditanstalt Fur Wiederaufbau (KfW) is to promote the economic development of developing countries by making long-term financing. This agency finances investments and consulting services for the development of economic and social infrastructure, as well as for the protection of the environment and the conservation of natural resources. This cooperation is defined as government to government.
In the context of the Project, it is expected that KfW will contribute in the execution.
2.3.13 Project Beneficiaries
The direct beneficiaries of the Project are the service users of the areas influenced by the Project. The benefitted population does not participate directly in the stage of identification

FEASIBILITY STUDY ON NORTH LIMA METROPOLITAN AREA WATER SUPPLY AND SEWERAGE OPTIMIZATION PROJECT (II)
FINAL REPORT
NIPPON KOEI CO.,LTD. 2-8 NIPPON KOEI LAC CO.,LTD
and design of the project, but they have contributed to this through their complaints and reports. However, in the course of EIA, public opinion will be collected and reflected in the project detailing stage.
In the stage of execution, they will participate by respecting the safety indications placed by the contractor in the surroundings of the work site and by cooperating with the contractor to mitigate the impact of the works on the pedestrian and traffic flow and on the urban landscape.
In the stage of operation and maintenance, the beneficiaries participate by using the facilities and services appropriately. Moreover, they contribute to the sustainability of the services through their monthly payments and their complaints regarding failures and anomalies that may occur.
2.3.14 Ministry of Environment (MINAM)
The Ministry of Environment has the objective of preserving environmental quality and assuring a balanced environment appropriate for the development for the present and future generations. With this purpose, it promotes and ensures the sustainable, responsible, rational and ethical use of natural resources and the environment that supports it, and contributes to social, economic and cultural sustainable development of the human individual, in permanent harmony with its environment. Likewise, this ministry shall promote sustainable development, through control and conservation measures regarding environmental quality, urban planning and environmental management. This ministry also promotes actions of basic sanitation and solid waste management that assure adequate environmental quality in the urban centers and especially in tourist destinations.
2.3.15 Contractors of SEDAPAL
Contractors are companies hired by SEDAPAL to conduct several activities. (i) CONCYSSA (Construcciones Civiles y Sanitarias S.A) is in charge of the maintenance of the water and sewerage networks, preventive and corrective maintenance of valves and fireplugs, cleansing and disinfection of storage facilities, tank trucks; as well as of construction of house-connections for water supply and sewerage. (ii) AZB – HCI is in charge of the Implementation of the Integral System of Commercial Activities (SIAC) which includes the supply and installation of meters, initial maintenance, corrective actions, as well as the integral management of persuasive actions.
2.3.16 Summary
The involved entities and the benefited population will participate according to their interests and strategies to solve the conflicts (for example, deficient water supply and sanitation services), as well as fulfilling the agreements and commitments made. Table 2.3.16-1 shows the analysis of the beneficiaries and involved entities, including interests, problems, resources and directives.

FEASIBILITY STUDY ON NORTH LIMA METROPOLITAN AREA WATER SUPPLY AND SEWERAGE OPTIMIZATION PROJECT (II)
FINAL REPORT
NIPPON KOEI CO.,LTD. 2-9 NIPPON KOEI LAC CO.,LTD
Table 2.3.16-1: Interests, Identified Problems and Commitments of the Involved Parties
Group Interests Identified Resource and Problems Directives
Ministry of Housing Construction and Sanitation
Wellbeing of the population through the water supply and sewerage services provided by SEDAPAL
The quality of the services in the area of influence is below the sector objectives.
Verification of the pertinence of the proposal and its agreement with the policies of the Sector.
SEDAPAL Administrate and operate appropriately the systems of production, distribution, collection, loss-reduction and increase of sales.
Bad condition of the networks, discontinuity of the service, considerable loss of water.
Resources and faculties to operate and maintain the water supply and sewerage service.
Ministry of Economy and Finances– MEF
Adequate and efficient allocation of resources for social wellbeing.
Loss of resources due to the deficient operation of the systems in the area.
Verification of the technical, economic, social and financial viability of the proposal.
FONAFE
In charge of regulating and directing the public business management.
SEDAPAL does not have the necessary financial resource for the financing of investments that improve the services.
Support and coordination with the financial entities for the financing of the Project. Approval and verification of the technical, economic, social and financial viability of the Project.
Ministry of Environmental Affairs (MINAM)
It is in charge of looking after the environmental quality conservation, and ensuring a right to enjoy a balanced environment by the present and future generations.
Environmental and natural resource degradation
To verify the proposal’s relevance and compliance with the sector’s policies.
Population of the districts under the North Service Center
To have a good water supply service (continuity, pressure and quality) and sewerage.
Insufficient water quantity, low pressures, blockages, leaks, hours of insufficient service, wastewater overflow and deterioration of road condition due to pipe collapse
Support to the Project, cooperating with the execution, using the service appropriately, and committing to the payment of the monthly service rate.
District Municipalities– NSC
To have a good water supply service (Continuity, pressure and quality) and sewerage.
Insufficient water quantity, low pressures, blockages, leaks, and hours of insufficient service. Problems in urban transportation due to the deterioration of public roads and floors. Dissatisfaction of the population due to having a restricted service.
Support to the project with norms and actions that promote and adequate use of the services and the conservation of the infrastructure.
International Cooperation Agencies: JICA, Kfw, IBRD and others
Contribute to the well being and improvement of the life quality of the population.
Lack of financial resources for the execution of the program for the partial or total replacement of old and deteriorated sanitary infrastructure.
Provision of reimbursable financing with the guarantee of the State and favorable long-term financial conditions; grace period, preferential interest rates; as well as technical support and advice.
Health Care Centers of the districts under the NSC
Contribute to the improvement of health, reducing the demand of health care.
Lack of the necessary staff and infrastructure for responding to the populations demands, due to the low water quality.
Monitoring of health indicators and report the improvement of the life quality of the population.
SUNASS Efficient rendering of the water supply and sewerage services.
High number of complaints due to deficient water supply and sewerage service rendering
Supervise, regulate, control, sanction and solve controversies and complaints of the users.
Contractors of SEDAPAL for the maintenance of the water supply and sewerage systems
To be awarded contracts that are viable to be implemented and that assure them a reasonable profit, with manageable risks.
An updated technical commercial cadastre is not available. Its activities are limited to the contract. They do not include all the activities of the Department. Activities of rehabilitation and expansion are not conducted.
In charge of the preventive and corrective maintenance of the water distribution and collection systems; as well as the activities of the Integral Commercial System (SIAC)
Source: JICA Study Team
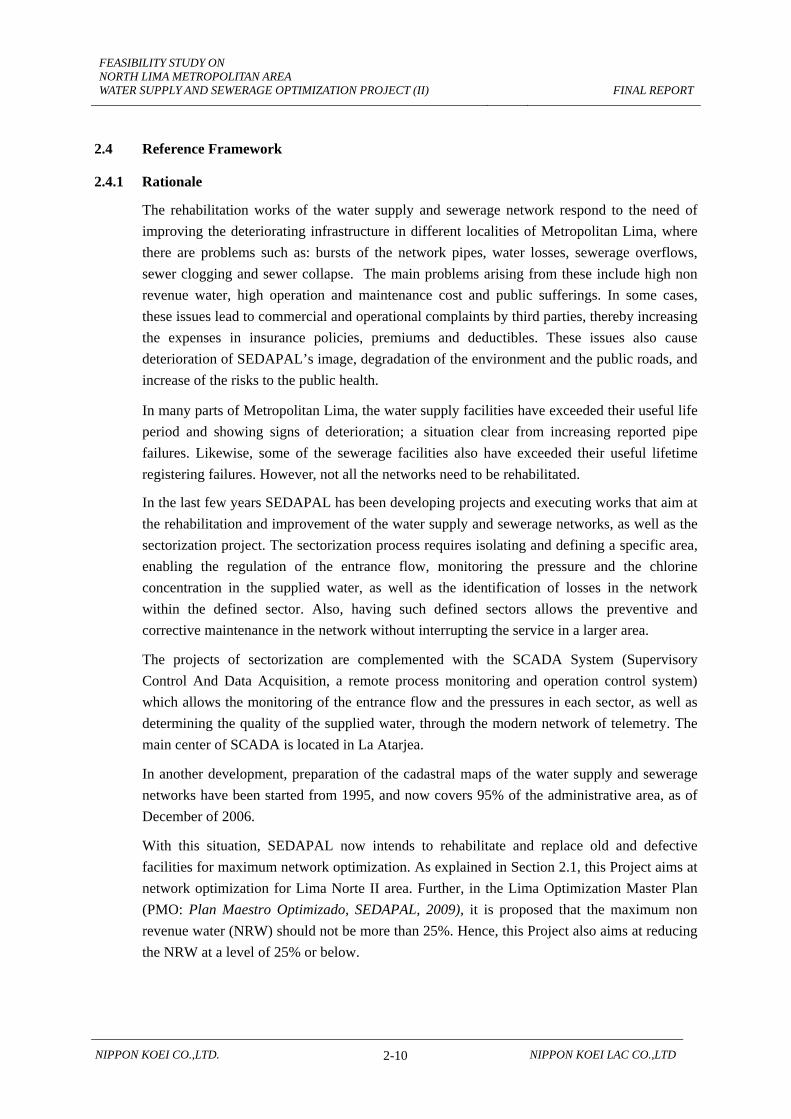
FEASIBILITY STUDY ON NORTH LIMA METROPOLITAN AREA WATER SUPPLY AND SEWERAGE OPTIMIZATION PROJECT (II)
FINAL REPORT
NIPPON KOEI CO.,LTD. 2-10 NIPPON KOEI LAC CO.,LTD
2.4 Reference Framework
2.4.1 Rationale
The rehabilitation works of the water supply and sewerage network respond to the need of improving the deteriorating infrastructure in different localities of Metropolitan Lima, where there are problems such as: bursts of the network pipes, water losses, sewerage overflows, sewer clogging and sewer collapse. The main problems arising from these include high non revenue water, high operation and maintenance cost and public sufferings. In some cases, these issues lead to commercial and operational complaints by third parties, thereby increasing the expenses in insurance policies, premiums and deductibles. These issues also cause deterioration of SEDAPAL’s image, degradation of the environment and the public roads, and increase of the risks to the public health.
In many parts of Metropolitan Lima, the water supply facilities have exceeded their useful life period and showing signs of deterioration; a situation clear from increasing reported pipe failures. Likewise, some of the sewerage facilities also have exceeded their useful lifetime registering failures. However, not all the networks need to be rehabilitated.
In the last few years SEDAPAL has been developing projects and executing works that aim at the rehabilitation and improvement of the water supply and sewerage networks, as well as the sectorization project. The sectorization process requires isolating and defining a specific area, enabling the regulation of the entrance flow, monitoring the pressure and the chlorine concentration in the supplied water, as well as the identification of losses in the network within the defined sector. Also, having such defined sectors allows the preventive and corrective maintenance in the network without interrupting the service in a larger area.
The projects of sectorization are complemented with the SCADA System (Supervisory Control And Data Acquisition, a remote process monitoring and operation control system) which allows the monitoring of the entrance flow and the pressures in each sector, as well as determining the quality of the supplied water, through the modern network of telemetry. The main center of SCADA is located in La Atarjea.
In another development, preparation of the cadastral maps of the water supply and sewerage networks have been started from 1995, and now covers 95% of the administrative area, as of December of 2006.
With this situation, SEDAPAL now intends to rehabilitate and replace old and defective facilities for maximum network optimization. As explained in Section 2.1, this Project aims at network optimization for Lima Norte II area. Further, in the Lima Optimization Master Plan (PMO: Plan Maestro Optimizado, SEDAPAL, 2009), it is proposed that the maximum non revenue water (NRW) should not be more than 25%. Hence, this Project also aims at reducing the NRW at a level of 25% or below.

FEASIBILITY STUDY ON NORTH LIMA METROPOLITAN AREA WATER SUPPLY AND SEWERAGE OPTIMIZATION PROJECT (II)
FINAL REPORT
NIPPON KOEI CO.,LTD. 2-11 NIPPON KOEI LAC CO.,LTD
This report contains the results of the analysis conducted according to the terms of reference and the regulations established in Act 27293: National Public Investment System (SNIP, prepared by MEF, 2000). Main topics are as follows;
• Diagnosis of socioeconomic and demographic conditions of the Project area.
• Diagnosis of the water supply and sewerage systems, supply methods and drainage areas, and identification of constraints that prevent the maximum use of the installed capacity. Diagnosis of commercial and institutional aspects is also included.
• Analysis and proposal of solutions for the improvement of the water and sewerage infrastructure.
• Plan for the implementation.
2.4.2 Reference Background Database
For the preparation of the Report, the following information sources were used:
• Pre investment Study at the level of Perfil for the “Optimization of the Infrastructure of the Water Supply and Sewerage Systems: Sectorization, Rehabilitation of Networks and Updating of the Cadastre of the North Service Management Office – Area of Influence of the Huachipa Plant – Areas of Drainage of the Sewers: Oquendo, Sinchi Roca, Puente Piedra and Sectors 83, 84, 85 and 212”. Development and Investigation Department – North Service Department of SEDAPAL, Nippon Koei LAC, January, 2010.
• Pre investment Study at the level of Feasibility “Optimization of the Water Supply and Sewerage Systems, Sectorization, Rehabilitation of Networks and Updating of the Cadastre – Area of Influence of the Huachipa Plant – Comas – Chillón Drainage Area”. Development and Investigation Department – North Service Department of SEDAPAL, October 2008
• “Optimization of the Water Supply and Sewerage Systems, Sectorization, Rehabilitation of Networks and Updating of the Cadastre – Area of Influence of the Huachipa Plant – Comas – Chillón”. Development and Investigation Department –North Service Department of SEDAPAL, Caduceo Consultores S.A., Lima, September 2007.
• Information on existing situation of the networks: age, material, valves and accessories.
• Information on current situation of the Sectorization Process.
• Definite Study for the Sectorization of the Central System of Distribution of La Atarjea Centro (Asociación Binnie & Partners- Binnie & Livesey & Asociados S.A. BLASA), which has Manuals of Operation and Maintenance for the sectorization and the SCADA System.
• Information on projects executed in the last few years for the rehabilitation of water supply and sewerage networks.
• Information on projects under execution for the rehabilitation of water supply and sewerage networks.
• Statistics of bursts, blockages, replacements and repairs of water supply and sewerage

FEASIBILITY STUDY ON NORTH LIMA METROPOLITAN AREA WATER SUPPLY AND SEWERAGE OPTIMIZATION PROJECT (II)
FINAL REPORT
NIPPON KOEI CO.,LTD. 2-12 NIPPON KOEI LAC CO.,LTD
pipes.
• Description of the operational problems and identification of their possible causes.
• Number of users, average consumption, connections with and without meters, amount of non-revenue water, average water demand per user groups.
• Drawing of the sectors and water and sewerage networks.
• Inventory of the water supply and sewerage network
Also, as part of the diagnosis and according to the terms of reference, the following activities were carried out:
• Evaluation of the water supply and sewerage infrastructure regarding its physical status, age, capacity, and current operation regime, for both primary and secondary networks.
• Evaluation of the current sources of water supply and distribution.
• Current situation and evaluation of the operation of the water and sewerage networks.
Based on the evaluation carried out on the current conditions, main problems have been defined. Alternate solutions have then proposed and best solution is identified from the technical, social, economic and environmental evaluations.
2.4.3 Legal Framework
The Project responds to the policies and strategic objectives of the Sanitation Sector, which aim to expand the coverage, as well as improving the quality of the water supply and sewerage services. These policies are defined in the Multi Annual Strategic Sectoral Plan of the Sanitation Sector for 2008-2015 (Plan Estratégico Sectorial Multianual del Sector Saneamiento 2008-2015). The investment in the Project is expected to improve the management system and the economic and financial viability of SEDAPAL. This is in line with the functional policies of the National Public Investment System (SNIP) and the General Act of Sanitation Services.
The Project also complies with the social objective of SEDAPAL; i.e., rendering the water supply and sewerage services to the population of the provinces of Lima and Callao, and improving the continuity and sustainability of the supplied services. In this sense, the proposed Project is compatible with the policies of the company, as defined in the Optimization Master Plan (PMO: Plan Maestro Optimizado, SEDAPAL, 2009).
a) Act Nº 26338, General Law of Sanitation Services (Ley Nº 26338: Ley General de Servicios de Saneamiento) (July/24/1994)
b) Supreme Decree N° 023-2005-Vivienda, Regulations of the General Law of Sanitation Services, Act Nº 26338 (Decreto Supremo Nº 023-2005-ViviendaTexto Único Ordenado del Reglamento de la Ley General de Servicios de Saneamiento, Ley N° 26338) (December/1/2005)
c) Supreme Decree N° 010-2007-Vivienda, Modifying the Regulations of the General Law of Sanitation Services (Decreto Supremo Nº 010-2007-Vivienda modificando el Texto Único Ordenado del Reglamento de la Ley General de Servicios de Saneamiento).
FEASIBILITY STUDY ON NORTH LIMA METROPOLITAN AREA WATER SUPPLY AND SEWERAGE OPTIMIZATION PROJECT (II)
FINAL REPORT
NIPPON KOEI CO.,LTD. 2-13 NIPPON KOEI LAC CO.,LTD
(April/20/2007).
d) Supreme Decree N° 002-2008-Vivienda, Modifying Art. 103° of the Regulations of the General Law of Sanitation Services (Decreto Supremo Nº 002-2008-Vivienda Modificando el Art. 103º del Texto Único Ordenado del Reglamento de la Ley General de Servicios de Saneamiento. (February/7/2008).
e) Supreme Decree N° 031-2008-Vivienda, Modifying the Regulations of the General Law of Sanitation Services (Decreto Supremo Nº 031-2008-Vivienda Modificando el Texto Único Ordenado del Reglamento de la Ley General de Servicios de Saneamiento. (November/30/2008).
f) Act N° 28870, Law for Optimizing the Sanitation Utilities Management (Ley Nº 28870: Ley para optimizar la gestión de las Entidades Prestadoras de Servicios de Saneamiento (August/2006)
g) Supreme Decree N° 006.2007-EF, Regulation of Act Nº 28870 of February 5th, 2007. (Decreto Supremo N° 006.2007-EF, Reglamento de la Ley 28870 del 5 de febrero del 2007)
h) Law Decree Nº 25965; Law for the Creation of the National Superintendence of Sanitation Services (Decreto Ley Nº 25965: Ley de Creación de la Superintendencia Nacional de Servicios de Saneamiento) (December/19/1992).
i) General Regulations of SUNASS, Supreme Decree Nº 017-2001-PCM (Reglamento General de la SUNASS, Decreto Supremo Nº 017-2001-PCM) (February/21/2001).
j) Supreme Decree N° 023-2002-PCM, Modifying the General Regulations of SUNASS (Decreto Supremo N° 023-2002-PCM, Modifican el Reglamento de la Ley General de la SUNASS). (April/4/2002).
k) Supreme Decree N° 035-2006-PCM, Approving the TUPA of SUNASS (Decreto Supremo N° 035-2006-PCM, Aprueban el TUPA de la SUNASS) (July/5/2006)
l) Act Nº 27293, Law that Creates the National System of Public Investment (Ley Nº 27293, Ley que crea el Sistema Nacional de Inversión Pública), modified by Acts Nº 28522 and 28802 of May 25th of 2005 and July 21 of 2006 respectively and the Legislative Decree Nº 1005 of May 3th of 2008 and Nº 1091 of June 21st of 2008.
m) Supreme Decree Nº 102-2007- Regulations of the National System of Public Investment (Decreto Supremo Nº 102-2007 - Reglamento del Sistema Nacional de Inversión Pública), of July 19th, 2007 and modified by the Supreme Decree Nº 038-2009-EF (February/15/2009).
n) Directive Resolution Nº 001-2011-EF/68.01, General Directive of the National System of Public Investment (Resolución Directoral Nº 002-2009-EF/68.01, Directiva General del Sistema nacional de Inversión Pública) (April 9th of 2011).
o) Directive Resolution Nº 003-2009-EF/68.01, Complementary Orders for the Investment Phase of the Project Cycle in the Framework of the National System of Pulic Investment (Resolución Directoral Nº 003-2009-EF/68.01, Disposiciones complementarias para la fase de inversión del ciclo del proyecto en el marco del Sistema Nacional de Inversión Pública) (March/21/2009).
p) Act Nº 27972; Organic Law of Municipalities (Ley Nº 27972: Ley Orgánica de Municipalidades.
q) Ministerial Resolution 920-2008-VIVIENDA, Multi-Annual Strategic Sectoral Plan for 2008-2015 of the Ministry of Housing, Construction and Sanitation (Resolución

FEASIBILITY STUDY ON NORTH LIMA METROPOLITAN AREA WATER SUPPLY AND SEWERAGE OPTIMIZATION PROJECT (II)
FINAL REPORT
NIPPON KOEI CO.,LTD. 2-14 NIPPON KOEI LAC CO.,LTD
Ministerial 920-2008-VIVIENDA, Plan Estratégico Sectorial Multianual 2008-2015 del Ministerio de Vivienda, Construcción y Saneamiento) (December/31/2008).
r) Master Plan for the Water Supply and Sewerage System of Lima and Callao for 2009-2030 (Plan Maestro de los Sistemas de Agua Potable y Alcantarillado de Lima y Callao 2009-2030).
s) General Management Resolution 081-2008-SUNASS-GG, Regulations for the Rendering of Sanitation Services by SEDAPAL S.A (Resolución de Gerencia General 081-2008-SUNASS-GG, Reglamento de Prestación de Servicios de Saneamiento de la Empresa SEDAPAL S.A.) (August/18/2009)
t) Public Sector Indebtedness Law for 2010 Fiscal Year (Ley de Endeudamiento del Sector Público para el Año Fiscal 2011).
FEASIBILITY STUDY ON NORTH LIMA METROPOLITAN AREA WATER SUPPLY AND SEWERAGE OPTIMIZATION PROJECT (II)
FINAL REPORT
NIPPON KOEI CO.,LTD. 2-15 NIPPON KOEI LAC CO.,LTD
2.5 Diagnosis of Existing Situation
This section introduces and analyzes all variables for a reference framework in which the Study is carried out and operated. It also attempts to define the problem and to help set out objectives and solution to address the constraints.
2.5.1 Study Area
The Study area lies within the boundaries of the following districts: Comas, Carabayllo, Los Olivos, Puente Piedra, San Martin de Porres, Callao, and Ventanilla; the first five districts belong to the Lima Province while the last two belongs to the Callao Region, but all are the parts of northern Metropolitan Lima. The Study area is located within the operational jurisdiction of SEDAPAL North Services Management (GSN), and it is part of the area where water will be supplied by the under-construction Huachipa Potable Water Treatment Plant. As explained in Section 2.1 and 2.4, GSN divided its command area into four parts, namely Lima Norte I, II, III, and IV, and Lima Norte II is the Study Area. The Study Area is defined in the pre F/S (perfil) of this Project as “Area of Influence of the Huachipa Plant – Areas of Drainage of the Sewers: Oquendo, Sinchi Roca, Puente Piedra and Sectors 83, 84, 85 and 212”.
Each district is divided by SEDAPAL into several distribution sectors. However, it is to be noted that all sectors of these 7 districts are not included in this Study Area. A total of 32 sectors are the subject area of this Study. General Location of the Study area with SEDAPAL’s sector boundary is shown Figure 2.5.1-1.
The Study area is geographically located on the Pacific Coast, at 77º03’ west longitude from the Greenwich Meridian, and at 11º55’ south latitude from the Equator. The area is situated at 137 m above mean sea level. The Rimac River crosses the city following an east – west direction, and discharges at the north of the Callao port.
The nearest meteorological station near the Study area is located at the Jorge Chavez International Airport. The maximum monthly temperature registered there for the last 12 years never exceeded 32.9 °C, except for the December 1997 – 1998 period, because of the El Niño phenomenon. The maximum monthly temperatures during the winter months in 2007, 2008, and 2009 ranged between 19.4ºC (September, 2007) and 23.3ºC (July, 2007).
Long term average precipitation is around 40 mm / year, and gradually increases from May, and starts decreasing from November. The lowest peak is registered in April.
The relative humidity percentage in the Lima and Callao districts shows very high values during most of the year; relative humidity values registered at the Jorge Chavez International Airport’s meteorological station show variations ranging between 73 % (July, 1997) and 91 % (September, 2001), as registered during the last decade, with small fluctuations throughout the year, and no seasonal differentiations.
The Project area limits with the following districts: at the north: Ventanilla and Puente de Piedra districts, at the south: Callao district, at the east: Comas, Carabaillo and Independencia

FEASIBILITY STUDY ON NORTH LIMA METROPOLITAN AREA WATER SUPPLY AND SEWERAGE OPTIMIZATION PROJECT (II)
FINAL REPORT
NIPPON KOEI CO.,LTD. 2-16 NIPPON KOEI LAC CO.,LTD
districts and at the west: the Pacific Ocean.
The Rímac river valley is the most important transport corridor that connects the metropolitan area with the central Andes region of Perú.
JICA Study Team
Figure 2.5.1-1: Location of Study Area
Table 2.5.1-1 shows the cities and populated areas in all 7 districts that relates with the Study area. It is to be noted that the only Carabayllo district shows rural areas; and the sanitation services of these rural areas are not under SEDAPAL’s scope.
Table 2.5.1-1: Populated Areas in the Districts related with the Study Area
District Rural Total
Rural
Urban Total Urban
Grand TotalHousing
association Hamlet Farming Cooperative Others City Town Others
Callao 1 1 1
Ventanilla 1 1 1
Carabayllo 1 3 11 2 17 1 1 2 19
Comas 1 1 1
Los Olivos 1 1 1
Puente Piedra 1 1 1
San Martin de Porres 1 1 1
Total 1 3 11 2 17 4 3 1 8 25
Source: INEI – 2007 National Censuses: XI population census and VI housing census

FEASIBILITY STUDY ON NORTH LIMA METROPOLITAN AREA WATER SUPPLY AND SEWERAGE OPTIMIZATION PROJECT (II)
FINAL REPORT
NIPPON KOEI CO.,LTD. 2-17 NIPPON KOEI LAC CO.,LTD
The following is a description of the physical characteristics of the districts that relates to the Study area.
(1) Carabayllo
It is geographically located at the coordinates 11051´06” south latitude and 770 02´11” west longitude. From this district, the sectors included in the Study Area are 350 and 351.
Carabayllo is the largest district in Metropolitan Lima, with an area of 346.88 km2 (34,688 Hectares), and it is mostly farmland. Carabayllo comprises 37. 3 % of the total area of the Lima Norte area, and it represents one of the lowest percentages of population. This district registers the largest growth rate in the last few years, and it is in the midst of an expansion in residential and agribusiness sectors. Carabayllo’s urban growth is taking place at the expense of its farmland environment.
(2) Comas
It is geographically located at the coordinates 11°56’48” south latitude and 77°02’48” west longitude.
From this district, the sectors included in the Study Area are 345, 346, 347, 348, and 349.
The Comas district is located 8 kilometers north of Metropolitan Lima. It has an area of 48.75 Km2. It estimated population is 486,977 according to the 2007 population and housing census. Most of its area is already populated, even part of the hill slopes are populated. However, it still shows further growth but the growth rate is expected to gradually decline. Business is the major activity in the district.
(3) Los Olivos
It is geographically located at the coordinates 11°09’09” south latitude and 77°04’14” west longitude.
From this district, the sectors included in the Study Area are 83, 84, and 85.
The Los Olivos district has an area of 18.25 km2, and its estimated population is 318,140, according to the 2007 population and housing census. The district still shows a population growth.
(4) Puente Piedra.
It is geographically located at the coordinates 11°51’43” south latitude and 77°04’34” west longitude.
From this district, the sectors included in the Study Area are 361, 368, 369 and 370.
The Puente Piedra district has an area of 71.18 km2, and its estimated population is 233,602 in 2007. This district has shown a slower, though still high growth rate of 6.04%.

FEASIBILITY STUDY ON NORTH LIMA METROPOLITAN AREA WATER SUPPLY AND SEWERAGE OPTIMIZATION PROJECT (II)
FINAL REPORT
NIPPON KOEI CO.,LTD. 2-18 NIPPON KOEI LAC CO.,LTD
(5) San Martín de Porres
It is geographically located at the coordinates 12°01’40” south latitude and 77°02’36” west longitude.
From this district, the sectors included in the Study Area are 212, 213, 251, 252, 253, 254, 255, and 257.
Its area is 36.9 km2. This district has a population of 579,561 according to the 2007 population census. This district still shows population growth.
(6) Callao
It is geographically located at the coordinates 12°03’23” south latitude and 77°08’40” west longitude.
From this district, the sectors included in the Study Area are 256, 258, and 259.
The Callao district is one of the 6 districts that make up the Constitutional Province of Callao under Callao Region. Act 27867 of November 16th, 2002 turns this region as the only region having only one province. Its population is over 400,000, and its area is 45.65 km2.
(7) Ventanilla
It is geographically located at the coordinates 11°56’48” south latitude and 77°02’48” west longitude.
From this district, the sectors included in the Study Area are 260, 261, 262, 263, 264, 265, and 266.
Ventanilla is located north of the Constitutional Province of Callao, around 18 km north of the Callao district. Ventanilla is one of the most important population development poles in the northern area; it has a significant expansion area and a very low current density. Ventanilla’s area is 73.52 km2.
2.5.2 Demographic Characteristics
(1) Total Population and Gender Distribution
Urban population in the districts related to the Study area is 2,519,043, of which, 1,238,840 (49.2%) are men, and 1,283,203 (50.8 %) are women. Thus, men’s percentage is slightly lower, i.e., there are 97 men for every 100 women (See Table 2.5.2-1.)

FEASIBILITY STUDY ON NORTH LIMA METROPOLITAN AREA WATER SUPPLY AND SEWERAGE OPTIMIZATION PROJECT (II)
FINAL REPORT
NIPPON KOEI CO.,LTD. 2-19 NIPPON KOEI LAC CO.,LTD
Table 2.5.2-1: 2007 Urban Population Structure by Gender
Location Total Men Women
Region of Lima 8,275,823 4,047,671 4,228,152 Province of Lima 7,596,058 3,708,359 3,887,699 Province of Callao 876,877 430,582 446,295 Callao district 415,888 206,078 209,810 Ventanilla district 277,895 136,855 141,040 Carabayllo district 206,980 102,433 104,547 Comas district 486,977 239,665 247,312 Los Olivos district 318,140 153,963 164,177 Puente Piedra district 233,602 116,937 116,665 San Martín de Porres district 579,561 282,909 296,652 Total of 7 Districts 2,519,043 1,238,840 1,280,203 Gender distribution (%) 100.00 49.20 50.80 Source: INEI – 2007 National Censuses: XI population census and VI housing census
(2) Population by Age
According to INEI’s 2007 census, the districts related to the Study area has 36.4 % of population under 20 years old, 35.4 % of population between 20 and 39 years old, and 3.6 % of population over 70 years old (See Table 2.5.2-2.)
Table 2.5.2-2: 2007 Urban Population Structure by Age
Location Total Age groups
0-9 10-19 20-29 30-39 40-49 50-59 60-69 70-79 80 +
Region of Lima 8,275,823 1,367,080 1,513,782 1,588,114 1,322,845 983,365 694,280 425,962 254,821 125,574
Prov. Lima 7,596,058 1,241,799 1,375,892 1,473,036 1,223,905 906,905 640,678 389,318 230,544 113,981
Prov. Callao 876,877 153,957 161,845 161,624 139,495 104,857 74,190 43,928 25,473 11,508
Callao district 415,888 67,548 73,799 80,098 65,532 49,250 39,240 22,660 12,171 5,590
Ventanilla district 277,895 59,906 59,296 51,625 44,561 31,801 17,287 7,708 4,131 1,580
Carabayllo district 206,980 40,415 41,693 39,068 33,894 23,407 14,693 8,214 3,950 1,646
Comas district 486,977 82,252 89,869 91,094 81,565 55,436 39,934 26,958 14,084 5,785
Los Olivos district 318,140 50,273 57,844 65,994 50,616 38,253 27,798 16,023 7,736 3,603Puente Piedra district 233,602 46,190 49,526 47,562 36,830 26,090 14,925 7,209 3,639 1,631
S. M. de Porres district 579,561 93,707 105,177 109,553 92,772 75,559 50,015 27,281 16,978 8,519
Total of 7 Districts 2,519,043 440,291 477,204 484,994 405,770 299,796 203,892 116,053 62,689 28,354
Percentage (%) 100.00 17.50 18.90 19.30 16.10 11.90 8.10 4.60 2.50 1.10
Source: INEI – 2007 National Censuses: XI population census and VI housing census
(3) Population Growth
Since 1940, both the Region of Lima and the Province of Callao have shown high population growth rates. The annual average was around 4.89 % between the 1961 -1972 censuses period. After that, the growth was decreased to 2.04 % between the 1993 – 2007 censuses period. In addition, it is noted that population in the urban area has shown a different behavior from that of the rural area. Between the last two population censuses, the urban population has grown at

FEASIBILITY STUDY ON NORTH LIMA METROPOLITAN AREA WATER SUPPLY AND SEWERAGE OPTIMIZATION PROJECT (II)
FINAL REPORT
NIPPON KOEI CO.,LTD. 2-20 NIPPON KOEI LAC CO.,LTD
2.13 % annually, whereas the rural population has shrank at – 1.46 % annually. Table 2.5.2-3 shows populations, and growth rates.
Table 2.5.2-3: Nominally Registered Population in Censuses and Population Growth of Region of Lima and Callao in 1940 - 2007
Census Total Growth in Periods Between Census Growth in Periods Between Census
Urban Rural Total Urban Rural Total Urban Rural Total
1940 711,441 199,144 910,585
1961 1,957,267 287,324 2,244,591 1,245,826 88,180 1,334,006 4.94% 1.76% 4.39%
1972 3,554,367 239,428 3,793,795 1,597,100 -47,896 1,549,204 5.57% -1.64% 4.89%
1981 4,983,357 205,933 5,189,290 1,428,990 -33,495 1,395,495 3.83% -1.66% 3.54%
1993 6,818,052 207,985 7,026,037 1,834,695 2,052 1,836,747 2.65% 0.08% 2.56%
2007 9,152,700 169,388 9,322,088 2,334,648 -38,597 2,296,051 2.13% -1.46% 2.04%
Source : INEI – 1972, 1981, 2007 population and housing censuses
Figure 2.5.2-1 shows annual average growth rate behavior between census periods, for the period 1940 – 2007. Between 1993 and 2007, population in these two regions increased to 2,296,051, that is, 164,004 per year. This meant 32.7 % increase compared to the 1993 population that was registered as 7,026,037.
911
2,245
3,794
5,189
7,026
9,3224.39%
4.89%
3.54%
2.56%2.04%
0.00%
1.00%
2.00%
3.00%
4.00%
5.00%
6.00%
01,0002,0003,0004,0005,0006,0007,0008,0009,000
10,000
1940 1961 1972 1981 1993 2007
LIMA Y CALLAO: POBLACIÓN Y TASA DE CRECIMIENTO PROMEDIO ANUAL1940-2007
Tasa de crecimiento
Source: INEI – 1972, 1981, 2007 population and housing censuses
Figure 2.5.2-1: Population and Its Increase Ratio in Lima and Callao
Annual average growth rate of 2.04 % for the period 1993 – 2007 was lower than previous growth rates, and it is mainly due to a decrease in fertility levels.
According to the information from the 1993 and 2007 censuses supplied by INEI, districts related to the Study area had an urban population and household of 2,519,043 and 594,261 in 2007 resulting 4.22 persons per household (See Table 2.5.2-5). The annual average growth of 2.96 % for the urban areas is greater than the annual average growth value of 2.11% for Lima (See Table 2.5.2-4.)

FEASIBILITY STUDY ON NORTH LIMA METROPOLITAN AREA WATER SUPPLY AND SEWERAGE OPTIMIZATION PROJECT (II)
FINAL REPORT
NIPPON KOEI CO.,LTD. 2-21 NIPPON KOEI LAC CO.,LTD
Table 2.5.2-4: Population and Growth Rate in the Vicinity of the Study Area
Location Period Urban Rural Total
Region of Lima 1993 6,178,820 207,488 6,386,308 2007 8,275,823 169,388 8,445,211 1993-2007 2.11% -1.44% 2.02% Prov. Lima 1993 5,681,941 24,186 5,706,127 2007 7,596,058 9,684 7,605,742 1993-2007 2.10% -6.33% 2.07% Prov. Callao 1993 639,232 497 639,729 2007 876,877 0 876,877 1993-2007 2.28% -100.0% 2.28% Callao dist. 1993 369,412 356 369,768 2007 415,888 415,888 1993-2007 0.85% -100.00% 0.84% Ventanilla dist. 1993 94,356 141 94,497 2007 277,895 277,895 1993-2007 8.02% -100.00% 8.01% Carabayllo dist. 1993 98,492 8,051 106,543 2007 206,980 6,406 213,386 1993-2007 5.45% -1.62% 5.09% Comas dist. 1993 404,352 0 404,352 2007 486,977 486,977 1993-2007 1.34% 1.34% Los Olivos dist. 1993 228,143 228,143 2007 318,140 318,140 1993-2007 2.40% 2.40% Puente Piedra dist. 1993 101,568 1,240 102,808 2007 233,602 233,602 1993-2007 6.13% -100.00% 6.04% S.M. de Porres dist. 1993 378,353 2,031 380,384 2007 579,561 579,561 1993-2007 3.09% -100.00% 3.05%
Districts in the area of influence 1993 1,674,676 11,819 1,686,495 2007 2,519,043 6,406 2,525,449
1993-2007 2.96% -4.28% 2.93% Source: INEI – 1993, 2007 population and housing censuses

FEASIBILITY STUDY ON NORTH LIMA METROPOLITAN AREA WATER SUPPLY AND SEWERAGE OPTIMIZATION PROJECT (II)
FINAL REPORT
NIPPON KOEI CO.,LTD. 2-22 NIPPON KOEI LAC CO.,LTD
Table 2.5.2-5: Urban Population and Household in the Vicinity of the Study Area
District Population Houses Density 2003-2007 annual growth
Callao 415,888 94,931 4.38 0.84% Ventanilla 277,895 81,388 3.41 8.01% Comas 486,977 99,039 4.92 1.34% Carabayllo 206,980 51,332 4.03 5.09% Los Olivos 318,140 76,966 4.13 2.40% Puente Piedra 233,602 58,453 4.00 6.04% San Martín de Porres 579,561 132,152 4.39 3.05% Total 2,519,043 596,544 4.22 2.93 Source: INEI – 2007 National Censuses: XI population census and VI housing census
As mentioned before, the Study area comprises of -32 SEDAPAL sectors, which is only a small part of these 7 districts. The Study area population was 592,399 in 2007 (based on SEDAPAL information database) and person per household is 4.28. The Study area population is 23.52% of the total population of the 7 districts.
(4) Migration
The Region of Lima has been the major attraction pole for migration movements, as it absorbs over half the total number of people migrating out of their regions of origin.
Net population migration balance shows population increases or decreases at region level. According to the latest 2007 census, both the Region of Lima and the province of Callao showed a positive balance (net migration values of 348,539 and 35,227 respectively). (In 1993 also, a similar situation was observed as shown in Figure 2.5.2-2.
Source: INEI – 2007 National Censuses: XI population census and VI housing census
Figure 2.5.2-2: Number of Migration of Lima and Callao
(5) Other Population Indicators
1) Birth Rate
Birth rates are decreasing at a national level, from 27.3 in 1993, to 22.8 in 2003, for every one thousand inhabitants. This is the result of an intense National Family Planning Program that has been boosted in the last few years as a public policy. This program aims
Lima Prov. Callao
299,020
52,650
348,539
35,227
DEPARTAMENTO DE LIMA Y PROVINCIA DEL CALLAO: SALDO MIGRATORIO SEGÚN DEPARTAMENTO DE NACIMIENTO 1998-1993 Y 2002-207
(Migración Reciente)
1988-1993 2002-2007
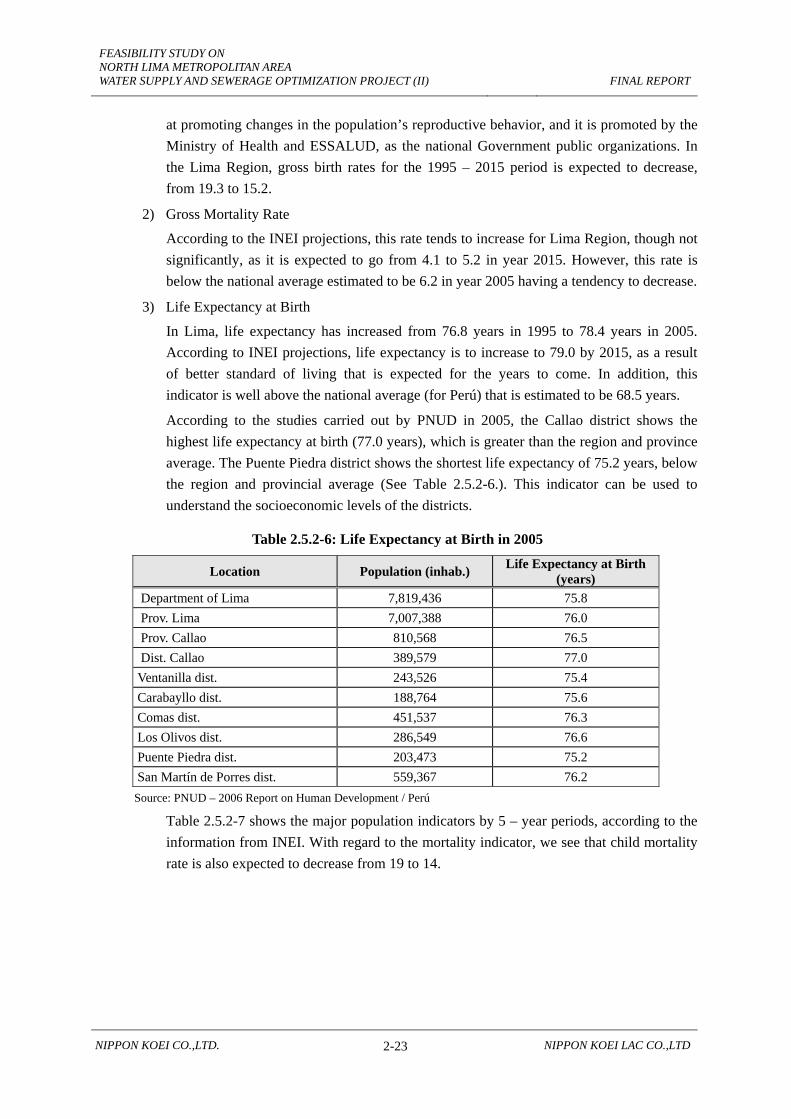
FEASIBILITY STUDY ON NORTH LIMA METROPOLITAN AREA WATER SUPPLY AND SEWERAGE OPTIMIZATION PROJECT (II)
FINAL REPORT
NIPPON KOEI CO.,LTD. 2-23 NIPPON KOEI LAC CO.,LTD
at promoting changes in the population’s reproductive behavior, and it is promoted by the Ministry of Health and ESSALUD, as the national Government public organizations. In the Lima Region, gross birth rates for the 1995 – 2015 period is expected to decrease, from 19.3 to 15.2.
2) Gross Mortality Rate
According to the INEI projections, this rate tends to increase for Lima Region, though not significantly, as it is expected to go from 4.1 to 5.2 in year 2015. However, this rate is below the national average estimated to be 6.2 in year 2005 having a tendency to decrease.
3) Life Expectancy at Birth
In Lima, life expectancy has increased from 76.8 years in 1995 to 78.4 years in 2005. According to INEI projections, life expectancy is to increase to 79.0 by 2015, as a result of better standard of living that is expected for the years to come. In addition, this indicator is well above the national average (for Perú) that is estimated to be 68.5 years.
According to the studies carried out by PNUD in 2005, the Callao district shows the highest life expectancy at birth (77.0 years), which is greater than the region and province average. The Puente Piedra district shows the shortest life expectancy of 75.2 years, below the region and provincial average (See Table 2.5.2-6.). This indicator can be used to understand the socioeconomic levels of the districts.
Table 2.5.2-6: Life Expectancy at Birth in 2005
Location Population (inhab.) Life Expectancy at Birth (years)
Department of Lima 7,819,436 75.8 Prov. Lima 7,007,388 76.0 Prov. Callao 810,568 76.5 Dist. Callao 389,579 77.0 Ventanilla dist. 243,526 75.4 Carabayllo dist. 188,764 75.6 Comas dist. 451,537 76.3 Los Olivos dist. 286,549 76.6 Puente Piedra dist. 203,473 75.2 San Martín de Porres dist. 559,367 76.2
Source: PNUD – 2006 Report on Human Development / Perú
Table 2.5.2-7 shows the major population indicators by 5 – year periods, according to the information from INEI. With regard to the mortality indicator, we see that child mortality rate is also expected to decrease from 19 to 14.
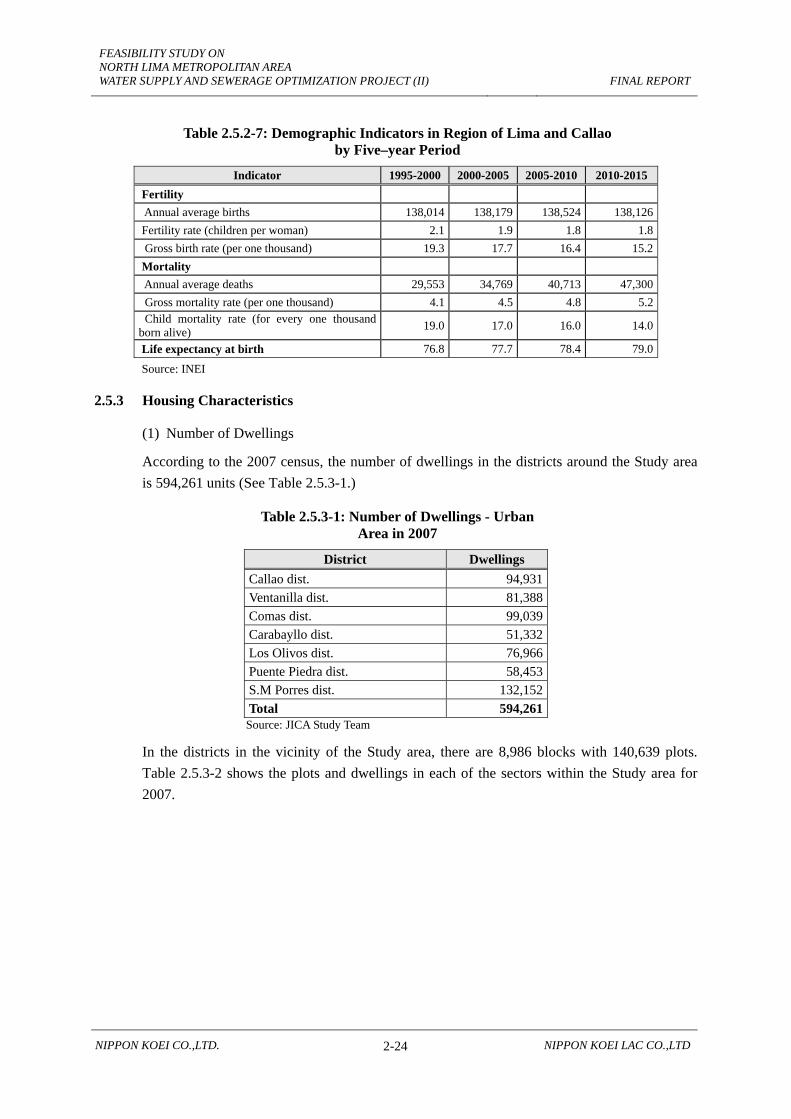
FEASIBILITY STUDY ON NORTH LIMA METROPOLITAN AREA WATER SUPPLY AND SEWERAGE OPTIMIZATION PROJECT (II)
FINAL REPORT
NIPPON KOEI CO.,LTD. 2-24 NIPPON KOEI LAC CO.,LTD
Table 2.5.2-7: Demographic Indicators in Region of Lima and Callao by Five–year Period
Indicator 1995-2000 2000-2005 2005-2010 2010-2015 Fertility Annual average births 138,014 138,179 138,524 138,126 Fertility rate (children per woman) 2.1 1.9 1.8 1.8 Gross birth rate (per one thousand) 19.3 17.7 16.4 15.2 Mortality Annual average deaths 29,553 34,769 40,713 47,300 Gross mortality rate (per one thousand) 4.1 4.5 4.8 5.2 Child mortality rate (for every one thousand born alive) 19.0 17.0 16.0 14.0
Life expectancy at birth 76.8 77.7 78.4 79.0
Source: INEI
2.5.3 Housing Characteristics
(1) Number of Dwellings
According to the 2007 census, the number of dwellings in the districts around the Study area is 594,261 units (See Table 2.5.3-1.)
Table 2.5.3-1: Number of Dwellings - Urban Area in 2007
District Dwellings Callao dist. 94,931Ventanilla dist. 81,388Comas dist. 99,039Carabayllo dist. 51,332Los Olivos dist. 76,966Puente Piedra dist. 58,453S.M Porres dist. 132,152Total 594,261Source: JICA Study Team
In the districts in the vicinity of the Study area, there are 8,986 blocks with 140,639 plots. Table 2.5.3-2 shows the plots and dwellings in each of the sectors within the Study area for 2007.

FEASIBILITY STUDY ON NORTH LIMA METROPOLITAN AREA WATER SUPPLY AND SEWERAGE OPTIMIZATION PROJECT (II)
FINAL REPORT
NIPPON KOEI CO.,LTD. 2-25 NIPPON KOEI LAC CO.,LTD
Table 2.5.3-2: Number of Blocks and Plots by Sectors in the Study Area (in units).
Sector No. of blocks No. of plots 83 540 9,204 84 615 14,102 85 409 7,414
212 421 9,510 213 287 4,915 251 339 7,477 252 171 3,765 253 291 5,277 254 413 6,599 255 112 1,023 256 509 9,160 257 118 1,174 258 33 75 259 200 3,371 260 35 175 261 81 735 262 33 154 263 32 127 264 49 271 265 30 253 266 35 403 345 205 3,191 346 312 6,267 347 198 3,453 348 292 3,776 349 795 9,144 350 525 7,700 351 184 1,666 361 240 3,919 368 706 7,991 369 487 7,112 370 199 1,236
Total 8,896 140,639 Source: INEI – 2007 National Censuses: XI population census and VI housing census
(2) Dwelling Tenure Regime
In the districts around the Study area, 21.6% of the dwellings are rented, 6.7 % are owned but not fully paid off, and 71.7 % are fully owned by the families. In the Ventanilla district, most of the dwellings (83.7 %) are totally paid; in Los Olivos, there is a larger portion of rented dwellings, and in the Carabayllo district, dwellings that are not fully paid shows a significant proportion.

FEASIBILITY STUDY ON NORTH LIMA METROPOLITAN AREA WATER SUPPLY AND SEWERAGE OPTIMIZATION PROJECT (II)
FINAL REPORT
NIPPON KOEI CO.,LTD. 2-26 NIPPON KOEI LAC CO.,LTD
Table 2.5.3-3: Dwelling Tenure Regime
District Rented Owned but not fully paid off Fully owned and paid Total
Callao 25.5% 5.4% 69.1% 100.0% Ventanilla 8.1% 8.2% 83.7% 100.0% Carabayllo 10.5% 12.5% 76.9% 100.0% Comas 18.4% 4.1% 77.5% 100.0% Los Olivos 32.6% 4.3% 63.1% 100.0% Puente Piedra 11.7% 10.6% 77.7% 100.0% S.M.P 28.1% 6.8% 65.1% 100.0%
Total 21.6% 6.7% 71.7% 100.0%
Source: INEI – 2007 National Censuses: XI population census and VI housing census
(3) Dwelling Construction Material
Table 2.5.3-4 shows major dwelling construction materials. It is noted that 77.5 % of the dwellings are made of brick or cement block, and San Martin de Porres is the district having the largest portion of this type of dwellings (92.9 %.).
Table 2.5.3-4: Dwelling Construction Materials
Type Callao Ventanilla Carabayllo Comas Los Olivos Puente Piedra S.M.P Total
Walls 100.0% 100.0% 100.0% 100.0% 100.0% 100.0% 100.0% 100.0%
Brick or cement block 82.3% 37.2% 66.6% 88.8% 88.0% 61.6% 92.9% 77.5%
Wooden 9.8% 52.7% 13.4% 6.4% 1.5% 24.2% 3.6% 13.9%
Adobe or mud brick 3.5% 3.6% 12.7% 2.1% 8.5% 6.7% 2.2% 4.7%
Straw or bamboo mats 0.2% 4.5% 5.2% 1.4% 0.2% 4.7% 0.5% 1.9%
Other materials 4.2% 1.9% 2.1% 1.3% 1.9% 2.7% 0.8% 2.0%
Floors 100.0% 100.0% 100.0% 100.0% 100.0% 100.0% 100.0% 100.0%
Cement 58.8% 54.1% 51.4% 62.4% 52.8% 52.6% 58.1% 56.6%
Tiles, terrazzo 24.5% 6.2% 10.3% 20.2% 27.0% 6.9% 26.0% 19.2%
Ground floor 9.1% 33.1% 35.4% 13.7% 10.3% 39.4% 9.0% 18.2%
Parquet o or polished wood 4.8% 0.7% 1.6% 2.0% 7.5% 0.3% 5.3% 3.6%
Other 2.9% 5.9% 1.4% 1.6% 2.5% 0.9% 1.5% 2.4%
Source: INEI – 2007 National Censuses: XI population census and VI housing census
(4) Utility Services
With regard to service availability, other than potable water and sewerage, in the districts around the Study area, it is noted that 94.5 % of the homes have electricity, and Los Olivos is the district having the largest number of dwellings with water supply (99.5 %). In most cases, homes connected to the water system seem to have more access to these services, in comparison to those homes without a water service.
With regard to the type of fuel used for cooking, most homes cook with gas (87.8 %), followed by kerosene (4.4 %), firewood (1.6 %), coal (1.3 %), electricity (1.8 %), and other types of fuel (3.1 %.)
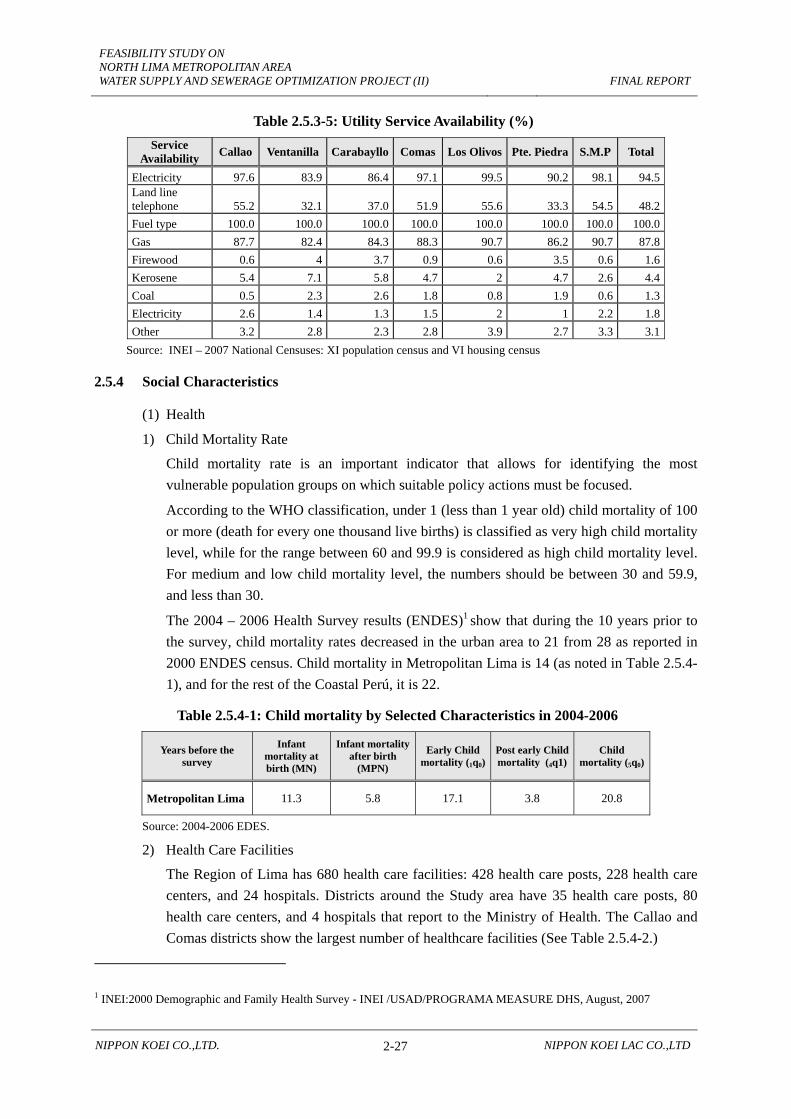
FEASIBILITY STUDY ON NORTH LIMA METROPOLITAN AREA WATER SUPPLY AND SEWERAGE OPTIMIZATION PROJECT (II)
FINAL REPORT
NIPPON KOEI CO.,LTD. 2-27 NIPPON KOEI LAC CO.,LTD
Table 2.5.3-5: Utility Service Availability (%) Service
Availability Callao Ventanilla Carabayllo Comas Los Olivos Pte. Piedra S.M.P Total
Electricity 97.6 83.9 86.4 97.1 99.5 90.2 98.1 94.5Land line telephone 55.2 32.1 37.0 51.9 55.6 33.3 54.5 48.2Fuel type 100.0 100.0 100.0 100.0 100.0 100.0 100.0 100.0Gas 87.7 82.4 84.3 88.3 90.7 86.2 90.7 87.8Firewood 0.6 4 3.7 0.9 0.6 3.5 0.6 1.6Kerosene 5.4 7.1 5.8 4.7 2 4.7 2.6 4.4Coal 0.5 2.3 2.6 1.8 0.8 1.9 0.6 1.3Electricity 2.6 1.4 1.3 1.5 2 1 2.2 1.8Other 3.2 2.8 2.3 2.8 3.9 2.7 3.3 3.1
Source: INEI – 2007 National Censuses: XI population census and VI housing census
2.5.4 Social Characteristics
(1) Health
1) Child Mortality Rate
Child mortality rate is an important indicator that allows for identifying the most vulnerable population groups on which suitable policy actions must be focused.
According to the WHO classification, under 1 (less than 1 year old) child mortality of 100 or more (death for every one thousand live births) is classified as very high child mortality level, while for the range between 60 and 99.9 is considered as high child mortality level. For medium and low child mortality level, the numbers should be between 30 and 59.9, and less than 30.
The 2004 – 2006 Health Survey results (ENDES)1 show that during the 10 years prior to the survey, child mortality rates decreased in the urban area to 21 from 28 as reported in 2000 ENDES census. Child mortality in Metropolitan Lima is 14 (as noted in Table 2.5.4-1), and for the rest of the Coastal Perú, it is 22.
Table 2.5.4-1: Child mortality by Selected Characteristics in 2004-2006
Years before the survey
Infant mortality at birth (MN)
Infant mortality after birth
(MPN)
Early Child mortality (1q0)
Post early Child mortality (4q1)
Child mortality (5q0)
Metropolitan Lima 11.3 5.8 17.1 3.8 20.8
Source: 2004-2006 EDES.
2) Health Care Facilities
The Region of Lima has 680 health care facilities: 428 health care posts, 228 health care centers, and 24 hospitals. Districts around the Study area have 35 health care posts, 80 health care centers, and 4 hospitals that report to the Ministry of Health. The Callao and Comas districts show the largest number of healthcare facilities (See Table 2.5.4-2.)
1 INEI:2000 Demographic and Family Health Survey - INEI /USAD/PROGRAMA MEASURE DHS, August, 2007

FEASIBILITY STUDY ON NORTH LIMA METROPOLITAN AREA WATER SUPPLY AND SEWERAGE OPTIMIZATION PROJECT (II)
FINAL REPORT
NIPPON KOEI CO.,LTD. 2-28 NIPPON KOEI LAC CO.,LTD
Table 2.5.4-2: Hospitals, Health Care Centers and Health Care Posts in 2008
Location Health Care Post
Health Care Center Hospital Total
Department of Lima 428 228 24 680 Prov. Lima 171 175 17 363 Prov. Callao 2 51 3 56 Callao Dist. 1 31 32 Ventanilla Dist. 1 14 1 16 Carabayllo Dist. 7 4 11 Comas Dist. 10 13 1 24 Dist. Los Olivos 6 5 11 Dist. Puente Piedra 1 6 1 8 Dist. San Martin de Porres 9 7 1 17
Source: MINSA
3) Health Practitioners
With regard to health practitioners, the Region of Lima has 30,632 health practitioners that include 12,071 professionals (39.4 %), 11,725 technicians, auxiliary staff and assistants (38. 3 %), and 6,836 administrative and general service staff. (22.3 %). (See Table 2.5.4-3). Districts in the vicinity of the Study area have 1,997 practitioners that represent 16.5 % of the total practitioner population in the department. In addition, there are 1,758 (15.0 %) technicians, auxiliary staff and assistants, and 1,274 (18.6 %) administrative and general service staff.
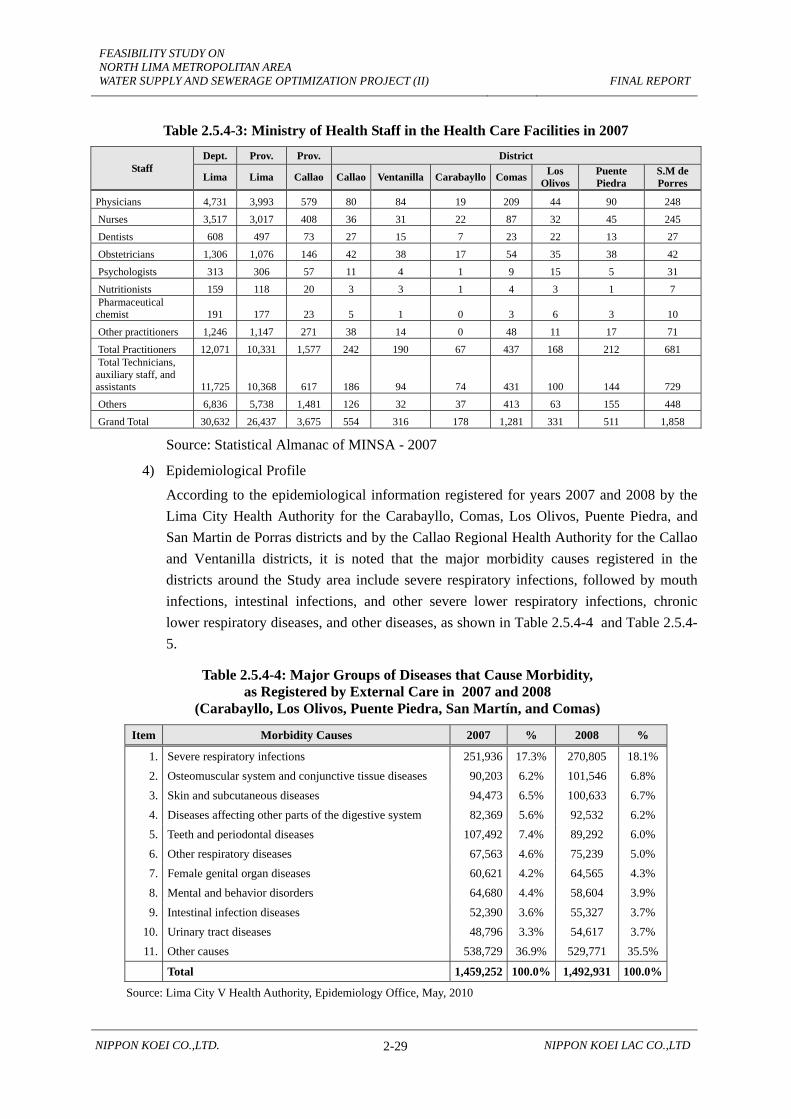
FEASIBILITY STUDY ON NORTH LIMA METROPOLITAN AREA WATER SUPPLY AND SEWERAGE OPTIMIZATION PROJECT (II)
FINAL REPORT
NIPPON KOEI CO.,LTD. 2-29 NIPPON KOEI LAC CO.,LTD
Table 2.5.4-3: Ministry of Health Staff in the Health Care Facilities in 2007
Staff Dept. Prov. Prov. District
Lima Lima Callao Callao Ventanilla Carabayllo Comas Los Olivos
Puente Piedra
S.M de Porres
Physicians 4,731 3,993 579 80 84 19 209 44 90 248
Nurses 3,517 3,017 408 36 31 22 87 32 45 245
Dentists 608 497 73 27 15 7 23 22 13 27
Obstetricians 1,306 1,076 146 42 38 17 54 35 38 42
Psychologists 313 306 57 11 4 1 9 15 5 31
Nutritionists 159 118 20 3 3 1 4 3 1 7 Pharmaceutical chemist 191 177 23 5 1 0 3 6 3 10
Other practitioners 1,246 1,147 271 38 14 0 48 11 17 71
Total Practitioners 12,071 10,331 1,577 242 190 67 437 168 212 681 Total Technicians, auxiliary staff, and assistants 11,725 10,368 617 186 94 74 431 100 144 729
Others 6,836 5,738 1,481 126 32 37 413 63 155 448
Grand Total 30,632 26,437 3,675 554 316 178 1,281 331 511 1,858
Source: Statistical Almanac of MINSA - 2007
4) Epidemiological Profile
According to the epidemiological information registered for years 2007 and 2008 by the Lima City Health Authority for the Carabayllo, Comas, Los Olivos, Puente Piedra, and San Martin de Porras districts and by the Callao Regional Health Authority for the Callao and Ventanilla districts, it is noted that the major morbidity causes registered in the districts around the Study area include severe respiratory infections, followed by mouth infections, intestinal infections, and other severe lower respiratory infections, chronic lower respiratory diseases, and other diseases, as shown in Table 2.5.4-4 and Table 2.5.4-5.
Table 2.5.4-4: Major Groups of Diseases that Cause Morbidity, as Registered by External Care in 2007 and 2008
(Carabayllo, Los Olivos, Puente Piedra, San Martín, and Comas)
Item Morbidity Causes 2007 % 2008 %
1. Severe respiratory infections 251,936 17.3% 270,805 18.1%2. Osteomuscular system and conjunctive tissue diseases 90,203 6.2% 101,546 6.8%3. Skin and subcutaneous diseases 94,473 6.5% 100,633 6.7%4. Diseases affecting other parts of the digestive system 82,369 5.6% 92,532 6.2%5. Teeth and periodontal diseases 107,492 7.4% 89,292 6.0%6. Other respiratory diseases 67,563 4.6% 75,239 5.0%7. Female genital organ diseases 60,621 4.2% 64,565 4.3%8. Mental and behavior disorders 64,680 4.4% 58,604 3.9%9. Intestinal infection diseases 52,390 3.6% 55,327 3.7%
10. Urinary tract diseases 48,796 3.3% 54,617 3.7%11. Other causes 538,729 36.9% 529,771 35.5%
Total 1,459,252 100.0% 1,492,931 100.0%
Source: Lima City V Health Authority, Epidemiology Office, May, 2010
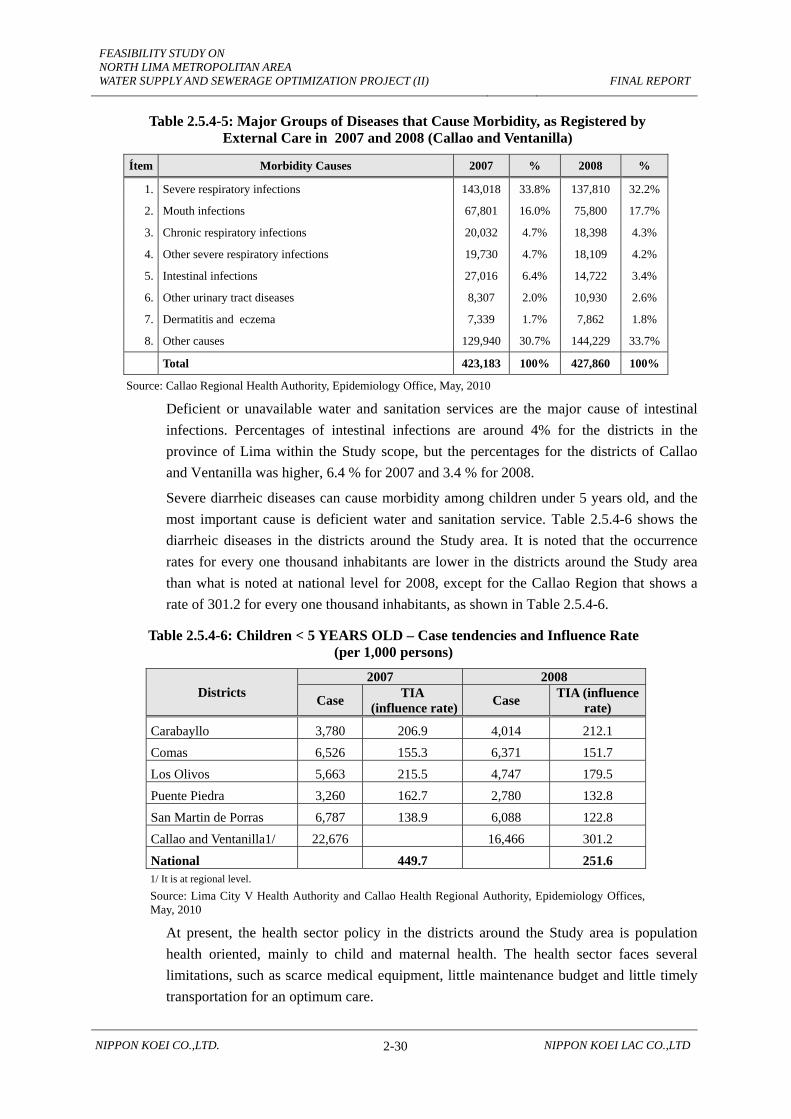
FEASIBILITY STUDY ON NORTH LIMA METROPOLITAN AREA WATER SUPPLY AND SEWERAGE OPTIMIZATION PROJECT (II)
FINAL REPORT
NIPPON KOEI CO.,LTD. 2-30 NIPPON KOEI LAC CO.,LTD
Table 2.5.4-5: Major Groups of Diseases that Cause Morbidity, as Registered by External Care in 2007 and 2008 (Callao and Ventanilla)
Ítem Morbidity Causes 2007 % 2008 %
1. Severe respiratory infections 143,018 33.8% 137,810 32.2%
2. Mouth infections 67,801 16.0% 75,800 17.7%
3. Chronic respiratory infections 20,032 4.7% 18,398 4.3%
4. Other severe respiratory infections 19,730 4.7% 18,109 4.2%
5. Intestinal infections 27,016 6.4% 14,722 3.4%
6. Other urinary tract diseases 8,307 2.0% 10,930 2.6%
7. Dermatitis and eczema 7,339 1.7% 7,862 1.8%
8. Other causes 129,940 30.7% 144,229 33.7%
Total 423,183 100% 427,860 100%
Source: Callao Regional Health Authority, Epidemiology Office, May, 2010
Deficient or unavailable water and sanitation services are the major cause of intestinal infections. Percentages of intestinal infections are around 4% for the districts in the province of Lima within the Study scope, but the percentages for the districts of Callao and Ventanilla was higher, 6.4 % for 2007 and 3.4 % for 2008.
Severe diarrheic diseases can cause morbidity among children under 5 years old, and the most important cause is deficient water and sanitation service. Table 2.5.4-6 shows the diarrheic diseases in the districts around the Study area. It is noted that the occurrence rates for every one thousand inhabitants are lower in the districts around the Study area than what is noted at national level for 2008, except for the Callao Region that shows a rate of 301.2 for every one thousand inhabitants, as shown in Table 2.5.4-6.
Table 2.5.4-6: Children < 5 YEARS OLD – Case tendencies and Influence Rate (per 1,000 persons)
Districts 2007 2008
Case TIA (influence rate) Case TIA (influence
rate)
Carabayllo 3,780 206.9 4,014 212.1 Comas 6,526 155.3 6,371 151.7 Los Olivos 5,663 215.5 4,747 179.5 Puente Piedra 3,260 162.7 2,780 132.8 San Martin de Porras 6,787 138.9 6,088 122.8 Callao and Ventanilla1/ 22,676 16,466 301.2 National 449.7 251.6 1/ It is at regional level. Source: Lima City V Health Authority and Callao Health Regional Authority, Epidemiology Offices, May, 2010
At present, the health sector policy in the districts around the Study area is population health oriented, mainly to child and maternal health. The health sector faces several limitations, such as scarce medical equipment, little maintenance budget and little timely transportation for an optimum care.

FEASIBILITY STUDY ON NORTH LIMA METROPOLITAN AREA WATER SUPPLY AND SEWERAGE OPTIMIZATION PROJECT (II)
FINAL REPORT
NIPPON KOEI CO.,LTD. 2-31 NIPPON KOEI LAC CO.,LTD
(2) Education.
1) Illiteracy Rate
In order to measure the extent of educational development, the illiteracy rate is analyzed. The illiteracy rate in the Lima Region (according to INEI) in 2005 represents 3.2 %, which is less than the national average of 8.1 %; this means that, in average, there are less illiterate people.
According to the INEI projections, it is expected that by year 2015, the illiteracy rate in the Region of Lima will decrease from 3.2 % to 2.4 % (See Table 2.5.4-7.)
Table 2.5.4-7: Illiteracy Rate in Lima Region in 1995-2015
Censuses Country Lima %
1995 Illiterate people 1,679,061 172,824 10.3 Illiteracy rate 11.1 3.6
2000 Illiterate people 1,581,947 171,873 10.9 Illiteracy rate 9.3 3.2
2005 Illiterate people 1,550,779 171,400 11.1 Illiteracy rate 8.1 3.2
2010 Illiterate people 1,563,854 171,422 11.0 Illiteracy rate 7.3 2.6
2015 Illiterate people 1,606,050 172,832 10.8 Illiteracy rate 6.9 2.4
Source: INEI – 2007 National Censuses: XI population census and VI housing census
According to the 2007 XI National Population Census and the VI National Housing Census, the districts in the vicinity of the Study area show an illiteracy average rate of 6.8 %, with Ventanilla having the largest rate of 8.6 %, and Los Olivos, the lowest rate of 5.8 % (See Table 2.5.4-8).
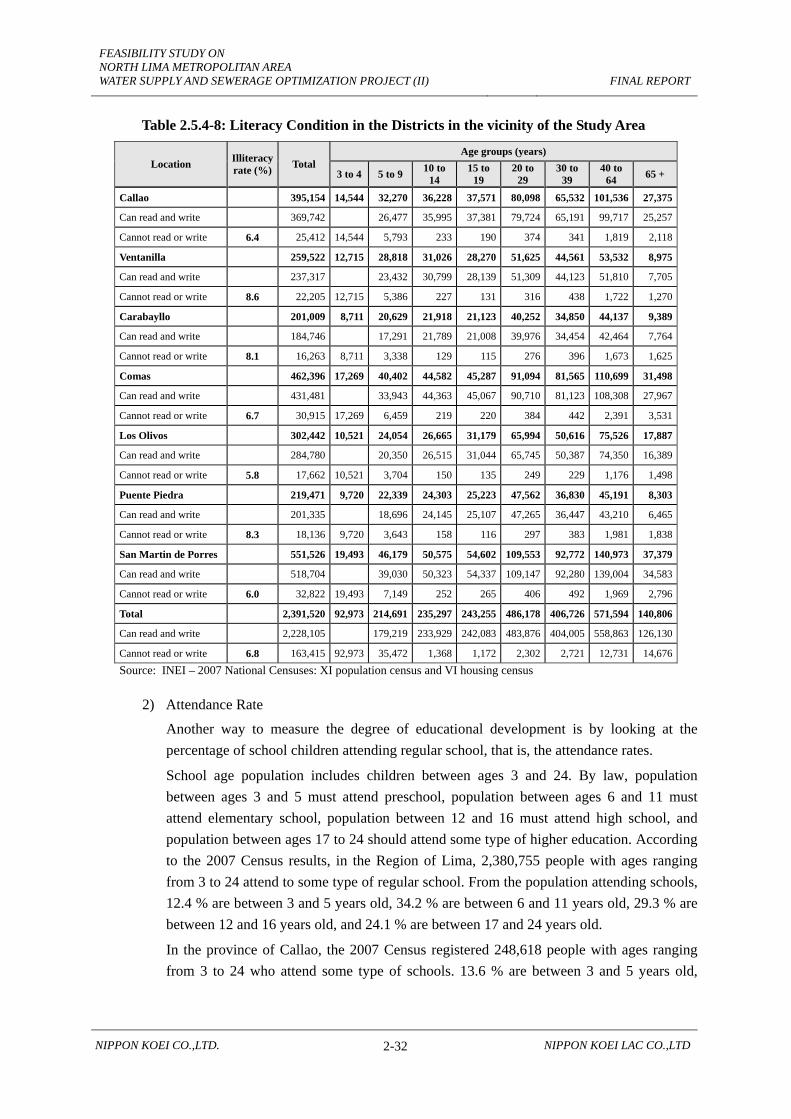
FEASIBILITY STUDY ON NORTH LIMA METROPOLITAN AREA WATER SUPPLY AND SEWERAGE OPTIMIZATION PROJECT (II)
FINAL REPORT
NIPPON KOEI CO.,LTD. 2-32 NIPPON KOEI LAC CO.,LTD
Table 2.5.4-8: Literacy Condition in the Districts in the vicinity of the Study Area
Location Illiteracy rate (%) Total
Age groups (years)
3 to 4 5 to 9 10 to 14
15 to 19
20 to 29
30 to 39
40 to 64 65 +
Callao 395,154 14,544 32,270 36,228 37,571 80,098 65,532 101,536 27,375
Can read and write 369,742 26,477 35,995 37,381 79,724 65,191 99,717 25,257
Cannot read or write 6.4 25,412 14,544 5,793 233 190 374 341 1,819 2,118
Ventanilla 259,522 12,715 28,818 31,026 28,270 51,625 44,561 53,532 8,975
Can read and write 237,317 23,432 30,799 28,139 51,309 44,123 51,810 7,705
Cannot read or write 8.6 22,205 12,715 5,386 227 131 316 438 1,722 1,270
Carabayllo 201,009 8,711 20,629 21,918 21,123 40,252 34,850 44,137 9,389
Can read and write 184,746 17,291 21,789 21,008 39,976 34,454 42,464 7,764
Cannot read or write 8.1 16,263 8,711 3,338 129 115 276 396 1,673 1,625
Comas 462,396 17,269 40,402 44,582 45,287 91,094 81,565 110,699 31,498
Can read and write 431,481 33,943 44,363 45,067 90,710 81,123 108,308 27,967
Cannot read or write 6.7 30,915 17,269 6,459 219 220 384 442 2,391 3,531
Los Olivos 302,442 10,521 24,054 26,665 31,179 65,994 50,616 75,526 17,887
Can read and write 284,780 20,350 26,515 31,044 65,745 50,387 74,350 16,389
Cannot read or write 5.8 17,662 10,521 3,704 150 135 249 229 1,176 1,498
Puente Piedra 219,471 9,720 22,339 24,303 25,223 47,562 36,830 45,191 8,303
Can read and write 201,335 18,696 24,145 25,107 47,265 36,447 43,210 6,465
Cannot read or write 8.3 18,136 9,720 3,643 158 116 297 383 1,981 1,838
San Martin de Porres 551,526 19,493 46,179 50,575 54,602 109,553 92,772 140,973 37,379
Can read and write 518,704 39,030 50,323 54,337 109,147 92,280 139,004 34,583
Cannot read or write 6.0 32,822 19,493 7,149 252 265 406 492 1,969 2,796
Total 2,391,520 92,973 214,691 235,297 243,255 486,178 406,726 571,594 140,806
Can read and write 2,228,105 179,219 233,929 242,083 483,876 404,005 558,863 126,130
Cannot read or write 6.8 163,415 92,973 35,472 1,368 1,172 2,302 2,721 12,731 14,676Source: INEI – 2007 National Censuses: XI population census and VI housing census
2) Attendance Rate
Another way to measure the degree of educational development is by looking at the percentage of school children attending regular school, that is, the attendance rates.
School age population includes children between ages 3 and 24. By law, population between ages 3 and 5 must attend preschool, population between ages 6 and 11 must attend elementary school, population between 12 and 16 must attend high school, and population between ages 17 to 24 should attend some type of higher education. According to the 2007 Census results, in the Region of Lima, 2,380,755 people with ages ranging from 3 to 24 attend to some type of regular school. From the population attending schools, 12.4 % are between 3 and 5 years old, 34.2 % are between 6 and 11 years old, 29.3 % are between 12 and 16 years old, and 24.1 % are between 17 and 24 years old.
In the province of Callao, the 2007 Census registered 248,618 people with ages ranging from 3 to 24 who attend some type of schools. 13.6 % are between 3 and 5 years old,

FEASIBILITY STUDY ON NORTH LIMA METROPOLITAN AREA WATER SUPPLY AND SEWERAGE OPTIMIZATION PROJECT (II)
FINAL REPORT
NIPPON KOEI CO.,LTD. 2-33 NIPPON KOEI LAC CO.,LTD
35.4 % are between 6 and 11 years old, 30.0 % are between 12 and 16 years old, and 21.0 % are between 17 and 24 years old.
3) School Dropout Rate
School dropout rate is defined as the “portion of students, who abandon school activities for a year or more, before completing the academic grade they were studying the previous year.” At national level, this indicator in 2002 was 4 %, both for men and women.
Dropout rate for 2007 in the Lima Region was 5.3 %, the rate was 5.4 % for the province of Lima, and 5.2 % for the province of Callao.
4) Educational Infrastructure
The Region of Lima has 18,658 schools: out of which 7,192 schools (42.4 %) depend on the Ministry of Education, and 10,746 schools (57.6 %) are private schools. Schools in the area of influence represent 29.7 % of the total educational infrastructure in the Region of Lima (See Table 2.5.4-9.)
Number of enrolled students and teachers in year 2008 were 2,364,840 and 140,713 (ratio is 17 students per teacher). These students are distributed in 105,369 classes on an average.
5) Academic Level, Teachers, Students, and Classes
According to educational statistics, there are 24 schools (4 %) for children with special needs, 2,717 (49.0 %) preschools, 1,703 (30.7 %) elementary schools, 953 (17.2 %) high schools, 114 (2.1 %) trade schools, and 37 (0.7 %) higher education schools.
In the districts in the vicinity of the Study area, educational infrastructure in year 2008 was 5,548, 35.6 % of which depend on the Ministry of Education, and 65.4 % are private schools (See Table 2.5.4-9).
Table 2.5.4-9: Educational Institutes in 2008*
District Ministry of Education % Private % Total
Region of Lima 7,912 42.4 10,746 57.6 18,658 Prov. Callao 648 37.2 1,094 62.8 1,742 Callao 273 36.2 481 63.8 754 Ventanilla 303 48.6 321 51.4 624 Prov. Lima 5,523 35.3 10,127 64.7 15,650 Carabayllo 218 41.9 302 58.1 520 Comas 371 35.5 674 64.5 1,045 Los Olivos 193 26.7 530 73.3 723 Puente Piedra 274 45.8 324 54.2 598 S.M.P 290 22.6 994 77.4 1,284 Total of 7 Districts 1,922 34.6 3,626 65.4 5,548 Source: Ministry of Education – Scale / * Preliminary Educational Statistics
Number of enrolled students and teachers in the 7 districts during year 2008 was 653,454 and 37,114, respectively. The average student teacher ratio was 18, while it was 7 for children with special needs and 22 for the trade schools.
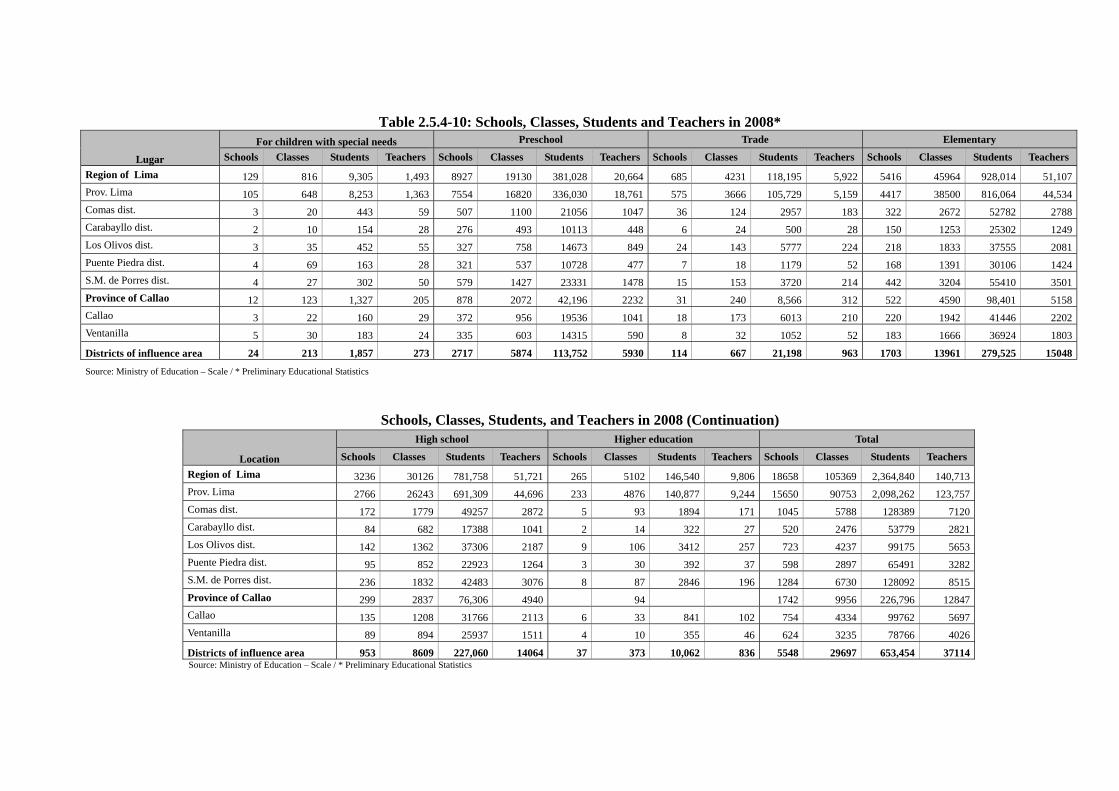
Table 2.5.4-10: Schools, Classes, Students and Teachers in 2008*
Lugar
For children with special needs Preschool Trade Elementary
Schools Classes Students Teachers Schools Classes Students Teachers Schools Classes Students Teachers Schools Classes Students Teachers
Region of Lima 129 816 9,305 1,493 8927 19130 381,028 20,664 685 4231 118,195 5,922 5416 45964 928,014 51,107 Prov. Lima 105 648 8,253 1,363 7554 16820 336,030 18,761 575 3666 105,729 5,159 4417 38500 816,064 44,534 Comas dist. 3 20 443 59 507 1100 21056 1047 36 124 2957 183 322 2672 52782 2788 Carabayllo dist. 2 10 154 28 276 493 10113 448 6 24 500 28 150 1253 25302 1249 Los Olivos dist. 3 35 452 55 327 758 14673 849 24 143 5777 224 218 1833 37555 2081 Puente Piedra dist. 4 69 163 28 321 537 10728 477 7 18 1179 52 168 1391 30106 1424 S.M. de Porres dist. 4 27 302 50 579 1427 23331 1478 15 153 3720 214 442 3204 55410 3501 Province of Callao 12 123 1,327 205 878 2072 42,196 2232 31 240 8,566 312 522 4590 98,401 5158 Callao 3 22 160 29 372 956 19536 1041 18 173 6013 210 220 1942 41446 2202 Ventanilla 5 30 183 24 335 603 14315 590 8 32 1052 52 183 1666 36924 1803
Districts of influence area 24 213 1,857 273 2717 5874 113,752 5930 114 667 21,198 963 1703 13961 279,525 15048
Source: Ministry of Education – Scale / * Preliminary Educational Statistics
Schools, Classes, Students, and Teachers in 2008 (Continuation)
Location
High school Higher education Total
Schools Classes Students Teachers Schools Classes Students Teachers Schools Classes Students Teachers
Region of Lima 3236 30126 781,758 51,721 265 5102 146,540 9,806 18658 105369 2,364,840 140,713Prov. Lima 2766 26243 691,309 44,696 233 4876 140,877 9,244 15650 90753 2,098,262 123,757Comas dist. 172 1779 49257 2872 5 93 1894 171 1045 5788 128389 7120Carabayllo dist. 84 682 17388 1041 2 14 322 27 520 2476 53779 2821Los Olivos dist. 142 1362 37306 2187 9 106 3412 257 723 4237 99175 5653Puente Piedra dist. 95 852 22923 1264 3 30 392 37 598 2897 65491 3282S.M. de Porres dist. 236 1832 42483 3076 8 87 2846 196 1284 6730 128092 8515Province of Callao 299 2837 76,306 4940 94 1742 9956 226,796 12847Callao 135 1208 31766 2113 6 33 841 102 754 4334 99762 5697Ventanilla 89 894 25937 1511 4 10 355 46 624 3235 78766 4026
Districts of influence area 953 8609 227,060 14064 37 373 10,062 836 5548 29697 653,454 37114Source: Ministry of Education – Scale / * Preliminary Educational Statistics
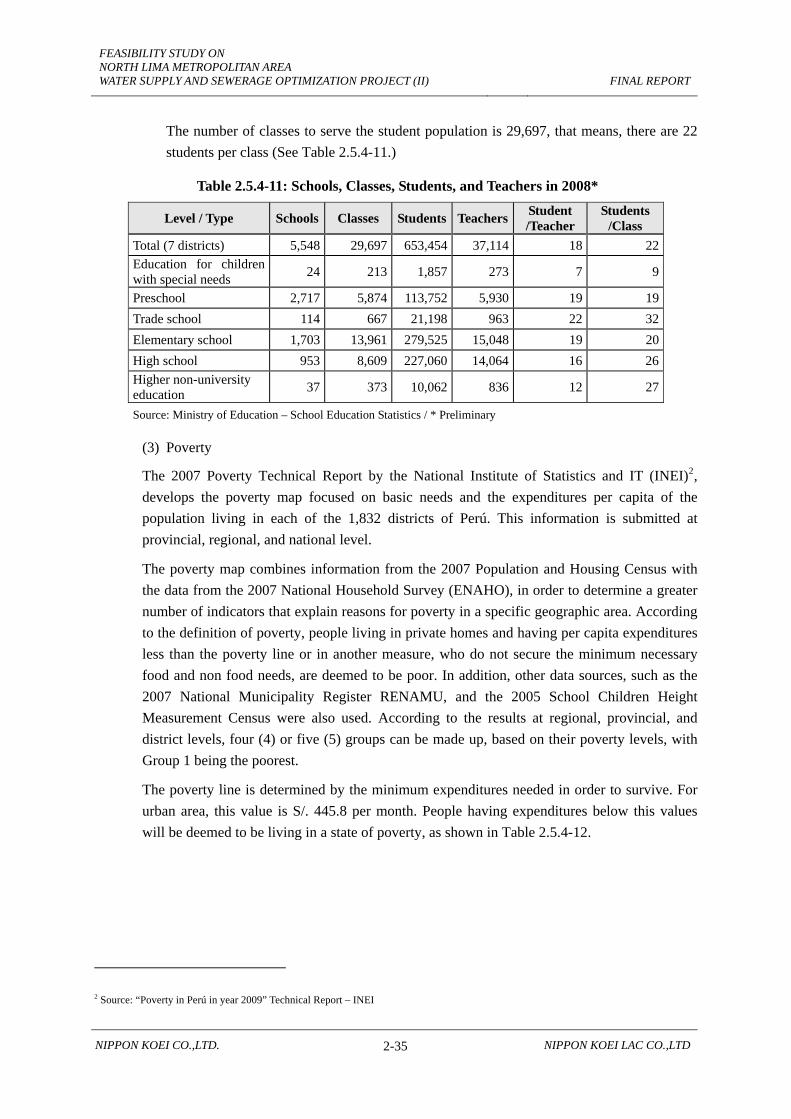
FEASIBILITY STUDY ON NORTH LIMA METROPOLITAN AREA WATER SUPPLY AND SEWERAGE OPTIMIZATION PROJECT (II)
FINAL REPORT
NIPPON KOEI CO.,LTD. 2-35 NIPPON KOEI LAC CO.,LTD
The number of classes to serve the student population is 29,697, that means, there are 22 students per class (See Table 2.5.4-11.)
Table 2.5.4-11: Schools, Classes, Students, and Teachers in 2008*
Level / Type Schools Classes Students Teachers Student /Teacher
Students /Class
Total (7 districts) 5,548 29,697 653,454 37,114 18 22Education for children with special needs 24 213 1,857 273 7 9
Preschool 2,717 5,874 113,752 5,930 19 19Trade school 114 667 21,198 963 22 32Elementary school 1,703 13,961 279,525 15,048 19 20High school 953 8,609 227,060 14,064 16 26Higher non-university education 37 373 10,062 836 12 27
Source: Ministry of Education – School Education Statistics / * Preliminary
(3) Poverty
The 2007 Poverty Technical Report by the National Institute of Statistics and IT (INEI)2, develops the poverty map focused on basic needs and the expenditures per capita of the population living in each of the 1,832 districts of Perú. This information is submitted at provincial, regional, and national level.
The poverty map combines information from the 2007 Population and Housing Census with the data from the 2007 National Household Survey (ENAHO), in order to determine a greater number of indicators that explain reasons for poverty in a specific geographic area. According to the definition of poverty, people living in private homes and having per capita expenditures less than the poverty line or in another measure, who do not secure the minimum necessary food and non food needs, are deemed to be poor. In addition, other data sources, such as the 2007 National Municipality Register RENAMU, and the 2005 School Children Height Measurement Census were also used. According to the results at regional, provincial, and district levels, four (4) or five (5) groups can be made up, based on their poverty levels, with Group 1 being the poorest.
The poverty line is determined by the minimum expenditures needed in order to survive. For urban area, this value is S/. 445.8 per month. People having expenditures below this values will be deemed to be living in a state of poverty, as shown in Table 2.5.4-12.
2 Source: “Poverty in Perú in year 2009” Technical Report – INEI
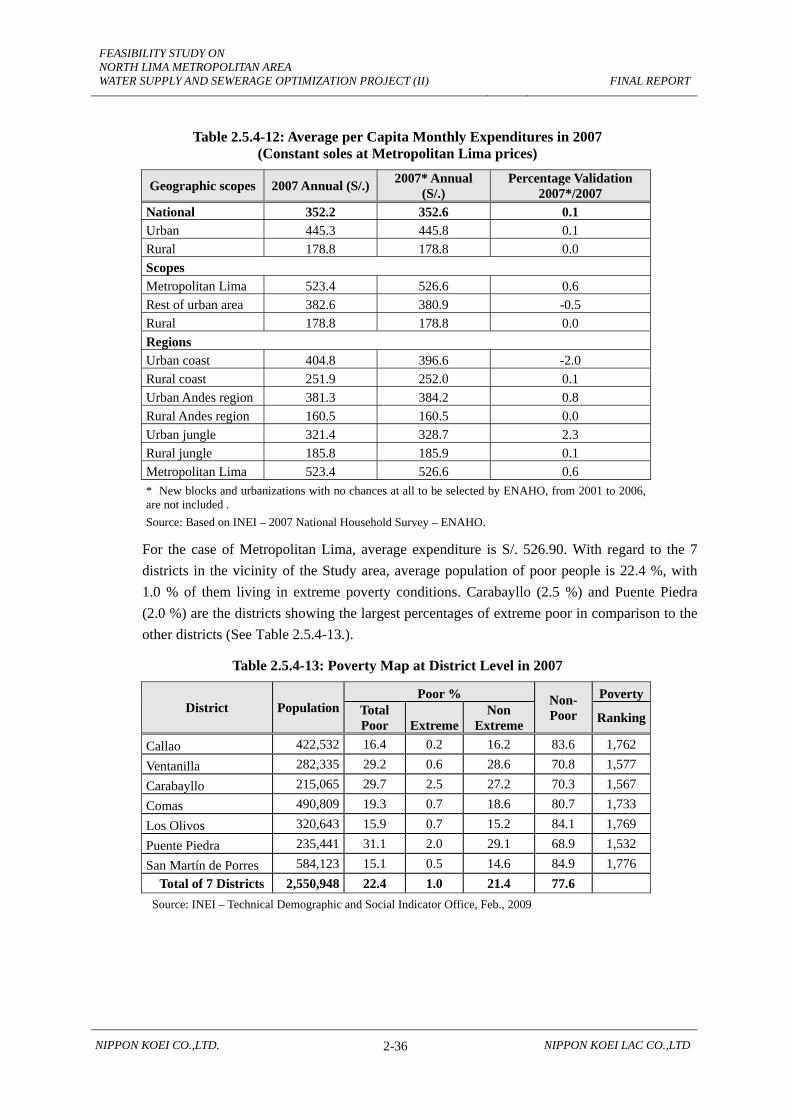
FEASIBILITY STUDY ON NORTH LIMA METROPOLITAN AREA WATER SUPPLY AND SEWERAGE OPTIMIZATION PROJECT (II)
FINAL REPORT
NIPPON KOEI CO.,LTD. 2-36 NIPPON KOEI LAC CO.,LTD
Table 2.5.4-12: Average per Capita Monthly Expenditures in 2007 (Constant soles at Metropolitan Lima prices)
Geographic scopes 2007 Annual (S/.) 2007* Annual (S/.)
Percentage Validation 2007*/2007
National 352.2 352.6 0.1 Urban 445.3 445.8 0.1 Rural 178.8 178.8 0.0 Scopes Metropolitan Lima 523.4 526.6 0.6 Rest of urban area 382.6 380.9 -0.5 Rural 178.8 178.8 0.0 Regions Urban coast 404.8 396.6 -2.0 Rural coast 251.9 252.0 0.1 Urban Andes region 381.3 384.2 0.8 Rural Andes region 160.5 160.5 0.0 Urban jungle 321.4 328.7 2.3 Rural jungle 185.8 185.9 0.1 Metropolitan Lima 523.4 526.6 0.6 * New blocks and urbanizations with no chances at all to be selected by ENAHO, from 2001 to 2006, are not included . Source: Based on INEI – 2007 National Household Survey – ENAHO.
For the case of Metropolitan Lima, average expenditure is S/. 526.90. With regard to the 7 districts in the vicinity of the Study area, average population of poor people is 22.4 %, with 1.0 % of them living in extreme poverty conditions. Carabayllo (2.5 %) and Puente Piedra (2.0 %) are the districts showing the largest percentages of extreme poor in comparison to the other districts (See Table 2.5.4-13.).
Table 2.5.4-13: Poverty Map at District Level in 2007
District PopulationPoor % Non-
Poor Poverty
Total Poor Extreme
Non Extreme Ranking
Callao 422,532 16.4 0.2 16.2 83.6 1,762 Ventanilla 282,335 29.2 0.6 28.6 70.8 1,577 Carabayllo 215,065 29.7 2.5 27.2 70.3 1,567 Comas 490,809 19.3 0.7 18.6 80.7 1,733 Los Olivos 320,643 15.9 0.7 15.2 84.1 1,769 Puente Piedra 235,441 31.1 2.0 29.1 68.9 1,532 San Martín de Porres 584,123 15.1 0.5 14.6 84.9 1,776
Total of 7 Districts 2,550,948 22.4 1.0 21.4 77.6 Source: INEI – Technical Demographic and Social Indicator Office, Feb., 2009

FEASIBILITY STUDY ON NORTH LIMA METROPOLITAN AREA WATER SUPPLY AND SEWERAGE OPTIMIZATION PROJECT (II)
FINAL REPORT
NIPPON KOEI CO.,LTD. 2-37 NIPPON KOEI LAC CO.,LTD
(4) Accessibility and Means of Transportation
Districts in the vicinity of the Study area are peripheral districts, and many people commute for work, study, and other purposes to central Lima. On average it takes over 40 minutes for one way travel.
Most used means of transportation for commuting is public transportation (over 80 %). At present, the existing road infrastructure is basically used to access the two major destinations: Lima downtown, and the west area of the city including Argentina Av and the Coast line (via freeway).
There are only two road axis connecting the 7 districts with the rest of the city: the Panamericana Norte, and Túpac Amaru. Thus, existing facilities are insufficient for a suitable “urban mobilization.” The localized transportation within the district areas basically renders a service to residential areas with the rest of the city. There is no significant traffic congestion at district level.
There is an east west interrelation problem as these roads lack continuity. There are 4 roads (over 20 meters wide) that stop 100 meters before reaching Av. Túpac Amaru (De La Puente, Carabayllo, Honduras, and Mexico.) There are no direct road links between the high part, the middle part, and the Chacracerro sector. The high areas have road capacity problems, as the roads are no wider than 14 meters, causing limited urban activity.
Short range public transportation is basically carried out in 2 ways: three wheel auto-rickshaws and the collective taxis. Pedestrian walkway is either non-existent or neglected; especially in the high parts and in the chacracerro sector. Pedestrians have to walk on roads or on dusty road shoulders, with all the potential danger associated with this. Already poorly constructed sidewalks are further disrupted by street vendors, and utility services posts.
Pavement conditions are another critical issue that leads to congestion and sometimes accidents. Most critical pavement problems involve potholes and the lack of asphalt layer.
Unplanned stops by vehicles, particularly buses are also critical, as they cause road congestion. For example, capacity of a 2 lane road decreases up to 30% due to unplanned road side vehicle stoppage. Thus, capacity reduction of a 2 lane road, having a rated capacity of 3,000 vehicle/hour, is 900 vehicle/hour.
The “Metropolitan” is a new integrated public transportation system for Lima, with large capacity articulated buses that run on exclusive corridors or “bus lane”, under the BRT (Bus Rapid Transit) scheme. The first of the Metropolitan route connects the south of Lima with the northern Lima, as it crosses 16 districts in the city of Lima, from Chorrillos to Comas, thus benefiting around 1 million users per day.
The objective of this modern system is to enhance living standard, by reducing the commuting time and offering improved service. This also offers better environmental protection and user safety. More inter-connections to Northern Lima are planned in the future.

FEASIBILITY STUDY ON NORTH LIMA METROPOLITAN AREA WATER SUPPLY AND SEWERAGE OPTIMIZATION PROJECT (II)
FINAL REPORT
NIPPON KOEI CO.,LTD. 2-38 NIPPON KOEI LAC CO.,LTD
(5) Civil Society Organizations
The major civil society organizations in the vicinity of the Study area include:
• The community groups including women’s organizations (Glass of Milk committees, soup kitchens, wawa wasis [day care centers]), youth organizations, neighbors’ organizations (shanty town, housing association, housing cooperative, urbanization, block committee representatives), and civil committees for parks and gardens.
• The private sector. It includes the organized micro businessmen, and trader organizations.
• Non Government Organizations (NGOs), schools, the Lawyers Association, the Biologists Association, the Church, the Civil Ombudsman’s office, the transportation organizations, the local media, the National University of Callao, the San Marcos University, and the Villarreal University, the Frente Único de Dirigentes y Vecinos en Beneficio del distrito de SMP (the Leaders and Neighbors Single Front on Behalf of the San Martin de Porres District - FUDIVUBD-SMP.)
2.5.5 Economic Characteristics
(1) Working Population and Employment Situation
Working age population in the Region of Lima for year 2007 was 3,744,947; 96.4 % of them (3,611,300) were employed, and 3.6 % (133,647) were unemployed. Employment ratio for the province of Lima was 96.4 % (3,274,973), and that for the province of Callao was 95.6 % (350,505). For the 7 districts in the vicinity of the Study area, this ratio was 96.0 % (1,032,684).
Table 2.5.5-1: Working Population Distribution in 2007 of the 7 Districts
Location Employed Unemployed Total
Department of Lima 3,611,300 133,647 3,744,947 Prov. Lima 3,274,973 120,969 3,395,942 Prov. Callao 350,505 16,201 366,706 Callao dist. 168,708 7,932 176,640 Ventanilla dist. 106,754 4,893 111,647 Carabayllo dist. 85,346 3,371 88,717 Comas dist. 199,057 7,588 206,645 Los Olivos dist. 138,538 5,341 143,879 Puente Piedra dist. 91,647 3,522 95,169 San Martín de Porres dist. 242,634 10,424 253,058 Total of 7 Districts 1,032,684 43,071 1,075,755 Source: INEI – 2007 National Censuses: XI population census and VI housing census
The type of employment in the 7 districts in the vicinity of the Study area is shown in the Table 2.5.5-2.

FEASIBILITY STUDY ON NORTH LIMA METROPOLITAN AREA WATER SUPPLY AND SEWERAGE OPTIMIZATION PROJECT (II)
FINAL REPORT
NIPPON KOEI CO.,LTD. 2-39 NIPPON KOEI LAC CO.,LTD
Table 2.5.5-2: Employment Category among the Population in the of the 7 Districts in 2007
Category People % Employee 419,056 40.6 Worker 189,163 18.3 Self – employed 345,434 33.5 Employer 17,026 1.6 Non-paid family member, worker or employee 21,481 2.1 Domestic worker 40,524 3.9
Total 1,032,684 100.0 Source: INEI – 2007 National Censuses: XI population census and VI housing census
(2) Economic and Productive Activity
Economic activities in the 7 districts are driven by medium and large companies, small and medium businesses (Pymes), and the informal sector. The medium and large companies are mostly devoted to industrial and service activities. However, small and medium businesses are the major employer in the area.
The main primary sector activities include cattle-raising, hunting, forestry, and mining. In the 7 districts, for year 2007, primary sector employed 1.7 % of the workforce, and this was as high as 4.8 % for the district of Carabayllo.
The secondary sector includes activities in the manufacturing and construction industries; and for the 7 districts, 21.1 % of the work force are devoted to this sector. Puente Piedra district shows the highest proportion (25.9 %) of employment for this sector.
The tertiary sector is made up of commerce and services, and it involves the largest percentage (77. 2 %) of the work force. Callao is the district having the largest proportion (80.0 %.)
Table 2.5.5-3: Employment by Sector in 2007
Location Primary Sector % Secondary
Sector % Tertiary Sector % Total
Department of Lima 166,525 4.6 691,379 19.1 2,753,396 76.2 3,611,300
Prov. Lima 48,732 1.5 652,174 19.9 2,574,067 78.6 3,274,973
Prov. Callao 6,402 1.8 67,994 19.4 276,109 78.8 350,505
Callao dist. 3,291 2.0 30,452 18.1 134,965 80.0 168,708
Ventanilla dist. 2,048 1.9 26,696 25.0 78,010 73.1 106,754
Carabayllo dist. 4,138 4.8 19,295 22.6 61,913 72.5 85,346
Comas dist. 1,888 0.9 44,138 22.2 153,031 76.9 199,057
Los Olivos dist. 1,301 0.9 26,976 19.5 110,261 79.6 138,538
Puente Piedra dist. 2,276 2.5 23,715 25.9 65,656 71.6 91,647
San Martín de Porres dist. 2,618 1.1 46,584 19.2 193,432 79.7 242,634
Total of 7 Districts 17,560 1.7 217,856 21.1 797,268 77.2 1,032,684
Source: INEI – 2007 National Censuses: XI population census and VI housing census

FEASIBILITY STUDY ON NORTH LIMA METROPOLITAN AREA WATER SUPPLY AND SEWERAGE OPTIMIZATION PROJECT (II)
FINAL REPORT
NIPPON KOEI CO.,LTD. 2-40 NIPPON KOEI LAC CO.,LTD
(3) Income Levels
Gross average monthly household income is 1,159 Nuevos Soles in the Northern Lima which is less than the average income for Metropolitan Lima. Around 78 % of the Northern Lima households show a family income of less than 1,890 Nuevos Soles / month, as shown in Table 2.5.5-4.
Table 2.5.5-4: Gross Family Income Levels
Description Total Lima North Lima
% % Up to189 Nuevos soles 0 0 From 189 to 567 Nuevos soles 16 19 From 567 to 945 Nuevos soles 28 27 From 946 to 1,890 Nuevos soles 29 32 From 1,890 to 3,780 Nuevos soles 11 11 From 3,780 to 9,450 Nuevos soles 4 1 Over 9,450 Nuevos soles 2 0 Not declared 10 10
Total 100 100 Average (Nuevos Soles) 1,761 1,159
Note: Exchange rate taken into account: S/ 3.15 per 1 USD Source: Apoyo Opinión y Mercado – MAPINSE 2007
Table 2.5.5-5 shows that average monthly per capita income is 296 Nuevos Soles in the North Lima, which is also significantly less than the average monthly per capita income for Metropolitan Lima.
Table 2.5.5-5: Monthly per Capital Income Levels
Description Total Lima North Lima % %
Up to189 Nuevos soles 32 36 From 189 to 567 Nuevos soles 38 42 From 567 to 945 Nuevos soles 11 10 From 946 to 1,890 Nuevos soles 5 2 From 1,890 to 3,780 Nuevos soles 2 0 From 3,780 to 9,450 Nuevos soles 1 0 Over 9,450 Nuevos soles 0 0 Not declared 11 10
TOTAL 100 100 Average (Nuevos Soles) 517 296 Note: Exchange rate taken into account: S/ 3.15 per 1 USD Source: Apoyo Opinión y Mercado – MAPINSE 2007

FEASIBILITY STUDY ON NORTH LIMA METROPOLITAN AREA WATER SUPPLY AND SEWERAGE OPTIMIZATION PROJECT (II)
FINAL REPORT
NIPPON KOEI CO.,LTD. 2-41 NIPPON KOEI LAC CO.,LTD
(4) Public Services
1) Electricity
The seven relevant districts have 24-hour electricity supply service offered by EDELNOR. Power supply service coverage is 94.5 %.
2) Water Service
Potable water service in the 7 districts is supplied by SEDAPAL, through its North Service Management and the Commercial Units of Comas and Callao.
According to the 2007 Census, there are 447,620 dwellings with potable water service in the 7 districts, 85.7 % of them have an indoors connection, 6.4 % of them have an outdoors connection, and 7.9 % of them are supplied by sinks.
Table 2.5.5-6: Dwellings with Potable Water Supply – Urban Area
District Total Public Network
Public network Outdoors Sink
Callao 79,374 71,915 6,537 922 Ventanilla 40,067 25,008 1,542 13,517 Comas 86,902 79,095 4,806 3,001 Carabayllo 29,036 22,908 1,673 4,455 Los Olivos 72,299 67,802 3,966 531 Puente Piedra 31,199 17,889 2,380 10,930 San Martín de Porres 108,743 99,174 7,768 1,801
Total 447,620 383,791 28,672 35,157 Share (%) 100.0 85.7 6.4 7.9
Source: INEI – 2007 National Censuses: XI population census and VI housing census
According to SEDAPAL’s commercial statistics as of December, 2009, the 7 districts had 336,876 total potable water connections. This number represents 27.4 % of the total water connections with regard to the total number of connections in all the districts within SEDAPAL’s scope (See Table 2.5.5-7.).
Table 2.5.5-7: Potable Water Connections of the 7 Districts in 2009
District Total Connections
Callao 51,966
Ventanilla 37,023
Carabayllo 26,398
Comas 59,089
Los Olivos 46,524
Puente Piedra 31,160
San Martín de Porres 84,716
Total 336,876 Source: SEDAPAL Tariff Study, April, 2010, SUNASS

FEASIBILITY STUDY ON NORTH LIMA METROPOLITAN AREA WATER SUPPLY AND SEWERAGE OPTIMIZATION PROJECT (II)
FINAL REPORT
NIPPON KOEI CO.,LTD. 2-42 NIPPON KOEI LAC CO.,LTD
3) Sewerage Service
This service is also managed by SEDAPAL. According to the 2007 census, there are 414,055 dwellings in the 7 districts (urban area) that are benefited with the sewerage service; 92.7 % of them have indoors connections to the public network, and 7.3 % have outdoors connections to the public network.
Table 2.5.5-8: Dwellings with Sewerage Service – District Urban Area in 2009
Location Total Public Network Public Network Outdoors
Dist. Callao 79,902 72,997 6,905 Dist. Ventanilla 27,129 25,465 1,664 Dist. Comas 85,162 79,895 5,267 Dist. Carabayllo 24,082 22,647 1,435 Dist. Los Olivos 72,087 67,467 4,620 Dist. Puente Piedra 17,933 15,991 1,942 Dist. San Martin de Porres 107,760 99,161 8,599 Total 414,055 383,623 30,432 Share (%) 100.0 92.7 7.3 Source: INEI – 2007 National Censuses: XI population census and VI housing census
According to SEDAPAL’s commercial statistics as of December, 2009, the 7 districts had 308,088 total sewerage connections. This number represents 27.5 % of the total sewerage with regard to the total number of connections in all the districts within SEDAPAL’s scope (See Table 2.5.5-9.)
Table 2.5.5-9: Sewerage Connections of the 7 Districts
District Total Connections
Callao 47,438 Ventanilla 33,995 Carabayllo 24,207 Comas 54,226 Los Olivos 42,722 Puente Piedra 27,825 San Martín de Porres 77,675 Total 308,088
Source: SEDAPAL Tariff Study, April, 2010, SUNASS
4) Telecommunications
The 7 districts in the vicinity of the Study area are covered with most of the current services and technologies, such as telephone, mobile, radio, cable TV, Internet, etc. i
5) Transportation
With regard to transportation mode, Table 2.5.5-10 shows that 64 % of the population in Lima North has no vehicle of their own. Sports bicycles are the most prominent transport mode in the north Lima area.

FEASIBILITY STUDY ON NORTH LIMA METROPOLITAN AREA WATER SUPPLY AND SEWERAGE OPTIMIZATION PROJECT (II)
FINAL REPORT
NIPPON KOEI CO.,LTD. 2-43 NIPPON KOEI LAC CO.,LTD
Table 2.5.5-10: Transportation Means per Household, Owned by the Family (*)
Description Total Lima Lima North % %
None 62 64 Has some kind of vehicle (*) 36 32
· Sports bicycle 21 23 · Automobile / pick up truck 18 11 · Automobile / private 4-wheel drive vehicle 14 8 · Automobile / pick up truck for work 5 4 · Bicycle for work 3 4 · Tricycle for work 2 3 · Three wheel auto rickshaw 1 0 · Motorbike 1 0 · Truck for work 0 0
Not specified 2 4 (*) Some use two or more types of services. Source: APOYO Opinión y Mercado - MAPINSE 2007
(5) Tourism
The 7 districts in the vicinity of the Study area have a wide range of tourism resources that are being promoted by their respective municipalities.
In order to turn Comas into an ecotourism oriented district, the Comas municipality is working on starting a circuit that will combine visits to cultural spaces, botanical parks, as well as archaeological sites. A boulevard was built to pay homage to Peruvian folk music and in memory of the Néctar folk music band. Likewise, a botanic park is being set up that not only will display a great variety of plant and flower species, but will also have trees pruned in animal shapes. Another park, the Sinchi Roca Park, has been designed for family entertainment. The tourist circuit will also include the Culture Boulevard, where the International Outdoors Drama Festival (Fiteca) will take place.
Other tourist sites in the Study area of influence include the Ventanilla Swamps, in the central western area of the Ventanilla district, just beside the Costa Azul beach. The swamps have a surface of 366 Hectares, and they are surrounded by low hills at the Ventanilla Pampa and the Salinas and Los Perros Hills. This is a wildlife heaven for many flora species, such as the totora reed, rush, seashore grass, glasswort, wild cane, etc. At least 54 bird species have been registered in the Swamps, including both resident and migrating birds. The most significant include the big white heron, the small white heron, the blue heron, the “perrito cigüeñela” (a kind of small stork – an endangered species), the “huerequeque” (Peruvian thick-knee), the “zarapito trinador” (whimbrel), the “turtupilin” (vermilion flycatcher), the red-breast bird, the “saltapalito” (blue black grassquit), etc.
The Pampa de los Perros archaeological site is located in the southern part of the Ventanilla district, and due to its importance, the Andean Archaeology Research Center (CIARA) took on the initiative to revalue it, as it is one of the oldest monumental architecture in Lima.
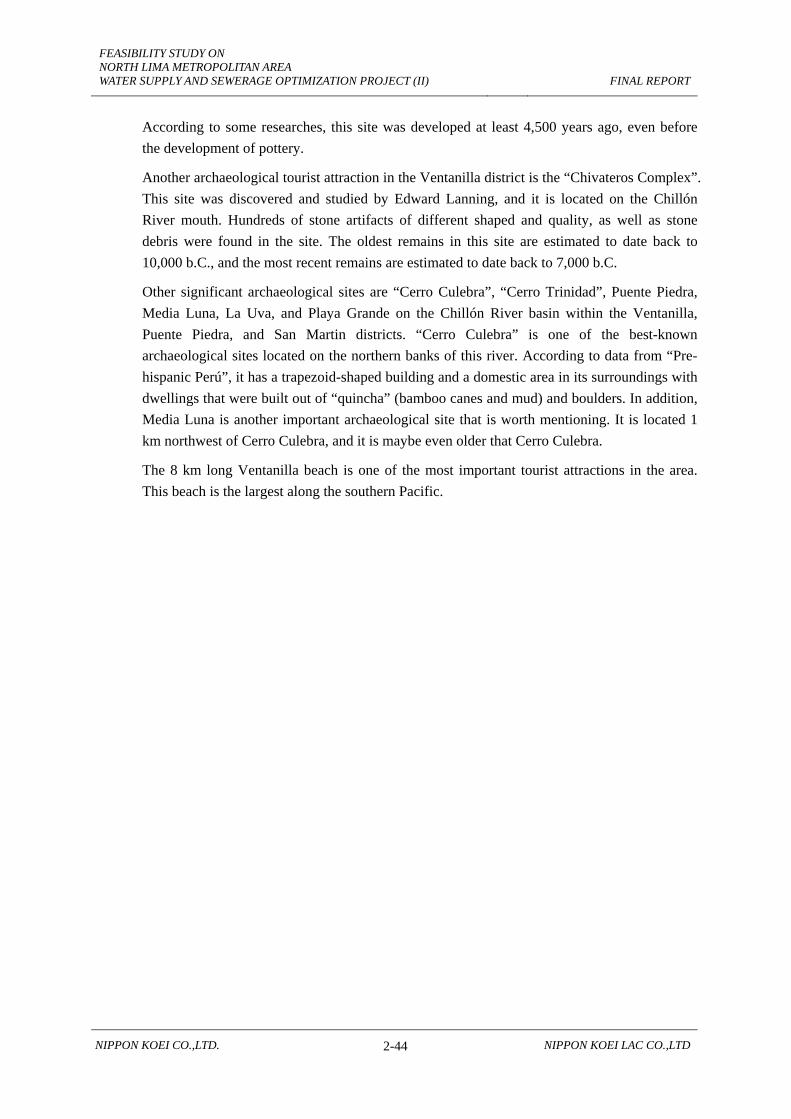
FEASIBILITY STUDY ON NORTH LIMA METROPOLITAN AREA WATER SUPPLY AND SEWERAGE OPTIMIZATION PROJECT (II)
FINAL REPORT
NIPPON KOEI CO.,LTD. 2-44 NIPPON KOEI LAC CO.,LTD
According to some researches, this site was developed at least 4,500 years ago, even before the development of pottery.
Another archaeological tourist attraction in the Ventanilla district is the “Chivateros Complex”. This site was discovered and studied by Edward Lanning, and it is located on the Chillón River mouth. Hundreds of stone artifacts of different shaped and quality, as well as stone debris were found in the site. The oldest remains in this site are estimated to date back to 10,000 b.C., and the most recent remains are estimated to date back to 7,000 b.C.
Other significant archaeological sites are “Cerro Culebra”, “Cerro Trinidad”, Puente Piedra, Media Luna, La Uva, and Playa Grande on the Chillón River basin within the Ventanilla, Puente Piedra, and San Martin districts. “Cerro Culebra” is one of the best-known archaeological sites located on the northern banks of this river. According to data from “Pre-hispanic Perú”, it has a trapezoid-shaped building and a domestic area in its surroundings with dwellings that were built out of “quincha” (bamboo canes and mud) and boulders. In addition, Media Luna is another important archaeological site that is worth mentioning. It is located 1 km northwest of Cerro Culebra, and it is maybe even older that Cerro Culebra.
The 8 km long Ventanilla beach is one of the most important tourist attractions in the area. This beach is the largest along the southern Pacific.

FEASIBILITY STUDY ON NORTH LIMA METROPOLITAN AREA WATER SUPPLY AND SEWERAGE OPTIMIZATION PROJECT (II)
FINAL REPORT
NIPPON KOEI CO.,LTD. 2-45 NIPPON KOEI LAC CO.,LTD
2.5.6 Results of Socioeconomic Study
(1) SEDAPAL Service in the Study Area
The geographic area of the Study is included in the districts of Los Olivos, San Martín de Porres, Callao, Comas, Carabayllo, Ventanilla and Puente Piedra. As explained before, SEDAPAL divided each district into several sectors. A total of 32 sectors are included in the Study area. The sectors that have households with SEDAPAL water connections are: sectors 83, 84 and 85 in Los Olivos; sectors 212 and 213 in San Martín de Porres; sectors 345, 346, 347, 348 and 349 in Comas; sectors 350 and 351 in Carabayllo; sectors 368 and 369 in Puente Piedra; and sector 259 in Callao. The sectors within the Study area without SEDAPAL water service networks are: sectors 251, 252, 253, 254 and 255 in San Martín de Porres; sectors 256, 257, 258 in Callao sectors 260, 261, 262 and 263 in Ventanilla and sectors 361 and 370 in Puente Piedra. Further, sectors 264, 265 and 266 are also without SEDAPAL water services, but the populations of these sectors are very low. The number of households within the Study area is composed of 105,590 households with SEDAPAL water and sanitation services and 41,245 households without SEDAPAL service.
(2) Survey Methodology
The objective of the socio-economic study by sample survey was to obtain primary information about the households with and without SEDAPAL services regarding income and willingness to pay for the water and sanitation services, and the impact of improvement of household connections that will be a direct result of the project.
Two types of questionnaires were prepared for “with” and “without” SEDAPAL services, the method of questioning varies regarding to the service facilities. The questionnaire for each case is attached in Appendix A7.
Before the actual field survey, training of the surveyors was carried out (for 1 day) and a pilot survey (pre-testing) was applied (for 1 day) in order to improve the questions so that the surveyors can get the result properly.
Source: JICA Study Team Source: JICA Study Team
Picture 2.5.6-1: Training of Surveyors Picture 2.5.6-2: Pilot Survey in Callao

FEASIBILITY STUDY ON NORTH LIMA METROPOLITAN AREA WATER SUPPLY AND SEWERAGE OPTIMIZATION PROJECT (II)
FINAL REPORT
NIPPON KOEI CO.,LTD. 2-46 NIPPON KOEI LAC CO.,LTD
The survey sample size was 388 households chosen randomly on the basis of a proportional distribution of each SEDAPAL sectors. The sample size1 has an acceptable error of d=+/- 5 %, associated to a level of confidence of 95% (t), and in the conditions of heterogeneity the prior informative probability of 0.5 (p=0.5 and q=0.5). The sample has been distributed proportionally to the quantity of SEDAPAL service connection in each sector. . Table 2.5.6-1 shows the sample distribution.
Table 2.5.6-1: Samples of survey by districts and sectors District Sector Population
with service Quantity of
houses (%) Quantity of samples
Los Olivos 83 46,550 11,271 10.3% 39 84 61,202 14,819 13.5% 52 85 37,517 9,084 8.3% 32
S.M.de Porres 212 44,046 10,196 9.7% 37 213 17,414 4,031 3.8% 15
Callao/Ventanilla 259 12,020 2,751 2.7% 16
Comas -1 345 10,528 2,340 2.3% 9 346 33,892 7,532 7.5% 29 347 21,235 4,719 4.7% 18
Carabayllo 350 39,680 9,293 8.8% 33 351 6,266 1,467 1.4% 5
Comas -2 348 18,961 4,214 4.2% 16 349 44,094 9,799 9.7% 37
Puente Piedra 368 32,316 7,622 7.1% 27 369 27,367 6,454 6.0% 23
Total 453,088 105,590 100% 388 1/ 1/ 1% of houses has been added Source: JICA Study Team, 2010
Furthermore, a sample of 82 households was surveyed in sectors without SEDAPAL service. The purpose of applying the survey in these areas was to investigate the economic situation of the families and of other services. The accuracy of results from these areas is less than that of the households with service. The minimum sample number was decided as four (4) samples for each sector. However, no samples were taken from sectors 260, 264, 265 or 266, because the populations of these sectors are very low (for example, only 147 for sector 265).
Table 2.5.6-2 shows the sample distribution by district, and sectors with and without SEDAPAL water service networks.
1 Formula used, n=t2.p.q/(d2), t= 1.96, without finite correction

FEASIBILITY STUDY ON NORTH LIMA METROPOLITAN AREA WATER SUPPLY AND SEWERAGE OPTIMIZATION PROJECT (II)
FINAL REPORT
NIPPON KOEI CO.,LTD. 2-47 NIPPON KOEI LAC CO.,LTD
Table 2.5.6-2: Survey Samples by Sectors and Supply Type
District Sector Population Number of
Samples SEDAPAL
Service Hours of
Service (h)Type of Alternative
Service
Los Olivos 83 46,550 39 Yes 24 84 61,202 52 Yes 24 85 37,517 32 Yes 24
S.M.de Porres
212 44,046 37 Yes 24 213 17,414 15 Yes 24 251 32,835 12 No ... Tank truck 252 18,972 7 No … Well/Tank Truck 253 17,414 6 No … Well/Tank Truck 254 29,036 10 No … Well/Tank Truck 255 4,501 4 No … Well/Tank Truck
Callao/Ventanilla
256 40,304 14 No … Well/Tank Truck 257 5,166 4 No … Well/Tank Truck 258 170 4 No … Well/Tank Truck 259 12,020 16 Yes 12 261 3370 4 No … Tank truck
262 375 4 No … Well
263 309 4 No … Tank truck
Comas -1 1/
345 10,528 9 Yes 24 346 33892 29 Yes 24 347 21,235 18 Yes 24
Comas -2 2/ 348 18,961 16 Yes 5 a 7 349 44,094 37 Yes 3
Carabayllo 350 39,680 33 Yes 24 351 6,266 5 Yes 24
Puente Piedra
361 13,631 5 No … Well 368 32,316 27 Yes 24 369 27,367 23 Yes 24 370 5,572 4 No … Well
Total 470 1/Has water supply 24 hours a day; 2/ water service around 3 to 7 hours a day. Source: JICA Study Team
Two standardized questionnaires were designed with both open- and close-ended questions to be asked in a face-to-face interview. In both questionnaires, five (05) replies were printed for willingness to pay with different values, with the goal of estimating the willingness to pay for improvement in services as a direct effect of the project.
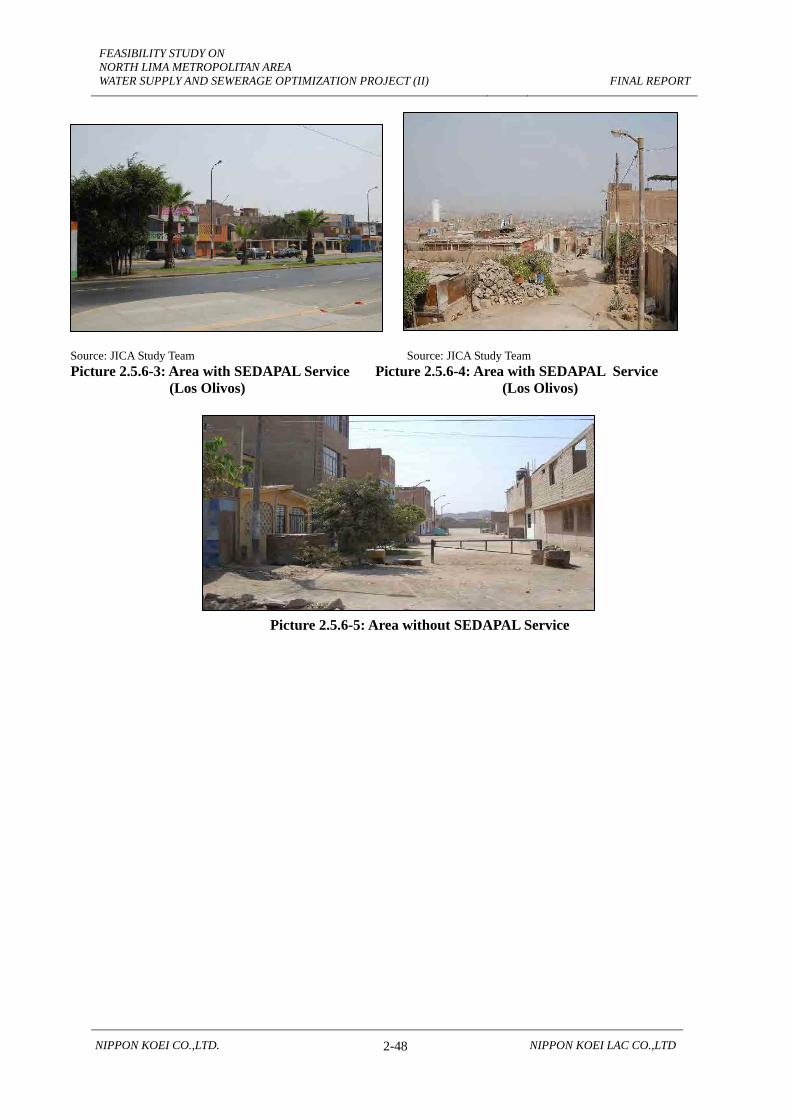
FEASIBILITY STUDY ON NORTH LIMA METROPOLITAN AREA WATER SUPPLY AND SEWERAGE OPTIMIZATION PROJECT (II)
FINAL REPORT
NIPPON KOEI CO.,LTD. 2-48 NIPPON KOEI LAC CO.,LTD
Source: JICA Study Team Source: JICA Study Team Picture 2.5.6-3: Area with SEDAPAL Service Picture 2.5.6-4: Area with SEDAPAL Service (Los Olivos) (Los Olivos)
Picture 2.5.6-5: Area without SEDAPAL Service

Figure 2.5.6-1: Sectors with and without SEDAPAL Service – Survey Coverage
FEASIBILITY STUDY ON NORTH LIMA METROPOLITAN AREA WATER SUPPLY AND SEWERAGE OPTIMIZATION PROJECT (II)
FINAL REPORT
NIPPON KOEI CO.,LTD. 2-50 NIPPON KOEI LAC CO.,LTD
(3) Survey Results
1) Family Size
The average number of persons per family is 4.2 for the sectors with SEDAPAL service, with the lowest value being 3.6 persons per household (sector 354, Comas) and the highest value being 4.9 persons per household (sector 369, Puente Piedra), as can be observed in Table 2.5.6-3.
2) Family Income and Expenditures
The results of the total monthly incomes and expenditures for each sector (with and without SEDAPAL service) are shown in Table 2.5.6-3 and Table 2.5.6-4. The income was calculated from the number of working people and the quantity of income for each working family member in the household. The expenditure was calculated by adding all types of expenses (such as electricity, water and sewerage, telephone, gas, rent, food, education, clothing, transportation and others). The average family incomes for the households connected to the SEDAPAL network vary between S/. 1,410 and S/. 3,826, with an average of S/. 2,058; while for the households not connected to the SEDAPAL network, the family incomes were less, varying between S/. 585 and S/. 2,721 (S/. 1,534 average).
It is to be noted that small differences can occur due to sampling error, considering that the families surveyed sometimes declare greater expenditures and lesser incomes than the actual values. For that reason, the household expenditures are sometimes better indicators of approximate household income.

FEASIBILITY STUDY ON NORTH LIMA METROPOLITAN AREA WATER SUPPLY AND SEWERAGE OPTIMIZATION PROJECT (II)
FINAL REPORT
NIPPON KOEI CO.,LTD. 2-51 NIPPON KOEI LAC CO.,LTD
Table 2.5.6-3: Monthly Family Incomes and Expenditures by Sector with SEDAPAL Water Service
Source: JICA Study Team Source: JICA Study Team
Figure 2.5.6-2: Monthly Family Incomes and Expenditures by Sector with SEDAPAL Water Service
District Sector Frequency
Average Number Living in
Household
Average Monthly
Family Income (S/.)
Average Monthly
Expenditures (S/.)
Income, from OMP: “Apoyo
Opinión y Mercado” 2005
Los Olivos 83 39 3,9 3,826 1,523
1,425 84 50 4,1 2,083 1,409 85 32 4,2 2,238 1,471
San Martín de Porres
212 37 4,5 1,988 1,225 1,165
213 15 4,2 1,734 1,086 Callao 259 16 4,4 1,731 1,370 1,174
Carabayllo 350 33 4,3 1,887 1,351
868 351 5 4,7 1,795 972
Comas- 1 345 8 3,6 1,650 1,186
1,060 346 27 4,0 1,410 930 347 18 4,2 1,709 1,231
Comas-2 348 16 4,6 1,817 1,147 349 36 4,1 1,886 1,134
Carabayllo 350 33 4,3 1,887 1,351
868 351 5 4,7 1,795 972
Puente Piedra 368 27 4,3 1,684 1,219
708 369 23 4,9 1,659 1,257
Total Average 382 4,2 2,058 1,275
0
1000
2000
3000
4000
5000
6000
83 84 85 212 213 259 350 351 345 346 347 348 349 368 369
Egresopromedio
Promedio deIngresosfamiliaresmensual
Average Monthly Family Income
Average Monthly Expenditures
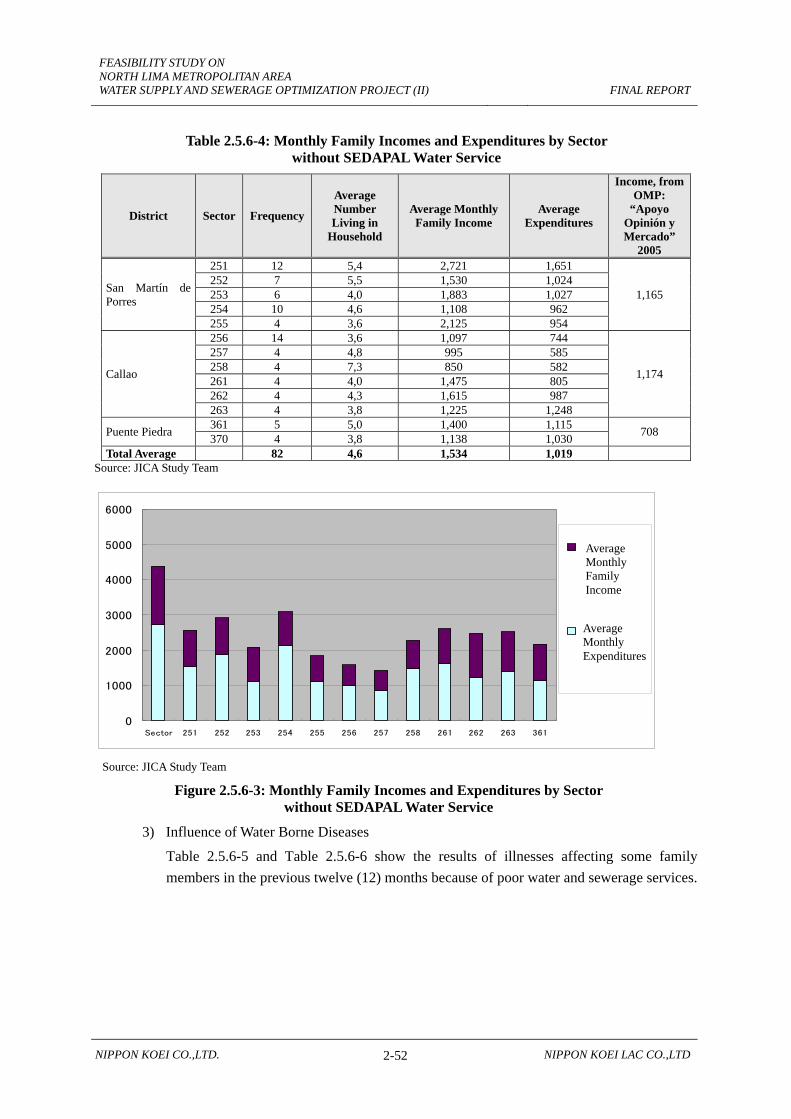
FEASIBILITY STUDY ON NORTH LIMA METROPOLITAN AREA WATER SUPPLY AND SEWERAGE OPTIMIZATION PROJECT (II)
FINAL REPORT
NIPPON KOEI CO.,LTD. 2-52 NIPPON KOEI LAC CO.,LTD
Table 2.5.6-4: Monthly Family Incomes and Expenditures by Sector without SEDAPAL Water Service
District Sector Frequency
Average Number Living in
Household
Average Monthly Family Income
Average Expenditures
Income, from OMP:
“Apoyo Opinión y Mercado”
2005
San Martín de Porres
251 12 5,4 2,721 1,651
1,165 252 7 5,5 1,530 1,024 253 6 4,0 1,883 1,027 254 10 4,6 1,108 962 255 4 3,6 2,125 954
Callao
256 14 3,6 1,097 744
1,174
257 4 4,8 995 585 258 4 7,3 850 582 261 4 4,0 1,475 805 262 4 4,3 1,615 987 263 4 3,8 1,225 1,248
Puente Piedra 361 5 5,0 1,400 1,115 708 370 4 3,8 1,138 1,030 Total Average 82 4,6 1,534 1,019
Source: JICA Study Team
Source: JICA Study Team
Figure 2.5.6-3: Monthly Family Incomes and Expenditures by Sector without SEDAPAL Water Service
3) Influence of Water Borne Diseases
Table 2.5.6-5 and Table 2.5.6-6 show the results of illnesses affecting some family members in the previous twelve (12) months because of poor water and sewerage services.
0
1000
2000
3000
4000
5000
6000
Sector 251 252 253 254 255 256 257 258 261 262 263 361
Egresopromedio
Promedio deIngresosfamiliaresmensual
Average Monthly Family Income
Average Monthly Expenditures

FEASIBILITY STUDY ON NORTH LIMA METROPOLITAN AREA WATER SUPPLY AND SEWERAGE OPTIMIZATION PROJECT (II)
FINAL REPORT
NIPPON KOEI CO.,LTD. 2-53 NIPPON KOEI LAC CO.,LTD
Table 2.5.6-5: Illness Related to Poor Water and Sewerage Service in Areas with SEDAPAL Service
Illness Sector
Total (388 samples) 83 84 85 212 259 350 349 369
Diarrhea 1 4 2 0 2 0 2 0 11 (2.8%) Skin 0 0 0 1 0 2 1 1 5 (1.7%) Conjunctivitis 1 3 0 0 0 1 0 0 5 (1.7%) Parasitosis 0 0 0 0 0 0 1 0 1 (0.3%) Other sickness 0 1 0 0 0 0 0 0 1 (0.3%) Total 2 8 2 1 2 3 4 1 23 (5.9 %)
Source: JICA Study Team
Table 2.5.6-6: Illness Related to Poor Water and Sewerage Service in Areas without SEDAPAL Service
Illness
District Total
(82 samples) San Martín de Porres
Callao Puente Piedra
Diarrhea 16 3 3 22 (26.7%) Cholera 3 0 0 3 (3.7%) Skin 1 1 0 2 (2.4%) Parasitosis 1 0 0 1 (1.2%) Typhoid 0 1 0 1 (1.2%) Total 21 5 3 29 (35.4%)
Source: JICA Study Team The rate of incidence of diarrheal illnesses indicates a high incidence in the zone without SEDAPAL service in comparison with the area that has SEDAPAL service. Therefore, the benefit of reducing illnesses by supplying SEDAPAL water is considered high.
4) Water Supply Information
(a) With SEDAPAL Service: Facility and Water Supply Problems
i) Average monthly water consumption
The average monthly water consumption is 17.9 m3. The monthly consumption in each sector and district is indicated in Table 2.5.6-7.
The verification of the average consumption in each case was carried out by reading the SEDAPAL invoices; however, many users had difficulty finding their last invoice, as well as the previous ones, and it is possible that some were delinquent accounts.
ii) Payment for water service
Table 2.5.6-7 shows the average monthly payments for water consumption by sector.
The average monthly payment for water consumption is S/. 42.89 nuevos soles. The values for the districts of Los Olivos and S.M. de Porres are above the mean and that for the Puente Piedra is the lowest. Many users complain about their high consumption bills, and others maintain that their consumption does not correspond to the amount of the invoice, as they have been wrongly considered a residential sector.

FEASIBILITY STUDY ON NORTH LIMA METROPOLITAN AREA WATER SUPPLY AND SEWERAGE OPTIMIZATION PROJECT (II)
FINAL REPORT
NIPPON KOEI CO.,LTD. 2-54 NIPPON KOEI LAC CO.,LTD
In the sectors where water is rationed to 12 hours a day, as in sector 259 in Callao, the households pay around S/. 30.13. In sector 348 in Comas, where the water is rationed to 5 to 7 hours per day, the households pay S/. 39.56; sector 349 receives water only 3 hours a day and pays a sum of S/. 29.68.
If the values indicated in the Optimized Master Plan (OMP), 2009-2013 are compared with the survey results, it is observed that the payment amounts for monthly service consumption are higher in the survey results. According to the OMP, on average, the households with SEDAPAL service pay S/. 37.0 per month; whereas in the survey the payment was S/. 42.89. However, one reason for this difference may be the natural increase in income, as the OMP information is four (4) years old.
Table 2.5.6-7: Average Monthly Water Consumption and Payments in Areas with SEDAPAL Service
District Sector Sample
Size Hours of Service
Average Monthly Water Consumption
(m3/Household)
Monthly Payment for Water
Consumption (S/./Household)
Payment/ Consumption
(S/./ m3)
Los Olivos 83 39 24 28.8 70.9 2.46 84 52 24 17.4 46.6 2.68 85 29 24 15.3 46.3 3.03
San Martín de Porres
212 27 24 19.0 43.0 2.26 213 15 24 13.6 39.1 2.88
Callao 259 16 12 12.7 30.1 2.37
Comas 1 345 9 24 15.7 30.7 1.96 346 20 24 17.2 45.1 2.62
Comas 2 347 18 24 22.1 53.2 2.41 348 15 5 a 7 20.1 39.6 1.97 349 37 3 14.7 29.7 2.02
Carabayllo 350 32 24 23.8 44.5 1.87 351 3 24 17.4 34.4 1.98
Puente Piedra 368 27 24 10.5 27.4 2.61 369 22 24 11.0 27.1 2.46
Total 361 17.9 42.9 2.40 Source: JICA Study Team
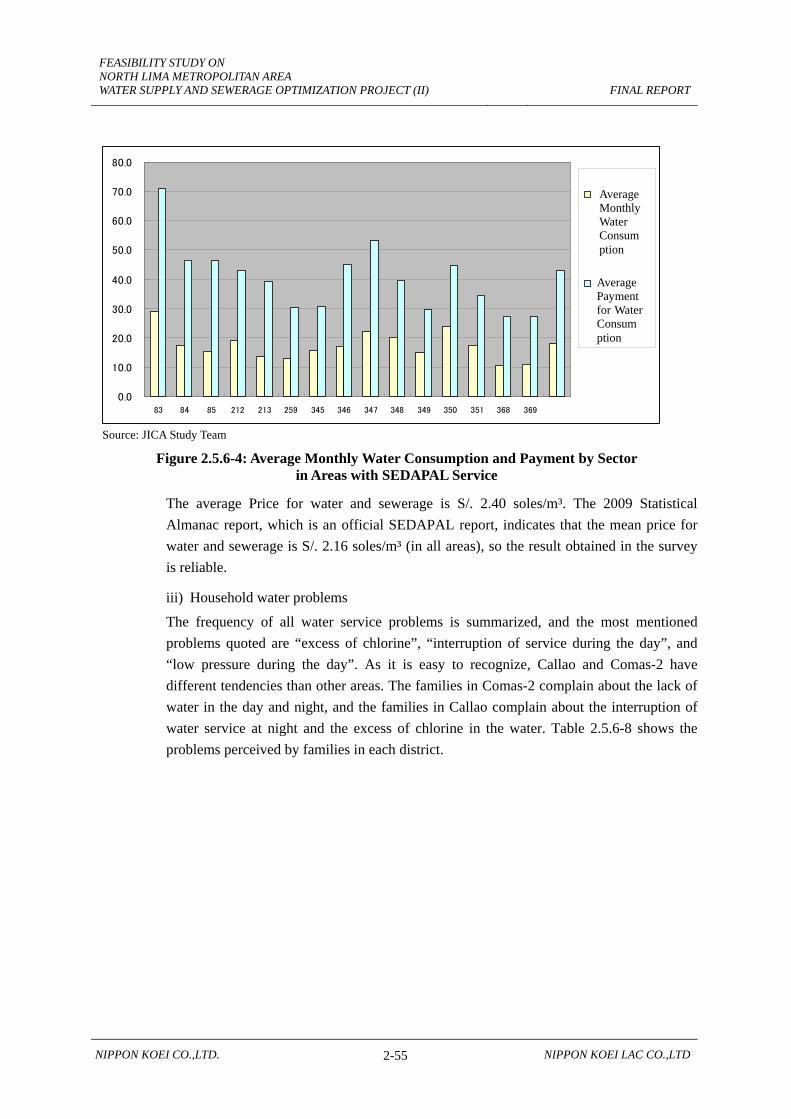
FEASIBILITY STUDY ON NORTH LIMA METROPOLITAN AREA WATER SUPPLY AND SEWERAGE OPTIMIZATION PROJECT (II)
FINAL REPORT
NIPPON KOEI CO.,LTD. 2-55 NIPPON KOEI LAC CO.,LTD
Source: JICA Study Team
Figure 2.5.6-4: Average Monthly Water Consumption and Payment by Sector in Areas with SEDAPAL Service
The average Price for water and sewerage is S/. 2.40 soles/m³. The 2009 Statistical Almanac report, which is an official SEDAPAL report, indicates that the mean price for water and sewerage is S/. 2.16 soles/m³ (in all areas), so the result obtained in the survey is reliable.
iii) Household water problems
The frequency of all water service problems is summarized, and the most mentioned problems quoted are “excess of chlorine”, “interruption of service during the day”, and “low pressure during the day”. As it is easy to recognize, Callao and Comas-2 have different tendencies than other areas. The families in Comas-2 complain about the lack of water in the day and night, and the families in Callao complain about the interruption of water service at night and the excess of chlorine in the water. Table 2.5.6-8 shows the problems perceived by families in each district.
0.0
10.0
20.0
30.0
40.0
50.0
60.0
70.0
80.0
83 84 85 212 213 259 345 346 347 348 349 350 351 368 369
Consumopromediomensual deagua
Pagomensual porconsumo deagua
Average Monthly Water Consumption
Average Payment for Water Consumption
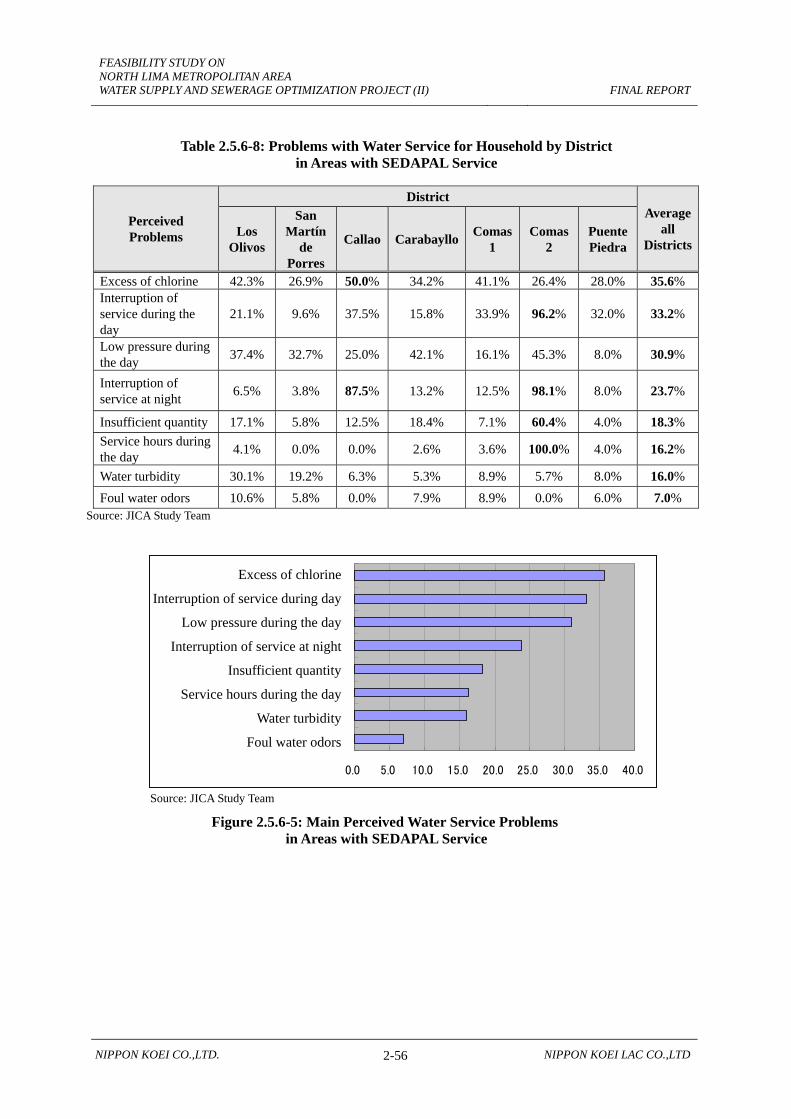
FEASIBILITY STUDY ON NORTH LIMA METROPOLITAN AREA WATER SUPPLY AND SEWERAGE OPTIMIZATION PROJECT (II)
FINAL REPORT
NIPPON KOEI CO.,LTD. 2-56 NIPPON KOEI LAC CO.,LTD
Table 2.5.6-8: Problems with Water Service for Household by District in Areas with SEDAPAL Service
Source: JICA Study Team
Source: JICA Study Team
Figure 2.5.6-5: Main Perceived Water Service Problems in Areas with SEDAPAL Service
Perceived Problems
District Average
all Districts
Los Olivos
San Martín
de Porres
Callao Carabayllo Comas 1
Comas 2
Puente Piedra
Excess of chlorine 42.3% 26.9% 50.0% 34.2% 41.1% 26.4% 28.0% 35.6% Interruption of service during the day
21.1% 9.6% 37.5% 15.8% 33.9% 96.2% 32.0% 33.2%
Low pressure during the day 37.4% 32.7% 25.0% 42.1% 16.1% 45.3% 8.0% 30.9%
Interruption of service at night 6.5% 3.8% 87.5% 13.2% 12.5% 98.1% 8.0% 23.7%
Insufficient quantity 17.1% 5.8% 12.5% 18.4% 7.1% 60.4% 4.0% 18.3% Service hours during the day 4.1% 0.0% 0.0% 2.6% 3.6% 100.0% 4.0% 16.2%
Water turbidity 30.1% 19.2% 6.3% 5.3% 8.9% 5.7% 8.0% 16.0% Foul water odors 10.6% 5.8% 0.0% 7.9% 8.9% 0.0% 6.0% 7.0%
0.0 5.0 10.0 15.0 20.0 25.0 30.0 35.0 40.0
Mal o lor del agua
Turbidez de agua
Horas de servic io al día
Insuf ic iente cantidad
Corte de servic io en las noches
Baja presión en e l día
Cortes de servic io en el día
Exceso de c loro Excess of chlorine
Interruption of service during day
Low pressure during the day
Interruption of service at night
Insufficient quantity
Service hours during the day
Water turbidity
Foul water odors

FEASIBILITY STUDY ON NORTH LIMA METROPOLITAN AREA WATER SUPPLY AND SEWERAGE OPTIMIZATION PROJECT (II)
FINAL REPORT
NIPPON KOEI CO.,LTD. 2-57 NIPPON KOEI LAC CO.,LTD
Source: JICA Study Team Source: JICA Study Team Picture 2.5.6-6: Comas 2 Picture 2.5.6-7: Basins
The hours of water service in the Comas and Callao sectors is currently restricted. Continuous supply shall be obtained through implementation of the Project.
iv) Water problems outside the home
The problems outside of homes are shown in Table 2.5.6-9; “stolen meters” are the main problem, and the frequency of other problems is low. In Callao, there are more water service problems regarding the frequent occurrence of leaks, breaks, and floods. According to the study interview, the reason for this was said to be the poor work performed during pipe installation in this area. (See Table 2.5.6-9).
Table 2.5.6-9: Service Problems Observed Outside the Home in Areas with SEDAPAL Service
Problems Outside the Home
District Avergae
all Districts
Los Olivos
San Martin
de Porres
CallaoCaraba
yllo Comas
1 Comas
2 Puente Piedra
Stolen meters 57.7% 30.8% 62.5% 44.7% 45.5% 1.9% 34.0% 40.6%
Water service has leaks 19.7% 7.7% 37.5% 13.2% 21.4% 9.4% 12.0% 16.0%
Delay in fixing breaks 22.8% 3.8% 13.3% 13.2% 23.2% 5.7% 6.0% 14.5%
Problems with breaks and floods
16.3% 7.7% 25.0% 15.8% 16.1% 7.5% 10.0% 13.4%
Clandestine interventions
4.1% 2.0% 6.3% 0.0% 0.0% 11.3% 2.0% 3.6%
Flooding of home 4.9% 5.8% 0.0% 0.0% 5.4% 1.9% 2.0% 3.6% Source: JICA Study Team

FEASIBILITY STUDY ON NORTH LIMA METROPOLITAN AREA WATER SUPPLY AND SEWERAGE OPTIMIZATION PROJECT (II)
FINAL REPORT
NIPPON KOEI CO.,LTD. 2-58 NIPPON KOEI LAC CO.,LTD
Source: JICA Study Team
Figure 2.5.6-6: Water Service Problems Observed Outside the Home in Areas with SEDAPAL Service
v) Use of electric water pump
According to the survey result, the number of household pumps (electric pumps for elevated water tanks) installed is limited or minimal (only 1.6% of households). The average installation cost for the cistern, pump and tank is S/. 933.3 nuevos soles, and the average monthly maintenance cost for the electric pump is S/. 27.5 nuevos soles. (See Table 2.5.6-10).
Table 2.5.6-10: Use of Electric Pump to Propel Water to an Elevated Tank in Areas with SEDAPAL Service
Response
District
Total SampleLos Olivos
San Martín
de Porres
Callao CarabaylloComas
1 Comas
2 Puente Piedra
Yes 1 1 0 1 1 1 1 6 (1.6%)
No 119 51 10 36 52 51 44 363 (98.4%)
Total 120 52 10 37 53 52 45 369 (100%) Source: JICA Study Team
(b) Without SEDAPAL Service
i) Household water source
Of the households surveyed, regarding the water source, 59.8% are served by a tank truck, 37.8% are served by wells, and 2.4% are served by both wells and tank trucks.
0.0% 5.0% 10.0%
15.0%
20.0%
25.0%
30.0%
35.0%
40.0%
45.0%
Inundaciones de viviendas
Intervenciones c landestinas
Presenta problemas de roturas y aniegos
Demora en repararse roturas
El servic io de agua tiene fugas
Robos de medidoresStolen meters
Water service has leaks
Delay in fixing breaks
Problems with breaks and floods
Clandestine interventions
Flooding of home

FEASIBILITY STUDY ON NORTH LIMA METROPOLITAN AREA WATER SUPPLY AND SEWERAGE OPTIMIZATION PROJECT (II)
FINAL REPORT
NIPPON KOEI CO.,LTD. 2-59 NIPPON KOEI LAC CO.,LTD
Source: JICA Study Team
Figure 2.5.6-7: Household Water Supply Source by District in Areas with SEDAPAL Service
Source: JICA Study Team Source: JICA Study Team Picture 2.5.6- 8: Water Tank Truck Picture 2.5.6-9: Typical Installation of
Water Tank in Front of Home
ii) Average monthly water consumption
The average monthly water consumption is 5.0 m3. The mean consumption quantity in sectors without SEDAPAL service is only 28% of the mean quantity in the SEDAPAL service area, as can be observed in Table 2.5.6-11.
23,138,2
100,0
37,8
71,8 61,8 59,8
5,1 2,40,0
20,040,060,080,0
100,0120,0
San Martín dePorres (39
casos)
Callao (34casos)
Puente Piedra (9casos)
Total (82 casos)
Pozo Camión Cisterna Pozo y camión cisterna

FEASIBILITY STUDY ON NORTH LIMA METROPOLITAN AREA WATER SUPPLY AND SEWERAGE OPTIMIZATION PROJECT (II)
FINAL REPORT
NIPPON KOEI CO.,LTD. 2-60 NIPPON KOEI LAC CO.,LTD
Table 2.5.6-11: Average Monthly Water Consumption and Payment in Areas without SEDAPAL Service
District Sector Sample
Size Type of Service
Average Monthly Water
Consumption (m3/Household)
Monthly Payment for Water
Consumption (S/.)
San Martín de Porres
251 12 Tank truck 5.8 61.9 252 7 Well/Tank truck 1.2 74.6 253 6 Well/Tank truck 3.9 63.1 254 10 Well/Tank truck 4.0 47.9 255 4 Well/Tank truck 5.5 53.5
Callao/Ventanilla
256 14 Well/Tank truck 3.3 25.8 257 4 Well/Tank truck 2.0 18.8 258 4 Well/Tank truck 1.0 29.3 261 4 Tank truck 5.5 61.3 262 4 Well 10.3 27.5 263 4 Tank truck 7.5 78.8
Puente Piedra 361 5 Well 12.8 0.0 370 4 Well 7.6 7.0
Total 82 5.0 44.1 Source: JICA Study Team
iii) Principal water supply problems in the home
The homes have four types of problems: insufficient quantity of water in the home, turbidity of water, interruption of service and low water pressure during the day. The rest of the problems are less significant for the majority of households. These identified problems are due to the fact that the homes that have a water tap or well do not have an adequate water supply. Regarding problems outside of the home, the greatest problem is the presence of water leaks or floods.
Source: JICA Study Team
Figure 2.5.6-8: Water Service Problems Observed in the Home in Areas without SEDAPAL Service
9.1
18.2
36.4
36.4
48.5
51.5
66.7
60.6
0.0 10.0 20.0 30.0 40.0 50.0 60.0 70.0 80.0
Exceso de cloro
Mal olor del agua
Horas de servicio al día
Corte de servicio en las noches
Cortes de servicio en el día
Turbidez de agua
Insuficiente cantidad
Baja presión en el díaLow water pressure during the day
Insufficient quantity of water
Turbidity of water
Interruption of service during the day
Interruption of service in the night
Service hours of day time
Bad odor of water
Excess of chlorine
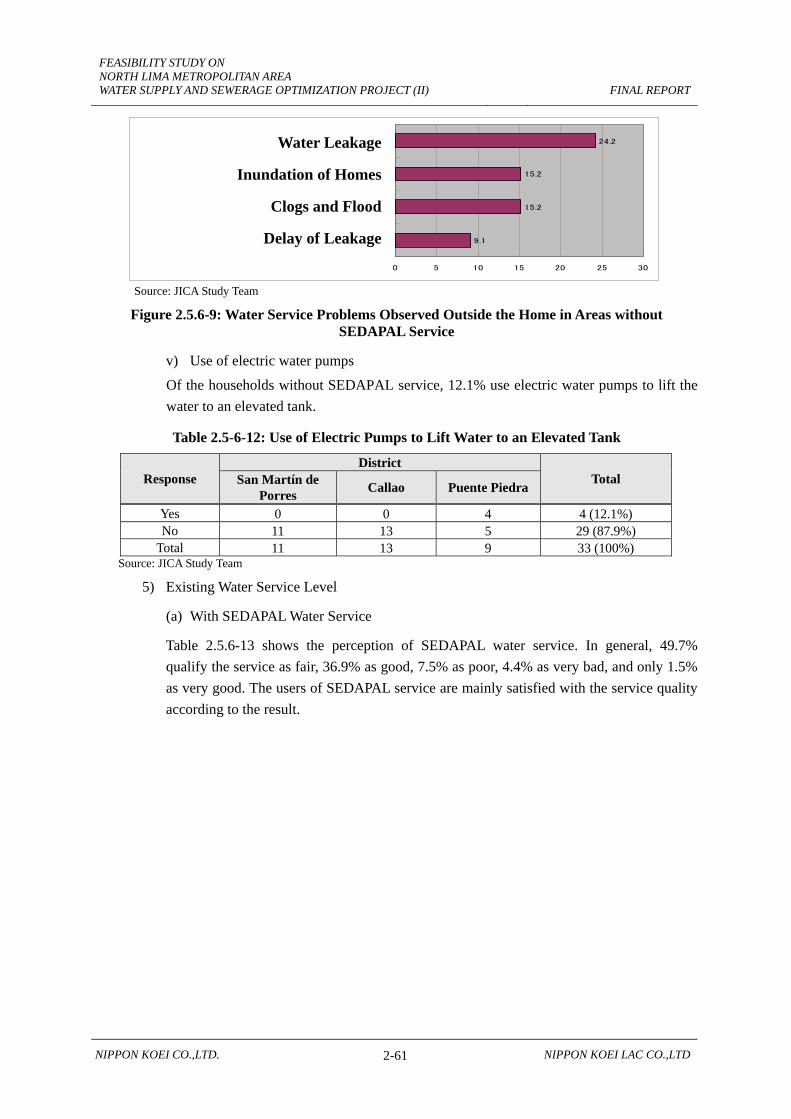
FEASIBILITY STUDY ON NORTH LIMA METROPOLITAN AREA WATER SUPPLY AND SEWERAGE OPTIMIZATION PROJECT (II)
FINAL REPORT
NIPPON KOEI CO.,LTD. 2-61 NIPPON KOEI LAC CO.,LTD
Source: JICA Study Team
Figure 2.5.6-9: Water Service Problems Observed Outside the Home in Areas without SEDAPAL Service
v) Use of electric water pumps
Of the households without SEDAPAL service, 12.1% use electric water pumps to lift the water to an elevated tank.
Table 2.5-6-12: Use of Electric Pumps to Lift Water to an Elevated Tank
Response District
Total San Martín de Porres Callao Puente Piedra
Yes 0 0 4 4 (12.1%) No 11 13 5 29 (87.9%)
Total 11 13 9 33 (100%) Source: JICA Study Team
5) Existing Water Service Level
(a) With SEDAPAL Water Service
Table 2.5.6-13 shows the perception of SEDAPAL water service. In general, 49.7% qualify the service as fair, 36.9% as good, 7.5% as poor, 4.4% as very bad, and only 1.5% as very good. The users of SEDAPAL service are mainly satisfied with the service quality according to the result.
9.1
15.2
15.2
24.2
0 5 10 15 20 25 30
Demora en repararse roturas
Roturas y aniegos
Inundaciones de viviendas
Fugas de aguaWater Leakage
Inundation of Homes
Clogs and Flood
Delay of Leakage

FEASIBILITY STUDY ON NORTH LIMA METROPOLITAN AREA WATER SUPPLY AND SEWERAGE OPTIMIZATION PROJECT (II)
FINAL REPORT
NIPPON KOEI CO.,LTD. 2-62 NIPPON KOEI LAC CO.,LTD
Table 2.5.6-13: Perception of SEDAPAL Service
Source: JICA Study Team
Source: JICA Study Team
Figure 2.5.6-10: Perception of SEDAPAL Service
(b) Without SEDAPAL Service
As shown in Table 2.5.6-14, 40.2% described the quality of service as poor, 39.0% as fair, 15.9% as good, and 3.7% as very poor.
Response
District
Total (%) Los
Olivos
San Martín
de Porres
CallaoCaraba
yllo Comas 1 Comas 2
Puente Piedra
Very good 1.6 % 0.0 0.0 2.6% 1.8% 1.9% 2.0% 1.5
Good 33.3% 53.8% 68.8 28.9% 39.3% 18.9% 40.0% 36.9
Fair 52.0% 34.6% 18.8 57.9% 50.0% 58.5% 54.0% 49.7
Poor 10.6% 5.8% 0.0 5.3% 5.4% 15.1% 0.0 7.5
Very poor 2.4% 5.8% 12.5 5.3% 3.6% 5.7% 4.0% 4.4
Total frequencies 123 52 16 38 56 53 50 388
Muy bueno
1.5%
Bueno
36.9%
Regular
49.7%
Malo
7.5%
Muy malo
4.4%
Muy bueno
Bueno
Regular
Malo
Muy malo
Very Good
Good
Fair
Poor
Very Poor
Good
Fair
Poor
Very Poor Very Good
Very Good Good Fair Poor
Very Poor

FEASIBILITY STUDY ON NORTH LIMA METROPOLITAN AREA WATER SUPPLY AND SEWERAGE OPTIMIZATION PROJECT (II)
FINAL REPORT
NIPPON KOEI CO.,LTD. 2-63 NIPPON KOEI LAC CO.,LTD
Table 2.5.6-14: Perception of Water Service Supplied (Tap, Well, or Tank Truck)
Source: JICA Study Team
Source: JICA Study Team
Figure 2.5.6-11: Perception of Service Quality of Water Supplied (Tap, Well, or Tank Truck)
6) Sewerage Service Situation
(a) With SEDAPAL Service Area: Facilities and Sewerage Service Problems
i) Perception of sewerage service problems within the home
In terms of SEDAPAL´s strategy, the water and sewerage services for each household are connected at the same time. Therefore, the service areas for water supply and sewerage basically correspond. The survey results regarding problems recognized in the SEDAPAL service area show that the “presence of rodents and insects” and “foul odors in the toilet bowl or manhole” were the main problems. The population in Comas-2 had more complaints than other areas.
Response
District
Total (%) San Martín de
Porres Callao Puente Piedra
Very good 0.0% 2.9% 0.0% 1.2
Good 7.7% 26.5% 11.1% 15.9
Fair 28.2% 44.1% 66.7% 39.0
Poor 56.4% 26.5% 22.2% 40.2
Very poor 7.7% 0.0% 0.0% 3.7
Total frequencies 39 34 9 82
Muy bueno
1.2% Bueno
15.9%
Regular
39.0%
Malo
40.2%
Muy malo
3.7%
Muy bueno
Bueno
Regular
Malo
Muy malo
Good
Fair
Poor
Very Poor Very Good
Very Good GoodFair Poor
Very Poor

FEASIBILITY STUDY ON NORTH LIMA METROPOLITAN AREA WATER SUPPLY AND SEWERAGE OPTIMIZATION PROJECT (II)
FINAL REPORT
NIPPON KOEI CO.,LTD. 2-64 NIPPON KOEI LAC CO.,LTD
Table 2.5.6-15: Problems with Household Sewer Pipes in Areas with SEDAPAL Service
Source: JICA Study Team
Source: JICA Study Team
Figure 2.5.6-12: Problems with Household Sewer Pipes in Areas with SEDAPAL Service
ii) Perception of sewerage service problems outside the home
The majority of homes do not have sewerage service problems outside the home. The main sewerage problems outside the home originated from the customs of throwing trash in the manholes and stealing the lids of the manholes. In Callao, the foul odors are not only from the sewer manholes, but also from the wastes of marine species. The foul odors in the streets are also a result of the trash that the neighbors drop on the corners and vacant lots. The problems with the presence of rodents and insects, the foul odors in the streets, the clogging of manholes and flooding are not only because of the sewerage networks. According to the survey responses, the neighbors´ concealed installations and flooding in the homes are the least problematic. (See Table 2.5-6-16.)
Problems District Average
of all DistrictsLos Olivos
San Martín de Porres
Callao Carabayllo Comas 1 Comas 2 Puente Piedra
Presence of rodents or insects 36.6% 26.9% 25.0% 25.0% 28.3% 42.1% 36.0% 32.5%
Foul odors in toilet bowls and manholes
26.8% 19.2% 25.0% 10.7% 24.5% 31.6% 28.0% 23.7%
Clogs in toilet bowls and manholes
13.0% 15.4% 6.3% 5.4% 15.1% 15.8% 18.0% 13.1%
Overlows in toilet bowls and manholes
4.1 % 0.0% 0.0% 1.8% 3.8% 13.2 % 4.0 % 3.9%
0.0 5.0 10.0 15.0 20.0 25.0 30.0 35.0
Rebalses en las tazas ybuzon
Atoros en las tazas ybuzon
Malos olores en las tazasy buzon
Presencia de roedores einsectos
Presence of rodents or insects Foul odors in toilet bowls and manholes Clogs in toilet bowls and manholes Overlows in toilet bowls and manholes
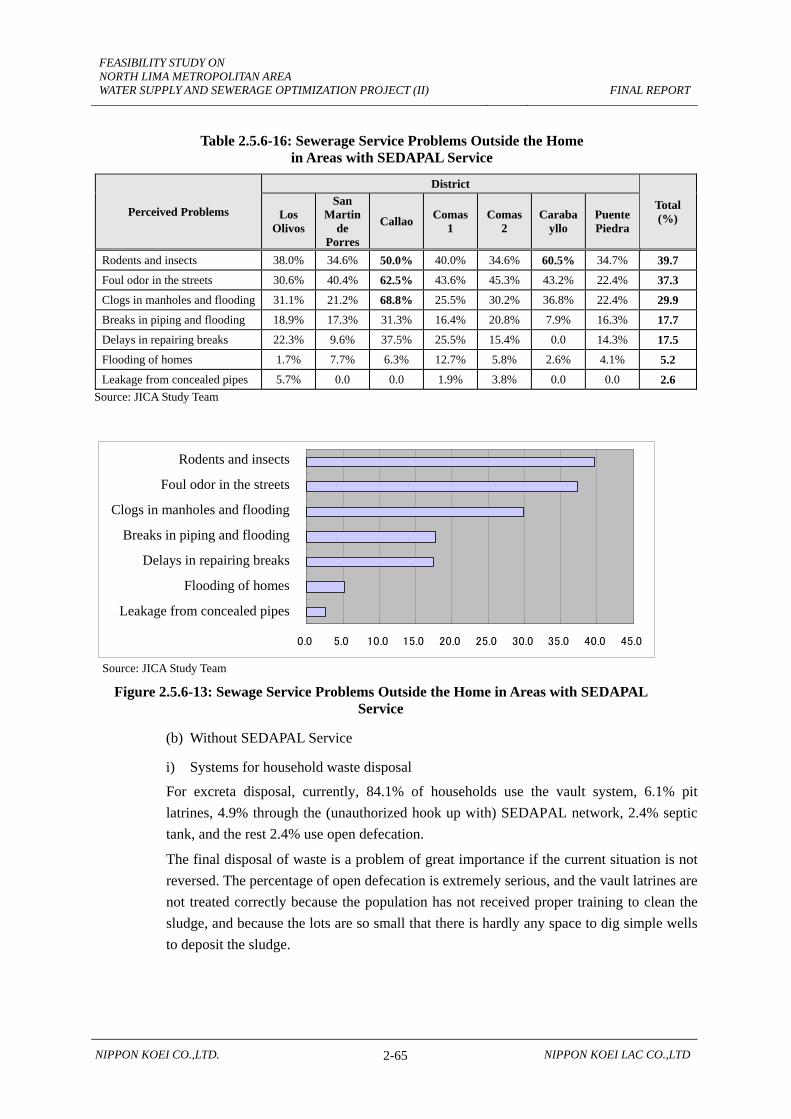
FEASIBILITY STUDY ON NORTH LIMA METROPOLITAN AREA WATER SUPPLY AND SEWERAGE OPTIMIZATION PROJECT (II)
FINAL REPORT
NIPPON KOEI CO.,LTD. 2-65 NIPPON KOEI LAC CO.,LTD
Table 2.5.6-16: Sewerage Service Problems Outside the Home in Areas with SEDAPAL Service
Perceived Problems
District
Total (%) Los
Olivos
San Martin
de Porres
Callao Comas 1
Comas 2
Carabayllo
Puente Piedra
Rodents and insects 38.0% 34.6% 50.0% 40.0% 34.6% 60.5% 34.7% 39.7 Foul odor in the streets 30.6% 40.4% 62.5% 43.6% 45.3% 43.2% 22.4% 37.3 Clogs in manholes and flooding 31.1% 21.2% 68.8% 25.5% 30.2% 36.8% 22.4% 29.9 Breaks in piping and flooding 18.9% 17.3% 31.3% 16.4% 20.8% 7.9% 16.3% 17.7 Delays in repairing breaks 22.3% 9.6% 37.5% 25.5% 15.4% 0.0 14.3% 17.5 Flooding of homes 1.7% 7.7% 6.3% 12.7% 5.8% 2.6% 4.1% 5.2 Leakage from concealed pipes 5.7% 0.0 0.0 1.9% 3.8% 0.0 0.0 2.6
Source: JICA Study Team
Source: JICA Study Team
Figure 2.5.6-13: Sewage Service Problems Outside the Home in Areas with SEDAPAL Service
(b) Without SEDAPAL Service
i) Systems for household waste disposal
For excreta disposal, currently, 84.1% of households use the vault system, 6.1% pit latrines, 4.9% through the (unauthorized hook up with) SEDAPAL network, 2.4% septic tank, and the rest 2.4% use open defecation.
The final disposal of waste is a problem of great importance if the current situation is not reversed. The percentage of open defecation is extremely serious, and the vault latrines are not treated correctly because the population has not received proper training to clean the sludge, and because the lots are so small that there is hardly any space to dig simple wells to deposit the sludge.
0.0 5.0 10.0 15.0 20.0 25.0 30.0 35.0 40.0 45.0
Intervenciones c landestinas
Inundaciones de viviendas
Demoras en repararse roturas
Roturas de tuberías y aniegos
Atoros de buzón y aniegos
Mal olor en las calles
Roedores e insectosRodents and insects
Foul odor in the streets
Clogs in manholes and flooding
Breaks in piping and flooding
Delays in repairing breaks
Flooding of homes
Leakage from concealed pipes

FEASIBILITY STUDY ON NORTH LIMA METROPOLITAN AREA WATER SUPPLY AND SEWERAGE OPTIMIZATION PROJECT (II)
FINAL REPORT
NIPPON KOEI CO.,LTD. 2-66 NIPPON KOEI LAC CO.,LTD
Source: JICA Study Team
Figure 2.5.6-14: Elimination of Excreta in Areas without SEDAPAL Service
With respect to the elimination of grey water from kitchen and bathroom, etc., 74.4% cases, these waters are disposed of in the street, 17.1% in the vault latrine, and 4.9% through the (unauthorized hook up with) SEDAPAL network. (See Figure 2.5.6-15.)
Since many neighborhoods disposed of their waste water in the streets, a proper sewerage system in these areas will improve the situation a lot. The new system will not only eliminate disposal of grey waters in the streets, but also urine and excreta.
Source: JICA Study Team
Figure 2.5.6-15: Elimination of Waste Water in Areas without SEDAPAL Service
ii) Perception of problems of waste disposal system within the home
Silo84,1%
Calle2,4%
Letrina6,1%
Pozo séptico2,4%
Red de Sedapal
4,9%
Red de Sedapal
4,9%
Calle74,4%
Silo17,1%
Otro1,2%
Letrina1,2%
Pozo séptico1,2%
SEDAPALNetwork Other
Pit latrine
Latrine
Septic tank
Street
SEDAPALNetwork
Street
Pit latrine
Latrine
Septic tank
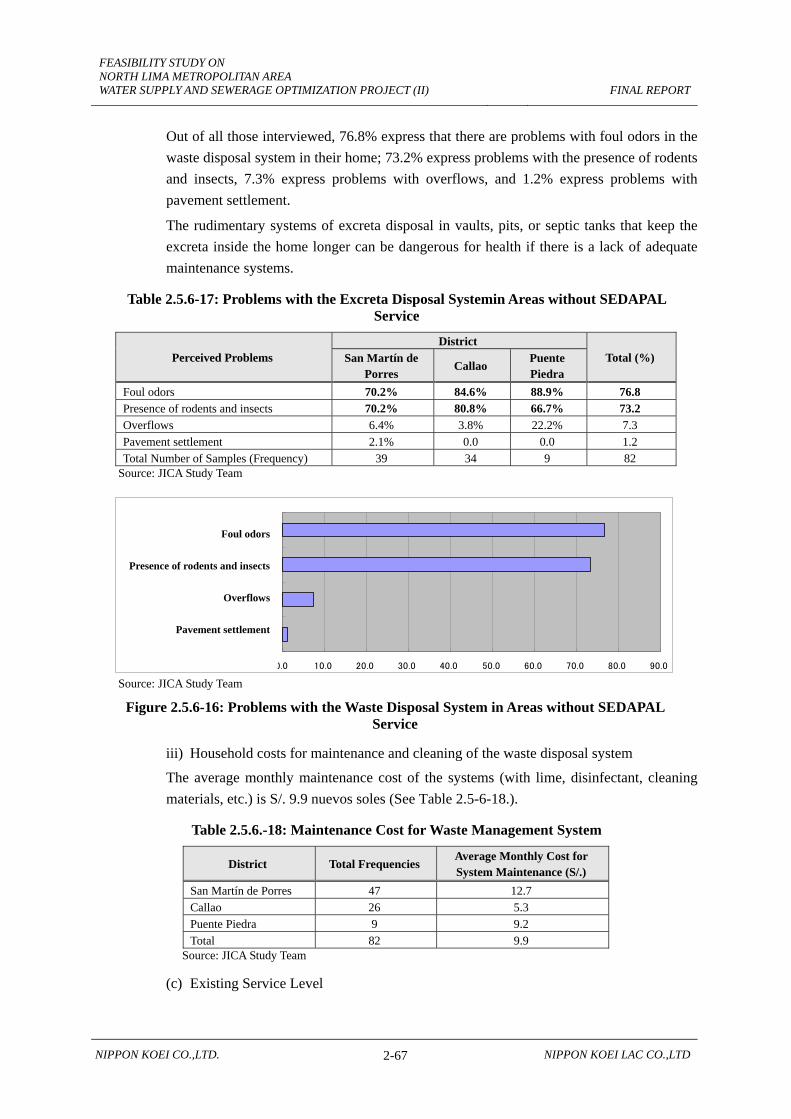
FEASIBILITY STUDY ON NORTH LIMA METROPOLITAN AREA WATER SUPPLY AND SEWERAGE OPTIMIZATION PROJECT (II)
FINAL REPORT
NIPPON KOEI CO.,LTD. 2-67 NIPPON KOEI LAC CO.,LTD
0.0 10.0 20.0 30.0 40.0 50.0 60.0 70.0 80.0 90.0
Hundimientos
Rebalses
Presenc ia de roedores einsectos
Malos o lores
Out of all those interviewed, 76.8% express that there are problems with foul odors in the waste disposal system in their home; 73.2% express problems with the presence of rodents and insects, 7.3% express problems with overflows, and 1.2% express problems with pavement settlement.
The rudimentary systems of excreta disposal in vaults, pits, or septic tanks that keep the excreta inside the home longer can be dangerous for health if there is a lack of adequate maintenance systems.
Table 2.5.6-17: Problems with the Excreta Disposal Systemin Areas without SEDAPAL Service
Perceived Problems District
Total (%) San Martín de Porres
Callao Puente Piedra
Foul odors 70.2% 84.6% 88.9% 76.8 Presence of rodents and insects 70.2% 80.8% 66.7% 73.2 Overflows 6.4% 3.8% 22.2% 7.3 Pavement settlement 2.1% 0.0 0.0 1.2 Total Number of Samples (Frequency) 39 34 9 82
Source: JICA Study Team
Source: JICA Study Team
Figure 2.5.6-16: Problems with the Waste Disposal System in Areas without SEDAPAL Service
iii) Household costs for maintenance and cleaning of the waste disposal system
The average monthly maintenance cost of the systems (with lime, disinfectant, cleaning materials, etc.) is S/. 9.9 nuevos soles (See Table 2.5-6-18.).
Table 2.5.6.-18: Maintenance Cost for Waste Management System
District Total Frequencies Average Monthly Cost for System Maintenance (S/.)
San Martín de Porres 47 12.7 Callao 26 5.3 Puente Piedra 9 9.2 Total 82 9.9
Source: JICA Study Team
(c) Existing Service Level
Foul odors
Presence of rodents and insects
Overflows
Pavement settlement

FEASIBILITY STUDY ON NORTH LIMA METROPOLITAN AREA WATER SUPPLY AND SEWERAGE OPTIMIZATION PROJECT (II)
FINAL REPORT
NIPPON KOEI CO.,LTD. 2-68 NIPPON KOEI LAC CO.,LTD
i) With SEDAPAL service
Another inconsistency among the survey responses with reference to the sewerage networks is evident in Table 2.5.6-19: more than 95% think that the service is between good and fair, and on the other hand, there were a high percentage of complaints of rodents, insects, foul odors, clogs, flooding, etc.
Table 2.5.6-19: Perception of Sewerage Service (provided by SEDAPAL)
Description
District
Total (%) Los
Olivos
San Martín
de Porres
Callao Carabay
llo Comas 1 Comas 2
Puente Piedra
Very good 3.3% 3.8% 0 0 1.8% 0 0 1.8 Good 60.2% 69.2% 75.0% 63.2% 76.4% 49.1% 72.9% 64.7
Fair 32.5% 25.0% 18.8% 34.2% 18.2% 49.1% 20.8% 29.9
Poor 4.1% 1.9% 6.3% 0 3.6% 1.9% 6.3% 3.4
Very por 0 0 0 2.6% 0 0 0 0.3
Total frequency 123 52 16 38 55 53 48 385
Source: JICA Study Team
Source: JICA Study Team
Figure 2.5.6-17: Perception of Sewerage Service Provided by SEDAPAL
ii) Without SEDAPAL service
Among the respondents, 46.3% rate the sewerage system as poor, 32.9% rate it as fair, 13.4% rate it as good, and 7.3% rate it as very poor. There is limited knowledge about the change in lifestyle that can result from the use of a toilet connected to the sewerage system; this knowledge should be more widely circulated. When a high percentage gives a “fair” rating to the use of vault latrine or septic tank, it is evident that they are clearly unfamiliar with the significance of the sewerage networks. (See Table 2.5.6-20.)
Bueno64,7%
Regular29,9%
Mal3,4%
Muy bueno1,8%
Muy mal0,3%
Fair
Poor
Very Poor Very Good
Good

FEASIBILITY STUDY ON NORTH LIMA METROPOLITAN AREA WATER SUPPLY AND SEWERAGE OPTIMIZATION PROJECT (II)
FINAL REPORT
NIPPON KOEI CO.,LTD. 2-69 NIPPON KOEI LAC CO.,LTD
Table 2.5.6-20: Perception of Sewerage System provided by SEDAPAL
Source: JICA Study Team
Source: JICA Study Team
Figure 2.5.6-18: General Perception of Sewerage System provided by SEDAPAL
7) Tariff and Service Payments
(a) Water and Sewerage and/or Sanitation Service Costs
Table 2.5.6-7 shows the average monthly costs incurred by users of SEDAPAL water and sewerage services, which is a payment of S/. 42.9. Table 2.5.6-11 and Table 2.5.6-18 indicate that the users without SEDAPAL services pay a monthly total of S/. 44.10 for water and S/. 9.9 for sanitation maintenance. It can be observed that the families that do not have water and sewerage service on the SEDAPAL network incur a greater cost.
(b) Perception of Payment for Water and Sewerage (and/or Sanitation) Services
i) With SEDAPAL service
Regarding the total payment for water and sewerage services paid by the families, half of the users have the opinion that it is high, and the other half think it as reasonable.
Description District
Total (%) San Martín de Porres
Callao Puente Piedra
Very good 0.0 0.0 0.0 0.0 Good 7.7% 14.7% 33.3% 13.4 Fair 12.8% 47.1% 66.7% 32.9 Poor 69.2% 32.4% 0.0 46.3 Very por 10.3% 5.9% 0.0 7.3 Total frequencies 39 34 9 82
Good
Fair
Bueno13,4%
Regular32,9%
Malo46,3%
Muy mal7,3%
Poor
Very Poor

FEASIBILITY STUDY ON NORTH LIMA METROPOLITAN AREA WATER SUPPLY AND SEWERAGE OPTIMIZATION PROJECT (II)
FINAL REPORT
NIPPON KOEI CO.,LTD. 2-70 NIPPON KOEI LAC CO.,LTD
Source: JICA Study Team
Figure 2.5.6-19: Opinion about Payment for Water and Sewerage Service
ii) Without SEDAPAL service
In general, 45.5% think that the amount paid for existing water services is high, 27.3% express that it is very high, and another 27.3% think that it is normal. There is not much difference in this tendency among the sectors.
Source: JICA Study Team
Figure 2.5.6-20: General Opinion about the Amount Paid for Existing Water Service
8) Payment Affordability
The total incomes and expenditures in a household and the average payment for water and sewerage services are summarized below. On average, the monthly payment for sanitation services represents 2.08% of the household income with SEDAPAL service, and 3.53% for households without SEDAPAL service. Generally, the maximum percentage of this
Muy alto
25.8%
Alto
24.7%
Regular
48.7%
Bajo
0.8%
Muy bajo
0.0%
Muy alto
Alto
Regular
Bajo
Muy bajo
Muy alto
27.3%
Alto
45.5%
Regular
27.3%
Bajo
0.0%
Muy bajo
0.0%
Muy alto
Alto
Regular
Bajo
Muy bajo
Very high
High
Fair Low
Very Low
Very high
High
Fair
Low
Very Low
Very high High
Fair
Low Very Low
Very high
High
Fair Low
Very Low

FEASIBILITY STUDY ON NORTH LIMA METROPOLITAN AREA WATER SUPPLY AND SEWERAGE OPTIMIZATION PROJECT (II)
FINAL REPORT
NIPPON KOEI CO.,LTD. 2-71 NIPPON KOEI LAC CO.,LTD
indicator is 5.0%, according to the recommendations by the World Bank and other international organizations. See Table 2.5.6-21 and Table 2.5.6-22.
Table 2.5.6-21: Payment Affordability in SEDAPAL Service Area
District SectorAverage Monthly Income
Average Monthly
Expenditures
Monthly Water /
sewerage Payment
Payment / Income
Payment / Expenditu
res
Los Olivos 83 3,826 1,523 70.9 1.85% 4.66% 84 2,083 1,409 46.6 2.24% 3.31% 85 2,238 1,471 46.3 2.07% 3.15%
San Martín de Porres
212 1,988 1,225 43.0 2.16% 3.51% 213 1,734 1,086 39.1 2.25% 3.60%
Callao 259 1,731 1,370 30.1 1.74% 2.20%
Comas 1 345 1,650 1,186 30.7 1.86% 2.59% 346 1,410 930 45.1 3.20% 4.85% 347 1,709 1,231 53.2 3.11% 4.32%
Comas 2 348 1,817 1,147 39.6 2.18% 3.45% 349 1,886 1,134 29.7 1.57% 2.62%
Carabayllo 350 1,887 1,351 44.5 2.36% 3.29% 351 1,795 972 34.4 1.92% 3.54%
Puente Piedra 368 1,684 1,219 27.4 1.63% 2.25% 369 1,659 1,257 27.1 1.63% 2.16%
Total Average 2,058 1,275 42.9 2.08% 3.36%
Source: JICA Study Team
Table 2.5.6-22: Payment Affordability in Area without SEDAPAL Service
District Sector Average Income
Average Expenditu
res
Monthly Water
Payment
Monthly Sanitation Payment
Payment / Income
Payment / Expenditur
es
San Martin de Porres
251 2721 1651 61.9 9.3 2.62% 4.31% 252 1530 1024 74.6 12.1 5.67% 8.47% 253 1883 1027 63.1 9.7 3.87% 7.09% 254 1108 962 47.9 28.5 6.90% 7.94% 255 2125 954 53.5 7.5 2.87% 6.39%
Callao
256 1097 744 25.8 7.4 3.03% 4.46% 257 995 585 18.8 4.6 2.35% 4.00% 258 850 582 29.3 2.0 3.68% 5.38% 261 1475 805 61.3 3.3 4.38% 8.02% 262 1615 987 27.5 5.0 2.01% 3.29% 263 1225 1248 78.8 0.0 6.43% 6.31%
Puente Piedra 361 1400 1115 0.0 9.6 0.69% 0.86% 370 1138 1030 7.0 8.8 1.39% 1.53%
Total 1534 1019 44.1 10.0 3.53% 5.31% Source: JICA Study Team
9) Willingness to Pay (WTP)
(a) With SEDAPAL Service

FEASIBILITY STUDY ON NORTH LIMA METROPOLITAN AREA WATER SUPPLY AND SEWERAGE OPTIMIZATION PROJECT (II)
FINAL REPORT
NIPPON KOEI CO.,LTD. 2-72 NIPPON KOEI LAC CO.,LTD
i) Willingness to pay for better water and sewerage service
For the analysis of the maximum willingness to pay, the Contingent Valuation methodology is one of the methods available to measure the benefits and costs related to the policies that affect the stock or characteristics of the public service or the environment.
It is a direct, non-market method. This means that it is not based on market information, but rather on a hypothetical market for the public service or for the environment. Parameters for this market are defined, and individuals are asked for their willingness to pay for a change in the characteristics of the water and sewerage services. Among these advantages, it stands out that this method involves an exact measurement in the change in well-being anticipated, and it does not depend on the order of the changes in the attributes when there are multiple changes.
The application of this method is based on the following assumptions: the individual interviewed is involved in the effect of Project execution on improving water and sewerage service, and therefore, given their available income, will maximize its utility; the behavior of the individual in the hypothetical market is equivalent to their behavior in the real market; the individual has complete information about the benefits that an efficient water and sewerage service will generate for him or her.
The double entry method of dichotomous election (that is, asking the questions of two alternative answers for 2 times) of contingent valuation is applied in the investigation. The procedure was processed in the following way: at first, price of additional payments at the current rate was shown to the individual interviewed, and they were asked if they could accept or not. Then, it was indicated whether or not they would accept the second price. The second, higher price becomes the first rate if the people respond “Yes” to the first question, and it becomes less if they respond “No” to the first question. The result of the entire questionnaire is summarized and evaluated through the prediction of how it approaches an average number. Five (5) payment prices were formulated, as shown in the Table 2.5.6-23 and Table 2.5.6-24, and the used questionnaire is chosen randomly before doing interview, so that the result has less bias of indicated number influence.
The Logit-linear model (which is a generalized linear model used for binomial regression for the prediction of probability), was used in order to process the information regarding willingness to pay (WTP), and the results are shown in the Tables corresponding to each case (with and without SEDAPAL water and sewerage service).
Substantial differences can be observed in the maximum willingness to pay according to the type of access to water service. In that sense, there is an inverse relationship between having water and sewerage and the maximum willingness to pay for the project; in other words, those that have continuous water and sewerage service through the SEDAPAL network (24 hour continuity) are the ones who are willing to pay less for the improvement and optimization of the water and sewerage service; on the other hand, the households that do not have continuous service (that is service with interruptions) are willing to pay more
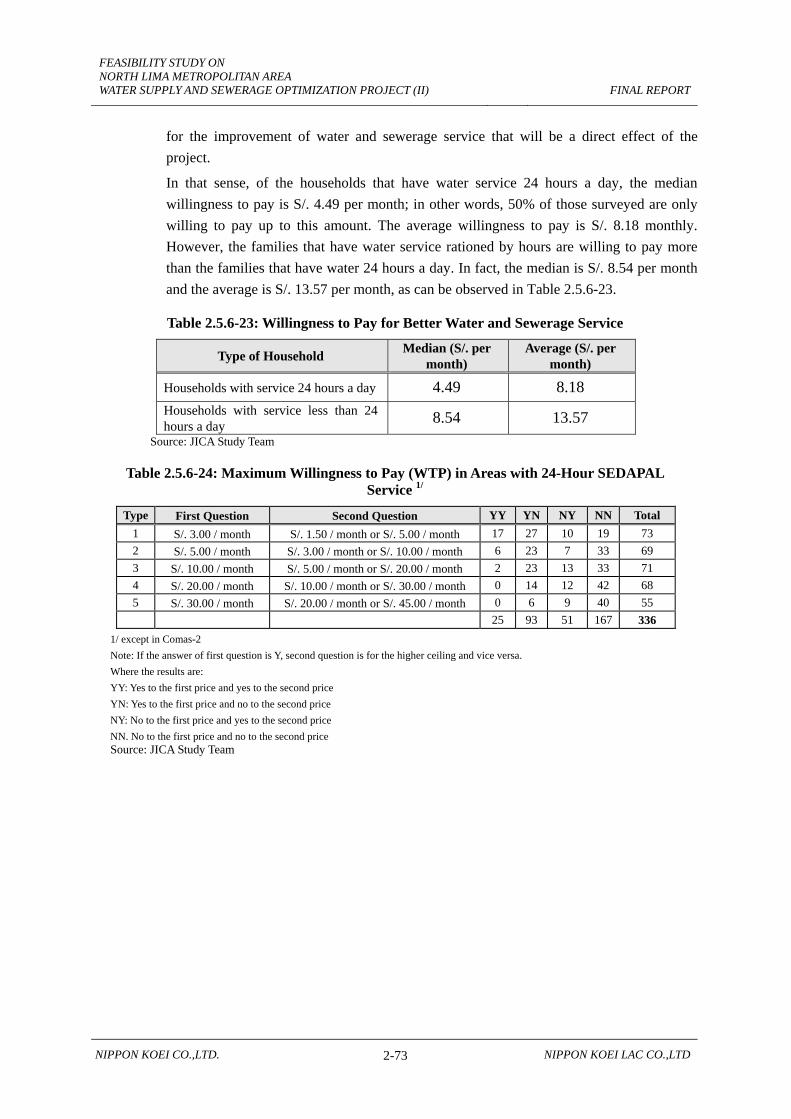
FEASIBILITY STUDY ON NORTH LIMA METROPOLITAN AREA WATER SUPPLY AND SEWERAGE OPTIMIZATION PROJECT (II)
FINAL REPORT
NIPPON KOEI CO.,LTD. 2-73 NIPPON KOEI LAC CO.,LTD
for the improvement of water and sewerage service that will be a direct effect of the project.
In that sense, of the households that have water service 24 hours a day, the median willingness to pay is S/. 4.49 per month; in other words, 50% of those surveyed are only willing to pay up to this amount. The average willingness to pay is S/. 8.18 monthly. However, the families that have water service rationed by hours are willing to pay more than the families that have water 24 hours a day. In fact, the median is S/. 8.54 per month and the average is S/. 13.57 per month, as can be observed in Table 2.5.6-23.
Table 2.5.6-23: Willingness to Pay for Better Water and Sewerage Service
Type of Household Median (S/. per month)
Average (S/. per month)
Households with service 24 hours a day 4.49 8.18 Households with service less than 24 hours a day 8.54 13.57
Source: JICA Study Team
Table 2.5.6-24: Maximum Willingness to Pay (WTP) in Areas with 24-Hour SEDAPAL Service 1/
Type First Question Second Question YY YN NY NN Total 1 S/. 3.00 / month S/. 1.50 / month or S/. 5.00 / month 17 27 10 19 73 2 S/. 5.00 / month S/. 3.00 / month or S/. 10.00 / month 6 23 7 33 69 3 S/. 10.00 / month S/. 5.00 / month or S/. 20.00 / month 2 23 13 33 71 4 S/. 20.00 / month S/. 10.00 / month or S/. 30.00 / month 0 14 12 42 68 5 S/. 30.00 / month S/. 20.00 / month or S/. 45.00 / month 0 6 9 40 55 25 93 51 167 336
1/ except in Comas-2 Note: If the answer of first question is Y, second question is for the higher ceiling and vice versa. Where the results are: YY: Yes to the first price and yes to the second price YN: Yes to the first price and no to the second price NY: No to the first price and yes to the second price NN. No to the first price and no to the second price Source: JICA Study Team

FEASIBILITY STUDY ON NORTH LIMA METROPOLITAN AREA WATER SUPPLY AND SEWERAGE OPTIMIZATION PROJECT (II)
FINAL REPORT
NIPPON KOEI CO.,LTD. 2-74 NIPPON KOEI LAC CO.,LTD
Source: JICA Study Team
Figure 2.5.6-21: Accumulation of Additional WTP for Better Service
Table 2.5.6-25: Result of WTP Questions in Areas with Less than 24 Hour Service (Comas-2)
Type First Question Second Question YY YN NY NN Total 1 S/. 3.00 / month S/. 1.50 / month or S/. 5.00 / month 4 4 1 4 13 2 S/. 5.00 / month S/. 3.00 / month or S/. 10.00 / month 3 6 0 2 11 3 S/. 10.00 / month S/. 5.00 / month or S/. 20.00 / month 1 6 2 2 11 4 S/. 20.00 / month S/. 10.00 / month or S/. 30.00 / month 1 6 1 3 11 5 S/. 30.00 / month S/. 20.00 / month or S/. 45.00 / month 0 1 2 4 7 9 23 6 15 53
Source: JICA Study Team
Source: JICA Study Team
Figure 2.5.6-22: Accumulation of Additional WTP for Better Service (Comas 2)
The results for greatest willingness to pay (WTP) shall be utilized for the Project´s economic evaluation.
(b) Without SEDAPAL Service
i) Willingness to pay for SEDAPAL water and sewerage service
0
0.2
0.4
0.6
0.8
1
0 10 20 30 40 50
Taza de "Yes"Average: S/. 8.18 soles/month
0
0.2
0.4
0.6
0.8
1
0 10 20 30 40 50
Taza de "Yes" Average: S/. 13.57 soles/month
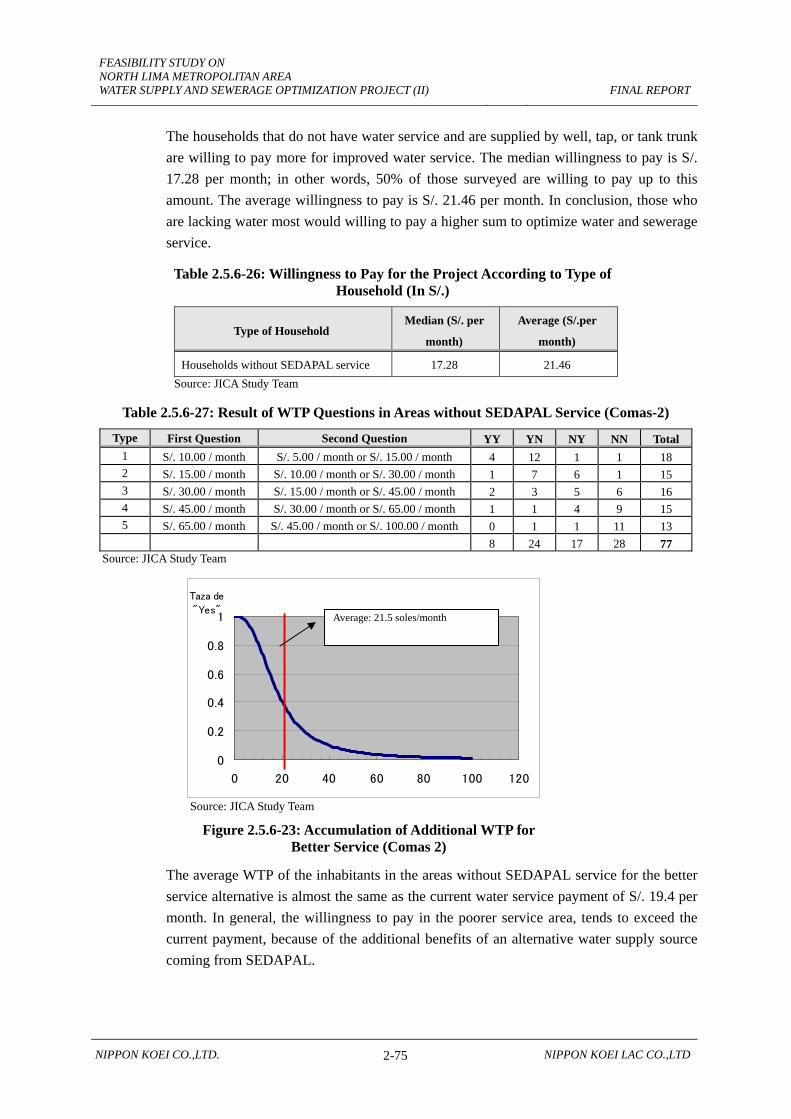
FEASIBILITY STUDY ON NORTH LIMA METROPOLITAN AREA WATER SUPPLY AND SEWERAGE OPTIMIZATION PROJECT (II)
FINAL REPORT
NIPPON KOEI CO.,LTD. 2-75 NIPPON KOEI LAC CO.,LTD
The households that do not have water service and are supplied by well, tap, or tank trunk are willing to pay more for improved water service. The median willingness to pay is S/. 17.28 per month; in other words, 50% of those surveyed are willing to pay up to this amount. The average willingness to pay is S/. 21.46 per month. In conclusion, those who are lacking water most would willing to pay a higher sum to optimize water and sewerage service.
Table 2.5.6-26: Willingness to Pay for the Project According to Type of Household (In S/.)
Type of Household Median (S/. per
month)
Average (S/.per
month)
Households without SEDAPAL service 17.28 21.46 Source: JICA Study Team
Table 2.5.6-27: Result of WTP Questions in Areas without SEDAPAL Service (Comas-2)
Type First Question Second Question YY YN NY NN Total 1 S/. 10.00 / month S/. 5.00 / month or S/. 15.00 / month 4 12 1 1 18 2 S/. 15.00 / month S/. 10.00 / month or S/. 30.00 / month 1 7 6 1 15 3 S/. 30.00 / month S/. 15.00 / month or S/. 45.00 / month 2 3 5 6 16 4 S/. 45.00 / month S/. 30.00 / month or S/. 65.00 / month 1 1 4 9 15 5 S/. 65.00 / month S/. 45.00 / month or S/. 100.00 / month 0 1 1 11 13 8 24 17 28 77
Source: JICA Study Team
Source: JICA Study Team
Figure 2.5.6-23: Accumulation of Additional WTP for Better Service (Comas 2)
The average WTP of the inhabitants in the areas without SEDAPAL service for the better service alternative is almost the same as the current water service payment of S/. 19.4 per month. In general, the willingness to pay in the poorer service area, tends to exceed the current payment, because of the additional benefits of an alternative water supply source coming from SEDAPAL.
0
0.2
0.4
0.6
0.8
1
0 20 40 60 80 100 120
Taza de
"Yes"Average: 21.5 soles/month

FEASIBILITY STUDY ON NORTH LIMA METROPOLITAN AREA WATER SUPPLY AND SEWERAGE OPTIMIZATION PROJECT (II)
FINAL REPORT
NIPPON KOEI CO.,LTD. 2-76 NIPPON KOEI LAC CO.,LTD
The reason for which the WTP is not higher could be that the inhabitants´ lack of understanding or ability to imagine the situation with better service. In reality, the number of samples in the zone without SEDAPAL service is limited to 82 samples. It is proposed to study with more depth and a greater sample size, if SEDAPAL would like to investigate the most accurate WTP value.

FEASIBILITY STUDY ON NORTH LIMA METROPOLITAN AREA WATER SUPPLY AND SEWERAGE OPTIMIZATION PROJECT (II)
FINAL REPORT
NIPPON KOEI CO.,LTD. 2-77 NIPPON KOEI LAC CO.,LTD
2.5.7 Topographic and Geotechnical Characteristics
(1) Topographic Characteristics
1) Background
The main objective of topographic survey is to investigate location, elevation and slope in and around a proposed or planned construction site. In this Study, it is included that the topographic survey should be carried out for any new construction.
2) Location
The Study area is located between UTM coordinates 274,930.482 and 8,685,434.462 in the north; 267,601.314 and 8,673,667.189 in the south; 282,805.503 and 8,682,343.127 in the east; and 266,216.240 and 8,683,112.935 in the west. The highest elevation is registered in the Collique area in the district of Comas at 550 m.a.s.l. The spurs of the Andes Mountain Range´s western branch start near the Study area’s eastern limit. The Chillón River and the Lurín River valleys limit the study area’s extension to the north and south, respectively. The distance between both the river mouths, along the Coast, is about 65 Km. The western boundary of the Study area is the Pacific Ocean.
3) Topography
The described area covers a predominantly flat area with a slight gradient at an average 4 – 5 % in a NE-SW direction. The Rímac River crosses the area’s urban settings, following an east-west direction, and discharges to the north of the Callao port. The Rímac River valley makes up the major access to connect the metropolitan area to the central Andean region of Peru.
4) Field Work
For the new pipe construction proposed in the Study, a topographic survey is carried out for route survey as well as transverse profiles at every 20 m. In addition, elevation bench marks are measured for other infrastructures like reservoirs, pumping stations, etc. Details can be found in Appendix A1.
5) Validation of SEDAPAL Topographic Data
In order to contrast topographic elevations with the data managed by SEDAPAL’s mappings, samples were taken from 12 of the field work points. Average topographic elevation mismatch is 0.64 m, ranging from a maximum of 2.82 m to a minimum of 0.15m. Biggest mismatches were found in the hill areas.
In that sense, it is deemed that the same mismatches will be found in the areas where no topographic survey was made.

FEASIBILITY STUDY ON NORTH LIMA METROPOLITAN AREA WATER SUPPLY AND SEWERAGE OPTIMIZATION PROJECT (II)
FINAL REPORT
NIPPON KOEI CO.,LTD. 2-78 NIPPON KOEI LAC CO.,LTD
Table 2.5.7-1: Validation of SEDAPAL Data Differences between elevation of SEDAPAL data and topographic survey
Section Points Coordinates Elevation East North SEDAPAL Field Difference
1 1 274,084.436 8,677,541.998 80 77.69 2.32 2 274,235.737 8,677,286.941 77.5 77.29 0.21
2 3 274,580.613 8,676,807.824 75 74.73 0.27 4 274,390.152 8,676,567.701 72.5 73.43 -0.93 5 274,602.520 8,676,014.247 67.5 69.03 -1.53
3 6 274,676.253 8,675,098.591 62.5 62.65 -0.15 7 274,328.342 8,674,745.646 57.5 58.45 -0.95
4 8 273,425.350 8,674,459.793 47.5 49.29 -1.79 9 273,408.774 8,674,145.320 42.5 44.56 -2.06
5 10 273,803.457 8,676,602.232 70 70.16 -0.16 11 273,289.489 8,676,799.118 70 69.79 0.21
6 12 273,670.950 8,676,398.349 65 67.31 -2.31 13 273,196.017 8,675,811.341 85 85.40 -0.40
7 14 273,641.162 8,675,863.514 60 61.69 -1.69 15 273,669.629 8,675,074.771 52.5 54.38 -1.88 16 274,028.799 8,675,334.515 57.5 59.02 -1.52
8 17 272,644.118 8,674,941.213 45 46.82 -1.82 18 272,191.584 8,673,834.571 35 36.63 -1.63 19 272,614.601 8,674,556.299 42.5 45.32 -2.82
9 20 273,211.372 8,677,425.833 75 74.49 0.51 21 273,932.072 8,677,624.915 80 79.80 0.20
10 22 273,152.768 8,678,579.283 80 79.05 0.95 23 273,747.124 8,678,870.482 90 89.02 0.98
11 24 280,642.176 8,682,206.693 320 321.22 -1.22 25 281,390.671 8,682,456.425 388 390.45 -2.45
12 26 279,452.723 8,681,870.164 238 235.10 2.90 Average Value of Comparison -0.64
Source: JICA Study Team
(2) Geotechnical Characteristics
The JICA Study Team conducted a soil and geotechnical survey to understand the general soil condition of the Study area. Details can be found in Appendix A2. A brief explanation is given below.
1) Diagnosis
Basically the Study area is an undulating area. The Chillón River flows through the Study area, dividing the districts of Puente Piedra and Los Olivos. An old alluvial fan can also be found forming the river bed, just before the river flows into the Pacific Ocean.
The study area is covered mainly by deposits of old fluvial-alluvial, as well as recent fluvial alluvial of Quaternary age. Intrusive rocks can also be found in some specific areas. Thus, most of the water and sewerage pipes are expected to be placed in the old alluvial deposits. Within the top layer of the soil, up to 1.5m to 3.0m deep, the soil consists of sandy silt, sandy loam, silty clay and / or clay. This layer is followed by a loose to medium compacted layer of sandy-gravel of various gradations, mixed with rounded and partially rounded pebbles of maximum diameter of 0.50m. The water level in the subsoil is generally found at lower than 10m of depth.

FEASIBILITY STUDY ON NORTH LIMA METROPOLITAN AREA WATER SUPPLY AND SEWERAGE OPTIMIZATION PROJECT (II)
FINAL REPORT
NIPPON KOEI CO.,LTD. 2-79 NIPPON KOEI LAC CO.,LTD
This configuration corresponds to a typical calm water alluvial deposit formed by horizontal and sub-horizontal strata of sand, silt, clay and lean and loose sandy-gravels. Fine materials are always found on top and the coarse ones deeper. It is necessary to point out that in these areas there are deposits of anthropogenic origin due to the explosive urban growth of the Northern Lima during the last two decades.
Since most of the populated areas within the Study area are located far from the main river channel of Chillón, flooding, bed erosion, marginal erosion, etc. are less likely to affect the construction activities of the Project.
In some isolated areas, such as Collique, Nueva Patria Reservoir area and Olives Pro R-1 Reservoir area in Los Olives District, and Márquez R-522 Reservoir area in Ventanilla District, any future construction works should preferably be placed over an outcrop of Diorite type intrusive rocks originating in the Super Drive Santa Rosa or Patapo (Gabrodiorita). It is possible to find such rocks only in small, isolated areas, in a highly fractured and altered form, between 0.10m and 0.50m of depth.
As the geological profile of the Study area is basically rigid soil consisting of sandy gravel, it is estimated that the values of the shear wave speed is between 750m/s to 1000m/s, and the periods of natural soil vibration are less than 0.40 seconds. It is also estimated that there is a slight possibility of local seismic amplification effects, and its value is estimated to be between 1.00 and 1.15 times the rock acceleration.
It is estimated that the depth of the sandy-gravel alluvial of medium to high compactness reaches more than 20.0m. The seismic response of the soil is governed by the characteristics of this deposit.
It is recommended that the water and sewer pipes should be placed around 3.0 m deep over silty clay, silt, sand, or sandy-silt. If the required depth is greater, the pipes should be placed over slightly wet sandy gravels, but without the presence of water level. When the soil compactness is between loose and medium and bearing capacity is between 1.00 Kg/cm2 and 2.00 Kg/cm2, it is easily excavated by manual or mechanical means; however, this type of soil shows instability of the vertical surface for excavations more than 2.50 m.
In many cases, the soils excavated for the installation of pipes, cannot be re-used to refill the trenches, due to some physical and mechanical characteristics. For example, some soil shows varied levels of chemical aggression towards concrete and ductile iron. In such cases, borrowed filling materials are required. A clear example of this phenomenon can be found near the Reservoir RP-2 Cerro Oquendo up to Reservoir R-522 Márquez in Ventanilla, where borrowed filling material has to be used for the filling of the trenches. Depending on the chemically aggressive soil property, enhanced protection is required for ductile iron pipe, like Type V cement and PE covering. There is a risk of this chemical attack in approximately 60% (estimated value) of the Study area.
2) Conclusions

FEASIBILITY STUDY ON NORTH LIMA METROPOLITAN AREA WATER SUPPLY AND SEWERAGE OPTIMIZATION PROJECT (II)
FINAL REPORT
NIPPON KOEI CO.,LTD. 2-80 NIPPON KOEI LAC CO.,LTD
Based on the assessment of soil characteristics, the following are the conclusions that should be taken into consideration during planning and designing future construction activities in the Project.
a) Ninety-five percent of the materials to be excavated for the trenches are expected to be dry and loose material like clays, silts and gravels. They are generally easy to excavate, either by manual or mechanical procedures. Difficulties are expected only in some isolated sectors due to the presence of altered and deeply fractured rock.
b) Excavation of the trenches may be carried out without any lateral support up to a depth of 2.50m. Support measures should be taken for deeper trenches, like dampening the vertical surface, plastering the vertical surface with cement-sand mortar, or others specific to the needs.
c) The foundation soil for pipe support is not expected to suffer any serious problems due to the presence of the high water table, loose soils, or soils of very low bearing capacity. Hence it requires no other treatment of the foundation prior to mechanical compaction, with the exception of those cases where material is anthropogenic and/or all the material up to the depth of influence will have to be removed.
d) In the preliminary design, it is recommended to use a load capacity of 1.00 Kg/cm2 for fine soils with foundations at a minimal depth of 1.50m, and a value of 2.00 Kg/cm2 in case of the sandy gravel soils (Reference values).
e) It is estimated that fifty percent of the excavated materials can be reused for backfill. Soils with low resistivity, high salt and sulfate content, high plasticity, high organic material content, or high waste material content cannot be used as backfill material, and suitable backfill material should be arranged from elsewhere.
f) It is estimated that 60% of the soil within the Study area has a strong presence of chemicals aggressive to the foundation soil and to the concrete and ductile iron pipes. In such cases, it is required to use Type V Cement and /or PE protection. In the case of the PVC pipes, no protection is required, because it is an inert material to chemical aggression.
g) During the water and sewer pipe replacement works, if the current backfill materials are considered to be inappropriate, new suitable material should be used as backfill.
h) Minimum coverage should be 1.2m and backfill should be properly compacted.
FEASIBILITY STUDY ON NORTH LIMA METROPOLITAN AREA WATER SUPPLY AND SEWERAGE OPTIMIZATION PROJECT (II)
FINAL REPORT
NIPPON KOEI CO.,LTD. 2-81 NIPPON KOEI LAC CO.,LTD
2.5.8 Diagnosis of Existing Infrastructure – Water Supply
(1) Restructuring of “Sector” and Setting of Sub-sector
“Sector” is the current operational unit of existing water supply system of SEDAPAL. From the initial assessment, it is found that some of the sectors have a large number of connections which is not suitable for effective sectorization, NRW management and system optimization. In the Study, thus, some of the current sectors are proposed to be divided into two or three sectors. Moreover, each sector is also divided into a number of sub-sectors, which in principle have their own reservoirs, and inflow volume and pressure measurement, to be operated independently as smallest operational units. The concepts of restructuring “sectors” and setting of sub-sectors are explained in Sections 3.4.2 and 3.4.3.
In this section of diagnosis of the existing infrastructure, a “sector” signifies the proposed restructured one in principle, and the current sector is expressed as “original sector”. The following table presents correspondence of original sectors, proposed sectors and proposed sub sectors. Number of proposed sectors is 41, which corresponds to 32 original sectors. Number of proposed sub-sectors is 63.

FEASIBILITY STUDY ON NORTH LIMA METROPOLITAN AREA WATER SUPPLY AND SEWERAGE OPTIMIZATION PROJECT (II)
FINAL REPORT
NIPPON KOEI CO.,LTD. 2-82 NIPPON KOEI LAC CO.,LTD
Table 2.5.8-1: Correspondence of Proposed Sectors and Sub-sectors with Original Sectors in the study area
83 A 83A-1, 83A-283 B 83B-1, 83B-284 A 84A-1, 84A-284 B 84B-1, 84B-285 A 85 A85 B 85B-1, 85B-2, 85B-385 C 85 C
212 A 212A-1, 212A-2212 B 212B-1, 212B-2
213 213 213-1, 213-2, 213-3251 251 251252 252 252253 253 253254 254 254255 255 255256 256 256257 257 257258 258 258259 259 259260 260 260261 261 261262 262 262263 263 263264 264 264265 265 265266 266 266345 345 345346 346 346-1, 346-2347 347 347-1, 347-2
348 A 348 A348 B 348B-1, 348B-2349 A 349A-1, 349A-2, 349A-3349 B 349B-1, 349B-2, 349B-3, 349B-4
350 350 350-1, 350-2351 351 351-1, 351-2, 351-3361 361 361
368 A 368A-1, 368A-2368 B 368 B369 A 369 A369 B 369 B
370 370 370Number 32 41 63
369
Sector
Carabayllo
Puente Piedra
348
District
83
84
85
212
368
S.M. de Porres
Callao
Ventanilla
Comas
349
Los Olivos
Original Sector Sub-sector
Source: JICA Study Team
(2) Water Supply System
1) General Description of Current Water Supply System
SEDAPAL has two water treatment plants, which are the La Atarjea Water Treatment Plant (La Atarjea WTP) and the Chillón Water Treatment Plant (Chillón WTP).
At present, the area with existing network within the Study Area is receiving water supply from the two WTPs mentioned above and also from wells. Water distribution system from La Atarjea WTP is mainly supplying water to center and southern part of the Study area, which includes the districts of Callao, Los Olivos and San Martín de Porres. The water distribution system from Chillón WTP, on the other hand, is mainly supplying water to the northern part of the Study area, which includes the districts of Comas, Carabayllo and Puente Piedra.
In addition, the two distribution networks are connected with each other so that they can compensate the other’s production when it is not enough.
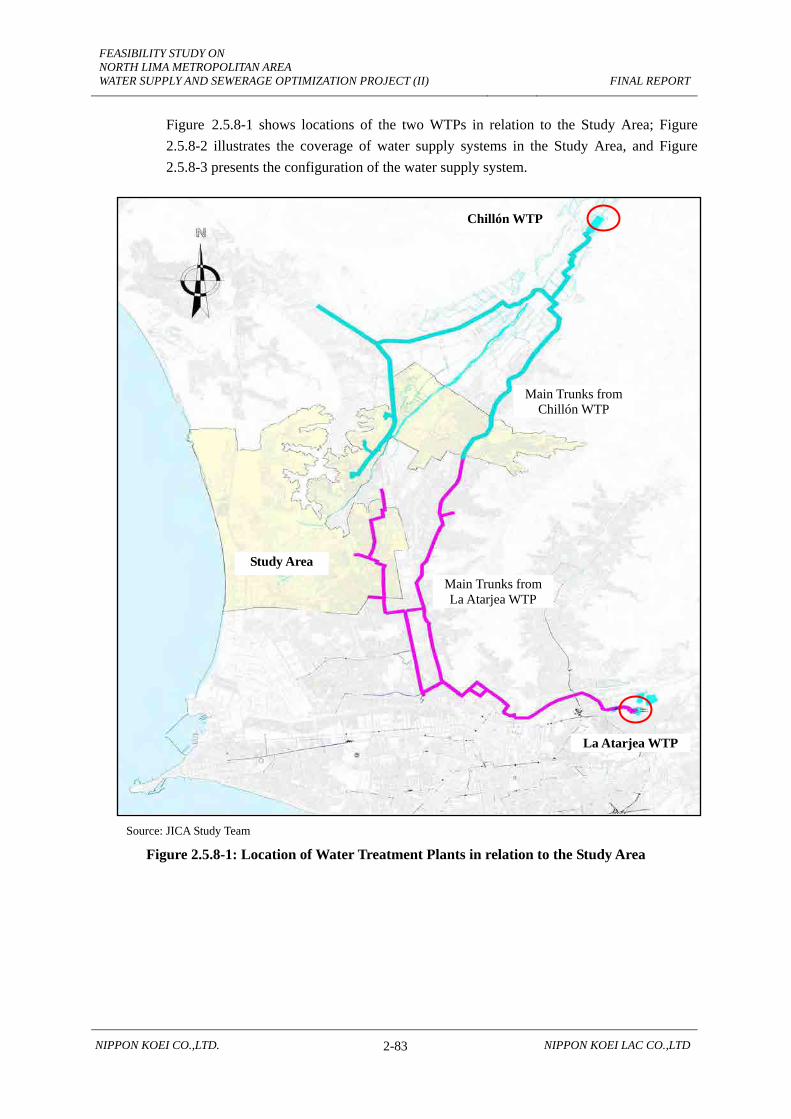
FEASIBILITY STUDY ON NORTH LIMA METROPOLITAN AREA WATER SUPPLY AND SEWERAGE OPTIMIZATION PROJECT (II)
FINAL REPORT
NIPPON KOEI CO.,LTD. 2-83 NIPPON KOEI LAC CO.,LTD
Figure 2.5.8-1 shows locations of the two WTPs in relation to the Study Area; Figure 2.5.8-2 illustrates the coverage of water supply systems in the Study Area, and Figure 2.5.8-3 presents the configuration of the water supply system.
Source: JICA Study Team
Figure 2.5.8-1: Location of Water Treatment Plants in relation to the Study Area
Chillón WTP
La Atarjea WTP
Study Area
Main Trunks from La Atarjea WTP
Main Trunks from Chillón WTP

FEASIBILITY STUDY ON NORTH LIMA METROPOLITAN AREA WATER SUPPLY AND SEWERAGE OPTIMIZATION PROJECT (II)
FINAL REPORT
NIPPON KOEI CO.,LTD. 2-84 NIPPON KOEI LAC CO.,LTD
Source: JICA Study Team
Figure 2.5.8-2: Water Supply System in the Study Area
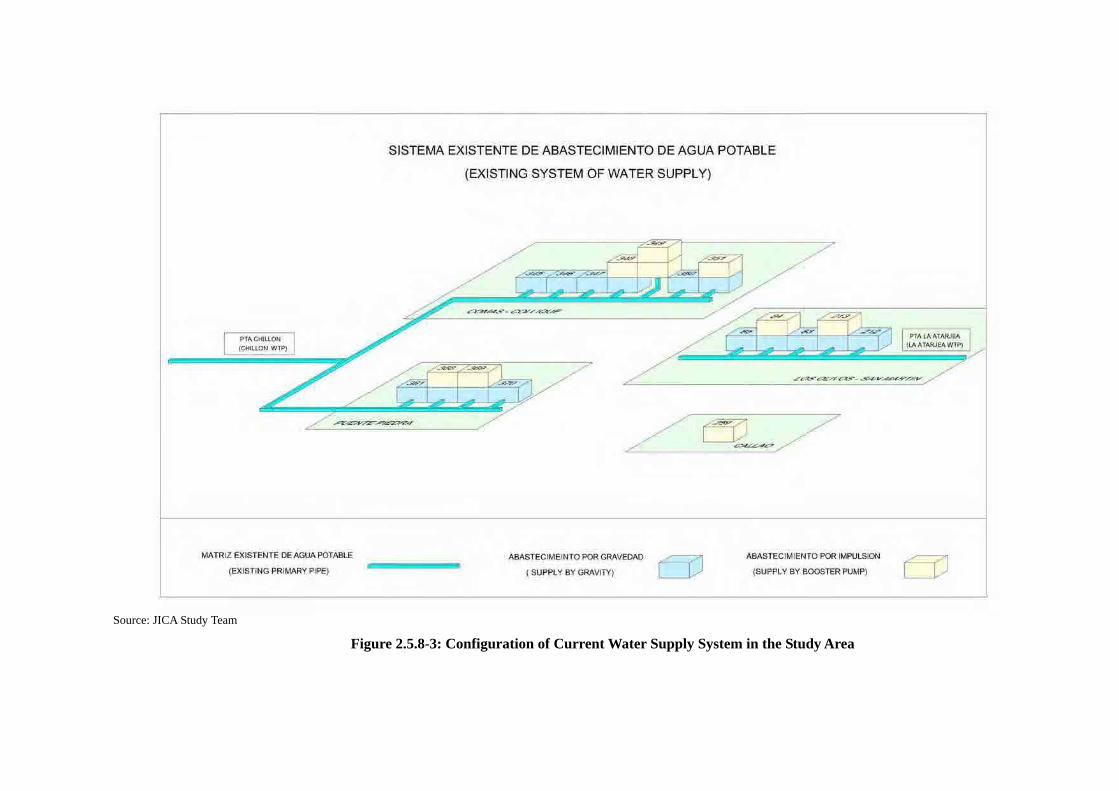
Source: JICA Study Team
Figure 2.5.8-3: Configuration of Current Water Supply System in the Study Area

FEASIBILITY STUDY ON NORTH LIMA METROPOLITAN AREA WATER SUPPLY AND SEWERAGE OPTIMIZATION PROJECT (II)
FINAL REPORT
NIPPON KOEI CO.,LTD. 2-86 NIPPON KOEI LAC CO.,LTD
2) Sectorization
(a) Current Situation
In the water supply engineering, “sectorization” means ability to operate a sector in isolation, installation of micrometer for each user, and provision of inlet pressure and flow measurement. With this kind of operation mode, it is possible to identify water loss.
In the Study Area, only eleven original sectors are physically sectored, and each sector is equipped with a valve pit with a micrometer, a pressure control valve, and pressure sensors at their entrance of the sector, as presented in Table 2.5.8-2. Other original sectors cannot be supervised or controlled independently. In addition, only five ogirinal sectors (83, 84, 85, 212 and 213) of the eleven can automatically control the valve and store the data of measured water flow and pressure. This situation makes it difficult for SEDAPAL to grasp exact conditions of water distribution, such as the non-revenue water (NRW) ratio, and to control the distribution to suit the geographic condition of each area.
It is necessary to improve the primary network in the Project so that it is possible to implement sectorization for each sector in order to optimize the water supply system.
Table 2.5.8-2: Original Sectors in the Study Area with Valve Pits at Their Entrance
District Original Sector
Los Olivos 83* 84* 85*
San Martín de Porres 212* 213*
Comas 350
345 – 346 347 – 346
Pte. Piedra 361 368 369
*: Original sectors which can be controlled and monitored automatically. Source: JICA Study Team
(b) Problems of Sectorization
As explained above, sectorization is not completed in the Study Area, so that NRW can not be monitored exactly.
(3) Operational Conditions
As only some sectors can be operated and monitored automatically, available data regarding operational conditions such as water flow and pressure are significantly limited. Observing the overall water supply system in the Study Area and the limited monitored operational information, operational conditions in the Study Area can be described as below;
1) Water Flow

FEASIBILITY STUDY ON NORTH LIMA METROPOLITAN AREA WATER SUPPLY AND SEWERAGE OPTIMIZATION PROJECT (II)
FINAL REPORT
NIPPON KOEI CO.,LTD. 2-87 NIPPON KOEI LAC CO.,LTD
Figure 2.5.8-4 illustrates locations of the valve pits which are monitoring and controlling the inflow to the sectors, and Figure 2.5.8-5 presents monitored water flow in the former sectors 83, 84, 85, 212 and 213. Data recorded in autumn (from 8th to 14th June 2009) is presented, when water consumption shows the typical trend in a year.
Because the original sectors 83, 84, 85, 212 and 213 are supplying water directly to the households without any buffer storage, water flows shown in the figure are mostly presenting the water consumption in each original sector. Water flow in the original sector 213, which shows a convexity curve, can not present the exact actual consumption because it has a pumping station to serve a high-elevation area in the sector.
Generally, all the sectors have the same consumption tendency in a sense that water flow is large in the daytime and small in the nighttime, which is derived from the typical life pattern of inhabitants. Original sector 85, however, has a slightly different trend, where high consumption continues until 11 P.M, due to large scale industrial users in the sectors.
Regarding the original sector 213, the pump operation period results drastic increase in the water flow.

FEASIBILITY STUDY ON NORTH LIMA METROPOLITAN AREA WATER SUPPLY AND SEWERAGE OPTIMIZATION PROJECT (II)
FINAL REPORT
NIPPON KOEI CO.,LTD. 2-88 NIPPON KOEI LAC CO.,LTD
Source: JICA Study Team
Figure 2.5.8-4: Locations of the Valve Pits at the Entrances of the Monitored Sectors
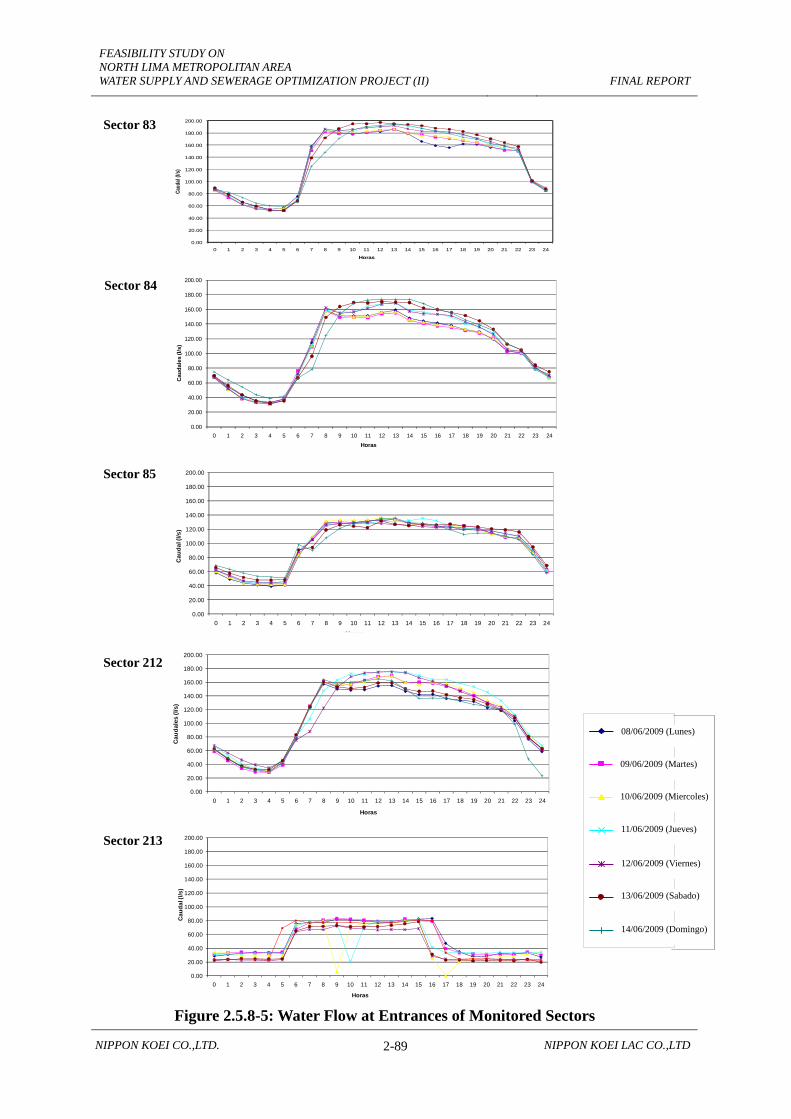
FEASIBILITY STUDY ON NORTH LIMA METROPOLITAN AREA WATER SUPPLY AND SEWERAGE OPTIMIZATION PROJECT (II)
FINAL REPORT
NIPPON KOEI CO.,LTD. 2-89 NIPPON KOEI LAC CO.,LTD
Lunes
Martes
Miercoles
Jueves
Viernes
Sabado
Domingo
08/06/2009 (Lunes)
10/06/2009 (Miercoles)
11/06/2009 (Jueves)
12/06/2009 (Viernes)
13/06/2009 (Sabado)
14/06/2009 (Domingo)
09/06/2009 (Martes)
Figure 2.5.8-5: Water Flow at Entrances of Monitored Sectors
0.00
20.00
40.00
60.00
80.00
100.00
120.00
140.00
160.00
180.00
200.00
0 1 2 3 4 5 6 7 8 9 10 11 12 13 14 15 16 17 18 19 20 21 22 23 24
Caud
al (l/
s)
Horas
0.00
20.00
40.00
60.00
80.00
100.00
120.00
140.00
160.00
180.00
200.00
0 1 2 3 4 5 6 7 8 9 10 11 12 13 14 15 16 17 18 19 20 21 22 23 24
Cau
dale
s (l/
s)
Horas
0.0020.0040.0060.0080.00
100.00120.00140.00160.00180.00200.00
0 1 2 3 4 5 6 7 8 9 10 11 12 13 14 15 16 17 18 19 20 21 22 23 24
Cau
dal (
l/s)
Horas
0.0020.0040.0060.0080.00
100.00120.00140.00160.00180.00200.00
0 1 2 3 4 5 6 7 8 9 10 11 12 13 14 15 16 17 18 19 20 21 22 23 24
Cau
dale
s (l/
s)
Horas
0.0020.0040.0060.0080.00
100.00120.00140.00160.00180.00200.00
0 1 2 3 4 5 6 7 8 9 10 11 12 13 14 15 16 17 18 19 20 21 22 23 24
Cau
dal (
l/s)
Horas
Sector 83
Sector 84
Sector 85
Sector 212
Sector 213

FEASIBILITY STUDY ON NORTH LIMA METROPOLITAN AREA WATER SUPPLY AND SEWERAGE OPTIMIZATION PROJECT (II)
FINAL REPORT
NIPPON KOEI CO.,LTD. 2-90 NIPPON KOEI LAC CO.,LTD
2) Water Pressure
Figure 2.5.8-6 presents monitored water pressure before it is controlled by valves in the former sectors 83, 84, 85, 212 and 213, which are located in Los Olivos and San Martín de Porres. Figure 2.5.8-7 also presents the monitored pressures at the sectors, but after they are regulated by the valves. In addition, Figure 2.5.8-8 presents water pressure measured by pressure sensor and monitored manually in the secondary networks. Presented data are those which were recorded in autumn (from 8th to 14th June 2009), when water consumption shows typical trend in a year.
(a) Water Pressure in Primary Network
The pressure of the water before it is controlled at the valve represents water pressure in primary networks, which are the networks that convey water from the WTPs to the sectors. (In the case of the former sectors above, the primary network is transferring water from the La Atarja WTP.)
Water pressures ranges between 30 m.c.a and 150 m.c.a., and at the entrances of original sectors 83, 212 and 213, the pressures are continuously higher than 80 m.c.a.
(b) Water Pressure in Secondary Network
The pressure of the water after it is controlled at the valve represents the conditions of water pressure in secondary networks, which are the networks that receive water from primary networks and distribute it throughout in the distribution area. Except for original sector 213, which has a pumping station, the inflows to the sectors are distributed directly to the households.
In original sectors 83, 84 and 212, water pressures are constantly around 36 m.c.a., 25 m.c.a., and 27 m.c.a., respectively. The constant pressure after the pressure control in the original sectors 83, 84 and 212 suggests that the pressure control is being successfully carried out.
In original sector 85, on the other hand, water pressure lowers by about 5 m.c.a. at peak time of water consumption.
(c) Problems of Water Pressure Control
Observing the dynamic trend of water pressure at the entrance of the monitored sectors, current problems of water pressure control can be summarized as follows;
• In view point of conservation of the pipeline, the constant pressure (80 m.c.a.) and the maximum pressure (150 m.c.a.) are so high that breakage and water leakage from pipe joints might be a concern. It is necessary to control them as much as possible to be lower than 75 m.c.a.
• In addition, reduction of the pressure is also necessary in order to avoid cavitation at the pressure control valve.
• The water pressure after pressure control in original sector 83 (constantly 36 m.c.a.) is significantly high, and like the primary network, breakage and water loss at pipe joints are a concern. It is necessary to lower the pressure of the inflow to the sector.
• As observed in the original sector 85, there might be some other areas, where the

FEASIBILITY STUDY ON NORTH LIMA METROPOLITAN AREA WATER SUPPLY AND SEWERAGE OPTIMIZATION PROJECT (II)
FINAL REPORT
NIPPON KOEI CO.,LTD. 2-91 NIPPON KOEI LAC CO.,LTD
water pressure at end users is low during the peak hours around lunch time. It is necessary to consider an operational or infrastructural corrective measure in order to optimize the distribution pressure.
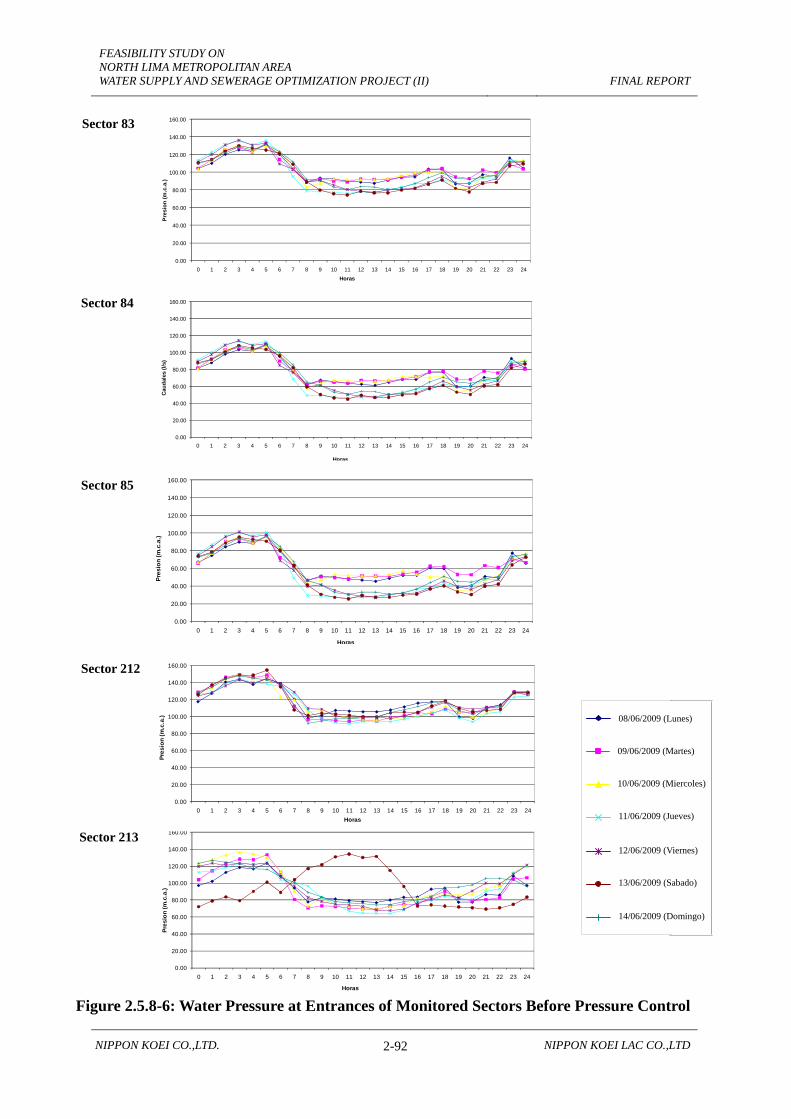
FEASIBILITY STUDY ON NORTH LIMA METROPOLITAN AREA WATER SUPPLY AND SEWERAGE OPTIMIZATION PROJECT (II)
FINAL REPORT
NIPPON KOEI CO.,LTD. 2-92 NIPPON KOEI LAC CO.,LTD
0.00
20.00
40.00
60.00
80.00
100.00
120.00
140.00
160.00
0 1 2 3 4 5 6 7 8 9 10 11 12 13 14 15 16 17 18 19 20 21 22 23 24
Pres
ion
(m.c
.a.)
Horas
Lunes
Martes
Miercoles
Jueves
Viernes
Sabado
Domingo
08/06/2009 (Lunes)
10/06/2009 (Miercoles)
11/06/2009 (Jueves)
12/06/2009 (Viernes)
13/06/2009 (Sabado)
14/06/2009 (Domingo)
09/06/2009 (Martes)
Figure 2.5.8-6: Water Pressure at Entrances of Monitored Sectors Before Pressure Control
0.00
20.00
40.00
60.00
80.00
100.00
120.00
140.00
160.00
0 1 2 3 4 5 6 7 8 9 10 11 12 13 14 15 16 17 18 19 20 21 22 23 24
Pre
sion
(m.c
.a.)
Horas
0.00
20.00
40.00
60.00
80.00
100.00
120.00
140.00
160.00
0 1 2 3 4 5 6 7 8 9 10 11 12 13 14 15 16 17 18 19 20 21 22 23 24
Caud
ales
(l/s
)
Horas
0.00
20.00
40.00
60.00
80.00
100.00
120.00
140.00
160.00
0 1 2 3 4 5 6 7 8 9 10 11 12 13 14 15 16 17 18 19 20 21 22 23 24
Pres
ion
(m.c
.a.)
Horas
0.00
20.00
40.00
60.00
80.00
100.00
120.00
140.00
160.00
0 1 2 3 4 5 6 7 8 9 10 11 12 13 14 15 16 17 18 19 20 21 22 23 24
Pres
ion
(m.c
.a.)
Horas
Sector 83
Sector 84
Sector 85
Sector 213
Sector 212

FEASIBILITY STUDY ON NORTH LIMA METROPOLITAN AREA WATER SUPPLY AND SEWERAGE OPTIMIZATION PROJECT (II)
FINAL REPORT
NIPPON KOEI CO.,LTD. 2-93 NIPPON KOEI LAC CO.,LTD
Lunes
Martes
Miercoles
Jueves
Viernes
Sabado
Domingo
08/06/2009 (Lunes)
10/06/2009 (Miercoles)
11/06/2009 (Jueves)
12/06/2009 (Viernes)
13/06/2009 (Sabado)
14/06/2009 (Domingo)
09/06/2009 (Martes)
Figure 2.5.8-7: Water Pressure at Entrances of Monitored Sectors After Pressure Control
0.00
5.00
10.00
15.00
20.00
25.00
30.00
35.00
40.00
0 1 2 3 4 5 6 7 8 9 10 11 12 13 14 15 16 17 18 19 20 21 22 23 24
Pres
ion
(m.c
.a.)
Horas
0.00
5.00
10.00
15.00
20.00
25.00
30.00
35.00
40.00
0 1 2 3 4 5 6 7 8 9 10 11 12 13 14 15 16 17 18 19 20 21 22 23 24
Cau
dale
s (l/
s)
Horas
0.00
5.00
10.00
15.00
20.00
25.00
30.00
35.00
40.00
0 1 2 3 4 5 6 7 8 9 10 11 12 13 14 15 16 17 18 19 20 21 22 23 24
Pres
ion
(m.c
.a.)
Horas
0.00
5.00
10.00
15.00
20.00
25.00
30.00
35.00
40.00
0 1 2 3 4 5 6 7 8 9 10 11 12 13 14 15 16 17 18 19 20 21 22 23 24
Pres
ione
s (m
.c.a
.)
Horas
0.00
10.00
20.00
30.00
40.00
50.00
60.00
70.00
80.00
90.00
0 1 2 3 4 5 6 7 8 9 10 11 12 13 14 15 16 17 18 19 20 21 22 23 24
pres
ion
(m)
horas
Sector 213
Sector 83
Sector 84
Sector 85
Sector 212

VENTANILLA
CALLAO
260
256
258
361 350
257
254
345
255
261
266370
264
251
262
253
362
265
213-1
263
259
252
368 B
369 B
346-1
85 C
347-2
369 A
85 B-2
83 B-2
84 A-1
84 B-2
368 A-1
346-2
84 B-1
85 A
349 A-1
83 A-2
84 A-2
83 B-1
212 A-1
348 A
85 B-1
348 B-1
349 B-2
212 B-1
212 A-2
212 B-2
347-1
83 A-1
349 B-1349 B-3349 A-3
351-1
349 A-2
349 B-4
351-2
368 A-2
348 B-2
351-3
213-3
213-2
COMAS
SAN JUAN DE LURIGANCHO
CARABAYLLO
LOS OLIVOS
PUENTE PIEDRA
SAN MARTIN DE PORRES
INDEPENDENCIA
SAN MARTIN DE PORRES RIMAC
LURIGANCHO
OCEANO PACIFICO
AV CE NTRA L
AV CHILL
ON
AV IN
DOAM
ERIC
A
AV P UNO
AV C
AV S
ANTA
ANA
AV CANTA CALLAO
AV P
ERIM
ETRAL
AV C
ARAB
AYLL
O
AV C
HACR
A CER
RO
AV 1
AV O LIV OS , LOS
AV T ANTAMAYO
AV UNGER, G
ERARDO
AV H
EROE
S DEL
ALTO
CEN
EPA
AV S
INCH
I ROC
A
A V S A N TA E L VI RA
AV R
E TA B
LO, E
L
AV RIO M A RA ÑON
AV SAN JOSE
AV MENDIOLA , A LF REDO
AV C
UZC O
AV PAR AMONGA
AV RE V OLUCION
A V 20 0 MI LL
A S
A V SOL DE NA RAN JA L
AV D
AV UNIVERS ITARIA
AV B
AV JUPIT ER
AV ALIS OS , LOS
AV LIM A
AV TA
Z A, LA
AV PANAMERICANA NORTE
AV 17
A V SAN DI EGO DE A LCA LA
AV SA N FE L IP E
AV PA RIA HUA NCA
AV METROPOLITANA
AV ACA P ULCO
AV E
AV C
OND OR
CANQ
UI, M
ARIA
NO
AV CONTISUYO
AV INDEPENDENCIA
AV PA
RADO DE BELL
IDO, MAR
IA
AV 4
AV RIO TAM
BO
AV INDUSTRIAL
AV INCA S, LO S
AV CH INCHA YS U YO
AV A CA CI A S, LA S
AV H
UAYL
AS
AV FA M ES A
AV D OM INIC OS , LOS
AV A
A V SA N RE MO
AV T
UPAC
AM
ARU
AV ROS ARIO , E L
AV S AN J UA N
AV S
AN M
ATE O
AV J AM A ICA
AV M E XICO
AV M
ALEC ON CHILL
ON
AV H
UAND
OY
A V ANG ELES , LO S
AV A
RTES
ANOS
, LO S
AV CED RO S, LOS
AV S ANG A RARAA V UGAR TE, A LFON SO
AV SOL DE ORO
AV JA ZMIN E S , LOS
AV P AR R AL , E L
AV E COLO GICO
AV ZINC, E L
AV RO SAL, EL
AV M IRAFLORES
AV DE SA N M ART IN, J OS E
AV C
HASQ
UIS ,
LOS
AV M IRA MA R
AV ROS A LU Z
AV PACASMAYO
AV NO VIE M BRE , 17 DE
AV CA NA DA
A V LIBE RT A D
AV S ET IE M BR E, 25 DE
AV EU CAL IP TO S, LO S
AV NIÑO S M A RT IRES , LOS
AV R
EGLA
, LA
AV CARR IO N, DANIEL AL CIDES
AV S AN CA RLOS
AV JA
CARA
NDA
AV HURIN CUZCO
A V MU JI CA G ALLO
, MANUEL
AV 2
AV BOLOGNESI, FRANCISCO
AV HUA NA CAURE
AV MAN CO CAPA C
AV ANT UNE Z DE M AY OL O, S ANTIA GO
AV CO RICANCHA
AV O CTUB RE, 2 DE
AV TO RRES , LAS
A V N A RA NJAL , E L
AV P ORTA LE S , LO S
AV REPU BL IC A DE L PER U
A V DICIEM BR E, 20 D E
AV CO LE CTO RA
AV A GOSTO, 1 1 DE
AV F A UCE TT , EL ME R
AV PO MAB
A MBA
AV S
AN R
O Q UE
AV S ANTA MA R IA A LT A
AV CO ND ORCA NQ UI, J OSE G AB RIEL
AV V IRGEN DEL ROSARIO
AV ALAMO S, L OS
AV JUNIO, 15 DE
AV VALL EJO , CE SAR
AV GL O BO
T E R RA Q U E O
AV M ILAG RO D E JESUS
A V M AE STRO P E RU ANO
A V S AN E NRIQUE
AV NE PT UNO
AV VENUS
AV AL
BORA
DA, L
A
AV VI RG EN DE L CA R M EN
AV GONZALE S P RADA, MA NUE L
AV 7
AV C
ENTE
NARI
O
A V PIN
OS ,
L O
S
AV ROSA DE AM
ERICA
AV TR
APICHE
CHIL LON
AV NARANJAL
AV IN TEG RA CIO N
AV U N IO N, L A
AV HUAMACHUCO
AV E NER O, 25 DE
AV O RQUIDEAS , LAS
A V PALME RAS , LAS
AV AM A NCA ES , LOS
AV PERIF ERICA
AV BERT ELLO, A LE JANDRO
AV BERT ELLO B O
LL AT I, AL E JA N DRO
AV AG OS TO, 22 DE
AV M
AYO,
11 D
E
AV O LIVAR, E L
A V BET AN COU RT, R OMU LO
A V DE LA FUENT E, GUIL LE R MO
AV VE NCED ORE S, L OS
AV P RA DO , M A NUE L
A V B AS TID A S, MICAELA
AV SAN A NTO NIO
A V G AMBETT A , CRNE L NES TOR
AV MONITO
R HUASCAR
AV ANT ISUYO
AV IZA GUIR RE, CA RLOS A LBE RTO
AV D E SAN MAR TIN, DO N JOSE
AV HO NDURAS
A V PE RU AN IDAD DE LA
AV TUL IP AN ES, LO S
AV S
ANTA
RO SA
A V ES T
A DO
S UN
IDOS
AV D
EL B
IERZ
O
AV B END EZU, W ILBE R
AV MERINO RE YN A
AV SAN JUAN MAS IAS
AV SANTA CRUZ
AV BELAUN DE O ESTE, VICTO R A
AV CHO CAN O, JOS E SANTOS
AV JULI
O, 1
DE
AV MAYO, 1
DE
AV PUNCHAUCA
AV P
LATI
NOS ,
LOS
AV SAN PEDRO DE CARABAYLLO
AV S
AN A LBIN O
AV G UARDIA CIV IL
AV AG OSTO, 25 DE
A V S OL , EL
AV PROCERES, DE LOSA V OC TUBRE , 12 DE
AV CO RDIALIDAD, LA
A V SE ÑOR DE CAUD IV ILL A
AV P ROCE RE S, LOS
AV PA RA ISO
AV MARTIN, JUAN MANUEL
AV HA Y A DE LA
TORRE, V
IC TO R R
AV CO LE CTO R COM AS
AV SANT A AD ELA
A V CH IMP U O C L LO , ISA BE L
AV S
AUC
ES, L
OS
AV TREBOL, EL
AV V IOL E T AS , L A S
AV IZA GUIRRE , CA RLO S A
AV S AN
F RANC
ISCO
AV S AN P E DR O
AV BO LO G NESI, C RNL FRAN CI SCO
AV RESIDENCIAL
AV DE LA TORRE UGA RTE , JOS E
AV CA CE RES , MRCA L A NDRE S A
AV VEN EZU ELA
AV M
AGNO
LIAS ,
LAS
AV AM E RICAS , LAS
A V L I BE RTAD , LA
A V JE R U SALEN
AV CO NFR ATE R NID AD , LA
AV ALAMEDA DEL PINAR
AV PALMA, RICARDO
AV SAN NICO LAS
AV HER
OE S DE P
UCUT
A
AV OLA
YA, MARTIR JO
SE
AV DE L
A MU JE R PER UAN A
AV SANT ISI MA C RU Z DE S AN D IE GO
AV JUL IO, 2 8 DE
A V G RAU, A LM T E MIG UEL
AV VILLAR RE AL, FE DER ICO
AV M AL VI NAS , LAS
AV RE PU BLICA DE ISRA E L
AV S A N MA RT IN
AV PRINCIPAL
AV B ELA UNDE ES TE , VICTO R A
AV R
EPU B
LICA D
E ARG
ENTIN
A
AV M ER CURIO
AV BELEN
AV RO BLE S, LO S
AV A
LHEL
IE S, LO
S
AV VAL LE, T OMAS
AV MENDIOLA , A LF REDO
AV SA N C ARLOS
A V NARA NJA L, E L
AV IZA GUIRRE , CA RLO S A LBE RTO
AV U
N IVER
S ITA
RIA
AV M E RINO RE YNA
AV A
AV A
AV G
AMBE
TTA,
CR N
EL N
EST O
R
AV S
AN
TA R OS A
AV PANAMERICANA NORTE
AV SAN NICO LAS
AV SANTA RO SA
AV T
UPAC
AMA R
U
AV CAN TA CAL LAO
A V S ANT A R OSA
AV M AG
N OLIA
S, LA
S
AV PR OCERE S, LO S
AV AN TI SUY O
AV ALIS OS , LOS
AV C
AV CHILLON
AV A
AV B OLO GNE SI, CRNL FRA NCIS CO
AV A
AV COLEC TOR A
AV FA UCET T, E LM E R
AV C ENTRAL
AV C
AV SA U C ES, LOS
AV SA NT A ROS A
AV PANAMERICANA NORTE
AV PACASMAYO
A V RIO MAR AÑONAV
RET
ABLO
, EL
AV IZA GUIRRE , CA RLO S A
AV ALIS OS , LOS
AV ALIS OS , LOS
AV TO RRES , LAS
AV PRINCIPAL
AV TORR E S, L AS
AV S ANTA ANA
AV TRAP ICHE CHILLON
AV CA NTA C AL LAO
AV C EDR OS, L OS
AV S
ANTA
RO SA
AV SAN ENRIQUE
AV U N G ER , GERA RDO
AV INDO AMERICA
AV TU
PAC
AMAR
U
AV U
N IV
ERSI
TAR I
A
AV MENDIOLA , A LF REDO
A V JA ZM INE S, LOS
AV ALIS OS , LOS
AV B ERTEL LO BOL LATI, ALE JAN DRO
A V UNI
VERS
I TA R
I A
A V ME N D IO L A, A LF R ED OAV NARA NJA L, E L
AV PALMA, RICARDO
AV C U ZCO
AV CENTRAL
AV P
A CAS
MAY O
AV PRINCIPA L
AV B
AV B
AV S ANG A RARA
AV P IN
O S, L OS
A V M ALECON CHILLO N
AV NARANJAL
A V IZA G UIRRE , CA RLOS A
AV TRAP ICHE CHILLON
AV DO MINICOS, LO S
AV C
AV A
AV E
AV S ANG A RARA
AV UNG ER, G ERARDO
A V O LIV OS, LOS
AV PA
CASMAY
O
AV IN
T EGR AC
ION
AV IN
TEGR
ACIO
N
AV C
ARAB
AYLL
O
AV SANTA RO SA
AV ALIS OS , LOS
AV P
ACAS
MAYO
AV S
ANTA
RO SA
AV IN DEP ENDE N CI A
AV 2
AV CO NFRATE RNIDA D, LA
AV RO SA DE AME RICA
AV TU
PAC
AMAR
U
AV R
ETAB
LO, E
L
AV 200 MILLAS
AV SEÑOR D E CA UD IVI LLA
AV C
ENTR
AL
AV CENTRAL
AV C
ANTA
CAL
LAO
A V H UA ND OY
AV PR AD O, M ANUE L
AV S ANTA RO SA
AV TORRES , LAS
A V M E ND IO L A , A L FR E DO
AV UNIVERS ITARIA
AV C
AV MA NC O C A P AC
AV S
AN F
RANCIS
CO
AV CHO CANO , JOSE SANTO S
AV T UPAC AMARU
AV PA
NAMERICANA N
ORTE
A V ROS ARIO, EL
AV VENUS
AV F AU C ETT, E LM ER
AV C
A V CH
ACRA
CER
RO
AV CHIMPU OCLLO, I SABEL
AV SAN DIEGO DE ALCALA
AV SAN PEDRO D E C ARA BA Y LLO
AV MENDIOLA , A LF REDO
AV UNGER , GE RA R D O
AV T U
P AC
A MAR
U
AV 2
AV P INOS , LOS
AV B
AV CE NTRA L
A V 200 M ILL AS
AV B
AV PARAD O DE B EL L IDO , M
ARIA
AV S ANTA RO SA
AV LIM A
AV T
UPAC
AM AR
U
AV METROPOLITANA
AV U
NIVE
RSIT
A RI A
AV 1
A V S AN FE LIP E
AV A LIS OS , LOS
AV OCTUBRE, 12 DE
AV FA UCET T, E LM E R
AV VA LLEJ O, CE SA R
A V TOR RES, L
A S
AV SA N CARLO S
AV PALMER AS, LA SAV A
AV BAV M E N DI OL A , A L FR E D O
AV PACASMAYO
AV P LATINOS , LOS
AV AGOSTO, 22 D E
AV B
AV SAUCES , LOS
AV B
AV U
NIVE
RSITA
RIA
AV P
RINC
IPAL
AV C
ANTA
CAL
LAO
AV H
UAND
OY
A V U
N IVE
RSIT A RI
A
AV ROSA DE AM
ERICA
AV B
AV SANTA ADELA
AV R
ETAB
LO, E
L
AV H
UAYL
AS
AV PERIMETRAL
A V METROPOL ITAN A
AV A
AV A
AV PACASMAYO
AV EUCALIPTOS , LOS AV CE NTRA L
AV CANTA C
ALLA
O
A V SAN F EL IPE
AV SANG AR ARA
AV C EDR OS, L
O S
A V R EP
UBLIC
A DEL
PER
U
AV A
AV CA NTA C ALLAO
AV A
AV CANTA CALLAO
AV NARANJAL
AV M
UJI C
A G A
L LO ,
MA N
UEL
AV C
AV B
A V P INO S, LO S
AV DOMINICO S, LOS
AV S
AN J
OSE
A V ME N D IO
L A, A LF R ED O
AV CAN TA C A LLA O
AV SANTA RO SA
AV SAUC ES , LOS
AV TAN TAMAYO
AV PACASMAYO
AV A
AV C
A RA B
A YLL
O
AV A
AV PANAMERICANA NORTE
AV 17
AV N ARANJA L
AV A
AV DO MINICOS , L OS
AV INDO AMERICAA V UNIVE RSIT ARIA
AV J AZ MINE S , LO S
AV CENTRAL
AV SAN M
ATEO
AV C
ENTE
NARI
O
AV S ANTA RO SA
AV B
A V R EV OLUCIO N
A V SA N J UA N MA SIA S
AV UNGER, G
ERARDO
AV O LIV OS , LOS
AV C
AV CHACRA C ERRO
AV U
NIVER
S ITARIA
AV INCA S, LO S
AV INDUSTRIAL
A V A NG ELE S, L OS
AV O LIVAR, E L
270000
270000
275000
275000
280000
280000
285000
285000
8675
000
8675
000
8680
000
8680
000
8685
000
8685
000·
LEGEND
PRESSURE (m.c.a)Range 2008
RANGE: < 10RANGE: 10-20RANGE: 21-30
MATERIAL PIPE SECONDARY NETWORK PAAC (Asbest Cement)ACER (Steel)FOFO (Cast Iron)PVC (Vinyl Polychloride)
STUDY AREADISTRICT BOUNDARYSECTOR BOUNDARYROADSGREEN AREABLOCKSRIVERSCOAST
PROYECTO :GRAFICO 2.5.8-8: PRESIONES EN REDES SECUNDARIAS DE AGUA POTABLE
SERVICIO DE AGUA POTABLE Y ALCANTARILLADO DE LIMAREPUBLICA DEL PERU
FIGURE 2.5.8-8: WATER PRESSURE IN THE SECONDARY NETWORKS OF POTABLE WATER
1:50,000Proyection: UTMDatum: WGS-84
Zone: 18 sur
0 1 20.5km

FEASIBILITY STUDY ON NORTH LIMA METROPOLITAN AREA WATER SUPPLY AND SEWERAGE OPTIMIZATION PROJECT (II)
FINAL REPORT
NIPPON KOEI CO.,LTD. 2-95 NIPPON KOEI LAC CO.,LTD
(4) Service Conditions
1) Scale of Service
According to cadastre of SEDAPAL, the Study Area contained 77,573 connections and 94,971 units of user in 2009. The population served is 398,600 inhabitants, which is equivalent to approximately 65% of the total population in the area.
In the sectors with existing networks, the coverage ratio is as high as 80% in some sectors, while there are many sectors in which the coverage ratio is between 50% and 60% or less.
2) Incidents
Events which have been counted as “incidents” are visible failures which appear as water leakage on the ground with settlement of pavement. These events cause stoppages of water supply in the surrounding area, deterioration of transportation conditions, and sometimes flooding in streets or houses.
Table 2.5.8-3 presents the number and type of incidents in the Study Area. As shown in the table, many incidents have occurred particularly at the connection points of the secondary distribution networks and at household connection pipes. No incidents in the primary pipe were reported.
It is noted that incidents in the distribution pipes are increasing rapidly year by year, though the current number is not notably high. The locations where incidents were registered between 2006 and 2009 are shown in Figures 2.5.8-9 and 2.5.8-10.
More specific situations of the incidents and their causes will be presented and analyzed in the diagnoses in items “(10) Secondary Network” and “(11) House Connections and Micrometers”.
Table 2.5.8-3: Records of Incidents
Category 2006 2007 2008 2009 Secondary Pipes 0.07 km/year
53 per year 0.19 km/year 144 per year
0.23 km/year 172 per year
0.43 km/year 162 per year
Connection Joints and Pipes 2.8 km/year 2,131 per year
3.08 km/year 2,341 per year
3.22 km/year 2,448 per year
1.29 km/year 983 per year
Source: JICA Study Team
As described in 2.5.8 (11) 2) (b), the Study Team analyzed the relation between frequency of incidents and pipe age/ pipe materials by sector. However, it could not show any relation between them.
3) Service Hours
SEDAPAL has achieved continuous service for most of the Study Area. In some areas of Collique and Márquez (sector 259), however, SEDAPAL has failed to offer 24-hour service, as shown in Figure 2.5.8-11. In case of Collique, its main cause of failure is that the Chillón WTP cannot send enough water to the area during dry season. In the case of Márquez, the area is fed by a groundwater source, which sometimes cannot cover all the area´s water demand.

FEASIBILITY STUDY ON NORTH LIMA METROPOLITAN AREA WATER SUPPLY AND SEWERAGE OPTIMIZATION PROJECT (II)
FINAL REPORT
NIPPON KOEI CO.,LTD. 2-96 NIPPON KOEI LAC CO.,LTD
4) Water Pressure
Water pressure at connections or in secondary distribution networks is not monitored in the Study Area. However, according to SEDAPAL and the feedback from local inhabitants, household water pressure tends to be unstable and sometimes it becomes too high or too low. The fluctuation of household water pressure is also supported by the data of water pressure at the entrance of existing sectors as presented in the previous item.
This issue of service pressure are caused by the following factors: i) water is mostly supplied to households not through the existing reservoirs, ii) water pressure at primary pipes is too high and unstable, iii) pressure control valves do not have enough capacity, and iv) pipe diameters of the secondary networks are not sufficient.
5) Problems of Service Conditions
Through the diagnoses above, problems of service conditions can be summarized as follows:
• Many incidents on distribution networks and connections, such as water leakage and settlement of pavement, are deteriorating living conditions of inhabitants.
• There are some areas in which 24-hour service has not been realized.
• Water pressure tends to be unstable and, in addition, it sometimes becomes too high or too low in some areas.

XYXY
XY XY
XY
XY
XYXY
XY
XY
XY
XY
XY
XY
XYXYXY
XYXY
XYXYXY
XY
XYXYXY
XY
XYXY
XY
XY
XY
XY
XY
XYXYXYXY
XY
XY XY
XY
XY
XY
XY
XYXY
XY
XY
XY
XY
XY
XY
XYXY
XY
XYXY
XYXYXY
XY
XY
XYXYXYXY XYXY
XY
XYXY
XYXYXY
XY XY
XY
XY
!(!(!(!(!(
!(!(!(!(
!(
!(!(!(!(!(
!(!(
!(
!(!(!(
!(
!(!(!(
!(
!(!(!(!(!(!(
!(
!(
!(
!(
!(!(
!(
!(
!(
!(
!(!(
!(!(
!(
!(
!(
!(!(
!(
!(
!(
!(
!(
!(
!(!(
!(
!(
!(!(!(
!(
!(
!(
!(!(
!(
!(
!(
!(
!(
!(
!(
!(
!(
!(
!(
!(
!(
!(!(
!(
!(
!(!(
!(
!(
!(!(
!(
!(!(!(!(!(
!(
!(
!(
!( !(
!(
!(
!(
!(
!(
!(
!(
!(
!(
!(
!( !(
!(!(
!(
!( !(
!(
!( !(
!(!(
!(
!(
!(!(
!(
!(
!(!(
!(!(!(
!(
!(!(!(
!(
!(
!(
!(
!(!(
!(
!(
!(!(
!(
!(
!(
!(!(
!(
!(
!(!(!(!(
!(!(!(
!(
!(!(!(!(
!(!(!(!(!( !(
!(
!( !(
!(
##
##
#
#
##
# #
#
#
#
#
#
#
##
#
###
# #
##
#
#
##
##
###
####
#
#
#
#
##
###
#
##
#
##
##
##
#
##
#
#
#
#
## #
#
#
##
#
#
#
#
#
#
#
#
###
#
# ##
####
#
####
###
###
#
#
##
#
#
#
#
#
#
#
# ## #
#
#
#
##
##
###
#
###
###
#
#
#
##
#####
#
##
#
##
##
#
#
##
#
##
##
######
##
#### #
##
#
###
##
###
#
#
##
#
#
#
##### ###
") ")
")
")")
")")")
")")
")")") ")")
")
")")")
") ")")")")")
") ")
")")")")")")")")")
")")
")")")")")")")
")")")")")")")")")")
")")
")")")
")")
")")
")")")")")")")
")
")")
")")")
")")")")
")
")")
")
")")")")")
")")")")
")")
")
")
")")")")")")
")
")
")
")
")
")")
")")")")
")")")
")
")")")
")")")
")")
")
")
")")
")
")
")
")
")
")")
")
")")
")
")")
")
")
")
")
")
")
")
")
")
")
")
")
")
")
")
")
")
")
")
")
")
")
")")
")
")
")")")
")")
")
")
")
")
")
")
")
")
")
")
")
") ")")
")
")
")
")
")
")
")
")
")
")
")
")
")
")
")
")
")
")
")
")")
")
")
")
")
")
")
")
")
")
")
")
")")
")
")
")
")
")")
")
")
")
")
")")
")
")
")
")")
")
")")
")
")
")
")
")")
")
")")
")
")
")
") ")
")
")")
")
")
")")
")")
")")
")")
") ")
")
")")")")
")")
")")
")
") ")")
")
VENTANILLA
CALLAO
260
256
258
361 350
257
254
345
255
261
266370
264
251
262
253
362
265
213-1
263
259
252
368 B
369 B
346-1
85 C
347-2
369 A
85 B-2
83 B-2
84 A-1
84 B-2
368 A-1
346-2
84 B-1
85 A
349 A-1
83 A-2
84 A-2
83 B-1
212 A-1
348 A
85 B-1
348 B-1
349 B-2
212 B-1
212 A-2
212 B-2
347-1
83 A-1
349 B-1349 B-3349 A-3
351-1
349 A-2
349 B-4
351-2
368 A-2
348 B-2
351-3
213-3
213-2
COMAS
SAN JUAN DE LURIGANCHO
CARABAYLLO
LOS OLIVOS
PUENTE PIEDRA
SAN MARTIN DE PORRES
INDEPENDENCIA
SAN MARTIN DE PORRES RIMAC
LURIGANCHO
OCEANO PACIFICO
AV CE NTRA L
AV CHILL
ON
AV IN
DOAM
ERIC
A
AV P UNO
AV C
AV S
ANTA
ANA
AV CANTA CALLAO
AV P
ERIM
ETRAL
AV C
ARAB
AYLL
O
AV C
HACR
A CER
RO
AV 1
AV O LIV OS , LOS
AV T ANTAMAYO
AV UNGER, G
ERARDO
AV H
EROE
S DEL
ALTO
CEN
EPA
AV S
INCH
I ROC
A
A V S A N TA E L VI RA
AV R
E TA B
LO, E
L
AV RIO M A RA ÑON
AV SAN JOSE
AV MENDIOLA , A LF REDO
AV C
UZC O
AV PAR AMONGA
AV RE V OLUCION
A V 20 0 MI LL
A S
A V SOL DE NA RAN JA L
AV D
AV UNIVERS ITARIA
AV B
AV JUPIT ER
AV ALIS OS , LOS
AV LIM A
AV TA
Z A, LA
AV PANAMERICANA NORTE
AV 17
A V SAN DI EGO DE A LCA LA
AV SA N FE L IP E
AV PA RIA HUA NCA
AV METROPOLITANA
AV ACA P ULCO
AV E
AV C
OND OR
CANQ
UI, M
ARIA
NO
AV CONTISUYO
AV INDEPENDENCIA
AV PA
RADO DE BELL
IDO, MAR
IA
AV 4
AV RIO TAM
BO
AV INDUSTRIAL
AV INCA S, LO S
AV CH INCHA YS U YO
AV A CA CI A S, LA S
AV H
UAYL
AS
AV FA M ES A
AV D OM INIC OS , LOS
AV A
A V SA N RE MO
AV T
UPAC
AM
ARU
AV ROS ARIO , E L
AV S AN J UA N
AV S
AN M
ATE O
AV J AM A ICA
AV M E XICO
AV M
ALEC ON CHILL
ON
AV H
UAND
OY
A V ANG ELES , LO S
AV A
RTES
ANOS
, LO S
AV CED RO S, LOS
AV S ANG A RARAA V UGAR TE, A LFON SO
AV SOL DE ORO
AV JA ZMIN E S , LOS
AV P AR R AL , E L
AV E COLO GICO
AV ZINC, E L
AV RO SAL, EL
AV M IRAFLORES
AV DE SA N M ART IN, J OS E
AV C
HASQ
UIS ,
LOS
AV M IRA MA R
AV ROS A LU Z
AV PACASMAYO
AV NO VIE M BRE , 17 DE
AV CA NA DA
A V LIBE RT A D
AV S ET IE M BR E, 25 DE
AV EU CAL IP TO S, LO S
AV NIÑO S M A RT IRES , LOS
AV R
EGLA
, LA
AV CARR IO N, DANIEL AL CIDES
AV S AN CA RLOS
AV JA
CARA
NDA
AV HURIN CUZCO
A V MU JI CA G ALLO
, MANUEL
AV 2
AV BOLOGNESI, FRANCISCO
AV HUA NA CAURE
AV MAN CO CAPA C
AV ANT UNE Z DE M AY OL O, S ANTIA GO
AV CO RICANCHA
AV O CTUB RE, 2 DE
AV TO RRES , LAS
A V N A RA NJAL , E L
AV P ORTA LE S , LO S
AV REPU BL IC A DE L PER U
A V DICIEM BR E, 20 D E
AV CO LE CTO RA
AV A GOSTO, 1 1 DE
AV F A UCE TT , EL ME R
AV PO MAB
A MBA
AV S
AN R
O Q UE
AV S ANTA MA R IA A LT A
AV CO ND ORCA NQ UI, J OSE G AB RIEL
AV V IRGEN DEL ROSARIO
AV ALAMO S, L OS
AV JUNIO, 15 DE
AV VALL EJO , CE SAR
AV GL O BO
T E R RA Q U E O
AV M ILAG RO D E JESUS
A V M AE STRO P E RU ANO
A V S AN E NRIQUE
AV NE PT UNO
AV VENUS
AV AL
BORA
DA, L
A
AV VI RG EN DE L CA R M EN
AV GONZALE S P RADA, MA NUE L
AV 7
AV C
ENTE
NARI
O
A V PIN
OS ,
L O
S
AV ROSA DE AM
ERICA
AV TR
APICHE
CHIL LON
AV NARANJAL
AV IN TEG RA CIO N
AV U N IO N, L A
AV HUAMACHUCO
AV E NER O, 25 DE
AV O RQUIDEAS , LAS
A V PALME RAS , LAS
AV AM A NCA ES , LOS
AV PERIF ERICA
AV BERT ELLO, A LE JANDRO
AV BERT ELLO B O
LL AT I, AL E JA N DRO
AV AG OS TO, 22 DE
AV M
AYO,
11 D
E
AV O LIVAR, E L
A V BET AN COU RT, R OMU LO
A V DE LA FUENT E, GUIL LE R MO
AV VE NCED ORE S, L OS
AV P RA DO , M A NUE L
A V B AS TID A S, MICAELA
AV SAN A NTO NIO
A V G AMBETT A , CRNE L NES TOR
AV MONITO
R HUASCAR
AV ANT ISUYO
AV IZA GUIR RE, CA RLOS A LBE RTO
AV D E SAN MAR TIN, DO N JOSE
AV HO NDURAS
A V PE RU AN IDAD DE LA
AV TUL IP AN ES, LO S
AV S
ANTA
RO SA
A V ES T
A DO
S UN
IDOS
AV D
EL B
IERZ
O
AV B END EZU, W ILBE R
AV MERINO RE YN A
AV SAN JUAN MAS IAS
AV SANTA CRUZ
AV BELAUN DE O ESTE, VICTO R A
AV CHO CAN O, JOS E SANTOS
AV JULI
O, 1
DE
AV MAYO, 1
DE
AV PUNCHAUCA
AV P
LATI
NOS ,
LOS
AV SAN PEDRO DE CARABAYLLO
AV S
AN A LBIN O
AV G UARDIA CIV IL
AV AG OSTO, 25 DE
A V S OL , EL
AV PROCERES, DE LOSA V OC TUBRE , 12 DE
AV CO RDIALIDAD, LA
A V SE ÑOR DE CAUD IV ILL A
AV P ROCE RE S, LOS
AV PA RA ISO
AV MARTIN, JUAN MANUEL
AV HA Y A DE LA
TORRE, V
IC TO R R
AV CO LE CTO R COM AS
AV SANT A AD ELA
A V CH IMP U O C L LO , ISA BE L
AV S
AUC
ES, L
OS
AV TREBOL, EL
AV V IOL E T AS , L A S
AV IZA GUIRRE , CA RLO S A
AV S AN
F RANC
ISCO
AV S AN P E DR O
AV BO LO G NESI, C RNL FRAN CI SCO
AV RESIDENCIAL
AV DE LA TORRE UGA RTE , JOS E
AV CA CE RES , MRCA L A NDRE S A
AV VEN EZU ELA
AV M
AGNO
LIAS ,
LAS
AV AM E RICAS , LAS
A V L I BE RTAD , LA
A V JE R U SALEN
AV CO NFR ATE R NID AD , LA
AV ALAMEDA DEL PINAR
AV PALMA, RICARDO
AV SAN NICO LAS
AV HER
OE S DE P
UCUT
A
AV OLA
YA, MARTIR JO
SE
AV DE L
A MU JE R PER UAN A
AV SANT ISI MA C RU Z DE S AN D IE GO
AV JUL IO, 2 8 DE
A V G RAU, A LM T E MIG UEL
AV VILLAR RE AL, FE DER ICO
AV M AL VI NAS , LAS
AV RE PU BLICA DE ISRA E L
AV S A N MA RT IN
AV PRINCIPAL
AV B ELA UNDE ES TE , VICTO R A
AV R
EPU B
LICA D
E ARG
ENTIN
A
AV M ER CURIO
AV BELEN
AV RO BLE S, LO S
AV A
LHEL
IE S, LO
S
AV VAL LE, T OMAS
AV MENDIOLA , A LF REDO
AV SA N C ARLOS
A V NARA NJA L, E L
AV IZA GUIRRE , CA RLO S A LBE RTO
AV U
N IVER
S ITA
RIA
AV M E RINO RE YNA
AV A
AV A
AV G
AMBE
TTA,
CR N
EL N
EST O
R
AV S
AN
TA R OS A
AV PANAMERICANA NORTE
AV SAN NICO LAS
AV SANTA RO SA
AV T
UPAC
AMA R
U
AV CAN TA CAL LAO
A V S ANT A R OSA
AV M AG
N OLIA
S, LA
S
AV PR OCERE S, LO S
AV AN TI SUY O
AV ALIS OS , LOS
AV C
AV CHILLON
AV A
AV B OLO GNE SI, CRNL FRA NCIS CO
AV A
AV COLEC TOR A
AV FA UCET T, E LM E R
AV C ENTRAL
AV C
AV SA U C ES, LOS
AV SA NT A ROS A
AV PANAMERICANA NORTE
AV PACASMAYO
A V RIO MAR AÑONAV
RET
ABLO
, EL
AV IZA GUIRRE , CA RLO S A
AV ALIS OS , LOS
AV ALIS OS , LOS
AV TO RRES , LAS
AV PRINCIPAL
AV TORR E S, L AS
AV S ANTA ANA
AV TRAP ICHE CHILLON
AV CA NTA C AL LAO
AV C EDR OS, L OS
AV S
ANTA
RO SA
AV SAN ENRIQUE
AV U N G ER , GERA RDO
AV INDO AMERICA
AV TU
PAC
AMAR
U
AV U
N IV
ERSI
TAR I
A
AV MENDIOLA , A LF REDO
A V JA ZM INE S, LOS
AV ALIS OS , LOS
AV B ERTEL LO BOL LATI, ALE JAN DRO
A V UNI
VERS
I TA R
I A
A V ME N D IO L A, A LF R ED OAV NARA NJA L, E L
AV PALMA, RICARDO
AV C U ZCO
AV CENTRAL
AV P
A CAS
MAY O
AV PRINCIPA L
AV B
AV B
AV S ANG A RARA
AV P IN
O S, L OS
A V M ALECON CHILLO N
AV NARANJAL
A V IZA G UIRRE , CA RLOS A
AV TRAP ICHE CHILLON
AV DO MINICOS, LO S
AV C
AV A
AV E
AV S ANG A RARA
AV UNG ER, G ERARDO
A V O LIV OS, LOS
AV PA
CASMAY
O
AV IN
T EGR AC
ION
AV IN
TEGR
ACIO
N
AV C
ARAB
AYLL
O
AV SANTA RO SA
AV ALIS OS , LOS
AV P
ACAS
MAYO
AV S
ANTA
RO SA
AV IN DEP ENDE N CI A
AV 2
AV CO NFRATE RNIDA D, LA
AV RO SA DE AME RICA
AV TU
PAC
AMAR
U
AV R
ETAB
LO, E
L
AV 200 MILLAS
AV SEÑOR D E CA UD IVI LLA
AV C
ENTR
AL
AV CENTRAL
AV C
ANTA
CAL
LAO
A V H UA ND OY
AV PR AD O, M ANUE L
AV S ANTA RO SA
AV TORRES , LAS
A V M E ND IO L A , A L FR E DO
AV UNIVERS ITARIA
AV C
AV MA NC O C A P AC
AV S
AN F
RANCIS
CO
AV CHO CANO , JOSE SANTO S
AV T UPAC AMARU
AV PA
NAMERICANA N
ORTE
A V ROS ARIO, EL
AV VENUS
AV F AU C ETT, E LM ER
AV C
A V CH
ACRA
CER
RO
AV CHIMPU OCLLO, I SABEL
AV SAN DIEGO DE ALCALA
AV SAN PEDRO D E C ARA BA Y LLO
AV MENDIOLA , A LF REDO
AV UNGER , GE RA R D O
AV T U
P AC
A MAR
U
AV 2
AV P INOS , LOS
AV B
AV CE NTRA L
A V 200 M ILL AS
AV B
AV PARAD O DE B EL L IDO , M
ARIA
AV S ANTA RO SA
AV LIM A
AV T
UPAC
AM AR
U
AV METROPOLITANA
AV U
NIVE
RSIT
A RI A
AV 1
A V S AN FE LIP E
AV A LIS OS , LOS
AV OCTUBRE, 12 DE
AV FA UCET T, E LM E R
AV VA LLEJ O, CE SA R
A V TOR RES, L
A S
AV SA N CARLO S
AV PALMER AS, LA SAV A
AV BAV M E N DI OL A , A L FR E D O
AV PACASMAYO
AV P LATINOS , LOS
AV AGOSTO, 22 D E
AV B
AV SAUCES , LOS
AV B
AV U
NIVE
RSITA
RIA
AV P
RINC
IPAL
AV C
ANTA
CAL
LAO
AV H
UAND
OY
A V U
N IVE
RSIT A RI
A
AV ROSA DE AM
ERICA
AV B
AV SANTA ADELA
AV R
ETAB
LO, E
L
AV H
UAYL
AS
AV PERIMETRAL
A V METROPOL ITAN A
AV A
AV A
AV PACASMAYO
AV EUCALIPTOS , LOS AV CE NTRA L
AV CANTA C
ALLA
O
A V SAN F EL IPE
AV SANG AR ARA
AV C EDR OS, L
O S
A V R EP
UBLIC
A DEL
PER
U
AV A
AV CA NTA C ALLAO
AV A
AV CANTA CALLAO
AV NARANJAL
AV M
UJI C
A G A
L LO ,
MA N
UEL
AV C
AV B
A V P INO S, LO S
AV DOMINICO S, LOS
AV S
AN J
OSE
A V ME N D IO
L A, A LF R ED O
AV CAN TA C A LLA O
AV SANTA RO SA
AV SAUC ES , LOS
AV TAN TAMAYO
AV PACASMAYO
AV A
AV C
A RA B
A YLL
O
AV A
AV PANAMERICANA NORTE
AV 17
AV N ARANJA L
AV A
AV DO MINICOS , L OS
AV INDO AMERICAA V UNIVE RSIT ARIA
AV J AZ MINE S , LO S
AV CENTRAL
AV SAN M
ATEO
AV C
ENTE
NARI
O
AV S ANTA RO SA
AV B
A V R EV OLUCIO N
A V SA N J UA N MA SIA S
AV UNGER, G
ERARDO
AV O LIV OS , LOS
AV C
AV CHACRA C ERRO
AV U
NIVER
S ITARIA
AV INCA S, LO S
AV INDUSTRIAL
A V A NG ELE S, L OS
AV O LIVAR, E L
270000
270000
275000
275000
280000
280000
285000
285000
8675
000
8675
000
8680
000
8680
000
8685
000
8685
000·
LEGEND
Incidences 2009") Valves") Hydrants") Pipes and Accessories
Incidences 2008# Valves# Hydrants# Pipes and Accessories
Incidences 2007!( Valves!( Hydrants!( Pipes and Accessories
Incidences 2006XY ValvesXY HydrantsXY Pipes and Accessories
STUDY AREADISTRICT BOUNDARYSECTOR BOUNDARYROADSGREEN AREABLOCKSRIVERSCOAST
PROYECTO :
GRAFICO 2.5.8-9: INCIDENCIAS OPERATIVAS EN REDES DEAGUA POTABLE 2006, 2007, 2008 Y 2009
SERVICIO DE AGUA POTABLE Y ALCANTARILLADO DE LIMAREPUBLICA DEL PERU
FIGURE 2.5.8-9: OPERATIONAL INCIDENCES ON POTABLEWATER NETWORKS 2006,2007,2008, AND 2009
1:50,000Proyection: UTMDatum: WGS-84
Zone: 18 sur
0 1 20.5km
212 A 2 2 0 2 2 1 2 3 7212 B 2 2 1 1 2 1 3 6 1 3 10 16213 6 3 9 4 2 2 8 11 1 12 3 1 4 3 3253 0 0 1 1 0 1254 0 0 0 0 0256 0 0 0 2 2 2259 5 1 6 33 2 2 3 7 2 1 1 4 18 18 6 5345 0 0 2 2 1 1 3346 7 1 2 10 15 3 2 2 0 20 3 2 2 5 11 11 6 6347 1 1 2 4 7 1 12 6 1 1 8 4 4 2 6348 A 0 3 3 1 1 2 2 2 7348 B 2 1 3 7 1 8 7 3 10 7 5 12 3 3349 A 8 2 2 12 15 5 2 0 19 5 2 4 16 6 2 2 78349 B 1 8 1 10 8 8 16 14 11 2 5 17 6 2 3 74350 1 1 2 4 1 1 6 7 7 14 11 2 1 14 3 6351 0 0 11 5 1 17 5 5 2 2361 0 0 0 1 1 1368 A 2 2 4 1 1 2 3 3 4 4 13368 B 0 0 0 2 1 3 3369 A 0 2 5 7 3 3 1 7 3 1 4 18369 B 1 1 2 2 9 9 1 1 2 14370 4 1 5 8 8 11 1 12 7 7 3 283 A 1 1 3 3 6 2 8 2 1 3 1583 B 2 1 3 9 5 14 10 2 12 6 1 1 8 3 784 A 2 2 3 4 7 8 8 7 1 8 2 584 B 5 1 6 7 3 2 12 4 1 1 6 9 10 19 4 385 A 0 1 2 3 1 1 2 1 1 685 B 1 1 3 5 8 2 2 12 9 1 1 11 7 1 8 3 685 C 1 1 2 7 7 5 5 8 3 11 2 5Total 53 2 1 13 8 7 14 4 4 5 19 2 0 8 172 3 9 2 1 2 3 2 16 2 3 8 10 2 10 73 7Percentage 7% 3% 2% 12% 20% 6% 3% 28% 23% 5% 3% 31% 22% 5% 1% 28% 100%
DETAILED OPERATIONAL INCIDENCES IN WATER SUPPLY NETWORK UNTIL DECEM BER 20092006 2007 2008 2009
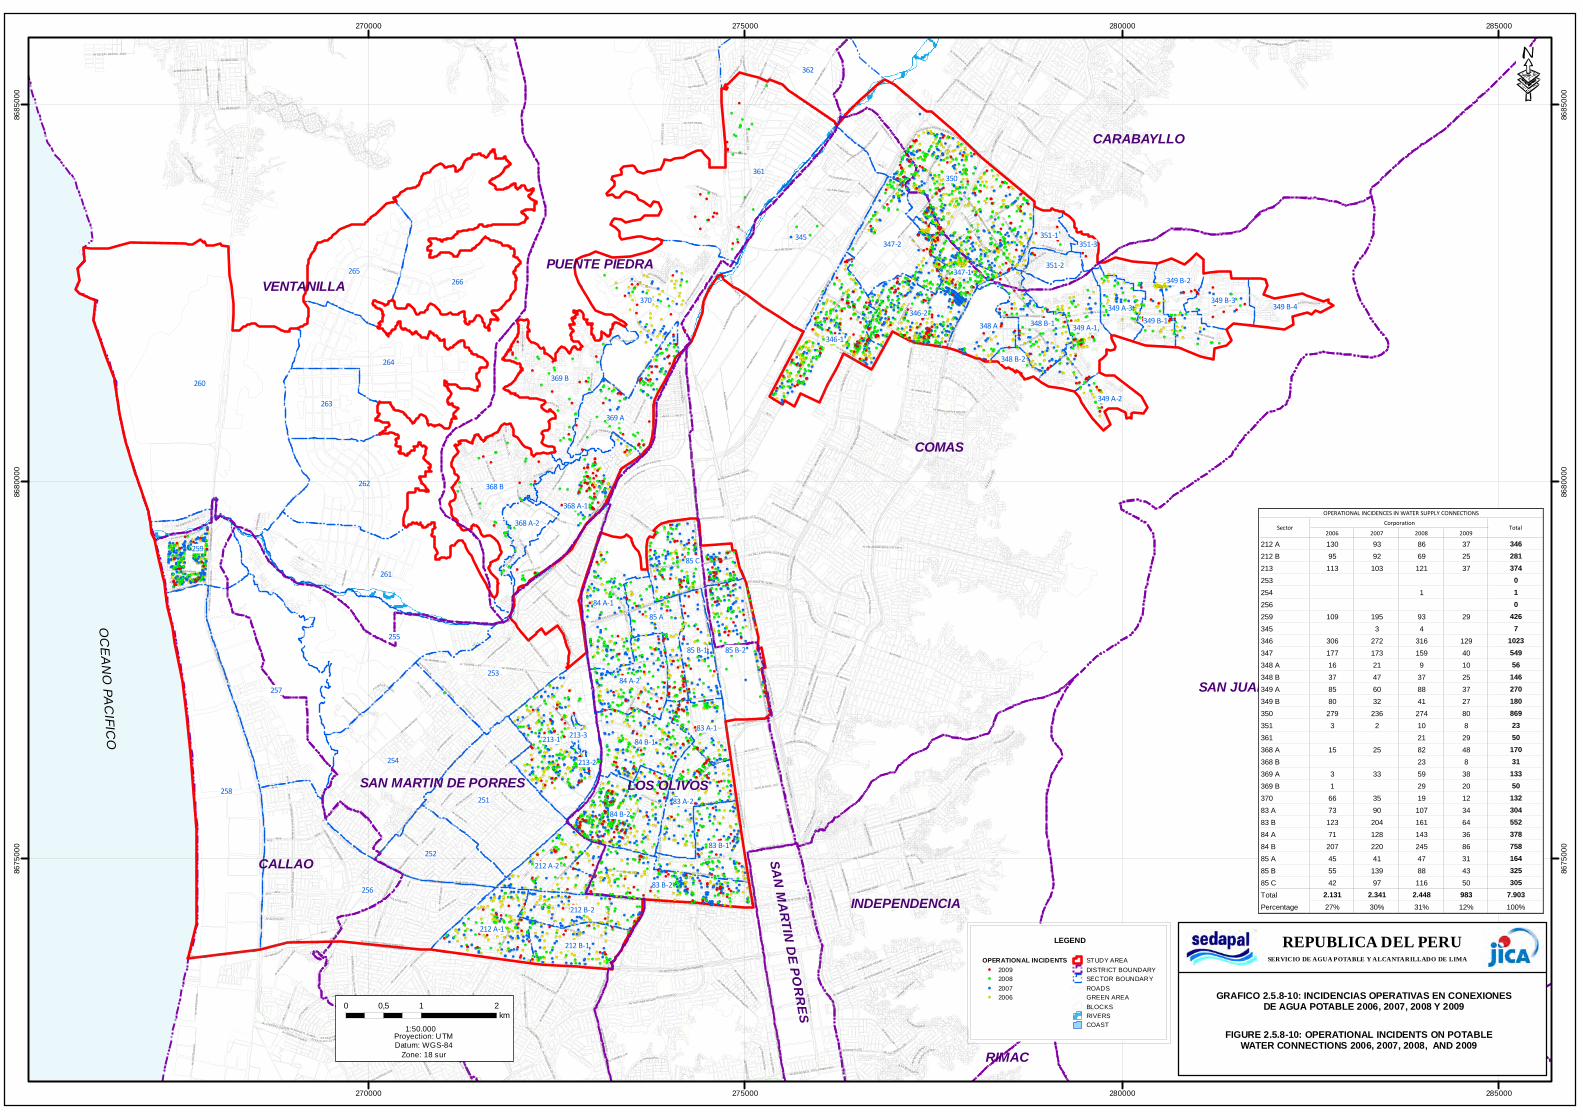
!(!(
!(!(!(!(!(!(!(
!(!(!(
!(!(!(!(!(
!(
!(
!(!(!(
!(!(!(!(!(!(
!(!(!(
!(
!(!(!(
!(
!(
!(
!( !(
!(!(
!(!(
!(!(!(!(!(!(
!(!(!(!(
!(!(!(
!(
!(
!(
!(
!(!(
!(!(!(!(
!(!(
!(!(!(
!(!(!(
!(
!(
!(!(
!(!(
!(
!(!(
!(!(!(
!(!(!(!(
!(
!(!(!(!(!(
!(!(
!(
!(
!(
!(!(
!( !(!(
!(
!(
!(!(
!(
!(!(!(!(
!(
!(!(
!(
!(
!(
!(
!(
!(
!(!(
!(!(
!(!(!(!(!(!(!( !(
!(
!( !(
!(!(
!(!(
!(
!(
!( !(
!(
!(
!(
!(!(
!(!(
!(!(
!(
!(
!(!(
!(
!(!(
!(
!(
!(!(!(!( !(!(!(
!( !(
!(!(!( !(
!(
!(
!(!(!(
!( !( !(!(!( !(!(!(!(
!(!(
!( !(!(!(!( !(!( !(
!(
!(!(
!(
!(
!(
!(!(!( !(
!(!(!(
!(
!( !(!(
!(
!(!(!(
!(!(
!( !(
!(!( !(
!(
!(
!(
!(
!(!(
!(!(
!(!( !(
!(
!(
!(!( !( !(!(!(!(!(!(
!(
!(
!(!(
!(!(
!(
!( !( !(!(
!(
!( !(
!( !(
!(!(!(!(
!( !(
!(!(!(!( !(
!(
!(!(!( !(!(!(
!( !( !(!(!( !(!(!(!(
!(!(!(!(
!(!(!(!( !(
!(
!(
!(
!(
!(!(
!(
!(!(
!(
!(
!(
!(
!(
!( !(!( !(!( !(
!(!( !(!(!(!(
!( !( !(
!(!( !(
!( !(
!(!(
!(!(!(
!(!(!(!(!( !(!(!(!(
!(
!(
!(
!(!(
!(
!( !(!(!(
!(
!(
!(
!(
!(
!(
!(
!(!(
!(
!(!(
!(!(!( !(
!(
!(!(
!(
!(
!(
!(
!( !(
!(
!(
!(
!(
!(!(
!(!(
!(
!(
!(!(
!(!(
!(
!(
!(
!(!(
!(
!(
!(!(!(
!(!(
!( !(
!(
!(!(!( !(
!( !( !(
!(!(!(!( !(
!( !(!(
!(!(
!(!( !(
!( !( !(!(
!( !(
!(
!(!(!(!(
!( !(
!(
!(
!(
!(!(!(
!( !(!(
!(
!(
!(
!(
!(
!(!( !(!(!( !( !(
!(
!(
!(!(!(
!( !(
!(
!(!(
!(!(
!( !(!( !( !(
!(!( !(
!(
!(!( !(!(
!(
!(!(
!(!(
!(!(
!(
!(
!(
!(
!(
!(
!(
!(
!(
!(
!(
!(!(!(
!(
!(
!(
!(
!( !(
!(
!(
!(
!(
!(
!(
!(
!(
!(
!(
!(
!( !(
!(!(!(!(
!(
!(!(
!(
!(
!(!(
!(
!(
!(!(
!(!(
!(
!(
!(!(
!(
!(
!(
!(
!(
!(
!(
!(
!(
!(
!(
!( !(!(
!(!(
!(
!( !(
!(!(
!(
!(
!(
!(
!(
!(
!(
!(!(
!(
!(!(!(!(
!(!(!(
!(
!(
!(
!(
!(
!(!(
!(
!(
!(
!(!(
!(
!(
!(!(
!(!(
!(
!(!(
!(
!(!(
!(!(
!(!(!(
!(
!(
!(
!(
!(
!( !(!(
!(
!(
!(
!(
!(
!(!(
!( !(!(
!(!(
!(!(!(!(
!(!(!(
!(
!(
!(
!(
!( !(
!(
!(!(
!(
!(!(
!(
!(!(
!(
!(
!(
!(!(
!(!(
!(
!( !(!(!(
!(
!(
!(
!(
!( !(!(
!(
!(!(
!(
!(!(!(
!( !(
!(
!(
!(
!(
!(
!( !(
!(!(
!(
!(!(!(!(
!( !(!(
!(!(!(
!(
!(
!(
!(!(
!(!(
!(!(
!(
!(
!(!(
!(!(!(
!(
!(
!(
!(
!(
!(
!(!(!(
!(!(
!(
!(
!(!(!(!(
!(
!(!(
!(
!(
!(
!(!( !(
!(!(
!(!(
!(!(!(
!(
!(!(!(!(
!(!(
!(
!( !(!(
!(
!(!(
!(
!(
!(!(
!(!(
!(
!(
!(!(
!(
!(!(
!(!(
!(!(
!(!(!(
!(!(!(!(
!(!(
!(
!(!(
!(!(
!(!(
!(
!(!(
!(
!(
!(!(
!(
!(!(!(!(
!(
!(!(!(
!(
!(!(!(!(
!(!( !(!(
!(!(!(
!(
!(
!(!(
!(
!(!(
!(!(!(
!(!(
!(
!(
!(
!(!(!(!(
!(
!(
!(!(!(
!( !(
!(!(!(!(!(
!(
!(
!(
!(
!(!(
!(
!(
!(!(
!(
!(!(
!(!(!(!(
!(!(!(
!(
!(!(
!(
!(
!(
!(!(
!(
!(
!(
!( !(
!(
!(
!(!(!(
!(
!(
!(!(
!(
!(!(
!(
!(
!(
!(
!(
!(
!(!(
!(
!(!(
!(!(
!(
!(
!(
!(
!(
!(
!(
!(!(!(
!(
!(
!(
!(
!(!(
!(
!(
!(
!(
!(
!(
!(
!(!(!(
!(!(
!(
!(!(!(
!(!(
!(
!(
!(!(
!(
!(
!(!(!(!(!(
!(
!(
!(!(
!(
!(!(
!(!(
!(
!(
!( !(!(
!(
!(
!(
!(
!(!(!(
!(!(
!(
!(
!(
!(
!(
!(
!(
!(
!(!(!(!(!(
!(!(!(!(!(!(!(
!(!(!(!(
!(!(
!(
!( !(
!( !(
!(
!(
!(!(
!(!(
!(
!(
!(
!(!(
!( !(
!(
!(!(!(
!(!(
!(
!(!(!(!(
!(!(!(
!(!(!(!(
!(!(!(!(
!(
!(!(
!(
!(
!(!(
!(
!(!( !(
!(
!(
!(
!(!(
!(!( !(
!(!(!(!(
!(
!(
!(!(
!(!(!(
!(!(!(!(!(!(
!(!(
!(
!(
!(!(!(!(!(
!(
!(
!(
!(!(
!(!(
!(!(!(
!(!(!(!(!(!(
!(!(!(
!(
!(
!(
!(
!(
!(!(
!(
!(!(!(
!(
!(
!(
!(!(!(!(!(!(!(!(
!(!(!(!(!(!(!(!(!(!(!(!( !(
!(
!(!(
!( !(
!(!( !(
!(!(!(
!(!(
!( !(
!(!(!(!(
!(
!(
!(!(
!(!(
!(!(!(!(
!(
!(
!(!(!(!(!(!(
!(!(!(
!(!(!(
!(!(!(
!(
!(!(
!(
!(!(!(!( !(!(
!(
!(
!(!(
!(
!(!(!(!(!(
!(!(
!(
!(!(!(!(!(!(
!(!(!(
!(!(!(!(!(
!(!(
!(
!(
!(!(!(
!(
!(!(!(
!(
!(
!(
!(
!(!(!(!(
!(
!(!(
!(
!(!(
!(
!(!(
!(!(!(!(
!(!(
!(
!(!(!(!(!(
!(
!(
!(!(
!(
!(!(!(
!(!(!(!(!(!(!(!(!(
!(!(!(
!(
!(
!(
!(!(
!(!(
!(
!(
!(!( !(
!(
!(
!(
!(!(
!(!(
!(
!(!(!(!(!(!(
!( !(!(!(!(!(!(!(
!(!(!(
!(
!(!(
!(!(
!(
!(!(!(!(
!(
!(
!(
!(
!(!(!(
!(!(!(!(
!(
!(!(!(
!(!(!(
!(
!(
!(
!(
!(!(
!(
!(!(
!(
!(!(!(
!(
!(!(!(
!(
!(!(
!(
!(!(!(!(
!(
!( !(
!(
!(!(
!(
!(!(
!(
!(
!(!(
!(!(!(
!(
!(!(
!(
!(!(!(!( !(
!(!(!(!(!(
!(!(!(!(!(!(!(!(!(!(!(!(
!(!(!(!(!(!(!(!(!(
!(
!(!(!(!(
!(
!(!(
!(
!(!(
!(
!(
!(
!(
!(!(
!(
!(
!(!(
!(!(
!(
!(!(!(!(
!(
!(
!(!(
!(!(!(!(!(
!(!(
!(!(!(
!(!(
!(!(!(!(
!(!(!(
!(!(!(
!(
!(
!(!(
!(
!(
!(!(!(!(
!(
!(
!( !( !(!(
!( !(!(
!(!(
!(
!(
!( !(!(
!(
!(!(!(!(
!(
!(
!(!(
!(
!(
!(!(
!(
!(
!(
!(
!(
!(
!(
!(!(
!(!(!(!(
!(
!(!(
!(
!(
!(
!(
!(
!(
!(!(
!( !(
!(
!(
!(
!(
!(
!(!(!(
!(
!(!(!(!(
!(
!(
!(
!(
!(!(
!(
!(!(
!(
!(!(
!(!(
!(
!(!(
!(
!(!( !(
!(!(
!(
!(!(
!(
!(
!(
!(!(
!(
!( !(
!(
!(!(
!(!(
!(!(
!(!(
!(!(!(
!(!( !(
!(
!(
!(
!(
!(!(
!(
!(
!(
!(!(
!(
!(
!(
!(
!(
!(!(!(
!(!(
!(!(!(!(!(!(!(!(!(!(!(
!(!(
!(
!(!(!(!(!(!(!(!(!(!(!(!(!(!(
!(!(!(!(
!(
!(
!(!(
!(!(
!(
!(!(!(!(!(
!(
!(!(!(!(
!(
!(!(
!(
!(!(
!(
!(
!(!(
!(
!(
!(!(
!(!(
!(
!(
!(!(
!(!(!(
!(!(!(
!(
!(
!(!(!(
!(!(
!(
!(!(!(
!(!(!(
!(!(
!(
!(!(
!(
!(
!(
!(
!(
!( !(!(
!(!(!(
!(!(
!(!(!(
!(!(!(!(!(
!(
!(
!(
!(!(!(
!(!(!(!(!(!(!(
!(
!(
!(!(!(!(!(
!(
!(
!(
!(!(
!(!(
!(
!(
!(!(
!( !(!(
!(
!(!(!(
!(
!(
!(!(
!(
!(!(!(
!(
!(!(!(
!(
!(
!(
!(!(!(
!(
!(
!(
!(!(
!(
!(!(!(
!(!(
!(!(!(!(
!(
!(
!(
!(
!(
!(
!(
!(
!(
!(
!(
!(!(
!(!(!(!(!(!(
!( !(!(!(!(
!(!(
!(!(!(!(!(!(
!(!( !(!(!(!(!(!(!(!(
!( !(
!(!(!(
!(
!( !(!(!(!(!(!(
!(!(
!(!(
!(!(!(!(
!(
!(
!(!(
!(!(
!(!(!(!(!(
!(
!(!(!(!(!(!(!(!(!(!(!(!(!(
!(!(!(
!(!(!(!(!(!(
!(!(
!(!(
!(
!(!(!(!(
!(
!(!(!(
!(
!(
!(!(!(!(!(!(
!(!(
!(
!(
!(!(
!(!(
!(!(
!(!(
!(!(!(!(
!(!(!(
!(
!(!(!(
!(
!(
!(
!(
!(!(!(!(!(!(
!(
!(!(!(!(
!(!(!(!(!(
!(!(!(!(
!(!(
!(!(!(!(!(!(!(!(!( !(!(!(!(
!(
!(!(
!(
!(!(
!(!(
!(!(!(
!(
!(!(!(
!(
!(!(
!( !(!(
!( !(
!(!(!( !(
!(
!( !(!(
!( !(
!( !(!( !(!(!(
!(
!(
!(
!(!(
!(!( !(!(
!(!( !(!(!(
!(!(!(!(!( !(
!(!(
!(
!( !(!(!(
!( !(
!( !(!(
!(!(!(
!(!( !(
!(!(!(
!(
!(
!(
!( !(
!(
!(
!(
!(
!( !(
!(
!(
!(
!(
!(
!(
!(!(
!( !(!( !( !(!(
!(
!( !(!( !(
!(
!(!( !(
!( !(!(
!( !(
!(!( !(
!(
!(
!( !(!( !(
!( !(
!( !( !(!( !(
!( !(!(!(
!( !( !(!(!(
!(!(
!(!(
!(!(!(!(
!(
!(
!( !( !(!(!(!(
!(
!( !(
!(!(!(
!(
!(!(!(
!(
!(
!(!(
!(!(
!(
!(!(!(
!(!(!(!(
!(
!(!( !(!( !( !(!(!(
!(
!(!(!( !( !(!(
!( !(!(!(!( !(
!(
!(!(!( !(!(!( !(!(!( !(
!(
!(!(!(
!(!(
!(
!(
!(!(
!( !(
!(
!(!(!( !(
!( !(!(!(!(!(
!(
!(
!(!(
!(
!(
!(
!(
!( !(!(!(!(
!(
!(!(
!(
!(
!(!(!( !(
!(!(!(
!(
!(
!(
!(
!(!(!(
!(!(!(
!( !(!(
!(
!(!(
!(
!( !(
!(!(!(!(
!( !(!(!(!(
!( !(!(
!(!(!(
!(
!(
!(!(!(!(
!(!(
!( !(!(!(
!(
!(
!(!(!(!( !(!(
!(
!(!( !(!(!(!(
!( !(
!(
!(
!(!(
!( !(!(
!(
!(!(
!(!(!(!(
!(
!(!(
!(
!(!(
!(
!(!(!(
!(!(
!( !(
!(!(
!(
!(
!(
!(
!(
!(!(
!(!(
!(
!(!(!(
!(!(
!(!(
!(!(!(
!( !(
!( !(!(!(!(
!( !(!(
!(!( !(!(
!(
!(
!(!(
!(
!(
!(!(
!(
!(
!(!(
!(
!(
!(!(
!( !(
!(
!(
!(!(
!(
!(!(!(
!(
!(!(
!(
!(
!(
!(
!(
!(
!(!(
!(
!(!(
!(
!(
!(!(
!(!(!(!(
!( !(!(!(
!(!(
!(
!(
!(
!(
!(
!(
!(
!(!(
!(
!(
!(!(
!( !(
!(
!(!(
!( !(
!(!(!(!(
!(!(
!(!(
!(!(
!(!(
!(
!(
!(
!(
!(
!(
!(
!(
!(
!(!(
!(
!(
!( !(
!(
!(
!(
!(
!(
!(
!(
!(!(!(!(
!(!(
!(
!(
!(
!(
!(!(!(
!(
!(
!(!(
!(!(
!(
!(!(
!(
!(!(!(
!(
!(!(!(
!(
!(!(
!(
!(!(
!(
!(!(
!(!(
!(
!(!(
!(
!(
!(
!(
!(
!(
!(
!(
!(
!(
!(
!(
!(
!(
!(!(
!(
!(
!(
!(!(!(
!(
!(
!(
!(!(
!(
!(!(!(!(
!( !(!(
!(
!(!(
!(!(
!(!(
!(
!(!(!(
!(
!(
!(!(
!(
!(
!(!(
!(!(
!(
!(
!(
!(
!(!(
!(!(
!(
!(!(
!(!(
!(!(
!(
!(
!(!(
!(!( !(!(!(
!(
!(
!(
!(
!(
!(!(!(!(!(
!(!( !(!(
!(
!(!( !(!(
!(!(
!( !(
!(
!(
!(
!(!(!(
!(
!(
!(!(
!(!(
!(
!(!(!(
!(
!(
!(
!(!(
!(
!(
!(!(
!(
!(
!(!(!(!(
!(!(
!(
!(
!(
!(!( !(
!(
!(
!(!(
!(!(
!(
!(
!(
!(
!(
!(!(!(
!(
!(!(
!(
!(
!(!(
!(!(
!(
!(
!(!(
!(
!(
!(!(
!(!(
!(
!(!(
!(
!(
!( !(
!( !(
!(
!(!(
!(!(!(
!(!(
!(
!(!(!(
!(!(
!(!(!(
!(
!(!(
!(
!(!(!(
!(
!(!(
!(
!(
!(!(
!( !(!(!(
!(
!( !(!(!(!(
!(
!(!(!(
!(
!(!(!(
!(!(
!(
!(!(
!(!(
!(
!(
!(
!(
!( !(
!(!(
!(!(
!(!(!(
!(
!(!(!(!(
!(
!(!(!(!(!(
!(!(
!(!(
!(!( !(
!(!(
!(!(
!(!(
!(
!(!(
!(
!(!(
!(
!(!(
!(
!(
!(
!(
!(
!(
!(!(
!(!(!(!(
!(!(
!(
!( !(
!(
!(
!(!(
!(
!(
!(!(
!(
!(
!(
!(!(
!(!(
!(
!(
!(
!(
!(
!(
!(
!(
!(!(!(!(!(!(
!(!(
!(
!(
!(!(
!(
!(!(
!(!(
!(
!(
!(
!(
!(
!(!(
!(!(
!(
!( !(
!(!( !(
!(!(
!( !(
!(!(
!(!(
!(
!(
!(!(
!(
!(
!(
!(
!(
!(
!(
!(
!(
!(
!(
!(
!(
!(
!(
!(!(
!(!(
!(
!(!(!(!(!(
!(!(!(!(
!(
!(!(
!(!(
!(!(
!(!(
!(!(!(!(
!(!(
!(!(
!(
!(!(!(
!(
!(
!(
!(
!(!(
!(!(
!(
!(
!(
!(
!(
!(!(!(
!(!(
!(!(
!(
!(
!(
!(!(!(
!(!(
!(
!(
!(
!(
!(!(!(!(
!(
!(!(!(
!(!(!(
!(
!(!(!(!(!(!(!(!(!(
!(!(
!(
!(!(!(!(
!(!(
!(
!(
!(!(!(
!(!(
!(
!(!(
!(
!(!(!(!(!(
!(!(!(
!(!(!(
!(!(!(
!(!(!(
!(!(
!(!(
!(!(
!(!(!(!(!(
!(
!(!(
!(!(!(!(!(!(
!( !(
!(
!(!(
!(
!(
!(
!(
!(
!(
!(
!(!(
!(!(
!(
!(
!(!(
!(
!(
!(!(
!(
!(
!(
!(
!(!(
!(!(
!( !(!(
!( !(
!(!(!(
!(!(
!(
!(
!(
!(
!(!( !(
!(!(!(!(
!(
!(
!(
!(
!( !(!(
!(
!(!(
!(
!(!(!(!(!( !(
!(
!(
!(
!(!(
!(
!(
!(
!(!(
!(!(
!(!(
!(!(!(
!(
!(!(!(!(
!(
!(
!(
!(
!(!(!(!(!(
!(!(!(!(!(!(!( !( !(
!(!(!(!(!(!(!(!(!(!(!(!(!(
!(!(!(!(!(!(!(!(!(!(!(
!(
!(!(!(!(!(!(!(!(!(!(!(!(!(!(!(!(!(!(!(!(
!(!(!(!(!(
!(
!(!(
!(!(!(
!(!(!(
!(!(
!(!(
!(
!(!(
!(!(
!(!(
!(
!(!(
!( !(!(
!(
!(!(!(!(!(!(!(!(!(!(
!(
!(!(
!(!(!(
!( !(!(!(
!(!(
!(
!(
!(
!( !(!(!(
!( !(!(
!(
!(
!(
!(!(
!(!(
!(!(
!(
!(
!(!(!(!(!(
!(
!(!(!(
!(!(
!(
!(
!(
!( !(!(!(
!(!(!(
!(!(
!(
!(!(!(!(
!(
!( !(
!(
!(
!(!(
!(!(!(
!(
!(!(
!(
!(
!(!( !(!(
!(!(!(
!(
!(
!(!(!(
!(
!(
!(!(!(!(
!(
!(
!(!(!(
!(!(
!(
!(
!(!(
!(
!(!(
!(
!(
!(
!(
!( !(
!(!(
!(!(
!(
!(
!(!(
!(
!(
!(!(
!(!(
!(!(
!(
!(!(!(
!(
!(!(!(
!(!(
!(!(
!(
!(!(
!(!(!(!(!(!(
!(!(!(!(!(!(
!(
!(!(!(!(
!(!(
!(
!(
!(
!(!(
!(
!(
!(
!(!(
!(!(
!( !( !(!(!(!(
!(
!(!(
!(!(!(
!(
!(!(!(
!(!(!(
!(!(
!(!(!(!(
!(!(
!(!(!(
!(
!(!(
!(
!(
!(
!(
!(!(!(!(!(!(
!(
!(
!(
!(!(!( !(!(
!(!(!(!(!(!(
!( !(
!(
!(
!(
!(!(
!(
!(
!(!(!(
!(
!(!(
!(!(
!(
!(!(!(!(
!(
!(
!(
!(
!(!( !(
!(
!(
!(
!(!(!(
!(
!(!(
!(
!(!(
!(!(!(
!(!(
!(!(
!(!(
!(!(
!(
!(
!(
!(!(!(!(
!(!( !(!(
!(!(
!(
!(!(
!(!(
!(
!(
!(
!(!(
!(
!(!( !(
!(!(!(
!(
!(!(!(
!(!(!(
!(
!(!(
!(
!(
!(
!(
!(!(!(
!(!( !(
!(
!(
!(!( !(!(
!(
!( !(
!(
!(
!(!( !(!(
!(
!(
!(
!(!(!(
!(
!(
!(
!(
!(!(
!(
!(!(!(!(!(
!(
!(
!(!(!(!( !(!(!(
!(
!(
!(
!(
!(
!(
!(
!(
!(
!(
!(
!(
!(!(!(
!(
!(
!(!(
!(
!(!( !(
!(
!(
!(
!(
!(
!(
!(!(
!(
!(
!(
!(
!(!(
!(
!(
!(
!(
!(!(
!(
!(!(!(!(
!(
!(
!(!(
!(!(
!(
!(!(
!(!(
!(
!(
!(!(
!(!(!(
!(
!(!(
!(
!(
!(!(!(
!(
!(!(
!(!(!(
!(!(
!(!(!(
!(
!(!(!(
!(
!(
!(!(
!(!(!(
!(
!(!(
!(
!(
!(
!(
!(!(!(
!(
!(!(!(!(
!(!(
!(
!(
!(!(!(!(
!(
!(!(
!(
!(
!(
!(
!(!(!(
!(
!(
!(!(!(
!(!(!(
!( !(
!(!(!(
!(
!(
!(!(
!(
!(!(!(!(!(!(!(!(
!(
!( !(!(
!(!(!(
!( !( !(!(!(!(
!(
!(!(!(
!(!(
!(!(
!(!(!(
!(
!(
!(!(
!(
!(
!(!(!(!(
!(!(
!(!(!(
!(
!(
!(!(
!(!(!(
!(
!(
!(
!(!(!(
!(!( !(!(!(!(
!(!(!(!(!(!( !(
!(!(
!(!(!(
!(!( !(
!(
!(!(
!(
!(
!( !(
!(
!(!(
!(!( !(!(
!( !(!(
!(!(
!( !(
!(
!(!(
!(!(!( !(
!( !(!( !(!(!(!( !(!(!(!(
!(!(
!(
!(!(
!( !(
!(!(!(!(
!(
!(
!( !(!( !(
!( !(
!(!(!(
!(
!(!(
!(
!( !(!(
!(
!( !(
!(!(
!(!(!(
!(
!(
!(!(!(
!(!(
!(
!(
!(
!(
!(
!(!(!(
!( !(
!(!(!(
!(!(!( !(
!( !(!(
!(!(
!(!( !(
!(
!(
!( !(
!( !(!(
!(!(
!(!(
!(!( !(!( !(
!(!(!(
!(!(
!(
!(!(
!(!(
!(
!( !(
!(!(!( !(!(!( !( !(
!(
!(!(
!(!(
!(!( !(!(
!(!(
!(
!(!(!( !(
!(!(!(
!(
!(
!( !(
!(!(!(!(!(!(!(
!(!(
!(!(
!(!(
!(!(
!(
!(
!(!(
!(
!( !(!(
!(
!(
!(
!(!(!(
!(!(!(!(
!(
!( !(
!(
!( !(
!(
!(
!(!(!(
!(!(!(
!(!( !(!(!(!(
!(
!( !(!(
!(
!(!(!(!(
!(
!( !(
!(!(
!(!(!(
!(
!(!(
!(!(
!(!(
!(
!(
!( !(!( !(!( !(!( !(
!( !(!(!(!( !(!(
!(!( !(!(
!(
!(!(!(
!(!(
!(!(!(!(!(
!(
!(!(!(
!(
!(!(
!(
!(
!(
!(
!(!(
!(!(
!(!(!(!(
!(
!(
!(
!(!(
!(!(!(!(!(
!(!(!(!(
!(!(
!(!(
!(!( !(
!(!(
!(!(
!(
!(!( !( !(!(!(!( !(
!(!(!(
!(
!(!(
!(!(!(
!(!(!(!(!(
!(!(!(
!(!(!(
!( !(!( !(!( !(!(
!(!(
!(
!(!(!(
!(!(
!(
!(!(
!(!(
!( !(
!(
!(!(
!(
!(
!(!(
!(
!(
!(
!(
!( !(!(
!(!(
!( !(!(!(
!(!(!(
!( !(
!(
!(
!(
!(!(!(!(
!(
!(
!(
!(
!(
!(
!(
!(
!(
!( !(
!(!(
!(!( !(
!(
!( !(!(
!(!(!(
!(
!(
!(
!(!(
!(
!(
!(
!(
!( !(!(
!(
!(!(
!(
!(!(
!( !(!(
!(
!(
!(
!(
!(
!(!(
!(
!(
!(
!(
!(
!(
!(
!(
!(!(
!(
!(
!(!(
!(
!(
!(
!(
!(
!(
!(!(!(
!(
!(
!(
!(
!(
!(!(
!(!(!(
!(
!(
!(
!(
!(
!(
!(!(
!(
!(
!(
!(
!(
!(
!(
!(
!(!( !(
!(
!(
!(
!(
!(
!(
!(!(
!(!(!(
!(
!(
!(
!(
!(
!(!(
!(
!(!(
!(
!(!(!(!(
!(!(
!(
!( !(
!(!(!(!(!(
!(!(
!(!(!(!(
!(!( !(
!(
!(!(!(!(!(
!(
!(
!(
!(!(!(
!(!(!(
!(!(
!(!(
!(
!(
!(
!(
!(
!(
!(
!(!(
!(!(
!(!(
!(
!(
!(
!(
!(
!(
!(
!(
!(!(
!(
!(
!(
!(!(!(!(
!(!(!(!(
!(
!(
!(
!(!(
!(
!(
!(
!(
!(
!(
!(
!(
!(
!(
!(
!(!(
!(!(
!(
!(!(
!(
!(
!(
!(
!(
!(
!(
!(
!(!( !( !(!( !(
!(
!(!( !(
!(!(
!(!(
!(!(
!(
!(
!(
!(
!(
!( !(!(
!(
!(
!(!(!(
!(!(
!(
!(
!(!(
!(
!(
!(
!(
!(
!(
!(!(
!(
!(!(
!(
!(!(!(
!( !(
!(
!(!(
!(!(!(
!(
!(!(!(!(
!(!(
!(
!(!(!(
!(
!(
!(
!(!(
!(
!(!(
!(!(!(
!(
!(
!(
!(
!(!(
!(!(
!(!(
!(
!(!(
!(
!(
!(!(
!(
!(
!(
!(
!(
!(
!(
!(!(!(!(
!(
!(!(!(!(!(
!(
!(!(
!(
!(!(
!(!(
!(
!(
!(
!(
!(
!(
!(
!(
!(!(!(
!(
!(!(
!(
!(
!(
!(
!(!(!(
!(
!(
!(
!(!(
!(!(
!(
!(
!(
!(!(!(
!(
!(!(
!(
!(!(!(
!(
!(
!(
!(
!(
!(
!(!(
!(
!(
!(
!(
!(
!(
!(!(
!(
!(!(
!(!(!(!(
!(!(!(!(
!(
!(
!(
!(
!(!(!(!(!(
!(!(!(
!(!(
!(!(!(!(
!(
!(!(
!(!(
!(!(
!(!(
!(
!(
!(!(!(
!(!(!(!(!(
!(
!( !(
!(!(!(!(!(
!(!(!(!(!(!(
!(!(!(!(
!(
!(
!(!(
!(
!(
!(
!(!(!(!(
!(!(
!(!(!(!(!(
!(
!(!(
!(
!(
!(
!(
!(!(!(!(!(!(!(!(
!(!(!(!(
!(!(
!(
!(!(!(!(
!(!( !(!(
!(!(
!(
!(!(
!(
!(!(
!(
!(!(
!(!(
!(
!(!(!(
!(!(!(!(!(!( !(
!(!( !(
!(
!(
!(!(
!( !(!(
!( !(
!(!(!(!(
!(
!(!(
!( !(!(
!(
!(
!(!(!(!(!(
!(
!(
!(
!(!(!(!(
!(
!(!( !(!(
!(
!(
!(
!(
!(!(!(!(
!(!(!(
!( !(
!(!(
!(
!(
!(
!(
!(
!(
!(
!(!(
!(
!(
!(
!(
!(
!(
!(
!(
!(!(
!(
!( !(!(
!(!(!(
!(
!( !(
!(!(
!(
!(!(
!(!(!(!(
!(!(
!(
!(
!(
!(
!(
!(!(
!(
!(
!(!(!(!(!(
!(
!(
!(!(
!(!(
!(!(!(!(!(
!(!(
!(
!(
!(
!(!(!(
!(!(
!(!(
!(!(!(!(
!(
!(!(
!(!(!(
!(
!(
!(
!(
!(!(
!(!(!(
!(
!(!(!(
!(!(!(!(!(!(!(!(!(!(
!(
!(!(!(
!(
!(!(
!(
!(
!(
!(
!(!(
!(
!(
!(
!(
!(
!(
!(!(!(
!(!(!(
!( !(
!(
!(
!(
!(!(!( !(!(!(
!(!(
!(
!(!(
!(
!(!(
!(!(
!(!(!(
!(
!(!(!(
!(!(
!(
!(!(!(
!(
!(!(!(!(
!(
!(!(
!(!(!(!(!(!(
!(
!(
!( !(!(
!(!(!(
!(
!(!(!(
!(
!(!(
!(!(
!(
!(
!(
!(!(
!(
!(!(!(
!(
!(
!(
!(!(!(
!(!(!(!(
!(!(!(
!(!(!(
!(!(
!(
!(!(
!(!(
!(
!(
!(
!(
!(
!(!(!(!(
!(
!(!(
!(!(!(
!(
!( !(!(!(
!(!(!(!(!(!(
!(
!(
!(!(
!(
!(
!(
!(
!(!(
!(
!( !(
!(
!(
!(!(
!(
!(
!(!(
!(
!(!(
!(!(
!(!(!(!(!(
!(!(
!(!(!(
!(
!(!(!(
!(
!(!(
!(!(
!(
!( !(!(
!(!(
!(!(!(!(
!(!(
!(!(!(
!(!(!(
!(
!(
!(!(!(!(!(
!(!(
!(!(
!(!(
!(
!(!(!(
!(
!(!(
!(
!( !(!(
!(!(
!( !(!(
!(!(!(
!(
!(
!(
!(
!(
!(
!(!(
!(!(!(
!(
!(
!(
!(
!(!(!(
!(
!(
!(!( !(!(
!(!(!(!(!(
!(!(
!(
!(
!(
!(!(!(
!(!(
!(!(
!(
!(!(
!(
!(
!(
!(
!(
!(!(
!(
!(!(
!(
!(
!(!(!(!(!(
!(
!(!(!(
!(!(!(
!(!(!(
!(!(!(
!(!(
!(!(
!(
!(!(!(
!(!(!(
!(!(
!(
!(
!(
!(!(
!(
!(!(
!(
!(!(
!(
!(
!(!(
!(!(!(
!(!(!(
!(!(
!(
!(
!(
!(!(!(
!(!(
!( !(!(
!(!(!(
!(
!(
!(
!(
!(!(!(
!(!(!(!(!(!(
!(!(
!(!( !(
!(
!(
!(!(!(!(
!(
!( !(
!( !(!(!(
!(!(!(
!(!(
!(!(
!(!(
!(
!(
!(
!(
!(
!(
!(!(
!(
!(
!(!(
!(!( !(!(
!(!(
!(!(!(
!(!(
!(
!(!(
!(!(
!(!(
!(
!(!(
!(!(
!(!(
!(
!( !(!(
!(!(!(!(
!(!(
!(!(
!( !(!(!(!(
!(!(!(
!(
!(!(
!(
!(
!(
!(!(!(
!(
!(
!(
!(!(
!(
!(
!(
!(!(
!(
!(
!(!(
!(!(!(!(
!( !( !(!(
!(
!(
!(
!(
!( !( !(
!(
!( !(!(!(
!(
!( !(!(
!(
!(!(
!(
!(!(!(!(
!(!(!(
!(
!(
!(!(
!(
!(!(
!(
!(
!(
!(
!(
!(
!(
!(
!( !(!(
!(!(!(!(
!(
!(
!(
!(
!(
!(
!(
!(!(
!(
!(
!(!(
!(
!(!(
!(!(
!(
!(
!(
!(
!(
!(
!(
!(!(!(!(
!(
!(!(
!(
!(!(
!(
!(!(!(
!(!(
!(!(
!(
!( !(!(
!(!(
!(!(
!( !(
!(!(
!(
!(!(
!(
!(
!(
!(
!(
!(!(!( !(
!(!(
!(
!(!(!(!(!(!(
!(!(
!(
!(!(
!(
!(!(
!(
!( !(!(
!(!(!(!(!(
!(!(
!(
!( !(
!(!(
!(
!(
!(
!(!(!(
!(
!(
!(!(!(!(
!(
!(
!(
!(!(
!(!(
!( !(
!(!(!(!(
!(!(!(
!(
!(!(
!(
!(!(!(!(
!(!(
!(
!( !(
!(
!(
!(!(!(!(
!(
!(!(
!(
!(
!(!(
!(!(!(!(
!(
!(
!(!(
!(
!(!(!(!(!(!(
!(
!(!(!(
!(!(
!(
!(
!(!(
!(!(!(
!(
!(!(
!(
!(!(!(!(
!(
!(
!(
!(
!(!(
!( !(
!(!(
!(!(
!( !(
!(
!(
!(
!(!(!(
!(
!(!(
!(!(
!(
!(
!(
!(!(
!(
!(
!(
!(
!(!(
!(!(!(!(
!(
!(
!(
!(
!(
!(
!(
!(!(
!(
!(
!(
!(
!(!(
!(
!(
!(
!(
!(!(
!(!(
!(!(
!(
!(
!(!(
!(
!(
!(
!( !(!(!( !(!(!(!(
!(
!(
!( !(
!( !(!(
!(
!(!(
!(
!(
!(!(
!(
!(
!(
!(!(
!(!(
!(
!(
!(
!(
!(
!(
!(
!(
!(!( !(
!(!(!(
!(!(
!(!(
!(
!(
!(
!(
!(
!(
!(
!(!(
!(
!(!(
!(!( !(
!(
!(!(
!(
!(
!(
!(
!(
!(
!(!(!(
!(
!(
!(
!(
!(!(!(
!(
!(
!(!(
!(
!(
!(
!(
!(
!(!(
!(!(
!(
!(!(!(!(!( !(
!(
!(
!(
!(
!(!(
!(!(!(
!(!(
!(!(
!(!(
!(!(
!(!(
!(
!(
!(!(
!(
!(!(
!(
!(!( !(!(
!(
!( !(!(!(!(
!(
!(
!(
!(
!(
!(
!(
!(
!(
!(
!(
!(
!(
!(!(
!(!(!(
!(!(!(
!(
!(!(
!(
!(
!(
!( !(
!(
!(
!( !(
!(
!(
!(
!(
!(
!(!(
!(!(!(
!(
!(!(
!(!(
!(
!(
!(
!(!(
!(!(!(
!(
!(
!( !(
!(
!(
!(!(
!(!(
!(
!(
!(
!(
!(
!(
!(
!(
!(
!(
!(
!(
!(
!(
!(
!(
!(!(
!(!(
!(
!(
!(
!(
!(!(
!(
!(!(
!(
!(
!(
!(
!(
!(!(
!(!(
!(
!(
!(
!(
!(
!(
!(
!(
!(!(
!(
!(
!(
!(!(
!(
!(!(
!(!(
!(
!(!(!(!(
!(
!(
!(
!(
!(!(
!(
!(!(
!(
!(
!(!(!(
!(
!(
!(!(
!(!(
!(!(
!(
!(
!(
!(!(
!(
!(
!(
!(
!(
!(
!(
!(
!(!(
!(!(!(
!(!(
!(!(
!(!(
!(
!(
!(!(
!(
!(
!(
!(!(
!(!(
!(!(!(
!(!(
!(
!(
!(!(
!(
!(!(
!(
!(!(
!(
!(
!(
!(
!(
!(!(!(
!(
!(!(
!(
!(
!(
!(
!(
!(
!(
!(
!(!(
!(!(
!(
!(
!(!(
!(
!(
!(
!(!(!(
!(
!(
!(
!(
!( !(
!(
!(!(
!(!(
!( !(
!(!(!(
!(
!(!(
!(!(!(!(
!(
!(
!(!(
!(!(!(
!(
!(!(
!(
!(
!(
!(!(!(
!(
!(!(
!(
!(
!(
!(
!(
!(
!(!(!(!(!(!(
!(!(
!(
!(!(
!(!(
!(!(
!(!(
!(!(
!(
!(
!(
!(
!(
!(!(
!(
!(
!(
!(
!(
!(
!(!(
!(
!(
!(
!(
!(
!(!(
!(
!(!(
!(!(
!(
!(
!(
!(
!(!(!(!(
!(!(!(
!(!(
!(
!(
!(
!(
!(
!(
!(
!(
!(
!(
!(!(!(
!(!( !(
!( !(!(!(
!(!(!(
!(
!(
!(
!(
!(
!(!(
!(
!(!(
!(
!(!(
!(!(!(
!(!(
!(
!(
!(!(!(
!(
!(
!(
!(
!(
!(!(
!(
!(
!(
!(!(!(!(
!(
!(
!(!(
!(!(
!(!(!(
!(
!(
!(
!(
!(
!(
!( !(
!(
!(!(!(!(!(
!(!(!(
!(
!(
!(
!(!(
!(!(
!(
!(
!(
!(!(!(!(
!(!(
!(
!(!(!(
!(!(
!(
!(
!(
!(!(
!(
!(
!(
!(
!(
!(!( !(!(
!(
!(
!( !(
!(!(
!(!(
!( !(!(
!(
!(!(
!(
!(
!(!(
!(
!(!(
!(!(
!(
!(
!(
!(
!(
!(!(
!(
!(!(!(
!(
!(
!( !(
!(!(
!(
!(
!(
!(
!(
!(
!(!(
!(
!(
!(
!(
!(
!(
!(
!(!( !(
VENTANILLA
CALLAO
260
256
258
361 350
257
254
345
255
261
266370
264
251
262
253
362
265
213-1
263
259
252
368 B
369 B
346-1
85 C
347-2
369 A
85 B-2
83 B-2
84 A-1
84 B-2
368 A-1
346-2
84 B-1
85 A
349 A-1
83 A-2
84 A-2
83 B-1
212 A-1
348 A
85 B-1
348 B-1
349 B-2
212 B-1
212 A-2
212 B-2
347-1
83 A-1
349 B-1349 B-3349 A-3
351-1
349 A-2
349 B-4
351-2
368 A-2
348 B-2
351-3
213-3
213-2
COMAS
SAN JUAN DE LURIGANCHO
CARABAYLLO
LOS OLIVOS
PUENTE PIEDRA
SAN MARTIN DE PORRES
INDEPENDENCIA
SAN MARTIN DE PORRES RIMAC
LURIGANCHO
OCEANO PACIFICO
AV CENTRAL
AV CHILL
ON
AV IN
DOAM
ERI C
A
AV PUNO
AV C
AV SA
NTA A
NA
AV CANTA CAL LAO
AV PE
RIME
TRAL
AV CA
RABA
YLLO
AV CH
ACRA
CERR
O
AV 1
AV OLI VO S, LOS
AV TANTAMAYO
AV UNGER, GERARDO
AV HE
ROES
DEL A
LTO C
ENEP
A
AV S
INCH
I ROC
A
A V S AN TA EL VIR A
A V R ET
ABLO
, EL
AV RIO M ARAÑON
AV SAN JOSE
AV MENDIOLA, ALFREDO
AV CUZCO
AV PA
RAM ONG A
AV REVOL UCION
AV 200 MILL
AS
AV SOL DE NA RANJAL
AV D
AV UNIVERSI TARIA
AV B
AV JUPITER
AV AL ISOS, LO S
AV LIM A
AV TA
ZA, L
A
AV PANAMERICANA NORTE
AV 17
AV SAN DIEGO DE ALCALA
A V SA N FE L IP E
AV PARIAHUANCA
AV METROPOLITANA
AV ACAPULCO
AV E
A V CON
DORC
A NQU I, M
ARIA NO
AV CONTISUYO
AV INDEPENDENCIA
AV P
ARA DO
DE B
ELLID
O, MARIA
AV 4
AV RIO TAMBO
AV INDUSTRI AL
AV INCAS, LO S
AV CHINCHAYSUYO
AV ACACI AS, LAS
AV HU
AYLA
S
AV FAM ES A
AV DOMIN ICOS , LOS
AV A
AV SAN REMO
AV T
UPA C
AM A
RU
AV RO SARIO, EL
AV SAN JUAN
AV S AN
MA TE
O
AV JAMAICA
AV MEXICO
AV MALECO N CHILLON
AV HU
ANDO
Y
AV A NGE LES , LOS
AV AR
TESA
NOS,
LOS
A V CEDR OS, LOS
AV SANG AR ARAAV UGARTE, ALFONSO
AV SOL DE ORO
AV J A Z MINES, LOS
AV PARRAL, EL
AV ECOLOG ICO
AV ZI NC, EL
AV ROSAL, EL
AV MI RAFLORES
AV DE SAN MARTIN, JOSE
AV CH
ASQ UIS
, LOS
AV MI RAM AR
AV RO SA LUZ
AV PACASMAYO
AV NOVIEMBRE, 1 7 DE
AV CANADA
AV L IBERTA D
AV SE TIEMBRE, 2 5 D E
AV EUCALIP T O S, L OS
AV NIÑOS M ARTIRES, LO S
AV R EG
LA, L A
A V CARRION , DA NIE L ALC IDES
AV SAN CARL OS
AV JA
CARA
NDA
AV HURIN CUZCO
A V M UJIC A GA LLO, MANUEL
AV 2
AV BOLOGNESI, FRANCISCO
AV HUANAC AURE
AV MANCO CA PA C
AV ANT UNEZ DE M AY OLO, SANTIAGO
AV CORICANCHA
AV OCTUBRE, 2 DE
AV TO RRES, L AS
AV N ARAN JAL, EL
AV PORTALES, LO S
A V REPU BL IC A DEL PERU
A V DIC
IEMBRE, 20 DE
AV COLECTORA
AV AGOS TO, 11 D E
AV FAUC ETT, EL MER
AV POM
A BAMB A
AV S
AN R
O QUE
AV SANTA MARIA ALTA
AV CONDORCANQ UI , JOSE G ABRIEL
AV VIRGEN DEL ROSARIO
A V ALA MOS , L OS
AV JUN IO, 15 DE
AV VA LLEJO, CES AR
A V G LO BO TE RR AQUEO
AV MILAGRO DE J ESUS
AV M AE STRO PERUA NO
A V SAN ENRI QUE
AV NEPTUNO
AV VENUS
AV AL
BORA
DA, L
A
AV VIRGEN DEL CARM EN
AV GON ZALES PR ADA, MAN UEL
AV 7
AV C
ENTE
NARI
O
AV P
IN OS,
LO
S
AV ROSA DE AMERI CA
AV T RA
P I CHE C
HIL LON
AV NARANJ AL
A V INTEG R ACI O N
AV U NION , LA
AV HUAMACHUCO
AV ENERO , 25 DE
A V O RQU ID EAS, LAS
A V PALMER AS, LA S
AV AM ANCAES, L OS
AV PERI FERICA
AV BERTELLO , AL EJANDRO
A V BERTELL O BOLL ATI, ALE
JAN DR O
AV AGOSTO, 22 DE
AV M
AYO,
11 D
E
AV OLI VAR, EL
AV BETANCOURT , R OMUL O
AV DE LA FUENTE, GUIL LERM O
AV VENCEDORES, L OS
AV PR AD O, M ANUEL
A V BA ST ID A S, MI CAELA
AV SAN ANTON IO
AV GAMB ETTA, CRNEL NESTOR
AV MONITOR
HUASCAR
AV ANT ISUYO
AV IZAGUI RRE, CARLOS ALBERTO
A V DE SA N MAR TIN, D ON JOSE
AV HONDURAS
AV PE RUANIDAD D E L A
A V TULIPANES, L OS
AV SA
NTA R
O SA
A V EST
ADOS
UNI
DOS
AV DE
L BIER
ZO
AV BENDEZU, WIL BER
AV MERINO REYNA
AV SAN JUAN MASIAS
AV SANTA CRUZ
A V BELAUNDE OESTE, VICTOR A
AV CHOCANO, J OSE SANTOS
AV J ULI
O, 1
DE
AV MAYO, 1 DE
AV PUNCHAUCA
AV P
LATI
NOS,
LOS
AV SAN PEDRO DE CARABAYLLO
A V SA
N A
LBINO
AV GUARDIA CIVIL
AV AG OSTO, 25 DE
AV SOL, EL
AV PROCERES, DE LOSAV OCTU BRE, 12 DE
AV CORDIALI DAD, LA
AV SEÑO R DE CAUDIVILLA
AV PROCERES, LOS
AV PARAISO
AV MARTIN, JUAN MANUEL
AV HAY A DE L A TORRE,
VICT OR R
AV COLECTOR COM AS
A V S A NTA AD ELA
AV CHIMPU OCLLO, ISABEL
AV S
AUCE
S, L
OS
AV TREBOL , EL
AV VIO LE TA S, LA S
AV IZAG UIRRE, CARLOS A
AV S AN
FRA
NCISC
O
AV S AN P EDR O
AV BOLOGNE SI, C RNL FRANCISCO
AV RESI DENCI AL
AV DE LA TO RRE UG ARTE, JOSE
AV CACERES, M RCAL ANDRES A
AV V ENEZUE LA
AV MA
GNO L
IAS, LA
S
AV AM ERICAS, LAS
AV L IB E RT AD , LA
AV JERUSALEN
AV CONFRAT ERNIDAD, LA
AV AL AMEDA DEL PI NAR
AV PALMA, RICARDO
AV SAN NICOLAS
AV HE RO
E S DE P
UCUT
A
AV OLA
YA, M
ARTIR JO
SE
AV DE L A
MU JE R PE RU AN A
AV JULIO, 28 DE
AV GRAU, ALM TE MIG UEL
AV VI LLA RR EAL , FE DERICO
AV M A LVIN AS, LAS
AV REPUBL ICA DE I SRAELAV SAN MART IN
AV PRINCIPAL
AV BEL AUNDE ESTE, VICTOR A
AV RE
PUBL
ICA DE
ARGE
NTINA
AV MERCURIO
AV BEL EN
AV ROBLES, LO S
AV A L
H ELI E
S, L OS
A V VALLE, TOMAS
AV MENDIOLA, ALFREDO
AV SAN CARLOS
AV NARANJ AL , EL
AV IZAG UIRRE, CARLOS ALBERTO
AV UN
IVE RS
I TA R
IA
AV MERINO REYNA
AV A
AV A
AV G
AMBE
TTA,
CRN
EL N
ESTO
R
A V S A
NTA ROS A
AV PANAMERICANA NORTE
AV SAN NICOLAS
AV SANTA RO SA
A V TUP
AC AM
ARU
AV CANTA CALLA O
A V SAN TA ROSA
AV MA
GNO LIA
S, LA
S
AV PROCERES, LOS
AV ANTISUYO
AV AL ISOS, LO S
AV C
AV CHILL ON
AV A
AV BOLOG NESI, CRNL FRANCI SCO
AV A
AV COLE
CTO RA
AV FAUCETT, ELMER
AV MENDIOLA, ALFREDO
AV CENTR
AL
AV C
AV S AUC ES, LOS
AV SAN TA ROSA
AV PANAMERICANA NORTE
AV PACASMAYO
A V RIO MA RA ÑONAV
RETA
BLO,
EL
AV IZAG UIRRE, CARLOS A
AV AL ISOS, LO S
AV AL ISOS, LO S
AV TO RRES, L AS
AV P
RINC
IPAL
AV T ORRES , LAS
AV SAN TA AN A
AV TRAPICHE CHIL LON
AV CANTA C ALLAO
A V CEDROS, LOS
AV SA
NTA R
O SA
AV SAN ENRI QUE
AV UNGER, GER A RD O
AV INDOAMERI CA
AV TU
PAC A
MARU
AV U
N IVE
RSIT
A RIA
AV MENDIOLA, ALFREDO
AV JAZM INES, LOS
AV AL ISOS, LO S
A V B ERT ELLO BOL LATI , ALE JANDRO
A V UN
I VER
SITA
RIA
A V M EN DIO LA , AL FR EDOAV NARANJAL, EL
AV PALMA, RICARDO
AV CUZ CO
AV CENTRAL
AV PA
CASM
AYO
AV PRINCIPAL
AV B
AV B
AV SANG AR ARA
AV P IN
OS, LO
S
AV MALECON CHILL ON
AV NARANJ AL
AV IZA G UIRRE, CARLOS A
AV TRAP
ICHE CHIL LON
AV DOM IN ICO S, LOS
AV C
AV A
AV E
AV UNGER, G ERARDO
A V P RINCIPAL
A V OL IVOS, LOS
AV PA
CASMAYO
AV IN
T EGR AC
ION
AV IN
TEG
RACI
ON
AV CA
RABA
YLLO
AV SANTA RO SA
AV AL ISOS, LO S
A V PAC
A SMA YO
AV SA
NTA R
O SA
AV I N DEP END ENCIA
AV 2
AV CONFRATERNIDAD, LA
AV ROSA DE AMERI CA
AV TU
PAC A
MARU
AV RE
TABL
O, EL
AV 200 M
I LLAS
AV SEÑOR DE CAU DIVILLA
AV C
ENTR
AL
AV CENTRAL
AV CA
NTA C
ALLA
O
A V H UA ND OY
AV PRADO, M ANUEL
AV SANTA RO SA
AV TORRES, L AS
AV M E ND IO LA, ALF RE DO
AV UNIVERSI TARIA
AV C
A V MAN CO CA PAC
AV SA
N FR
ANCIS
CO
AV CHOCANO, JOSE SANTOS
AV TUPAC A MAR U
AV PA
NAME
RICAN
A NOR
TE
AV ROSARIO, EL
AV VENUS
AV F AUCETT , ELM ER
AV C
AV C
H ACRA
C ERRO
A V C HIMPU O CLLO, ISABEL
AV C
ONDO
RCAN
QUI, JOSE GABRIEL
AV SAN DIEGO DE ALCALA
AV SAN PEDRO DE CA RA BA Y LLO
AV MENDIOLA, ALFREDO
A V UN GE R , GER AR DO
AV TUP
AC A
MARU
AV 2
AV PINOS, L OS
AV TO RRES, L AS
AV B
AV CENTRAL
AV 200 M ILLA S
AV B
AV P ARA DO DE BEL L IDO, MA RI
A
AV SANTA RO SA
AV LIM A
AV TU
PAC
AMAR
U
AV METROPOLITANA
AV TOR RES , L AS
A V U
NIVE
RSIT A
RIA
AV 1
AV SA N F ELI P E
AV AL ISOS, LO S
AV OC TUBRE, 1 2 DE
AV FAUCETT, ELMER
AV VALL EJO, CESAR
AV TOR RES , L
AS
AV SAN CARL OS
AV CORICANCHA
AV PALM ERA S, L ASAV A
AV BA V M END IO LA, AL FRE DO
AV PACASMAYOAV PLAT INOS, LOS
AV AG O ST O, 22 D E
AV B
AV SAUCES, L OS
AV B
AV UN
IVERS
I TARIA
AV CA
NTA C
ALLA
O
AV HU
ANDO
Y
AV U
N IVER SI T
A R IA
AV ROSA DE AMERI CA
AV B
AV SANTA ADELA
AV RE
TABL
O, EL
AV HU
AYLA
S
AV PERI METRAL
A V METROPOL ITA N A
AV A
AV A
AV PACASMAYO
AV EUCAL IPTOS, LOS AV CENTRAL
AV CANTA
CAL
LAO
AV SA N FELIP E
AV S ANGARA RA
AV CEDRO
S, L
OS
AV RE PU
B LI CA D
EL P
ERU
AV A
AV CANTA CAL LAO
AV A
AV CANTA CAL LAO
AV NARANJ AL
A V ME T RO P OL ITA N A
AV M
UJIC
A GA
LLO,
MAN
UEL
AV C
AV B
AV PINOS, L OS
AV DOM INICOS, L OS
AV S
AN J
OSE
A V M E ND IOL A, ALF RE DO
AV CANTA CALLAO
AV SAN
TA RO SA
AV SAUCES, L OS
AV TANTAM AYO
AV PACASMAYO
AV A
AV C
A RAB
AYL L
O
AV A
AV PANAMERICANA NORTE
AV 17
AV NARANJ AL
AV A
AV DOM IN ICO S, LOS
AV UNI VERSITARIA
AV JAZM INES, LOS
AV CENTR
AL
AV SA
N MA
TEO
AV C
ENTE
NARI
O
AV SANTA RO SA
AV B
AV REVOLUCIO N
AV SA N JUA N MAS IAS
AV UNGER, GERARDO
AV OLI VO S, LOS
AV JAMAICA
AV C
AV CHAC
RA CERRO
AV UN
IVERS
I TARIA
AV INCAS, LO S
AV IZAG UIRRE, CARLOS ALBERTO
AV INDUSTRI AL
AV ANG EL ES, LO S
270000
270000
275000
275000
280000
280000
285000
285000
8675
000
8675
000
8680
000
8680
000
8685
000
8685
000·
LEGEND
OPERATIONAL INCIDENTS!( 2009!( 2008!( 2007!( 2006
STUDY AREADISTRICT BOUNDARYSECTOR BOUNDARYROADSGREEN AREABLOCKSRIVERSCOAST
PROYEC TO :
GRAFICO 2.5.8-10: INCIDENCIAS OPERATIVAS EN CONEXIONESDE AGUA POTABLE 2006, 2007, 2008 Y 2009
SERVICIO DE AGUA POTABLE Y ALCANTARILLADO DE LIMAREPUBLICA DEL PERU
FIGURE 2.5.8-10: OPERATIONAL INCIDENTS ON POTABLEWATER CONNECTIONS 2006, 2007, 2008, AND 2009
1:50.000Proyection: UTMDatum: WGS-84
Zone: 18 sur
0 1 20,5km
2006 2007 2008 2009212 A 130 93 86 37 346212 B 95 92 69 25 281213 113 103 121 37 374253 0254 1 1256 0259 109 195 93 29 426345 3 4 7346 306 272 316 129 1023347 177 173 159 40 549348 A 16 21 9 10 56348 B 37 47 37 25 146349 A 85 60 88 37 270349 B 80 32 41 27 180350 279 236 274 80 869351 3 2 10 8 23361 21 29 50368 A 15 25 82 48 170368 B 23 8 31369 A 3 33 59 38 133369 B 1 29 20 50370 66 35 19 12 13283 A 73 90 107 34 30483 B 123 204 161 64 55284 A 71 128 143 36 37884 B 207 220 245 86 75885 A 45 41 47 31 16485 B 55 139 88 43 32585 C 42 97 116 50 305Total 2.131 2.341 2.448 983 7.903Percentage 27% 30% 31% 12% 100%
OPERATIONAL INCIDENCES IN WATER SUPPLY CONNECTIONSSector Corporation Total

VENTANILLA
CALLAO
260
256
258
361 350
257
254
345
255
261
266370
264
251
262
253
362
265
213-1
368 B
263
259
252
369 B
346-1
347-2
85 C
85 B-2
369 A
83 B-2
84 A-1
368 A-1
84 B-2
346-2
84 B-1
349 A-1
83 A-2
85 A
84 A-2
83 B-1
212 A-1
348 A 348 B-1
349 B-2
212 B-1
85 B-1
212 A-2
212 B-2
347-1 349 B-1
83 A-1
349 B-3349 A-3
349 A-2
349 B-4
351-1
368 A-2
351-2351-3
348 B-2
213-3
213-2
COMAS
SAN JUAN DE LURIGANCHO
CARABAYLLO
LOS OLIVOS
PUENTE PIEDRA
SAN MARTIN DE PORRES
INDEPENDENCIA
SAN MARTIN DE PORRES RIMAC
LURIGANCHO
OCEANO PACIFICO
AV CE NTRA L
AV CHILL
ON
AV IN
DOAM
ERIC
A
AV P UNO
AV C
AV S
ANTA
ANA
AV CANTA CALLAO
AV P
ERIM
ETRAL
AV C
ARAB
AYLL
O
AV C
HACR
A CER
RO
AV 1
AV O LIV OS , LOS
AV T ANTAMAYO
AV UNGER, G
ERARDO
AV H
EROE
S DEL
ALTO
CEN
EPA
AV S
INCH
I ROC
A
A V S A N TA E L VI RA
AV R
E TA B
LO, E
L
AV RIO M A RA ÑON
AV SAN JOSE
AV MENDIOLA , A LF REDO
AV C
UZC O
AV PAR AMONGA
A V R E VO LUCIO N
A V 20 0 MI LL
A S
A V SOL DE NA RAN JA L
AV D
AV UNIVERS ITARIA
AV B
AV JUPIT ER
AV ALIS OS , LOS
AV LIM A
AV TA
Z A, LA
AV PANAMERICANA NORTE
AV 17
A V SAN DI EGO DE A LCA LA
AV SA N FE L IP E
AV PA RIA HUA NCA
AV METROPOLITANA
AV ACA P ULCO
AV E
AV C
OND OR
CANQ
UI, M
ARIA
NO
AV CONTISUYO
AV INDEPENDENCIA
AV PA
RADO DE BELL
IDO, MAR
IA
AV 4
AV RIO TAM
BO
AV INDUSTRIAL
AV INCA S, LO S
AV CH INCHA YS U YO
AV A CA CI A S, LA S
AV H
UAYL
AS
AV FA M ES A
AV D OM INIC OS , LOS
AV A
A V SA N RE MO
AV T
UPAC
AM
ARU
AV ROS ARIO , E L
AV S AN J UA N
AV S
AN M
ATEO
AV J AM A ICA
AV M E XICO
AV M
ALEC ON CHILL
ON
AV H
UAND
OY
A V ANG ELES , LO S
AV A
RTES
ANOS
, LO S
AV CED RO S, LOS
AV S ANG A RARAA V UGAR TE, A LFON SO
AV SOL DE ORO
AV JA ZMIN E S , LOS
AV P AR R AL , E L
AV E COLO GICO
AV ZINC, E L
AV RO SAL, EL
AV M IRAFLORES
AV DE SA N M ART IN, J OS E
AV C
HASQ
UIS ,
LOS
AV M IRA MA R
AV ROS A LU Z
AV PACASMAYO
AV NO VIE M BRE , 17 DE
AV CA NA DA
A V LIBE RT A D
AV S ET IE M BR E, 25 DE
AV EU CAL IP TO S, LO S
AV NIÑO S M A RT IRES , LOS
AV R
EGLA
, LA
AV CARR IO N, DANIEL AL CIDES
AV SAN CARLO S
AV JA
CARA
NDA
AV HURIN CUZCO
A V MU JI CA G ALLO
, MANUEL
AV 2
AV BOLOGNESI, FRANCISCO
AV HUA NA CAURE
AV MAN CO CAPA C
AV ANT UNE Z DE M AY OL O, S ANTIA GO
AV CO RICANCHA
AV O CTUB RE, 2 DE
AV TO RRES , LAS
A V N A RA NJAL , E L
AV P ORTA LE S , LO S
AV REPU BL IC A DE L PER U
A V DICIEM BR E, 20 D E
AV CO LE CTO RA
AV A GOSTO, 1 1 DE
AV F A UCE TT , EL ME R
AV PO MAB
A MBA
AV S
AN R
O Q UE
AV S ANTA MA R IA A LT A
AV CO ND ORCA NQ UI, J OSE G AB RIEL
AV V IRGEN DEL ROSARIO
AV ALAMO S, L OS
AV JUNIO, 15 DE
AV VALL EJO , CE SAR
AV GL O BO
T E R RA Q U E O
AV M ILAG RO D E JESUS
A V M AE STRO P E RU ANO
A V S AN E NRIQUE
AV NE PT UNO
AV VENUS
AV AL
BORA
DA, L
A
AV VI RG EN DE L CA R M EN
AV GONZALE S P RADA, MA NUE L
AV 7
AV C
ENTE
NARI
O
A V PIN
OS ,
L O
S
AV ROSA DE AM
ERICA
AV TR
APICHE
CHIL LON
AV NARANJAL
AV IN TEG RA CIO N
AV U N IO N, L A
AV HUAMACHUCO
AV E NER O, 25 DE
AV O RQUIDEAS , LAS
A V PALME RAS , LAS
AV AM A NCA ES , LOS
AV PERIF ERICA
AV BERT ELLO, A LE JANDRO
AV BERT ELLO B O
LL AT I, AL E JA N DRO
AV AG OS TO, 22 DE
AV M
AYO,
11 D
E
AV O LIVAR, E L
A V BET AN COU RT, R OMU LO
A V DE LA FUENT E, GUIL LE R MO
AV VE NCED ORE S, L OS
AV P RA DO , M A NUE L
A V B AS TID A S, MICAELA
AV SAN A NTO NIO
A V G AMBETT A , CRNE L NES TOR
AV MONITO
R HUASCAR
AV ANT ISUYO
AV IZA GUIR RE, CA RLOS A LBE RTO
AV D E SAN MAR TIN, DO N JOSE
AV HO NDURAS
A V PE RU AN IDAD DE LA
AV TUL IP AN ES, LO S
AV S
ANTA
RO SA
A V ES T
A DO
S UN
IDOS
AV B END EZU, W ILBE R
AV MERINO RE YN A
AV SAN JUAN MAS IAS
AV SANTA CRUZ
AV BELAUN DE O ESTE, VICTO R A
AV CHO CAN O, JOS E SANTOS
AV JULI
O, 1
DE
AV MAYO, 1
DE
AV PUNCHAUCA
AV P
LATI
NOS ,
LOS
AV SAN PEDRO DE CARABAYLLO
AV S
AN A LBIN O
AV G UARDIA CIV IL
AV AG OSTO, 25 DE
A V S OL , EL
AV PROCERES, DE LOSA V OC TUBRE , 12 DE
AV CO RDIALIDAD, LA
A V SE ÑOR DE CAUD IV ILL A
AV P ROCE RE S, LOS
AV PA RA ISO
AV MARTIN, JUAN MANUEL
AV HA Y A DE LA
TORRE, V
IC TO R R
AV CO LE CTO R COM AS
AV SANT A AD ELA
A V CH IMP U O C L LO , ISA BE L
AV S
AUC
ES, L
OS
AV TREBOL, EL
AV V IOL E T AS , L A S
AV IZA GUIRRE , CA RLO S A
AV S AN
F RANC
ISCO
AV S AN P E DR O
AV BO LO G NESI, C RNL FRAN CI SCO
AV RESIDENCIAL
AV DE LA TORRE UGA RTE , JOS E
AV CA CE RES , MRCA L A NDRE S A
AV VEN EZU ELA
AV M
AGNO
LIAS ,
LAS
AV AM E RICAS , LAS
A V L I BE RTAD , LA
A V JE R U SALEN
AV CO NFR ATE R NID AD , LA
AV ALAMEDA DEL PINAR
A V PAL MA, R IC AR DO
AV SAN NICO LAS
AV HER
OE S DE P
UCUT
A
AV OLA
YA, MARTIR JO
SE
AV DE L
A MU JE R PER UAN A
AV SANT ISI MA C RU Z DE S AN D IE GO
A V G RAU, A LM T E MIG UEL
AV VILLAR RE AL, FE DER ICO
AV M AL VI NAS , LAS
AV RE PU BLICA DE ISRA E L
AV S A N MA RT IN
AV PRINCIPAL
AV B ELA UNDE ES TE , VICTO R A
AV R
EPU B
LICA D
E ARG
ENTIN
A
AV M ER CURIO
AV BELEN
AV RO BLE S, LO S
AV A
LHEL
IE S, LO
S
AV VAL LE, T OMAS
AV MENDIOLA , A LF REDO
AV SA N C ARLOS
A V NARA NJA L, E L
AV IZA GUIRRE , CA RLO S A LBE RTO
AV U
N IVER
S ITA
RIA
AV M E RINO RE YNA
AV A
AV A
AV G
AMBE
TTA,
CR N
EL N
EST O
R
AV S
AN
TA R OS A
AV PANAMERICANA NORTE
AV SAN NICO LAS
AV SANTA RO SA
AV T
UPAC
AMA R
U
AV CAN TA CAL LAO
A V S ANT A R OSA
AV M
A GNO LIA
S, LA
S
AV PR OCERE S, LO S
AV AN TI SUY O
AV ALIS OS , LOS
AV C
AV CHILLON
AV A
AV B OLO GNE SI, CRNL FRA NCIS CO
AV A
AV COLEC TOR A
AV FA UCET T, E LM E R
AV C ENTRAL
AV C
AV SA U C ES, LOS
AV SA NT A ROS A
AV PANAMERICANA NORTE
AV PACASMAYO
A V RIO MAR AÑONAV
RET
ABLO
, EL
AV IZA GUIRRE , CA RLO S A
AV ALIS OS , LOS
AV ALIS OS , LOS
AV TO RRES , LAS
AV PRINCIPAL
AV TORR E S, L AS
AV S ANTA ANA
AV TRAP ICHE CHILLON
AV CA NTA C AL LAO
AV C EDR OS, L OS
AV S
ANTA
RO SA
AV SAN ENRIQUE
AV U N G ER , GERA RDO
AV INDO AMERICA
AV TU
PAC
AMAR
U
AV U
N IV
ERSI
TAR I
A
AV MENDIOLA , A LF REDO
A V JA ZM INE S, LOS
AV ALIS OS , LOS
AV B ERTEL LO BOL LATI, ALE JAN DRO
A V UNI
VERS
I TA R
I A
A V ME N D IO L A, A LF R ED OAV NARA NJA L, E L
AV PALMA, RICARDO
AV C U ZCO
AV CENTRAL
AV P
A CAS
MAY O
AV PRINCIPA L
AV B
AV S ANG A RARA
AV P IN
O S, L OS
A V M ALECON CHILLO N
AV NARANJAL
A V IZA G UIRRE , CA RLOS A
AV TRAP ICHE CHILLON
AV DO MINICOS, LO S
AV C
AV A
AV E
AV S ANG A RARA
AV UNG ER, G ERARDO
A V O LIV OS, LOS
AV PA
CASMAY
O
AV IN
T EGR AC
ION
AV IN
TEGR
ACIO
N
AV C
ARAB
AYLL
O
AV SANTA RO SA
AV ALIS OS , LOS
AV P
ACAS
MAYO
AV S
ANTA
RO SA
AV IN DEP ENDE N CI A
AV 2
AV CO NFRATE RNIDA D, LA
AV RO SA DE AME RICA
AV TU
PAC
AMAR
U
AV R
ETAB
LO, E
L
AV 200 MILLAS
AV SEÑOR D E CA UD IVI LLA
AV C
ENTR
AL
AV CENTRAL
AV C
ANTA
CAL
LAO
A V H UA ND OY
AV PR AD O, M ANUE L
AV S ANTA RO SA
AV TORRES , LAS
A V M E ND IO L A , A L FR E DO
AV UNIVERS ITARIA
AV C
AV MA NC O C A P AC
AV S
AN F
RANCIS
CO
AV CHO CANO , JOSE SANTO S
AV T UPAC AMARU
AV PA
NAMERICANA N
ORTE
A V ROS ARIO, EL
AV VENUS
AV F AU C ETT, E LM ER
AV C
A V CH
ACRA
CER
RO
AV CHIMPU OCLLO, I SABEL
AV SAN DIEGO DE ALCALA
AV SAN PEDRO D E C ARA BA Y LLO
AV MENDIOLA , A LF REDO
AV UNGER , GE RA R D O
AV T U
P AC
A MAR
U
AV 2
AV P INOS , LOS
AV B
AV CE NTRA L
A V 200 M ILL AS
AV B
AV PARAD O DE B EL L IDO , M
ARIA
AV S ANTA RO SA
AV LIM A
AV T
UPAC
AM AR
U
AV METROPOLITANA
AV U
NIVE
RSIT
A RI A
AV 1
A V S AN FE LIP E
AV A LIS OS , LOS
AV OCTUBRE, 12 DE
AV FA UCET T, E LM E R
AV VA LLEJ O, CE SA R
A V TOR RES, L
A S
AV SA N CARLO S
AV PALMER AS, LA SAV A
AV BAV M E N DI OL A , A L FR E D O
AV PACASMAYO
AV P LATINOS , LOS
AV AGOSTO, 22 D E
AV B
AV SAUCES , LOS
AV B
AV U
NIVE
RSITA
RIA
AV P
RINC
IPAL
AV C
ANTA
CAL
LAO
AV H
UAND
OY
A V U
N IVE
RSIT A RI
A
AV ROSA DE AM
ERICA
AV SANTA ADELA
AV R
ETAB
LO, E
L
AV H
UAYL
AS
AV PERIMETRAL
A V METROPOL ITAN A
AV A
AV A
AV PACASMAYO
AV EUCALIPTOS , LOS AV CE NTRA L
AV CANTA C
ALLA
O
A V SAN F EL IPE
AV SANG AR ARA
AV C EDR OS, L
O S
A V R EP
UBLIC
A DEL
PER
U
AV A
AV CA NTA C ALLAO
AV A
AV CANTA CALLAO
AV NARANJAL
AV M
UJI C
A G A
L LO ,
MA N
UEL
AV C
AV B
A V P INO S, LO S
AV DOMINICO S, LOS
AV S
AN J
OSE
A V ME N D IO
L A, A LF R ED O
AV CAN TA C A LLA O
AV SANTA RO SA
AV SAUC ES , LOS
AV TAN TAMAYO
AV PACASMAYO
AV A
AV C
A RA B
A YLL
O
AV A
AV PANAMERICANA NORTE
AV 17
AV N ARANJA L
AV A
AV DO MINICOS , L OS
AV INDO AMERICAA V UNIVE RSIT ARIA
AV J AZ MINE S , LO S
AV CENTRAL
AV C
ENTE
NARI
O
AV S ANTA RO SA
AV B
AV RE V OLUCIO N
A V SA N J UA N MA SIA S
AV UNGER, G
ERARDO
AV O LIV OS , LOS
AV C
AV CHACRA C ERRO
AV U
NIVER
S ITARIA
AV INCA S, LO S
AV INDUSTRIAL
A V A NG ELE S, L OS
AV O LIVAR, E L
270000
270000
275000
275000
280000
280000
285000
285000
8675
000
8675
000
8680
000
8680
000
8685
000
8685
000·
LEGEND
SUPPLY HOURS3 Hours5 Hours7 Hours8 Hours12 Hours24 Hours
STUDY AREADISTRICT BOUNDARYSECTOR BOUNDARYROADSGREEN AREABLOCKSRIVERSCOAST
PROYECTO : GRAFICO_2.5.8-11: CONTINUIDAD DE SERVICIO
SERVICIO DE AGUA POTABLE Y ALCANTARILLADO DE LIMAREPUBLICA DEL PERU
FIGURE_2.5.8-11: SERVICE CONTINUITY1:50,000Proyection: UTM
Datum: WGS-84Zone: 18 sur
0 1 20.5km
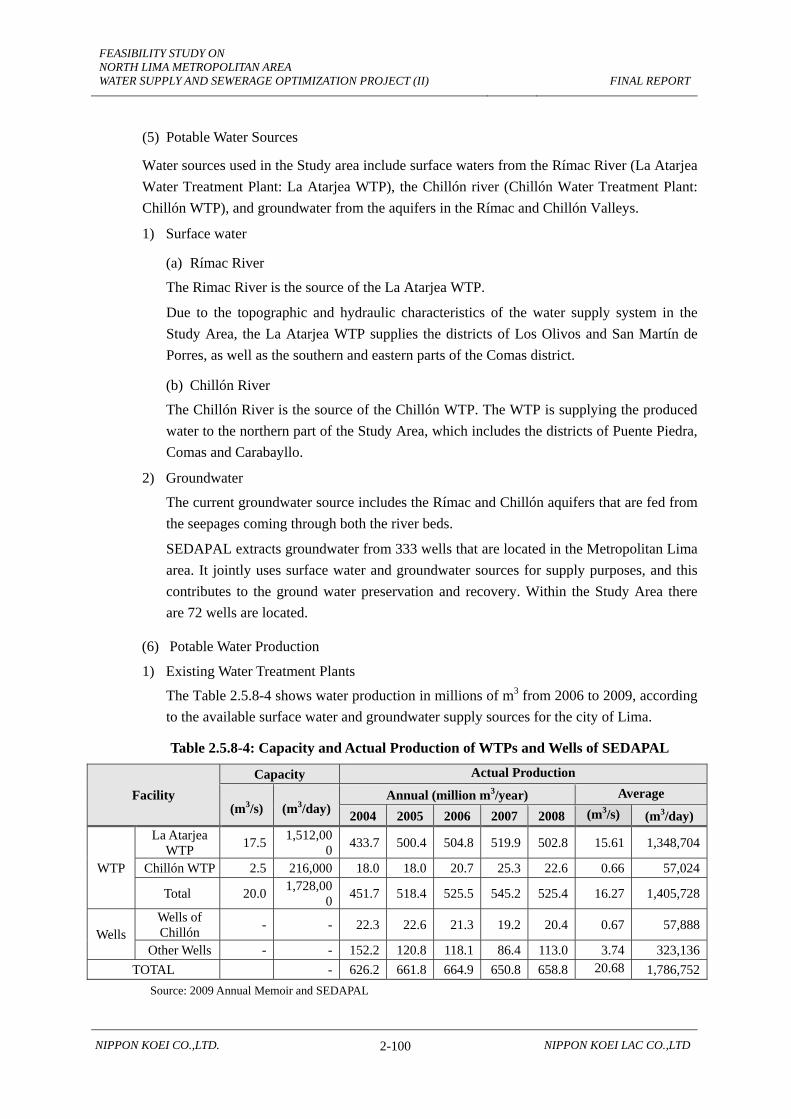
FEASIBILITY STUDY ON NORTH LIMA METROPOLITAN AREA WATER SUPPLY AND SEWERAGE OPTIMIZATION PROJECT (II)
FINAL REPORT
NIPPON KOEI CO.,LTD. 2-100 NIPPON KOEI LAC CO.,LTD
(5) Potable Water Sources
Water sources used in the Study area include surface waters from the Rímac River (La Atarjea Water Treatment Plant: La Atarjea WTP), the Chillón river (Chillón Water Treatment Plant: Chillón WTP), and groundwater from the aquifers in the Rímac and Chillón Valleys.
1) Surface water
(a) Rímac River
The Rimac River is the source of the La Atarjea WTP.
Due to the topographic and hydraulic characteristics of the water supply system in the Study Area, the La Atarjea WTP supplies the districts of Los Olivos and San Martín de Porres, as well as the southern and eastern parts of the Comas district.
(b) Chillón River
The Chillón River is the source of the Chillón WTP. The WTP is supplying the produced water to the northern part of the Study Area, which includes the districts of Puente Piedra, Comas and Carabayllo.
2) Groundwater
The current groundwater source includes the Rímac and Chillón aquifers that are fed from the seepages coming through both the river beds.
SEDAPAL extracts groundwater from 333 wells that are located in the Metropolitan Lima area. It jointly uses surface water and groundwater sources for supply purposes, and this contributes to the ground water preservation and recovery. Within the Study Area there are 72 wells are located.
(6) Potable Water Production
1) Existing Water Treatment Plants
The Table 2.5.8-4 shows water production in millions of m3 from 2006 to 2009, according to the available surface water and groundwater supply sources for the city of Lima.
Table 2.5.8-4: Capacity and Actual Production of WTPs and Wells of SEDAPAL
Facility Capacity Actual Production
(m3/s)
(m3/day)
Annual (million m3/year) Average
2004 2005 2006 2007 2008 (m3/s) (m3/day)
WTP
La Atarjea WTP 17.5 1,512,00
0 433.7 500.4 504.8 519.9 502.8 15.61 1,348,704
Chillón WTP 2.5 216,000 18.0 18.0 20.7 25.3 22.6 0.66 57,024
Total 20.0 1,728,000 451.7 518.4 525.5 545.2 525.4 16.27 1,405,728
Wells Wells of Chillón - - 22.3 22.6 21.3 19.2 20.4 0.67 57,888
Other Wells - - 152.2 120.8 118.1 86.4 113.0 3.74 323,136TOTAL - 626.2 661.8 664.9 650.8 658.8 20.68 1,786,752
Source: 2009 Annual Memoir and SEDAPAL

FEASIBILITY STUDY ON NORTH LIMA METROPOLITAN AREA WATER SUPPLY AND SEWERAGE OPTIMIZATION PROJECT (II)
FINAL REPORT
NIPPON KOEI CO.,LTD. 2-101 NIPPON KOEI LAC CO.,LTD
(a) La Atarjea Water Treatment Plant
The La Atarjea Water Treatment Plant (La Atarjea WTP) has two intakes, and their intake capacities are 15 and 20 m3/s. Water treatment is carried out at 2 plants in the WTP, with a total combined capacity of 17.5 m3/s.
(b) Chillón Water Treatment Plant
The Chillón Water Treatment Plant (Chillón WTP) was built between the years 2000 and 2002, and it is currently being operated by the Italian Agua Azul Consortium S.A., under BOT (Build, Operate, and Transfer) for a 25–year-period. The Chillón WTP has a nominal capacity of 2.5 m3/s during the flood season.
In the dry season, the Chillón WTP does not operate well due to insufficient river flow; therefore, water to its distribution area is supplied by 28 wells located in the Punchauca area which have a total capacity of 1 m3/s.
The Chillón WTP is expected to supply water to a target area of the project known as the “Potable Water and Sewerage System Extension and Enhancement for the Pachacutec Macro Project-Ventanilla District”.
2) Enhancement of Chillón WTP, Construction of Huachipa WTP
(a) Necessity of Enlargement of Production Capacity
As described above, water is currently supplied to the Study Area by the two WTPs and by wells. However, SEDAPAL is facing some difficulties in water production. The main problems with water production can be summarized as follows:
• In the dry season, production of the Chillón WTP is not enough to meet the demand in its distribution area because of insufficient flow of the river.
• Apart from low flow in the dry season, the total current capacity of water production has been evaluated and found insufficient to meet the future demand.
• There are dozens of wells in the North Lima Area apart from the wells of Chillón, and this underground water is expected to supplement the lack of water supply, especially during dry season. However, many of the wells have problems with low water quality. (Concentration of NO3 and NO2 tend to be higher than drinking water standards.)
(b) Construction Plan
In order to solve or mitigate the problems above, SEDAPAL is constructing the Huachipa WTP under the “Huachipa Water Treatment Plant Project-Lima North Main,” funded by JICA. In addition, SEDAPAL has planned some other projects to increase water production, and they have announced their intention to execute some of the projects in the “2009 Master Plan” (Plan Maestro 2009) as shown below:

FEASIBILITY STUDY ON NORTH LIMA METROPOLITAN AREA WATER SUPPLY AND SEWERAGE OPTIMIZATION PROJECT (II)
FINAL REPORT
NIPPON KOEI CO.,LTD. 2-102 NIPPON KOEI LAC CO.,LTD
Table 2.5.8-5: Outline of the Projects for Production Mentioned in the 2009 Master Plan
Project Outline
Remarks Capacity Progress Schedule of completion (m3/s) (m3/day)
Huachipa WTP
Phase-1 5.0 432,000 Recently completed 2010 To send water to the
North Lima Area
Phase-2 5.0 432,000 Master Plan 2021 To send water to the
South Lima Area
Chillón WTP
Gangay Reservoir Project
- - Master Plan -
To achieve stable production of 2.0m3/s.
La Atarjea WTP
Blanco River Project (Marca II)
4.0 345,600 Master Plan -
To divert water from the Yauli River basin to the Rimac River basin
Lima South Water Project
100,224 Master
Plan Master Plan -
Source: JICA Study Team
(c) Huachipa Water Treatment Plant
The Huachipa Water Treatment Plant (Huachipa WTP) is located in the Lurigancho district. It has 18.73 ha of area at an elevation of 396 m.a.s.l. Its water source is the Rímac River, similar to the La Atarjea WTP, but it is located upstream of the La Atarjea WTP.
Construction is planned in two phases. The capacity of the WTP shall be 5.0m3/s in the first phase, and it will be enhanced to 10.0m3/s after the second phase.
The first phase is being executed through the JBIC PE-P30 loan, and was completed in 2010. The second phase is scheduled to be completed in 2021, according to 2009 Master Plan. In the first phase, the plant will supply water to the North Lima Area, including the areas of the Lima Norte I Project and the Lima Norte II Project. In the second phase, the plant will supply water to the South Lima area.
The distribution area of the Huachipa WTP (Phase-1) is illustrated in Figure 2.5.8-12. The distribution area covers project areas of Lima Norte I and Lima Norte II, to which the La Atarjea WTP and the Chillón WTP are currently supplying water. Table 2.5.8-6 presents sectors in the Study Area to be supplied by the Huachipa WTP, which is to be called the “Influence Area” in this Study.
(d) Risk of Water Production in Dry Season
It is noted that there is no comprehensive master plan of SEDAPAL currently exists to explain and present a clear vision on future water production, especially in the dry season, for their entire administration area.
The Huachipa WTP is planned to supply water to its command area, which will reduce the required amount from the Chillón WTP and the La Atarjea WTP, but there are also expansion projects of water supply networks by which the distribution areas of the Chillón and La Atarjea WTPs will be expanded. However, there is no explanation in SEDAPAL
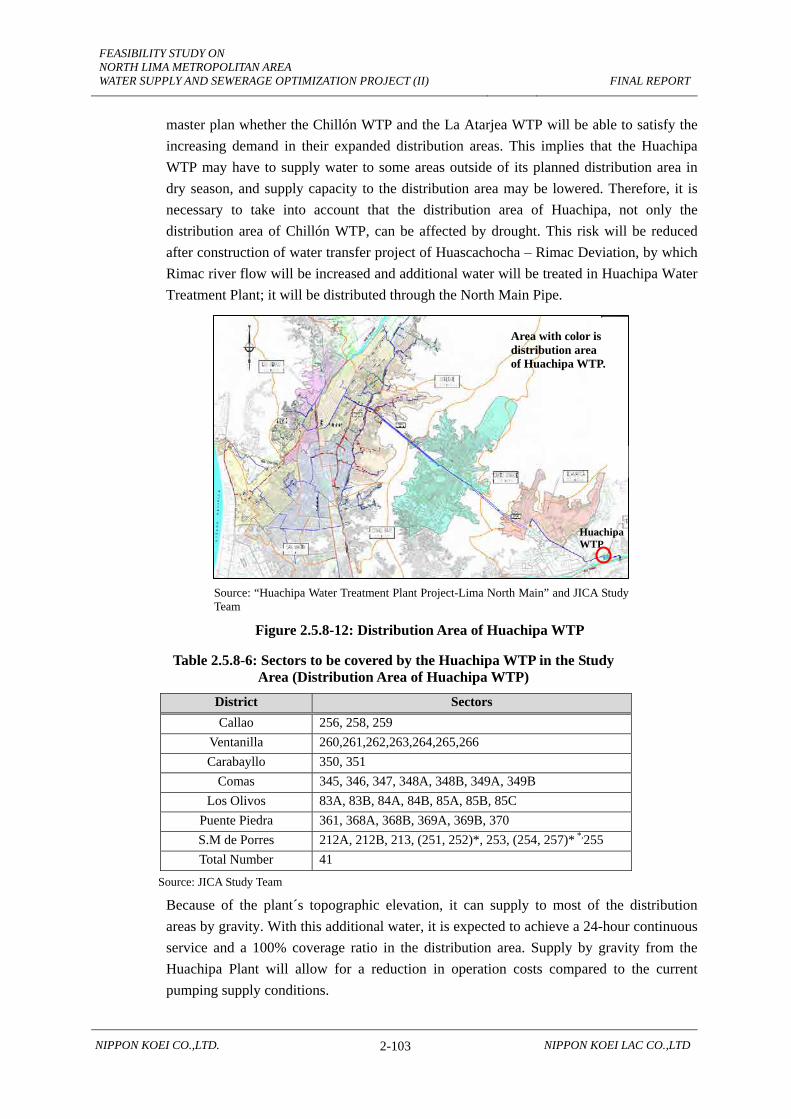
FEASIBILITY STUDY ON NORTH LIMA METROPOLITAN AREA WATER SUPPLY AND SEWERAGE OPTIMIZATION PROJECT (II)
FINAL REPORT
NIPPON KOEI CO.,LTD. 2-103 NIPPON KOEI LAC CO.,LTD
master plan whether the Chillón WTP and the La Atarjea WTP will be able to satisfy the increasing demand in their expanded distribution areas. This implies that the Huachipa WTP may have to supply water to some areas outside of its planned distribution area in dry season, and supply capacity to the distribution area may be lowered. Therefore, it is necessary to take into account that the distribution area of Huachipa, not only the distribution area of Chillón WTP, can be affected by drought. This risk will be reduced after construction of water transfer project of Huascachocha – Rimac Deviation, by which Rimac river flow will be increased and additional water will be treated in Huachipa Water Treatment Plant; it will be distributed through the North Main Pipe.
Source: “Huachipa Water Treatment Plant Project-Lima North Main” and JICA Study Team
Figure 2.5.8-12: Distribution Area of Huachipa WTP
Table 2.5.8-6: Sectors to be covered by the Huachipa WTP in the Study Area (Distribution Area of Huachipa WTP)
District Sectors Callao 256, 258, 259
Ventanilla 260,261,262,263,264,265,266 Carabayllo 350, 351
Comas 345, 346, 347, 348A, 348B, 349A, 349B Los Olivos 83A, 83B, 84A, 84B, 85A, 85B, 85C
Puente Piedra 361, 368A, 368B, 369A, 369B, 370 S.M de Porres 212A, 212B, 213, (251, 252)*, 253, (254, 257)* *,255 Total Number 41
Source: JICA Study Team
Because of the plant´s topographic elevation, it can supply to most of the distribution areas by gravity. With this additional water, it is expected to achieve a 24-hour continuous service and a 100% coverage ratio in the distribution area. Supply by gravity from the Huachipa Plant will allow for a reduction in operation costs compared to the current pumping supply conditions.
Huachipa WTP
Area with color is distribution area of Huachipa WTP.

FEASIBILITY STUDY ON NORTH LIMA METROPOLITAN AREA WATER SUPPLY AND SEWERAGE OPTIMIZATION PROJECT (II)
FINAL REPORT
NIPPON KOEI CO.,LTD. 2-104 NIPPON KOEI LAC CO.,LTD
(e) Other Construction Works
The project for the Chillón WTP is to construct the Gangay Reservoir, which will supply water to the WTP so that the WTP can consistently produce 2.0 m3/s. It has been mentioned that the project aims at increasing production to the Carabayllo District, but the storage capacity and schedule were not mentioned.
The Marca II Project is to increase the flow of the Rímac River, which sources the La Atarjea WTP. If executed, this project will make enhancement of La Atarjea possible. The South Lima Water Project is a project to construct a desalination plant to supply water to southern area of the Province of Lima.
As for the Marca II Project and the South Lima Water Project, locations and capacities are indicated in the 2009 Master Plan, but their schedules for implementation are not mentioned.
4) Water Production Problems
Through the diagnoses above, problems of the water production can be summarized as follows:
• Existing water treatment plants (WTPs) cannot always satisfy the demand because the productions of the WTPs diminish significantly in the dry season.
• A comprehensive study on demarcation of the WTPs’ distribution area is not available in SEDAPAL.
(7) Primary Networks
1) Type of Existing Pipes for Primary Networks
Primary networks are defined as transmission pipes which consist of i) main trunks which send water from water sources, ii) transmission branches which branch from the main trunks, and iii) other transmission pipes called “pumping lines” which send underground water from wells to reservoirs or superficial water from pumping chambers.
Table 2.5.8-7 shows the lengths of existing primary pipes in the Study area by sectors and materials. As presented in the table, there are four kinds of materials, which area asbestos cement pipe (AC), steel pipe (ACERO), ductile iron pipe (DI) and polyvinyl chloride pipe (PVC).

FEASIBILITY STUDY ON NORTH LIMA METROPOLITAN AREA WATER SUPPLY AND SEWERAGE OPTIMIZATION PROJECT (II)
FINAL REPORT
NIPPON KOEI CO.,LTD. 2-105 NIPPON KOEI LAC CO.,LTD
Table 2.5.8-7: Length of Existing Primary Pipeline by Sectors in the Study Area
Sector Subsector Type of Material TOTAL
(km) AC ACERO HD PVC
83 A 83 A-1 1.08 1.08 83 A-2 1.45 1.45
83 B 83 B-1 83 B-2 0.35 0.81 1.16
84 A 84 A-1 0.28 0.46 0.74 84 A-2 1.53 1.53
84 B 84 B-1 0.04 0.04 84 B-2
85 A 85 A 0.01 0.76 0.77 85 C 85 C 0.9 0.9
212 A 212 A-1 0.03 0.24 0.27 212 A-2 0.01 0.01 0.02
212 B 212 B-1 1.09 1.09 212 B-2 0.16 0.16
213 213-1 0.13 0.13 213-2 213-3
345 345 1.36 1.36
346 346-1 1.2 1.2 346-2 1.06 1.06
347 347-1 1.18 2.08 3.26 347-2 0.11 2.17 0.15 2.43
348 A 348 A 0.92 1.25 2.17
348 B 348 B-1 0.98 0.55 1.53 348 B-2 0.17 0.17
349 A 349 A-1 0.29 0.15 0.44 349 A-2 349 A-3
350 350-1 0.98 3.45 4.43 350-2 0.06 0.18 0.24
351 351-1 1.67 1.67 351-2 0.19 0.19 351-3 0.07 0.07
361 361 6.07 0.01 6.08
368 A 368 A-1 0.02 0.02 368 A-2
368 B 368 B 369 A 369 A 1.44 1.44 370 370 2.82 2.82
TOTAL 5.37 0.15 34.23 0.17 39.92 Source: JICA Study Team
2) Main Trunks
In the Study Area, there are four main trunks, which are the La Atarjea – Comas main, the La Atarjea – Los Olivos main, the Chillón – Comas main, and the Chillón – Los Olivos main as shown in Table 2.5.8-8. Locations of the main trunks were illustrated in Figure 2.5.8-2. They are monitored and controlled by SCADA system.
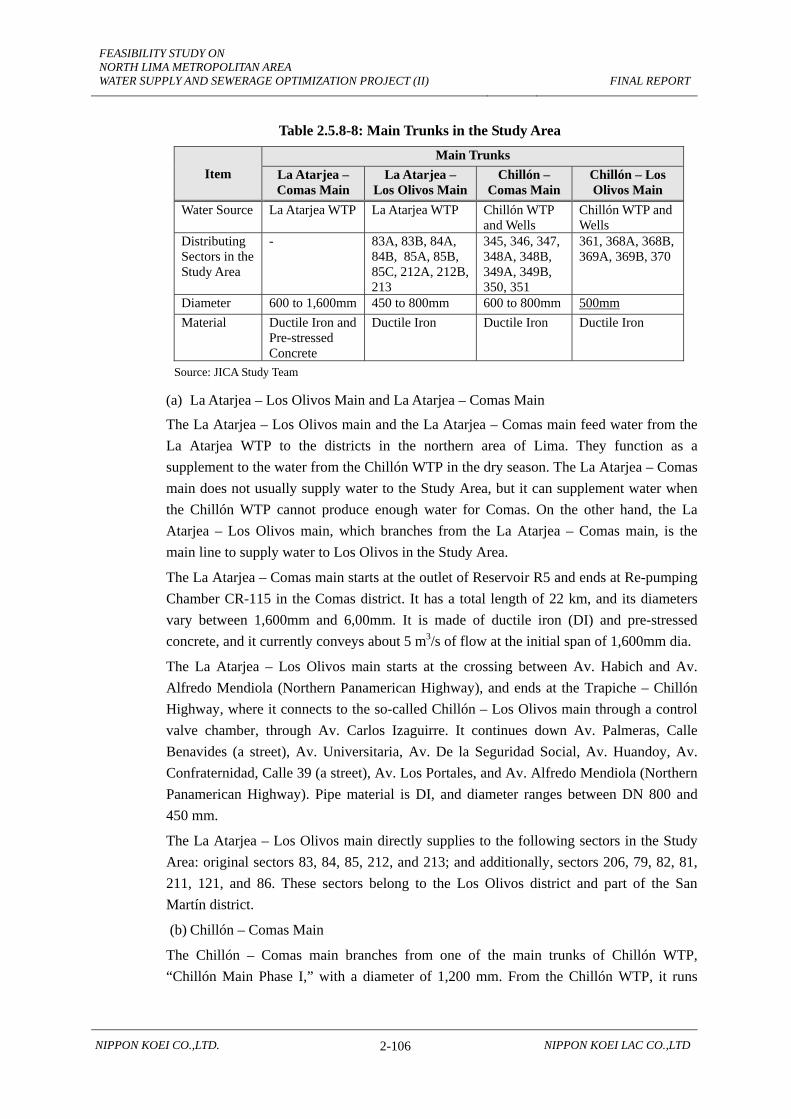
FEASIBILITY STUDY ON NORTH LIMA METROPOLITAN AREA WATER SUPPLY AND SEWERAGE OPTIMIZATION PROJECT (II)
FINAL REPORT
NIPPON KOEI CO.,LTD. 2-106 NIPPON KOEI LAC CO.,LTD
Table 2.5.8-8: Main Trunks in the Study Area
Item Main Trunks
La Atarjea – Comas Main
La Atarjea – Los Olivos Main
Chillón – Comas Main
Chillón – Los Olivos Main
Water Source La Atarjea WTP La Atarjea WTP Chillón WTP and Wells
Chillón WTP and Wells
Distributing Sectors in the Study Area
- 83A, 83B, 84A, 84B, 85A, 85B, 85C, 212A, 212B, 213
345, 346, 347, 348A, 348B, 349A, 349B, 350, 351
361, 368A, 368B, 369A, 369B, 370
Diameter 600 to 1,600mm 450 to 800mm 600 to 800mm 500mm Material Ductile Iron and
Pre-stressed Concrete
Ductile Iron Ductile Iron Ductile Iron
Source: JICA Study Team
(a) La Atarjea – Los Olivos Main and La Atarjea – Comas Main
The La Atarjea – Los Olivos main and the La Atarjea – Comas main feed water from the La Atarjea WTP to the districts in the northern area of Lima. They function as a supplement to the water from the Chillón WTP in the dry season. The La Atarjea – Comas main does not usually supply water to the Study Area, but it can supplement water when the Chillón WTP cannot produce enough water for Comas. On the other hand, the La Atarjea – Los Olivos main, which branches from the La Atarjea – Comas main, is the main line to supply water to Los Olivos in the Study Area.
The La Atarjea – Comas main starts at the outlet of Reservoir R5 and ends at Re-pumping Chamber CR-115 in the Comas district. It has a total length of 22 km, and its diameters vary between 1,600mm and 6,00mm. It is made of ductile iron (DI) and pre-stressed concrete, and it currently conveys about 5 m3/s of flow at the initial span of 1,600mm dia.
The La Atarjea – Los Olivos main starts at the crossing between Av. Habich and Av. Alfredo Mendiola (Northern Panamerican Highway), and ends at the Trapiche – Chillón Highway, where it connects to the so-called Chillón – Los Olivos main through a control valve chamber, through Av. Carlos Izaguirre. It continues down Av. Palmeras, Calle Benavides (a street), Av. Universitaria, Av. De la Seguridad Social, Av. Huandoy, Av. Confraternidad, Calle 39 (a street), Av. Los Portales, and Av. Alfredo Mendiola (Northern Panamerican Highway). Pipe material is DI, and diameter ranges between DN 800 and 450 mm.
The La Atarjea – Los Olivos main directly supplies to the following sectors in the Study Area: original sectors 83, 84, 85, 212, and 213; and additionally, sectors 206, 79, 82, 81, 211, 121, and 86. These sectors belong to the Los Olivos district and part of the San Martín district.
(b) Chillón – Comas Main
The Chillón – Comas main branches from one of the main trunks of Chillón WTP, “Chillón Main Phase I,” with a diameter of 1,200 mm. From the Chillón WTP, it runs

FEASIBILITY STUDY ON NORTH LIMA METROPOLITAN AREA WATER SUPPLY AND SEWERAGE OPTIMIZATION PROJECT (II)
FINAL REPORT
NIPPON KOEI CO.,LTD. 2-107 NIPPON KOEI LAC CO.,LTD
along Av. Túpac Amaru and ends at the CRP-2 pressure reducing chamber, where it joins the existing La Atarjea – Comas main at the CR-155 re-pumping chamber. It has a diameter ranging between 800 mm and 600 mm, a capacity of 1m3/s, and a length of about 8.8 km. It is made of DI.
Water flow from the Chillón – Comas main is not measured, but that of the “Chillón Main Phase I” is approximately 1,000 l/s in flood season and 400 l/s during dry season.
This water main uses gravity, and it feeds the Carabayllo district and part of the Comas district, namely, the Collique and Año Nuevo areas. The main feeds sectors 345, 346, 347, 348A, 348B, 349A and 349B in the Comas district and 350 and 351 in the Carabayllo district. These are part of this study. Sector 349 is fed by sector 348 through successive re-pumping.
(c) Chillón – Los Olivos Main
The Chillón – Los Olivos main branches from one of the main trunks of the Chillón WTP, the “Chillón Main Phase II,” with a diameter of 1,000 mm. From the Chillón WTP at the Northern Panamerican Highway, it runs along the Northern Panamerican Highway down to the Trapiche – Chillón highway crossing, where it joins the Los Olivos main through a DN 500 mm CDI control valve chamber.
This main also receives water from five wells: Ca-1, Ca-2, Ca-8, Ca-11, and Ca-12. Pipelines from these wells are joined to the water main through a control valve and pressure sustainer chamber. These wells supply the project area during low water seasons.
Water flow for the Chillón – Comas main is not measured, but that of the “Chillón Main Phase II” is approximately 1,500 l/s in flood season and 600 l/s during dry season.
In order to reduce pressure, the Chillón – Los Olivos main has 2 pressure reducing chambers, CRP-5 and CRP-6, and 4 major diversions.
At present, this water main supplies water to sectors 361, 362, 368A, 368B, 369A, 369B and 370 in the Puente Piedra district, which are parts of this Study’s area.
3) Other Primary Pipes
Apart from the main trunks above, there are primary pipes called “transmission lines” which branch from the main trunks, and “pumping lines” which send underground water from wells to reservoirs or send water from booster pumping stations.
“Transmission lines” are made of DI. The “pumping lines”, on the other hand, are made of various materials: asbestos cement piping (AC) is used for the pipeline to sector 259 (Márquez); polyvinyl chloride pipe (PVC) is used for pipelines to the high part of Collique, as well as the pumping lines from the wells (out of service) to the reservoir in the Los Olivos sector; and DI is used for pipelines to sector 350 in Carabayllo and sectors 368A, 368B, 369A and 369B in Puente Piedra.
4) Condition of Primary Network
According to the Primary Distribution Unit (Equipo de Distribución Primaria, or EDP) staff, no incidents have been reported on main trunks made of DI or on other

FEASIBILITY STUDY ON NORTH LIMA METROPOLITAN AREA WATER SUPPLY AND SEWERAGE OPTIMIZATION PROJECT (II)
FINAL REPORT
NIPPON KOEI CO.,LTD. 2-108 NIPPON KOEI LAC CO.,LTD
“transmission lines” made of DI. The AC pipeline to sector 259 is in poor condition: diversions have been made to users along its route and illegal connections might have been installed; it crosses private land; and some of its spans have been installed on the surface or at shallow depth. However, this line will not be used after the Project because new primary pipeline is planned to be installed in the Project to receive water from the Huachipa WTP.
Service pressure is not currently controlled properly in some areas because of fluctuation in the pressure of the primary network. However, the Project will solve this problem because the service pressure will be regulated by the reservoir.
5) Plan of Primary Network after commencement of the Huachipa WTP
(a) General Concept in Establishing Primary Network from Huachipa WTP
After the Huachipa WTP begins operation, most of the Study Area (the Area of Influence) will receive water from the WTP. Therefore, it is necessary to restructure the existing primary network so that the WTP can send the water to the area.
In parallel with the Huachipa WTP, the construction works of the main trunk from the WTP and main reservoirs are also being executed. The primary network to the Influence Area will be established through a combination of the facilities under construction, the existing primary networks described above, and a new primary network to be constructed in the Project.
(b) Plan for Main Trunk from Huachipa WTP in “Huachipa Water Treatment Plant Project-Lima North Main”
Figure 2.5.8-13 and Table 2.5.8-9 show the water distribution plan for the Huachipa WTP in the first phase. Planned distribution to Lima Norte I and II is 2.9m3/s in total. Water demand in each area of Lima Norte I and II is still not clear in SEDAPAL, but they can be estimated to be about 0.8 m3/s and 2.1 m3/s, respectively.

FEASIBILITY STUDY ON NORTH LIMA METROPOLITAN AREA WATER SUPPLY AND SEWERAGE OPTIMIZATION PROJECT (II)
FINAL REPORT
NIPPON KOEI CO.,LTD. 2-109 NIPPON KOEI LAC CO.,LTD
Source: “Huachipa Water Treatment Plant Project-Lima North Main”
Figure 2.5.8-13: Plan for Main Trunk from Huachipa WTP
Table 2.5.8-9: Planned Distribution of Water Produced at Huachipa WTP
Area Planned Volume Remarks Jicamarca 0.3m3/s -
Canto Grande 1.8m3/s - Comas Bajo 0.8m3/s
North Lima Norte I and II Collique 0.3 m3/s Los Olivos 0.7 m3/s San Martín 1.1m3/s Lima Norte II Sub-total 2.9m3/s Lima Norte I and II TOTAL 5.0m3/s -
Remarks: Water demand in the areas of North Lima I and North Lima II are not clear but can be estimated as about 0.8m3/s and 2.1m3/s, respectively.
Source: “Huachipa Water Treatment Plant Project-Lima North Main”
(8) Reservoirs and Pumping Stations
1) Reservoirs and Pumping Stations in the Study Area
In the Study Area, there are 63 reservoirs and 16 of them have pumping stations beside. Apart from them, there are 2 reservoirs under construction and 2 independent pumping stations. Within these, 38 reservoirs (14 of which have pumping stations) have been rehabilitated or to be rehabilitated by other projects. As for 2 of the 14 reservoirs with pumping stations, however, only reservoirs were rehabilitated and rehabilitation of their pumping stations were not carried out.
Jicamarca: 0.3m3/s
Canto Grande: 1.8m3/s
Collique: 0.7m3/s
Comas Bajo: 0.8m3/s San Martín: 1.1m3/s
Los Olivos: 0.3m3/s
Huachipa WTP
1
23
4
Main Reservoirs 1234 : RPA-7 (for San Martín
and Los Olivos)
: RRN-3 (for Collique)
: RRN-4 (for Comas Bajo)
: RRN-1 (for Jicamarca)
5.0m3/s

FEASIBILITY STUDY ON NORTH LIMA METROPOLITAN AREA WATER SUPPLY AND SEWERAGE OPTIMIZATION PROJECT (II)
FINAL REPORT
NIPPON KOEI CO.,LTD. 2-110 NIPPON KOEI LAC CO.,LTD
There are 23 reservoirs which are not operating but 7 of them are already or scheduled to be rehabilitated by other projects. Most of the non-operating reservoirs are located in Los Olivos (13 reservoirs) and San Martín de Porres (4 reservoirs), and none of them are scheduled to be rehabilitated. Those reservoirs were constructed to store groundwater from wells and then distribute, but now SEDAPAL is distributing water directly from La Atarjea to the area. Most of the reservoirs are not connected to the primary network from La Atarjea at present.
Table 2.5.8-10 summarizes the reservoirs and pumping stations in the Study Area. The JST appointed Consultant carried out a site survey of structure and electromechanical equipment. Survey covered the reservoirs and pumping stations for which there is no intervention planned by other projects. Results of the surveys are explained in the following, and more detailed information about the surveys is given in Appendix A4.
2) Objectives of Diagnosis and the Survey Activities
The objectives of the diagnosis are to evaluate the present conditions of the existing reservoirs and pumping stations and to recommend necessary actions so that the target facilities can recover or maintain their functions. The activities included in the diagnosis are site inspection and evaluation of i) the structures and ii) the electromechanical equipment.
The current conditions and evaluation of the controlling and operating system for the reservoirs and pumping stations is presented in diagnosis of “(11) Automation and SCADA System”.
3) General Evaluation
Generally, the reservoir structures need some repairs in order to avoid any contamination of stored water and to facilitate maintenance works, though re-construction is not necessary. Regarding electromechanical equipment, for reservoirs not currently operated are required to be replaced before beginning any operations.

Table 2.5.8-10: Reservoirs and Pumping Stations in the Study Area and their Existing Conditions
Project* Status of the Project
83A-1 R-800 VILLA SOL R-1 without 1300 97,00 103,00 74,66 Elevado RESERVA - -83A-2 R-801 VILLA DEL NORTE R-1 without 1800 99,08 105,08 68,58 Elevado RESERVA - -83B-1 R-996 PARQUE DEL NARANJAL R-1 without 1400 89,70 101,00 63,50 Elevado RESERVA - -83B-2 - CUETO FERNANDINI R-1 without 1500 82,50 87,50 58,90 Elevado RESERVA - -84A-1 - OLIVOS DE PRO R-1 without 1500 128,10 135,05 128,10 Apoyado RESERVA - -84A-2 - PROGRAMA CONFRATERNIDAD R-2 without 1600 99,50 107,95 78,50 Elevado RESERVA - -84B-1 - PROGRAMA CONFRATERNIDAD R-1 without 1600 97,25 105,50 71,00 Elevado RESERVA - -
- COMITÉ APOSTE without 500 85,71 90,51 59,35 Elevado RESERVA - -- PATRIA NUEVA R-1 without 70 97,20 100,70 87,00 Elevado OPERATIVO - -
85A 85A R-805 PUERTA DE PRO R-1 without 1100 109,70 117,70 109,70 Apoyado RESERVA - -85B-1 - RIO SANTA R-1 without 570 106,50 112,00 88,50 Elevado RESERVA - -85B-2 R-997 PRO (shared with 85C) without 1900 128,04 RESERVA - -85B-3 R-802 SANTA LUISA R-1 without 500 114,64 121,64 93,49 Elevado RESERVA - -
85C 85C R-997 PRO (shared with 85B-2) without 1900 128,04 RESERVA - -212A-1 R-986 VIRGEN DE LAS NIEVES R-4 without 1500 64,85 69,85 32,25 Elevado RESERVA - -212A-2 - VIRGEN DEL ROSARIO R-1 without 1200 67,85 72,35 48,85 Elevado RESERVA - -212B-1 - ROSARIO DEL NORTE R-3 without 1200 66,90 71,70 44,90 Elevado RESERVA - -212B-2 - JAZMINES DE NARANJAL R-2 without 1200 65,70 70,20 46,70 Elevado RESERVA - -213-1 CR-243 VIPOL NARANJAL R-1 WITH 1900 96,00 102,00 - Apoyado OPERATIVO - -213-2 - CERRO EL CHOCLO R-2 without 100 101,00 104,85 81,00 Elevado OPERATIVO - -213-3 - CERRO EL CHOCLO R-1 without 100 115,00 118,85 100,00 Elevado OPERATIVO - -
259 259 R-522 MARQUEZ R-522 without 1200 36,00 42,50 - Apoyado OPERATIVO - -345 345 - ALAMEDA DEL PINAR R-1 without 1300 177,00 183,25 150,00 Elevado OPERATIVO B Being executed
- El Manantial R-1 without 1100 140,80 143,70 - Apoyado INOPERATIVO A Being executed- El Manantial R-2 without 1100 140,80 143,70 - Apoyado INOPERATIVO A Being executed
346-2 - EL PINAR R-1 without 1200 184,65 192,05 150,00 Elevado OPERATIVO B Being executed347-1 R-918 SAN FELIPE R-1 without 670 200,34 207,39 - Apoyado OPERATIVO B Being executed
- LA ALBORADA R-2 without 1200 185,97 192,77 162,97 Elevado OPERATIVO B Being executed- ALBORADA R-1 without 1200 186,25 192,05 155,15 Elevado OPERATIVO B Being executed
348A R-921 COLLIQUE R-1 WITH 1100 218,00 - - Apoyado OPERATIVO B Being executed348B-1 R-922 COLLIQUE R-2 WITH 1500 248,00 - - Apoyado OPERATIVO B and E Being executed348B-2 RE-01 RE-01 without 100 OPERATIVO B Being executed349A-1 R-923 COLLIQUE R-3 WITH 1100 276,00 281,50 276,00 Apoyado OPERATIVO B Being executed
CR-76** Cisterna - OPERATIVO - -R-927 NVA. ESPERANZA R-1 without 400 340,00 344,00 340,00 Apoyado OPERATIVO - -
349A-3 R-924 COLLIQUE R-4 WITH 1000 307,00 312,87 - Apoyado OPERATIVO B Being executed349B-1 R-925 COLLIQUE R-5 WITH 800 340,00 347,18 340,00 Apoyado OPERATIVO E Being executed349B-2 R-926 COLLIQUE R-6 WITH 800 370,00 376,56 370,00 Apoyado OPERATIVO - -349B-3 R-820 COLLIQUE R-7 without 550 430,00 434,70 430,00 Apoyado OPERATIVO - -
- - COLLIQUE R-8 without 100 Apoyado OPERATIVO F Executed (2009)350-1 R-934 SANTA ISABEL R-1 WITH 1400 197,72 203,22 - Apoyado OPERATIVO B Being executed350-2 R-935 SANTA ISABEL R-2 WITH 1500 197,84 203,40 - Apoyado OPERATIVO B Being executed
RP-1 LOS ANGELES R-1 without 400 225,00 230,30 - Apoyado OPERATIVO B Being executedRP-02 LOS ANGELES R-2 without 150 280,00 283,90 - Apoyado OPERATIVO G Executed (2006)
351-2 RP-3 LOS ANGELES R-3 without 100 315,00 319,00 - Apoyado OPERATIVO - -351-3 RP-4 LOS ANGELES R-4 without 100 280,00 283,00 - Apoyado OPERATIVO - -
361 361 R-RP-1 LA CAPITANIA PAMPA GALLINAZO RP-1 without 1000 195,00 200,00 - Apoyado RESERVA C Being executed368A-1 RPA-6 RPA-6 WITH 2000 130 136,4 - Apoyado OPERATIVO D Executed (2008)
RPA-1 RPA-1 without 500 116 122,4 - Apoyado OPERATIVO D Executed (2008)CR-2** Cisterna - 30 262,6 OPERATIVO D Executed (2008)
368B RPA-2 RPA-2 WITH 1500 160 167,65 - Apoyado OPERATIVO D Executed (2008)368B R-820 RP-17 without 100 190,00 193,55 - Apoyado OPERATIVO D Executed (2008)368B R-924 RPA-5 without 150 260,00 263,9 - Apoyado OPERATIVO D Executed (2008)368B R-925 RPA-4 WITH 200 225,00 228,9 - Apoyado OPERATIVO D Executed (2008)368B R-926 RPA-3 WITH 600 190,00 196,4 - Apoyado OPERATIVO D Executed (2008)368B RP-16 RP-16 without 100 225 228,55 - OPERATIVO D Executed (2008)369A RPA-17 RPA - 17 WITH 3000 168 175,3 - Apoyado OPERATIVO D Executed (2008)369B R-1 LADERAS DE CHILLON R-1 without 400 165,00 169,00 - Apoyado OPERATIVO D Executed (2008)369B R-2 LADERAS DE CHILLON R-2 WITH 200 196,00 199,00 - Apoyado OPERATIVO D Executed (2008)369B R-3 LADERAS DE CHILLON R-3 without 100 226,00 228,50 - Apoyado INOPERATIVO D Executed (2008)369B RP-11 RP-11 WITH 100 226,00 228,50 - Apoyado OPERATIVO D Executed (2008)369B RP-12 RP-12 without 250 263,50 268,50 - Apoyado OPERATIVO D Executed (2008)
- SHANGRILA R-1 without 500 164,50 168,00 - Apoyado INOPERATIVO C Being executed- SHANGRILA R-2 without 500 - - - Apoyado INOPERATIVO H Perfil
- - RRN-3 Reservorio Collique without 4000 340,00 Apoyado Under Construction B Being executed- - RRN-4 Reservorio Comas Bajo without 4000 155,00 Apoyado Under Construction B Being executed- - RP-2 Cerro Oquendo without 5000 72,50 79,70 - Apoyado INOPERATIVO B Being executed- - RP-1 Cerro Candela without 5000 86,50 93,70 - Apoyado INOPERATIVO B Being executed
* : A: Proyecto de optimizacion del suministro del agua potable y alcantarillado de Lima Norte (I), "Lima Norte I" B: Proyecto de Mejoramient Sanitario de las Areas Marginales de Lima Convenio de Prestamo Nº PE-30, Obras complementarias a los Lote 1, 2 y 3 C: Proyecto de Mejoramient Sanitario de las Areas Marginales de Lima Convenio de Prestamo Nº PE-30, Lote 7: Obras Redes Secundarias de Agua Potable y Alcantarillado del Sitrito de Puente Piedra D: Proyecto de Mejoramient Sanitario de las Areas Marginales de Lima Convenio de Prestamo Nº PE-30, Lote 10: Distrito de Puente Piedra, Obras Redes Secundarias de Agua Potable y Alcantarillado Esquemas Jardines Valle Chillon - La Ensenada - Asoc. De Vivienda Chillon E: Proyecto de Rehabilitacion de Reservorios y Cisternas dentro del Ambio del Centro de Servicios Comas F: Contrato de Obra Nº 023-2007-CW-3196-BIRF-SEDAPAL Ampliacion de redes de agua potable y alcantarillado mediente sistemas condominiales en diversos del Cono Norte, Paquete 2 G: L. P. Nº 0002-2005-CO-SEDAPAL Ampliacion y Mejoramiento de los Sistemas de Agua Potable y Alcantarillado del Esquema los Angeles, Casuarinas y Anexos del Distrito de Carabayllo H: Elaboracion del Estudio del Perfil del Proyecto de Ampliacion y Mejoramiento del System de Agua Potable y Alcantarillado del Esquema Cerro Las Animas y Anexos**: Independent pumping station
SAN MARTIN DE PORRES
370 370
COMAS
CARABAYLLO 351351-1
PTE. PIEDRA
368
368A-2
369
346-1
CARABAYLLO 347347-2
212B
213
CALLAO
COMAS346
Type of Structure Condition
Other Planned Projects to Intervene
District Sector Sub-Sector Code/Name
COMAS
348
349
349A-2
CARAB/ COMAS
350
Los Olivos
83A
83B
84A
84B84B-2
85B
SAN MARTIN DE PORRES
212A
With/WithoutPumping Station
Volume (m3)
Bottom Level (m)
Water Level (m)
Ground Level (m)
Source: JICA Study Team
FEASIBILITY STUDY ON NORTH LIMA METROPOLITAN AREA WATER SUPPLY AND SEWERAGE OPTIMIZATION PROJECT (II)
FINAL REPORT
NIPPON KOEI CO.,LTD. 2-112 NIPPON KOEI LAC CO.,LTD
4) Structural Conditions
(a) Introduction
A survey has been carried out in the Study to evaluate the current structural conditions of the existing reservoirs and pumping stations, determine whether the structures need re-construction or not, and propose necessary rehabilitation works. Diagnosis of the structures consists of evaluation of the main structures and their accessories so that proposal on rehabilitations can be made. Details of the diagnosis with pictures can be found in Appendix A4.
(b) Survey of Existing Structural Condition of Reservoir an Pumping Stations
In general, the structural survey did not find any serious damage on the structures or deterioration caused by permanent load, impact load, earthquake load, corrosion, or ground subsidence. Although some exposed and oxidized reinforcement and chipped concrete on some reservoirs, and some shrinkage cracks on every reservoir were observed, it was evaluated that these would not deteriorate the structural strength of the facilities and that they could be rehabilitated by conventional methods of repairing concrete structures.
(c) Proposal for Structure of Reservoirs and Pumping Stations
Considering that there found no serious damage and that the structures were constructed in 1980s or 1990s, all facilities are evaluated that they do not need reconstruction but rehabilitation is required to bring them into a proper operating condition and prolong their service lives.
Required rehabilitation will include repair of cracks, repair of exposed reinforcement and chipped concrete, interior water proofing of the tank, reinstallation of ladders for maintenance, exterior painting of reservoirs, constructing concrete pits for drain and overflow of the reservoirs and other accessories. In addition, pumping stations need rehabilitation such as repair of cracks and painting.
In the detailed design of the Project, the following activities are recommended to be implemented in order to detect the current function of the reservoirs and secure their continuous operation.
• Operational test of the reservoirs by filling the tanks with water (All reservoirs should be checked.)
• Detailed visual structure survey by which cracks (location and width) and other damages of the structures are to be detected in detail
• Detailed physical structural survey such as laboratory test of concrete strength with sample cores, check of bar arrangement by ladder, geotechnical survey, modeling of the structures and structural calculation for the reservoirs (Target facilities can be selected based on their scale and age.)
• Detailed design of rehabilitation works based on the result of visual structure survey
• Plan of strengthening method if the structural calculation find the necessities

FEASIBILITY STUDY ON NORTH LIMA METROPOLITAN AREA WATER SUPPLY AND SEWERAGE OPTIMIZATION PROJECT (II)
FINAL REPORT
NIPPON KOEI CO.,LTD. 2-113 NIPPON KOEI LAC CO.,LTD
5) Electromechanical Conditions
(a) Introduction
A field survey has been carried out in the Study to evaluate the current electromechanical equipment used in the reservoirs for the water supply and to identify any limitations.
The previous study (Perfil) of this Project identified that electromechanical components of 30 reservoirs and 5 pumping stations could be used, either in their current state or after rehabilitation. Under the current Study, the rehabilitation of 23 wells, 27 reservoirs and 4 pumping stations are defined. In table 2.5.8-11 the hydraulic installations to be rehabilitated are shown.
List of conditions of the electromechanical facilities is mentioned as following:
• Discharging pipes
Within 27 reservoirs taken into account, 22 of them have no discharging pipes installed. Only 5 reservoirs have discharging pipes already installed, but their outlet sluice valves do not have enough capacity as for SCADA system integration. Besides, macro-meters do not have necessary technology to be monitored by the SCADA system.
• Electrical panel
No reservoirs have power electric panel for valve control by actuator or SCADA system.
• Altitude valve
Only 5 reservoirs have altitude valves.
• Chlorination system
No reservoir has chlorination system
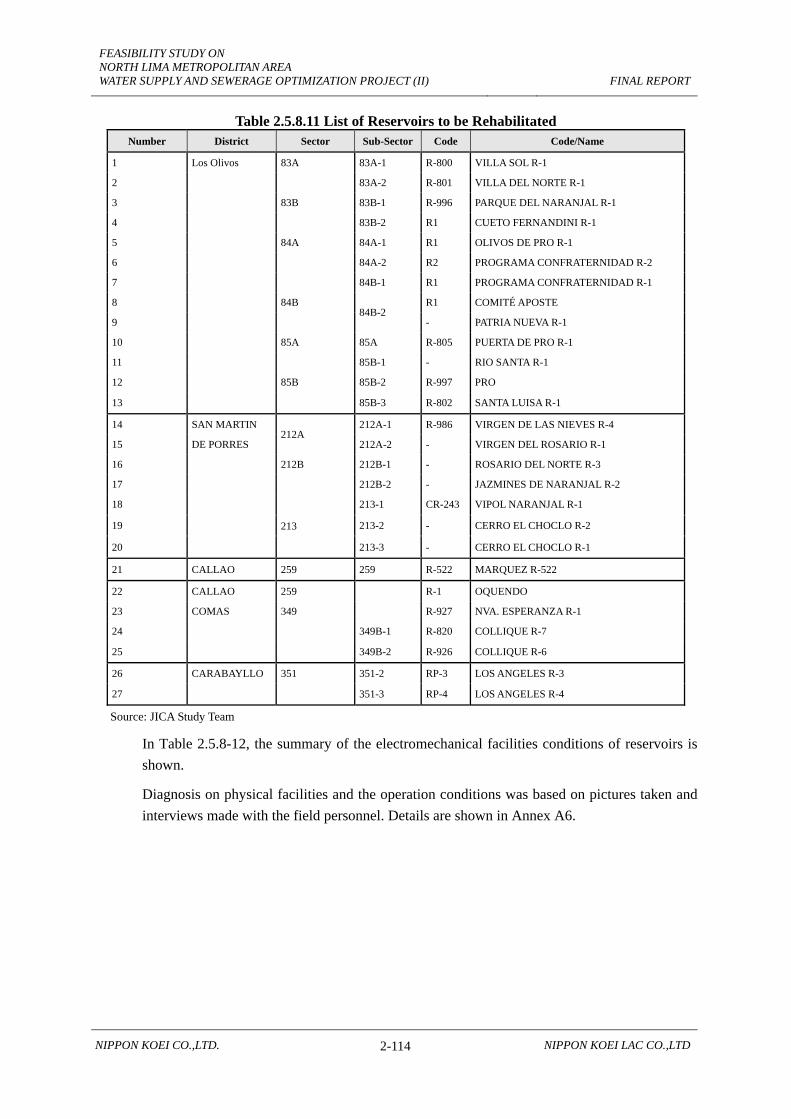
FEASIBILITY STUDY ON NORTH LIMA METROPOLITAN AREA WATER SUPPLY AND SEWERAGE OPTIMIZATION PROJECT (II)
FINAL REPORT
NIPPON KOEI CO.,LTD. 2-114 NIPPON KOEI LAC CO.,LTD
Table 2.5.8.11 List of Reservoirs to be Rehabilitated Number District Sector Sub-Sector Code Code/Name
1 Los Olivos 83A 83A-1 R-800 VILLA SOL R-1
2 83A-2 R-801 VILLA DEL NORTE R-1
3 83B 83B-1 R-996 PARQUE DEL NARANJAL R-1
4 83B-2 R1 CUETO FERNANDINI R-1
5 84A 84A-1 R1 OLIVOS DE PRO R-1
6 84A-2 R2 PROGRAMA CONFRATERNIDAD R-2
7 84B-1 R1 PROGRAMA CONFRATERNIDAD R-1
8 84B 84B-2
R1 COMITÉ APOSTE
9 - PATRIA NUEVA R-1
10 85A 85A R-805 PUERTA DE PRO R-1
11 85B-1 - RIO SANTA R-1
12 85B 85B-2 R-997 PRO
13 85B-3 R-802 SANTA LUISA R-1
14 SAN MARTIN 212A
212A-1 R-986 VIRGEN DE LAS NIEVES R-4
15 DE PORRES 212A-2 - VIRGEN DEL ROSARIO R-1
16 212B 212B-1 - ROSARIO DEL NORTE R-3
17 212B-2 - JAZMINES DE NARANJAL R-2
18 213
213-1 CR-243 VIPOL NARANJAL R-1
19 213-2 - CERRO EL CHOCLO R-2
20 213-3 - CERRO EL CHOCLO R-1
21 CALLAO 259 259 R-522 MARQUEZ R-522
22 CALLAO 259 R-1 OQUENDO
23 COMAS 349 R-927 NVA. ESPERANZA R-1
24 349B-1 R-820 COLLIQUE R-7
25 349B-2 R-926 COLLIQUE R-6
26 CARABAYLLO 351 351-2 RP-3 LOS ANGELES R-3
27 351-3 RP-4 LOS ANGELES R-4
Source: JICA Study Team
In Table 2.5.8-12, the summary of the electromechanical facilities conditions of reservoirs is shown.
Diagnosis on physical facilities and the operation conditions was based on pictures taken and interviews made with the field personnel. Details are shown in Annex A6.

Table 2.5.8-12 Electromechanical Facilities Conditions of Reservoirs
Number Code Name Diameter mm
Flow lps
Volume m3 Type Condition Electromechanical
Accessories Control Panel Altitude Valve Chlorination System
1 R-800 VILLA SOL R-1 200 53,04 1300 Elevated For emergency Operable Operable Operable No 2 R-801 VILLA DEL NORTE R-1 250 97,63 1800 Elevated For emergency Operable Non operable Operable Without equip 3 R-996 PARQUE DEL NARANJAL R-1 250 89,45 1400 Elevated For emergency Operable Non operable Operable Without equip 4 R1 CUETO FERNANDINI R-1 300 162,03 1500 Elevated For emergency Non operable Non operable Non operable Without equip 5 R1 OLIVOS DE PRO R-1 300 79,76 1500 Not elevated For emergency Without equip Without equip Without equip Without equip
6 R2 PROGRAMA CONFRATERNIDAD R-2 250 77,64 1600 Elevated For emergency Without equip Without equip Without equip Without equip
7 R1 PROGRAMA CONFRATERNIDAD R-1 250 100,69 1600 Elevated For emergency Without equip Without equip Without equip Without equip
8 R1 COMITÉ APOSTE Elevated For emergency 9 - PATRIA NUEVA R-1 Elevated For emergency 10 R-805 PUERTA DE PRO R-1 300 92 1100 Not elevated For emergency Without equip Without equip Non operable Without equip 11 - RIO SANTA R-1 200 50,51 570 Elevated For emergency Without equip Without equip Without equip Without equip 12 R-997 PRO Elevated For emergency 13 R-802 SANTA LUISA R-1 250 76,12 500 Elevated For emergency Operable Operable Operable Without equip 14 R-986 VIRGEN DE LAS NIEVES R-4 250 106,43 1500 Elevated For emergency Without equip Without equip Without equip Without equip 15 - VIRGEN DEL ROSARIO R-1 300 79,26 1200 Elevated For emergency Without equip Without equip Without equip Without equip 16 - ROSARIO DEL NORTE R-3 250 87,51 1200 Elevated For emergency Without equip Without equip Without equip Without equip 17 - JAZMINES DE NARANJAL R-2 250 77,71 1200 Elevated For emergency Without equip Without equip Without equip Without equip 18 CR-243 VIPOL NARANJAL R-1 300 121,2 1500 Not elevated Operable Without equip Without equip Without equip Without equip 19 - CERRO EL CHOCLO R-2 100 4,6 1200 Elevated Operable Without equip Operable Without equip Without equip 20 - CERRO EL CHOCLO R-1 100 2,2 1200 Elevated Operable Operable Operable Operable Without equip 21 R-522 MARQUEZ R-522 Elevated Operable Without equip 22 R-927 NVA. ESPERANZA R-1 150 18,1 400 Not elevated Operable Without equip Operable Operable Without equip 23 R-1 OQUENDO 350 400 Not elevated For emergency With equipment 24 R-820 COLLIQUE R-7 200 34 550 Not elevated Operable Without equip Without equip Without equip Without equip 25 R-926 COLLIQUE R-6 250 29,8 800 Not elevated Operable Without equip Without equip Without equip Without equip 26 RP-3 LOS ANGELES R-3 200 14,48 100 Not elevated Operable Without equip Without equip Without equip Without equip 27 RP-4 LOS ANGELES R-4 200 15,93 100 Not elevated Operable Without equip Without equip Without equip Without equip
Source: JICA Study Team 1 Electromechanical Equipments in General – Valve Included with Actuator and Accessories 2 Automatic Control Panel 3 Altitude Control Valve 4 Chlorination System Incluyes Injection Pump, Leakage Detector and Waste Chlorine Analyzer
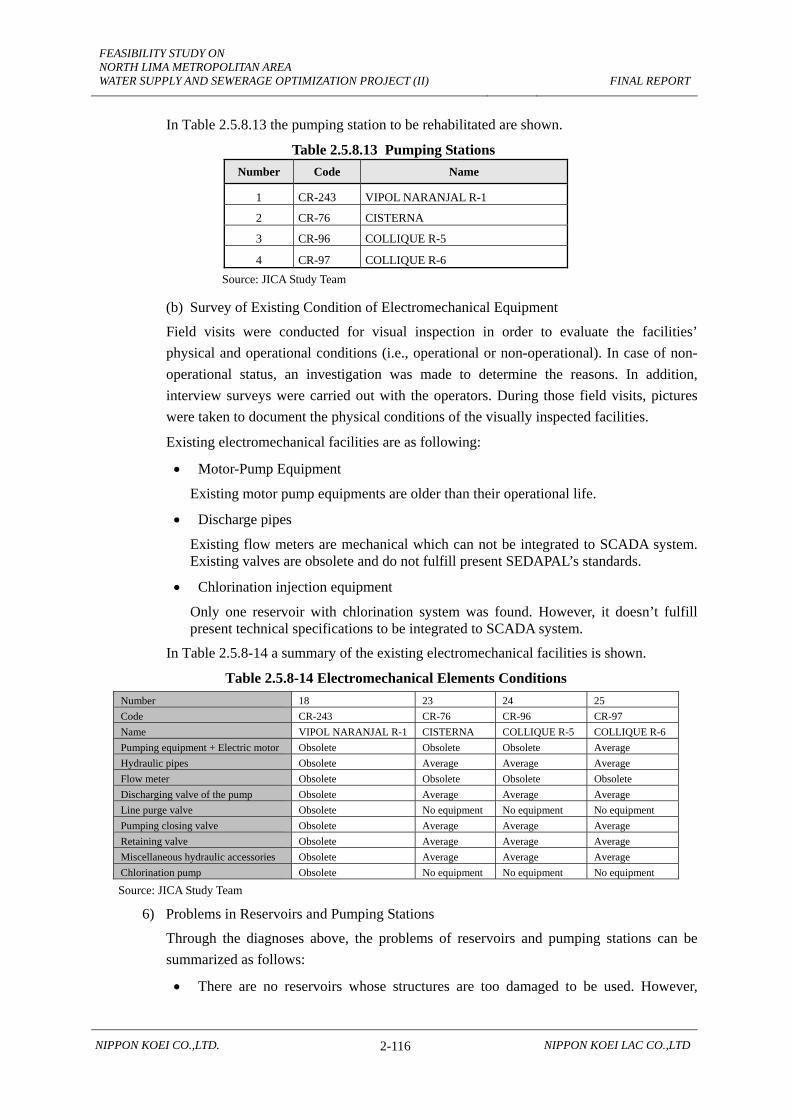
FEASIBILITY STUDY ON NORTH LIMA METROPOLITAN AREA WATER SUPPLY AND SEWERAGE OPTIMIZATION PROJECT (II)
FINAL REPORT
NIPPON KOEI CO.,LTD. 2-116 NIPPON KOEI LAC CO.,LTD
In Table 2.5.8.13 the pumping station to be rehabilitated are shown.
Table 2.5.8.13 Pumping Stations Number Code Name
1 CR-243 VIPOL NARANJAL R-1
2 CR-76 CISTERNA
3 CR-96 COLLIQUE R-5
4 CR-97 COLLIQUE R-6 Source: JICA Study Team
(b) Survey of Existing Condition of Electromechanical Equipment
Field visits were conducted for visual inspection in order to evaluate the facilities’ physical and operational conditions (i.e., operational or non-operational). In case of non-operational status, an investigation was made to determine the reasons. In addition, interview surveys were carried out with the operators. During those field visits, pictures were taken to document the physical conditions of the visually inspected facilities.
Existing electromechanical facilities are as following:
• Motor-Pump Equipment
Existing motor pump equipments are older than their operational life.
• Discharge pipes
Existing flow meters are mechanical which can not be integrated to SCADA system. Existing valves are obsolete and do not fulfill present SEDAPAL’s standards.
• Chlorination injection equipment
Only one reservoir with chlorination system was found. However, it doesn’t fulfill present technical specifications to be integrated to SCADA system.
In Table 2.5.8-14 a summary of the existing electromechanical facilities is shown.
Table 2.5.8-14 Electromechanical Elements Conditions Number 18 23 24 25 Code CR-243 CR-76 CR-96 CR-97 Name VIPOL NARANJAL R-1 CISTERNA COLLIQUE R-5 COLLIQUE R-6 Pumping equipment + Electric motor Obsolete Obsolete Obsolete Average Hydraulic pipes Obsolete Average Average Average Flow meter Obsolete Obsolete Obsolete Obsolete Discharging valve of the pump Obsolete Average Average Average Line purge valve Obsolete No equipment No equipment No equipment Pumping closing valve Obsolete Average Average Average Retaining valve Obsolete Average Average Average Miscellaneous hydraulic accessories Obsolete Average Average Average Chlorination pump Obsolete No equipment No equipment No equipment
Source: JICA Study Team
6) Problems in Reservoirs and Pumping Stations
Through the diagnoses above, the problems of reservoirs and pumping stations can be summarized as follows:
• There are no reservoirs whose structures are too damaged to be used. However,

FEASIBILITY STUDY ON NORTH LIMA METROPOLITAN AREA WATER SUPPLY AND SEWERAGE OPTIMIZATION PROJECT (II)
FINAL REPORT
NIPPON KOEI CO.,LTD. 2-117 NIPPON KOEI LAC CO.,LTD
rehabilitation of the structures of many of the existing reservoirs and pumping stations is necessary.
• Non-operational mechanical and electric equipment in the reservoirs shall be renewed to begin the operations.
• Some of mechanical and electric equipment in the operating reservoirs need rehabilitation or replacement in order to maintain their proper operation.
(9) Wells and Groundwater
1) Wells and Groundwater in the Study Area
Within the Study area, SEDAPAL possesses a good number of groundwater wells. In Table 2.5.8-15 the list of wells in the Study Area is shown.
However, not all of them are currently used. The Study identified that 23 wells could be used for emergency purpose in case of serious draught. Selection of them was based according to the closeness of well to reservoirs to be rehabilitated.
JICA Study Team carried out an investigation entrusting local Consultant to diagnose the situation of these groundwater wells and therefore determine their suitability for use. These wells are located in the Los Olivos and San Martín de Porres districts.
In the Study, it was found out that out of these 23 wells, 12 wells have complete pumping equipment, 5 have partial pumping equipment and 6 have no pumping equipment. Also, it was observed that 3 of the wells are in operation, 10 wells are used as reserve or emergency backup and 10 wells are not operated due to poor quality water. It is necessary to point out that, according to Technical Information of Wells (ITP) of December 2009 prepared monthly by the Groundwater Team, the most wells are being used for contingency or they are stopped because they do not fulfill parameters of drinking water quality. In most cases, water coming from wells surpasses the maximum acceptable values for most of the parameters. Acceptable parameters are values less than: Electric Conductivity 1500 μmhos/cm, Carbonate CaCO3 500 mg/l, Sulphate SO4 250 mg/l, Chloride Cl 250 mg/l, and Nitrate NO3 50 mg/l.
However the ITP shows that three wells were under operation. Regarding to wells 498 and 716 they were working only when the network pressure was required to be increased. Usually, La Atarjea plant, at certain hours of the day, was able to keep pressure of 18 or 19 PSI only, but those zones require 28 PSI. Therefore, it was necessary to keep the two wells under operation even though they do not fulfill water quality parameters.
Regardng to well 569, this is the only water source in the area, so it was necessary to exploit the well for the water supply in Marquez zone of Callao. Water quality of this well sometimes surpasses the acceptable maximum values of water quality, but they are not so high (CaCO3 surpasses by 67 mg/l and SO4 surpasses in 26 mg/l).
In order that the wells can fulfill the drinking water regulations for human consumption, it is necessary to mix groundwater with surface water coming from Huachipa plant. In order to guarantee suitable water mixing, measuring instrumentations will be installed to

FEASIBILITY STUDY ON NORTH LIMA METROPOLITAN AREA WATER SUPPLY AND SEWERAGE OPTIMIZATION PROJECT (II)
FINAL REPORT
NIPPON KOEI CO.,LTD. 2-118 NIPPON KOEI LAC CO.,LTD
measure sulphate quantity at all wells, nitrates at 16 wells and electric conductivity at 1 well only. These sensors will measure the parameters on-line through a Derivation Integration Process (PID) which will be installed in the PLC to determine amount of mixing to reduce surpassing values of Physical-Chemical quality parameters.
The 23 wells to be rehabilitated are shown in the Table 2.5.8.16.
2) Objective of Diagnosis and Activities
The objective of this diagnosis is to identify and verify the hydro-geological characteristics and the state of the infrastructure of wells, in order to determine if it is possible to extract groundwater for the Project. Recommendations have also been made to solve the problems, if any, in order to extend the useful life span of the wells.
The activities conducted are summarized below:
• Collection and analysis of information available.
• Carrying out short duration pumping tests for 10 wells (those with complete pumping equipment installed) in order to identify hydro-geological problem.
• Determination of recommended operating flow for 10 wells.
• Studying the variations of the water levels with respect to time through the development of piezometric variation hydrographs.
• Diagnosis of infrastructure of 11 wells by inspection with CCTV camera in order to identify infrastructure problems.
• Estimation of water extraction capacity of the wells.
3) Hydro Geological Evaluation
The Hydro geological evaluation involves integrating the results of the short duration pumping tests with the historical data of static level hydrographs obtained from SEDAPAL.
Particular attention has been given to technical characteristics of each well in terms of its current operations: filter length, location of filters, static and dynamic levels, flow rates, depression, location of the dynamic level in respect to the top level of filters, thickness of saturated aquifer, percentage drawdown of saturated aquifer and specific water flow.
The structural and hydraulic characteristics that largely correspond to the stage of drilling have been correlated with the updated data obtained from short duration pumping tests in order to recommend the volume of groundwater exploitation.
Moreover, the interpretation of the evolution of groundwater levels in wells distributed over the two districts allows for the analysis of the general condition of the state of the groundwater, as well as the determination of areas of depression and the assessment of recharge of groundwater. This interpretation is important for assessing the future possibilities of greater groundwater exploitation.
Results for each well, as well as conclusions and recommendations, can be found in Appendix A3. A brief summary is given below.

FEASIBILITY STUDY ON NORTH LIMA METROPOLITAN AREA WATER SUPPLY AND SEWERAGE OPTIMIZATION PROJECT (II)
FINAL REPORT
NIPPON KOEI CO.,LTD. 2-119 NIPPON KOEI LAC CO.,LTD
4) Recovery of the Groundwater Reserves and Change of Groundwater Levels with Time
In order to diagnose the state of the groundwater in the area, the historical water levels of the 23 wells between 1993 and 2010 were analyzed. It was observed that for the variations in water levels in the wells located in these districts, the Chillón aquifer has an important role. Between the years 1997 and 2001, the maximum depths of descent have been reached. After that, a continuous process of recovery has been observed for the 23 wells, and in 2010, the levels have reached a magnitude that exceeded the water levels prevailing at the time of drilling of the wells. This increase in the water levels varies from 8.40 to 39.54 m. There were 13 wells (60.86% of the total), for which the rise of the water levels falls in the bracket of 20.00 to 30.00 m. For another 8 wells (30.43% of the total), the water level recovery is greater than 30.00 m.
This progressive recovery of the water levels of the wells in this area that has been taking place in the last twelve years has produced a significant increase in the exploitable aquifer thickness, resulting in increased groundwater reserves. This situation is particularly related to the gradual reduction of groundwater exploitation; beginning ten years ago, SEDAPAL started discontinuing the pumping of wells.

FEASIBILITY STUDY ON NORTH LIMA METROPOLITAN AREA WATER SUPPLY AND SEWERAGE OPTIMIZATION PROJECT (II)
FINAL REPORT
NIPPON KOEI CO.,LTD. 2-120 NIPPON KOEI LAC CO.,LTD
Table 2.5.8-15 List of Wells in the Study Area Zone Sit. Depth
Item District Code Name Well Maker HP Amp Vol Lg-Bm Type Maker Model Date Staticlevel (m)
Dynamiclevel (m) P1(psi) P2(psi) Q(l/s) Well
m Date Conduct. µmhos/cm
TotalHardness
mg/l CaCO3
Sulphates mg/lSO4
Chloride mg/lCl
Nitrates mg/lNO3
1 7 161 San Felipe 2 Stand by Complete SUM 100 139 220 Submersible 2009/11/4 15.00 18.55 52 51 40 72.70 2009/5/20 1136 468 315 89 592 31 162 Palao Stand by Complete IEM 75 167 217 97.20 Vertical turbulence PEER-6 10MA-8 2009/2/27 43.80 54.25 27 27 30 99.50 2009/3/10 907 396 182 59 553 7 215 Retablo 4 Stand by Complete HIT 20 59 222 75.45 Submersible LAY-4 6RKHC-5 2009/11/3 12.60 27.30 11 10 17 103.00 2009/2/18 1240 648 398 43 374 31 225 San German Stand by Complete P 50 223 84.30 Submersible DPUM-6 8M23-5 2009/9/30 33.58 35 92.00 2009/5/20 1297 565 345 157 265 7 226 Pascana Under Operation Complete P 49 51 220 88.33 Submersible 2009/12/14 13.10 19.30 20 20 13 102.95 2009/1/27 1772 844 391 202 426 39 280 Pro 3 No function No Equipment 224 2008/8/6 20.75 45 103.50 2006/4/21 879 423 286 48 227 7 303 San Carlos Stand by Complete D 50 97 218 54.39 Vertical turburance HID-6 8MQH-7 2009/12/14 12.90 13.60 30 30 30 75.00 2009/8/12 1439 630 342 72 538 7 312 Pro6 9no Sec Stand by Complete D 50 84 210 83.50 Vertical turburance LAY-10 8URC-3 2009/8/19 9.30 31.00 13 12 8 85.00 2009/1/27 1137 567 399 77 409 39 316 Pro Lima No function No Equipment 220 2009/9/7 2.73 3 85.00 2005/11/22 1824 1123 886 89 1610 7 337 Sangarara 2 Stand by Complete SAE 20 48 222 68.28 Submersible GPUM-6 10MA-10 2009/8/19 15.60 29.70 10 8 17 83.00 2009/5/20 1244 595 348 49 4211 7 344 Collique 1 No function No Equipment 225 2008/12/16 18.83 23 68.80 2000/4/11 1439 588 311 96 5912 7 348 Santa Luisa Stand by Complete D 20 40 218 50.51 Vertical turburance BJ-5 8GH-6 2008/12/9 23.90 25.40 30 28 10 110.00 2008/10/17 1535 823 355 78 7013 39 351 Puerta Pro Stand by Complete HIT 75 212 90.30 Submergible HID-5 7MQL-5 2009/2/25 21.60 13 94.00 2009/9/16 1297 696 436 53 2014 7 378 Ano Nuevo Stand by Complete SUM 40 36 215 63.96 Submersible HID-6 10GL-9 2009/12/4 8.60 26.10 16 15 10 66.50 2009/4/29 1237 636 406 58 4415 31 382 Vipol 1 Stand by Complete US 100 221 78.35 Vertical turburance BJ-10 12GM-5 2009/9/7 7.18 52 94.00 2009/4/29 1619 799 423 142 2916 7 385 Ano Nuevo 2 No function No Equipment 220 2007/6/4 9.00 9 61.50 2004/9/20 1638 867 639 71 3117 7 401 Sta Luisa No function Partial HIT 40 218 77.50 Submerginal HID-4 6MQH-6 2008/8/6 20.35 30 217.00 2005/9/20 1468 700 422 59 5318 39 423 Sta Luisa 4 No function Partial D 40 220 103.90 Vertical turburance HID-6 8MQH-11 2008/4/21 18.30 20 140.90 2006/4/12 1283 562 411 66 5219 31 95 San Martin 2 Stand by Complete US 125 220 100.00 Vertical turburance BJ-8 10H60-10 2009/10/28 42.96 30 150.00 2008/8/12 690 319 160 43 2520 31 99 Condevilla Stand by Complete IEM 75 220 101.23 Vertical turburance BJ-5 8MQL-16 2009/9/30 40.52 30 103.70 2009/5/20 826 357 229 42 4821 31 141 Canta Under Operation Complete D 50 120 216 91.40 Vertical turburance BJ-6 10CGL-9 2009/9/30 47.59 17 138.00 2009/4/29 846 381 164 84 4822 31 142 Amalia Puga Stand by Complete P 75 165 220 84.29 Submersible DPUM-6 8H38-4 2009/9/30 33.67 43 132.20 2009/5/20 782 342 238 36 4223 31 776 El Trebol 3 No function No Equipment 220 2001/8/21 60.50 45 145.00 2006/5/9 934 443 216 64 3724 31 780 Palao 3 No function No Equipment 220 2004/3/5 45.41 25 139.00 2006/8/21 1022 397 164 86 4825 7 430 Primavera 2 Stand by Complete SAE 75 72 221 66.85 Submersible GPUM-6 8GH-10 2009/9/7 15.10 38.65 38 38 16 79.13 2009/4/29 1304 674 468 61 3126 31 781 Lola Ferreyros 2 No function No Equipment 220 2007/8/17 52.49 30 150.00 2006/4/5 1091 451 413 113 5927 7 431 Collique 4 Stand by Complete US 100 440 23.24 Vertical turburance BJ-8 12GL-10 2009/6/10 8.00 33 29.95 2000/3/16 1191 594 429 49 4528 39 785 Vipol 4 No function No Equipment 220 2007/2/12 3.07 8 85.00 2006/3/28 1198 577 76 79 1029 7 437 Retablo 5 Stand by Complete FKL 30 217 93.00 Submersible GOULD-4 6CHC-4 2009/9/7 13.18 17 117.00 2009/9/16 1515 803 395 76 5330 39 788 San Roque No function No Equipment 220 2009/9/4 12.78 17 110.00 2006/4/29 1139 545 399 95 2131 39 474 Pro 12 Stand by Complete SUM 25 217 73.10 Submergible BJ-6 10CGL-8 2009/5/14 19.50 20 120.00 2008/12/13 1235 623 439 69 4432 31 789 Trebol de Chavarria No function No Equipment 448 2009/10/28 27.20 43 125.00 2005/9/20 1077 493 167 115 5333 7 487 El Pinar-Teo Stand by Complete SAE 30 86 216 42.00 Submersible GPUM-6 9RCLC-5 2009/12/14 2.80 16.40 16 16 40 60.00 2009/8/12 1263 552 348 45 3734 39 791 Prolima Under Operation Complete IEM 50 99 225 74.23 Vertical turburance BJ-6 10GH-6 2009/10/13 9.70 51.05 27 27 13 100.00 2009/2/18 1505 804 259 63 4035 39 489 Los Naranjos No function No Equipment 227 2008/8/18 18.97 17 106.20 2004/1/29 1400 754 538 77 4436 39 498 Pro 11 Under Operation Complete US 40 92 220 103.50 Vertical turburance PEER-5 8MA-14 2009/8/26 19.40 50.80 18 16 17 129.00 2009/1/27 1119 540 353 77 2937 31 569 Chuquitanta Under Operation Complete IEM 60 103 220 45.72 Vertical turburance HID-6 8MQH-3 2009/11/23 10.50 23.80 12 12 40 119.00 2009/1/27 1128 567 326 98 1538 31 606 El Establo No function No Equipment 213 2007/10/11 42.20 17 120.00 2000/3/21 745 318 116 50 4239 7 616 Pinar 2 Stand by Complete IEM 30 89 221 57.60 Vertical turburance BJ-4 300S-4 2009/10/21 9.14 38.30 22 22 16 58.00 2009/8/12 1285 596 349 47 3140 39 618 Wiesse Stand by Complete D 50 227 84.72 Vertical turburance BJ-6 10GL-9 2009/9/30 12.02 30 118.00 2008/9/17 1227 629 364 68 2641 7 619 Pinar 1 Stand by Complete FKL 25 115 214 51.50 Submersible DEMIN-4 MGEA-4 2009/12/14 7.90 41.50 72 36 16 59.50 2009/8/12 1270 581 343 42 3542 31 656 Malaspina Stand by Complete HIT 80 220 Submersible 2009/9/30 29.27 17 119.84 2008/8/14 847 413 168 160 6643 31 657 Vipol Naranajal No function No Equipment 220 2009/9/30 11.50 10 89.90 2006/5/9 1564 801 628 84 5944 31 666 San Martin 5 Stand by Complete D 125 220 100.08 Vertical turburance BJ-8 10GH-8 2009/8/27 34.80 40 150.00 2008/8/12 735 362 155 62 3445 31 670 El Rosario Stand by Complete US 125 175 221 75.05 Vertical turburance HID-8 12GM-4 2009/5/14 33.20 48.65 36 35 50 117.00 2009/1/27 1209 603 157 172 5146 31 679 Chicmabamba P-4 No function Partial IEM 75 212 Vertical turburance BJ-6 2007/11/14 12.20 36 120.00 2006/2/9 1106 635 381 53 2747 31 680 La Florida P-9 No function No Equipment 220 2008/8/8 8.08 20 120.00 2006/3/8 1155 528 356 51 2348 39 684 Aposte No function Partial D 30 45 220 44.00 Vertical turburance BJ-5 8GH-6 2008/8/4 10.60 10 115.00 2009/5/20 1965 909 345 287 5749 31 687 Virgen Fatima P-10 Stand by Complete US 75 225 69.00 Vertical turburance BJ-8 10GM-8 2009/9/2 6.87 30 120.00 2008/11/18 1411 692 418 130 4250 39 688 Aznapuquio P-5 No function Partial IEM 50 220 Vertical turburance BJ-6 2009/9/2 8.14 27 120.00 2004/1/26 1129 591 455 63 1851 31 689 Aznapuquio P-12 Stand by Complete HIT 40 220 Submergible 2009/9/2 5.31 18 120.00 2005/8/19 1551 816 404 144 4352 31 690 Aznapuquio P-13 Stand by Complete HIT 30 122 220 72.40 Submersible PLEU-4 S/PLAC-5 2009/9/2 4.96 23 120.00 2009/3/10 2100 1012 429 312 5753 39 691 Milla Ochoa 2 No function No Equipment 216 2009/9/4 18.23 15 120.00 2006/5/10 971 487 382 48 1354 39 692 Milla Ochoa 3 No function No Equipment 223 2009/9/4 17.95 27 120.00 2004/1/29 1222 655 416 70 2755 39 693 Milla Ochoa 10 Stand by Complete IEM 40 105 220 85.19 Vertical turburance HID-4 7MQH-22 2009/9/4 19.33 17 120.00 2008/10/17 1055 536 332 53 1856 39 694 AH.Sn Martin 4 No function No Equipment 220 2009/9/4 17.88 20 112.00 2006/6/16 1133 515 386 55 1857 39 695 A.H San Martin 5 Stand by Complete IEM 75 220 88.78 Vertical turburance BJ-6 10GL-13 2009/5/14 14.95 20 120.00 2008/10/17 993 474 335 50 1558 39 696 Laura Calle 6 No function No Equipment 213 2009/9/4 18.11 14 110.26 2006/2/8 934 410 312 48 1659 39 704 Rio Santa Stand by Complete SIEM 30 212 81.00 Vertical turburance JHON-8 2009/12/14 20.30 13 100.00 2009/3/10 876 391 302 29 1560 39 716 Santa Elisa Under Operation Complete US 40 222 53.62 Vertical turburance HID-6 10CGL-6 2009/5/14 14.80 26 110.00 2008/10/17 1191 632 270 56 2461 39 717 Estrella No function No Equipment 225 2009/9/14 17.91 12 92.60 2006/4/20 1016 471 273 41 2462 39 719 Los Olivos Pro-P1 Stand by Partial HIT 40 223 93.54 Submersible HID-4 5.5CGH-9 2009/3/10 18.50 12 119.10 2004/7/14 1270 578 342 68 2163 39 720 Los Olivos Pro-P2 Stand by Complete US 50 211 55.98 Vertical turburance GPUM-6 9RCHC-6 2009/5/14 12.75 40 120.00 2009/9/16 1323 463 443 114 264 7 721 Alborada-PT1 Stand by Complete D 40 59 218 58.00 Vertical turburance PEER-6 8MA-10 2009/12/14 8.25 32.80 32 30 13 100.00 2009/8/12 1087 479 265 41 1565 7 722 Alborada-PT3 Stand by Complete ATU 40 75 223 54.90 Submerginal NASJHO NJ-7CC-4 2009/10/16 14.70 17.60 43 42 21 84.00 2009/8/12 1322 588 335 51 4666 7 723 Alborada-PT4 Stand by Complete D 40 220 54.44 Vertical turburance BJ-6 10GM-9 2009/2/25 7.15 23 100.00 2006/3/6 1197 590 371 87 5567 7 724 Alborada-PT5 Stand by Complete US 40 210 43.96 Vertical turburance HID-5 10GL-4 2009/3/17 9.85 33 97.65 2008/11/18 1004 501 321 41 3168 7 725 Alborada-PT2 Stand by Complete SAE 20 52 224 44.23 Submersible GPUM-4 7WALC-3 2009/12/14 4.70 18.15 38 36 13 74.00 2008/12/22 793 376 264 32 1369 31 727 Asnapuquio C1 Stand by Partial IEM 60 210 Vertical turburance 2009/9/1 11.87 36 120.00 2005/11/30 1235 671 435 62 3670 31 728 Asnapuquio C2 No function Partial IEM 60 116 211 65.81 Vertical turburance DPUM-6 10CGL-9 2009/9/1 12.44 33 120.00 2004/3/4 1326 716 482 59 3271 31 729 Asnapuquio C4 No function Partial IEM 60 138 220 77.63 Vertical turburance NAT-6 10CGL-9 2009/9/1 11.03 33 120.00 2006/2/9 1253 647 447 62 3472 31 730 Asnapuquio P9 Stand by Complete IEM 100 213 66.43 Vertical turburance BJ-8 12GL-6 2009/12/14 3.97 43 111.20 2006/10/16 1341 602 390 63 2973 31 748 San Martin 6 No function Partial US 125 227 87.77 Vertical turburance BJ-6 12 GM 2009/9/30 27.15 30 150.00 2006/3/30 809 369 139 55 51
Selected wells for rehabilitation
Source: Technical Information of Well ITP December 2010 - Groundwater Team – SEDAPAL
Physical - Chemical ConditionsLocation WELL Electric Motor Pump OPERATION CONDUCTIONEquipment

FEASIBILITY STUDY ON NORTH LIMA METROPOLITAN AREA WATER SUPPLY AND SEWERAGE OPTIMIZATION PROJECT (II)
FINAL REPORT
NIPPON KOEI CO.,LTD. 2-121 NIPPON KOEI LAC CO.,LTD
Table 2.5.8-16: Existing Wells to be Rehabilitated in the Study Area
WELL Sit. Muestreo Conduct. Har. Total Sulphates Chlorides NitratesCS Dis No Name Well Fecha µmhos/cm mg/l CaCO3 mg/l SO4 mg/l Cl mg/l NO3
1 39 351 Puerta Pro Rse* Complete 16/09/2009 1297 696 436 53 202 39 474 Pro 12 Rse* Complete 13/12/2008 1235 623 439 69 443 39 498 Pro 11 F Complete 27/01/2009 1119 540 353 77 294 31 569 Chuquitanta F Complete 27/01/2009 1128 567 326 98 155 39 618 Wiesse Rse* Complete 17/09/2008 1227 629 364 68 266 31 687 Virgen Fatima P-10 Rse* Complete 18/11/2008 1411 692 418 130 427 31 689 Aznapuquio P-12 Rse* Complete 19/08/2005 1551 816 404 144 438 39 693 Milla Ochoa 10 Rse* Complete 17/10/2008 1055 536 332 53 189 39 695 A.H San Martin 5 Rse* Complete 17/10/2008 993 474 335 50 15
10 39 704 Rio Santa Rse* Complete 10/03/2009 876 391 302 29 1511 39 716 Santa Elisa F Complete 17/10/2008 1191 632 270 56 2412 39 720 Los Olivos Pro-P2 Rse* Complete 16/09/2009 1323 463 443 114 213 39 423 Sta Luisa 4 Pca Partial 12/04/2006 1283 562 411 66 5214 39 688 Aznapuquio P-5 Pca Partial 26/01/2004 1129 591 455 63 1815 31 727 Asnapuquio C1 Rse* Partial 30/11/2005 1235 671 435 62 3616 31 728 Asnapuquio C2 Pca Partial 04/03/2004 1326 716 482 59 3217 31 729 Asnapuquio C4 Pca Partial 09/02/2006 1253 647 447 62 3418 39 280 Pro 3 Pca Without 21/04/2006 879 423 286 48 2219 39 691 Milla Ochoa 2 Pca Without 10/05/2006 971 487 382 48 1320 39 692 Milla Ochoa 3 Pca Without 29/01/2004 1222 655 416 70 2721 39 694 AH.Sn Martin 4 Pca Without 16/06/2006 1133 515 386 55 1822 39 696 Laura Calle 6 Pca Without 08/02/2006 934 410 312 48 1623 39 717 Estrella Pca Without 20/04/2006 1016 471 273 41 24
Wells under operationWells for contingencyWells stopped
General CharacteristisEquipment
Physical - Chemical ConditionsLocation
Source: ITP Groundwater Team – SEDAPAL
5) Distance of the Dynamic Water Level from the Top of the Filter
The analysis of updated information from SEDAPAL and results of the short duration pumping tests performed between May and June of 2010, shows that the dynamic groundwater tables are located above the top levels of the filters for all the wells investigated. The distance varies between 7.63 and 49.55 m. In most cases, these distances were between 25.09 and 49.55 m, meaning the filters are totally submerged throughout their length. This represents a favorable situation regarding their exploitation and useful life span.
6) Drawdown / Depression of Saturated Aquifer
With the rising of the groundwater tables in the recent years, the thickness of saturated aquifer has also been increased. Therefore the recorded drawdown in 2010 for 17 wells showed decreased values compared to what considered as good. This means increase in exploitation capacity.
The rate of depletion of the saturated aquifer during pumping varies from 3.51% (well No. 569) to 43.88% (Well No. 280), though the majority of the wells show a rate of under 25%, which is considered to be good.
FEASIBILITY STUDY ON NORTH LIMA METROPOLITAN AREA WATER SUPPLY AND SEWERAGE OPTIMIZATION PROJECT (II)
FINAL REPORT
NIPPON KOEI CO.,LTD. 2-122 NIPPON KOEI LAC CO.,LTD
The wells that had the highest percentage of lowering of saturated aquifer during pumping tests were No. 280 with 43.88%, No. 351 with 34.16% and No. 689 with 28.20%.
7) Pumping Tests
Between May 4 and June 9 of 2010, short-duration pumping tests were carried out in the following 10 wells in the Los Olivos district: Wells N° 351,474,498, 618, 687, 693, 695, 704, 716, and 720. This was carried out in order to determine the hydraulic parameters like statistic levels, static levels, dynamic levels, depression, water flow and specific capacity. The executions of the pumping tests were conducted in coordination with SEDAPAL staff following SEDAPAL´s pumping regulations 1 and 3.
The short duration pumping tests were conducted for a variable time period, between 2h 15m and 2h 30m using vertical shaft pumps powered by electric motors and electric submersible pumps.
The comparative analysis of the performance curves of the pumping tests show a significant improvement in the hydraulic parameters (static and dynamic levels and flow), the thickness of the saturated aquifer, the percentage of drawdown, submergence situation of the filters, and specific flow volume.
8) Inspection of Wells Using CCTV Cameras
CCTV camera inspection have been carried out in 11 wells, out of which 5 wells did not have pumping equipment (N° 280, 694, 696, 717, and 689), and 6 wells did have pumping equipment (N° 423,691,618, 687, 689 and 727). For wells with pumping equipment, this inspection required removal of pumping equipment and later reinstallation. From the inspection, it was found that there was no serious damage of the casings, sedimentation or cloggings in the wells which may prevent usual operation of the wells.
9) Water Extraction
The possible water production has been calculated from the pumping tests performed in 10 wells and the hydro-geological evaluation of 13 wells. The possible total water extraction from the 23 boreholes investigated is 531.50 liters / sec., which is equivalent to 0.531 m³ / sec.
10) Diagnosis of Electromechanial Equipment of Wells
Apart from the inspection of the wells explained above, the Consultant has carried out site surveys for the wells’ electromechanical equipment. From the result of these surveys, it was observed that:
Pumping equipment of wells
Within 23 inspected wells, 9 of them didn’t have any pumping equipment.
Within 14 wells with existing pumping equipment, 4 of them have submersible pumping equipment and the others have vertical turbine pumping equipment (VT) which is lubricated by water. It must be mentioned that the pumping equipment maintenance staff prefers VT equipments that are lubricated by water instead of submersible pumping equipments. This is because VT pumping equipments are easier to install compared to submersible pumps because for the later, there are difficulty of

FEASIBILITY STUDY ON NORTH LIMA METROPOLITAN AREA WATER SUPPLY AND SEWERAGE OPTIMIZATION PROJECT (II)
FINAL REPORT
NIPPON KOEI CO.,LTD. 2-123 NIPPON KOEI LAC CO.,LTD
installation of power cable in the motor located underneath the pumping equipment. Besides, in many cases the location is deeper than 70 meters.
At present there is no control system, so maintenance of pumping equipments are done only when it needed to be repaired.
Electrical equipments:
• Electric motors
Existing electrical motors surveyed are 10 VT pumping motors lubricated by water.
As mentioned before, these stations have no telemetry, so preventive maintenance in motors could not be done.
• Electric panels
Inspected power electric panels are in bad conditions. Some wells have no electronic starters and speed changer. Some wells have network analyzers and condenser banks, but these elements are obsolete and they are not compatible with the controls required by SEDAPAL. Existing electric components, such as sectioners, relays and contacts are obsolete.
Some wells have incomplete panels but the technology is rather old and not possible to be integrated to SCADA of SEDAPAL.
• Discharging pipes
Within 23 wells, six of them have no discharging pipes. The others have discharging pipes that are partially installed. 16 wells have mechanical seat type flow meter; and only one well has electromagnetic flow meter. None of these flow meters could be used for SCADA system integration. All of these meters shall be replaced by new ones. Also, none of the inspected outlet sluice valve fulfill the condition required to be controlled remotely. Valves shall be replaced.
• Chlorination system
Within 23 wells, 15 wells have ithe injection pump for chlorine system, the security system and chlorine tanks. In all cases, it is necessary to replace the injection system of chlorine gas because they are obsolete and can not be integrated to SCADA system.
In Table 2.5.8-17 a summary of existing accessories in selected wells is shown.
In annex A6, the well evaluation sheets are shown.
11) Problems of Wells
Many of the 23 wells to be used for emergency purpose do not have pumping equipment or are not equipped with enough equipment for suitable operation. New installation of pumping equipment as well as rehabilitation and improvement of existing equipment are necessary.

FEASIBILITY STUDY ON NORTH LIMA METROPOLITAN AREA WATER SUPPLY AND SEWERAGE OPTIMIZATION PROJECT (II)
FINAL REPORT
NIPPON KOEI CO.,LTD. 2-124 NIPPON KOEI LAC CO.,LTD
Table 2.5.8-17 Electromechanical Characteristis of Wells
WELL Electromechanical Equipment Discharging Pipes Chlorination System Automation and Control
Panel
Motor Pump Eqiupment
Mechanical Equipment Electrical Equipment Discharging Pipes diameter
Oultel Valve Lamp Relief Dresser Flow Meter Pressure Meter Pump Panel Security
System Chlorine Cylinder PLC Radio Antenna
No Name Lg-Bm Type Maker Model Mar HP Amp Vol. Network Analizer
Condenser Banks
280 Pro 3 No equipment 224 No No 8 Sluice No No Yes No No No No No No No No No
351 Puerta Pro Complete 90,30 SU HID-5 7MQL-5 HIT 75 212 Si Si 4 Sluice Codo Yes Yes Mc Crometer Yes Yes Yes Yes Yes No No No
423 Sta. Luisa 4 Partial 103,90 VT HID-6 8MQH-11 D 40 220 Si Si 8 Sluice Yes Aire Yes Mc Crometer Yes No No No No No No No
474 Pro 12 Complete 73,10 SU BJ-6 10CGL-8 SUM 25 217 Si Si 6 Sluice Codo Yes Yes Mc Crometer Yes Yes Yes Yes Yes No No No
498 Pro 11 Complete 103,50 VT PEER-5 8MA-14 US 40 92 220 Si Si 6 Sluice YES YES Yes Mc Crometer Yes Yes Yes Yes Yes No No No
569 Chuquitanta Complete 45,72 VT HID-6 8MQH-3 IEM 60 103 220 No Si 8 Sluice Yes Yes Yes Electromag. Yes Yes Yes Yes Yes No No No
618 Wiesse Complete 84,72 VT BJ-6 10GL-9 D 50 227 No Si 6 Sluice Yes Yes Yes Mc Crometer Yes Yes Yes Yes Yes No No No
687 Virgen Fátima P-10 Complete 69,00 VT BJ-8 10GM-8 US 75 225 No Si 8 Sluice Yes Niple Yes Mc Crometer Yes Yes Yes Yes Yes No No No
688 Aznapuquio P-5 Partial VT BJ-6 IEM 50 220 No Si 6 Sluice Yes No Yes Mc Crometer Yes Yes Yes Yes Yes No No No
689 Aznapuquio P-12 Complete SU HIT 40 220 No Si 6 Sluice Yes Yes Yes Mc Crometer Yes Yes Yes Yes Yes No No No
691 Milla Ochoa 2 Partial VT 216 Si Si 4 Sluice Yes Yes Yes Mc Crometer Yes Yes Yes Yes Yes No No No
692 Milla Ochoa 3 No equipment SU 223 Si Si 6 Sluice Codo Yes Yes Mc Crometer Yes Yes Yes Yes Yes No No No
693 Milla Ochoa 10 Complete 85,19 VT HID-4 7MQH-22 IEM 40 105 220 No No 6 Sluice Yes Yes Yes Mc Crometer Yes Yes Yes Yes Yes No No No
694 AH.San Martin 4 No equipment 220 No No No Sluice No No No No No No No No No No No No
695 A.H San Martin 5 Complete 88,78 VT BJ-6 10GL-13 IEM 75 220 Si Si 6 Sluice Yes Yes Yes Mc Crometer Yes Yes Yes Yes Yes No No No
696 Laura Calle 6 No equipment 213 No No No Sluice No No No No No No No No No No No No
704 Rio Santa Partial 81,00 VT JHON-8 Si Si 4 Sluice Yes Yes Yes Mc Crometer Yes Yes Yes Yes Yes No No No
716 Santa Elisa Complete 53,62 VT HID-6 10CGL-6 US 40 222 No Si 6 Sluice Yes Yes Yes Mc Crometer Yes Yes Yes Yes Yes No No No
717 Estrella No equipment No No No Sluice No No No No No No No No No No No No
720 Los Olivos Pro-P2 Complete 55,98 VT GPUM-6 9RCHC-6 US 50 211 Si Si 4 Sluice Yes Yes Yes Mc Crometer Yes Yes Yes Yes Yes No No No
727 Aznapuquio C1 Partial VT IEM 60 210 No No 6 Sluice Yes Yes Yes Mc Crometer Yes No No No No No No No
728 Aznapuquio C2 Partial 65,81 VT DPUM-6 10CGL-9 IEM 60 116 211 No No 6 Sluice No No No No No No No No No No No No
729 Aznapuquio C4 Partial 77,63 VT NAT-6 10CGL-9 IEM 60 138 220 No No 6 Sluice No No No No No No No No No No No No
Source: Technical Information of Wells (ITP) Groundwater Team - SEDAPAL, Field Visit, EOMASBA team

FEASIBILITY STUDY ON NORTH LIMA METROPOLITAN AREA WATER SUPPLY AND SEWERAGE OPTIMIZATION PROJECT (II)
FINAL REPORT
NIPPON KOEI CO.,LTD. 2-125 NIPPON KOEI LAC CO.,LTD
(10) Valve pits
1) Condition of Valve Pits
Control structures that supervise and control inflow to each sector have been located at eleven (11) points, as presented in Table 2.5.8-18. These structures usually include sluice valves, regulating valves, and telemetry equipment. Filters have been installed in some cases to protect regulation valves.
Within the eleven valve pits, five (5) of them can store the monitoring data but have no filters along the inflow line, thus, the valves are exposed to higher maintenance needs due to strange particle incrustations.
Table 2.5.8-18: Existing Valve Pits
No District Location Code Original Sector
1 Los Olivos Av. Las Palmeras / Calle Río Marañon S0083 83*2 Av. Huandoy / Calle 69 S0084 84*3 Av. Mendiola / Av. Los Portales S0085 85*4 San Martín Av. Universitaria / Av. Los Mirlos S0212 212*5 Autopista Lima-Canta / Av. Universitaria S0213 213*6 Comas Av. Túpac Amaru/ Las Lomas - 350 7 Av. Túpac Amaru/ San Felipe - 345 – 346 8 Av. Túpac Amaru - 347 - 346 9 Pte. Piedra Capitana Sector - 361
10 Ensenada Sector - 368 11 Sureños Sector - 369
*: Original sectors which can be controlled and monitored automatically. Source: SEDAPAL ECRF Cadastre plan
Among the eleven, five valve pits, which are located in the original sectors 83, 84, 85, 212 and 213, can be controlled and monitored automatically.
The five valve pits have an automated ring valve that is connected to the SCADA system for its remote command; it regulates flow and inflow pressure to the sector, according to its specific regulation regime criterion; upstream of this valve there is a guard butterfly valve, and a gate valve is available downstream. The by-pass valve also has a butterfly valve available both upstream and downstream.
An electromagnetic meter is available at the valve pit entrance that registers flow data through the SCADA system.
A pressure translator is also available to register pressure data both upstream and downstream of the control valve. Only 2 valve pits have air valves, and none of them have filters.
The Table 2.5.8-19 below shows valve pits and their equipment:
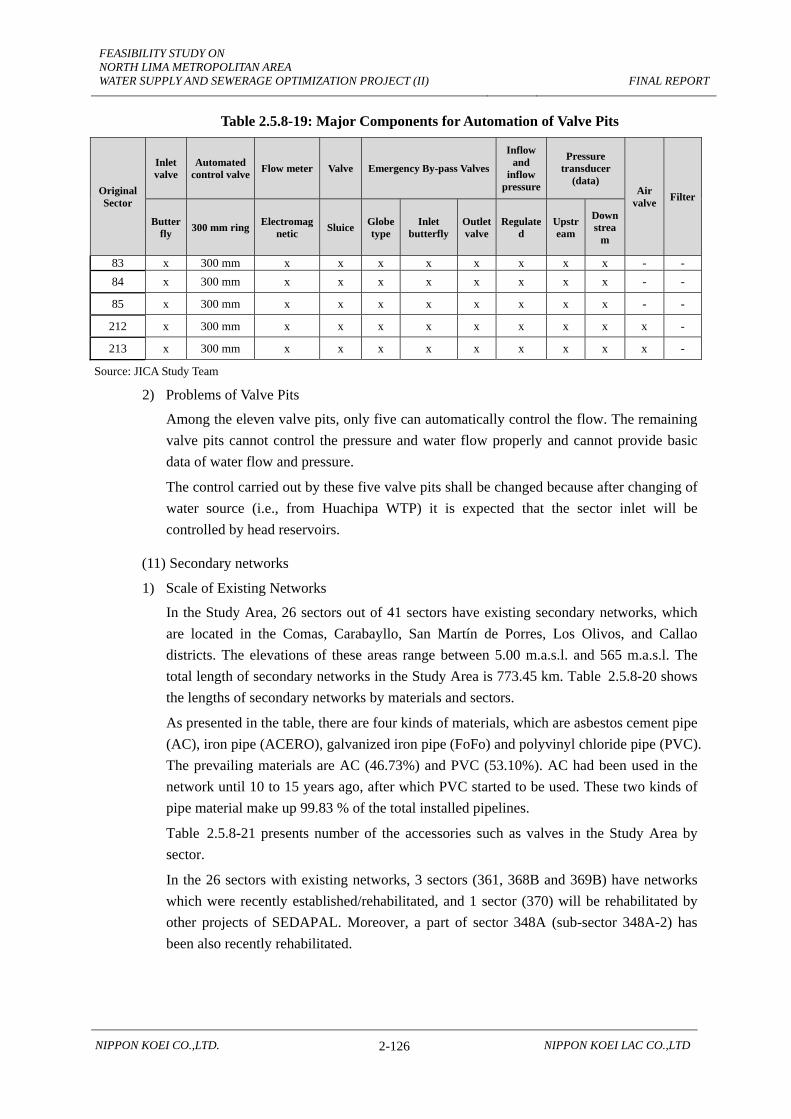
FEASIBILITY STUDY ON NORTH LIMA METROPOLITAN AREA WATER SUPPLY AND SEWERAGE OPTIMIZATION PROJECT (II)
FINAL REPORT
NIPPON KOEI CO.,LTD. 2-126 NIPPON KOEI LAC CO.,LTD
Table 2.5.8-19: Major Components for Automation of Valve Pits
Original Sector
Inlet valve
Automated control valve Flow meter Valve Emergency By-pass Valves
Inflow and
inflow pressure
Pressure transducer
(data) Air
valve Filter
Butterfly 300 mm ring Electromag
netic Sluice Globe type
Inlet butterfly
Outlet valve
Regulated
Upstream
Downstrea
m
83 x 300 mm x x x x x x x x - - 84 x 300 mm x x x x x x x x - -
85 x 300 mm x x x x x x x x - -
212 x 300 mm x x x x x x x x x -
213 x 300 mm x x x x x x x x x -
Source: JICA Study Team
2) Problems of Valve Pits
Among the eleven valve pits, only five can automatically control the flow. The remaining valve pits cannot control the pressure and water flow properly and cannot provide basic data of water flow and pressure.
The control carried out by these five valve pits shall be changed because after changing of water source (i.e., from Huachipa WTP) it is expected that the sector inlet will be controlled by head reservoirs.
(11) Secondary networks
1) Scale of Existing Networks
In the Study Area, 26 sectors out of 41 sectors have existing secondary networks, which are located in the Comas, Carabayllo, San Martín de Porres, Los Olivos, and Callao districts. The elevations of these areas range between 5.00 m.a.s.l. and 565 m.a.s.l. The total length of secondary networks in the Study Area is 773.45 km. Table 2.5.8-20 shows the lengths of secondary networks by materials and sectors.
As presented in the table, there are four kinds of materials, which are asbestos cement pipe (AC), iron pipe (ACERO), galvanized iron pipe (FoFo) and polyvinyl chloride pipe (PVC). The prevailing materials are AC (46.73%) and PVC (53.10%). AC had been used in the network until 10 to 15 years ago, after which PVC started to be used. These two kinds of pipe material make up 99.83 % of the total installed pipelines.
Table 2.5.8-21 presents number of the accessories such as valves in the Study Area by sector.
In the 26 sectors with existing networks, 3 sectors (361, 368B and 369B) have networks which were recently established/rehabilitated, and 1 sector (370) will be rehabilitated by other projects of SEDAPAL. Moreover, a part of sector 348A (sub-sector 348A-2) has been also recently rehabilitated.
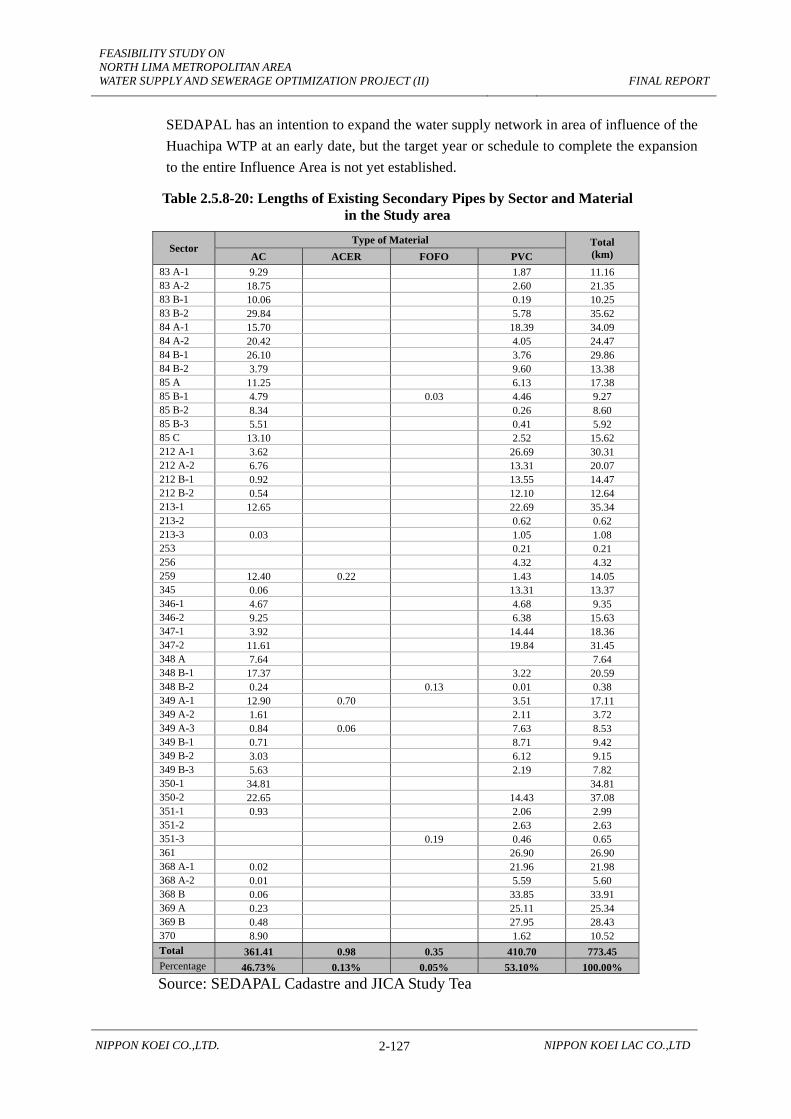
FEASIBILITY STUDY ON NORTH LIMA METROPOLITAN AREA WATER SUPPLY AND SEWERAGE OPTIMIZATION PROJECT (II)
FINAL REPORT
NIPPON KOEI CO.,LTD. 2-127 NIPPON KOEI LAC CO.,LTD
SEDAPAL has an intention to expand the water supply network in area of influence of the Huachipa WTP at an early date, but the target year or schedule to complete the expansion to the entire Influence Area is not yet established.
Table 2.5.8-20: Lengths of Existing Secondary Pipes by Sector and Material in the Study area
Sector Type of Material Total
(km) AC ACER FOFO PVC 83 A-1 9.29 1.87 11.16 83 A-2 18.75 2.60 21.35 83 B-1 10.06 0.19 10.25 83 B-2 29.84 5.78 35.62 84 A-1 15.70 18.39 34.09 84 A-2 20.42 4.05 24.47 84 B-1 26.10 3.76 29.86 84 B-2 3.79 9.60 13.38 85 A 11.25 6.13 17.38 85 B-1 4.79 0.03 4.46 9.27 85 B-2 8.34 0.26 8.60 85 B-3 5.51 0.41 5.92 85 C 13.10 2.52 15.62 212 A-1 3.62 26.69 30.31 212 A-2 6.76 13.31 20.07 212 B-1 0.92 13.55 14.47 212 B-2 0.54 12.10 12.64 213-1 12.65 22.69 35.34 213-2 0.62 0.62 213-3 0.03 1.05 1.08 253 0.21 0.21 256 4.32 4.32 259 12.40 0.22 1.43 14.05 345 0.06 13.31 13.37 346-1 4.67 4.68 9.35 346-2 9.25 6.38 15.63 347-1 3.92 14.44 18.36 347-2 11.61 19.84 31.45 348 A 7.64 7.64 348 B-1 17.37 3.22 20.59 348 B-2 0.24 0.13 0.01 0.38 349 A-1 12.90 0.70 3.51 17.11 349 A-2 1.61 2.11 3.72 349 A-3 0.84 0.06 7.63 8.53 349 B-1 0.71 8.71 9.42 349 B-2 3.03 6.12 9.15 349 B-3 5.63 2.19 7.82 350-1 34.81 34.81 350-2 22.65 14.43 37.08 351-1 0.93 2.06 2.99 351-2 2.63 2.63 351-3 0.19 0.46 0.65 361 26.90 26.90 368 A-1 0.02 21.96 21.98 368 A-2 0.01 5.59 5.60 368 B 0.06 33.85 33.91 369 A 0.23 25.11 25.34 369 B 0.48 27.95 28.43 370 8.90 1.62 10.52 Total 361.41 0.98 0.35 410.70 773.45 Percentage 46.73% 0.13% 0.05% 53.10% 100.00%
Source: SEDAPAL Cadastre and JICA Study Tea

FEASIBILITY STUDY ON NORTH LIMA METROPOLITAN AREA WATER SUPPLY AND SEWERAGE OPTIMIZATION PROJECT (II)
FINAL REPORT
NIPPON KOEI CO.,LTD. 2-128 NIPPON KOEI LAC CO.,LTD
Table 2.5.8-21: Numbers of the Accessories by Sector
75 100 150 200 250 300 Total 63 75 90 100 110 150 160 200 250 300 315 Total 50 75 90 100 150 200 250 300 Total 50 63 75 90 100 110 150 160 200 250 300 315 Total 50 100 150 200 250 Total 75 90 100 110 160 Total83 A-1 6 1 3 10 0 10 45 5 6 2 58 9 9 67 1 1 1 1 2 10 67 2 11.16 0.90 6.00 0.1883 A-2 12 5 3 4 24 2 2 26 70 22 8 4 104 1 8 4 1 1 15 119 1 1 2 2 26 119 2 21.35 1.22 5.57 0.0983 B-1 10 7 17 2 2 19 39 12 6 3 60 1 1 2 62 1 1 1 19 62 1 10.25 1.85 6.05 0.1083 B-2 40 14 2 1 57 4 1 5 62 4 3 110 53 4 11 185 26 18 2 1 47 232 1 1 1 1 2 62 232 2 35.62 1.74 6.51 0.0684 A-1 12 1 2 2 17 10 1 1 1 13 30 54 8 6 3 71 72 4 7 6 1 90 161 30 161 0 34.09 0.88 4.72 0.0084 A-2 4 3 4 1 12 2 3 5 17 80 10 10 13 113 17 3 20 133 1 1 2 2 17 133 2 24.47 0.69 5.44 0.0884 B-1 20 6 5 31 2 2 4 35 108 27 14 149 4 6 9 19 168 1 2 3 1 1 4 35 168 4 29.86 1.17 5.63 0.1384 B-2 6 1 2 9 1 4 3 1 9 18 16 2 5 1 24 11 7 24 9 2 53 77 18 77 0 13.39 1.34 5.75 0.00
85 A 85 A 14 4 1 19 4 4 23 53 15 11 1 1 81 1 31 8 3 43 124 1 1 1 23 124 1 17.38 1.32 7.13 0.0685 B-1 6 1 2 9 5 3 1 9 18 11 5 2 18 19 4 6 29 47 18 47 0 9.27 1.94 5.07 0.0085 B-2 13 4 2 19 1 1 20 28 8 5 4 45 1 1 46 1 1 2 2 20 46 2 8.60 2.33 5.35 0.2385 B-3 1 5 4 4 14 0 14 6 5 6 8 25 1 1 26 1 1 1 14 26 1 5.92 2.36 4.39 0.17
85 C 85 C 16 14 1 31 3 3 34 47 26 1 3 77 12 1 13 90 34 90 0 15.62 2.18 5.76 0.00212 A-1 3 2 5 1 24 5 30 35 1 1 11 2 2 2 19 2 5 10 138 8 3 1 167 186 3 3 3 35 186 3 30.31 1.15 6.14 0.10212 A-2 1 5 4 3 13 10 4 1 15 28 6 22 8 7 2 45 8 59 13 3 1 1 85 130 1 1 2 2 3 28 130 3 20.07 1.40 6.48 0.15212 B-1 1 1 12 2 14 15 2 1 3 4 67 8 1 80 83 15 83 0 14.47 1.04 5.74 0.00212 B-2 1 1 6 1 3 10 11 1 1 2 1 52 9 13 75 77 11 77 0 12.64 0.87 6.09 0.00213-1 10 6 2 18 1 14 2 1 18 36 2 52 20 4 4 82 34 71 13 7 125 207 1 1 2 2 6 8 10 36 207 10 35.34 1.02 5.86 0.28213-2 0 1 1 1 3 1 4 4 1 4 0 0.62 1.61 6.45 0.00213-3 0 1 1 2 2 2 2 4 4 1 1 1 2 4 1 1.08 1.85 3.70 0.93
253 253 0 1 1 1 1 0 0 0.21 4.76 0.00 0.00256 256 0 0 0 8 8 1 17 17 0 17 0 4.32 0.00 3.94 0.00259 259 4 5 4 2 15 1 1 2 17 18 25 19 4 66 1 2 5 2 10 76 2 2 2 17 76 2 14.05 1.21 5.41 0.14345 345 0 9 2 11 11 5 67 9 1 3 85 85 2 2 2 11 85 2 13.37 0.82 6.36 0.15
346-1 2 3 2 7 10 2 12 19 17 9 6 2 34 25 3 28 62 1 1 1 19 62 1 9.35 2.03 6.63 0.11346-2 9 7 16 8 2 10 26 39 13 1 1 54 1 3 29 7 1 41 95 26 95 0 15.63 1.66 6.08 0.00347-1 6 1 1 8 8 2 10 18 15 2 1 18 1 13 57 9 6 1 87 105 18 105 0 18.36 0.98 5.72 0.00347-2 9 5 1 1 16 10 1 1 12 28 39 15 2 5 3 64 63 9 3 5 80 144 28 144 0 31.45 0.89 4.58 0.00
348 A 348 A 2 8 3 13 0 13 11 16 13 2 42 42 1 1 1 13 42 1 7.64 1.70 5.50 0.13348 B-1 348 B-1 16 6 1 1 24 1 1 2 4 28 13 72 28 1 3 117 2 6 8 6 22 139 28 139 0 20.59 1.36 6.75 0.00348 B2 0.38
349 A-1 14 6 2 22 1 1 1 3 25 18 38 15 3 2 76 8 6 5 19 95 25 95 0 17.11 1.46 5.55 0.00349 A-2 1 1 3 1 4 5 1 5 2 8 3 7 2 12 20 5 20 0 3.72 1.34 5.38 0.00349 A-3 0 1 2 3 3 1 1 12 12 6 2 32 33 3 33 0 8.53 0.35 3.87 0.00349 B-1 0 3 3 3 11 6 21 4 1 43 43 3 43 0 9.42 0.32 4.56 0.00349 B-2 5 1 6 2 2 8 9 1 5 15 6 5 6 8 2 27 42 8 42 0 9.15 0.87 4.59 0.00349 B-3 7 3 10 0 10 1 11 9 1 1 23 9 2 11 34 10 34 0 7.82 1.28 4.35 0.00350-1 56 21 3 4 84 0 84 177 40 11 1 3 232 0 232 2 5 7 7 84 232 7 34.81 2.41 6.66 0.20350-2 43 11 4 1 59 7 1 1 9 68 117 23 7 4 1 152 1 17 53 13 1 85 237 1 1 1 68 237 1 37.08 1.83 6.39 0.03351-1 2 2 1 1 2 4 4 4 5 2 8 15 19 4 19 0 2.99 1.34 6.35 0.00351-2 0 1 1 1 22 22 22 1 22 0 2.63 0.38 8.37 0.00351-3 0 1 1 1 4 4 4 1 4 0 0.65 1.54 6.15 0.00
361 361 0 23 9 2 2 36 36 81 22 4 8 5 120 120 5 1 6 6 36 120 6 26.90 1.34 4.46 0.22368 A-1 0 1 2 8 1 4 2 2 20 20 1 1 10 14 74 1 2 9 2 112 113 3 3 3 20 113 3 21.98 0.91 5.14 0.14368 A-2 0 1 1 2 2 6 6 8 3 14 4 29 29 6 29 0 5.60 1.07 5.18 0.00
368 B 368 B 0 6 17 2 3 1 3 32 32 54 93 6 13 3 8 2 1 180 180 3 1 4 4 32 180 4 33.91 0.94 5.31 0.12369 A 369 A 0 8 8 5 21 21 4 6 82 2 8 9 1 112 112 3 3 3 21 112 3 25.34 0.83 4.42 0.12369 B 369 B 0 3 15 18 18 2 2 18 65 6 2 2 1 94 96 1 1 2 2 18 96 2 28.43 0.63 3.38 0.07370 370 5 8 1 14 0 14 3 5 2 1 11 1 1 1 3 14 7 12 1 3 23 4 6 10 33 14 14 33 10.52 1.33 1.33 3.14
7 368 153 47 23 6 604 1 13 8 35 215 4 61 22 8 1 2 370 974 4 74 1 1,343 418 139 85 17 2,081 1 11 183 129 181 1,272 22 223 100 39 5 6 2,172 4,253 2 19 21 3 4 49 8 5 2 31 4 50 99 974 4,253 99 773.45 1.34 5.34 0.15
349 B
350
351
368 A
Total general
212 B
213
346
347
349 A
84 A
84 B
85 B
212 A
Válvula VálvPurga
83 A
83 B
Hidrante Válvula Válv
PurgaHidrante
Total PVC
Total AC PVCAC PVC
TotalAC
VALVES BY TYPE OF MATERIAL AND PIPE DIAMETER IN SECONDARY NETWORKS OF SEWERAGE BY SUB-SECTOR VULAS Y GRIFOS POR LONG. TUB. POR SUB - SEC
Sector SubSectorHYDRANT VALVES SLUICE VALVES DRAIN VALVES Total Long.
TuberíaSub-
Sector
Ratio (Cant. / km)
Source: SEDAPAL Cadastre and JICA Study Team

FEASIBILITY STUDY ON NORTH LIMA METROPOLITAN AREA WATER SUPPLY AND SEWERAGE OPTIMIZATION PROJECT (II)
FINAL REPORT
NIPPON KOEI CO.,LTD. 2-129 NIPPON KOEI LAC CO.,LTD
2) Pipe Materials, Diameter and Ages of Pipes
(a) Distribution of Pipes by Materials, Diameter and Ages
Distribution of the four kinds of pipe materials, ages and diameters of the pipes are presented in the following figures and tables:
• Table 2.5.8-22 : Length of Secondary Pipe by Age
• Table 2.5.8-23 : Length of AC Pipe by Age
• Table 2.5.8-24 : Length of PVC Pipe by Age
• Table 2.5.8-25 : Length of Pipe by Diameter and Material
• Figure 2.5.8-14 : Distribution of Secondary Pipes by Material
• Figure 2.5.8-15 : Distribution of Secondary Pipes by Age
• Figure 2.5.8-16 : Distribution of AC Pipes in the Secondary Networks by Age
• Figure 2.5.8-17 : Distribution of PVC Pipes in the Secondary Networks by Age
•

FEASIBILITY STUDY ON NORTH LIMA METROPOLITAN AREA WATER SUPPLY AND SEWERAGE OPTIMIZATION PROJECT (II)
FINAL REPORT
NIPPON KOEI CO.,LTD. 2-130 NIPPON KOEI LAC CO.,LTD
Table 2.5.8-22: Length of Secondary Pipe by Age
Sectors No data
Less than 5 years
From 5 to 10 Years
From 10 to 15 Years
From 15 to 20 Years
From 20 to 25 Years
From 25 to 30 Years
From 30 to 35 Years
More than 35 Years
Total (Km)
83 A-1 5.27 0.07 0.44 5.38 11.16 83 A-2 1.11 5.08 1.42 7.38 6.36 21.35 83 B-1 0.13 6.50 3.62 10.25 83 B-2 0.05 12.36 0.01 10.42 8.25 4.53 35.62 84 A-1 0.20 1.44 28.07 4.34 0.04 34.09 84 A-2 24.40 0.07 24.47 84 B-1 0.30 1.69 22.13 4.43 1.31 29.86 84 B-2 3.01 8.29 1.20 0.89 13.39 85 A 0.28 5.26 3.23 4.41 4.20 17.38
85 B-1 0.30 0.88 3.33 0.40 4.33 0.03 9.27 85 B-2 1.00 0.23 7.37 8.60 85 B-3 0.28 0.61 0.41 0.52 4.10 5.92 85 C 0.17 0.17 3.10 3.59 1.70 6.89 15.62
212 A-1 0.78 15.86 13.67 30.31 212 A-2 13.13 6.94 20.07 212 B-1 0.25 14.05 0.17 14.47 212 B-2 1.83 10.81 12.64 213-1 3.11 21.66 9.70 0.87 35.34 213-2 0.62 0.62 213-3 1.08 1.08 253 0.21 0.21 256 4.32 4.32 259 13.83 0.22 14.05 345 7.14 6.23 13.37
346-1 9.26 0.09 9.35 346-2 0.41 7.46 5.01 2.75 15.63 347-1 0.42 8.07 9.87 18.36 347-2 0.83 0.16 13.47 16.38 0.61 31.45 348 A 7.64 7.64
348 B-1 0.07 0.04 1.12 4.14 14.15 1.07 20.59 348 B-2 0.02 0.23 0.13 0.38 349 A-1 0.10 0.28 1.03 5.41 9.59 0.70 17.11 349 A-2 0.18 3.54 3.72 349 A-3 8.47 8.47 349 B-1 2.14 7.28 9.42 349 B-2 2.55 6.60 9.15 349 B-3 0.74 0.22 6.86 0.06 7.88 350-1 0.23 0.15 4.22 1.28 28.93 34.81 350-2 3.01 8.78 2.49 1.42 1.96 1.09 18.33 37.08 351-1 0.17 1.73 0.24 0.20 0.65 2.99 351-2 0.62 2.01 2.63 351-3 0.46 0.19 0.65 361 0.04 24.29 2.57 26.90
368 A-1 12.41 9.57 21.98 368 A-2 2.17 3.43 5.60 368 B 31.56 2.35 33.91 369 A 20.69 4.65 25.34 369 B 26.43 1.96 0.04 28.43 370 0.78 0.02 1.54 0.07 8.11 10.52
Total 3.46 137.03 130.19 212.99 94.26 94.05 7.98 54.01 39.48 773.45 Percentage 0.45% 17.74% 16.85% 27.54% 12.23% 12.24% 1.03% 6.98% 4.93% 100.00%
Source: JICA Study Team
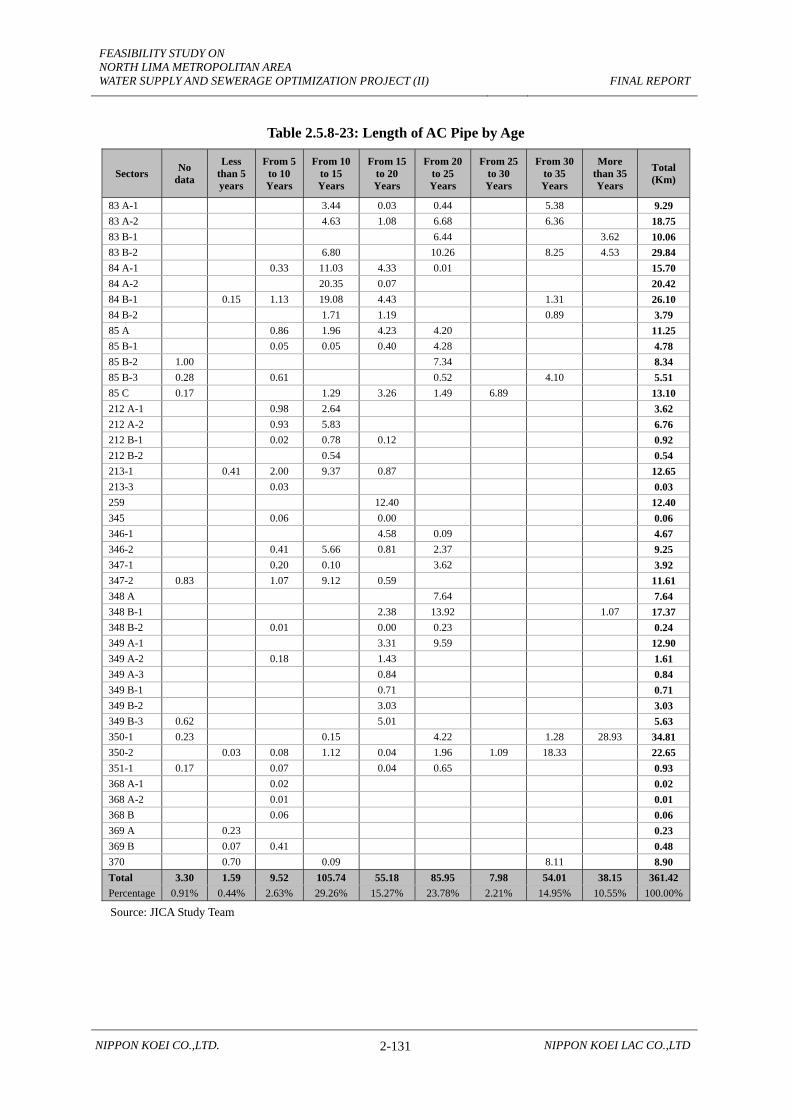
FEASIBILITY STUDY ON NORTH LIMA METROPOLITAN AREA WATER SUPPLY AND SEWERAGE OPTIMIZATION PROJECT (II)
FINAL REPORT
NIPPON KOEI CO.,LTD. 2-131 NIPPON KOEI LAC CO.,LTD
Table 2.5.8-23: Length of AC Pipe by Age
Sectors No data
Less than 5 years
From 5 to 10 Years
From 10 to 15 Years
From 15 to 20 Years
From 20 to 25 Years
From 25 to 30 Years
From 30 to 35 Years
More than 35 Years
Total (Km)
83 A-1 3.44 0.03 0.44 5.38 9.29 83 A-2 4.63 1.08 6.68 6.36 18.75 83 B-1 6.44 3.62 10.06 83 B-2 6.80 10.26 8.25 4.53 29.84 84 A-1 0.33 11.03 4.33 0.01 15.70 84 A-2 20.35 0.07 20.42 84 B-1 0.15 1.13 19.08 4.43 1.31 26.10 84 B-2 1.71 1.19 0.89 3.79 85 A 0.86 1.96 4.23 4.20 11.25 85 B-1 0.05 0.05 0.40 4.28 4.78 85 B-2 1.00 7.34 8.34 85 B-3 0.28 0.61 0.52 4.10 5.51 85 C 0.17 1.29 3.26 1.49 6.89 13.10 212 A-1 0.98 2.64 3.62 212 A-2 0.93 5.83 6.76 212 B-1 0.02 0.78 0.12 0.92 212 B-2 0.54 0.54 213-1 0.41 2.00 9.37 0.87 12.65 213-3 0.03 0.03 259 12.40 12.40 345 0.06 0.00 0.06 346-1 4.58 0.09 4.67 346-2 0.41 5.66 0.81 2.37 9.25 347-1 0.20 0.10 3.62 3.92 347-2 0.83 1.07 9.12 0.59 11.61 348 A 7.64 7.64 348 B-1 2.38 13.92 1.07 17.37 348 B-2 0.01 0.00 0.23 0.24 349 A-1 3.31 9.59 12.90 349 A-2 0.18 1.43 1.61 349 A-3 0.84 0.84 349 B-1 0.71 0.71 349 B-2 3.03 3.03 349 B-3 0.62 5.01 5.63 350-1 0.23 0.15 4.22 1.28 28.93 34.81 350-2 0.03 0.08 1.12 0.04 1.96 1.09 18.33 22.65 351-1 0.17 0.07 0.04 0.65 0.93 368 A-1 0.02 0.02 368 A-2 0.01 0.01 368 B 0.06 0.06 369 A 0.23 0.23 369 B 0.07 0.41 0.48 370 0.70 0.09 8.11 8.90 Total 3.30 1.59 9.52 105.74 55.18 85.95 7.98 54.01 38.15 361.42 Percentage 0.91% 0.44% 2.63% 29.26% 15.27% 23.78% 2.21% 14.95% 10.55% 100.00%
Source: JICA Study Team

FEASIBILITY STUDY ON NORTH LIMA METROPOLITAN AREA WATER SUPPLY AND SEWERAGE OPTIMIZATION PROJECT (II)
FINAL REPORT
NIPPON KOEI CO.,LTD. 2-132 NIPPON KOEI LAC CO.,LTD
Table 2.5.8-24: Length of PVC Pipe by Age
Sector No data Less
than 5 years
From 5 to 10 Years
From 10 to 15 Years
From 15 to 20 Years
From 20 to 25 Years
Total (km)
83 A-1 1.83 0.04 1.87 83 A-2 1.11 0.45 0.34 0.70 2.61 83 B-1 0.13 0.06 0.19 83 B-2 0.05 5.56 0.01 0.16 5.79 84 A-1 0.20 1.11 17.04 0.01 0.03 18.39 84 A-2 4.05 4.05 84 B-1 0.15 0.56 3.05 3.76 84 B-2 3.01 6.58 0.01 9.60 85 A 0.28 4.40 1.27 0.18 6.13 85 B-1 0.30 0.83 3.28 0.05 4.46 85 B-2 0.23 0.03 0.26 85 B-3 0.41 0.41 85 C 0.17 1.81 0.33 0.21 2.54 212 A-1 0.78 14.88 11.03 26.68 212 A-2 12.20 1.11 13.31 212 B-1 0.23 13.27 0.05 13.55 212 B-2 1.83 10.27 12.10 213-1 2.70 19.66 0.33 22.69 213-2 0.62 0.62 213-3 1.05 1.05 253 0.21 0.21 256 4.32 4.32 259 1.43 1.43 345 7.14 6.17 13.31 346-1 4.68 4.68 346-2 1.80 4.20 0.38 6.39 347-1 0.22 7.97 6.25 14.44 347-2 0.16 12.40 7.26 0.02 19.84 348 B-1 0.07 0.04 1.12 1.76 0.23 3.22 348 B-2 0.01 0.01 349 A-1 0.10 0.28 1.03 2.10 3.50 349 A-2 2.11 2.11 349 A-3 7.63 7.63 349 B-1 2.14 6.57 8.71 349 B-2 2.55 3.57 6.12 349 B-3 0.12 0.22 1.85 2.20 350-2 2.98 8.70 1.37 1.38 14.43 351-1 1.73 0.17 0.16 2.06 351-2 0.62 2.01 2.62 351-3 0.46 0.46 361 0.04 24.29 2.57 26.90 368 A-1 12.41 9.55 21.96 368 A-2 2.17 3.42 5.59 368 B 31.56 2.29 33.85 369 A 20.46 4.65 25.10 369 B 26.36 1.55 0.04 27.96 370 0.08 0.02 1.45 0.07 1.62 Total 0.16 135.44 120.67 107.25 39.08 8.10 410.70 Percentage 0.04% 32.97% 29.38% 26.12% 9.52% 1.98% 100.00%
Source: JICA Study Team
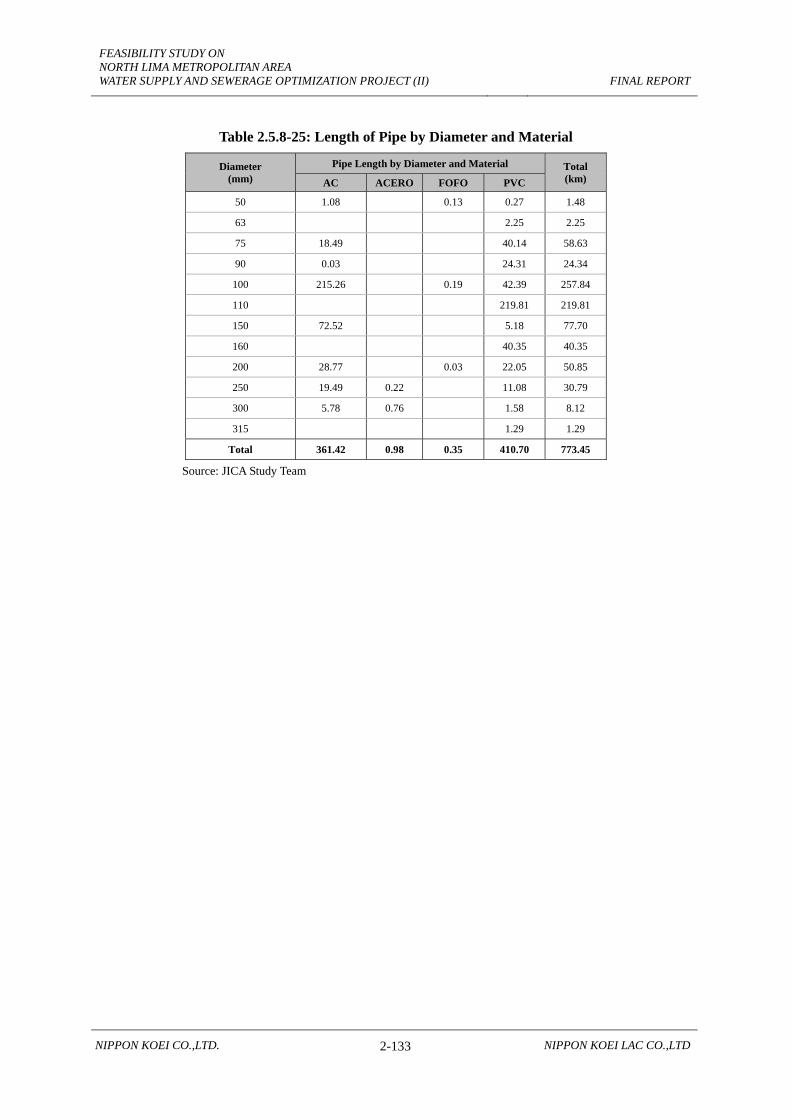
FEASIBILITY STUDY ON NORTH LIMA METROPOLITAN AREA WATER SUPPLY AND SEWERAGE OPTIMIZATION PROJECT (II)
FINAL REPORT
NIPPON KOEI CO.,LTD. 2-133 NIPPON KOEI LAC CO.,LTD
Table 2.5.8-25: Length of Pipe by Diameter and Material
Diameter (mm)
Pipe Length by Diameter and Material Total (km) AC ACERO FOFO PVC
50 1.08 0.13 0.27 1.48
63 2.25 2.25
75 18.49 40.14 58.63
90 0.03 24.31 24.34
100 215.26 0.19 42.39 257.84
110 219.81 219.81
150 72.52 5.18 77.70
160 40.35 40.35
200 28.77 0.03 22.05 50.85
250 19.49 0.22 11.08 30.79
300 5.78 0.76 1.58 8.12
315 1.29 1.29
Total 361.42 0.98 0.35 410.70 773.45
Source: JICA Study Team