the predictive validity of a psychological test
TRANSCRIPT

THE PREDICTIVE VALIDITY OF A PSYCHOLOGICAL TEST BATTERY FOR
THE SELECTION OF CADET PILOTS IN A COMMERCIAL AIRLINE
by
VUSUMUZI QUIRION MNGUNI
submitted in accordance with the requirements for
the degree of
MASTER OF COMMERCE
in the subject
INDUSTRIAL AND ORGANISATIONAL PSYCHOLOGY
at the
UNIVERSITY OF SOUTH AFRICA
SUPERVISOR: PROF. M. DE BEER
MARCH 2011

iii.
STATEMENT: I declare that this dissertation: “The predictive validity of a psychological test
battery for the selection of cadet pilots in a commercial airline”, is my own work
and that all the resources used or quoted have been indicated and acknowledged by
means of complete reference.
________________ ___________________
V. Q. MNGUNI DATE

ACKNOWLEDGEMENTS
I would like to express my gratitude to the following people: South African Airways management and staff for allowing and giving me access to the information for this research. The Almighty for giving me the opportunity and grace to undertake this research until completion. Frans van Staden for his encouragement, support and believing in my capability. My wife Pheello and children for their understanding and support as well as sacrifice of their time. Finally, my sincere appreciation and gratitude to my supervisor Prof. M. De Beer, for her guidance, assistance, reassurance and encouragement, which has made me achieve a milestone in completing this research.
ii

xv
SUMMARY
THE PREDICTIVE VALIDITY OF A PSYCHOLOGICAL TEST
BATTERY FOR THE SELECTION OF CADET PILOTS FOR A
COMMERCIAL AIRLINE
By Vusumuzi Quirion Mnguni Degree: M. Comm. Subject: Industrial Psychology Supervisor: Prof. M. de Beer
Commercial airlines need to employ well qualified pilots to run their core business. The current
supply from privately and military qualified pilots is proving to be inadequate. A further challenge
facing the airline is having to attempt to reflect the diversity of the country in its workforce.
The present study investigated the predictive validity of a psychological test battery for cadet
pilots. The predictors that were included in the research are: biographical data, ABET levels in
terms of English and Matric results, as well as results from psychological tests, namely: English
literacy skills assessment (ELSA), Raven’s Progressive Matrices (RMP), Blox test, subtests of
the Intermediate Battery (B/77) viz: Arithmetic 1 and 2, and Reading Comprehension, and the
Wechsler Adult Intelligence Scale (WAIS). The objective of the research was to determine the
predictive validity of the selection battery utilizing the final flying school results as the criteria.
The results of the research were inconclusive. Only some of the tests showed positive
correlations with the modules of the flying school results. The Ravens Progressive Matrices,
Blox, Matriculation English symbol, ABET levels and Reading Comprehension, were found to
have predictive power with some of the modules of the flying school results based on the
regression analysis.
It is recommended that a revised profile for a commercial airline pilot should be developed, as
well as that the critical skills and competencies should be identified to enable the airlines to
utilize appropriate and relevant assessment tools to select prospective candidates, particularly
among the previously disadvantaged communities.

xvi
Key words
i. Psychological tests; intelligence/aptitude; literacy; numeracy; predictive validity;
selection; cadet pilot.

iv
TABLE OF CONTENTS
Page ACKNOWLEDGEMENTS ii LIST OF TABLES xi LIST OF FIGURES xiv SUMMARY xv CHAPTER 1
BACKGROUND TO AND RATIONALE FOR THE RESEARCH 1 1.1 INTRODUCTION 1
1.2 PROBLEM STATEMENT 6
1.3 RESEARCH AIMS 7
1.3.1 General aim 7
1.3.2 Specific aims of the literature review 8
1.3.3 Specific aims of the empirical study 8
1.4 THE PARADIGM PERSPECTIVE OF THE RESEARCH 8
1.4.1 Applicable psychological paradigms 8
1.4.1.1 Cognitive behaviourism
1.4.1.2 Functionalism
1.4.1.3 Empiricism
1.4.2 Meta-theoretical statements 10
1.4.3 Market of intellectual resources 12
1.4.4 Psychological models and theories 13
1.4.5 Applicable concepts and constructs 13
1.4.6 Methodological assumptions 15
1.5 RESEARCH DESIGN 16
1.5.1 Research variables 16

v
1.5.1.1 Independent variables 16
1.5.1.2 Dependent variables 17
1.6 RESEARCH METHOD 17
1.6.1 Literature review 17
1.6.1.1 The use of psychological tests in the selection of cadet pilots 17
1.6.1.2 The nature of literacy and numeracy 17
1.6.1.3 Integration 18
1.6.2 The empirical study 18
1.6.2.1 Data collection 18
1.6.2.2 Data processing 18
1.6.2.3 Research hypotheses 18
1.6.2.4 Reporting the results 19
1.6.2.5 Conclusion, limitations and recommendations 19
1.7 LAYOUT OF CHAPTERS 19
1.8 CHAPTER SUMMARY 20
CHAPTER 2 THE USE OF PSYCHOLOGICAL TESTS IN SELECTION 21
WITH SPECIFIC FOCUS ON MEASUREMENTS OF COGNITIVE
ASPECTS
2.1 INTRODUCTION 21
2.2 DEFINITION OF CONCEPTS 21
2.2.1 Selection process 22
2.2.2 Definition of selection 25
2.3 PSYCHOLOGICAL TESTS 26
2.3.1 Definition of psychological tests 27
2.3.2 Functions of psychological tests 28
2.4 THE DETERMINANTS OF PILOT TRAINING SUCCESS 32
2.4.1 Intelligence and aptitude 32
2.4.2 Psychomotor coordination 32

vi
2.4.3 Personality 33
2.5 THE DEVELOPMENT AND THEORIES OF INTELLIGENCE 33
2.5.1 Spearman’s two-factor model 34
2.5.2 Thurstone’s primary mental abilities model 34
2.5.3 Cattell’s model 35
2.5.4 Gustafsson’s three-level model 37
2.5.5 Carroll’s three-stratum theory 38
2.5.6 Definition of intelligence 40
2.5.7 Measurement of intelligence 43
2.6 DEFINITION OF APTITUDE 45
2.6.1 Measurement of aptitude 50
2.7 PSYCHOLOGICAL TESTS THAT MEASURE INTELLIGENCE 53
AND APTITUDE
2.7.1 Requirements for psychological measures 58
2.7.1.1 Reliability 58
2.7.1.2 Validity 59
2.8 OVERVIEW OF THE STRUCTURE AND FORMAT 61
OF THE CADET PILOT TRAINING PROGRAMME
2.8.1 Content of the cadet training programme 62
2.8.2 Duties and responsibilities of a pilot 63
2.8.3 Psychological profile of a pilot 65
2.9 CHAPTER SUMMARY 66
CHAPTER 3 LITERACY AND NUMERACY 67
3.1 INTRODUCTION 67
3.2 LITERACY 67
3.2.1 Literacy in the South African context 68
3.2.2 Definition of literacy 69
3.2.3 Development of language skills for basic English 72

vii
3.2.3.1 Theories and models in language testing 72
3.2.3.2 Language testing 74
3.2.3.3 Language skills for basic English literacy 79
3.2.4 Components of language 81
3.2.4.1 Context of language 82
3.2.4.2 Forms of language 82
3.2.4.3 Use of language 83
3.2.5 Basic dimensions of language 84
3.2.5.1 Basic functions of language 85
3.3 NUMERACY 94 3.3.1 Definition of numeracy 94
3.3.2 Development of skills for basic numeracy 96
3.3.2.1 Theories, models and skills for basic numeracy 96
3.3.3 Basic dimensions of numeracy 100
3.3.3.1 Basic functions of numeracy 101
3.4 INTEGRATION OF LANGUAGE, LITERACY AND NUMERACY 104 3.5 CHAPTER SUMMARY 107 CHAPTER 4 THE EMPIRICAL STUDY 108
4.1 INTRODUCTION 108
4.2 DESCRIPTION OF THE POPULATION AND SAMPLE 108
4.2.1 Biographical profile of the sample in the second phase (phase 2) 112
4.3 PSYCHOLOGICAL TESTS USED AS MEASURING 117 INSTRUMENTS 4.3.1 General proposed profile of a pilot 117
4.3.2 Psychological assessment instruments used in the cadet pilot 122
selection procedure
4.3.2.1 English Literacy Skills Assessment (ELSA) 122
4.3.2.2 The Blox Test 125
4.3.2.3 Raven’s Progressive Matrices (RPM) test 127

viii
4.3.2.4 The Intermediate Battery (B/77) 130
4.3.2.5 The Wechsler Adult Intelligence Scale (WAIS) 132
4.3.2.6 Biographical factors and matriculation results 139 4.4 DATA COLLECTION AND PROCESSING 140 4.4.1 Data collection for the independent variables 141
4.4.2 Data collection for the dependent variables 141 4.5 DATA ANALYSIS 142
4.5.1 Introduction 142
4.5.2 Descriptive statistics 142
4.5.3 Inferential statistics 143
4.5.3.1 ANOVA 144
4.5.3.2 Correlation analysis 144
4.5.3.3 Regression analysis 145
4.5.4 Statistical techniques used 146
4.5.5 Level of statistical significance 147
4.5.6 Practical effect size 148
4.6 RESEARCH HYPOTHESES 149 4.6.1 Hypotheses regarding the validity of each psychological test 149 in phase 1 of the selection for predicting performance in a cadet pilot training programme 4.6.2 Hypotheses regarding the validity of each psychological test 150 in phase 2 of the selection for predicting performance in a cadet pilot training programme 4.7 CHAPTER SUMMARY 151 CHAPTER 5
THE RESEARCH RESULTS 152
5.1 INTRODUCTION 152 5.2 RESULTS OF THE PSYCHOMETRIC TESTS IN 152 PHASE 1: COMPARISON BETWEEN THE RACE AND GENDER GROUPS
5.2.1 Results of the tests per race group on the independent variables 154
5.2.1.1 Summary 158
5.2.2 Results for the tests by gender (within race) 159

ix
5.2.2.1 Blacks 160
5.2.2.2 Coloureds 162
5.2.2.3 Asians 164
5.2.2.4 Whites 166
5.2.2.5 Summary of descriptive results 167
5.2.3 Relationship between psychometric 167 tests (phase 1)
5.3 THE RESULTS OF THE PSYCHOMETRIC SUBTESTS DURING 168 PHASE 2: COMPARISON OF RACE GROUPS 5.4 SUMMARY OF THE COMPARISON OF THE SUBGROUP RESULTS 175 5.5 CORRELATION BETWEEN PHASE 1 AND PHASE 2 176
RESULTS AND PERFORMANCE IN THE CADET PILOT
TRAINING PROGRAMME
5.5.1 Correlations between the phase 1 test results and performance 177
in the cadet training programme
5.5.2 Correlations between the phase 2 test results and performance 182
in the cadet training programme
5.5.3 Stepwise regression analysis 188
5.6 INTEGRATION OF RESULTS 196
5.6.1 Descriptive statistics and group comparison 196
5.6.2 Correlation analysis 196
5.6.3 Stepwise regression analysis 197
5.7 TESTING OF THE RESEARCH HYPOTHESES 197
5.7.1 Hypothesis testing regarding the psychological tests 199
5.7.2 Discussion 204
5.8 CHAPTER SUMMARY 207 CHAPTER 6
CONCLUSIONS, LIMITATIONS AND RECOMMENDATIONS FOR 208 FUTURE RESEARCH 6.1 INTRODUCTION 208
6.1.1 General conclusions 208

x
6.1.2 Specific conclusions relating to the literature review 209
6.1.2.1 Conclusions relating to intelligence, aptitude, psychological tests 209
and selection
6.1.2.2 Conclusions relating to literacy and numeracy 210
6.1.3 Specific conclusions relating to the empirical research 211
6.1.3.1 Conclusions relating to psychological test battery 211
6.1.3.2 Conclusions relating to the importance of other variables: English 212
Matric symbol and literacy as well as ABET levels, in determining
the successful completion of the cadet training programme
6.1.4 Potential resolution of the research problem 212 6.2 LIMITATIONS OF THE PRESENT RESEARCH 213
6.2.1 Practical constraints 214
6.2.2 Restriction of range 214
6.2.3 Sample 215
6.3 RECOMMENDATIONS 216
6.3.1 Incorporation of other psychological paradigms 216
6.3.2 Cross-validation 218
6.3.3 Longitudinal study of progress through performance 218
6.4 CHAPTER SUMMARY 219 REFERENCES 221

xi
LIST OF TABLES Table 2.1: Content of each module in phase 1: the preparation course 62 Table 2.2: Content of each module in phase 2: the flying course 63 Table 2.3: General duties of pilot 64 Table 3.1: The four basic components of comprehension 91 Table 3.2: Differences between arithmetic and numeracy 95 Table 4.1: Distribution of applications by half yearly intake 109 Table 4.2: Race distribution of applicants 110 Table 4.3: Gender distribution of applicants 110 Table 4.4: Mid-year estimates for South Africa by population group 111 and sex, 2006 Table 4.5: Race by gender distribution of applicants 112 Table 4.6: Race distribution of second phase candidates 113 Table 4.7: Gender distribution of second phase candidates 114 Table 4.8: Race and gender of second phase candidates 115 Table 4.9: Proportion of each demographic group included 116
in phase 2, as a percentage of phase 1 participants Table 4.10: Proposed profile of a pilot 117 Table 4.11: The psychological instruments used 121 Table 5.1: Descriptive statistics for the psychometric tests in phase 1 154 Table 5.2: ANOVA comparison of race groups in each of the tests 156 Table 5.3: Scheffé subsets of race group on Raven’s Test 157 Table 5.4: Scheffé subsets of race group on the Blox Test 157 Table 5.5: Scheffé subsets of race group on the reading 158 comprehension test Table 5.6: Scheffé subsets of race group in arithmetic 1 158 Table 5.7: Scheffé subsets of race group on arithmetic 2 158

xii
Table 5.8: Descriptive statistics for gender among blacks on 160 the independent variables Table 5.9: ANOVA comparison of the black gender groups 161 Table 5.10: Descriptive statistics per gender group for the coloureds 162 in the independent variables Table 5.11: ANOVA comparison of the coloured gender groups 163 Table 5.12: Descriptive statistics per Asian gender group on the 164 independent variables Table 5.13: ANOVA comparison of the Asian gender groups 165 Table 5.14: Descriptive statistics per the white gender group 166 on the independent variables Table 5.15: ANOVA comparison of the white gender groups 167 Table 5.16: Correlation matrix of the tests in phase 1 168 Table 5.17: Descriptive statistics for the test results for phase 2, 169 per gender group Table 5.18: Tests of between-subjects’ effects per test between race groups 171 Table 5.19: Scheffé test results for level of literacy 172 Table 5.20: Scheffé test results for the ABET levels 173 Table 5.21: Scheffé results for the English Matric symbol 173 Table 5.22: Scheffé results for digits combined 174 Table 5.23: Scheffé results for picture completion 174 Table 5.24: Scheffé results for object assembly 175 Table 5.25: Scheffé results for block design 175 Table 5.26: Correlations between the phase 1 test results and 178 the final flying school results Table 5.27: Correlations between the phase 2 test results and 183 the final flying school results Table 5.28: Predicting performance in meteorology 190 Table 5.29: Predicting performance in navigation 192 Table 5.30: Predicting performance in radio 193

xiii
Table 5.31: Predicting performance in air law and procedures 193 Table 5.32: Predicting performance in human performance 194 Table 5.33: Predicting performance in aircraft technical 195 Table 5.34: Hypothesis testing of the results 198

xiv
LIST OF FIGURES Figure 2.1: The selection process 24 Figure 2.2: Gustafsson’s hierarchical model of intelligence 37 Figure 3.1: The three bases of the environment as seen from 87 the perspective of language Figure 3.2: Components of reading 88 Figure 3.3: Numeracy in a social context 99 Figure 3.4: Model integrating the development of the 104
numeracy concepts, skills and language Figure 5.1: Mean score per race group for the psychometric tests in phase 1 155

1
CHAPTER 1
BACKGROUND TO AND RATIONALE FOR THE RESEARCH
1.1 INTRODUCTION
According to Marais (2010), the official unemployment rate in South Africa rose to 23.5% in the
first quarter of 2010, from 21.9% in the previous quarter, ending a five-year decline. He further
reports that the actual unemployment rate is closer to 40%, and among young African men and
women it probably exceeds 60%. This information emphasises the fact that the country needs to
rebuild local industrial capacity. The government has promised to create four million “new jobs”
by 2014 (Marais, 2010). It can be inferred that there is currently an oversupply of applicants
chasing the few available jobs, which poses a challenge for organisations and employers who
need to appoint employees with a better chance of succeeding in their positions.
For years, the airline industry has been perceived as a white male-dominated industry.
Vermeulen (2009) concurs and reports that in the last decade, new South African government
and labour policies have been put in place to encourage more women to become aviators.
However, even though women have been aviators for almost as long as men, aviation is still
largely a male-dominated profession.
According to Copans (2007), Frankel (president of the Commercial Aviation Association of
South Africa [CAASA]) has noted that historically, many airline pilots were originally air force
pilots. However, this is no longer the case, and there is now a dearth of skilled pilots in the
aviation industry. Hence substantial effort is required to attract more people to the aviation
industry, including previously disadvantaged people, so that they can be trained as pilots.
According to Frankel (Copans, 2007), the increased inclusion of previously disadvantaged
people into aerospace industry is imperative for the sustainability of the industry. He further
asserts that aggressive, government-supported training and apprentice schemes are required to
attract young black talent to this segment of the industry.
According to Theron (2009), selection from a diverse group poses a real and formidable
challenge to the field of industrial psychology in South Africa. The challenge is to develop

2
selection procedures that simultaneously add value, do not discriminate unfairly and minimise
the adverse impact. Theron (2009) emphasised that the success of organisations in such an
undertaking of efficiently combining and transforming scarce factors of production into products
and services with economic utility, requires competent high-performing employees. At the same
time, however, South African organisations are under moral, economic, political and legal
pressure to diversify their workforce.
It can be argued that the promulgation of legislation, particularly the Employment Equity Act 55
of 1998 (EEA) and the Skills Development Act 97 of 1998, after the 1994 democratic elections,
introduced a number of new employment practices.
Psychometric assessment in most South African organisations was part and parcel of the
selection process. However, the promulgation of the above-mentioned Acts has prompted
organisations to review their employment processes and procedures with a particular focus on
the use of, inter alia, psychological assessments.
According to Muller and Schepers (2003) and Van de Vijver and Rothmann (2004), in South
Africa, reference to psychometric testing is made in the EEA, chapter 2 point 8: “Psychometric
testing of an employee is prohibited unless the test -
a) Has been scientifically validated as providing reliable results which are appropriate for
the intended purpose;
b) Can be applied fairly to employees irrespective of their culture, and
c) Is not biased against people from designated groups.
According to this legislation, the burden of proof has been placed on the organisation to justify
the utilisation of psychological instruments in their employment practices with the emphasis on
the previously disadvantaged people. This view is supported by Nzama, De Beer and Visser
(2008) who confirmed that the introduction of the Labour Relations Act (1995) has compelled
organisations to ensure that their employment practices are fair.
These views indicate that the selection instruments and procedures need to be re-evaluated to
ensure that they discriminate fairly. Theron (2009) refers to the Uniform Guideline on Employee
Selection Procedures published by the Equal Employment Opportunity Commission (EEOC)
which endorses this position by stipulating the following: “Where two or more selection

3
procedures are available which serve the user’s legitimate interest in efficient and trustworthy
workmanship, and which are substantially equally valid for a given purpose, the user should use
the procedure which has been demonstrated to have the lesser adverse impact” (EEOC, 1978,
p. 3897).
Owing to the oversupply of job applicants, one of the functions of human resources is to select
and appoint employees who will help the organisation succeed by selecting, appointing and
retaining a competent and motivated workforce. Theron (2009) concurred when he postulated
that the objective of personnel selection is to allow only those applicants to enter the
organisation who would perform satisfactorily in their designated positions.
Another challenge for organisations and employers is the Skills Development Act 97 of 1998),
the purpose of which is
a) To develop the skills of South African workforce;
b) To increase the levels of investment in education and training in the labour market and
improve the return on that investment;
c) To encourage employers -
i. To use the workplace as an active learning environment;
ii. To provide employees with the opportunities to acquire new skills;
iii. To provide opportunities for new entrants to the labour market to gain work
experience; and
iv. To employ persons who find it difficult to be employed
d) To encourage workers to participate in learnership and other training programmes;
e) To improve the employment prospects of person previously disadvantaged by unfair
discrimination and redress those disadvantages through training and education;
f) To ensure the quality of education and training in and for the workplace
g) To assist -
i. Work-seekers to find work;
ii. Retrenched workers to re-enter the labour market;
iii. Employers to find qualified employees; and
h) To provide and regulate employment services.
This legislation has placed another burden on organisations, namely to create opportunities to
uplift the standard of living of historically disadvantaged people. According to Meiring, Van de

4
Vijver, Rothmann and Barrick (2005), there is an urgent need for measuring instruments that
meet the EEA requirements and that can be used for all the culture and language groups in
South Africa.
Van Der Merwe (2002) stated that one of the critical elements in ensuring outstanding
organisational performance is the selection and development of excellent staff. International as
well as local research has demonstrated the role that psychometric assessment can play in
significantly improving the selection process for both new entrants and internal promotions.
According to Van Der Merwe (2002), effective psychometric assessment can also play a part in
staff development processes – a critical challenge that currently faces South Africa.
Paterson and Uys (2005) have noted that the changing world of work has an impact on
assessment practices. They suggest that in the “new” organization, the focus is on recruiting
and developing employees with the ability to work flexibly and adaptively, owing to rapid
changes inside and outside the organisation. Assessment can contribute to the identification of
these employees.
In order to contextualise the need for this study, the commercial airline used in the research,
utilised psychometric tests in the selection of trainees for their cadet pilot training programme.
However, the relevance and appropriateness of these psychological tests could be questioned
as part of the selection battery.
Ritson (in Muller & Schepers, 2003) postulated that the rationale for using psychometric tests in
the selection process lies in the purported ability of the testing instruments to accurately and
objectively assess an applicant’s ability to perform the work required by the job.
The importance of validation of any instruments to be used for assessment purposes is
highlighted by the ongoing developments in South African labour legislation and the implications
of the EEA in particular. According to Van Der Merwe (1999), these issues also accentuate
once again the need for the responsible use of tests and other psychological procedures.
Experience has shown that tests are generally far more reliable and more valid than other
techniques (Van der Walt, 1998). Van der Walt (1998) further stated that studies in trade and
industry have indicated that psychometric tests are about four times more effective than

5
screening interviews. The commercial airline thus exercised sound practice in using
psychological tests in the selection process for the cadet pilot training programme.
The literature on pilot selection indicates that the military introduced this process during the
World War II. The identification of candidates who are likely to succeed as military pilots has
been a longstanding goal (Carreta & Ree, 1989). According to Carretta and Ree (1996), the
selection of military pilots has always included the use of multiple aptitude test batteries. They
(1996, p. 279) further stated that “these tests have been described as measuring a variety of
abilities that have demonstrated utility in predicting pilot success”. This statement refers
specifically to two tests used by the United States Air Force (USAF) namely, the Air Force
Officer Qualifying Test (AFOQT) and the Basic Attributes Test (BAT).
During the literature review few previous research on the topic were found, a point noted by
Damon (1996) that all the studies conducted on selection batteries were concerned with fighter
pilots and no examination of concurrent validity or post-undergraduate training performance
were made for transport pilots. This observation further supports the appropriateness and
relevance of this research, which would assist commercial airlines to implement better
recruitment objectives.
It can be argued that the selection of pilots for a commercial airline should be no different from
that of the military. The job of a pilot requires a high degree of emotional stability and flying
complex aircraft on tight schedules, in all kinds of weather, requiring a great deal of ability,
extensive experience, a clear mind and coolness in emergency situations (Butcher, 2002). This
view indicates the responsibility of airline pilots towards the safety of the passengers and cargo
they carry. Furthermore, because the costs associated with the aircraft itself are immense, to
ensure the safety not only of the passengers and cargo but also the investments in aircraft,
airlines need to select and appoint people who are reliable and psychologically sound (Butcher,
2002).
In relation to the military, Flotman (2002) suggested that because of the shortage of pilots in the
South African Air Force and the acquisition of new aircraft, it is critical to enhance the value of
these newly acquired aircraft by selecting and training the most suitable personnel.

6
The above views explain the rationale for the need to investigate the utilisation of psychological
assessments in predicting successful completion of a cadet pilot training programme.
1.2 PROBLEM STATEMENT
Traditionally, the function of psychological tests has been to measure differences between
individuals or between the reactions of the same individual on different occasions (Anastasi,
1990). Psychological tests can be of great value in employee selection because of their
objectivity and validity.
The diverse nature of the South African community poses a challenge when considering the use
of psychological tests during the selection process of cadet pilots for a commercial airline.
Research investigating the predictive validity of psychological tests in pilot selection has
generally mainly been applied in the military environment. According to Hunter and Burke
(1994), military pilot selection has traditionally been heavily researched, partly because pilots
play a key role in modern warfare, and training them is costly in terms of both finances and time.
Safety is paramount in aviation. According to Hoole and Vermeulen (2003), the human factor is
widely recognised to be critical to aviation safety and effectiveness. They (2003) reported that
the numerous studies indicating that the human factor is vital in maintaining or improving safety,
prompted the development and publication in 1990 of the United States National Plan for
Aviation Human Factors for research, which would lead to the enhancement of
(1) human-centred design of controls, display and advanced systems
(2) selection and training
(3) information transfer
(4) personal safety, well-being and survival
(5) the measurement of performance and understanding of variables that affect
performance (Federal Aviation Administration, in Hoole et.al. 2003).
This research supports objective (2) above, and will contribute to the field of industrial and
organisational psychology.
The problem faced by the commercial airline is that the current selection test battery has not
been scientifically investigated for its predictive validity in the selection of “cadet pilots” for the

7
training programme. Since training is a precursor to job performance, training criteria are vital
because they impart job knowledge that facilitates the performance of the job task (Carretta &
Ree, 1996).
According to Schmidt and Hunter (1998, p. 262), “the most important property of a personnel
assessment method is predictive validity: the ability to predict future job performance, job-
related learning, such as amount of learning in training and development programs, and other
criteria”. This statement highlights the focus of this research.
It is anticipated that the current research will provide information to assist the commercial airline
to select candidates with the potential to successfully complete the training programme, thus
reducing the financial burden on the organisation.
In this research, the measurement of learning potential was not part of the psychological battery
used in the selection of cadet pilots.
The next section deals with the research aims.
1.3 RESEARCH AIMS
1.3.1 General aim
The general aim of this research is to ascertain whether the psychological tests used for the
selection of cadet pilot training programme in a commercial airline are valid predictors of their
performance using their final flying school results as a criterion measure. According to Muller
and Schepers (2003), this is in line with the guidelines of the Society of Industrial Psychology
which state that the onus is on practitioners to validate the tests they use, and to provide
concrete empirical evidence that their selection practices are fair (Society for Industrial
Psychology, 1992).
The aim of this research study is not to determine the reliability and validity of the cadet pilot
training programme.

8
1.3.2 Specific aims of the literature review
(1) To review the literature on the concepts of intelligence and aptitude and explore the
nature of these concepts, as well as how intelligence and aptitude can be measured
using psychological instruments. The concept of selection will also be covered.
(2) To review the literature on the concepts of literacy and numeracy and describe their
dimensions.
1.3.3 Specific aims for the empirical study
(1) To evaluate the predictive validity of the psychological test battery used in the selection
of cadet pilots as a predictor of success in the training programme.
(2) To compare different race groups, in terms of psychological test battery scores, in order
to investigate whether the English Matric symbol and ABET levels correlate with
performance in the final flying school examination results.
1.4 THE PARADIGM PERSPECTIVE OF THE RESEARCH
According to Mouton and Marais (1990), normal science may be defined as the practice of
scientific research within and from the frame of reference supplied by a dominant paradigm. In
this sense, a paradigm is primarily a model for conducting normal research.
The relevant paradigms, meta-context and disciplinary and methodological dimensions of this
research are discussed below and provide a context for the research within the discourse of
science.
1.4.1 Applicable psychological paradigms
Morgan (1980) stated that one of the principal implications of Kuhn’s work stems from the
identification of paradigms as alternative realities. The term “paradigm” is used in its meta-
theoretical or philosophical sense to denote an implicit or explicit view of reality. The research is

9
conducted within the broader context of paradigms and disciplines of cognitive behaviourism,
functionalism and empiricism. The literature survey on literacy and numeracy and psychological
tests in a selection process will be presented from the cognitive behaviourism, functionalism and
empiricism paradigms.
1.4.1.1 Cognitive behaviourism
According to Bergh and Theron (2003), behaviourism is based on Watson’s belief that the
subject matter of psychology should be observable behaviour, because Watson maintains that
only what is observable can be studied objectively. These authors (2003) further stated that
after 1960, social learning theories were developed which focused on learning in social
situations because of the introduction of the notion of consciousness into behaviourism theories.
This occurs through the use of cognitive processes, that is, processes whereby the individual
becomes conscious of the environment, such as in the recognition and perception of others’
behaviour.
It would appear that the behaviourist views humans as machines in terms of stimuli and
response, whereas the cognitive approach sees humans as complex machines in terms of
inputs and outputs. According to Leahey (cited in Bergh & Theron, 2003, p. 11), the association
between stimuli and response is replaced with the terms “computational state and internal
computations”.
In terms of this research, this implies that the stimuli are processed not purely in a clinical
behaviourist paradigm manner, that is, stimuli – response, but in a stimuli – organism –
response (S-O-R) approach. This indicates that the organism utilises various cognitive abilities
to make sense of the environment by processing the stimuli. For example, literacy and
numeracy are variables which may influence the response of the individual (organism) to the
stimulus of psychological assessment.
1.4.1.2 Functionalism
Functionalism was developed in the USA as a reaction to structurism. According to Bergh and
Theron (2003), psychology was seen as a practical science with its subject matter being the
functions of the mind instead of the structure or content of the mind. “The focus was on the
10
mind, as it is functional to the individual’s adaptation to the environment” (Bergh & Theron,
2003, p. 6). With regard to the current research, the functionalist approach in the literature
review in terms of literacy and numeracy is adopted in order to explain the functions that may
enable cadet pilots to successfully adapt to their environment.
1.4.1.3 Empiricism
Morgan (1980) stated that because human behaviour is assumed to be measurable, it can be
explained using statistical analysis. In other words, the research design is based on scientific
methods.
Empirical refers to tested knowledge and conclusions that are based on direct, sometimes
indirect, but systematic, repeated and incontrovertible observations and experience (Bergh &
Theron, 2003). This implies that the research can be verified to ensure certainty and extension
of knowledge in terms of the reported findings.
In using these paradigms for this research, the researcher was afforded an opportunity to study
and understand how cadet pilots assimilate the knowledge required to become a pilot. In the
literature review, the researcher considered what is required of the cadet pilot to acquire the
relevant skills and abilities and the impact of literacy and numeracy on these skills. Furthermore,
the researcher determined how these skills/abilities can be measured (i.e. the inductive phase).
Based on the hypotheses formulated, the extent to which the psychological tests that measure
these abilities, predict successful completion of the training programme was evaluated (i.e. the
deductive phase). Through empirical study, these hypotheses were statistically tested and
objectively verifiedy (i.e. the verification phase).
1.4.2 Meta-theoretical statements
According to Bergh and Theron (2003), an eclectic approach involves meta-theories, which are
integrative approaches that overcome the limitations of adhering to one particular theoretical
point of view. They further stated that the aim of metapsychology is to place human behaviour
and experience in a holistic perspective. In this perspective, the assumption is that a human is
an organised whole, functioning in totality through the interaction of structures and processes.
The intellectual climate refers to the variety of meta-theoretical values or beliefs and

11
assumptions, which because of their origin, can usually be traced to nonscientific contexts and
have become part and parcel of the intellectual climate of a particular discipline in the social
sciences (Mouton & Marais, 1990). The meta-theoretical assumptions underpinning theories
and models provide a vital contextual perspective of the research.
According to Theron (2003, p. 11), “the aim of metapsychology is to place the human behavior
and experience in a holistic perspective”. This not only studies humans in relation to their
physical environment, but also in relation to their transcendental environment, which includes
theology and philosophy (Meyer et al., in Theron, 2003). Meta-theoretical statements, in terms
of this research are presented below.
A theoretical statement refers to those beliefs of which testable statements about social
phenomenon are made. Theoretical belief may therefore be regarded as assertions about the
what (descriptive) and why (interpretative) aspects of human behaviour (Mouton & Marais,
1990). In terms of this research, this could mean that candidates, who are selected for the
training programme on the basis of their psychological tests results, should be successful in the
training programme.
A methodological statement refers to beliefs concerning the nature of social science and
scientific research. The primary methodological models are quantitative and qualitative (Mouton
& Marais, 1990).
The methodology used in this empirical study is quantitative, which is congruent with the
methodological conventions of the subdiscipline of psychometrics. The data on the independent
and dependent variables are quantitative.
The interrelations of disciplines/field of industrial psychology are as follows:
(1) Personnel psychology. According to Bergh and Theron (2003), this field is concerned with
recruitment, selection, placement and training of employees, as well as a study of factors
that affect the utilisation of personnel (also known as human resources). In this research,
the selection of personnel will be studied.
12
(2) Career psychology. This field is concerned with career and organisational choice, career
issues that affect individuals in the course of their careers and changes in the organisations
that affect careers (Bergh & Theron, 2003). In this research, choosing a career as a pilot will
be discussed.
(3) Psychological assessment. Psychological assessment is a core discipline in most fields of
industrial psychology. The focus is on studying the principles and techniques for the
assessment of individual differences and similarities within or between people (Bergh &
Theron, 2003). The use of psychological tests in predicting performance for the various race
groups in the pilot training programme will be a focus of this research
(4) Psychometrics. According to Moerdyk (2009), psychometric tests have been designed to
measure one or a small number of dimensions, and the points for the answers given can be
added together to make a single score. In psychometrics, however, there has been a
predominant interest in the quantitative study of abilities, educational achievements,
personality styles, attitude and other human traits and characteristics (Fillmore, Kempler &
Wang, 1979).
In the current research, the predictive validity of the psychological tests used in a selection
process will be discussed.
1.4.3 Market of intellectual resources
Mouton and Marais (1990) distinguished between theoretical and methodological beliefs.
The main thesis of Mouton and Marais’s model is that in a research project, the researcher
internalises specific inputs from the paradigm(s) to which he/she subscribes in a selective
manner, to enable him/her to interact with the research domain in a fruitful manner and to
produce scientifically valid research (Mouton & Marais, 1990).
According to Mouton and Marais (1990), the principle of selective internalising may explain why
researchers do not necessarily adhere to an identifiable paradigm in their research. This implies
that the researcher in the current research and in the literature review will consider whether the
levels of literacy, (particularly English literacy) and numeracy, influence performance in
psychological tests for predicting success in the cadet training programme.

13
1.4.4 Psychological models and theories
Cattell’s (1987) theory of fluid and crystallised intelligence underscores most of the literature
review. However, other models and theories on intelligence and cognitive abilities are also
important for the research. Some of these are Spearman’s (1904) two-factor theory,
Gustafsson’s (1989) three-level model, Thurstone’s (1938) primary mental abilities and Carroll’s
(1993) three-stratum model.
1.4.5 Applicable concepts and constructs
The following concepts and constructs are applicable to this study:
(1) Intelligence. Moerdyk (2009) states that according to the About Intelligence newsletter,
intelligence is often seen in the popular sense as the general mental ability to learn and apply
knowledge to manipulate one’s environment, as well as the ability to reason and show abstract
thought. More formally, intelligence involves the ability to act purposefully by seeking out
relevant knowledge, finding or creating rules to link these units of knowledge or information,
applying them to novel situations, adapting and extending the rules where necessary, and
generally arriving at a reasonable and appropriate decision (Moerdyk, 2009).
According to Bartholomew (2004), the problem with the concept is that it is twisted so that it can
be empirically tested, and intelligence is not about doing tests, which tend to be concerned not
only with speed of performance and suchlike, but also about creativity and the willingness to
grapple with ideas. Measurement of cognition concentrates on problem solving and information
processing (Bornstein, Schuster & Ashburgn, 1992).
(2) Literacy. According to Holme (2004), viewing literacy as the mastery of a set of skills can
mean that this mastery is in fact never attained. The indeterminate nature of what being literate
means was clearly acknowledged in a UNESCO report: literacy is a characteristic acquired by
individuals in varying degrees from just above none to an indeterminate upper level. Some
individuals are more or less literate than others, but it is really not possible to speak of illiterate
and literate people as two distinct categories (Holme, 2004).
14
(3) Functional literacy. In his discussion of literacy, Holme (2004)commented that the problem of
literacy measurement is intensified in a developed economy where schooling, which
sometimes resulting in educational failures, is at least universal. In the author’s view there
are not two contrary states, literate and illiterate. Functional literacy recognises the fact that
people will master the skills of literacy to different degrees. Functional illiteracy occurs when
the ability to read and write is inadequate for an individual to engage in society, work
effectively and pursue lifestyle choices (Holme, 2004).
According to Ellsworth, Hedley and Baratta (1994), functional literacy is the capacity to use
language to do something, say, read an advertisement or uses a technical manual to fix a
leaking sink. They further stated that critical literacy includes the capacity for action, but also
incorporates a broader sense of understanding and insight and the ability to communicate
with others about “texts” that are either written or spoken.
(4) Numeracy. According to Harris and Hodges (1995), numeracy is explained as fluency in
mathematical operations. Bergh (2009) described numerical ability as the ability to reason
quickly and accurately by way of addition, subtraction, multiplication and division.
(5) Validity. This is the psychometric requirement for a measurement technique to measure
the construct it is designed to measure (Bergh, 2003).
Several categorisation systems are used, but in this research, the following were
considered:
According to Moerdyk (2009), there are three main forms of validity. They are all important,
but are applied differently in different contexts and therefore require different kinds of
evidence. The three forms of validity are as follows:
Construct (theoretical) validity. This is concerned with whether the assessment
technique produces results that are in line with what is already known (Moerdyk, 2009).
Content validity. According to Moerdyk (2009), content validity is concerned with whether
the content of the scale or measure accurately reflects the domain it is trying to assess.
This form of checking is most appropriate for achievement and knowledge assessment.

15
Criterion-related (empirical) validity. This relates the scale outcomes to some external
criterion. Moerdyk (2009) describes the following two forms of criterion-related validity:
concurrent and predictive validity:
- Concurrent validity. This form of validity is designed to ask whether the measure
successfully distinguishes between known groups.
- Predictive validity. This form of validity is focused on whether the assessment
procedure can predict how groups may differ in the future (Moerdyk, 2009).
There are two further forms of validity worth mentioning here, namely face and ecological
validity.
Face validity. According to Moerdyk (2009), the basic issue with face validity is that the
assessment technique should appear (especially to the uninformed) to be doing what it
claims to be doing.
Ecological validity. This is concerned with whether the results of the assessment are
meaningful and useful outside the setting in which they are obtained.
(6) Reliability. According to Bergh and Theron (2003), reliability involves the consistency of
measurements, that is, a process or measurement repeated in various situations or by
different people will provide more or less the same measurement results.
In this research, the predictive validity of the psychological tests used during the selection
process of the “cadet” pilots to successfully complete the pilot training programme was
evaluated using the final flying school results as the criterion.
1.4.6 Methodological assumptions
Scientific research is a systematic, controlled, empirical and critical investigation of material
phenomena guided by theory and hypotheses about the presumed relationships between such
phenomena (Kerlinger, 1986). This research is quantitative, in accordance with scientific
methods of research, and is aligned to the subdiscipline of psychometrics. When processing

16
data relating to the dependent and the independent variables, statistical formulae will be used to
provide quantitative results which may indicate whether or not there is a relationship between
the dependent and the independent variables.
1.5 RESEARCH DESIGN
The aim of a research design is to plan and structure a given research project in such a way
that the ultimate external and internal validity of the research findings is maximised (Mouton &
Marais, 1990).
According to Cooper and Schindler (1998), the following are the essentials of research design:
The design is a plan for selecting the sources and types of information used to answer
the research question.
It is a framework for specifying the relationships between the study’s variables.
It is a blueprint that outlines each procedure from the hypotheses to the analysis of data.
In the current research, the data were collected by means of psychometric and academic
assessment, which is a nonexperimental correlational design.
1.5.1 Research variables
According to Kerlinger (1986), research design sets up the framework for studying the
relationships between variables. The independent and dependent variables in this research are
discussed below.
1.5.1.1 Independent variables
The independent variables are the scores for each individual in the battery of the psychological
tests in phases 1 and 2, namely: English Literacy Skills Assessment (ELSA); the Blox Test;
Raven’s Progressive Matrices (RMP); the Intermediate Test Battery; and the Wechsler Adult
Intelligence Scale (WAIS).

17
1.5.1.2 Dependent variables
The dependent variables are the results obtained in the final examination at the flying school
offering the cadet pilot training programme.
The research is descriptive in both the review of the literature and the empirical study..
According to Mouton and Marais (1992), the goal of the researcher in this type of research is to
describe that which exists as accurately as possible. The above-mentioned will be integrated in
the conclusion, and recommendations will be contextualised with reference to the formulated
problem.
1.6 RESEARCH METHOD
This research was undertaken in two phases, namely a literature survey and an empirical study
which are outlined below.
1.6.1 Literature review
The specific aim of the literature review is to conceptualise intelligence, literacy and numeracy.
These concepts are defined, focusing on the nature of the concept of intelligence and how it can
be measured by means of psychological tests.
1.6.1.1 The use of psychological tests in the selection of cadet pilots
In chapter 2, the concepts of psychological test, intelligence and selection are defined and
discussed. The theories of intelligence are explained in relation to the concept.
1.6.1.2 The nature of literacy and numeracy
The literature review is focused on the conceptualisation of literacy and numeracy, the nature of
these concepts and how they are operationalised. In chapter 3, literacy and numeracy are
defined to provide a conceptual understanding of the domain.

18
1.6.1.3 Integration
The aim of this section of the literature survey is to integrate available information on literacy
and numeracy and psychological tests in the selection process in order to demonstrate the
theories and models that are dealt with in chapters 2 and 3 and which are used as the basis to
test the relationship empirically.
1.6.2 Empirical study
The empirical research is summarised and the population and sample described. The
psychological instruments used in the study are identified and the selection of the psychological
instruments highlighted. The manner in which data were collected and processed is discussed
as well as process of testing the hypotheses. A general outline of how the results will be
reported and interpreted is given and lastly, conclusions are drawn, the limitations of the study
discussed and recommendations made (see aim 1.3).
1.6.2.1 Data collection
All testing was done at the regional recruitment centres. The administration and scoring were
done by a registered psychometrist under standard testing conditions. The test results and
scores were checked and captured by an administrative assistant. Chapter 4 explains the data
collection process.
1.6.2.2 Data processing
In order to determine predictive validity, the Pearson correlation coefficient and regression
analysis were used to measure the relationship between the independent (predictor) and
dependent (criterion) variables. Chapter 4 discusses the processing of the data that were
collected.
1.6.2.3 Research hypotheses
The research hypotheses were formulated with regard to the primary aim of the study in order to
determine whether there is a statistically significant relationship between the psychological test

19
scores and the final flying examination results. Regarding the second aim of the study, the
hypothesis states that there is statistically significant relationship between scores of the final
examination flying school results and English Matric symbol and ABET levels. These
hypotheses will be discussed in chapter 4.
1.6.2.4 Reporting of results
Chapter 5 reports on the predictive validity of the empirical results and of the psychological tests
used in line with the specified aims of the research, as outlined in the empirical study.
1.6.2.5 Conclusions, limitations and recommendations
Conclusions are drawn on the basis of the extent to which the research aims have been met.
Limited resources in terms of human capital and time and the follow-up of successful applicants
who joined the organisation influenced the limitations of this research. Further limitations in
terms of statistical considerations will be discussed in chapter 6.
Chapter 6 also makes recommendations for further research. These include follow-up studies in
terms of job performance as predicted by the psychological instruments. Furthermore, the
standardisation of the psychological test batteries aligned to competencies required for a
competent pilot is proposed.
1.7 CHAPTER LAYOUT
Chapter 2: The use of psychological tests in selection and nature of intelligence
Chapter 3: The concepts of literacy and numeracy
Chapter 4: The empirical study
Chapter 5 The research results
Chapter 6 Conclusions, limitations and recommendations

20
1.8 CHAPTER SUMMARY
In this chapter, the background to and rationale for this research were discussed. The problem
statement, the aims, the research model, the paradigm perspective, the research design and
method and the chapter layout were also highlighted.

21
CHAPTER 2
THE USE OF PSYCHOLOGICAL TESTS IN SELECTION WITH SPECIFIC FOCUS ON
MEASUREMENT OF COGNITIVE ASPECTS
2.1 INTRODUCTION
The notion of human assessment as a means of knowing and understanding another person
has been around for a long time. Human behaviour has been assessed in a variety of
settings and by individuals in many different disciplines (Walsh & Betz, 1995).
The recruitment of people as pilots in the aviation industry, in a multicultural society, poses a
challenge, particularly in South Africa. Owing to the huge costs associated with pilot training,
selecting candidates to successfully complete the pilot training programme has resulted in a
special focus on the selection process.
In line with the objective of this research, namely to determine the predictive validity of the
psychological tests to select cadet pilots, this chapter will discuss the selection of pilots and
the psychological tests included in the test battery. One of the aims of the current research is
to investigate variables that have positive correlations with the successful completion of the
cadet training programme. According to Carretta (1992), medical and physical fitness, paper-
and-pencil aptitude test scores, academic performance and previous flying experience are
variables currently considered in pilot candidate selection in the USAF.
The concept of selection will be explained in relation to the use of the psychological tests
utilised during the process of pilot candidate selection. The various predictors, namely
intelligence/aptitude, English Matric symbols and the ABET levels will also be discussed.
2.2 DEFINITION OF CONCEPTS
Bartram (2004) commented that in the workplace, tests, as part of assessment, are used to
measure the performance and potential of current and future employees through selection
22
and performance management respectively. This suggests that psychological assessments
in organisations need to be used responsibly, ethically and equitably.
Moerdyk (2009) argued that in South Africa, with the socioeconomic differences continuing
to be visible in the education and general socioeconomic status of different sectors of the
country‟s population, large parts of society remain at a disadvantage when they are
assessed with current assessment techniques and tools such as psychological tests. This
implies that the use of psychological tests in their adapted and/or current format may unfairly
discriminate against people, particularly in a multicultural society such as that of South
Africa.
2.2.1 Selection process
In most organisations, recruitment and selection are the responsibility of human resources,
who are tasked with recruiting and selecting suitable candidates to perform duties on the
basis of their abilities. Unfortunately, there has been and still is a trend towards a large
number of people with the abilities and/or competencies to perform a specific job and/or
occupy a certain position in an organisation applying for very few jobs and positions. After
attracting as many suitable applicants as possible, the process of selection commences.
Selection methods vary between two extremes on a continuum, from ”scientific approaches”
at one extreme, to an ”intuitive approach”, at the other (Louw & Edwards, 1997). According
to Louw and Edwards (1997), the intuitive approach is more subjective, whereas in the
scientific approach, efforts are made to limit subjectivity. The requirements of the EEA
support the scientific approach in the selection process.
According to Damos (1996), the term “selection battery” refers to either batteries
administered as part of screening for air carriers that hire experienced pilots or to batteries
administered to ab initio pilots, prior to admission to flight training or during the ground phase
of training. In the current research, the focus is on ab initio pilots.
Literature on pilot selection suggests that much was achieved in the military institutions
(Damos, 1996; Martinussen & Torjussen, 1998; Ree & Carretta, 1996; Tsang & Vidulich,
2003), because commercial airlines used to recruit their pilots from the military. According to

23
Hunter and Burke (1994), the bulk of published reports have dealt with selection for ab initio
(beginner) pilot military training, although much of what has been accomplished in the
military setting is directly applicable to civic aviation.
In a study by O‟Hare and Walsh (2003) which involved a review of articles published during
1996 and 2000, with particular focus on the International Journal of Aviation Psychology
(IJAP), which was the first journal devoted exclusively to aviation psychology, they
established that of the 21 topics discussed in IJAP, 21% of the articles dealt with display
issues, 13% with training, 10% with automation and 9% with selection. This observation led
the authors to conclude that there is growing interest in the articles on display and
automation and a decreasing proportion on workload. Hence there has been no sign of a
broadening of the content base beyond the traditional flight deck and ATC concerns. This is
not surprising in the light of the critical issue of flight safety in the airline business.
Locally, the literature review shows trend that is similar to the international one, from a
research perspective. However, the research conducted locally was in the military and
extremely limited in commercial and/or civil aviation. De Kock and Schlechter (2009) shared
this view in their statement that traditionally, validation research received considerable
attention in the military.
Military pilot selection has been heavily researched for a number of reasons.
For instance, the literature indicates that training attrition rates over the last 20 years have
typically been in the order of 25%, with an average cost for each failure ranging from $ $50
000 to 80,000 for the USAF (Hunter & Burke, 1994; Martinussen, 1996). De Kock and
Schlechter (2009) concurred when they stated that in the UK, the estimated unit cost of
training a fast-jet pilot is more than £3,7 million. In the South African Air Force (SAAF), it
takes five years to train a fighter pilot.
These views confirm that training failures are costly. Having an efficient and properly
structured selection process should ensure that there is a better “fit” between the selected
applicants and the job, which would also ensure that the organisation obtains the “best”
return on its investment. Also confirmed in relation to selection, is that it is essential to admit
people to a training programme, with a high probability of success, thus minimising a
mismatch with the position and reducing employment costs.

24
According to Van Der Merwe (2002), the vast majority of employee selection programmes
are based upon the successive hurdle technique. This means that in order to be hired, the
applicant must successfully pass various screening steps. At each step or hurdle, some
candidates are rejected. The selection process, as indicated by Van Der Merwe (2000), in
figure 2.1, shows the method used during cadet pilot selection in the commercial airline.
FIGURE 2.1. The selection process Source: Adapted from Van Der Merwe (2002, p .78)
The process is aligned to those in the military, as noted in Carretta and Ree (2003), who
stated that selection for the military or civilian pilot training programme is typically a
multistage process, in which decisions are made at several points.
One of the critical elements in ensuring outstanding organisational performance is the
selection and development of excellent staff. International as well as local research has
demonstrated the role that psychometric assessment can play in significantly improving the
Recruitment of candidates
Application forms
Preliminary screening
Reference checking
Psychological testing
Interview: line management
Medical examination
Successful candidates Unsuccessful candidates
Rejectio
n

25
selection process for both new entrants and internal promotions (Van der Merwe, 2002).
Effective psychometric assessment can also play a key role in staff development processes,
and this is one of the main challenges presently facing South Africa (Van der Merwe, 2002).
It can be inferred that selection is a vital process in identifying candidates with the potential
to enter and/or join an organisation and to reach their optimum performance with relevant
and appropriate training and development.
2.2.2 Definition of selection
The general objective of a selection process is to match the person to the job. As noted in
the above discussion, the selection of a pilot for training is not that different from a selection
process in any organisation. The term “selection” will be broadly defined and common
features of a selection process highlighted.
Moerdyk (2009) defined selection as the process of matching people to the job requirements
in order to meet organisational objectives, both current and in the longer term.
According to Jackson (1996), who described selection from a decision-making perspective,
the concept involves only two categories – acceptance and rejection.
According to Louw and Edwards (1997), some of the features common to most selection
processes are as follows:
Through the job analysis process, the traits (or characteristics) required to perform
the job competently are identified.
Information is obtained about predictors.
An evaluation is made of how well the predictors succeed in predicting the
performance of applicants.
These features indicate that there should be close fit between the applicant and the job and
that decision making should be based on objective information obtained during the selection
process using psychological tests.
In their definition of pilot selection, Carretta and Ree (2003) asserted that in military aviation,
the goal is to achieve and maintain a high level of mission readiness – hence the fact that

26
organisations need people to serve in various capacities and people need jobs. They further
stated that to achieve this, the needs of the organisation should be matched to those of the
job applicant. Making the right selection decision thus reduces training costs, improves job
performance and enhances organisational effectiveness (Carretta & Ree, 2003).
Effective selection procedures will produce cost avoidance savings through reduced attrition
and reduced training requirements and will improve job performance. Poor selection will
have the opposite effect on the organisation (Carretta & Ree, 2003). Moerdyk (2000)
expressed a similar view when he noted that poor selection can result in quality and safety
being compromised, increased risk of injury, underspending of allocated budgets and
underdelivery of vital services, to mention but a few, in addition to direct costs. The
implications of these views indicate that the commercial airline should aim to have a
streamlined selection process that should impact positively on service delivery because of
the type of people appointed in the various positions and capacities.
It is common practice for most organisations to use psychological tests in their selection
process as an aid to decision making. In support of this view, Elkonin, Foxcroft, Roodt and
Astbury (2005) stated that perhaps the mostly widely used function of psychological
measures in industry is to assist with selection and employment decisions. Anastasi and
Urbina (1997) concurred with this view when they stated that the goal of measuring human
attributes in a work situation is to identify the potential of individuals and to match them with
the right job.
2.3 PSYCHOLOGICAL TESTS
It is becoming increasingly common for psychological tests or entire test batteries to be used
in the selection of suitable candidates for a professional position or training programme,
although internationally, the frequency of their use varies greatly (Schuler, in Sommer,
Olbrich & Arendasy, 2004). Sommer et al. (2004) noted that the derivation of decisions and
training from the results of such individual tests requires a sufficiently high level of
agreement between the test used and the corresponding criterion variable.

27
According to Nzama et al. (2008), in South Africa in particular, the use of psychological
assessment as a means of determining the employability of individuals has had a mixed
history, marked by acceptance, in some instances, and by scepticism, in others.
Aligned to this view is the comment on ability tests by Muller and Schepers (2003), who
reported that Wood and Payne (1998) found that the proportion of organisations using tests
to select staff rose from just below 50% in 1991 to 75% in 1996, making them as popular as
curriculum vitaes.
It is against this background that the ensuing discussion will consider the definition and
functions of psychological tests in a selection process.
2.3.1 Definition of psychological tests
Throughout the discussion thus far, psychological tests have been generally defined as an
objective and standardised measure of a sample of behaviour. Psychological tests are like
tests in any other science, insofar as they are observations on a small but carefully chosen
sample of an individual‟s behaviour (Anastasi, 1990). This definition indicates that, if a
psychologist wishes to measure a clerk's ability to perform arithmetic computation or a pilot's
hand-eye coordination, he/she must examine their performance by means of a
representative set of arithmetic problems or motor tests (Anastasi, 1990).
Cohen and Swerdlink (2002) defined psychological assessment as the gathering and
integration of psychology-related data for the purpose of making a psychological evaluation,
accomplished through the use of tools such as tests, interviews, case studies and
behavioural observation, as well as specially designed apparatuses and measurement
procedures. They define psychological testing as the process of measuring psychology-
related variables by means of devices or procedures designed to obtain a sample of
behaviour.
According to Shum, O‟Gorman and Myors (2006), a psychological test is an objective
procedure for sampling and quantifying human behaviour to make inferences about a
particular psychological construct using standardised stimuli and a method of administration
and scoring.

28
The assessment process is multidimensional and entails gathering and synthesising
information as a means of describing and understanding functioning (Foxcroft & Roodt,
2005).
According to Elkonin et al. (2005), basically, two approaches are used in the application of
psychological measures. In the input-based approach, individuals are compared with the job
specifications in terms of their personal characteristics or personality traits. The other
approach is output based in the sense that individuals are compared in relation to the
required outputs of the job. In this instance, the aim is to determine whether the individual
has the necessary competencies to perform a particular task or job.
In terms of this research, the output based approach is used to determine whether the
applicants have the ability to successfully complete the cadet pilot training programme.
Based on the above definitions, one may infer that psychological tests may differ according
to the number of investigated variables such as content, format, administration procedures,
scoring and interpretation procedures and psychometric or technical quality.
These views suggests that the next step in the discussion is to understand the functions of
psychological test in order to use the information obtained during assessment for the benefit
of both the applicants and the organisation.
2.3.2 Functions of psychological tests
According to Anastasi (1990), although intelligence tests were originally designed to sample
a wide variety of functions in order to estimate the individual's general intellectual level, it
soon became apparent that such tests were fairly limited in their coverage.
Aiken (1991) emphasised this view when he stated that because employment tests, which
are classified as psychological tests, had been validated primarily on members of the
dominant white culture, it was reasonable to ask whether they would be valid for black and
other minorities.

29
Cascio (1991) claimed that if an individual from a specific population group does not have an
equal opportunity of being selected for a specific post, but has an equal probability of
succeeding in the job, test bias exists which could result in unfair discrimination. Although
the current study will not be investigating the fairness of the instruments, it is necessary to
note these comments because they may impact on the commercial airline not achieving its
employment equity targets, as a requirement of the EEA.
According to Anastasi (1990), one needs to be sure that the tests cover abilities that are of
primary importance in one‟s culture.
Muller and Schepers (2003) asserted that it is important to acknowledge the fact that a test is
designed to discriminate between candidates with higher and lower abilities on certain
criteria. The issue then, according to these authors, is whether the test discriminates fairly.
The main purpose of psychological testing today is the same as it was throughout the 20th
century, namely to evaluate behaviour, cognitive abilities, personality traits and other
individual and group characteristics in order to assist in making judgements, predictions and
decisions about people (Aiken, 2003). More specifically, tests are used to
screen applicants for jobs in the education and employment context
counsel and guide individuals for educational, vocational and personal purposes
retain or dismiss, promote and rotate students or employees in educational and
training programmes and in on-the-job situations
diagnose and prescribe psychological and physical treatments in clinics and hospitals
evaluate cognitive, intrapersonal and interpersonal changes caused by educational
psychotherapeutic and other intervention programmes
conduct research on changes in behaviour over time and evaluate the effectiveness
of new programmes or techniques
For the purpose of this research, the psychological tests were utilised to evaluate the
cognitive abilities of applicants for the cadet pilot training programme and to determine
whether or not they could successfully complete the training programme.
This view was emphasised by Johnston (1997, p.179) who confirmed that “psychological
testing of applicants for pilot training and employment is now a well-established and widely

30
accepted activity in most parts of the world; it is only in very recent times that psychological
testing has been potentially envisaged to have a substantive role in pilot licensing”.
Foxcroft and Roodt (2005) highlighted some of the problems encountered when changes
were evident in the sociopolitical situation in South Africa. In the first instance, measures
were developed for more than one racial group and/or norms were constructed for more than
one racial group so that test performance could be interpreted in relation to an appropriate
norm group. In the second instance, psychological measures were developed and
standardised for white South Africans only, and some were also imported from overseas and
used to assess other groups as well. These authors (2005) further stated that in the absence
of appropriate norms, the potentially bad habit arose of interpreting such test results “with
caution”. The major problem with this approach was that initially little research was done to
determine the suitability of these measures for a multicultural South African environment.
Another area of psychological testing is concerned with the affective or nonintellectual
aspects of behaviour. Tests designed for this purpose are commonly known as personality
tests, although some psychologists prefer to use the term "personality" in a broader sense to
refer to the entire individual. As stated by Anastasi (1990), in the terminology of
psychological testing, however, the designation "personality test" generally refers to
measures of such characteristics as emotional states, interpersonal relations, motivation,
interests and attitudes.
As mentioned earlier, personality tests were not part of the selection battery used during the
assessment of the applicants for the purpose of this research.
It is evident from the previous discussion that psychological tests can be used for many other
purposes such as to determine individual differences in general intelligence, specific
aptitudes and noncognitive personality traits.
Groth-Marnat (2003) suggested that intelligence tests are limited in predicting certain
aspects of occupational success and nonacademic skills such as creativity, motivational
level, social acumen and success in dealing with people. Finally, there has been an
overemphasis on understanding the end product of cognitive functioning and relative neglect
in appreciating underlying cognitive processes (Groth-Marnat, 2003).

31
Dillon (1997) raised a concern, not with the particular type of test, but with the method of
measurement. The author‟s premise is that neither type of tests will account adequately for
intelligence performance when test scores are used as predictors. Dillon (1997) proposed
that the same kinds of tests may continue to be used or new tests may be developed. In
either case, indices of ongoing information processing should be recorded, and such
measures should be used as predictors of school or occupational success.
In the current research, the applicants were assessed on their intellectual skills on the basis
of the scores obtained from the various measurement instruments. As indicated in the above
statement, the underlying cognitive processes were not assessed - in other words, the
assessment answered the question “what” and not “how”.
Van Eeden and De Beer (2005) stated that psychological measures are not as accurate as
physical measures such as height. This exacerbates the difficulties and controversy
surrounding the measurement in social sciences, which is partly due to the fact that one
measures constructs which are entities not directly visible or directly measurable and which
have to be measured in a roundabout fashion. Hence measuring variables such as
intelligence and aptitude will have to be inferred from the scores obtained by the candidates.
Ree and Carretta (1996) reported on research by Yerkes (1919) during World War I, which
showed that measures of intelligence were valid predictors of pilot training success. The
authors further reported that between the two World Wars, Flanagan (1942) noted that the
US aviation selection examination involved a general mental battery testing comprehension
and reasoning – again highly “g” loaded.
According to Ree and Carretta (1996), World War II generated a renewed interest in pilot
selection by all combatants. Influenced by multiple aptitude theory (e.g. Melton, 1947) and
the Navy (e.g. Fiske, 1947; Viteles, 1945), Ree and Carretta (1996) noted that the US Army
used several ability measures for pilot selection, including intelligence, psychomotor,
mechanical comprehension and spatial measures.
These views suggest that inferences need to be made about the constructs, that is, traits
that are supposed to be measured by the measurement instruments. When selecting

32
applicants for ab initio (beginner) pilot training, indicators of ability (i.e. trainability) are
emphasised (Carretta & Ree, 2003).
Psychological tests are thus tools that are seen as objective in the assessment of individuals
in order to assist decision making in a number of different situations (Van Der Merwe, 2002).
The focus is normally on a sample of behaviour considered important in an organisation.
Psychological tests can be considered useful when they can provide information and/or data
that are perceived to be valid and reliable. Legislation, as outlined in the Skills Development
Act 97 of 1998, emphasises the fact that psychological tests may be used in the selection
process, provided their validity and reliability can be proven.
This leads to the next point of discussion in considering the determinants of pilot training
success.
2.4 THE DETERMINANTS OF PILOT TRAINING SUCCESS
According to Carretta and Ree (1996), there is consensus that the determinants of pilot
success reside in the following three main domains:
2.4.1 Intelligence and aptitude
Hilton and Dolgin (1991) have characterised intelligence as the best and most stable
predictor of flight training success, based on their summary of pilot selection research during
the last century. According to De Kock and Schlechter (2009), intelligence is a broad concept
and is sometimes defined more specifically. These authors referred to Ree and Carretta‟s
(1996) distinction between two types of intelligence, where they used Spearman‟s (1904)
two-factor theory of cognitive ability and argued that intelligence can be seen as a general
cognitive ability “g”, on the one hand, or in terms of specific abilities (Sn), on the other.
According to De Kock and Schlechter (2009), the construct “g” is synonymous with fluid
intelligence.
2.4.2 Psychomotor coordination
Measures of psychomotor coordination or hand-eye coordination, as it sometimes referred
to, are commonly included in the selection batteries for two apparent reasons, namely (1)

33
that they have an obvious relation to the task; and (2) the results of validation research
support their inclusion in selection batteries (Hilton & Dolgin, 1991).
2.4.3 Personality
Contrary to expectation, most studies report that personality adds little to the prediction of
pilot success (Carretta, Perry & Ree, 1996; Hunter & Burke, 1994; De Kock & Schlechter,
2009). Some studies did in fact report that certain aspects of personality had incremental
predictive validity in traditional batteries, for instance, attitude to risk (Ree & Carretta, 1996).
The focus of the current research is on one of the domains, namely intelligence and aptitude,
as determinants in predicting success in a pilot training programme for the commercial
airline. The data for the other two domains were not available because they had not been
collected or captured during the assessment. Also, the limited nature of the research had an
impact.
2.5 THE DEVELOPMENT AND THEORIES OF INTELLIGENCE
The development of intelligence is discussed by examining the theories of the concept of
intelligence as part of cognitive ability. This will be followed by a look at the measurements of
the concept.
As in any scientific practice, theory formulation plays a cardinal role, and the aim of any
theory is to explain logically and in simple terms the relationships between as many
perceptible phenomena as possible.
The literature on intelligence indicates that the majority of theories and models on the nature
of intelligence are based on Spearman‟s (1904) theory of “g” as a point of departure.
The theories of Spearman (1904), Thurstone (1938), and Cattell (1987) are discussed as
concepts of general “g‟ and specific “s” abilities. The works such as those of Vernon (1969)
on the theory of the hierarchical model, Guildford on the intellectual model and Jensen‟s
(1986) on the mental functioning model place the emphasis on “g” (the general factor) and
“s” (special abilities) as being inseparable.

34
These views seem to suggest that intelligence and aptitude are in fact “two sides of the
same coin”.
Spearman‟s two-factor model of general intelligence will be discussed first because it seems
to provide the foundation for most theories of intelligence. Thurstone‟s primary mental
abilities model appears to challenge Spearman‟s theory, by suggesting that intelligence is a
unitary ability and that it has a number of what he referred to as primary mental abilities
(PMAs). Building on Thurstone‟s PMAs, in his model, Cattell suggests that general
intelligence can be split into what is termed “fluid and crystallised intelligence”. Gustafsson‟s
three-level model incorporates Spearman‟s two-factor model, Thurston‟s PMAs and Cattell‟s
models of intelligence, and last but not least, Carroll‟s three-stratum theory.
2.5.1 Spearman’s two-factor model
Building upon the earlier work of Galton and Pearson, the inventors of the correlation
coefficient, Spearman (1904) concluded that all the tests he conducted measured a common
factor. This common factor is “g” – general intelligence. All the tests did not produce exactly
the same results; each had an associated smaller, more “specific” ability, which he named
“s” – specific abilities. Spearman also developed factor analysis, which determines whether
some pattern occurs in the test scores. According to Thurstone (1938), the criticism of the
two-factor model poses the question: Is intelligence a unitary ability?
Jensen (1986) provided evidence that Spearman‟s “g” is more than a statistical artifact
originating from factor analysis by showing that it is correlated more highly than any other
known factor with a number of phenomena that are independent of psychometrics and factor
analysis.
2.5.2 Thurstone’s primary mental abilities model
Thurstone (1938) found that a number of PMAs are all basic, with no one assuming more
importance than another the PMAs are as follows:
Verbal comprehension is the ability to understand the meaning of words.

35
Word fluency is the ability to think of words rapidly, as in rhyming words and
anagrams.
Number is the ability to work with numbers and compute.
Space is the ability to visualise space, for example, recognise figures in various
orientations.
Memory is the ability to recall word-pairs/sentences.
Perceptual speed is the ability to grasp visual details quickly.
Reasoning is the ability to find general rules on the basis of partial information.
Thurstone (1938) felt that a broad profile of individual mental abilities is more useful than a
simple overall measure.
2.5.3 Cattell’s model
Cattell (1987) argued that Spearman‟s theory was clearly a two-factor theory, that is, every
measured ability is a mixture of general intelligence and some quite specific ability peculiar
to that field. Thus, although verbal and numerical ability are highly loaded with Spearman‟s
“g”, each has an additional something of a special primary ability in it. Cattell viewed these
two factors, that is, fluid and crystallised intelligence, as distinct but correlated (Aiken, 1991).
While this is consistent with the spirit and technical methods of Spearman‟s basic approach,
it leads one to conclude that one is in fact dealing with two broad or “general” ability factors,
namely fluid and crystallised intelligence (Cattell, 1987).
According to Cattell (1987), one of the most interesting features is that although crystallised
ability generally does not enter culture fair subtest performance, fluid performance does,
although to a lesser extent, into those primaries such as verbal, numerical and reasoning
abilities which have been used in traditional intelligence tests.
Crystallised intelligence or – “gc” – is a measure of the outcome of culture and educational
experience. Intelligence is more dependent on the physiological structure that supports
intellectual behaviour than on crystallised intelligence. Also, it is more sensitive to the effects
of brain injury.

36
Crystallised intelligence, which reflects cultural assimilation, is highly influenced by formal
and informal educational factors. The argument against this model is that it is difficult to split
“g” into “gf” and “gc”, because “gf” and “gc” tend to cooperate (Pyle, 1979).
Cattell (1987) also argued against the concept of general intelligence because he believed
that intellectual ability is composed of several distinct functions that probably have genetic
bases. He proposed a four-level mechanical model. The usual visual and auditory sensory
detention functions are at the lowest level. The second level involves associational
processes, both short and long term. At the third level, perceptual organisational processes
come into play – broad visualisation, clerical speed and broad auditory thinking. The highest
level involves the education of relations‟ fluid ability and crystallised ability. Abilities at the
bottom of the hierarchy have low correlations with those near the top.
De Kock and Schlechter (2009) pointed out that there are two issues that seem to dominate
current pilot selection research. First, the fact that Spearman‟s general cognitive ability “g”
plays such a central role in predicting pilot success has raised the question of whether it
really makes sense to also assess specific intelligence (Carretta & Ree, 1989; Ree &
Carretta, 1996; 2002). According to these authors, the proponents of this argument
contended that because most specific intelligences are saturated with “g”, it rarely adds any
incremental validity to batteries already containing measures of “g”. This argument would
make sense, assuming Carroll‟s (1993) model of cognitive ability, which will be discussed
below, with “g” at its apex and group factors at successively lower levels to be true. For the
purpose of this research, crystallised intelligence and “g” were assumed to be theoretically
congruent.
The second issue, according to De Kock and Schlechter (2009), relates to the so-called
“criterion problems”. Most validity studies cite the lack of meaningful, quality criteria to
validate predictors against a weakness (Hunter & Burke, 1994). This problem is especially
prominent in pilot selection research (Damos, 1996).
The current research sought to address some of these issues by assessing both measures
of “g” and specific intelligence and consider how well these predict multiple criteria of pilot
training in a commercial airline.

37
2.5.4 Gustafsson’s three-level model
Gustafsson (1989) proposed a three-level model to account for the structure of intellectual
abilities as depicted in figure 2.1 below. This model integrates Spearman‟s (1904), Cattell‟s
(1971), Thurstone‟s (1938) and Guildford‟s (1967) models.
At the highest level is “g”, which represents Spearman‟s conception of intelligence. The next
level comprises three broad factors: crystallised intelligence (dealing with verbal information),
fluid intelligence (dealing with adaptive nonverbal abilities) and general visualisation (dealing
with figural information). Fluid intelligence is essentially the same as general intelligence or
“g” in this model.
Figure 2.2. Gustafsson’s hierarchical model of intelligence Source: Adapted from Sattler (1988, p. 50)
General intelligence
G
Crystallised intelligence
CG
Fluid intelligence
FG
Visualisation intelligence
VG
Verbal
achievement
V Ach
Numerical
achievement
N Ach
Verbal
comprehension
VC
Spatial
orientation
Flexibility
of closure
Visualisation
VZ
Cognition of
figural
relations
CG
Speed of
closure
CS
Induction
I
Memory
span
MS

38
Gustafsson (1989) conceived crystallised intelligence as representing a relatively narrow
dimension of knowledge and generalising less to subsequent problem-solving and learning
situations than fluid intelligence. The crystallised and fluid intelligence factors are similar to
those of Cattell and Horn‟s model of intelligence. At the lowest level are the primary factors,
similar to those in the Thurstone and Guildford traditions.
While the hierarchical model depicted in figure 2.2 above may not fit the complexities of the
interrelationships of human ability perfectly, it is a useful approximation (Humphreys et al.,. in
Sattler, 1988), and provides a useful guideline for understanding the nature of intelligence.
The view of unitary and divisible performance on literacy and numeracy tasks (to be
discussed in chapter 3) can be associated with the theories of single factor such as “g” and
separate primary mental abilities. Hence in an attempt to measure those aptitude abilities
associated with separate competence, measures of primary mental abilities may be used.
From this discussion it can be deduced that intellectual/aptitude abilities can be related to
performance in literacy and numeracy tests as broadly verbal and numerical abilities. In
other words, measures of crystallised fluid intelligence and general visualisation as depicted
in figure 2.1 may be used to measure the intellectual abilities associated with the concept of
divisible or separate performance.
2.5.5 Carroll’s three-stratum theory
This theory is hierarchical and posits a factor referred to as general intelligence, general
mental ability (GMA) or “g”, as the most abstract and general cognitive ability. Beneath “g”
reside the second stratum factors of fluid intelligence, crystallised intelligence, general
memory and learning, broad visual perception, broad auditory perception, broad retrieval
ability, broad cognitive speediness and processing speed. This theory is similar to Cattell‟s
theory of fluid and crystallised intelligence except that it posits a “g” factor at the third stratum
(Carroll, 1993).
The discussions on the various theories of intelligence indicate that there is general
intelligence “g” as a base, with other intellectual abilities that are influenced by and/or
dependent on “g”.

39
According to Cronbach (1990), some discussions in the literature seem to suggest that fluid
ability is content-less and that crystallised abilities are elementary and nonintellectual.
However, fluid ability uses knowledge in formulating and checking hypotheses. For example,
an architect designing a building, even at his or her most creative, constantly relies on a
bank of knowledge. At the crystallised end, basic language and number skills are important
(Cronbach, 1990).
With further research on the concepts of intelligence, other types of intelligence, such as
emotional intelligence, have been identified. This view is supported by other authors (e.g.
Lazear), who indicated that researchers are now looking at intelligence as a set of
capabilities that are continually expanding and changing throughout one‟s life.
Furthermore, Van Eeden and De Beer (2005, p. 121), emphasised that, “in general, we can
distinguish different types of intelligence, for instance, biological intelligence, psychometric
intelligence, and social (or emotional) intelligence”.
These views indicate the difficulties in defining the concept “intelligence”. In the current
research, however, it will suffice to accept that the concept is used in its broadest sense,
based on Cattell‟s model of fluid and crystallised intelligence.
Two issues seem to dominate current pilot selection research. Firstly, the fact that
Spearman‟s general cognitive ability (g) plays such a central role in predicting pilot success
has raised the question of whether it really makes sense to also assess specific intelligence
(Carretta & Ree, 1989; De Kock & Schlechter, 2009; Ree & Carretta, 1996; 2002). The
second issue relates to the so-called “criterion problem” (De Kock & Schlechter, 2009). Most
validity studies cite the lack of meaningful quality criteria to validate predictors against a
weakness (Hunter & Burke, 1994; Hunter & Schmidt, 1990; De Kock & Schlechter, 2009).
Regarding the first issue, according to De Kock and Schlechter (2009), proponents of this
argument argued that most specific intelligences are so saturated with g that it rarely adds
any incremental validity to batteries already containing measures of g. The authors further
stated that this argument would make sense, assuming Carroll‟s (1993) model of cognitive
ability of a hierarchy of factors with g at its apex and group factors at successive lower levels

40
to be true. For the purpose of the current research, fluid and crystallised intelligence were
assumed to be theoretically separate and were therefore discussed as such.
The next section will explore the definitions of intelligence, which will clarify the concept of
intelligence in relation to the current research.
2.5.6 Definition of intelligence
Many researchers have investigated the relationship between psychological testing and
intelligence, and it would appear that the term “intelligence” has different meanings for
different researchers.
In this section, the focus will be on understanding the term and how it is developed, taking
the theories of intelligence into account. The concept of aptitude will, for the sake of clarity,
be discussed separately. However, the stance adopted in this study, is that intelligence and
aptitude are different sides of the same coin.
Reviews of the literature on the concept of intelligence suggest that the word “intelligence” is
situation specific. According to Pyle (1979), writers such as Lierner (1977) argued that
intelligence is not the same as other psychological terms such as “learning; thinking;
problem-solving attainment or achievement”, whilst others, such as Humphreys (1971),
McFarland; 1971, stated that these terms are not qualitatively different and largely overlap.
Although intelligence as a concept has never been adequately defined, it is still regarded by
the public at large as an important entity. Confusion is widespread concerning its definition
and many still confuse IQ with intelligence (Samunda, Feuerstein, Kaufman Lewis &
Sternberg, 1998).
Moerdyk (2009) indicated that, according to the About Intelligence Newsletter, intelligence is
often seen, in the popular sense, as the general mental ability to learn and apply knowledge
to manipulate one‟s environment and to reason and have abstract thought. He further stated,
that other definitions of intelligence include adaptability to a new environment or changes in
current environment, the ability to evaluate and judge, the ability to comprehend complex
ideas and the capacity for solving problems in an original and productive way. Intelligence is

41
also regarded as the ability to learn quickly and learn from experience, and even the ability to
comprehend relationships.
Murphy and Davidshofer (2005) stated that intelligence is first and foremost a construct and
that it is impossible to formulate a definition of the actual essence of intelligence – it can be
defined only in terms of the behaviours that indicate various levels of intelligence.
According to Aiken (1991), intelligence has been viewed by educators as the ability to learn,
by biologists as the ability to adapt to the environment, by psychologists as the ability to
deduce relationships between objects and events and by information theorists as the ability
to process information.
Mundy-Castle (1974) established that the definition of intelligence in Africa was based on the
integration of both a social and a technological dimension, whereby the latter was integrated
into the former and viewed as being subordinate to the social dimension. For instance, skills
and knowledge inculcated through schooling would only be considered intelligent behaviour
insofar as such acquired cognitive abilities could later be practically implemented in the
existing social system operating within the particular culture – hence a social system which
defined intelligent behaviour in terms of rendering social services to a group as opposed to
being viewed as individualistic advancement (Segall, Dasen, Berry & Poortinga, 1999).
Armour-Thomas and Gopaul-McNicol (1998) concurred with the view of Mundy-Castle
(1974) and Segal et al. (1999), namely that the construct (intelligence) itself is a culture
invention created for the purpose of appraising who has how much of it, according to the
value system of any given society at any point in time.
According to Anastasi (1990), intelligence is not an entity in the organism but a quality of
behaviour. Intelligent behaviour is essentially adaptive, insofar as it represents effective
ways of meeting the demands of a changing environment. Anastasi (1990) further stated that
in the human species, intelligence comprises that combination of cognitive skills and
knowledge demanded, fostered and rewarded by the particular culture within which the
individual becomes socialised.

42
From the above discussion, it is clear that intelligence is an abstract with many connotations
or meanings. According to Vernon (1969), three such connotations or uses of the term are
as follows:
the innate capacity of individuals, that is, their genetic make-up
the behaviour involved in learning, thinking and problem solving
the scores obtained for intelligence tests that measure various abilities (verbal,
nonverbal, mechanical, etc.)
However, one should bear in mind is that more than a single issue is involved – intelligent
behaviour consists of a range of somewhat interrelated skills, which is what authors
emphasise when they refer to the multifaceted nature of intelligence (Pyle, 1979).
Carretta and Ree (1996) reported on a study by Olea and Ree comparing the validity of
general cognitive ability, g, and specific abilities and specific knowledge, s1 ......sn for
predicting pilot criteria, where regression equations were compared to evaluate the
predictive efficiency of g and s for each of the criteria. The above authors found that the
measure of g across all pilot criteria was the best predictor, while s contributed little. They
also reported that on the work sample criteria, the results indicated that incremental validity
of specific measures was the result of specific knowledge of aviation (e.g. aviation principles,
controls and instruments) rather than specific cognitive abilities, namely verbal, quantitative,
spatial or perceptual speed.
The implications of the divisible or separate performance of intelligence seem to suggest that
consideration should be given to how intelligence can be measured using psychological
tests. Regarding pilot selection, Ree and Carretta (1996) cautioned that generally,
intelligence should be estimated from multiple tests. Hence no estimate of intelligence
should be based on a single test.
The discussion below focuses on the measurement of intelligence, without emphasising
whether or not it is unitary based on the view that general cognitive ability (intelligence) is a
better predictor than specific abilities in pilot selection (Carretta & Ree, 1989). This should
indicate the measuring instruments that are being appropriate in the current research.

43
2.5.7 Measurement of intelligence
In conceptualising psychological testing, it is vital to introduce the aim of measurement,
which is concerned with the application of an instrument or instruments to collect data for a
specific purpose.
This is the basis of psychometric theory, the subdiscipline of industrial psychology, within
which this research is undertaken, as well as the applicable quantitative statistical
methodology. Implied in psychological testing are measurements and obtaining a record of
sample behaviour or performance which is systematic and objective enough for different
observers to make reasonably comparable findings.
According to Van Eeden and De Beer (2005), the use of intelligence measures to obtain a
score that reflects a person‟s intellectual ability has traditionally been associated with the
measurement of intelligence.
Aiken (1997) stated that, according to the tradition in psychological assessment, anything
that exists at all exists in some measurable amount. The crux of measurement, not only in
the behavioural sciences, but in all scientific disciplines, is variables. Variables, unlike
constants, are static or dynamic properties of objects or events and they have more than one
value. According to Aiken (1997), certain variables are disparate, that is, their values are
discontinuous or detached from each other, for example, male or female, while others are
continuous (i.e. in theory at least) and measurable to any desired level of accuracy.
Anastasi (1990) explained that individual differences in human intelligence can be measured
at different levels of generality or specificity, depending upon the purpose of the assessment.
She further stated that at a relatively broad level, one finds the traditional “intelligence tests”
which can be more accurately described as measures of academic intelligence or scholastic
aptitude.
These measure a kind of intelligent behaviour that is both developed by formal schooling and
required for progress along the academic ladder. For fuller assessment of an individual‟s
readiness to perform in a particular occupation or course of study, tests of separate abilities
in such areas as the verbal, mathematical, spatial, mechanical or perceptual-motor are

44
useful – and even more narrowly defined skills and knowledge may be required for the
execution of clearly defined tasks such as certain military occupational specialties (Anastasi,
1990).
Van Eeden and De Beer (2005, p. 125) cautioned that “we must remember that an IQ or
intelligence score is a theoretical concept and it cannot reflect intelligence in all its diversity”.
In other words, the score obtained is merely an inference to reflect mental abilities, based on
the purpose of the assessment.
The view of divisible or separate performance of intelligence seems to suggest that
measures to assess the specific abilities are appropriate for such assessments, while for
general intelligence broader assessment instruments will have to be used.
The relative importance of g and s in the prediction of criteria has been and remains the
centre of controversy (Calfee, 1993; Jensen, 1993; McClellan, 1993; Ree & Earles, 1992;
1993; Ree & Carretta, 1996; Schmidt & Hunter, 1998; Sternberg & Wagner, 1993;). Ree and
Carretta (1996) noted that the study of abilities indicates notable difficulties in the
interpretation of results. According to Ree and Carretta (1996), ignoring any of the following
four important issues will lead to misinterpretation:
sample size
censored samples, which restrict range
the interpretation of rotated factors
reliability, which leads to erroneous conclusions, including using tests or other
predictors so unreliably that they cannot correlate with any other measures, thus
erroneously giving the appearance of uniqueness
In this research, both the broad level of intelligence and readiness to perform pilot tasks are
assessed. The intelligence tests used as measurement instruments in this research are
Raven‟s Progressive Matrices (RMP) and the Wechsler Adult Intelligence Scale (WAIS),
together with tests of separate abilities, namely the English Literacy Skills Assessment
(ELSA), the Blox Test and the Intermediate Test Battery. However, it could be argued that
these tests have a g loading.

45
Earlier in the chapter it was indicated that aptitude would be discussed separately to provide
clarity and to conceptuale aptitude as part of intelligence. This is to ensure that a holistic
approach to intelligence is adopted for the purpose of this research.
2.6 DEFINITION OF APTITUDE
It is pertinent to mention that, according to Birch and Hayward (1994), factor analytical
theories attempt to identify the structure of abilities which make up intelligence, and a
number of more recent theories seek to explore the working of the abilities themselves. The
above authors (1994) indicated that the theories of Gardner (1983) and Sternberg (1985;
1988) are attempts to understand intelligence in terms of the complex interaction of the
various cognitive abilities and other systems.
This part of the discussion provides a framework in which aptitude is conceptualised as
special abilities under the umbrella of intelligence. The concept will be defined from a
cognitive abilities perspective, based on an integration of the notion of intelligence and
psychological testing. The researcher will endeavour to demonstrate that the
assessment/testing used by the commercial airline dealt with in the current study is used to
test for the special abilities needed to succeed in the cadet pilot training programme.
In psychology, the term “aptitude” is defined in various ways, just as there are many different
definitions of it in the English language (Kline, 1998). For instance, according to Bingham
(1937), writers use the term “aptitude” with different emphasis, some stressing inherited
capacity, others, present ability, ease of acquisition, dominant interest or some other aspect
of aptitude.
Bingham (1937) defined aptitude as a condition of a set of characteristics regarded as
symptomatic of an individual‟s ability to acquire, with training, some (usually specified)
knowledge, skill or set of responses such as the ability to speak a language, produce music,
and so forth. According to this view, however, aptitude is a present condition, a pattern of
traits, deemed to be indicative of potentialities.
According to Kline (1998), aptitude usually refers to a collection of abilities which happen to
be of value in a particular culture. Of interest here is the fact that in both definitions, nothing
46
is said about whether the “conditions or set of characteristics or collections of abilities” are
acquired or inborn.
Reschly and Robinson-Zanartu (2002) in their discussion on dynamic assessment indicated
that dynamic assessment and mediated learning intervention models presume that learning
abilities or aptitudes are modifiable rather than stable.
Murphy (1989), however, explained that abilities are relatively stable individual differences
that are related to performance on some sets of tasks, problems or other goal-oriented
activities. A distinction is made between general ability and special abilities, where the latter
refer to more specific abilities that are restricted to a relatively narrow range of goal-directed
activities (e.g. music).
According to Owen (1991), factors that are relevant in this regard are a real interest in and
preference for a particular task without which it is not possible to acquire the specific abilities
required for a certain task. This indicates that aptitude is influenced by other constructs,
which are usually not measured.
According to Reschly and Robinson-Zanartu (2002), aptitude, intelligence and achievement
as psychological constructs or type of tests are not easily distinguished. The authors stated
that the traditional distinction was that achievement tests reflected the effects of past
learning, whereas aptitude and intelligence reflected the individual‟s potential for success. In
this traditional view, both aptitude and intelligence were seen as relatively enduring traits of
the individual, not easily modified by experience or special training.
Cattell (1987) suggested that, in a sense, the term “aptitude” is a misnomer if it means to
imply that what is being measured is an inborn unchangeable characteristic. Tests of special
aptitudes were viewed as measures of special innate or hereditary talents not based on
experience.
In contrast to Bingham (1937) and his followers, Guildford (in Owen & Taljaard 1989) and
Super and Crites (1965) and others had a somewhat different view of aptitude. Owen and
Taljaard (1989) cited Guildford (1959), who referred to the term as the underlying

47
dimensions of ability. Some of these dimensions appeared to be fields of knowledge (e.g.
mechanical or mathematical).
Super and Crites (1965) adopted another approach to aptitude. It is used in either of two
ways, as when it is said that a man has a great deal of aptitude for art, meaning that he has
many of the characteristics required to be successful as an artist or when one says that a
person lacks spatial aptitude, meaning that she lacks this one specialised aptitude which is
vital in a number of occupations.
In the first instance, the term refers to a combination of traits and abilities, and in the second,
to a discrete unitary characteristic, a view proposed by Cascio (1991).
Reschly and Robinson-Zanartu (2002) indicated that the aptitude models and measures
typically focus more on intra- as opposed to inter-individual differences. The former involves
variation in the pattern of cognitive processes in the individual, whereas the latter, which is
typically used with conventional measures of intelligence and achievements, examines
differences between individuals. According to these authors, the inter-individual approaches
to interpretation are useful for determining level of performance in comparison to others,
while intra-individual approaches yield information on an individual‟s pattern of performance.
However, aptitude assessment and intervention models share the common goal of improving
academic achievement.
In the current study, the inter-individual interpretation method will be followed because
differences between individuals will provide the commercial airline with information on
individuals who are likely to succeed in completing the pilot training programme against
those who may not.
In their discussion on product versus process orientation, Reschly and Robinson-Zanartu
(2002) stated that product-oriented models focus on whether or not the individual can
correctly perform certain tasks that are assumed to be reflections of underlying aptitude. In
contrast, aptitude models that are more process oriented attempt to examine underlying
cognitive processes or thinking skills that the individual uses to achieve right or wrong
answers to the task.

48
According to Reschly and Robinson-Zanartu (2002), the process product distinction relates
to both the stability-modifiability assumption and the question of transfer of training, kind of
assessment and intended outcomes. In other words, when measuring aptitude, one
measures the outcome as reflected by the score obtained as an indication that the individual
has the aptitude to perform the task, in accordance with the product-oriented model.
Alternatively, when the scores/results are interpreted, these do measure the process the
individual uses to obtain the outcome, and this applies to the process-oriented model.
These views by Reschly and Robinson-Zanartu (2002) indicated the complexities and
interactions between intelligence and aptitude as well as whether aptitude is a unitary ability
or numerous abilities. Furthermore, it highlights the issue whether aptitude is a changeable
construct.
According to the Institute of Psychology and Edumetric Research at the Human Sciences
Research Council (Owen & Taljaard, 1989), aptitude may be regarded as the potential that
enables an individual to reach a particular level of ability with a given amount of training
and/or practice. Aptitude, together with other personality characteristics such as interest,
attitude and motivation as well as training and teaching will determine the level of proficiency
and skill a person can attain.
Van Eeden and De Beer (2005) concurred in their definition of aptitude, namely that it refers
to the individual‟s ability to acquire, with training, a specific skill or to attain a specific level of
performance.
In a study by Van Eeden, De Beer and Coetzee (2001), the aim of which was to evaluate a
battery of tests to be used as part of a process of selecting first-year students
(disadvantaged students in particular) – for engineering and other science and technology
courses at the ML Sultan Technikon in Durban, a computerised adaptive test measuring
learning potential developed specifically for disadvantaged students was included. A more
commonly used test of general ability, which measures specific aptitude, the Learning
Potential Computerised Adaptive Test (LPCAT) (De Beer 1994, 1997) was also included in
the battery. This test consists of nonverbal items only in an attempt to negate the effect of
language ability/competence on test scores. This study seems to support the view that

49
aptitude may be an indicator of an applicant‟s potential to successfully complete a training
programme when training is provided.
To avoid confusion, a point of terminology needs to be clarified here. The term "aptitude test"
has been traditionally employed to refer to tests measuring relatively homogeneous and
clearly defined segments of ability, whereas the term "intelligence test" usually refers to more
heterogeneous tests yielding a single global score such as IQ (Anastasi, 1990).
Anastasi (1990) suggested replacing the traditional concepts of aptitude and achievement in
psychometrics with the concept of “developed abilities”, that is, the level of development
attained by an individual in one or more abilities.
Any test, according to Bingham (1937), tests aptitude in so far as an individual‟s score is an
indication of future potential. Prediction value is consequently the most notable feature of an
aptitude test – without it, a test cannot be an aptitude test. This indicates that when using an
aptitude test, the purpose is to determine whether a person has the necessary susceptibility
for learning or learning ability in a particular field so that with the appropriate stimuli, he/she
will succeed in that field.
Aiken (2003) stated that because of the confusion over the difference between aptitude and
achievement, it has been recommended that the two terms be replaced with the single term
“ability” – a test of ability can be a measure of achievement or of aptitude.
Multiple aptitude tests, in contrast with general aptitude tests (i.e. intelligence tests), adopt a
differential approach to measurement of aptitude. Multiple aptitude tests provide a set of
scores for different aptitudes. These scores are used to draw an intellectual profile reflecting
the individual‟s strong and weak points (Aiken, 2003).
Aiken (2003) indicated that scores on general intelligence tests are often better predictors of
success in educational and employment situations than combined scores on measures of
special abilities. This view is supported by Vernon (1960), who concluded that general
intelligence is more important than special abilities in determining occupational success.

50
According to Van Eeden and De Beer (2005), the term “aptitude” is used to describe a
specific ability. It refers to the individual‟s ability to acquire, with training, a specific skill or
attain a specific level of performance. The authors further stated that different aptitudes and
aptitude fields are also important for success in different occupations. However, the level of
skill a person may acquire also depends on his/her general intellectual ability, interest,
personality traits, attitude, motivation and training.
It can be inferred that aptitude measurements focus on the future and achievement
measurements on the past – hence Aiken‟s (2003) statement that intelligence tests are
better predictors of success, is aligned to this research. Regarding specific intelligence (Sn),
a multitude of abilities have been found to predict pilot training success, including verbal,
quantitative, spatial and mathematical ability, as well as perceptual speed and instrument
comprehension (Carretta & Ree, 1996; De Kock & Schlechter, 2009).
For the purpose of this research, the term “aptitude” is used as a broad classification,
including verbal and mathematical ability to ensure that the constructs to be investigated are
delimited. Neither personality characteristics nor training or teaching, according to the
HRSC‟s view, fall within the scope of this research.
In this research, general intelligence tests were used as measurement instruments of
general intelligence as a unitary ability. However, according to De Kock and Schlechter
(2009), the relative importance of “g” and Sn in predicting pilot training success remains a
controversial issue.
2.6.1 Measurement of aptitude
Literature on the measurement of intelligence indicates that the concept is multifaceted,
although the factor “g” plays a significant role. As such, there are numerous psychological
tests available to measure the intellectual behaviour associated with literacy and numeracy.
Regarding aptitude, Van Eeden and De Beer (2005) commented that the difference is that
the items and subtests of measures of general cognitive functioning are selected primarily to
provide a unitary measure, and not to provide an indication of differential abilities.

51
Aiken (1997) stated that researchers need to make certain that the selected instrument has
enough range for the purpose of their investigation. In this research, the ELSA test, for
instance, was found suitable as a tool to measure verbal ability and ABET levels.
According to Owen (1996), the abilities measured by aptitude measures correspond to the
intellectual abilities measured by a test of general ability. This view is similar to that of De
Kock and Schlechter (2009), who stated that many of the additional measures that are used
are saturated with “g” and do not represent unique abilities. However, some authors (e.g.
Martinussen, 1996) disagreed and demonstrated that the inclusion of specific abilities did
have an incremental validity over and above measures of “g”.
De Kock and Schlechter (2009) pointed out that according to some authors, such as Burke,
Hobson and Linsky (1997), Carretta, Perry and Ree (1996), and Ree and Carretta (2002),
“g” remains a better predictor of pilot success than specific abilities. Other authors (e.g.
Hunter & Burke, 1994; Martinussen, 1996) came to a different conclusion and reported – as
a result of their meta-analyses – that measures of general intelligence had a low mean
validities compared to more specific measures of intelligence.
According to Bergh (2009), aptitude testing is mainly directed at assessing an individual‟s
natural potential and acquired learning, which may enable him/her to develop particular
proficiencies and skills for particular intellectual tasks.
It would seem that from the aptitude measures that an individual‟s potential can be inferred
from his/her score in these measures, which could be a reflection of his/her general mental
ability. However, Bergh‟s (2009) view appears to indicate that the measure could reflect the
potential the individual has to acquire a particular skill to perform a specific task. This view
suggests that the measure may indicate the individual‟s potential in a specific task.
Intelligence test scores often correlate highly with academic success. Numerous studies
have reported moderate to high correlations between intelligence test scores and academic
achievement. The correlations are generally highest for verbal-oriented courses. For
instance, Sternberg (1982) reported on a study by Bond, that correlations between Stanford-
Binet IQ scores and success in various high school studies ranged from 0.48 (geometry) to
0.73 (reading comprehension). This is in accordance with the view of Vernon (1969) who

52
recommended that when constructing a selection procedure for the prediction of academic
performance, it is preferable to incorporate measures of general ability measuring verbal
ability and reasoning ability.
According to Bergh (2009), most aptitude measurements are based on the following general
and group abilities, as classified by Spearman (1904) and Thurstone (1938) in particular:
intelligence – the general mental ability (g factor) to understand, learn, reason and
adapt
reasoning – the ability to think logically and find rules for solutions on given
information
memory – the ability to reproduce meaningful information such as words, symbols
and numbers obtained or retained from previous learning and experience
numerical ability – the ability to reason quickly and accurately by way of addition,
subtraction, multiplication and division
spatial ability – the ability to perceive form and space, visualising forms and distance
in two and three dimensions
verbal (language) comprehension – the ability to understand and reason about
problems containing language such as words and verbal analogies
word fluency – the ability to be fluent in word and language
perceptual speed – the ability to perceive detail and differences quickly and
accurately
Of these, verbal, spatial, reasoning and numerical abilities have been found to be best
predictors of work performance (Bergh, 2009; Hunter, 1986).
Van Eeden and De Beer (2005) appear to concur with Bergh (2009) that the abilities
measured by different aptitude measures include reasoning on the basis of verbal, nonverbal
and quantitative material, language comprehension, spatial ability, perceptual speed,
memory, coordination, and so on.
Organisations need to be highly sensitive and efficient when testing applicants for positions.
The learning organisation concept suggests a way of thinking about ensuring that

53
organisations as a system can choose to create selection batteries that will potentially
identify applicants who have a better chance of succeeding in a training programme.
According to De Kock and Schlechter (2009), the debate on the role of intelligence and
aptitude in the prediction of pilot training success is still active and can be interpreted as an
attestation to its dominance in pilot selection batteries.
The discussion seems to suggest that aptitude should be measured separately. However,
the general intelligence “g” appears to play a vital role in measuring aptitude. With the
overlap between aptitude and intelligence so apparent, the implication is to consider whether
psychological tests should measure intelligence and aptitude as a unitary measure or
separate performance measures.
2.7 PSYCHOLOGICAL TESTS THAT MEASURE INTELLIGENCE AND APTITUDE
Much has been written about psychological testing and the measurement of intelligence and
aptitude. The discussion has provided the background by defining the concepts of
intelligence and aptitude, while highlighting the development of intelligence on the basis of
theories of intelligence. At this stage it would therefore be appropriate to consider the
psychological tests that provide measures for general intelligence and special abilities or
aptitude.
The use of the mental aptitude test becomes important when endeavouring to predict a
broad range of skills. According to Cunningham (1986), a single mental ability test can be
used to predict a wide range of performances and tests that were once referred to as
intelligence tests are now having their names changed. The publishers seem to be trying to
avoid the controversy and negative connotations surrounding the term “intelligence”. The
Large-Thorndike Intelligence Test is now referred to as the Cognitive Ability Test.
A recent study by Jukes and Grigorenko (2010) on assessment of cognitive abilities in multi-
ethnic countries reported that the results of their research indicated that sub-Sahara Africa‟s
historically low levels of formal education and urbanisation are providing some kind of
explanation for the continent‟s poor performance in Western IQ tests, which are designed in
and for the context of schooling in industrialised societies.

54
Most cognitive tests used in this country assess verbal ability, numerical ability, deductive
reasoning and the like. These can largely be viewed as indicators of crystallised intelligence
(following Cattell's theory) and often concern specialised skills or knowledge promoted or
required by a given culture (Taylor, 1994). This structural approach attempts to measure
performance along dimensions assumed to constitute the fundamental structure of a domain
such as cognition (Bedell, Van Eeden & Van Staden, 1999).
Van Eeden and De Beer (2005) advocated that researchers should consider the following
factors when investigating the cross-cultural equivalence of measures:
Construct equivalent refers to the fact that one needs to investigate and ensure that
the construct being measured is equivalent across different subgroups.
Method equivalence involves referring to the way in which measures are applied,
thus ensuring that the contextual and practical application of measures does not lead
to differences between subgroups. Factors such as test sophistication and language
proficiency are relevant here.
Item equivalence ensures that different subgroups do not respond to a particular item
differently because of the way in which it has been constructed and because it does
not relate to the construct being measured.
In the light of the factors discussed above, it is possible some of the instruments used during
the cadet pilot selection process may have placed some of the applicants at a disadvantage.
Method equivalence is relevant to this research study because of the diverse nature of the
applicants with regard to educational, cultural and socioeconomic backgrounds.
Jukes and Grigorenko (2010, p. 92) cited the view by Rosselli and Ardila, namely that
nonverbal tests as being “culture free” or “culture fair”, found evidence that suggests that
education level, cultural background and urban residence are all associated with
performance on nonverbal tests. The conclusion they draw is that “that there are no „culture
free‟ or „culture fair‟ tests”.
Holburn (1993) reported that psychometric assessment techniques assess specific aspects
of a person‟s functioning. A case in point is the so-called “intelligence tests” which do not

55
measure intelligence per se. They measure the ability that is deemed important in Western
cultures, and the items, which are presented in a specific language, closely approximate
those found in Western education systems. All test scores are influenced by past learning
experiences. There are no measures of pure innate ability.
The results of a study by Carroll (1993) found that performance in a foreign language course
by students whose precourse scores in a foreign language achievement test were zero could
be predicted from their scores in a test of aptitude for learning foreign languages. As one
would expect, if the training had improved achievement but had not affected aptitude, the
scores for the achievement test would have increased significantly. However, the aptitude
test scores remained essentially unchanged.
These views suggest that caution should be exercised when measuring a construct such as
aptitude because there may be underlying factors that affect the scores. Also, the measuring
instruments should measure the constructs that have been identified as important for one to
successfully complete a pilot training programme.
According to Hesketh and Robertson (1993, p. 4), to fully understand the role of both broad
and more specialised abilities, they should both be assessed at the same time: “research on
narrow abilities may have failed because the attention has not been paid to broad abilities
and, conversely … the research on broad abilities has been hampered, because the
influence of narrow abilities has not been recognized to a sufficient degree”.
Hesketh and Robertson (1993) further stated that to achieve such an understanding, a wider
empirical and theoretical lens is needed than has been evident in the selection literature to
date, including recognition of the distinction between latent and manifest variables and the
influence of other factors, such as motivation (maximum and typical performance) and the
measurement of variables.
Implied in these views is that the variables measured during the cadet pilot selection process
should be broad enough to make meaningful deductions about the applicant‟s abilities and
potential to successfully complete the cadet pilot training programme.

56
Aiken (1997) expressed the view that general intelligence tests measure a hodgepodge of
specific aptitudes or abilities as a two-edged sword. Because intelligence tests measure an
assortment of abilities – what Cronbach (1990) referred to as bandwidth – because of their
broadness, they have proven to be moderately effective in predicting various criteria. The
complementary concept of bandwidth refers to the amount or complexity of information one
tries to communicate in a given space or time.
Having noted the significant positive correlations between measures of special abilities,
Vernon (1960) concluded that general intelligence is more important than special abilities in
determining occupational success. Whether performance varies because of differences in
work motivation or differences in the special abilities required by certain occupations, or
both, is arguable.
According to Feldhusen and Jarwan (1995), the goal of an admission programme should be
to select students who are most likely to benefit from what is offered educationally, as well as
meeting the institution's criteria of success – hence the need to identify both the
educationally advantaged and disadvantaged candidates who have the best chance of
passing a course (Nunns & Ortlepp, 1994). It is also necessary to identify those who have a
reasonable chance of passing the course with the aid of academic support programmes. The
aim of this research study is to determine whether the measurement instruments used in the
selection process could identify candidates who have the potential to successfully complete
the cadet pilot training programme.
Taylor (1994) stressed the importance of identifying those individuals who have the potential
for development, even though their abilities are currently limited by previous disadvantages.
He suggested that in order to address the inequities of the past, more emphasis should be
placed on potential as opposed to skills or specific abilities, and those individuals with high
potential should be afforded the opportunity to develop specific skills through training
programmes.
According to Van Eeden and De Beer (2005), providing a learning opportunity as part of the
assessment takes into account the fact that individuals may differ considerably in terms of
their educational and socioeconomic background. These are known to influence cognitive

57
performance. Hence individuals should be allowed to indicate their potential level of
performance regardless of their background.
Shochet (1994) stated that tests of cognitive abilities that reflect the individual's current level
of functioning rely largely on his/her previous learning experience. Groups from a
disadvantaged educational background thus typically do not perform well in such tests.
These views are relevant to this research because the applicants were from diverse
backgrounds in terms of education, socioeconomic background, culture and so forth.
Furthermore, during the selection process from which the data were obtained, the learning
potential of these applicants was not measured, which would have added value to the
decision making on which candidates would be more likely to successfully complete the
cadet pilot training programme.
It is assumed that everyone being assessed has more or less the same level of experience
with regard to the different aptitudes. This is not necessarily true in a context where people‟s
backgrounds might not be the same. The composition of the norm group with regard to
language and culture should therefore be taken into account when interpreting results (Van
Eeden & De Beer, 2005).
Numerous instruments are available to measure intelligence and aptitude. Of relevance here
is whether organisations should be measuring potential or current abilities, with due
consideration of the impact of language for those individuals whose home language is not
English.
It can be inferred that in terms of the current research this could mean that the commercial
airline could justify using mathematics, science and English as minimum criteria for selection
to participate in the cadet training programme since these subjects may provide an indication
of some of the aptitudes required for a career as a pilot.
As mentioned previously, the purpose of the current research is to evaluate the predictive
validity of the current psychological tests used to select cadet pilots to successfully complete
the commercial airline‟s cadet pilot training programme.

58
2.7.1 Requirements for psychological measures
As mentioned earlier, in South Africa, according to the requirements of the Employment
Equity Act, it is the responsibility of organisations and employers to ensure that the
psychological measures used in the selection process are reliable and valid and do not
discriminate unfairly.
According to Damos (1996), there are three basic criteria for a pilot selection battery:
The fundamental purpose of such a battery is to select individuals for the job of flying
an airplane.
The scores obtained from the battery must be reliable.
The battery must be valid.
2.7.1.1 Reliability
Foxcroft, Roodt and Abrahams (2005) and Moerdyk (2009), defined the reliability of a
measure as the consistency with which it measures what it is supposed to measure.
Moerdyk (2009) referred to four types of reliability, namely test-retest reliability, parallel or
alternate form of reliability, internal consistency and inter-score reliability. Each of these will
be briefly discussed below.
a Test-retest reliability
In determining the reliability of a measure it is necessary to administer the measure twice to
the same group of test-takers. The reliability coefficient in this case is simply the correlation
between the scores obtained on the first (X) and second (Y) application of the measure
(Foxcroft et al., 2005). According to Moerdyk (2009), the closer the correlation coefficient is
to 1, the greater the stability will be over time.
b Parallel or alternate form of reliability
In this method, two equivalent forms of the same measure are administered to the same
group on two different occasions. The correlation that is obtained between the two sets of
scores represents the reliability coefficient which is known as the coefficient of equivalence

59
(Foxcroft et al., 2005). Some theorists argue, however, that the development of a parallel or
alternate form of any test is time consuming and expensive and therefore not recommended
(Foxcroft et al., 2005; Moerdyk, 2009).
c Internal consistency or split-half reliability
This type of reliability coefficient is obtained by splitting the measure into two equivalent
halves (after a single administration of the test) and computing the correlation coefficient
between these two sets of scores. This is referred to as the coefficient of internal
consistency. Splitting the measure at its midpoint into the first and the second half is the
simplest way, but this may be problematic because measures, particularly of ability, tend to
become more difficult towards the end (Foxcroft et al., 2005; Moerdyk, 2009).
d Inter-score or inter-rater reliability
This form of reliability is concerned with the extent to which two or more raters, observers or
judges agree about what has been observed. The correlation coefficient between the scores
from two or more observers is called the inter-score reliability coefficient (Foxcroft et al.,
2005; Moerdyk, 2009).
Generally information relating to the reliability of a test is included in the test manual or
technical manual of the psychometric test (Cronbach, 1990).
2.7.1.2 Validity
According to Moerdyk (2009), there are three main forms of validity, all of which are
important, although they are applied differently in various contexts and therefore require
different kinds of evidence. The three forms are as follows:
a Construct (theoretical) validity
This is concerned with whether the assessment technique produces results that are in line
with what is already known (Moerdyk, 2009).

60
b Content validity
According to Moerdyk (2009), content validity is concerned with whether the content of the
scale or measure accurately reflects the domain it is trying to assess. This form of checking
is most appropriate for achievement and knowledge assessment.
c Criterion-related (empirical) validity
This relates the scale outcomes to some external criterion. Moerdyk (2009) describes the
following two forms of criterion-related validity:
(1) Concurrent validity. This form of validity is designed to ask whether the
measure successfully distinguishes between known groups.
(2) Predictive validity. This is focused on whether the assessment procedure can
predict how groups may differ in the future (Moerdyk, 2009).
The following additional forms of validity are worth mentioning:
(1) Face validity. According to Moerdyk (2009), the basic issue with face validity is
that the assessment technique should appear (especially to the uninformed) to be
doing what it claims to be doing.
(2) Ecological validity. This is concerned with whether the results of the assessment
are meaningful and useful outside the setting in which they are obtained.
(3) Incremental validity. According to Carretta and Ree (1996), incremental validity is
the ability of one predictor to add to the predictive efficiency of another predictor.
Damos (1996) reported that military selection batteries are overwhelmingly designed to
predict pass-fail undergraduate flight training, while Carretta and Ree (1996) referred to
these as dichotomous pass/fail training criteria. As stated in chapter one that Damos (1996)
also noted that no examination of concurrent validity of postgraduate training performance
has been made for transport pilots.
According to the internationally accepted principles and guidelines (American Psychological
Association, 2003; US Department of Labor, both cited in De Kock and Schlechter, 2009), a
sound selection procedure is one that allows valid inferences to be made regarding future

61
job behaviour from an available measured score. Muller and Schepers (2003) concurred by
stating that predictive validity refers to the degree to which a current measure (the predictor)
can predict the variable of real interest (the criterion), which is not observed until sometime in
the future (Ghiselli, Campbell & Zedeck, 1981; Huysamen, 1996). In the current research,
the researcher wished to determine whether the psychological tests measuring intelligence,
aptitude, the Matric English symbol and ABET levels (predictors) are valid in predicting the
successful completion of the cadet pilot training programme (criterion).
Huysamen (1996) asserted that predictive validation is most relevant for aptitude and
interest tests, which are used to select and classify job applicants, or applicants for
specialised training courses. According to Muller and Schepers (2003), if a test possesses
predictive validity, it improves the decision-making process, which is of particular significance
in the selection process.
At this stage, in order to contextualise the discussion thus far, it would be appropriate to
provide a brief overview of the structure and content of the cadet training programme. This
will provide a point of reference for the importance of using the appropriate psychological
tests to select candidates for the training programme.
2.8 OVERVIEW OF THE STRUCTURE AND FORMAT OF THE CADET TRAINING
PROGRAMME
The main focus of the programme is to open doors to a career that was historically closed to
previously disadvantaged individuals. The basic requirements for selection include the
following:
no more than 60 flying hours (flying experience is not a prerequisite)
compulsory Mathematics with Physical Science, Computer Science or Accounting,
and fluency in English (at level 4)
Phase 1, the preparation course, takes place over a four-month period and consists of six
modules. There are written examinations in all aspects of modules 1, 2, 4, 5 and 6 and the
required pass mark are 75% for all examinations. There are no written examinations in
module 3. After each of the six modules, all candidates are assessed individually in terms of

62
their leadership and motivation as well as having achieved an overall 75% for the written
examinations.
After 18 months of flight training, the cadets‟ graduate with a South African Commercial
Pilot‟s Licence, with Instrumentation Rating and a Frozen Airline Transport Pilot‟s Licence.
2.8.1 Content of the cadet training programme
The basic content of phase 1, the preparation course, comprising six modules, is provided in
table 2.1 below.
Table 2.1 Content of each module in phase 1: the preparation course
Module 1 Module 2 Module 3 Module 4 Module 5 Module 6
Mathematics Physical Science Computer Training
Aviation- related Geography
Life skills Whole-brain learning Business awareness Cultural diversity Managing your money Airline industry overview Customer treatment
Avionics Internal combustion engine Mechanical/gas turbine/propeller theory Electronics/radio/ instruments
Aeroplane weight and balance and performance
Radio procedural training
External providers present modules 1 and 2 over a period of seven-and-a-half weeks. It is
pertinent to mention that phase 1 of the cadet training programme as outlined above in table
2.1 covers the phonology, syntax and semantic nature of the English language and at the
same time deals with the measurements of the basic dimensions of numeracy.
Table 2.2 highlights the practical training that the cadet pilots undertake over a period of 18
months. During this phase, the cadet pilots have to do a written and practical examination.
Those candidates who do not achieve the required pass mark are afforded an opportunity to
rewrite the examination for the particular module in which they were unsuccessful.

63
Table 2.2
Content of each module of phase 2: the flying course
Module 1 Module 2 Module 3 Module 4
Meteorology Flight planning Radio Navigation
Module 5 Module 6 Module 7 Module 8
Air law
and procedures
Aircraft technical Instruments Human
performance
The practical aircraft training is provided by an accredited flying school. The training was
previously undertaken in Australia, but is now provided at a local training school in South
Africa.
2.8.2 Duties and responsibilities of a pilot
According to Loukpoulos, Dismukes and Barshi (2003), airline cockpit operations are highly
scripted. Pilots are given formal written procedures that prescribe in detail how the aircraft
must be operated in each phase of flight, and who is required to do what and in what
sequence.
A pilot‟s primary task is to operate the aircraft safely and economically. To achieve this, pilots
perform a range of tasks as depicted in table 2.3 below, with many shared between the
captain and first officer. These may vary, depending on the company, but generally include
the following:

64
Table 2.3
General duties of pilot *
Ensuring that information about the route,
weather, passengers and aircraft is correct
Analysing the flight plan, including the route
and flying altitude, to ensure that it
accurately reflects the expected
circumstances of the flight
Calculating how much fuel to take, and
supervising the loading and fuelling of
aircraft
Ensuring that all safety systems are working
properly
Briefing the cabin crew before the flight, and
maintaining regular contact with them
throughout the flight
Carrying out preflight checks on the
navigation and operating systems
Communicating with air traffic control prior
to take-off and during flight and landing
Ensuring that noise regulations are
followed during take-off and landing
Understanding and interpreting data from
the instruments and controls
Making regular checks on aircraft‟s
technical performance and position, on
weather conditions and air traffic during
flight
Communicating with passengers using
the public address system
Reacting quickly and appropriately to
environmental changes and emergencies
Updating the aircraft logbook and/or
writing a report at the end of the flight,
noting any incidents or problems in the
aircraft
*Source: Adapted from Airline pilot job description and activities (2010)
This part of the discussion covered the first phase of the cadet pilot training programme,
which is theoretical, thus forming the foundation for the second phase, which is practical and
includes the actual flying of an aircraft. On successful completion of the practical training,
the cadet pilot will obtain the Commercial Pilot Licence.
The duties and responsibilities, although not detailed, describe some of the basic functions
that a pilot must perform. It should be noted that there are differences in functions between

65
the captain and the first officer. In most instances, this is based on the individual‟s number of
flying hours. Furthermore, it will be noted that the duties mentioned do not cover the “during
the flying phase”.
2.8.3 Psychological profile of a pilot
According to Bartram and Baxter (1996), in the search to find better methods of identifying
“the right stuff”, the history of pilot selection has witnessed a wide variety of assessment
methods. The authors stated that over the past 40 or 50 years, individual differences in
general ability have remained a strong predictor of training outcome, together with an
emphasis on the importance of psychomotor coordination and various aspects of personality.
This view indicates that pilot selection has not reached consensus of what “the right stuff” is
in pilot selection, particularly for passenger airlines. Damos (1996) supported this view when
she reported that no examination of concurrent validity or postundergraduate training
performance has been made for transport pilots.
In her research, Damos (1996) reported that job analysis for operational pilots is surprisingly
difficult to find. According to her, the problem associated with defining an airline pilot‟s job is
evident in the fact that literature available on this topic dates back to 1940s and 1950s.
Identifying reliable measures of job performance is more complex in some respects for
airlines than for the military – for instance, airline pilots have tasks other than flying the
aircraft (e.g. interacting with the public), which aircraft carriers believe are a vital part of the
job and should therefore be measured (Damos, 1996).
A literature review of the profile of a commercial pilot does not provide a “definitive” profile of
a pilot. Different views have been expressed with a particular reference to the differences
between military and civil/commercial pilots relating specifically to the personality attributes.
Table 4.10 in chapter 4 provides a comparison from different sources, namely Aspeling
(1990), De Montalk (2008) and Hutchison (2009). The common theme that emerges from the
information is some measure of cognitive ability and communication.

66
2.9 CHAPTER SUMMARY
This chapter explained the concept of selection and the process followed during cadet pilot
selection. The determinants of pilot training success were also highlighted as well as the
generic duties of a pilot. The theories of Spearman (1904), Thurstone (1938, 1948), Cattell
(1987), Gustaffsson (1984) and Carroll (1993) were outlined in order to explain intelligence in
relation to aptitude, literacy and numeracy (the latter two concepts will be discussed further
in chapter 3). Concerns about the definition of intelligence were also raised.
The literature review of intelligence provides an integrated approach, thus forming a basis to
empirically test the relationship and/or correlation and differences between
intelligence/aptitude and literacy and numeracy, which will be discussed in chapter 4.

67
CHAPTER 3
LITERACY AND NUMERACY
3.1 INTRODUCTION
In this chapter the concepts of literacy and numeracy are defined and discussed in order to
operationalise these concepts in the context of the research. The literature reviews in
chapters 2 and 3 are then integrated to provide the conceptual and theoretical perspective
for the empirical study to be discussed in chapter 4.
3.2 LITERACY
According to Jukes and Grigorenko (2010), in early childhood care and education
programmes in Africa, there is increasing use of other measures of cognitive development,
which shows recognition of the importance of mother tongue as a medium of instruction.
Another view by Huysamen (1996) relating to the use of untranslated tests in English to
individuals whose home language is not English, the individual’s test performance is not only
affected by his/her standing in the construct involved , but also by his/her familiarity with the
English language and the situation depicted in the test.
These views suggest that literacy has an impact on an individual’s performance during a
selection process involving psychological tests.
Holme (2004) stated that both the Roman and Greeks saw literacy as a condition of full civic
participation and hence of citizenship itself. This confirms the view that literacy should be
viewed from a society and community perspective.
In today’s world, literacy expectations are higher and a literate person would be expected to
be able to read widely with understanding of the meaning or be able to identify the barriers to
understanding (Holme, 2004).

68
3.2.1 Literacy in the South African context
The above explanations seem to emphasise the cultural perspective based on community
norms. This means one has to look at the implications of these explanations from a South
African perspective.
Because English has become the lingua franca of business and government, a greater
responsibility now lies with employers to ensure adequate proficiency in this language
among their employees (Price, 1997). A reasonable level of English proficiency is required to
avoid conflict and misunderstanding and to promote productivity. As mentioned previously,
this improvement in language skills is likely to prove beneficial to the test performance of
many African language speakers (Bedell, Van Eeden & Van Staden, 1999).
According to Mazak (2007), the saliency of English in the domain of work and politics is not
that surprising when viewed through the lens of colonialism. Mazak (2007) also stated that
the status of English and its importance for economic success are not questioned, and these
remain unquestioned in countries throughout the world that are trying to gain access to the
world markets.
Foxcroft and Aston (2006) noted that language is one of the parameters along which cultures
vary. They (2006) further pointed out that in South Africa, 11 official languages are
recognised: nine African languages, Afrikaans and English. The implication of this view is
emphasised by Hutton (1992) who referred to a statement by Lyster that learners in South
Africa, often move to learning English as a second language (ESL) before they are fluently
literate in their mother tongue. This is partly because English is seen as the language of
education, power and work. People learn best when they can build on what they already
know, but learning to read a language one does not know is like trying to learn two systems
at once.
The current levels of school dropouts, the need to repeat grades and the high failure rates in
the National Senior School Certificate examination taken in grade 12 (formerly standard 10)
at approximately 18 years of age, all indicate considerable underachievement among black
scholars (Viljoen, 1999).

69
The results of a study by Pretorius and Naude (2002) indicated that children are ill prepared
for formal education. They reveal inadequate literacy skill, poor sentence construction, poor
sense of syntax, and inadequate sound development and knowledge of the alphabet. The
cultural strengths of these disadvantaged black children include adequate gestalt formation,
enjoyment of and proficiency in visual art, responsiveness to the concrete, expressiveness of
gestures and body language, enjoyment of and the ability to learn via hand and symbolic
representations (Pretorius & Naude, 2002). Generally, this state of inadequacy is attributed
to the different education systems pre-1994.
Foxcroft and Aston (2006) reported on a study by Herbst and Huysamen (2000) which found
that environmentally disadvantaged children assessed in a language other than that spoken
at home performed at a significantly lower level than those who were assessed in their
mother tongue. Items involving verbal comprehension were found to be biased against test-
takers who spoke an African language at home, even though they had been exposed to
English on a daily basis.
These views are confirmed by Heugh (2001), who reported that recent international studies
show that South African pupils compared extremely unfavourably with pupils in other
countries in literacy and numeracy development.
The above discussion highlights the different views on what literacy is and the role of
language, particularly English usage and reading ability. The role of literacy in formal
schooling in the South African context seems to suggest that literacy should be defined
differently. It is therefore appropriate to consider the definition as well as the theories and
models of language testing, which provide the background to the development of language
skills for basic English.
3.2.2 Definition of literacy
Moss (1994) referred to a literature review on literacy conducted by Guerra (1992), who
found no fewer than 43 definitions of the concept. These ranged from defining literacy as the
simple encoding and decoding of graphic symbols (the ability to read and write) at a basic
level to the more complex acquisition of knowledge and skills, which allow one to use

70
language according to community norms. According to the latter definition, everyone is
literate as defined by their particular community.
Wagner (1991) asserted that because literacy is a cultural phenomenon adequately defined
and understood only within the culture in which it exists, it is not surprising that definitions of
literacy may never be permanently fixed. However, he provides the following definition:
literacy is a characteristic acquired by individuals in varying degrees from just above none to
an indeterminate upper level. Some individuals are more or less literate than others, but it is
not possible to speak of literate and illiterate persons as two distinct categories.
According to Hamon (2000), some commentators have argued that literacy enables societies
to reach a higher level of intellectual achievement. Hence being literate means having a
certain sort of awareness of language (e.g. that it consists of words and sounds).
Chew (1992) saw literacy as a competence in language arts, listening, speaking, reading
and writing, with language being central to all learning and indeed all creative art.
The following definition by Unesco (United Nations Educational, Scientific and Cultural
Organisation) is appealing in its simplicity and apparent neutrality: a person is literate who
can with understanding both read and write a short simple statement on his/her everyday life
(Gillette & Ryan, in Hutton, 1992). A more recent Unesco definition emphasises that literacy
needs to be defined in relation to its uses and purposes. "A person is literate when he has
acquired the essential knowledge and skills which enable him to engage in all those activities
in which literacy is required for effective functioning in his group and community and whose
attainments in reading, writing and arithmetic make it possible for him to continue to use
these skills towards his own and the community's development" (Hutton, 1992, p. 10).
Wagner (1991, p. 68) used Gray’s (1956) definition of functional literacy, namely, “a person
is functionally literate when he has acquired the knowledge and skills in reading and writing
which enable him to engage effectively in all activities in which literacy is normally assumed
in his culture or group”.
According to Harris and Hodges (1995), because of the breadth of the concepts involved in
literacy, several investigators prefer the use of the plural “literacies”.

71
One particular influential piece of research into the life of some US communities found
literacy being used for seven socially oriented purposes, by adults and children alike (Wray &
Medwell, 1993).
Purcell-Gates (2007) emphasised that literacy is always embedded in social institutions, and
as such, is only knowable as it is defined and practised by social and cultural groups. As
such, the author suggested that literacy is best considered an ideological construct as
opposed to an autonomous skill, separable from context of use. It is preferable, as
suggested by Street in Purcell-Gates (2007), to think of the plural, literacies, instead of the
singular, literacy.
The idea that literacy is somehow associated with a different more elaborate and effective
use of language indicates that to be literate is no longer only about being able to read and
write – it is about speaking and understanding the more elaborate forms of language that
literacy has allowed us to create (Holme, 2004). He further stated that literacy would then
suggest a capacity to talk and hence to think about complicated issues and abstract
problems.
According to Holme (2004), the concept of visual literacy as the ability to interpret diagrams
and pictures adds further confusion. If literacy is partly a visual sign system it is also bound
up with an even more complex use of signs, namely language. One effect is in language
standardisation. Developing a set way to use a language with an idea of what is correct and
what is not, is very much a product of literacy. In Holme’s (2004) view therefore, literacy is
inescapably a social phenomenon.
The ability to comprehend written text is only one of the components of literacy, and
increasingly more attention is being focused on the thinking skills that enable one to utilise
knowledge to make appropriate decisions.
Molosiwa (2007) reported on a study to investigate current language and literacy issues in
the African country of Botswana. Data for the study were collected through formal interviews.
When the participants in this study were asked what literacy meant to them, they indicated
that it means the ability to read with understanding and to apply the information being read to

72
the reader’s situation, not simply the technical aspects of decoding and encoding print.
Literacy was associated with making meaning out of written material. Because the
participants in the study were graduate students and teachers by profession, their
understanding of literacy had moved beyond merely decoding words from printed text.
Hutton (1992) stated that in South Africa, definitions of literacy are complicated by the fact
that knowledge of a second language, usually English, is as vital for survival and
development as the ability to read and write in an African language. The term "literacy" is
often loosely used to include basic competency in English. Officially, the term "English
literacy" is used in South Africa to mean the language and learning needs of those people
who have between one and five years of schooling. For the purpose of the current research,
a similar meaning will be used. It can be inferred that a person will be considered literate in
terms of English literacy provided he/she has a minimum of five years of schooling.
In the South African context, the implications of this definition may mean that any individual
without formal schooling is illiterate by virtue of English being essential in all modes of
communication in speaking and writing, but this does not necessarily mean that they are
illiterate.
3.2.3 Development of language skills for basic English
The development of language skills for basic English is discussed by considering current
theories and models of these concepts. Some of the basic skills are presented in the context
of the research.
3.2.3.1 Theories and models in language testing
The basic assumption of Lado’s theory of foreign language testing (Anderson, 1976) is that
language is a system of habits of communication. This implies that the basic patterns of
language as the forms of expression are overlearnt to the extent that they become
automatic. However, Lado’s theory offers no suggestions for measuring the comprehension
difficulty of reading materials in a foreign language. Lorge (cited in Anderson, 1976) pointed
out the weakness of a practice that involved constructing comprehension tests from
passages and adopting as an index of reading difficulty the mean score obtained by a

73
sample of subjects. The difficulty of a passage could be reflected in the difficulty of the
language used in framing test items, such that a difficult passage may appear easy because
the text questions are simply phrased, or it may appear difficult because the text questions
are couched in more complex language than the language of the passage. This could be a
major source of error variance.
According to Koch (in Foxcroft & Aston, 2006), psychologists often argue that it is justifiable
to administer the measure in English, irrespective of whether English is the first or second
language of the test-taker, because it is important that the test-takers can demonstrate their
ability to perform test tasks in a language that will be used in the workplace. However, Koch
was critical of this approach for two reasons: first, it assumes that the scores on the measure
are comparable across language groups; and second, it ignores the fact that language can
be a ”nuisance factor” that impacts on the test performance of English second language
speakers.
Language may be the most important mediator of test performance, especially when the
language in which the measure is administered is not the home language of the test-taker
(Foxcroft & Aston 2006). They reported that, according to Nell (1999), it has been found that
language is one of the primary influencers of intelligence test performance, and can have a
significant negative impact when a test is administered in the test-taker’s second or third
language. During the cadet selection process, because the tests that were used were all in
English and the administration was also conducted in English, this may have impacted on
the test performance of some of the applicants.
Readability or reading difficulty is defined in terms of the degree of comprehension with
which written material is read. Reading comprehension is defined as the correspondence
between the way the writer encodes the message and the way the reader decodes it
(Anderson, 1976).
According to Anderson (1976), Shannon and Weaver’s generalised communication model,
which is seen in Taylor’s definition of cloze procedure, is linear in that there is a beginning (a
source), a transmitter (channel) and a receiver (destination). This model was developed to
deal with signal transmissions relating to the telephone.

74
Anderson (1976) cites Klemmer (1962) and McCreary and Surbarsen (1965), who cautioned
that this model was never intended as a model for human communication. The limitation of
the model when applied to a human communication system is the separation of source and
destination and transmitter and receiver. In human communication, all these functions are
combined and performed by a human being.
As stated by Anderson (1976), the language communication model is useful for the following
reasons: (1) it permits treatment in operational terms of something that is essentially
abstract; (2) it permits well-established methods of analysis to be applied, provided that the
basic assumptions are not violated; (3) it provides a framework for establishing facts; and (4)
it provides hypotheses or explains phenomena.
The theories and models of language testing provide a framework of what language tests
should measure. The discussion below focuses on some of the tests described as language
tests.
3.2.3.2 Language testing
According to Downey, Suzuki and Van Moere (2010), the assessment of spoken language
skills is crucial in professions where communication breakdowns may have catastrophic
consequences. The authors further stated that international aviation professionals, including
pilots and air traffic control personnel, are routinely engaged in communication with fellow
professionals who may not share their native (or primary) language.
This view indicates the importance of language in aviation, particularly for pilots who utilise
different airspace all over the world and need to ensure that they maintain their core function
of safety, which is paramount in civil aviation.
Making effective decisions about the language skills of aviation professionals is thus a high-
stake endeavour and depends on valid assessment practices. According to Downey et al.
(2010), this suggests that measurement tools to assess language proficiency need to be
identified and used effectively to ensure that the measures obtained provide vital information
during the selection process.

75
A testing method originally used as a readability index has recently been looked at seriously
as a possible measure of second language proficiency. Taylor termed this method the “cloze
procedure”. According to Anderson (1976), Taylor defined the cloze procedure as a method
of intercepting a message from a transmitter, mutilating its language patterns by deleting
parts of the message and administering it to the receiver, who must attempt to make the
pattern whole again, potentially yielding a considerable number of complete sentences
(units). The cloze procedure is based on the Gestalt principle of closure, which states that
there is a tendency for individuals to close incomplete forms in order to constitute wholes.
The same principle is applied in numeracy.
Oller (1979) reported on a study conducted by Hinofotis (1976) on a cloze test in open-
ended form, which was administered to incoming foreign students at the Centre for English
as a Second Language (CESL) at Southern Illinois University. The Test of English as a
Foreign Language (TOEFL) and the placement examination used at the CESL were the
written criterion measures against which the cloze test was evaluated. The data indicated
that cloze testing might indeed be a viable alternative procedure for placement and
proficiency testing. This study supports previous research in language testing which
suggests that the cloze procedure is a useful evaluation tool.
The cloze total scores on the TOEFL and CESL placement tests were strongly correlated
regardless of the scoring method used to score the cloze test. Cloze correlated with the total
TOEFL at 0.71 and with the total score on CESL, at 0.79 and 0.84 respectively. The
correlations were significant beyond the 0.05 probability level, and indicated substantial
variance overlap among the tests.
The concern with cloze procedure is the frequency of word deletions and the scoring
procedures.
The common procedure involves credit being given only if the subject replaces a blank with
the exact word that was deleted. Allowing credit (full or partial) for synonyms was reported
by Taylor (1953), Ruddel (1964), Bermuth (1965), Blamenfeld and Miller (1966) and Miller
and Coleman (1967), all cited in Anderson (1976).
76
Experimental evidence of the relationship between these different scoring procedures is in
close agreement. For instance, Anderson (1976) reported that Rankin obtained correlations
of 0.86 and 0.92 between exact replacement and synonym scores on two different cloze
tests.
Studies of aspects of message in relation to readability have as a common purpose the
provision of a set of guidelines for making writing more comprehensible. The effect of short
sentences was investigated by Coleman (1962) and Gallant (1965), as reported by Anderson
(1976), and both studies found that shorter sentences increased comprehensibility.
Anderson (1976) reported on a study by Blumenfeld (1963) that the use of active instead of
passive verbs resulted in improvements in the number of words correctly replaced.
Anderson (1976), in further studies undertaken by Ruddel (1965), found that structured
redundancy with passage controlled difficulty enhanced comprehension.
Studies, which were also concerned with message presentation and comprehension, were
undertaken by Musgrave (1963), who tested the proposition that a short paragraph
preceding a cloze passage explaining the content of the passage, increased comprehension
(Anderson, 1976). The ultimate aim of the research into the message system is not only the
prediction of language difficulty but also its control (Anderson, 1976).
Studies were conducted by Taylor (1956, 1957), as reported by Oller (1979), to explore the
relationship between the cloze scores and general cognitive abilities, attitudes and other
personality variables. Significant and uniformly high correlations were reported at the tertiary
level between cloze scores to a measure of reading. Kohler (in Anderson, 1976) applied
factor analysis to a battery of cloze tests and selected cognitive variables. He concluded
that the abilities required for the successful completion of the cloze task in order of
importance were wide range vocabulary, logical reasoning, inference, addition (representing
a speed factor) and hidden patterns (a measure of flexibility of closure).
According to Van den Berg (1994), language proficiency is the most important single
moderator of test performance because it reflects familiarity with concepts and access to the
language medium through which knowledge has to be gained.

77
In a study with Junior Aptitude Tests (JAT) constructed by Owen (1991), Van Eeden and De
Beer (2005) stated that they found differences in mean test performance for white, coloured,
Indian and black students, despite the fact that the test measured the same psychological
constructs for the these groups. They suggested that factors such as language could have
been a source of bias, especially in the case of black students who were tested in English.
From the studies presented above, it may be concluded that performance in second
language tests will show different scores resulting in certain individuals being referred to as
having an “aptitude” for certain abilities.
Oller and Hinofotis (in Oller & Perkins, 1980) provided an explanation of individual
performance through two mutually exclusive hypotheses about second language ability.
The first hypothesis, referred to as the Divisible Competence Hypothesis, postulated that
language skill is separable into components relating to linguistically defined categories, for
example, phenology, syntax and lexicon, or to the traditionally recognised skills of listening,
speaking, reading and writing.
The second hypothesis, referred to as the Unitary Competence Hypothesis, is reminiscent of
Spearman’s general factor of intelligence and postulated that second language ability may
be a more unitary factor. In fact, once the common variance of a variety of language tasks is
explained, no meaningful unique variance attributable to separate components will remain.
The Divisible and Unitary Competency Models are mentioned here because they tie in with
the detailed discussion of intelligence and special abilities/aptitude in chapter 2.
According to Downey et al. (2010), numerous assessments have been developed for the
aviation context in response to the International Civil Aviation Organisation’s (ICAO’s)
initiative, many of which utilise interlocutors in oral proficiency interview (OPI) format.
However, the OPI format faces several challenges with regard to practicality, reliability and
standardisation for widespread (global) use (Downey et al. 2010).
In their research, Downey et al. (2010) reported on a survey which showed that at least 20
aviation English tests have been developed in response to ICAO’s English-proficiency

78
requirements. The authors stated that some of these tests were developed specifically for
testing aviation professionals domestically (e.g. Japan’s English Proficiency Test for Airline
Pilots or Thailand’s Thai DCA Aviation Test), while others were developed for an
international test-taker population (e.g. Eurocontrol’s English language proficiency for
Aeronautical Communication or RMIT’s English Language Test for Aviation). The authors
further explained that most of these tests consist of listening and speaking tasks, and the
speaking section typically employs a traditional oral interview, which is scored by human
raters.
It is interesting to note that, in their study, Downey et al. (2010) referred to the fact that the
test must be reliable, valid and practical as well as the need for standardised testing
conditions across locations. This is crucial for assessment to be fair to all candidates and
these are also vital components in evaluating the usefulness of any language test. In their
discussion on reliability in spoken language testing, they stated that reliability is usually
based on how consistently two different raters assess a candidate’s performance. This
indicates that in spoken language testing the inter-rater reliability approach is used.
Regarding standardisation, Downey et al. (2010) confirmed that fair and standardised testing
procedures are critical qualities of any high stake testing, including certification of aviation
professionals. The authors also noted that studies have reported inherent problems with the
interview formats, showing that interviewers modify their language from one candidate to
another when eliciting ratable spoken performance and that elicitation skills and interviewer
variability may result in totally different ratings for the same candidates. Downey et al. (2010)
therefore stated that evidence suggests that a computer-mediated speaking test – where all
candidates receive controlled prompts from a common item pool and are scored by the same
algorithms – can be fairer than face-to-face interviews in an appropriate context.
The Versant Aviation English Test (VAET) is designed to measure facility in spoken aviation
English and common English in the aviation domain. This construct represents the ability to
understand spoken English – both within the aviation radiotelephony phraseology and topics
related to aviation (such as movement, position, time, duration, weather and animals) – and
to respond appropriately in intelligible English at a fully functional pace (Downey et al.,
2010).

79
In the current study, a locally developed language test was utilised to measure the language
proficiency of the applicants, not necessarily for aviation communication, but to assess their
language skills to determine whether they had the potential to successfully complete the
cadet pilot training programme.
3.2.3.3 Language skills for basic English
The divisible and unitary competency models suggest that certain language skills are vital for
basic English literacy. These will be discussed next with particular reference to research on
learning a second language.
Bohlmann and Pretorius (2002) reported that the persistent problem of the poor academic
performance of many students at primary, secondary and tertiary level, particularly in
science and mathematics, is disturbing. The conceptual complexity and problem-solving
nature of these disciplines make extensive demands on the reasoning, interpretive and
strategic skills of students, especially when these skills are carried out in a language that is
not the student's primary language. They further stated that there are obviously many
factors, both extrinsic and intrinsic, to a learner that contribute to poor academic
performance. A number of studies, for instance, have been conducted on the role of
language in mathematics, and much is known about the ways in which poorly developed
language skills undermine students’ mathematical performance. But to what extent does
reading competence influence a student's ability to comprehend and do mathematics? As
early as 1987 it was pointed out by Dale and Cuevas (in Bohlmann & Pretorius, 2002) that
proficiency in the language in which mathematics is taught, especially reading proficiency,
was a prerequisite for mathematics achievement.
When students have difficulty reading in order to learn, it is often assumed that their
comprehension problem stems from limited language proficiency. This reflects an underlying
assumption that language proficiency and reading ability are basically the same thing, and if
this is indeed so, then improving the language proficiency of students should improve their
comprehension. Research by Hacquebord (in Bohlmann & Pretorius, 2002) showed that this
does not readily happen. Language and reading are clearly related, but they are
conceptually and cognitively uniquely specific skills that develop in distinct ways and rely on

80
specific cognitive operations. This view seems to emphasise the divisibility and unitary
competency model.
Learning a second language is a different task as it involves learning how to express familiar
meaning, either orally or in writing, using a whole new set of language forms or structure.
Fillmore et al. (1979) emphasise this view in their assertion that the cognitive problem facing
second language learners is both immense and complex. Their explanation is that, before
the structures of the new language can be learnt, the learner needs, firstly, to comprehend
them, and secondly, somehow to gain entry into the language and then to figure out how the
pieces of it fit together. Furthermore, he/she must somehow develop fluency in the language
and ferret out its structural details, so that his/her version of it matches the one spoken by
the people around him/her (Fillmore et al., 1979).
According to Pretorius and Naude, (2002), Ross and Roe (1990) postulated that children
from homes where reading and writing are priorities; develop literacy skills more readily than
children from homes where literacy is not valued. Informal reading activities should be
interactive, implying that parents should discuss the stories, ask questions about the books
and stories and respond to children’s comments. Pretorius and Naude (2002) reported that
Heald-Taylor (1987) concluded that these types of informal reading experiences develop
children's enthusiasm for reading and love of literature, thus providing an excellent
foundation for learning to read.
Pretorius and Naude (2002) further reported that Naude (1999) investigated the language
development and language enrichment of senior toddlers in an environmentally deprived
Griqua (South African) community, and concluded that language development and
enrichment are essentially a socially mediated process. They also concluded that the
inadequate linguistics example set by both the family and the community resulted in
inadequate language development and enrichment and the senior toddlers revealed their
impoverished, undifferentiated world of language in deficiencies pertaining to mastery of
language, style of language and code of language. The results indicated that the senior
toddlers' conceptualisation was deficient and that they were concrete bound, instead of
analytical and abstract, in their language usage.

81
It can be inferred from these studies that language skills for basic English literacy will be
influenced by both the community and the culture of the learner. In a multicultural society
such as that of South Africa, barriers will exist because English is not the first language for
all cultures.
Hutton (1992), when referring to the cognitive aspects of learning a second language, stated
that learners are unable to practise and develop their higher-level cognitive skills, such as
analysis, evaluation and synthesis, because they do not have the necessary language skills.
From the above it can be concluded that the basic skills for English literacy will be influenced
by a learner’s environment and community/culture. This leads to the question of what
constitutes the components of language, which is the focus of the next section.
3.2.4 Components of language
Thus far, the discussion in this chapter has indicated a link between the environmental and
biological factors that influence the learning of a second language, particularly cognitive
development. Hence the influence of literacy and numeracy during performance in
psychological tests will have to be assessed to determine variances, if any, in the scores
obtained. The focus now will be on components of language in relation to this research.
According to Harris and Hodges (1995), a problem in defining language is that language
itself must be the medium of its own description – hence a definition of language is
conditioned by the theoretical or subjective linguistic views of the definer.
Lieberman (1975) proposed an operational definition of language as a communications
system capable of transmitting new information, whereas, Bloom and Lahey (1978) stated
that the definition of language depends on the context in which one asks the question, “What
is language?” They further described language as a code whereby ideas about the world
are represented through a conventional system of arbitrary signals.
Holme (2004, p. 132) provided the following definition of a notable linguist, (Bloomfield,
1993): ”A system of symbols used in communication, language code; in a broad sense … A
system in terms of which something can be presented by one user and understood by

82
another … A system of communication”. This definition, according to Holme (2005), included
all forms of language, human and nonhuman, technical and common.
A sociolinguist Hymes (in Holme, 2004 p.99) described language as “socially constitute”.
This meant that language should be treated as part of the larger system of communication
that creates society and makes it what it is; therefore language is a form of social action
(Holme, 2004).
Painter (cited in Hasan & Martin, 1989, p.19) indicated that “taking language as a symbolic
system implies that, whether reading or speaking, listening or writing, the individual is
engaged in making meaning in some particular context”. It can thus be inferred that there
may be other factors that contribute to the understanding of what is said and how this
information is translated to make sense to the person receiving the message.
Bloom and Lahey (1978) identified three major components of language, namely context,
form and use. These components are discussed below.
3.2.4.1 Context of language
Language context is the broader more general categorisation of the topics that are encoded
in messages. Words or signs and the relationships between them represent information or
meaning in messages. There is a distinction between topics, the particular idea encoded in
a message, also, personal and contextual, and content, which is general, depersonalised
and independent of particular context.
3.2.4.2 Forms of language
The form of utterances can be described in terms of their acoustic phonetic shape, while the
form of signed communication can be described in terms of its configurational properties.
Broadly, form in language is the means for connecting sounds or signs with meaning, and
consists of an inventory of linguistic units and the system of rules for their combination. The
essence of language is the correlation between sound (syntax – morphemes) and meaning
or experience. Associated with these forms of expression are meanings shared by all

83
members of the same cultural community. The acquisition of the forms of expression used
and the association of meaning with these forms of expression are problems faced by
subjects learning the language.
3.2.4.3 Use of language
According to Clark (1996), language is used for doing things, and it embodies both individual
and social processes. This indicates that language use is really a form of joint action that is
carried out by an ensemble of people acting in coordination with one another. Clark (1996)
further stated that language is classified by scene and medium. The scene is where
language use takes place and the medium is whether the language use is spoken, gestured
or written or printed (or mixed).
Bloom and Lahey (1978) stated that there are two major aspects of the use of language.
First, it has to do with the goals or functions of language, and second, with the influence of
linguistic and nonlinguistic context that determines how individuals understand and choose
between alternative forms of language for achieving the same or different goals.
Language use consists of the socially and cognitively determined selection of behaviours
according to the goals of the speaker and the context of the situation. Language has two
interconnected merits: first, that it is social, and second, that it supplies public expressions
for “thoughts” which would otherwise remain private (De Vito, 1973).
Clark (1996) referred to personal settings or institutional settings or mediating or private
settings. Halliday (1973) conceived of the function of language in more social terms
involving interaction, regulation and personal control.
It is important to mention that cognitive ability plays a role in language usage, a view that is
shared by Lieberman (1975), who stated that cognitive ability is a necessary factor in human
language.
This section emphasises the social mores of the community as determinants of the
components of language, particularly as described by Bloom and Lahey (1978), and stresses
the fact that cognitive ability fulfils a major role in language.

84
Much has been said about the components of language – hence discussing the dimensions
of a language will provide the foundation on which to consider the functions of a language.
3.2.5 Basic dimensions of language
The discussion in the previous sections covered the skills and components of language. The
focus below is on the dimensions of language as related to literacy.
Lankshear et al. (cited in Green 1999, p.20) referred to emerging understandings of literacy
as an articulation of language and technology viewed historically so as to take cognisance of
"marks on natural surfaces, the alphabet and other symbols systems, stylus and pencil,
printing press and the digital electronic apparatus". Basically the framework is predicated on
an integrated, holistic (or critical-holistic) view of literacy as a situational social practice and
involves understanding literacy in terms of three interrelated aspects or dimensions: the
''operational", "cultural" and "critical". The framework, in essence, involves understanding
literacy in terms of these three interlocking dimensions or aspects (Green, 1999). They can
be understood as a set of intersecting circles, bringing together language, meaning and
context (Green 1999, pp.160–163; Lankshear et al., 1997, pp. 50–52), on the one hand, and
technology, practice and context, on the other (Green, 1999).
As explained by Green (1999), the operational refers to turning "it" on, and knowing what to
do to make "it" work; the “cultural” involves using "it" to do something meaningful and
effective in particular situations and circumstances (e.g. a geography lesson, the workplace,
etc.); while the “critical” entails recognising and acknowledging that all social practices and
their meaning systems are partial and selective and shaped by power relations.
The key point is to stress the interdependence between and intricacy of these dimensions. A
critical-holistic integrated view of literacy in practice and in pedagogy addresses all three
simultaneously – none has any necessary priority, in practice, over any other or either of the
others (Green, 1999).
Importantly, however, a first-order relationship exists between the “operational” and “cultural”
dimensions of literacy learning conceived in this manner. This is in accordance with, and by

85
analogy with Halliday (1973), to the insight that learning language is learning culture, and
vice versa.
This view is aligned to that expressed by Pretorius and Naude (2002), namely that the
school syllabus, which emanates from a centralised, urban, Westernised paradigm, bears
little or no relationship to these children's lives. In the South African context, the lack of
parental involvement is exacerbated because many parents work for long periods away from
the family home. Children are often cared for by grandparents or other relatives who have
received little, if any, formal education. Children therefore tend to have difficulty when they
reach school-going age in learning a foreign language such as English. This may mean that
the teachers have to spend more time teaching English, which, in most instances, is a base
for other subjects, including numeracy.
Green (1999) reported on a study that clearly revealed that the emphasis fell heavily on the
operational dimension of literacy and computing in the schools included in the study as well
as in the system’s literature and associated policies. Little explicit attention was paid to the
cultural dimension, and even less to the critical dimension.
3.2.5.1 Basic functions of language
The previous section indicated that three dimensions of language are needed to consider the
functions of language in relation to the links of the dimensions discussed above.
There are two basic functions of language, which are termed the experiential and the
interpersonal meta-functions. Painter (in Hasan & Martin, 1989) stated that in order to fulfil
these two basic functions, language needs a further set of resources by means of which any
part of an ongoing text is linked to the rest of the text as well as to the context – this is the
textual meta-function.
Obviously, the functions of language, which manifest in the language system, occur in the
grammatical structure. The grammatical structure may in fact be regarded as the means
whereby the various components of meaning, deriving from the different functions of
language, are integrated (Halliday, 1976).

86
Halliday (1973), in line with the understanding of the functional approach as adopted in the
current, identified four models of functions of language in the context of the ideational,
interpersonal and textual components of language, as depicted in figure 3.1 below. These
models are described as follows:
the instrumental model, which refers to use as a means of getting things done
the regulatory model, which refers to the use of language to regulate the behaviour of
others
the interactional model, which refers to the use of language in the interaction between
the self and others
the personal model or the individual’s awareness of the language as a form of his/her
individuality
The functional approach, as outlined in these four models, provides the basic functions of
language in a particular context and does not explicitly indicate the impact language has
during tasks such as those experienced in psychological testing. However, this research,
which is based on the interrelationship between language, numeracy and intelligence, does
not provide an acceptable model of the impact these variables will have on the psychological
tests used to predict success in a training programme.

87
Figure 3.1. The three bases of the environment as seen from the perspective of language. Source: Adapted from Halliday & Matthiessen (1999, p. 13) According to Lieberman (1975), human language achieves a high rate of speed and
overcomes the limits of memory span by the process of encoding, which occurs two levels –
in the production of speech and in the transformational syntax of human language. Chimsy
(in Lieberman, 1975) referred to transformational syntax as the “device” that restructures the
deep underlying level of language that is subjected to semantive analysis in the actual
sentence a person writes or speaks.
Language has two primary purposes, expression and communication, where communication
is the transmission of information from one person to another. Hence the focus in this regard
is on understanding or comprehension and usage, which denote meaning around one’s own
knowledge or experience (Lieberman, 1975).
It is necessary to assume that an overlap will occur between the functions of language
because of the interrelationship between the various functions of language. In focusing on
recruitment and selection using psychological tests, a wealth of information is normally
Second-order Reality (realm of meaning)
First-order reality
Ideational
Textual
Interpersonal

88
transmitted either during the briefing of testees or during the testing itself (i.e. when the
testees respond to the test items).
It is relevant to consider the role of comprehension as it relates to this research, particularly
as a means of measurement for literacy and/or numeracy.
a Comprehension
In this section, the concept of reading, which implies comprehension, will be discussed,
followed by a review of the nature of reading, writing and vocabulary.
Word recognition Comprehension Context analysis Word meaning Phonetic analysis Explicit meaning Structural analysis Implicit meaning Sight words Aesthetic appreciative meaning Dictionary skills Study skills Figure 3.2. Components of reading Source: Adapted from Cramer (1978, p. 207) Cramer (1978) stated that it is essential that any comprehension scheme accommodates the
traditional description labels of reading comprehension skills since all texts, tests and
material use them to identify reading comprehension skills.
Components of reading

89
Cramer (1978) distinguished between four components of comprehension (see figure 3.2
above). These components are briefly discussed below:
i Comprehension of explicit meaning
This is defined as the ability to understand, at a literal level, information clearly stated in the
text. This may include locating information, following explicit directions, identifying supporting
detail, recognising stated sequences, finding explicit proof and answering factual questions.
Explicit comprehension is also referred to as obtaining or knowing the facts and may be
likened to the thinking component. Guilford (cited in Cramer, 1978) refers to this as cognitive
memory, which is the understanding and retention of information in any form as a result of all
types of experiences.
ii Comprehension of implicit meaning
Comprehension of implicit meaning may be defined as the ability to gain meaning, through
reasoning, at levels beyond explicit meaning. The processes involved are all those reading
abilities that demand thinking, productive, intellectual responses to what is being read.
Guilford (cited in Cramer, 1978) identified the following three thinking skills similar to
the comprehension of implicit meaning:
(1) convergent thinking – problem solving in situations where sufficient information is
given so that reasoning is likely to lead to a specific answer or outcome
(2) divergent thinking – problem solving when several answers are possible,
stimulated in situations where a limited amount of information is available
(3) evaluative thinking – problem solving in relation to a value judgement, stimulated
in situations where the decision is whether the available information supports a
carefully defined concept; it focuses on questions of suitability, desirability and
worthiness of ideas and information
These thinking skills require mental operations and processes.

90
iii Comprehension of word meaning
This concept is defined as the ability to understand both the connotative and denotative
meaning of words and phrases. The process includes knowledge of the denotative and
connotative meanings of words, translation of figures of speech, idioms, slang, word origin
and other circumstances relating to word meaning. Depth and breadth of word meaning
depend largely on the quality of an individual’s experience.
iv Comprehension of aesthetic appreciative meaning
This component refers to the ability to derive personal enjoyment and meaning from
materials and to understand and appreciate the literacy devices associated with
interpretation of mode, tone, beauty, humour and other affective elements associated with
the written word. It requires the use of inference and thinking and the emphasis is on the
affective rather than the cognitive side of intellect.
The above discussion of comprehension highlights the fact that the background, experience
and environment of an individual are all relevant in the development of his/her language
skills.
Table 3.1 highlights the relationship between the four components of comprehension and the
commonly used names for reading skills.

91
Table 3.1 The four basic components of comprehension
EXPLICIT (literal)
IMPLICIT (reasoning)
WORD MEANING (vocabulary)
APPRECIATIVE (affective)
Main idea (stated) Inference Denotation Mode
Factual questions Prediction Connotation Tone
Sequence (stated) Prediction Contextual meaning Characterisation
Restating information
Interpretation Synonyms Beauty
Funding proof Evaluation Antonyms Humour
Recognising details Comparison Root words Values (personal)
Recalling details Drawing conclusions Prefixes Feeling
Locating information Critical reading Metaphor Opinion
Source: Adapted from Cramer (1978, p. 206) b Reading According to Underwood and Underwood (in Cashdan, 1986), models of those cognitive
processes involved in reading and spelling emphasise the available sources of information
and the related transformational processes necessary to convert a visual symbol into a
spoken utterance or an understanding of an idea. In the course of understanding print, the
reader may be said to process or transform the information from a visual to a semantive
code. For instance, when reading aloud, visual analysis will be followed by transformation
into a sound-based code.
The recognition of a word during reading is the process whereby a purely visual stimulus is
understood as the symbol for a specific meaning. Cashdan (1986) identified two component
subskills, both involving the relationship between print and meaning, as being significant in
reading and spelling. These sub skills are as follows: the analysis of visual patterns and the
conversion of the written form of a word into a phonological form. These two processes are

92
implemented in reading as word recognition via a purely graphic route or a phonological
route and they are also implemented as spelling because of reliance on a visual and on a
phonetic pattern.
Contextual analysis refers to the context provided by the sentence, which implies that the
word itself provides visual data and the sentence provides contextual data which are of use
to the individual who is familiar with the syntax of the particular language in use.
c Writing
According to Cramer (1978), historically, oral language comes first. Since written language is
based on an oral language tradition, one would expect this relationship to influence the
attainment of literacy.
Underwood and Underwood (in Cashdan, 1986) described the skill of writing as comprising
components which include an ability to hold a pen or pencil, an ability to form letters of the
alphabet and to join them into recognisable words and sentences, and so on.
In terms of skills, producing a coherent, fluent, extended piece of writing is probably the most
difficult thing there is to do in language. To second language learners, the challenges are
enormous, particularly for those who go on to a university and study in a language that is not
their own (Nunan, 1999).
The concern from a South African perspective is the issue of communities who were
educated under various education systems, particularly Bantu education, where they were
taught to read and write in their mother tongue, but had to apply second language skills
when seeking employment and during their training in the business environment.
d Vocabulary
As part of the language system, vocabulary is intimately interrelated with grammar, and it is
therefore more than a test of target language words. Nunan (1999) stated that the
“grammaticality” of vocabulary also manifests itself in word morphology - that is, the
grammatical particles that we attach to the beginning and ends of words in order to form a

93
new word. Proponents of audiolingualism have argued that foreign language learning would
be most effective if learners concentrated their efforts on mastering the basic sentence
patterns of the language. Once these patterns have been memorised, new vocabulary can
be “slotted in” (Nunan, 1999).
Nunan (1999) further stated that proponents of a comprehension-based approach to
language acquisition argue that early development of an extensive vocabulary can enable
learners to “outperform their competence”. This means that, if one has an extensive
vocabulary, it is possible to obtain meaning from spoken and written texts, even though one
does not know the grammatical structure in which the text is encoded.
According to Larsen-Freedman (in Nunan, 1999), descriptioned grammar is an integration of
syntax (form), semantics (meaning) and pragmatics (use) which enables individuals to
communicate through language. This idea was emphasised by Bloom and Lahey (1978),
who proposed that the ability to integrate the above three major components determines a
person’s knowledge of the language.
The models, components and dimensions relating to language do not provide a holistic
approach to the understanding of language, although the above discussion indicates that
literacy is broadly inclusive of language.
Learning to read involves learning to recognise the alphabet and utilising the various letters,
firstly in monosyllablic, later polysyllabic, words before graduating to reading phrases and/or
sentences. It is pertinent to mention that both spoken and written texts contain many of the
same vocabulary items and therefore draw on the same underlying linguistic systems of
English.
Discussion of the notion that language has two functions, namely experiential and
interpersonal meta-functions, infers that text provided in a certain context and grammatical
structure will give meaning. The description of the three thinking skills as identified by
Guilford, are utilised by candidates participating in psychological tests which require reading,
writing and comprehension skills (Cramer, 1978). Hence the role of literacy, particularly in
the English language, cannot be underestimated when assessing performance in
psychological tests.

94
The first part of this chapter provided the framework of the concept of literacy. The second
part will provide the framework for the numeracy concept, thus completing the
operationalisation of these concepts as they relate to this research.
3.3 NUMERACY
The concept of numeracy is defined below to explain its application in the context of this
research. The basic components of numeracy are also discussed in terms of the
development of numeracy skills and the basic dimensions thereof.
3.3.1 Definition of numeracy
Curwin, Slater and Hart (1994) described numeracy as far more than the ability to add two
numbers together and obtain the correct answer. They defined it as knowing when to use
numbers and being confident that these numbers have meaning.
Curwin et al. (1994) further stated that numeracy involves having the following
competencies:
knowing when to use numbers and when to ignore them
knowing that the numbers used are meaningful and likely to be correct
being able to select appropriate methods to make numbers more meaningful
being able to use the results produced by others
being able to interpret results and communicate this interpretation to others
Table 3.2 highlights the major differences between arithmetic and numeracy, as identified by
Penney (in Hutton, 1992).

95
Table 3.2
Differences between arithmetic and numeracy
Arithmetic
Numeracy
Context Contrived and unlikely to occur in real life
Real problems drawn from learners' daily lives
Data Problems contain only data needed for their solution. Learners never develop the skill of selecting what is relevant
Learner extrapolates the data necessary to answer his/her needs from the mass of data that is encountered in everyday life
Techniques Mechanical Requires judgement to draw inferences at an appropriate point from the available data
Level of complexity in the operation of techniques
Operative skills Skills involved in calculation, approximation, estimation, the use of calculators and other suitable aids
Castle (in Hutton, 1992) postulated that it would appear that numeracy is more than
arithmetic, but arithmetic might be part of what constitutes numeracy. According to Glen (in
Hutton, 1992), numeracy is an integrated set of mental skills plus understanding.
Hutton (1992) stated that the Crowther Report of the Central Advisory Council for Education
(in the UK) defined numeracy in 1959 as the minimum knowledge of mathematics and
science subjects which any person should possess in order to be considered educated.
According to Castle (in Hutton, 1992), this definition implies that a sophisticated level of
mathematics and scientific understanding is required for numeracy, and that the precise level
of "minimum knowledge" is determined by the numerate or educated members of society.
The definition also implies that numeracy provides access to superior culture and
information.
Similar to literacy, it would appear that there is no single definition of numeracy. Based on
this research, the approach would be an integration of the definitions provided above.
However, the view that there is a difference between arithmetic proficiency and numeracy
will not be considered further in the current research because the above definitions do not

96
distinguish between the two concepts. For the purpose of this research, numeracy will
therefore be used as an encompassing concept.
The concept of numeracy is discussed separately from literacy to ensure that it is understood
in the context of this research. As with language, it would be appropriate to consider the
development of skills for numeracy.
3.3.2 Development of skills for basic numeracy
The literature contains many theories, models or approaches regarding what constitutes
basic skills for numeracy. The difficulty is for a researcher to identify the most relevant and
appropriate theory, model or approach for his/her particular study. Hence these theories,
models or approaches will be explained as they relate to the current research, which will
provide the foundation for exploring how the skills for basic numeracy are developed and the
dimensions of this concept.
3.3.2.1 Theories, models and skills for basic numeracy
According to Piaget (in Papalia & Olds, 1995), human beings enter the stage of concrete
operations when they can think logically about the here and now. Logical operations include
arithmetic, class and set relationships, measurement and conception of hierarchical
structures. Operations may thus be described as an advanced cognitive ability based upon
certain concepts such as, mass, weight, number, length, area volume and the ability to deal
with alterations (Papalia & Olds, 1995).
Other researchers, including Vergnaud (1997), explained certain points that were not clear in
Piaget’s theory. First, other researchers in the psychology of mathematics education
complained that Piaget did not pay enough attention to the social aspects of the teaching-
learning process. Second, the issue of the relationship between the knowing process and the
psychic and social characteristics of the situations those students are faced with is relevant.
This relates to the relationship between the problems to be solved and specific
competencies and conceptions. Last but not least, the fact that mathematical knowledge
emanates from abstracting the properties and relationships of operations and not of objects

97
may be misleading. Vergnaud’s (1997) view is that mathematics is a way to conceptualise
the real world, at least during the early stages of mathematics education.
According to Van der Zanden (1993), human beings can avoid tedious, costly, trial-and-error
experimentation by initiating the behaviour of socially competent models. This process is
referred to as observational learning, social learning and modelling (cognitive learning).
In developing conceptual thinking, a key shift may be made from learning a concept in a
concrete familiar context to understanding the concept when it is removed from that
particular concrete context and as a convention that operates across many contexts.
Mathematics (this word is used interchangeably with “numeracy”) is essentially about
disembedding and being able to see the general in the specific (Lukin & Ross, 1997). This
view is shown diagrammatically in figure 3.3 below in the model that integrates numeracy
and language when introducing numeracy as a concept that has a social purpose while
building understanding by moving from the specific to the general.
While a certain amount of learning, progress can be made with “concrete” and “street”
mathematics, the power of mathematics only really becomes available when the
generalisation becomes available (Lukin & Ross, 1997). It can thus be inferred that the
ability to generalise is highlighted as a vital skill to develop.
The basic skills of developing numeracy, as identified by Southwood, Spannerberg and
Stoker (1997), are as follows:
a Comparing, matching, sorting and classifying
These are fundamental skills based on identifying similarities and differences. Classification
is an example of detecting and expressing generality in objects, numbers, pictures and
symbols.

98
b Counting
Counting skills and understanding numbers are important in the acquisition of number facts
and in calculations. However, it is pertinent to mention that it is not enough only to know the
numbers - one also to have the ability to use them.
c Calculating
It is fundamental to be encouraged to develop and use individual methods in calculations.
This may involve the decision making in “what needs to be calculated and how best to
calculate it”.
d Estimating
Skillful estimation involves making a reasonable and accurate guess based on facts and
prior knowledge as opposed to random guessing. The ability to estimate will provide a better
appreciation of the answer to be given and may make easy detection when going wrong.
e Identifying patterns
The ability to recognise patterns helps one to master basic facts and solve problems. For
instance, numbers in bracket are calculated first.
The view that literacy and numeracy should not be separated was supported by (Halliday,
1973) who noted that numeracy is being integrated into literacy programmes because
mathematics and language are seen as interrelated social systems of meaning. Figure 3.3
below depicts the interrelationship between numeracy and literacy/language in a social
context.

99
Figure 3.3 Numeracy in a social context Source: Adapted from Lukin & Ross (1997, p. 27)
As stated by Lukin and Ross (1997), there is recognition that the development of numeracy
skills cannot be separated from the development of language and literacy skills.
According to Zevenbergen (2001), for too long, school mathematics was seen to be a
discipline different or even divorced from language. After all, there is a widely held
perception that students who do not have a strong background in English can still do
mathematics, which lends support to the notion that the two disciplines are discrete to a
significant extent. This has given rise to increasing use of word problems and highly
contextualised tasks which, to a greater or lesser extent, make links between the two worlds.
These highly contextualised tasks result in higher levels of language being used and thus
greater links between literacy and mathematics (Zevenbergen, 2001).
The social theory of numeracy views it as a meaning-making system that operates in social
context (Lukin & Roos, 1997). This view emphasises context, purpose and meaning, which
were discussed in detail under literacy above.
According to Piaget (in Hughes, 1986), in acquiring the notion of number and other
mathematical concepts, learners develop independently and spontaneously. This is done in
Tasks
Numeracy concepts &
language
Spoken & written
text

100
order to help structure and interpret their experiences, and in an effort to develop the ability
to communicate mathematically; they work cooperatively towards solving problems and so
move on to the use of correct mathematical terminology and symbols (Freedman, 2000).
Numerous writers have explained the development of basic numeracy skills, and the views
expressed seem to suggest that numeracy and language/literacy are linked and should not
be separated. In other words, the basic skills for language and numeracy are similar in that
they focus on context, purpose and meaning, which fosters the ability to communicate and
solve problems using numbers.
In order to provide context, purpose and meaning in terms of numeracy, it is necessary to
consider the basic dimensions of numeracy, which will be the focus of the next section.
3.3.3 Basic dimensions of numeracy
The focus on the basic dimensions is critical to understanding the context of the current
research. It is necessary to consider the various views on describing numeracy and
explaining the basic functions of numeracy, and these will be discussed below.
The term “addition” as used by Piaget (in Hughes, 1986) is an operation in numbers as well
as in classes, quantities and characters.
Copeland (1979) described the concept of numeracy in terms of addition and subtraction,
multiplication and division, fractions and proportions, time, chance and probability and
measurements in one, two or three dimensions.
According to Curwin et al. (1994), the dimensions of numeracy refer to addition, subtraction,
multiplication and division as basic arithmetic.
These views of the term “numeracy” seem to have a common denominator in that numeracy
encompasses addition, subtraction, multiplication and division. With this understanding, it is
now possible to consider the basic functions of numeracy.

101
3.3.3.1 Basic functions of numeracy
The ability to calculate is a fundamental mathematical skill that enables people to
communicate about human activities such as counting, comparing, measuring and
designing. It can therefore be argued that the function of numeracy is to communicate
meaning by using numbers. The discussion that follows will focus on how this meaning is
communicated.
a Addition and subtraction
Addition of numbers does not mean to increase but to group, join or rename a pair of
numbers as a simple number. Subtraction entails combining two line sections, but the minus
sign means a movement backwards for one part – in other words, subtraction is a separating
action.
Piaget (in Copeland, 1979) described addition as a reversible operation. The operation of
addition comes into being when, on the one hand, the addenda are united in a whole and on
the other, this whole is regarded as invariant, irrespective of the distribution of its parts.
The commutative property of addition means that when joining sets of objects,
using an inductive procedure, the order of adding whole numbers does not
change the sum (i.e. the associative property of addition). This means that adding
any whole numbers in whatever order does not change the sum.
b Multiplication and division
Multiplication may be regarded as quick addition, while division is really the opposite of
multiplication. According to Copeland (1979), Piaget defines multiplication of numbers as an
equidistribution. Because of their inverse relationship, multiplication and division must both
be understood, if either is to be understood.
According to Curwin et al. (1994), the rule known as the “order of operation rule”, must be
followed when using the components discussed thus far, and it is summarised as follows:

102
B – bracket
E – exponentiation (power)
D – divide
M – multiply
A – add
S – subtract
This means that one should first work out the numbers in the brackets. Exponentiation
occurs when multiplying a number by itself. Division/multiplication follow, and finally, addition
and subtraction.
c Fractions
Fractions involve understanding what one number being written over another represents. It
should be realised that the necessary characteristics of fractions, are that each part must be
the same size or equal and an integral part of the whole, which can be separated or
reassembled to form the same whole.
According to Piaget (in Copeland, 1979), seven characteristics of fractions must be complied
with prior to an operational understanding of fractions:
There cannot be thought of a fraction unless there is a divisible whole.
A fraction implies a determinate number of parts.
The subdivision is exhaustive (i.e. there is no remainder).
There is a fixed relationship between the number of parts into which the whole is
divided and the number of intersections (i.e. one cut produces two parts).
The concept of an arithmetical fraction implies that all parts are equal
When the concept of subdivision is operational, fractions have a dual character. In
other words, they are part of the original whole and they are also wholes in their own
right which may be further subdivided.
The whole remains invariant. In the principle of conservation, fractions make up the
original whole.

103
d Ratio and proportion
Ratio involves the comparison of two quantities that relate to each other. Proportion refers to
two ratios that are equivalent. The ratio concept may be applied to measurements of
volume, mass, length and calculation of area, whereas the concept of proportion is used in
the solution of problems of speed and time.
e Rate
In general, the rate is the amount by which a quantity changes when another quantity
increases by one unit.
f Measurement
The main types of measurement appropriate to the current research, in terms of operational
principles, are briefly discussed below in order to achieve the required performance.
Measurement in two or three dimensions refers to the ideas of vertical and horizontal
coordinates. Two-dimensional space involves a region or area. To locate a point in two-
dimensional space without an instrument to measure angles requires a coordinate reference
system such as horizontal and vertical axes or rectangular coordinates. This field of
measurement requires an understanding of the concept of conservation, which involves two
linear measures. The calculation area is based upon the principle of subtraction and
addition plus multiplication.
The application of two- or three-dimensional measurement is used in the construction of
diagrams in order to create a visual impact to convey details.
With a better understanding of the basic functions of numeracy, as noted in chapter 2, in
terms of the cadet pilot training programme and assessment using psychological tests, plus
the criteria to be considered for the training programme, an applicant needs to be competent
in the understanding and use of numbers. Failure to meet this minimum requirement may
have an impact on the successful completion of the cadet training programme.

104
3.4 INTEGRATION OF LANGUAGE, LITERACY AND NUMERACY
Since many texts have numeracy embedded in them, it is vital to approach texts as a whole
unit of meaning and to deal with the language, literacy and numeracy skills required to
engage successfully with them.
According to Lukin and Ross (in Halliday 1985), language has evolved to satisfy human
needs and the way in which it is organised is functional with respect to these needs. It is not
arbitrary.
Figure 3.4. Model integrating the development of numeracy concepts, skills and language
Source: Adapted from Lukin & Ross (1997, p. 47)
Extend application to further context
Develop an understanding of the interrelationship
between numeracy areas
Introduce activities that encourage learners to
Independently select and use numeracy skills
Become critical analysts
Relate to test and task
Scaffold understanding by
Moving from: specific general patterns
concrete abstract
familiar less familiar
Developing an understanding of numeracy as a tool
Developing spoken, written and symbolic language
Introduce the numeracy concept by establishing that it has a
social purpose

105
Numeracy requires systematic planning if it is to be effectively integrated into a language and
literacy programme. Hence relating numeracy concepts to text may facilitate the
understanding of mathematical concepts for social purposes. Figure 3.4 above depicts the
integration of the development of numeracy concepts, skills and language in relation to text.
In order for people to engage in issues, they often need numeracy skills to interpret
information and make considered judgements. Rogers (1975) distinguished language
competence as communicative and grammatical competence.
Grammatical competence is semantically based transformational grammar. Communicative
competence is the human abilities specific to language, based on the assumption that
linguistic capacity may theoretically be separated from cognitive capacities.
It is therefore essential for people to provide a balance of experience, which is systematic
and logical, with the application of different approaches thus helping to generate new and
more sophisticated ways of tackling word problems.
Michael (in Hutton, 1992) suggested that the languages spoken in African cultures may
retard the accessibility of mathematics concepts. In addition, the transition from the mother
tongue to English as a medium of instruction in black schools complicates concept learning.
This view seems to indicate that people whose mother tongue is not English will take longer
to understand mathematical concepts and this may contribute to their slow progress in
understanding and applying the concepts to numeracy.
Mathematical language may enable people to communicate about human activities such as
counting, comparing, measuring and designing, which will promote the development of
spoken, written and symbolic mathematical language by progressing from a basic
vocabulary requirement to language which is more formal and specialised.
Thus Grabe (in Ferdman, Weber, & Ramirez, 1994), stated that second language acquisition
cannot be envisaged as separate, independent language modalities, but instead, should be
conceived of as interdependent language skills, cognitive processes and a means of
learning. This is inclusive of numeracy.

106
According to Holme (2004, p. 13),”we need literacy to work and to make informed judgments
that participating in a democratic society requires. This understanding of social importance of
literacy was not new either, even though its incorporation into a concept of functionality was”.
In Holme’s (2004) view, functional literacy recognises that people will master the skills of
literacy to different degrees. Functional illiteracy occurs when the ability to read and write is
not sufficient for an individual to engage in society, work effectively and pursue his/her
lifestyle choices. Holme (2004) also stated that functional literacy seems to have the
advantage of assessing reading and writing skills according to a community’s socioeconomic
needs.
These views raise concern in terms of the current research in that the applicants were drawn
from diverse cultures and communities and/or societies. However, with the higher
requirements in terms of academic qualifications and specific subjects indicated earlier,
basic literacy and numeracy could be expected of this sample group. The following core
assumptions, according to Holme (2004), on which functional literacy is based, apply here:
Literacy has an economic impact.
Literacy can be measured according to what it allows us to do.
A literacy shaped by the socioeconomic opportunities it affords one is a necessary
and sufficient educational goal.
Functionality may be a useful concept for assessing the literacy of the workforce in relation
to the tasks they have to perform (Holme, 2004). This suggests that one needs to have some
understanding of the functions of the pilot, as in the case of the current research, to make
meaningful inferences from measures obtained from the assessment instrument results.
Hence measuring the literacy levels of the applicants as part of the selection process, as
was done for this research, will enhance decision making in terms of which candidates are
more likely to be successful in the cadet pilot training programme.
It can be argued based on the above literature review that the current views on thinking
(cognition), language ability and numeracy are not perceived as discrete constructs.
However, language and arithmetic abilities appear to be central to the individual’s ability to
grasp and represent reality and to solve problems in a systematic manner. Therefore, it can

107
be expected that skills in these domains would be required to perform in a wide range of
higher order areas, including successful completion of the cadet pilot training programme.
3.4 CHAPTER SUMMARY
In this chapter the concepts of literacy and numeracy were discussed and defined and linked
at the meta-level. However, they were independently described here because they consist of
various dimensions. This satisfied the second aim of the literature survey, namely to define
literacy and numeracy and identify the basic dimensions of language and numeracy as well
as the development of basic skills for English literacy and numeracy. The theories and
model underpinning second language testing, using cloze procedures, as well the
interrelationship between literacy and numeracy, were highlighted.
Various concepts were explained and defined, namely intelligence and aptitude, literacy and
numeracy, with reference to appropriate theories. From an operational perspective, literacy
was reviewed, particularly English as a second language, in order to understand the impact
on performance in psychological tests and the cadet pilot training programme.
The concepts of intelligence, literacy and numeracy were integrated in an effort to indicate
alignment of the theories, thus forming a conceptual and theoretical basis for empirically
testing the correlation between these constructs and performance in the cadet training
programme to be discussed in chapter 4.

108
CHAPTER 4
THE EMPIRICAL STUDY
4.1 INTRODUCTION
This chapter provides a detailed discussion of the research design and method used for the
empirical study. The discussion will cover the steps that were followed in the sampling,
measurement of the variables and the statistical techniques employed to analyse the data.
4.2 DESCRIPTION OF THE POPULATION AND SAMPLE The population on which the empirical study was based represents the applicants for a
commercial airline’s cadet training programme nationally, who had a confirmed level of
education of Matric (grade 12) or higher. The rationale for the cut-off in educational level was
that these applicants are expected and required to have the basic English literacy and
numeracy levels, which will enable them to read manuals and policies and understand
instructions during the training courses.
The cadet pilot selection was conducted in several stages. The applicants who met the formal
criteria in terms of age, and who had at least 12 years of education in English, Mathematics
and Science as subjects, were admitted to the first step of the selection process. They were
given several paper-and-pencil tests measuring cognitive abilities, mathematical and language
skills. A similar selection process was followed by the Norwegian Air Force, where only
candidates who met the formal criteria were admitted to the first step of the selection process
(Martinussen & Torjussen, 1998).
The initial population (n = 2 253) comprised all applicants meeting the minimum requirement
for the training programme, that is, Matric or equivalent, with English, Mathematics and
Science as subjects. It is pertinent to mention at this stage that the sample comprised all
candidates who had been selected for the pilot training in three intakes: January 2001, July
2001 and January 2002. Since the inception of the cadet training programme by the
commercial airline, no validity studies have been conducted on psychological assessment
instruments, and it was therefore deemed useful to commence with data from the initial intakes
to evaluate the relevance and appropriateness of the instruments used at that time. This view
on the use of tests for the selection of aircraft pilots was supported by Damos (1996), who
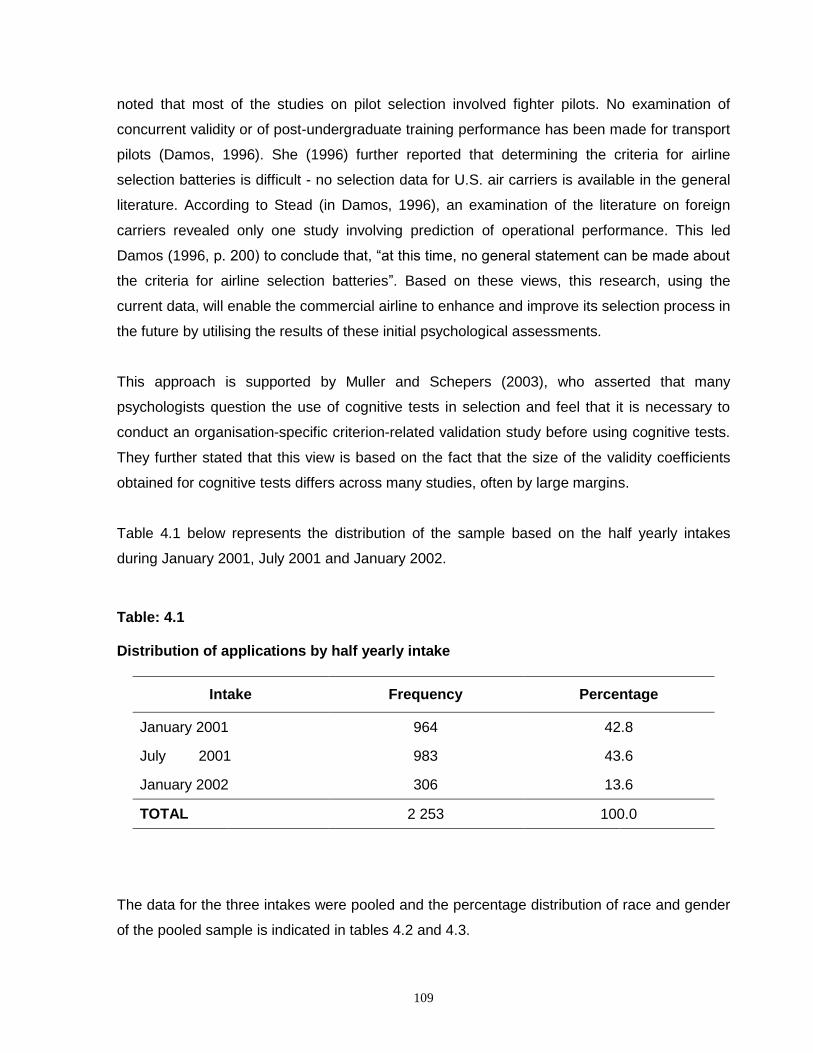
109
noted that most of the studies on pilot selection involved fighter pilots. No examination of
concurrent validity or of post-undergraduate training performance has been made for transport
pilots (Damos, 1996). She (1996) further reported that determining the criteria for airline
selection batteries is difficult - no selection data for U.S. air carriers is available in the general
literature. According to Stead (in Damos, 1996), an examination of the literature on foreign
carriers revealed only one study involving prediction of operational performance. This led
Damos (1996, p. 200) to conclude that, “at this time, no general statement can be made about
the criteria for airline selection batteries”. Based on these views, this research, using the
current data, will enable the commercial airline to enhance and improve its selection process in
the future by utilising the results of these initial psychological assessments.
This approach is supported by Muller and Schepers (2003), who asserted that many
psychologists question the use of cognitive tests in selection and feel that it is necessary to
conduct an organisation-specific criterion-related validation study before using cognitive tests.
They further stated that this view is based on the fact that the size of the validity coefficients
obtained for cognitive tests differs across many studies, often by large margins.
Table 4.1 below represents the distribution of the sample based on the half yearly intakes
during January 2001, July 2001 and January 2002.
Table: 4.1 Distribution of applications by half yearly intake
Intake Frequency Percentage
January 2001 964 42.8
July 2001 983 43.6
January 2002 306 13.6
TOTAL 2 253 100.0
The data for the three intakes were pooled and the percentage distribution of race and gender
of the pooled sample is indicated in tables 4.2 and 4.3.
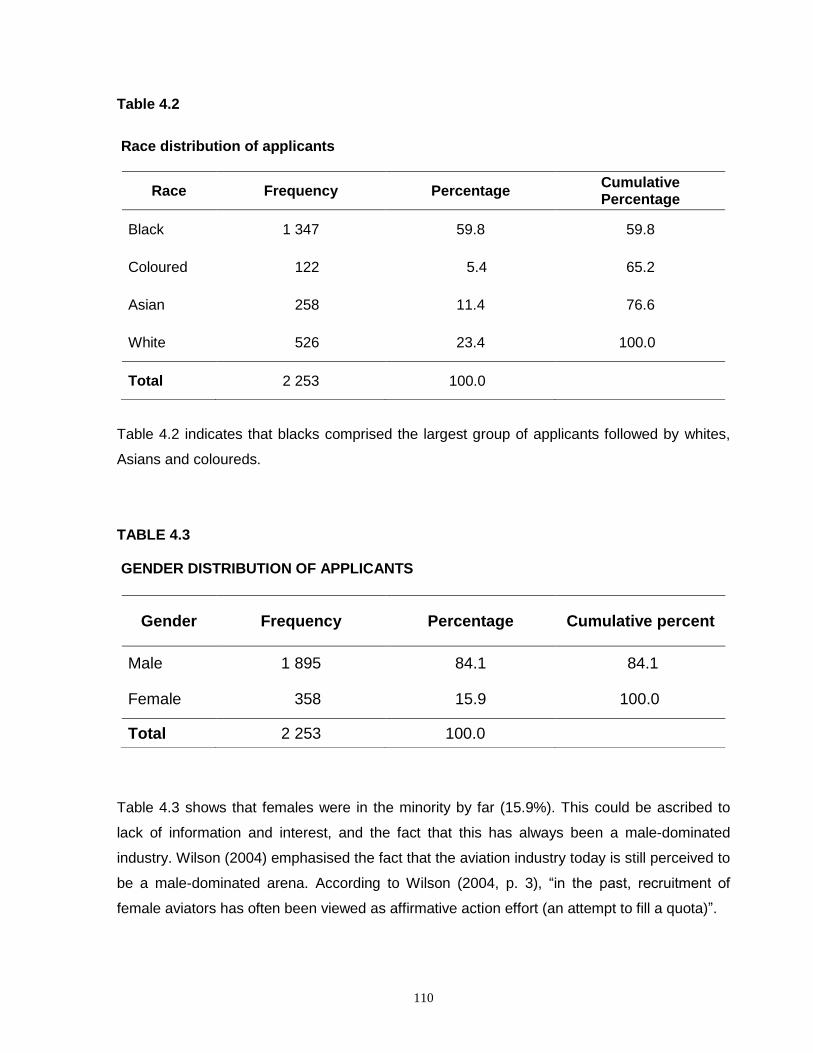
110
Table 4.2
Race distribution of applicants
Table 4.2 indicates that blacks comprised the largest group of applicants followed by whites,
Asians and coloureds.
TABLE 4.3 GENDER DISTRIBUTION OF APPLICANTS
Table 4.3 shows that females were in the minority by far (15.9%). This could be ascribed to
lack of information and interest, and the fact that this has always been a male-dominated
industry. Wilson (2004) emphasised the fact that the aviation industry today is still perceived to
be a male-dominated arena. According to Wilson (2004, p. 3), “in the past, recruitment of
female aviators has often been viewed as affirmative action effort (an attempt to fill a quota)”.
Race Frequency Percentage Cumulative Percentage
Black 1 347 59.8 59.8
Coloured 122 5.4 65.2
Asian 258 11.4 76.6
White 526 23.4 100.0
Total 2 253 100.0
Gender Frequency Percentage Cumulative percent
Male 1 895 84.1 84.1
Female 358 15.9 100.0
Total 2 253 100.0

111
The sample of applicants does not reflect the racial breakdown of the South African population
and is disproportionate in terms of race and gender as depicted in table 4.4 below. Table 4.4
indicates that blacks comprised 79.5% of the total South African population, followed by whites
at 9.2%, with coloureds and Indian/Asians representing 8.9% and 2.5% respectively.
In terms of gender, the population statistics as depicted in table 4.4 show a similar picture as
per the race groups, even though the race gender distribution indicates an equal distribution.
The commercial airline is attempting to address the imbalances of the past by providing career
opportunities to previously disadvantaged race groups, while also making a meaningful
contribution in terms of employment equity. This effort was also evident in the commercial
airline’s press advertisements specifying that preference would be given to previously
disadvantaged groups.
Table 4.4
Mid-year estimated for South Africa by population group and sex, 2006
Population group
Male Female Total
Number % of
population Number % of
population Number % of
population
African 18 558 500 79.6 19 104 400 79.4 37 662 900 79.5 Coloured 2 060 000 8.8 2 138 800 8.9 4 198 800 8.9 Indian/Asian 570 200 2.4 593 700 2.5 1 163 900 2.5 White 2 138 900 9.2 2 226 400 9.3 4 365 300 9.2
Total 23 327 600 100 24 063 300 100 47 390 900 100
Source: Adapted from Statistics South Africa (2006)
From the information in table 4.5 below, it is evident that females were in the minority in all the
race groups, especially the blacks and least so the whites.

112
Table 4.5 Race by gender distribution of applicants
Race
Gender Total
Male Female
Black Count 1 182 165 1 347
% within race 87.8% 12.2% 100.0%
Coloured
Count
97
25
122
% within race
79.5%
20.5%
100.0%
Asian Count 212 45 257
% within race 82.5% 17.5% 100.0%
White Count 404 123 527
% within race 76.7% 23.3% 100.0%
Total Count 1 895 358 2 253
% within race 84.1% 15.9% 100.0%
4.2.1 Biographical profile of sample in the second phase (phase 2)
All the candidates in the first phase (phase 1) who had achieved the cut-off scores in terms of
results of the psychological tests in this phase, namely English Language Skills Assessment
(Hough & Horne, 1989), Raven’s (Raven & Court, 1985) Intermediate Battery (B/77), and two
subtests,namely Reading Comprehension and Arithmetic 1 and 2 (Wilcocks, 1973) and the
Blox (Holburn, 1992), proceeded to the second phase. The second phase consisted of the
Wechsler Adult Intelligence Scale (WAIS) (Wechsler test manual, 1997), which was then
followed by a structured interview. The number of candidates was reduced from the first to the
second phase because the intention was to select those candidates who had the potential to
be successful in the training programme and the instruments were aimed at measuring
important characteristics aligned with the “ideal” profile as outlined in table 4.10 (to be
discussed in section 4.3).

113
Table 4.6 Race distribution of second phase candidates
Race Frequency Percentage Cumulative percentage
Black 19 21.8 21.8
Coloured 15 17.2 39.1
Asian 18 20.7 59.8
White 35 40.2 100.0
Total 87 100.0
After selection, which was based on the test scores achieved (see table 4.6 above), the white
cohort (23.4% of applicant pool) were now in the majority (40.2%), with the other groups were
more or less equally represented. However, the black applicant pool declined significantly from
59.8 to 21.8%.
These results highlight the debate over whether testing is useful in a multicultural environment
such as South Africa, where it is known that disadvantaged groups tend to score lower in
certain type of assessment instruments, particularly in cognitive ability tests (Kriek &
Dowdeswell, 2007, 2010; Van Eeden et al., 2001). The psychological instruments used in
phase 1 can be clustered as cognitive ability tests, and the group differences between the
racial groups based on table 4.6, therefore seem to favour whites.
According to Kriek and Dowdeswell (2010), the occurrence of group difference can potentially
lead to indirect discrimination and have an adverse impact on previously disadvantaged
groups, depending on how the assessment instruments are used.

114
Table 4.7 Gender distribution of second phase candidates
Gender Frequency Percentage Cumulative percentage
Male 64 73.6 73.6
Female 23 26.4 100.0
Total 87 100.0
Whereas in phase 1, females made up 16% of applicants, in phase 2 (see table 4.7) they
comprised 26.4%. According to Theron (2009, p. 183), “the origin of adverse impact is
generally believed to reside in the selection instruments used for personnel selection, or
differences occurring in the latent trait being assessed”. This view seems to indicate that the
applicants and black women in particular could have experienced an adverse impact. This
could be attributed to the instruments themselves or the attributes being assessed by some of
these instruments, resulting in no black women being selected for the second phase.
As an expression of the latter view, Theron (2009) cites an example by Pyburn, Ployhart and
Kravitz (2008), who reported that the ability of organisations to simultaneously identify high-
quality candidates and establish a diverse work force may be hindered by the fact that many of
the more predictive selection procedures negatively influence the pass rate of racio-ethic
minority group members (nonwhites) and women. Pyburn et al. (in Theron (2009) stated that
unfortunately, many of the most predictive knowledge, skills, abilities and other characteristics
(KSAOs) (e.g. cognitive ability) and predictor methods (e.g. assessment centres) produce
varying degrees of mean subgroup differences, with racio-ethnic minority groups usually
scoring lower than the majority. In most realistic selection situations, these subgroup
differences are large enough to reduce employment opportunities for the racio-ethnic minority
groups and women.
According to Theron (2009), there is thus a belief that selection instruments differ in terms of
the adverse impact they have on protected groups, and the instruments thus can be graded in
terms of their relative degree of adverse impact. From these beliefs, it can be inferred that the
changes reflected in tables 4.6, 4.7 and 4.8, in terms of race and gender, may be attributed to
the psychological instruments used during the two phases of the cadet selection process
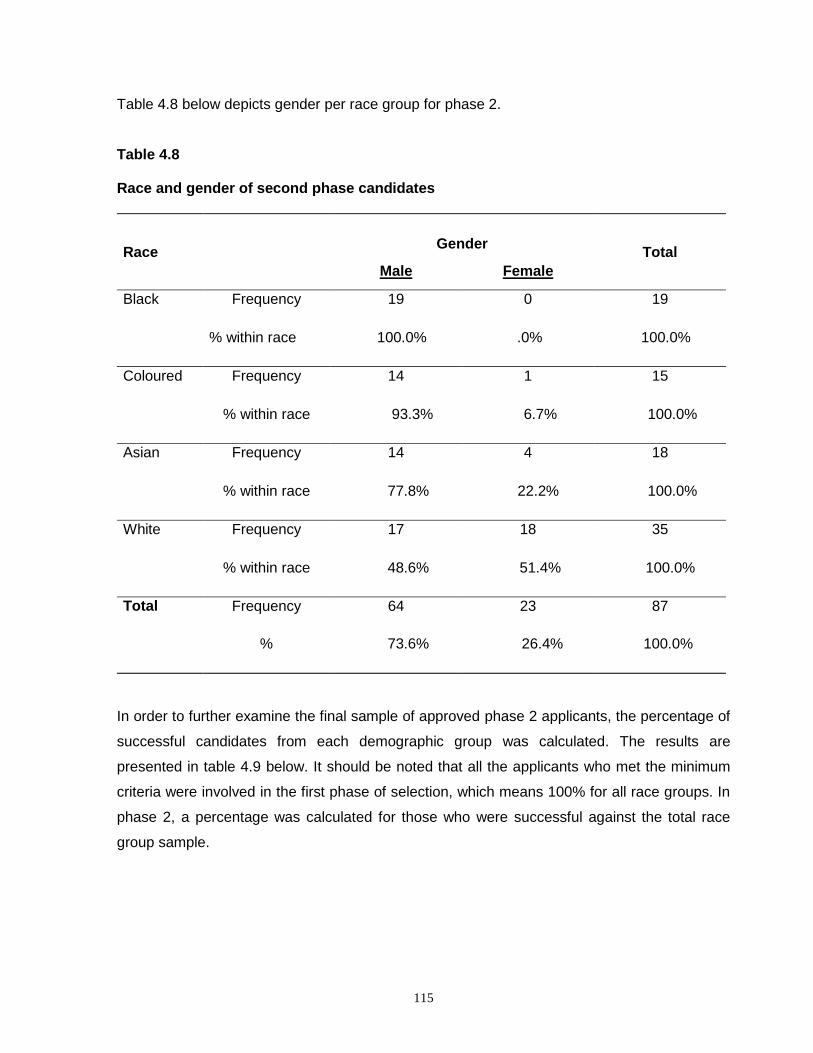
115
Table 4.8 below depicts gender per race group for phase 2. Table 4.8 Race and gender of second phase candidates
Race Gender
Total
Male Female
Black
Frequency 19 0 19
% within race 100.0% .0% 100.0%
Coloured
Frequency 14 1 15
% within race 93.3% 6.7% 100.0%
Asian
Frequency 14 4 18
% within race 77.8% 22.2% 100.0%
White
Frequency 17 18 35
% within race 48.6% 51.4% 100.0%
Total Frequency 64 23 87
% 73.6% 26.4% 100.0%
In order to further examine the final sample of approved phase 2 applicants, the percentage of
successful candidates from each demographic group was calculated. The results are
presented in table 4.9 below. It should be noted that all the applicants who met the minimum
criteria were involved in the first phase of selection, which means 100% for all race groups. In
phase 2, a percentage was calculated for those who were successful against the total race
group sample.

116
Table 4.9 Proportion of each demographic group included in phase 2, as a percentage of phase 1 participants
Race and gender
Frequency % of each group
admitted to phase 2
Applicants Phase 1
Applicants
Phase 2
Black male 1 182 19 1.6
Black female 165 0 0.0
Total black 1 347 19 1.4
Coloured male 97 14 14.4
Coloured female 25 1 4.0
Total coloured 122 15 12.3
Asian male 212 14 6.6
Asian female 45 4 8.9
Total Asian 258 18 7.0
White male 404 17 4.2
White female 123 18 14.6
Total White 526 35 6.7
Total male 1 895 64 3.4
Total female 358 23 6.4
Total candidates 2 253 87 3.9
It appears that in terms of the actual numbers, equal gender representation was achieved for
whites, but not for the other race groups. In the case of blacks, no females were selected for
phase 2, while for the coloureds, only one female was selected.

117
4.3 PSYCHOLOGICAL TESTS USED AS MEASURING INSTRUMENTS
The psychological tests used to predict the successful completion of the training programme
are supported by the literature review in chapters 2 and 3 as well as being defined by practical
issues in terms of time and resources.
It is pertinent to mention that a job analysis for a pilot was not conducted to identify the profile
and/or competencies of a cadet pilot. However, in consultation with the aviation psychologist,
who was a service provider and advisor during the initiation stages of the project, the
psychological instruments discussed below are compared to other tools that were identified,
based on a comprehensive job description developed of what a pilot would do on the job, as
discussed in section 2.8.2.
4.3.1 General proposed profile of a pilot
Table 4.10 below, as stated in section 2.8.3, provides some of the proposed requirements for a
pilot. This information was obtained from various sources, including pilot training school
recruitment requirements (Hutchison, 2009), the South African Airways’ (SAA’s) (SAA, 2010)
cadet pilot training programme, the South African Air Force (SAAF) as proposed by Aspeling
(1990) and the New Zealand airline (De Montalk, 2008).
Table 4.10 Proposed profile of a pilot
SAA cadet pilot requirement
Aspeling’s proposed profile
Hutchison’s proposed profile
New Zealand’s desirable personal attributes
Requirements
- South African citizen with passion for flying
- Medically fit
- At least 1.6
metres tall
- Pass a security
Primary cognitive abilities
- Mental alertness
- Memory
- Technical
comprehension
- Technical
knowledge
- Good
educational
qualification
- Good
communication
skills
- Level-
headedness,
calmness and
- Keenness and
enthusiasm
- Positive
attitude
- Willingness to
learn
- Awareness of
the big picture

118
check
- Good communication skills
- Good hand-eye coordination
- Preferably up to 25 years of age
- Highly motivated
- Ability to work under pressure
- Multi-tasking skills
- Confident and assertiveness
- Good judgement
- Decision-making skills
- Excellent problem- solving skills
Academic requirements
- Matric certificate/Grade 12/N3 or relevant qualification (SAQA accredited)
- Pure Maths or Statistics 101:HG symbol D or SG symbol C (level 4)
- Physical
- Arithmetic ability
- Initiative
Primary affective characteristics
- Stress
management
- Adaptability
- Emotional stability
- Assertiveness
- Institutional
aggression
- Caution
Primary psycho-physiological characteristic
- Vitality
- Alertness
- Concentration
Primary conative characteristics
- Motivation
- Responsibility
Primary psycho-social characteristics
- Leadership
- Team work
- Discipline
- Interpersonal
relations
- Communication
Primary perceptual- motor characteristics
- Complex co-
ordination
- Reaction time
the ability to
think and
respond
appropriately in
difficult
situations
- The ability to do
rapid mental
calculations
- Logical
problem- solving
- Self- confidence
and clear
speaking voice
- A disciplined
outlook and
responsible
attitude
- Good
coordination
and physical
fitness
- A sound
understanding
of science
subjects such
as Physics and
Maths
- The ability to
speak English
fluently
- The ability to
motivate and
the capacity for
team work
- Communicatio
n skills
- Command
potential
- Motivation
- Level-
headedness
- Maturity
- Ability to listen
- High personal
standards
- Good
personality
- Willingness to
learn from
mistakes
- Willingness to
conform

119
Science or Computer Science: HG symbol D or SG symbol C (level 4)
- English: HG symbol D or SG symbol C (level 4)
- Dynamic
anticipation
Primary management ability
- Mature decision
making
- Strategic planning
The selection battery used in the selection process for the cadet pilots was as follows:
English Literacy Skills Assessment (ELSA) (Hough & Horne,1989)
The Blox Test (Holburn, 1992)
Raven’s Progressive Matrices (RMP) (Raven & Court,1985)
Intermediate Test Battery (B/77), subtests: (Wilcocks, 1973)
o reading comprehension
o arithmetic 1 and 2
The Wechsler Adult Intelligence Scale (WAIS) (Wechsler, 1997)
With due consideration of the contents of table 4.10 and the psychological tests listed above in
terms of this research and from Aspeling’s proposed profile under the cluster of primary
cognitive abilities, the latter were measured using the psychological tests mentioned above
(see table 4.11). It should be noted that Hutchison’s (2009) proposed profile and SAA’s
academic requirements, namely Matric certificate/Grade 12/N3 or a relevant qualification
(SAQA accredited); Maths or Statistics 101; HG symbol D or SG symbol C (level 4); Physical
Science or Computer Science: HG symbol D or SG symbol C (level 4); and English: HG
symbol D or SG symbol C (level) were used as criteria to enter the programme and the ELSA
was used to assess the English literacy level of the applicants. The applicants’ Matric symbol
for English was also considered. Arithmetic ability (Aspeling, 1990) and the ability to do rapid
mental calculations (Hutchison, 2009) the Intermediate Battery (B/77), the arithmetic 1 and 2
subtests were used to measure these abilities. Good communication, as proposed by
Hutchison (2009) and SAA (2010) which includes written and spoken communication, as wells
as technical comprehension, as proposed by Aspeling (1990), were measured by the
Intermediate Battery (B/77) subtest, namely reading comprehension.

120
The personality attributes as proposed in table 4.10 were excluded in this research. However,
these attributes were assessed during the cadet pilot selection process.
Martinussen (1996) identified the following predictors, used in pilot selection, from 50 studies
that were included in the meta-analysis. The focus was on psychological measures and not
training experience:
cognitive tests, which were used mostly in the first screening of applicants, included
various pencil-and-paper tests measuring mechanical comprehension, spatial
orientation, time sharing, visualisation, perceptual speed, instrument comprehension
and attention
intelligence tests, which were placed in a separate category because they are intended
to measure global intelligence instead of separate abilities
psychomotor/information tests, typically measuring tracking or complex coordination
and usually requiring some sort of apparatus
aviation information tests, which consisted of questions about aviation in general and
measured motivation for flying
personality tests which included specialised tests and scales developed for aviator
selection
biographical inventories, which contained background information on the applicants
the combined index, which was a combination of several tests, namely cognitive and
psychomotor, for which apparently the correlations between the subtests and the
criteria were not reported
academic results, which were either school grades or tests that measured
mathematical or language proficiency
training experience, which involved flying experience prior to selection
This information shows that the psychological instruments used for this research were aligned
to international pilot selection processes, although not all the above-mentioned predictors were
used. Cognitive and intelligence tests, as discussed in chapter 2, biographical data, academic
results and training experience were included. Training experience was used during the paper
screening of the applications. The aviation information was assessed during the interview
phase of the selection process and the results are not reported in this research.

121
Damos (1996, p. 201) noted the following: “Job analyses for operational pilots are surprisingly
difficult to find. Indeed, no discussions of the tasks required by military transport flying were
found. The problems associated with defining an airline pilot’s job are evident in the fact that
the literature available on this topic dates from 1940s and 1950s.”
Hence the test battery used during the selection of cadet pilots was guided by information from
various sources, including other airlines as well as the air force.
The tests that were included in the selection battery to measure psychological abilities required
for a cadet pilot and which psychological attributes they measure are indicated in table 4.11
below for both phases 1 and 2 of the selection process.
Table 4.11 The psychological instruments used
Test battery What it Measures
Ph
ase
On
e
ELSA English proficiency – phonics, dictation, vocabulary, reading comprehension and verbal and numerical understanding
Blox Spatial ability, the ability to visualise three-dimensional drawings and understand the nature of the arrangements of elements in visual stimulus patterns
Raven’s Progressive Matrices
Analytical ability, deductive reasoning and the ability to integrate details into a complex whole
Intermediate Test Battery (B/77): reading comprehension
English literacy – understanding grammar and vocabulary
Intermediate Test Battery (B/77): arithmetic 1 & 2
Aptitude for figures – arithmetic calculations and arithmetic reasoning in practical situations
Ph
ase
Tw
o Test battery What it measures
Wechsler Adult Intelligence Scale (WAIS)
General Intelligence (IQ)

122
The psychological tests used during the first and second phases of the cadet selection process
are discussed providing the research findings on their suitability in predicting success in the
cadet pilot training programme
These tests serve as the independent variables for the research.
Taking into account the discussion in chapters 2 and 3 relating to psychological tests and
some of the limitations of current psychological batteries, instruments to measure both literacy
and numeracy were considered on the basis that group tests need to be conducted because of
limited resources in terms of time and capital.
4.3.2 Psychological assessment instruments used in the cadet pilot selection procedure
It is necessary at this juncture to describe the instruments used in terms of the aim,
description, administration, reliability and validity as well as the research findings.
4.3.2.1 English Literacy Skills Assessment (ELSA)
The ELSA is a measuring instrument designed and developed locally for Southern African
needs (Hough & Horne, 1989). The test is described below in terms of the aim, description,
administration, validity and reliability.
a Aim
The ELSA Intermediate is a measuring instrument that quantifies the English competency
input levels and trainability levels of employees who have to communicate, cope and
function effectively in an English language environment and/or undergo training that
utilises English tests such as books, manuals, study guides, etc., with English as the
language of learning.
b Description
The test comprises the following seven subtests:

123
Phonic skills assesses whether a learner is experiencing problems with the sound
systems of the language of learning and to what extent.
Dictation determines how well the learner “hears” English and whether the
conventions of writing are part and parcel of the learner’s literacy skills. According to
Hough and Horne (1989), spelling is also taken into account.
Basic numeracy determines whether the learner is numerate. According to Hough and
Horne (1989), numeracy is an integral part of literacy.
The asserted that a person who is literate but not numerate will not be able to look up a
telephone number, a date on a calendar or read a weather report, etc., or understand
or write down a message involving numeracy.
Language and grammar of spatial relations identify learners who have a problem
with these abilities/skills.
Reading comprehension assesses narrative writing at a relatively simple level with a
readability index of ± Grade 7 for English mother tongue users.
Cloze procedure determines exposure to and familiarity with English.
Vocabulary in context involves expository writing.
c Administration
Detailed instructions for the administration of and instructions for the test are provided in
the ELSA manual (ELSA, 1989). The marking/scoring, evaluating and reporting of the
results were provided by the supplier/developer of the assessment instrument, who
provided the organisation with reports within 72 hours of the answer sheets being
delivered.
d Reliability and validity
According to Horne (1989), the predictive validity of the test is 84% and reliability is 0.67.
The ELSA literacy levels are benchmarked against South African norms as follows:
literacy – equivalent to three years of formal schooling (mother tongue implied)
functional literacy – equivalent to eight years of formal schooling

124
academic literacy – equivalent to ten years of formal schooling
e Research
After the development of the ELSA, the developers approached the Human Resources
Research Council (HRSC) to evaluate it. The first evaluation was conducted on two sets of
test results, with the first dataset comprising 74 candidates with English as their mother
tongue and the second dataset comprising the results of 614 candidates with English as
their second language. Each dataset contained two observations of each candidate,
namely the candidate’s scholastic level and the literacy skills level as determined by the
ELSA. Schoeman (1991) reported that, for the first dataset, the contingency coefficient, C,
which is a measure of agreement between the scholastic level and literacy skills level, was
C= 0.80. It was further reported that in 37 (50%) of the cases, the literacy levels agreed
with the scholastic levels. In 61 ( 82.4%) of the cases, the literacy skills level deviated by
no more than ± 1 from the scholastic levels. There was skweness in this context in the
sense that in eight (10.8%) of cases, the deviation was +1, whereas in the 16 (21.6%) of
the cases, the deviation was – 1. On average, the literacy skills test rated the candidates
half a level (0.5) below the scholastic level, with a standard deviation of 1.3.
In case of the second dataset, it is reported that contingency coefficient C = 0.65.
Regarding the discrepancies between the literacy skills levels and scholastic levels it was
found that in 33 (5.4%) of the cases, the literacy skills agreed with the scholastic levels. In
133 (21.7%) of the cases, the literacy skills deviated by not more than ± 1 from the
scholastic level. There was a marked skewness in this context in the sense that in nine
(1.5%) of the cases, the deviation was + 1, whereas in 91 (14.8%) of the cases, the
deviation was -1. On average, the literacy skills test rated the candidates 2.6 levels lower
than the scholastic levels, with a standard deviation of 1.5.
In 1993, the HRSC was approached to determine the predictive validity of theELSA, on a
sample of 684 employees, who had passed Standard 6 (Grade 7) with English as mother
tongue, in a manufacturing sector. Kriek (1993) reported that the mean raw scores of the
respondents were 72.8%, representing a higher level of English literacy skill than was
expected from the employees who had passed Standard 6 (Grade 7). Only 14.3% of the
respondents obtained a mark below the Standard 6 (Grade 7) interval.

125
In a study to determine the influence of the language proficiency of English teachers who
are not native speakers of English on language skills of their learners, KrÜgel (2006) used
the ELSA as a measuring tool. The sample for the research consisted of eight secondary
schools in the Sedibeng East District of the Gauteng Department of Education, which had
opted to use English as a medium of instruction, where Grade 12 learners (n = 102) were
taught English by teachers (n = 9) who were not native English speakers. The researcher
concluded that the results of the ELSA indicated a clear correlation between teachers and
learners. For instance, where the teachers had good scores, the learners also had good
scores. However, where the teachers had poor scores, the learners performed even
worse. KrÜgel (2006; p. 85) cautioned that “although teachers had a profound impact on
the language skills of their learners, it must be understood that apart from teachers, there
are numerous other factors/variables (e.g. environmental influence, early stimulation,
communication, auditory problems and ineffective information processing skills, etc.) that
could have had an impact or influence on the language abilities of the learners.”
4.3.2.2 The Blox Test
The aim, description, administration, reliability and validity of the Blox Test are discussed
below.
a Aim
The Blox Test measures spatial ability and is made up of a number of factors, namely
visualisation, spatial relations and spatial orientation (BLOX Test Manual, 1983). This ability to
visualise three-dimensional drawings and understand the nature of the arrangements of
elements within visual stimulus patterns is deemed to be essential for a pilot.
b Description
This is a paper-and-pencil based test using a reusable test book. It is a nonverbal test
consisting of six examples and 45 items. The stimuli are isometric drawings of different
combinations of two, three, four, five or six cubes. Each set of cubes must be compared to

126
similar arrangements of cubes viewed from other angles. The Blox Test measures the
following:
Spatial relations and orientation. This is the ability to comprehend the nature of the
arrangements within a visual stimulus pattern primarily with respect to the examinee’s
body or frame of reference (Zimmerman, 1957). The parts that comprise the figure
maintain their relationships with one another as the whole figure is moved or rotated in
space. The examinee’s task is to recognise the same visual stimulus pattern from
different angles.
Visualisation. This is the ability to mentally manipulate, that is, rotate, invert and/or
twist one or more parts of a visual stimulus pattern and recognise the changed
appearance of the object.
c Administration
In order to ensure that the respondents have a clear understanding of what is expected of
them, the test administrator works with them through the six test examples. The respondents
must analyse each stimulus set and choose the corresponding set from the five possible
options, viewing the stimulus set from different angles. The test has a time limit of 30 minutes
and consists of 45 items.
d Reliability and validity
Holburn (1992) conducted a study of trainee engineering technicians and found that the
internal consistency data indicated correlations of consistency of 0.91 and reliability of at least
0.81 Holburn (1992).
e Research
Wheeler (1993), who used a sample consisting of 93 black male apprentices and 166 white
male apprentices employed in mines in Gauteng, reported on the regression results of the
overall predictive validity of the Blox Test. In terms of predictive power, the Blox Test makes a
significant contribution to predicting overall effectiveness with 14.87% of the variance
127
explained over and above the effects of the significant third variable race (F = 23,.9; p <
0.001).
After the significant contributions of the Blox Test and the variable mine had been partialled
out, no additional variance in overall effectiveness was accounted for by either the main (F =
0,.39; p > 0.05) or interaction effect ( F = 0.10; p > 0.05) of the variable race. Wheeler (1993)
concluded that when the Blox Test was used as a predictor of overall effectiveness, there was
no support for differential prediction in respect of either intercept or slope difference between
the two race groups.
Flotman (2002), who conducted a study on the selection of SAAF pilots between 1997 and
1999, involving 92 candidates who had completed the Ground School Phase, found that the
correlations between the Blox Test and Ground School Phase results were not statistically
significant (r = 0.091; p > 0.05). He concluded that despite the poor correlation with the Ground
School Phase results, the BloxTest remains an important component of the selection battery in
the sense that it measures one of the critical abilities a potential pilot should have, namely
spatial relations and orientation.
De Kock and Schlechter (2009) reported that the Blox Test has been shown to yield
acceptable reliability estimates of scores for various South Africa cultural groups, namely for
black Xhosa males (KR20 = 0.89, coloured Afrikaans males (KR20 = 0.82), Indian males
(KR21 = 0.79) and black Zulu males (KR21 = 0.77).
4.3.2.3 Raven’s Progressive Matrices (RPM) Test
a Aim
The RPM was developed to measure eductive ability in a way that would be minimally
contaminated by variation in the knowledge possessed by those being tested. Eductive ability
is used to refer to the process of educing or squeezing new insight and information out of that
which is perceived or already known (Raven, Raven & Court, 1998).
Effective eductive behaviour requires problem identification, reconceptualisation of the whole
field (not just "the problem”) and monitoring tentative solutions for consistency with all

128
available information (Raven et al., 1998). The RPM has also been used as a dependent
measure to evaluate the effectiveness of other programmes intended to enhance "problem-
solving ability” (Raven, et al., 1998).
b Description
The test is divided into five sets of 12 problems (sets A, B, C, D and E). Each set starts with a
problem which, as far as possible, is self-evident and develops a theme in the course of which
the problem builds on the argument of what has gone before and thus becomes progressively
more difficult. This procedure affords the respondent five opportunities to familiarise
himself/herself with the field and method of thought required to solve the problems.
Administered in a standard way, the test therefore provides a built-in training programme and
indexes the ability to learn from experience or "learning potential". The cyclical format also
affords the tester an opportunity to assess the consistency of a person's intellectual activity
across five successive lines of thinking (Raven et al., 1998).
c Administration
The key requirements are firstly to make sure that the respondents understand what they are
required to do and the method of thought required to solve the problems; and secondly, to
ensure that the tests are administered as outlined in the test manual to all who are to be tested
so that the procedure adopted corresponds to that used when collecting any reference data
with which the results will be compared.
This is a pencil-and-paper test and can be administered individually or in groups. The
respondent should be allowed to work on his/her own if he/she is capable of doing so. There is
only one example to complete. One point is scored for each correct answer using a marking
key.
d Reliability and validity
Raven et al. (1998), who reported on internal consistency, found that among young people in a
1979 British standardisation process, the correlations established for eight socioeconomic
groups ranged from 0.97 to 0.99, with the low of 0.97 being a statistical artifact.

129
According to Owen (1992), a considerable amount of work has been done with the RPM
working with job applicants in the gold mining industry. An interesting finding was that,
although the testees were not test sophisticated, the internal consistency coefficient (K-R21
plus Tucker's correction) was quite high, namely 0.87.
e Research
Numerous versions of the RPM have been developed over the years, including Raven’s
Progressive Matrices (RMP), which is a nonverbal group ability test (Raven, 1960). The
Advanced Ravens Progressive Matrices (ARMP) test was specifically developed for use with
superior adults (Raven, Court & Raven, 1988).
According to Rushton, Skuy and Fridjhon (2003), regardless of the version, Raven’s test, the
Coloured Progressive Matrices, the Standard Progressive Matrices and the ARPM are the best
known, most researched and most widely used of all culture-reduced tests (Raven, 2000).
Carpenter, Just and Shell (1990) found that the ability to deduce relations and manage a large
set of problem-solving goals tends to distinguish between high- and low-scoring subjects on
the RMP. The above authors mentioned the following reasons why the RMP is appropriate in
the study of cognitive and analytical abilities:
The large number of items included in the RMP lends itself to experimental analysis of
problem solving.
Correlations between RMP scores and other measures of intellectual achievement
suggest a general underlying construct similar to Spearman’s g–factor rather than
specific aspects of cognitive functioning.
The RMP is commonly used in research that requires language processing to be
minimised.
Several studies have concluded that the RMP measures processes central to analytical
intelligence.
According to Muller and Schepers (2003), a survey of reliability studies shows a wide range of
coefficients, from the high 0.70s to the low 0.90s. They further state that early studies revealed
a fairly high correlation between the RMP and the Stanford–Binet of r = 0.60 (Keir, 1949),

130
Wechsler performance IQ of r = 0.70 (Hall, 1957) and Wechsler verbal IQ of r = 0.58 (Hall,
1957).
Zindi (1994) compared the results of black working-class Zimbabwean children with those of
white London children, using the RPM. The English group outperformed the Zimbabwean
sample, with mean IQs of 96.71 and 72.36 respectively. The researcher suggested that the
lack of Westernised test sophistication was probably a contributory factor in this lowered
performance.
In another study, Jukes and Grigorenko (2010) noted that the RPM was used in many studies
reporting IQ scores for sub-Saharan Africans. Their study indicated that almost 50% of
intergroup differences could be attributed to the effects of schooling and urban residence.
4.3.2.4 Intermediate Battery (B77)
a Aim
The National Institute of Personnel Research (NIPR), under the auspices of the Human
Sciences Research Council (HSRC), developed the Intermediate Battery. This test battery was
designed to measure mental ability in a number of areas. It is used for vocational guidance
and also for selection of staff with more than 12 years of education (Wilcocks, 1973).
The test consists of seven subtests measuring quantitative analysis ability, verbal ability and
clerical speed and accuracy, giving an overall impression of a person's abilities and aptitudes.
The battery can be used as a whole or those tests pertaining to the ability being tested can be
used in isolation.
b Description
The battery is a paper-and-pencil test in reusable booklets. Each subtest is a unit, with its own
instructions and time limit, which means that it can be applied alone. The battery is answered
on a separate answer sheet.

131
For most of the subtests, each item takes the form of a question with a five-choice answer
from which the testee must select the correct answer.
If one considers some of the duties of a pilot, for instance, the ability to assimilate and utilise
numerical values through concentration, memory and application (e.g. the calculation of fuel
consumption based on the flight plan and weather conditions), numerical and verbal
proficiency are some of the competencies assessed.
Based on these competencies, the subtests used for the selection of cadet pilots are briefly
described below:
Arithmetic problems. This is a test of arithmetic reasoning. The 30 items are in the
form of verbal statements of computational problems in two parts A and B.
Reading comprehension: This test measures the ability to understand the content of
written passages. There are four paragraphs in the test and five questions to be
answered on each paragraph.
The time limits are 45 and 20 minutes respectively for each of the above subtests.
c Administration
Groups of fewer than 20 candidates were tested by one person. However, for larger groups,
the psychometrist was assisted by a test administrator, who distributed and collected the
testing materials, answered questions, ensured that the examples at the beginning of the tests
were correctly answered and maintained order in the testing room.
The raw scores for a particular test are those questions answered correctly by a testee. The
raw scores were verified by subtracting the number of red marks from the maximum score
possible, for example, 20 was the maximum score for reading comprehension.
d Reliability and validity
The reliability of each subtest was determined using a sample of 176 South African Railways
male clerical staff with 12+ years of education (Wilcocks, 1973).
132
The reliability coefficient for the arithmetic problems and reading Comprehension subtests
were 0.795 and 0.680 respectively (Wilcocks, 1973).
Another study was conducted with a sample of 205 South African Railways male clerical staff
with nine to ten years of education. The reliability coefficient for the arithmetic problems and
reading comprehension was 0.621 and 0.737 respectively.
e Research
A review of the available literature shows that in most instances where the intermediate battery
was used as a measurement instrument, the most commonly used subtest was the mental
alertness subtest. Considering the primary measures of this subtest (i.e. mental alertness),
which are the verbal aspects of intelligence, including reasoning tasks in the form of verbal
analogies, classification of abstract concepts and figure and letter series (Intermediate Battery
Test Administration manual, 1973), it is not surprising that this subtest was utilised. The
reading comprehension and arithmetic subtests which measure arithmetic reasoning and the
ability to understand the content of a written passage were included under the mental
alertness subtest as explained above.
Nonetheless, the researchers, Nunns and Ortlepp (1994), drew a conclusion using the mental
alertness test as a predictor of academic success in Psychology 1, the researchers found that
this test correlated statistically significantly (r = 0.37; p < 0.0001) with Psychology 1, for
educationally advantaged students, but not for educationally disadvantaged students.
4.3.2.5 The Wechsler Adult Intelligence Scale (WAIS)
a Aim
Wechsler's original intelligence test, the Wechsler-Bellevue Intelligence Scale (1939), was a
milestone in the history of intelligence testing because it incorporated both verbal and
performance scales and yielded scores for those scales in addition to an overall composite
score. Furthermore, the Wechsler-Bellevue was innovative because it provided deviation IQ

133
scores that were based on standard scores computed with the same distributional
characteristics at all ages (Wechsler, 1997).
In the technical manual (1997), it is stated that Wechsler adopted an ecological approach to
the concept of intelligence and conceived of it as a multidimensional construct, one that
manifests itself in many forms. He considered intelligence not only as a global entity but also
as an aggregate of specific abilities. Wechsler explained that intelligence is global because it
characterises the individual's behaviour as a whole. It is also specific because it is composed
of elements or abilities that are qualitatively different.
Wechsler believed that intelligence should be measured by both verbal and performance
tasks, each of which measures ability in a different way and which could be aggregated to form
a general global construct (Wechsler,1997).
b Description
In the current research, ten of the 11 subtests were used. As previously mentioned, the test
has verbal tests consisting of verbal reasoning, comprehension, arithmetic reasoning, digit
symbol forward and backward and similarities subtests. The performance/practical tests
consist of the following subtests picture completion, object assembly, block design, digits
symbol 90 and picture arrangement.
c Administration
The individual subtests will be described under the following subheadings: description and
administration and scoring.
(1) Verbal tests
Comprehension
i. Description: This test measures common-sense judgement and practical
reasoning.
ii. Administration and scoring: The manual suggests that this test should be
discontinued after four failures. In scoring this test, 1 or 0 marks are awarded
according to the generalisation and quality of the response. The total score is
20.

134
Arithmetic reasoning
i. Description: This test consists of 14 items, but testing routinely begins with the
third item since the first two are ordinarily given to respondents who fail items 3
and 4. The arithmetic scores have limited added value as measures of general
ability in the population at large, but they do reflect concentration and "ideational
discipline" (Lezak, 1995).
ii. Administration and scoring: The technical test manual (1997) suggests that the
first eight problems are given orally and the last two handed to the subject on
printed cards. Question 1 should be used as an example. Normally, the examiner
should continue until three successive problems have been failed.
The arithmetic items have a time limit ranging from 15 seconds on the first four to
120 seconds on the last one. A subject can earn raw score bonus points for
particularly rapid responses on the last four items. The maximum score is 14.
Digit span
i. Description: The digit span in the Wechsler batteries is the most common for
measuring the span of immediate verbal recall. It comprises two different tests, the
digit forward and digit backward.
Both tests consist of seven pairs of random number sequences that the examiner
reads aloud at the rate of one per second. Both tests thus involve auditory
attention. In addition, both depend on a short-term retention capacity.
ii. Administration and scoring
Digit forward: The examiner requests the subject to repeat the numbers in the
same sequence in which the examiner said them. The test will normally be
discontinued after the subject has failed both series at any level, but the examiner
should proceed with the longer series if there are any indications of varying
attention.

135
Digit backward: The examiner requests the subject to repeat the numbers given
backwards. Generally, the examiner should pronounce the digits at a rate of one
per second. When a sequence is repeated correctly, the examiner reads the next
longer number sequence, continuing until the subject fails a pair of sequences or
repeats a nine-digit series correctly.
The test manual indicates that the score is the highest number of digits repeated
without error on either of the two trials, except that no credit is given for success
following on a failure on both trials. The maximum total score for the digit forward
and backward is 17.
Combining the two digit span tasks scores to obtain one score, which is the score
that is entered for statistical analysis of the Wechsler tests, indicates that the two
tests are treated as if they measured the same behaviour or are very highly
correlated behaviours (Lezak, 1995).
Similarities
i. Description: In this test of verbal concept formation, the testee must explain
what each of the pair of words has in common.
ii. Administration and scoring: The word pairs range in difficulty from the simplest
(Orange-Banana), which only retarded or impaired adults fail, to the most difficult
(Fly-Tree) in the WAIS and (Praise-Punishment) in the WAIS-R.
The test manual stipulates that responses are scored 2, 1 or 0, depending on the
degree and quality of the generalisation. The guide to marking must always be
used in evaluating responses. The maximum score is 24.
(2) Practical or performance tests
Picture completion

136
i. Description: The test consists of 15 drawings, each of which has a part missing.
Incomplete pictures of human features, familiar objects or scenes are arranged in
order of difficulty with instructions to explain which important part is missing.
ii. Administration and scoring: The examiner presents the cards in numerical order
and the subject has to name or indicate the missing part in each.
One point for each picture for which a correct response is given within the time limit.
No half marks are given. The maximum score is 15.
Object assembly
i. Description of the test: Lezak (1995) describes object assembly as a test of speed
of visual organisation and motor response because it tests the capacity for visual
organisation. Visual acuity and dexterity also make significant contributions.
This test consists of three items, namely a manikin, a profile and a hand.
ii. Administration and scoring: The test manual stipulates that the order of
presentation of the objects is a manikin, a profile and a hand.
All responses are scored for both time and accuracy. The manikin has a time limit
of two minutes, while the profile and hand have three minutes. Although the
manikin has a time limit, it is scored for accuracy only, whereas the profile and
hand are scored for both time and accuracy. This means that the final score for
these two is the sum of accuracy and time credits. The total score for the three
objects is a maximum of 26.
Block design
i. Description: This test is a construction test in which the subject is presented
with red and white blocks, four or nine, depending on the item. Each block has two
white and two red sides, and two half-red half-white sides with colours divided
along the diagonal.
ii. Administration and scoring: The test material consists of a box with 16 cubes
and nine design cards, with the first two cards being samples. The examiner

137
should remove four cubes from the box and display them to the subject and
describe the blocks.
The four-block designs have one-minute time limits and the nine-block design a
two-minute limit. The subject can earn one or two bonus points for speed on the
last designs of the WAIS. After each design has been completed, the examiner
must break the design up, leaving one block facing the right way up for the next
design, before presenting the next card.
The test is scored for both accuracy and time. Three points are given for each
design correctly reproduced within the maximum time limits. No credit for time is
allowed unless the design is reproduced just as shown on the card. Blocks need
not fit perfectly, but the design must be absolutely correct. The maximum score is
42.
Digit symbol
i. Description of the test: The symbol substitution task is printed in the WAIS test
booklet. The task is a measure of perceptual and graph motor speed. The
subject's performance on this task is a means of determining skills that might
have affected his/her score on digit symbol coding. According to Lezak (1995),
for most adults, the digit symbol is a test of psychomotor performance. Motor
persistence, sustained attention, response speed and visuomotor coordination
play a key role in a normal person's performance, but visual acuity does not.
ii. Administration and scoring: Digit symbol substitution requires the subject to
copy the symbols.
The examiner places the digit symbol sheet before the subject and indicates the
key at the top, with an explanation that the subject must complete the space
underneath with a mark that corresponds to the number at the top.
The score is the total number of symbols correctly entered. Precision and neatness
are disregarded, but recorded symbols must be identifiable as keyed symbols. The
maximum score is 67.

138
d Reliability and validity
Corrected split-half reliability coefficients for verbal IQ (.95 to .97) and full scale IQ (.96 to .98),
and their respective standard errors of about two points, are quite acceptable. The reliability of
performance IQ is excellent, averaging .93, although the value of .88 at ages 16 to 17 is not
ideal. Subtest reliability coefficients average values exceed .80 for nine of the 11 subtests.
Only picture arrangement (.74) and object assembly (.68) fall short of expectations. Test-retest
reliability coefficients affirm the excellent reliability of the verbal and full scales, and show
performance IQ to be quite acceptable (.89 to .90). Test-retest coefficients for the subtests
confirm the reliability of all tasks except object assembly and picture arrangement
e Research
Foxcroft and Aston (2003) reported on a study conducted by the task team responsible for the
adaption of the WAIS-III for English-speaking South Africans, who obtained the following mean
scores on the English proficiency test: 112.62 (SD = 9.75) for English-speaking whites, 106.52
(SD = 11.19) for English-speaking coloureds, 102.72 (SD = 1.50) for Afrikaans-speaking
whites, 99.72 (SD = 13.56) for English-speaking blacks, 95.88 (SD = 14.75) for Afrikaans-
speaking coloureds and 90.37 (SD = 17.47) blacks who spoke English at work but for whom
English was largely a second or third language.
When the mean difference were statistically compared, it was found that the mean score for
English-speaking whites was significantly higher than that of Afrikaans-speaking whites (p <
0.001), English-speaking coloureds (p = 0.0012), Afrikaans-speaking coloureds (p < 0.001),
English-speaking blacks (p < 0.001) and blacks who spoke English at work, although this was
not their first language (p < 0.001) (Foxcroft & Aston, 2003). The authors concluded that the
groups differed significantly in terms of their English proficiency levels, with groups for whom
English was a second (or third) language, scoring 0.5 to almost two standard deviations below
the white English first language sample.
In South Africa, Shuttleworth-Jordan (1996) conducted a study drawing on African first
language students studying in the medium of English at a traditionally white university. In this
study, there was evidence of consistent but only marginally lower scores for black African first
language versus white English first language students on a variety of neuropsychological
139
measures, including the South African Wechsler Adult Intelligence Scale’s (SAWAIS’s) digit
span and digit symbol subtests. Furthermore, it was found that the black African first language
scores were equivalent to those of comparable US standardised data.
According to Shuttleworth-Edwards et al. (2004), when comparing the indications from the
Avenant and Shuttleworth-Jordan studies, which both focused on black university students,
using the digit span and digit symbol subtests of the SAWAIS, it appeared that the quality of
education should be used to explain the highly discrepant finding. This is view is based on the
Avenant (1988) study in which the WAIS-R was applied to a sample comprising black prison
wardens and students from historically black universities. It was found that the university
undergraduate students scored better than the prison wardens, but fell significantly below the
US standardised sample, with a full scale IQ of 77 (recalculated in Nell, 1999, p. 132), while
the prison warden’s mean full scale IQ was 73.
Albeit ostensibly equivalent for educational level, in Avenant’s (1988) study, students from the
historically disadvantaged black universities demonstrated an IQ level in the borderline range.
In contrast, in the Shuttleworth-Jordan’s study, the students from historically advantaged white
universities achieved scores that were commensurate with the US standardisation data, and
that were not substantially different from their white English-speaking university counterparts
(Shuttleworth-Edwards et al., 2004).
4.3.2.6 Biographical factors and matriculation results
One of the requirements for the applicants for the cadet pilot programme is that they should
have a matriculation certificate or equivalent, with a pass in Maths or Science and English.
Their race and gender are also considered. These requirements, as indicated in chapter 1,
were stipulated to ensure that the commercial airline achieves its affirmative action targets as
well as diversity in its workforce.
In the discussion on literacy and numeracy, which was covered in chapter 2, the importance of
language was explored in detail. Van Rooyen’s (2001) study on home language indicated that
a person’s home language was a significant predictor of academic performance, (p < 0.01),
and it explained 10.8% of the variance in the mean of percentage mark (MCPM).

140
A literature search on biographical factors with regard to gender revealed conflicting results.
For instance, a study by Everette (1991) on 1 695 students in Australia in 1987, showed that
there is a tendency for women to have a higher pass rate than men (Everette, 1991).
Whereas, Zaaiman (1998) reported on a study by Brusselmans-Dehairs and Henry (1994),
who demonstrated that boys generally performed better than girls in mathematics.
Many organisations use Matric results as a minimum criterion for entry-level positions. As
indicated in section 4.3.1 above, the Norwegian Air Force used 12 years of education as a
formal criterion for admission to their ab initio training programme. In research conducted by
Van Eeden et al. (2001), it was indicated that school performance in Mathematics (r = 0.25; p
< 0.01), Science (r = 0.28; p < 0.01 and English (r = 0.33; p < 0.01) was the best predictor of
average first-year performance in science courses.
A study by Shochet (1998) showed that while there was a statistically significant correlation
between Matric results and university success for educationally advantaged students - with the
Matric results explaining 30% of the variance of student’s average result - a similar conclusion
could not be drawn for academically disadvantaged students. However, Zaaiman (1998)
concluded that the South African Matric results are not valid or reliable because of differences
in the scholastic education of students.
4.4 DATA COLLECTION AND PROCESSING
According to Mouton and Marais (1990), the step of data collection in the research design
poses a huge challenge for the social science researcher because of the rational, historical
and normative characteristics of humans. They (1990) further stated that it is essentially a
requirement that the application of a valid measuring instrument to different groups under
different sets of circumstances should lead to similar observations.
The purpose of gathering data is to ensure optimal administration of the collection methods, as
well as comprehensiveness and accuracy of the raw data in respect of the independent and
dependent variables.
Huysamen (2000, p. 146) asserted that “ it is common cause that students from schools
formerly falling under the Department of Education and Training (DET) have been exposed to

141
schooling system which was inferior compared to that attended by their white counterparts”.
Hence the Matric results of students from these schools, particularly black students, are bound
to correlate more poorly with tertiary academic performance (Huysamen, 2000). In his study to
investigate whether university marks were a better predictor of marks in subsequent years
than Matric marks, he operationalised the Matric performance by assigning values of 8 to 2 to
symbols A to G obtained for subjects passed at the higher grade (HG), values of 6 to 0 to the
corresponding symbols for standard grade (SG) and summing these values to obtain a Matric
symbol point total (MSPT).
In the current research, a similar procedure was used to convert the Matric symbols to values,
which enabled the researcher to conduct statistical analysis on this variable.
4.4.1 Data collection for the independent variables
A psychometrist and a test administrator administered the tests at the various centres
countrywide. The test administrator functioned as an assistant during the testing process, in
distributing and collecting the test material, answering questions and ensuring that examples
were completed and properly understood for each test battery. This approach was used for
both phases 1 and 2 of the selection process.
Prior to the final selection process, all the applicants who were found suitable in phase2 of the
psychometric tests were required to perform aircraft manoeuvres in an aircraft simulator to
measure their psychomotor capabilities based on motor coordination of arms/hands and legs,
spatial skills in a three-dimensional direction, multitasking by processing information from three
instruments at the same time, strategic information processing by using the memory, attention
to detail, information gathering, evaluation and logical processing and mathematical operations
using a compass. The applicants were given practice tasks before the actual test. It is
pertinent to mention that these results were not considered in the current study.
4.4.2 Data collection for the dependent variable
The final flying school training results were provided by the flying school which had conducted
both the theoretical and practical flying tests results. The theoretical results were used in the
current research.

142
4.5 DATA ANALYSIS
The purpose of the data analysis is to test the hypothesis and the general aims of the
research, as set out in section 1.3.
4.5.1 Introduction
According to Kerlinger, (1986, p. 175), "Statistics is the theory and method of analysing
quantitative data obtained from a sample of observations in order to study and compare
sources of variance of phenomena, to help make decisions to accept or reject hypothesized
relations between the phenomena, and to aid in making reliable inferences from empirical
observations."
In the current research, statistical analysis was used to test the hypotheses that the
psychometric test results during phases 1 and 2 correlated with performance in terms of the
actual flying school final examination results in a cadet pilot training programme.
All statistical analyses in the present study were computed using the SPSS statistical package
for Windows version 11.1 (SPSS, 2001).
There are two major components of the discipline of statistics - descriptive and inferential
statistics. Also of importance are the concepts of statistical significance, practical effect sizes,
reliability and validity, all of which will be explained in this section.
4.5.2 Descriptive statistics
The purpose of descriptive statistical analysis is to provide an overview of the data that were
collected for the research. The tables in chapter 5 reflect the sample size (n) in the initial
selection process based on the paper screening in terms of race and gender as well as the
mean and standard deviation for each variable.

143
According to Cohen (2008), descriptive statistics is concerned with summarising a given set of
measurements, whereas inferential statistics involves generalising beyond the given data to
some larger potential set of measurement.
Descriptive statistics were calculated for each variable in the study. In the case of categorical
data, for example, this involved the calculation of the frequency distribution of the responses
to each categorical scaled question. A frequency distribution shows in absolute or relative
(percentage) terms, how often the different values of a variable are found among the
respondents. In the current study, biographical data such as race and gender are examples of
variables that are presented using frequency distribution data.
The measures of central or average tendency are the mean and variance. Although they both
measure optimised sets of scores, they do so in different ways. According to Kerlinger and Lee
(2000), the mean expresses the general level and is representative of the level of a group’s
characteristics or performance.
The variance is a measure of dispersion of the set of scores in that it indicates how much the
scores are spread out. In other words, the variance describes the extent to which the scores
differ from one another. For descriptive purposes, the square root of the variance is used. This
is referred to as the standard deviation (SD) (Kerlinger & Lee, 2000).
In the cases where scales were used in the various tests, the descriptive statistics that were
most appropriate were means and standard deviations.
4.5.3 Inferential statistics
The inferential statistical techniques used in the study are discussed below in more detail.
Inferential statistics is the area of statistics described by Howitt and Cramer (2000) as using
sample scores to make general statements or draw general conclusions that apply well
beyond the sample being used in the research.
The basic inferential techniques used in this study were analysis of variance (ANOVA),
correlation and regression analysis.

144
4.5.3.1 ANOVA
In general, the purpose of ANOVA is to test the statistical significance of differences between
means (Clayton, 1984). In the present study, the four race groups were compared with respect
to their mean scores on the various tests used in phases 1 and 2. For this purpose, the
ANOVA procedure (Kerlinger, 1986) was used to examine the effect of the various variables,
for instance, race and gender on the successful completion of the cadet pilot training
programme.
According to Kerlinger (1986), unfortunately tests of statistical significance such as the t- and
F-tests do not indicate the magnitude or strength of relations. An F-test, if significant, simply
says that a difference exists. When the F-test in the ANOVA proves significant at, say, the 0.05
level, the researcher knows that there are statistically significant differences between the
groups (e.g. race groups) as far as the dependent variable (which would be one of the
psychometric tests performed) is concerned. However, this is often merely saying that the
groups are different with respect to their mean scores, and it is still not known which pairs of
groups (of the possible pairings of groups) are different in respect of their mean scores.
For this purpose, when the overall F-test of the ANOVA is significant, a so-called “post-hoc
test” procedure is applied in order to test which pairwise group differences are significant. The
procedure used in the present study is the Scheffé test (Glass & Stanley, 1984).
Furthermore, according to Kerlinger (1986), the Scheffé test, if used with discretion, is a
general method that can be applied to all comparisons of means after an analysis of variance.
The main point is that post-hoc comparisons and tests of means can be conducted mainly for
exploratory and interpretative purposes, as is the case in the current study.
4.5.3.2 Correlation analysis
The specific aim of this study was to evaluate the predictive validity of the psychological test
battery used in the selection of cadet pilots as a predictor of success in the training
programme. In other words, the aim was to determine if there is a relationship between the
results of the psychological tests used and the final flying school results.

145
Another specific aim of this research was to investigate whether the English Matric symbol,
literacy and the ABET levels correlated with performance in the final flying school examination
results for the different race and gender groups.
According to Shaughnessy (2000), a correlation exists when two different measures vary
together - that is, when the scores on one variable co-vary with scores on another variable.
The correlation coefficient measures the strength of the linear relationship between variables.
The value of the correlation coefficient ranges from –1 (for a perfect negative correlation) to +1
for a perfect positive correlation. One of the most frequently used measures of correlation is
the Pearson product-moment correlation (r).
A positive correlation between two variables means that as the scores on one of the variables
increase, the scores on the other variable also tend to increase. If the correlation is negative,
however, say, -0.5, then the higher a person’s score on one variable, the lower his/her score is
likely to be on the other variable.
In the current study, the effect size indexes of about 0.10 will be considered small,
correlations of 0.30 moderately large and correlations of about 0.50 large (Cohen, 1992).
These parameters are set to guide the interpretation and drawing of inferences from the
results of the research.
Miles and Banyard (2007) asserted that a correlation is both a descriptive and an inferential
statistic.
The correlations in the current research were calculated to determine the relationships
between the psychological tests utilised in both phases 1 and 2 and the final flying school
results.
4.5.3.3 Regression analysis
According to Howitt and Cramer (2003), regression, like correlation coefficient, describes
important features of a scattergram relating two variables, but allows the researcher to make
predictions. In the current study, the stepwise regression analysis was conducted to examine

146
the separate effects of two or more predictors on the criteria (Tredoux & Durrheim, 2002). The
effects of the various psychological tests on performance on the different modules of the flying
school were investigated.
.
4.5.4 Statistical techniques used
The statistical techniques used in this research are presented in this section. The following two
options were considered:
(1) Variables measured on an interval scale. In such cases, the Pearson product
moment correlation coefficient (Kerlinger, 1986) is calculated as a measure of the
linear relationship between the different variables.
In the current study, the hypotheses were mostly about positive correlations between
tests and performance in the cadet pilot training programme. Tests scores were all
interval measurements and the Pearson correlation coefficient was used. According to
Howitt and Cramer (2003, p. 52), “it is more convenient to have the main features of
the scattergram expressed as a single numerical index – the correlation coefficient”.
The correlation coefficient helps to present the research finding more concisely,
particularly when several variables are involved and they are considered a basic
descriptive statistic. Therefore, owing to the number of variables in the current
research, it was deemed appropriate to calculate the Pearson correlation coefficient to
determine the relationships between the various dependent and independent variables.
According to Howitt and Cramer (2003), the correlation coefficient consists of the following two
parts:
a positive or negative sign
any numerical value in the range of 0.00 to 1.00
Based on the numerical value and the sample size, the statistical significance determines the
interpretation of results in terms of the testing of the hypothesis in research.
(2) One variable categorical and another measured on an interval scale. In such
cases, the ANOVA technique was used to identify whether significant differences

147
between the categorical groups existed and a post-hoc Scheffe test was used to
identify the exact groups that differ from one another.
Examples in the current study refer to differences between the scores of different race groups
(categorical variable) on the test scores (interval variables).
4.5.5 Level of statistical significance
According to Field (2005), there are two possibilities in the real world (the actual population):
(1) In reality, there is an effect in the population.
(2) There is no effect in the population.
Breakwell, Hammond and Fife-Schaw (2000) explained that statistical significance tests begin
with the supposition that the null hypothesis is true. However, the null hypothesis always
assumes that there is not a difference in means. More specifically, the null hypothesis states
that there is no difference between, say, two mean scores or no real relationship between
variables in the population. The alternative hypothesis, however, states that there is a real
difference or relationship.
The probability of obtaining the observed data if the null hypothesis is true is therefore
calculated during most inferential tests (such as ANOVA and correlation analysis). If the
probability is small (say, 0.05), it is unlikely that the null hypothesis is true, and one could
therefore conclude that the null hypothesis is false.
There is always a chance that the researcher might be wrong in his/her decision. According to
Tredoux and Durrheim (2002), using samples to estimate population parameters always yields
uncertain results. If the researcher rejects the null hypothesis and concludes that the
population means are not equal, when in fact they are in the real population, then a type I
error was made. A type I error therefore occurs when a researcher rejects a null hypothesis,
that is, H0, when it is true. However, a type II error occurs when H0 is false, but the conclusion
made is that H0, is true. Generally, a type II error is represented by β (beta).
Conventionally, most researchers use the significance levels of 0.05 and 0.01. These are small
values because the researcher wishes to be sure before he/she comes forward with a

148
significant result. The intention is to limit the risk of committing a type I error. One would rather
run the risk of missing a significant result than erroneously producing one.
In the current study, a significance level of 0.05 was used. This view was supported by
Kerlinger (1986) in this statement that the 0.05 level is still used by researchers because it is
considered to be a reasonably sound gamble. It is neither too high nor too low for most social
scientific research. However, the researcher will not focus on statistical significance only but
also note the actual size of the results such as the size of the correlations.
4.5.6 Practical effect size
Leong and Austin (2006) emphasised the need to extend research beyond the
significant/nonsignificant dichotomy. They also cited other authors such as Cohen (1992) in
support of this. These authors feel that it is important not to limit all research to studies whose
results will hinge on a significant test and that a valuable contribution to theory should not be
hindered by the pervading acceptance of the p < 0.05 requirement.
While there are various methods of calculating the effect size, in the current study, the GLM
procedure of the statistical package SPSS was used to calculate the ANOVA, which also
calculates and presents the so-called “partial squared eta values” which were used as an
indication of the practical effect size (Pierce, Block & Aguinis, 2004). According to them (2004,
p. 918), partial eta squared is described as the “proportion of the total variation attributable to
the factor, partialling out (excluding) other factors from the total non-error variation” and is
normally higher than eta squared.
In the current research, partial eta squared was calculated for each race group for the
psychological tests utilised in phase 1. The results will be provided in tables 5.9 to 5.15.
The generally accepted regression benchmark for effect size comes from (Cohen, 1992): 0.20
is a minimal solution (but significant in social science research); 0.50 indicates medium effect;
and anything equal to or greater than 0.80 is considered to be a large effect size (Cohen,
1992).
The regression analysis, helps to make predictions about the relationship between the
variables, was calculated. The aim of the research was to also determine what psychological

149
tests would predict successful completion of the cadet pilot programme using the final flying
school results as criteria.
However, Cohen (1992) acknowledged the danger of using terms like ”small”, ”medium” and
”large” out of context. Glass and Stanley (1994) were particularly critical of this approach,
arguing that the effectiveness of a particular intervention can only be interpreted in relation to
other interventions that seek to produce the same effect.
4.6 RESEARCH HYPOTHESES
The specific aims of the current research were discussed in chapter 1 (see section 1.4). The
research hypotheses are discussed below.
Mouton and Marais (1990) discussed the obvious use of hypotheses in quantitatively oriented
research, and indicated the following requirements for a hypothesis:
It should be stated explicitly, at least in the form of a research question.
It should be formulated beforehand.
It should be possible to reject it.
Quantitative researchers are far more concerned with ensuring that the hypotheses have been
formulated before embarking on the investigation (Mouton & Marais, 1990). Hence in the
current study, the hypotheses set out below, were formulated to cover the objectives of the
empirical study. The hypotheses were aligned to the quantitative-oriented research as outlined
above.
4.6.1 Hypotheses regarding the predictive validity of each psychological test in phase 1
of the selection for performance in a cadet pilot training programme
The following hypotheses were formulated on the predictive validity of the psychological tests
for performance in the flying school final examination results in a cadet pilot training
programme:

150
H11: Raven’s Progressive Matrices scores correlate statistically significantly and positively
with the flying school final examination results.
H21: The Blox Test scores correlate statistically significantly and positively with the flying
school final examination results.
H31: The scores for reading comprehension in the Intermediate Test Battery correlate
statistically significantly and positively with the flying school final examination results.
H41: The arithmetic (parts 1 and 2) subtest scores correlate statistically significantly and
positively with the flying school final examination results.
H51: The literacy level scores of the ELSA scores correlate statistically significantly and
positively with the flying school final examination results.
H61: The ABET level scores of the ELSA correlate statistically significantly and positively
with the flying school final examination results.
H71: The Matric English symbol scores correlate statistically significantly and positively
with the flying school final examination results.
4.6.2 Hypotheses regarding the predictive validity of each psychological subtest in
phase 2 of the selection for performance in a cadet pilot training programme
Hypotheses were formulated on the predictive validity of each psychological test in phase 2 of
the selection for performance in the flying school final examination results in a cadet pilot
training programme.
H81: The comprehension subtest of the WAIS scores correlates statistically significantly
and positively with the flying school final examination results.
H91: The arithmetic subtest of the WAIS scores correlates statistically significantly and
positively with the flying school final examination results.
H101: The digit forward subtest of the WAIS scores correlates statistically significantly and
positively with the flying school final examination results.
H111: The digit backward subtest of the WAIS scores correlates statistically significantly
and positively with the flying school final examination results.
H121: The digit combine subtest of the WAIS scores correlates statistically significantly and
positively with the flying school final examination results.

151
H131: The similarity subtest of the WAIS scores correlates statistically significantly and
positively with the flying school final examination results.
H141: The picture completion subtest of the WAIS scores correlates statistically
significantly and positively with the flying school final examination results,
H151: The object assembly subtest of the WAIS scores correlates statistically significantly
and positively with the flying school final examination results.
H161: The block subtest of the WAIS scores correlates statistically significantly and
positively with the flying school final examination results.
H171: The digit ’90 subtest of the WAIS scores correlates statistically significantly and
positively with the flying school final examination results.
H181: The picture Arrangement subtest scores of the WAIS correlate statistically
significantly and positively with the flying school final examination results.
4.7 CHAPTER SUMMARY
This chapter dealt with the empirical study. This involved a discussion of the population and
sample, the measuring instruments used, the objectives of the study in terms of the predictor
and criterion variables and the gathering and statistical processing of the data for the various
techniques that were used to determine the predictive validity of each of the psychological
tests.
The chapter concluded by formulating the research hypotheses relating to the validity of each
of the psychological tests used to predict performance in a cadet pilot training programme.
Chapter 5 will discuss the research findings and interpret the results of the data analysis.

152
CHAPTER 5
THE RESEARCH RESULTS 5.1 INTRODUCTION In this chapter the results of the empirical study are discussed. The objective of the
research was to determine which of the variables that were used significantly predict
successful completion of the cadet pilot training programme.
The results below first indicate the performance in psychological tests during the initial
phase (phase 1), split by race and gender. In the next section then the performance in
the tests used in phase 2 are discussed, with a look at differences between the race
groups.
In the last section, the relationships and performance in the first and second phase tests
are discussed. Correlations between the first and second phase tests as well as the
performance of the respondents in the cadet pilot training programme are presented.
Regression analysis is used to predict performance in the modules of the cadet training
programme.
5.2 RESULTS OF THE PSYCHOMETRIC TESTS IN PHASE 1: COMPARISON
BETWEEN THE RACE AND GENDER GROUPS
In this section, the descriptive statistics for the sample on the independent variable in
phase 1 are presented in table 5.1.
Secondly, the scores for the males and females and for the different race groups were
examined and an ANOVA procedure performed to determine whether there were any
statistically significant differences between the race and gender groups in the test scores
in phase 1.
It was previously reported that the total sample consisted of 2 238 applicants who had
met the minimum criteria in terms of the information on the application forms, namely
Matric certificate, Science, Maths and English as their subjects, and an indication of their

153
race and gender and South African citizenship. The race and gender of the applicants
were noted but not considered during the selection process except for comparison of
subgroups.
Table 5.1 shows the number of applicants per race group. Blacks had the highest
number of applicants (n = 1 334), followed by whites. In terms of the purpose of the
cadet pilot training programme, which was to improve diversity in the workforce, it can be
inferred that overall, EE requirements were achieved in that the previously
disadvantaged population groups were well represented. However, the distribution per
race group was disproportionate in that there were significantly more white applicants
than coloureds and Asians. The mean scores indicate that blacks scored lower in all the
tests, in comparison with the other race groups, while the white applicants scored the
highest.
In Wheeler’s (1993) study on apprentices in a mining industry, he found a significant
difference in means between the black and white groups on all the predictors, that is, the
mental alertness test (t = 4.39, p < 0.001) and the Blox Test (t = 7.68,p < 0.001), which
led the researcher to conclude that the mean scores indicated that on average, the black
apprentices tended to achieve lower scores on the predictors. In Wheeler’s (1993)
research, the blacks generally scored between a half to one standard deviation lower
than their white counterparts in these tests.
A similar trend was evident in the current study (table 5.1), where the blacks achieved
almost similar values, with the exception of Raven’s Test where they scored three
standard deviations above their counterparts, while the coloureds and blacks scored
between a half to one standard deviation lower than the Asians and whites, in the Blox
Text, and the reading comprehension and arithmetic 1 tests.
In a study conducted by Freedman (2000, p. 83) using Raven’s SPM, in the mining
industry, it was reported that “given that the maximum score obtained on Raven’s SPM
is 60, a score of 40, 45 on this test for a given respondent may be expected to vary
between 35, 06 and 45.84”. Freedman (2000) concluded that Raven’s SPM remains a
reasonable predictor of literacy and numeracy performance and should be retained as a
screening test for selection in a training programme.

154
5.2.1 Results of the tests per race group on the independent variables
Table 5.1
Descriptive statistics for the psychometric tests in phase 1
TESTS RACE Mean Std. deviation
N
Raven’s
Black 44.4 9.368 1334 Coloured 51.1 5.341 122 Asian 52.4 4.530 258 White 55.1 3.436 524 Total 48.2 9.010 2 238
Blox
Black 24.4 6.700 1334 Coloured 29.8 6.171 122 Asian 30.8 5.797 258 White 35.0 4.783 524 Total 27.9 7.644 2 238
Reading comprehension
Black 7.2 3.284 1334
Coloured 11.9 3.112 122
Asian 12.9 2.863 258
White 14.3 2.911 524
Total 9.8 4.485 2 238
Arith- metic 1
Black 14.6 4.534 1334 Coloured 18.5 3.975 122 Asian 20.4 3.590 258 White 20.5 3.764 524 Total 16.9 5.076 2 238
Arithmetic 2
Black 8.4 2.394 1 334
Coloured 11.0 2.443 122
Asian 12.5 2.234 258
White 12.7 2.061 524
Total 10.1 3.044 2 238

155
Figure 5.1 below plots these mean scores to present a graphic image of the scores.
Figure 5.1 shows that the whites performed better in all the tests, followed by the Asians,
the coloureds and the blacks.
Mean score per Race group per first fase psychometric
test
0.00
20.00
40.00
60.00
Mean
sco
re
RAV
Blox
RC
AR1
AR2
RAV 44.40 51.11 52.37 55.10
Blox 24.39 29.77 30.77 35.04
RC 7.16 11.89 12.94 14.28
AR1 14.57 18.54 20.40 20.53
AR2 8.45 10.98 12.49 12.74
Black Coloured Asian White
Figure 5.1. Mean score per race group for the psychometric tests in phase 1 A possible reason why the blacks scored lower than the other groups could be that most
of the tests were conducted in English. However, the Raven and Blox Tests are
regarded as nonverbal tests. It could be argued that no test is entirely nonverbal
primarily because the test instructions are normally explained verbally.
According to Nell (1999, p. 12), “it is by no means clear that home language
administration is the method of choice, since translating a test from English into the
subjects’ home language may block access to terms and concepts they have acquired
through the medium of the English language”.
Table 5.2 below indicates which differences are statistically significant as well as the
practical effect size (partial eta). If the partial eta is 0.01, a small effect size is indicated,

156
while 0.06 indicates a medium effect siza and 0.14 or higher a strong effect size (Cohen,
1992).
Table 5.2 ANOVA comparison of race groups in each of the tests
Dependent variable F Sig. Partial eta squared
Raven’s 280.6 .000 .274
Blox 399.6 .000 .349
Reading comprehension 772.6 .000 .509
Arithematic 1 327.4 .000 .305
Arithematic 2 556.1 .000 .428
The larger the sample size, the more likely it is that statistically significant results can be
obtained, and indeed, the race groups differed statistically significantly in all the tests.
The partial eta values, however, indicated large effect sizes (values close to 0.14 or
larger) and it may therefore be concluded that practically significant differences do exist.
The post-hoc tests were computed to determine between which race groups differences
exist. Tables 5.3 to 5.7 indicate these post-hoc tests.
In table 5.3, the coloureds’ and Asians’ performance in Raven’s test was more or less
the same, with the whites performing moderately better then the coloureds and Asians.
The blacks performed below the other race groups in this test.

157
Table 5.3 Scheffé subsets of race group on Raven’s Test
RACE
N
Subset
1 2 3
Blacks 1334 44.4033
Coloureds 122 51.1066
Asians 258 52.3721
Whites 524
55.0992
Rushton et al. (2003) reported on a study conducted in 2000 at the University of
Witwatersrand in Johannesburg, where three separate studies were conducted using the
standard Raven’s Progressive Matrices. They found that the 198 African first-year
engineering students had an average IQ of 97, in contrast to the white students in the
three studies who had IQs ranging from 105 to 111; the Indian students had intermediate
IQs ranging from 102 to 106.
Table 5.4 indicates the performance on the Blox Test, with the coloureds and Asians
again on par (i.e. their performance was fairly similar), with the whites performing better
than the other race groups. Again the blacks were at the bottom end of the scale.
Table 5.4 Scheffé subsets of race group on the Blox Test
RACE
N
Subset 1 2 3
Blacks 1 334 24.3928
Coloureds 122 29.7705
Asians 258 30.7674
Whites 524 35.0363
Table 5.5 indicates the results of the four race groups based on their performance in the
reading comprehension test. The differences between these subgroups show that the
whites performed better, followed by the Asians, the coloureds and the blacks.

158
Table 5.5 Scheffé subsets of race group on the reading comprehension test
RACE
N
Subset
1 2 3 4
Blacks 1334 7.1589 Coloureds 122 11.8934
Asians 258 12.9419
Whites 524
14.2824
Tables 5.6 and 5.7, which show the participants’ performance in arithmetic 1 and 2
respectively, indicate that the Asian and whites subgroups had similar results in these
tests. The coloured subgroup performed better than the blacks in both tests.
Table 5.6 Scheffé subsets of race group in arithmetic 1
RACE
N
Subset
1 2 3
Blacks 1334 14.5750
Coloureds 122 18.5410
Asians 258 20.3992
Whites 524
20.5305
Table 5.7 Scheffé subsets of race group in Arithmetic 2
RACE
N
Subset
1 2 3
Blacks 1334 8.4453
Coloureds 122 10.9836
Asians 258 12.4922
Whites 524
12.7366
5.2.1.1 Summary
According to Howitt and Cramer (2000), if there is a significant difference between all the
groups, then one would have four separate culture groups each with only one group. In
other words, the tables above indicate that there were differences between the groups.

159
It appears that differences do exist between all the race groups in terms of the reading
comprehension test. In terms of the Raven and Blox Tests, the coloureds and the Asians
were generally on a par, whereas their scores differed from those of the blacks and
whites. In arithmetic 1 and 2, the white and Asian respondents performed similarly, but
their scores differed from those of the blacks and coloureds, who in turn, also differed
from one another.
Six studies in sub-Saharan Africa supported Spearman’s (1927) hypothesis that
black/white IQ differences are mainly on g, the general factor of intelligence (Rushton et
al. (2003). These authors reported on analysed item data by Rushton in 2000 from 40
000 high school students in South Africa with regard to the Standard Progressive
Matrices published by Owen (1992) and found that the four-way African-coloured-
Indian-white mean differences were all on g.
5.2.2 Results for the tests by gender (within race)
The differences between the males and females in these tests are compared below for
each of the race groups. First gender is compared for the black race group. The mean
scores in table 5.8 below indicate that the males scored higher in the Raven and Blox
Tests, with the means equal to 44.49 and 24.81 respectively, while the females scored
higher in the reading comprehension test, with a mean of 8.06. The scores in the
arithmetic tests were virtually identical.

160
5.2.2.1 Blacks Table 5.8 Descriptive statistics for gender among blacks on the independent variables
Variable Gender Mean Std. deviation N
Raven’s
Male 44.49 9.344 1 171
Female 43.81 9.550 163
Total 44.40 9.368 1 334
Blox
Male 24.81 6.684 1 171
Female 21.37 6.019 163
Total 24.39 6.700 1 334
Reading Comprehension
Male 7.03 3.217 1 171
Female 8.06 3.612 163
Total 7.16 3.284 1 334
Arithmetic 1
Male 14.57 4.571 1 171
Female 14.59 4.267 163
Total 14.58 4.534 1 334
Arithmetic 2
Male 8.47 2.391 1 171
Female 8.28 2.418 163
Total 8.45 2.394 1 334
To test whether the differences observed in the table above are statistically significant an
ANOVA was performed, with the results indicated in table 5.9 below. Although the
females performed significantly lower on the Blox Test (p = 0.000), the practical effect
size was small (close to 0.01). In the case of reading comprehension, the females
actually performed better than the males, but again the practical effect size was small.

161
Table 5.9 ANOVA comparison of the black gender groups
Variable F Sig. Partial eta squared
Raven’s .745 .388 .001
Blox 38.9 .000 .028
Reading comprehension 14.1 .000 .011
Arithmetic 1 .002 .966 .000
Arithmetic 2 .861 .354 .001
Although statistically significant differences were found for the Blox Test and reading
comprehension results, the effect size results indicate that these differences were not
practically significant, showing small effect size (eta = 0.028, p < 0.000 and eta = 0.011,
p < 0000) respectively. While there were no real differences between the results of the
black males and females in these tests, no black females managed to advance to phase
2.
Considering the mean scores for the black males and females (see table 5.8), and the
fact that the females performed significantly higher in reading comprehension, while the
males performed significantly higher in the Blox, it was surprising that no black females
were able to advance to phase 2. This outcome merits further investigation.
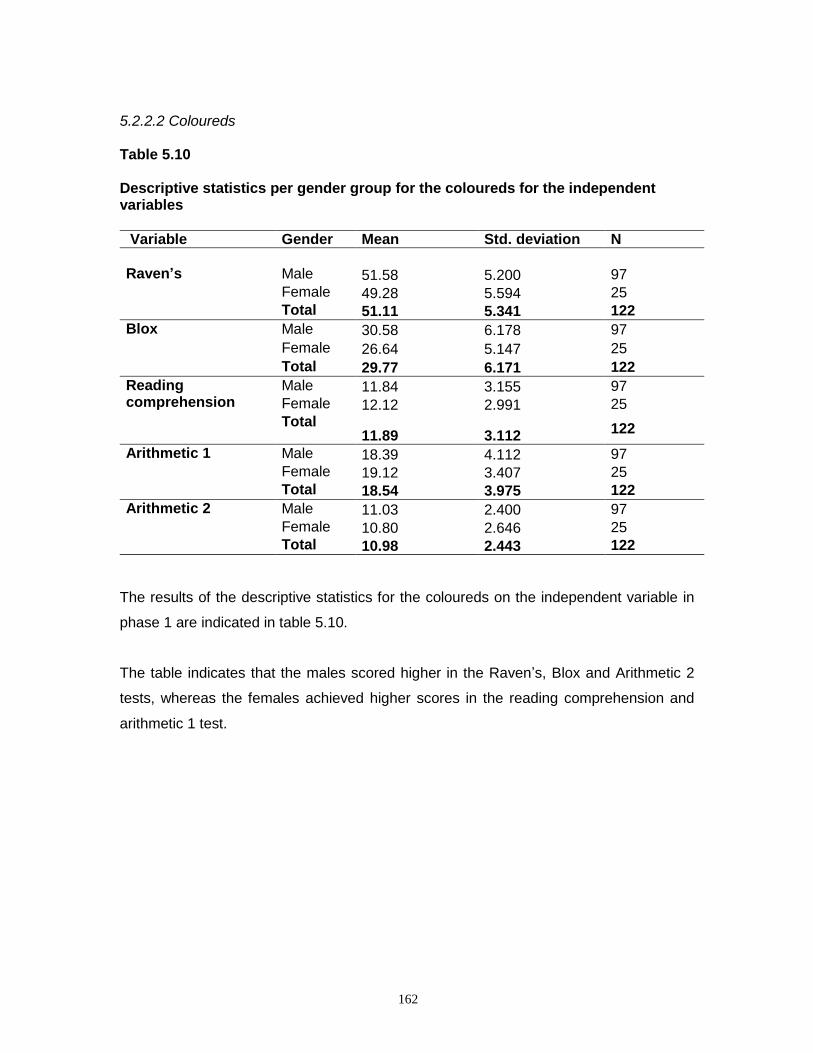
162
5.2.2.2 Coloureds Table 5.10 Descriptive statistics per gender group for the coloureds for the independent variables
Variable Gender Mean Std. deviation N
Raven’s
Male 51.58 5.200 97
Female 49.28 5.594 25
Total 51.11 5.341 122
Blox
Male 30.58 6.178 97
Female 26.64 5.147 25
Total 29.77 6.171 122
Reading comprehension
Male 11.84 3.155 97
Female 12.12 2.991 25
Total 11.89 3.112
122
Arithmetic 1
Male 18.39 4.112 97
Female 19.12 3.407 25
Total 18.54 3.975 122
Arithmetic 2
Male 11.03 2.400 97
Female 10.80 2.646 25
Total 10.98 2.443 122
The results of the descriptive statistics for the coloureds on the independent variable in
phase 1 are indicated in table 5.10.
The table indicates that the males scored higher in the Raven’s, Blox and Arithmetic 2
tests, whereas the females achieved higher scores in the reading comprehension and
arithmetic 1 test.

163
Table 5.11 ANOVA comparison of the coloured gender groups
Variable F Sig. Partial eta squared
Raven’s 3.761 .055 .030
Blox 8.600 .004 .067
Reading comprehension
.166 .685 .001
Arithmetic 1 .665 .416 .006
Arithmetic 2 .176 .675 .001
It is only in the Blox Test that the coloured males performed statistically significantly
better than the females. The practical effect size was of medium strength (eta = 0.067,
p<0.005).

164
5.2.2.3 Asians Table 5.12 Descriptive statistics per Asian gender group for the independent variables
Variable Gender Mean Std. deviation N
Raven’s
Male 52.58 4.349 212
Female 51.29 5.221 45
Total 52.35 4.530
257
Blox
Male 31.53 5.441 212
Female 27.11 6.132 45
Total 30.75 5.805 257
Reading comprehension
Male 12.85 2.739 212
Female 13.44 3.354 45
Total 12.96 2.858 257
Arithmetic 1
Male 20.66 3.586 212
Female 19.36 3.304 45
Total 20.43 3.567 257
Arithmetic 2
Male 12.75 2.187 212
Female 11.33 2.056 45
Total 12.51 2.228 257
The mean scores indicate that the results of the females and males in this group
were similar, with the exception of the Blox Test, where the males scored better
than the females.

165
Table 5.13 ANOVA comparison of the Asian gender groups
Variable F Sig. Partial eta squared
Raven’s
3.041 .082 .012
Blox 23.375 .000 .084
Reading comprehension 1.590 .209 .006
Arithmetic 1 5.009 .026 .019
Arithmetic 2 16.000 .000 .059
Once again, the Asian females performed significantly lower on the Blox Test compared
with the Asian males’ medium to strong practical effect size (eta = 0.084, p = 0,000). The
Asian females also achieved lower scores in arithmetic 2 (eta = 0. 059, p = 0.000) with
medium practical effect size.

166
5.2.2.4 Whites Table 5.14 Descriptive statistics per white gender group for the independent variables
Variable Gender Mean Std. deviation N
Raven’s
Male 55.2 3.41 402
Female 54.8 3.50 122
Total 55.1 3.44 524
Blox
Male 35.9 4.41 402
Female 32.2 4.90 122
Total 35.0 4.78 524
Reading comprehension
Male 14.1 2.90 402
Female 14.9 2.88 122
Total 14.3 2.91 524
Arithmetic 1
Male 20.6 3.82 402
Female 20.5 3.58 122
Total 20.5 3.76 524
Arithmetic 2
Male 12.8 2.09 402
Female 12.5 1.94 122
Total 12.7 2.06 524
Table 5.14 indicates that the scores on the independent variables were markedly similar
in all the tests, with the exception of the Blox Test, where the males had higher scores
than the females ( mean = 35.9 and SD = 4.41).

167
Table 5.15 ANOVA comparison of the White gender groups
Variable F Sig. Partial eta squared
Raven’s 1.315 .252 .003
Blox 62.242 .000 .107
Reading comprehension 6.338 .012 .012
Arithmetic 1 .057 .811 .000
Arithmetic 2 1.957 .162 .004
The white females performed significantly lower on the Blox Test (p = 0.000). The
practical effect size was medium to large (eta = 0.107). This indicates that the white
females outperformed the white males in the reading comprehension test (with p =
0.012). However, the practical effect size was small (eta = 0.012).
5.2.2.5 Summary of descriptive results
The black males and females showed statistically significant and practical significance
effect size differences between the tests, and there were generally few large differences
(large eta) between the gender groups in the different race groups.
It would appear, however, that the male respondents generally outperformed the
females in the Blox Test, but the opposite applied in the the reading comprehension test.
5.2.3 RELATIONSHIPS BETWEEN PSYCHOMETRIC TESTS (PHASE 1)
To determine whether there was a relationship between the results of the respondents in
the different tests, a correlation matrix was performed between all the five tests in first
phase. Table 5.16 depicts the correlation matrix.

168
Table 5.16 Correlation matrix of the tests in phase 1
Variable Raven’s Blox
Reading comprehen sion
Arithmetic 1
Arithmetic2
Correlation
Raven’s 1.000 .648* .554* .510* .585*
Blox .648* 1.000 .556* .479* .568* Reading Comprehension
.554* .556* 1.000 .569* .643*
Arithmetic 1 .510* .479* .569* 1.000 .701* Arithmetic 2 .585* .568* .643* .701* 1.000
*p < 0.05
All significance values (p-values) were higher than 0.05, indicating statistically highly
significant results. It can be concluded that all the tests correlates statistically highly
significantly with one another. The Pearson r (correlation coefficient) showed a large
effect size, indicating positive strong relationships.
All the correlations were positive, which indicates that the higher a respondent’s scored
in one test, the higher he/she was likely to score in the other tests as well, and vice
versa.
5.3 THE RESULTS OF THE PSYCHOMETRIC SUBTESTS DURING PHASE 2:
COMPARISON OF RACE GROUPS
The mean scores on each subtest of the WAIS (tests performed during phase 2) as well
as Matric performance in English (symbol), literacy and ABET levels are presented
below for each of the race groups.
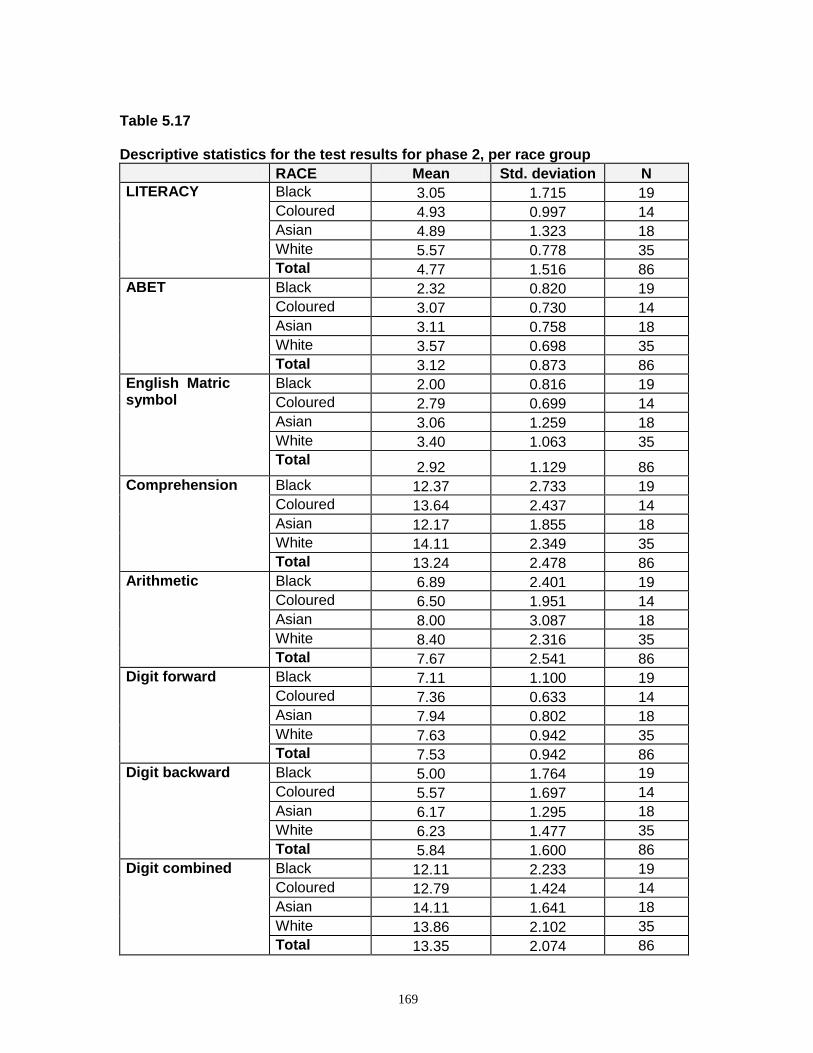
169
Table 5.17 Descriptive statistics for the test results for phase 2, per race group
RACE Mean Std. deviation N
LITERACY
Black 3.05 1.715 19
Coloured 4.93 0.997 14
Asian 4.89 1.323 18
White 5.57 0.778 35
Total 4.77 1.516 86
ABET
Black 2.32 0.820 19
Coloured 3.07 0.730 14
Asian 3.11 0.758 18
White 3.57 0.698 35
Total 3.12 0.873 86
English Matric symbol
Black 2.00 0.816 19
Coloured 2.79 0.699 14
Asian 3.06 1.259 18
White 3.40 1.063 35
Total 2.92 1.129 86
Comprehension
Black 12.37 2.733 19
Coloured 13.64 2.437 14
Asian 12.17 1.855 18
White 14.11 2.349 35
Total 13.24 2.478 86
Arithmetic
Black 6.89 2.401 19
Coloured 6.50 1.951 14
Asian 8.00 3.087 18
White 8.40 2.316 35
Total 7.67 2.541 86
Digit forward
Black 7.11 1.100 19
Coloured 7.36 0.633 14
Asian 7.94 0.802 18
White 7.63 0.942 35
Total 7.53 0.942 86
Digit backward
Black 5.00 1.764 19
Coloured 5.57 1.697 14
Asian 6.17 1.295 18
White 6.23 1.477 35
Total 5.84 1.600 86
Digit combined
Black 12.11 2.233 19
Coloured 12.79 1.424 14
Asian 14.11 1.641 18
White 13.86 2.102 35
Total 13.35 2.074 86

170
RACE Mean Std. deviation N
Similarities
Black 17.37 2.948 19
Coloured 18.71 1.978 14
Asian 17.78 1.865 18
White 17.71 2.527 35
Total 17.81 2.423 86
Picture completion
Black 12.95 1.471 19
Coloured 13.86 0.949 14
Asian 13.83 1.295 18
White 14.06 0.906 35
Total 13.73 1.202 86
Object assembly
Black 17.53 3.502 19
Coloured 18.50 1.605 14
Asian 17.00 2.828 18
White 20.31 2.958 35
Total 18.71 3.177 86
Block design
Black 29.74 5.645 19
Coloured 30.71 3.688 14
Asian 30.50 5.904 18
White 36.40 3.790 35
Total 32.77 5.551 86
Digit 90
Black 57.42 8.002 19
Coloured 59.71 9.352 14
Asian 59.50 10.107 18
White 61.03 10.340 35
Total 59.70 9.593 86
Picture arrangement
Black 12.74 3.588 19
Coloured 15.07 3.605 14
Asian 14.83 2.895 18
White 14.91 3.373 35
Total 14.44 3.432 86

171
Table 5.17 indicates the differences between the different race groups. The standard
deviation of the blacks was between half and two below the total group standard
deviation in all the subtests.
An ANOVA was performed to establish which differences were of importance from a
statistical and practical effect size perspective.
The results of this analysis are presented below in table 5.18.
Table 5.18 Tests of between-subjects’ effects per test between race groups
Variable F Sig. Partial eta squared
LITERACY 18.608 .000* .405
ABET 11.717 .000* .300
Matric English symbol 8.075 .000* .228
Comprehension 3.834 .013* .123
Arithmetic 2.812 .044* .093
Digit forward 2.919 .039* .097
Digit backward 3.014 .035* .099
Digit combined 4.668 .005* .146
Similarities .876 .457 .031
Picture completion 4.035 .010* .129
Object assembly 6.754 .000* .198
Block design 11.759 .000* .301
Digit 90 .575 .633 .021
Picture arrangement 2.097 .107 .071
*p < 0.05;

172
There were statistically significant differences between the race groups in most of the
tests, with the partial eta squared values indicating medium to very large differences
between the race groups. The exceptions were the tests “Similarity”, “Digit 90” and
“Picture arrangement”, although even for these tests, a slightly larger than small effect
size was obtained.
The post-hoc Scheffé test indicated significant differences for the tests items with bullets
below.
Literacy (eta = 0.405). The post-hoc Scheffé results identified the homogeneous
subsets indicated in table 5.19.
Table 5.19 depicts the correlations between the race groups in terms of the scores for
the literacy independent variable.
Table 5.19 Scheffé test results for level of literacy
RACE
N
Subset
1 2
Black 19 3.0526
Asian 18 4.8889
Coloured 14 4.9286
White 35 5.5714
The results show that the level of literacy of the blacks was generally lower than that of
the other three race groups. The remaining three race groups did not differ statistically
significantly from one another.
ABET levels (eta squared = 0.300). The post-hoc Scheffé results identified the
homogeneous subsets shown in table 5.20. In other words, the scores for the
coloureds, Asians and whites were similar in terms of ABET levels, whilst those
for the blacks were below the other race groups.

173
Table 5.20 Scheffé results for the ABET levels
RACE
N
Subset
1 2
Black 19 2.3158
Coloured 14 3.0714
Asian 18 3.1111
White 35 3.5714
The results indicate that the blacks’ ABET levels were generally lower than those of the
other three race groups. The other three race groups did not differ statistically
significantly from one another.
Matric English symbol (eta squared = 0.228). The post-hoc Scheffé results
identified the homogeneous subsets indicated in table 5.21 below.
Table 5.21 Scheffé results for the Matric English symbol
RACE
N
Subset
1 2
Black 19 2.00
Coloured 14 2.79
Asian 18 3.06
White 35 3.40
The blacks performed at a lower level in Matric English, while statistically, the coloureds,
Asians and whites did perform significantly differently from one another.
This could be symptomatic of the different education systems that were in place for the
various race groups prior to 1994.
Digits combined (eta squared = 0.146)

174
Table 5.22 Scheffé results for digits combined
RACE
N
Subset
1 2
Black 19 12.1053
Coloured 14 12.7857
Asian 18 14.1111
White 35 13.8571
The significant difference here was between the blacks (who scored lowest for digits
combined) and the Asians who scored highest. While the scores for the blacks and
coloureds were similar, they were, however, statistically significantly different.
Picture completion (eta squared = 0.129)
Table 5.23 Scheffé results for picture completion
RACE
N
Subset
1 2
Black 19 12.9474
Coloured 14 13.8571 Asian 18 13.8333 White 35 14.0571
The blacks scored significantly lower than the whites, coloureds and Asians, whose
scores did not differ statistically significantly from one another. The coloureds and
Asians scored the highest and second highest respectively in this test, with a small
difference between the two subgroups.
Object assembly (eta squared = 0.198)

175
Table 5.24 Scheffé results for object assembly
RACE
N
Subset
1 2
Black 19 17.5263
Coloured 14 18.5000
Asian 18 17.0000
White 35 20.3143
The Asians scored lowest in this test and significantly lower than the whites. Although
other differences were not statistically significant, it is interesting to note that the
coloureds scored second highest, followed by the blacks who, in turn, outperformed the
Asians.
Block design (eta squared = 0.198) Table 5.25 Scheffé results for block design
RACE
N
Subset
1 2
Black Coloured
19 14
29.7368 30.7143
Asian 18 30.5000
White 35 36.4000
The whites scored significantly higher in this test than the other race groups. However,
the other race groups did not differ statistically significantly from one another.
5.4 SUMMARY OF THE COMPARISON OF THE SUBGROUP RESULTS
The white respondents generally performed better in most of the tests except for digits.
The Asians did best in this test. The differences, between these two groups, however,
were not statistically significant.

176
Although the black respondents generally performed poorest on most of the tests, there
were exceptions. For instance, they outperformed the Asian respondents in the object
assembly test (although not significantly so). Furthermore, they also did not perform
significantly worse than the coloured and white respondents in the digit test or
significantly worse than the coloured and Asian respondents in the picture completion
and block design tests.
Nell (1999) reported on preliminary data collected by Unisa’s Health Psychology unit for
157 black South Africans with less than 12 years’ education. Those in long-standing
employment in a sophisticated environment, scored between about one and two
standard deviations below the US WAIS–R norms using the digit symbol, block design,
digit span (forward and backward) and arithmetic subtests.
Nell (1999) also reported on research conducted on university undergraduates which
showed that these undergraduates were one standard deviation below the US age
norms on the first three subtests of the verbal scale and on block design; nonsignificantly
below the norm on digit span and similarities; and more than a standard deviation below
the norm on picture completion, picture arrangement and object assembly.
5.5 CORRELATION OF PHASE 1 AND PHASE 2 RESULTS WITH
PERFORMANCE IN THE CADET PILOT TRAINING PROGRAMME
It is pertinent to mention at this stage that it is the final results achieved at the flying
school and obtaining the Commercial Pilot Licence that actually determines the final
successful outcome. The following questions can be asked about each respondent’s
performance in the cadet pilot training programme:
Do the candidates’ test scores obtained in the first phase of selection show
statistically significant positive correlations with their performance in the cadet
pilot training programme?

177
Do the additional tests scores that became available in the second phase show
statistically significant positive correlations with their performance in the cadet
pilot training programme?
5.5.1 Correlation of phase 1 results with performance in the cadet pilot training
programme
One would normally conduct regression analyses with the performance in cadet pilot
training programme as a dependent variable. However, it is clear that the dynamics differ
from one race group to the next. If regression analyses were to be performed, they
would therefore have to be performed for each race group separately. Because the
sample sizes were too small for multiple regression analyses based on race groups, it
was decided to perform regression analyses and correlate the tests of the first and
second phases of the selection process with the performance in the cadet pilot training
programme on the total sample of 28 respondents. This sample represents all the
candidates who were finally selected for the actual training programme at the flying
school.
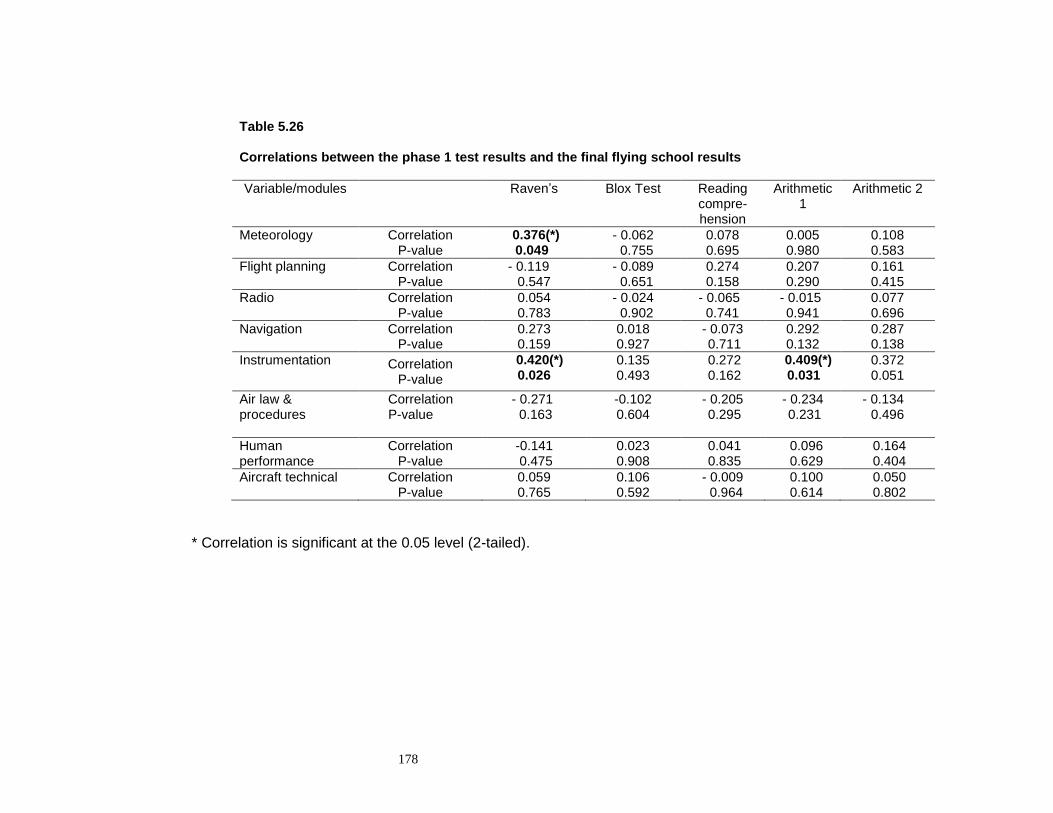
178
Table 5.26 Correlations between the phase 1 test results and the final flying school results
Variable/modules Raven’s Blox Test Reading compre-hension
Arithmetic 1
Arithmetic 2
Meteorology Correlation P-value
0.376(*) 0.049
- 0.062 0.755
0.078 0.695
0.005 0.980
0.108 0.583
Flight planning Correlation P-value
- 0.119 0.547
- 0.089 0.651
0.274 0.158
0.207 0.290
0.161 0.415
Radio Correlation P-value
0.054 0.783
- 0.024 0.902
- 0.065 0.741
- 0.015 0.941
0.077 0.696
Navigation Correlation P-value
0.273 0.159
0.018 0.927
- 0.073 0.711
0.292 0.132
0.287 0.138
Instrumentation Correlation P-value
0.420(*) 0.026
0.135 0.493
0.272 0.162
0.409(*) 0.031
0.372 0.051
Air law & procedures
Correlation P-value
- 0.271 0.163
-0.102 0.604
- 0.205 0.295
- 0.234 0.231
- 0.134 0.496
Human performance
Correlation P-value
-0.141 0.475
0.023 0.908
0.041 0.835
0.096 0.629
0.164 0.404
Aircraft technical Correlation P-value
0.059 0.765
0.106 0.592
- 0.009 0.964
0.100 0.614
0.050 0.802
* Correlation is significant at the 0.05 level (2-tailed).

179
Table 5.26 Correlations between the phase 1 test results and the final flying school results (continued)
Variable/modules ELSA ABET English language symbol
Matric symbol
Meteorology Correlation P-value
0.212 0.299
0.224 0.272
0.331 0.098
0.231 0.256
Flight planning Correlation P-value
0.234 0.250
0.129 0.531
0.208 0.307
0.133 0.517
Radio Correlation P-value
0.170 0.407
0.233 0.251
0.343 0.087
0.431(*) 0.028
Navigation Correlation P-value
0.448 (*) 0.022
0.473(*) 0.015
0.295 0.144
0.205 0.315
Instrumentation Correlation P-value
0.297 0.141
0.229 0.260
0.406(*) 0.040
0.282 0.163
Air law & procedures
Correlation P-value
0.035 0.867
0.037 0.859
- 0.186 0.363
- 0.077 0.709
Human performance
Correlation P-value
0.269 0.185
0.267 0.188
-0.092 0.655
0.090 0.663
Aircraft technical Correlation
P-value
0.317 0.114
0.267 0.188
0.377 0.057
0.304 0.131
* Correlation is significant at the 0.05 level (2-tailed).

180
Table 5.26 indicates that statistically significant positive correlations exist between
Raven’s (RPM) and two measures of the cadet pilot training modules, namely
meteorology and instrumentation. One other significant correlation was evident between
instrumentation and arithmetic 1 in the phase 1 psychometric results.
The following is a summary of the significant results of the correlation analysis:
The correlation between the RPM and the meteorology module of the flying school
results was statistically significant (r = 0.376; p < 0.05).
Also, the RPM showed a positive correlation with the instrumentation module of the
flying school results, which was statistically significant (r = 0.420; p < 0.05).
The arithmetic 1 subtest indicated a high correlation with the instrumentation module,
which was statistically significant (r = 0.409; p<0.05).
The results show a correlation of a medium to large effect size. However, in terms of
statistical significance, two correlations reached statistical significance at the 0.05 level,
namely the correlation between Raven’s test and meteorology and instrumentation and
between arithmetic 1 and instrumentation.
The following are possible explanations for the correlations or the lack thereof:
Raven’s Progressive Matrices test measures an individual’s general intelligence -
hence an individual who identifies a theme in terms of a response to the test items
obtains a high score. The results of the RPM indicated a positive correlation with
meteorology, radio, navigation, instrumentation and the aircraft technical modules of
the flying school (dependent variable), except for the flight planning, air law and
procedures and human performance modules which reflect a negative correlation.
Only two of the correlations were significant and the negative correlations were not
significant.
While there were not many significant correlations, it is pertinent to state that certain
abilities, such as identifying patterns/themes/strategies and learning within time

181
constraints, as tested by the RPM, remain critical pilot skills because pilots are
required to make quick decisions under stressful conditions to ensure flight safety
Flotman (2002).
Flotman (2002, p. 61) noted that “the Advanced Raven’s test provides an indication of
a person’s intellectual efficiency (e.g. to make quick, accurate judgments’ under
stressful conditions) which is critical during flying process”. The researcher found a
positive correlation between this test and the ground school phase results of the
candidates.
The Blox Test reflected a negative correlation with most of the modules, but where
the correlations were positive, they were insignificant. The measure of the Blox Test
is spatial ability, which includes visualisation, spatial relations and spatial orientation,
which are deemed to be critical skills for a pilot. The negative correlation in this study
may have been as a result of the individual candidates not obtaining the required
pass mark during the first sitting of the pilot training examination.
Flotman (2000, p. 61) asserted that “despite the Blox test’s poor correlation with the
Ground School Phase results, it remains an important component of the selection
battery in the sense that it measures one of the critical abilities a potential pilot should
have, namely, spatial relations and orientation”. The above research recommended
that the test should be retained until a more comprehensive study is undertaken.
The reading comprehension test of the intermediate battery measures verbal
ability and clerical speed and accuracy. The poor correlation with the flying school
modules could be the result of the technical language used during the training
programme compared with the language used in the test. Hence the performance of
the candidates during the selection phases may have indicated potential success in
the training, although the training school results do not appear to have confirmed this.
The correlations between arithmetic 1 and 2 and the flying school results were
not significant, with the exception of arithmetic 1 and the instrumentation module,
which were statistically significant. If one considers the fact that the items in the tests
are verbal statements of computational problems, these may not be similar to

182
calculations required when flying an aircraft. This could be an indication that a study
needs to be conducted to determine the nature and type of numerical abilities
required for a pilot, and whether these differ from the general numerical abilities
based on community norms as discussed in chapter 3.
5.5.2 Correlations between the phase 2 test results and performance in the cadet
pilot training programme
It was decided not to perform regression analyses for each race group because the
sample sizes were too small. Instead the correlations and regression of phase 2 tests
with performance in cadet pilot training programme based on the total sample were
investigated.
Burke, Hobson and Linsky (1997) noted a trend of declining validity over time for several
pilot aptitude measures and a discernible trend for smaller validation sample sizes in
more recent decades.

183
Table 5.27 Correlations between the phase 2 test results and the final flying school results
Variable/modules ELSA ABET English language symbol
Matric symbol
Meteorology Correlation P-value
0.212 0.299
0.224 0.272
0.331 0.098
0.231 0.256
Flight planning Correlation P-value
0.234 0.250
0.129 0.531
0.208 0.307
0.133 0.517
Radio Correlation P-value
0.170 0.407
0.233 0.251
0.343 0.087
0.431* 0.028
Navigation Correlation P-- value
0.448 * 0.022
0.473* 0.015
0.295 0.144
0.205 0.315
Instrumentation Correlation P-value
0.297 0.141
0.229 0.260
0.406* 0.040
0.282 0.163
Air law & procedures Correlation P-value
0.035 0.867
0.037 0.859
- 0.186 0.363
- 0.077 0.709
Human performance Correlation P-value
0.269 0.185
0.267 0.188
-0.092 0.655
0.090 0.663
Aircraft technical Correlation
P-value
0.317 0.114
0.267 0.188
0.377 0.057
0.304 0.131
*p < 0.05

184
Table 5.27 Correlations between the phase 2 test results and the final flying school results (continued)
Variable/modules Comprehension Arithmetic Digit forward
Digit backward
Digit combined
Similarities
Meteorology Correlation P-value
0.292 0.148
0.324 0.106
0.262 0.196
0.150 0.466
0.243 0.231
-0.148 0.471
Flight planning Correlation P-value
- 0.037 0.856
- 0.123 0.549
0.129 0.531
0.068 0.740
0.115 0.575
-0.085 0.681
Radio Correlation P-value
0.286 0.157
0.204 0.317
- 0.045 0.828
0.099 0.632
0.062 0.764
-0.210 0.302
Navigation Correlation P-value
0.053 0.796
-0.004 0.985
- 0.098 0.633
0.010 0.962
-0.036 0.860
0.297 0.140
Instrumentation Correlation P-value
- 0.004 0.985
- 0.059 0.775
0.085 0.680
0.104 0.612
0.125 0.542
-0.031 0.880
Air law & procedures
Correlation P-value
0.026 0.901
- 0.112 0.587
- 0.288 0.153
- 0.187 0.360
- 0.286 0.156
-0.160 0.435
Human performance
Correlation P-value
0.289 0.152
0.086 0.675
- 0.043 0.836
-0.258 0.203
-0.235 0.249
0.124 0.547
Aircraft technical Correlation
P-value
0.396* 0.045
-0.249 0.221
- 0.196 0.336
-0.196 0.336
-0.181 0.377
-0.324 0.106
*p < 0.05

185
Table 5.27 Correlations between the phase 2 test results and the final flying school results (continued)
Variable/modules Picture completion
Object assembly
Block design
Digit 90 Picture arrange-
ment
Meteorology Correlation P-value
0.033 0.872
0.145 0.480
0.001 0.995
0.024 0.909
-0.030 0.885
Flight planning Correlation P-value
0.034 0.867
- 0.133 0.518
0.032 0.875
-0.236 0.246
-0.105 0.611
Radio Correlation P-value
-0.393(*) 0.047
- 0.284 0.159
- 0.168 0.411
- 0.229 0.260
-0.013 0.951
Navigation Correlation P-value
0.013 0.950
- 0.103 0.617
- 0.108 0.600
-0.092 0.260
0.148 0.470
Instrumentation Correlation P-value
0.005 0.982
0.121 0.555
0.029 0.889
- 0.128 0.534
0.018 0.932
Air law & procedures
Correlation P-value
- 0.147 0.473
- 0.340 0.089
- 0.310 0.123
- 0.394* 0.047
- 0.224 0.270
Human performance
Correlation P-value
-0.128 0.534
- 0.423* 0.032
-0.313 0.119
0.009 0.966
-0.087 0.672
Aircraft technical Correlation P-value
-0.164 0.424
0.035 0.864
- 0.154 0.454
0.055 0.454
-0.114 0.580
*p < 0.05

186
Table 5.27 indicates that there were generally few statistically significant correlations
between the phase 2 tests and the performance of cadet pilots during training. This
could be the result of restriction of range which could have affected the correlation sizes
because of preselection and a small sample size.
According to Burke et al. (1997), sample sizes in pilot validation are important because
the occupation of aviation pilot attracts a highly self-selected group of applicants as a
career option, and those entering training typically represent a small percentage of the
most able of these applicants. Hence these high degrees of selection tend to bias
estimates of validity downwards. Thorndike (in Burke et al., 1997) observed that
validities tend to underestimate the true validities of pilot selection measures simply
because the full range of ability is not present in all validation samples on account of
range restriction.
Hunter and Burke (in Burke et al., 1997) reported with regard to the nature of the
criterion widely used in pilot selection research, that the dichotomous split of training
success into pass versus fail tends to dominate the pilot selection literature, a factor that
would also substantially reduce the observed validity estimates.
A similar comment is made by Stauffer and Ree (1996), who postulated that often in
assessing pilot selection systems, continuous criteria may not be available for all
trainees, particularly those who fail and those who leave before completing all the
phases of instruction that contribute to continuous criteria. This scenario was
experienced during the cadet training programme on which the results of this study were
based, where at least two of the candidates left the programme for personal reasons.
The results based on the phase 2 psychometric battery are summarised below.
The correlation between the comprehension and aircraft technical module was
statistically significant (r = 0.396; p < 0.05). The comprehension test measures
the respondent’s ability to deal with abstract social conventions, rules and
expressions, while the aircraft technical modules include material on the different
aircraft types, and so on, which are considered abstract.

187
The negative correlations between picture completion and the radio module,
object assembly and the human performance module as well as digit 90 and air
law and procedures results, were statistically significant (r = - 0.393, - 0.423 and
– 0.394; p < 0.05) respectively. Picture completion and object assembly involve
the ability to deal with perceived visual details. Radio focuses on communication
with control centres and other air space users, while human performance has to
do with, say, workload and stress and their impact on pilot performance. Object
assembly measures the ability to a form visual concept quickly, which is a critical
skill for a pilot. Hence the statistically significant correlation with human
performance reflects this relationship.
Although the results of literacy and ABET showed positive correlations with air
law and procedures, which were not statistically significant, this could be an
indication of the content of the subject/module and the language, as opposed to
the language of the test items of the ELSA, in which the language is more South
African.
The correlation between literacy level, as measured by the ELSA, with the
navigation module was statistically significant (r = 0.448; p<0.05). The ELSA
quantifies a person’s English competency input and trainability levels, and the
results reflect positive correlations with the some of the flying school modules.
The relationship between the literacy levels of a cadet pilot and his/her
understanding of signals on the dials in the aircraft was reflected in this
statistically significant correlation.
There was a statistically significant correlation between the ABET levels and
navigation (r = 0.473; p < 0.05). Also, the ABET level (i.e. academic level) of the
cadet pilot was reflected in the relationship between the predictor and the
criterion.
The Matric English language symbol indicated a positive correlation with both the
instrumentation and aircraft technical modules of the flying school final
examination results, which were statistically significant (r = 0.406; p < 0.05 and r
= 0.377; p < 0.05 respectively). Again, the academic English level of the cadet
188
pilot and the understanding of the various instruments used to manoeuvre an
aircraft and dials reflected a positive relationship.
The correlation between the Matric symbol and the radio module was positive
and statistically significant (r = 431; p < 0.05). The Matric symbol as reflected by
the academic certification of the cadet pilot indicated a relationship with
communication via radio in an aircraft.
In conclusion it should be noted that the results seems to indicate poor correlations in
phases 1 and 2 as reported in tables 5.26 and 5.27. This could have been caused by the
job description used to identify the psychological tests and qualities to be assessed
during the recruitment and selection process being based on the competencies of
qualified pilots. Furthermore, the cadet pilots may not have had prior exposure to and
experience in aviation and performance during the selection process may thus have
been influenced by other (unknown) factors.
Burke et al. (1997) supported the view of Ackerman (1989) and Fitts and Posner (1967)
to improve prediction in pilot selection, by following a skills acquisition model, in order to
obtain incremental benefits to add tests of information-processing abilities to account for
increasing dominance of cognitive ability in the later stages of pilot training and in coping
with the information demands of contemporary avionics systems in actual operations.
Sommer et al. (2004) pointed out that in many fields; there are low correlation
coefficients between test results and the chosen criterion variable. There are a variety of
reasons for this. They stated that based on the test results obtained in the selection
procedures, individuals who are already excluded are not available for further evaluation
analysis. This selection results in a restriction of the range in the predictor variable and
thus a decrease in the correlation coefficient (Sommer et al., 2004).
5.5.3 STEPWISE REGRESSION ANALYSIS
In section 5.5.2 it was stated that multiple regression was performed on the total sample
and the psychological tests in both phases 1 and 2 in order to determine which tests are
better predictors of performance in the cadet training programme. The stepwise

189
regression analysis method was used because it is the most parsimonious model
(Brace, Kemp & Snelgar, 2009). Furthermore, the total number of psychological tests
including the subtests used during the selection of the cadet pilots, leaned towards using
the stepwise regression method because it would ensure ending up with the smallest
possible set of predictor variables included in the model.
The regression analysis was conducted on the basis of the statistically significant
relationship between the psychological tests and the final cadet flying school results.
The variables included as part of the model in the stepwise regression analysis were as
follows:
(1) Dependent variables
Meteorology
Navigation
Radio
Air law and procedures
Human performance
Aircraft technical
(2) Independent variables
Raven’s Progressive Matrices test score
The Blox Test score
ABET levels
the Matric symbol
the digit 90 subtest score
the object assembly subtest score
the comprehension subtest score
According to Howitt and Cramer (2000), the primary use of regression is that it allows
the researcher to make predictions. Stepwise regression was used to ensure that the
smallest possible set of predictor variables was obtained taking into account the small
sample size. This view is supported by Brace et al. (2009), in their statement that the
advantage of the stepwise method is that it always results in the most economical
model. This suggests that if a researcher wishes to determine the minimum number of

190
variables that he/she needs to measure in order to predict the criteria variable, the
stepwise method would be a better option. Brace et al. (2009) recommended that if one
does not have a strong theoretical framework, then it is probably safest to use the
“enter”.
Owing to the multicolinearity nature of the variable, a variable either being entered on its
own or with other variables in the stepwise procedure will result in the percentage of the
variable explained being different.
The results of the stepwise regression are presented in tables 5.28 to 5.33.
Table 5.28 below indicates the regression results for the meteorology module in the
cadet training programme.
Table 5.28
Predicting performance in meteorology
Model R R square Adjusted R square
Std. error of the estimate
1 .470(a) .221 .189 6.297769
2 .672(b) .452 .404 5.397591
a. Predictors: (constant), RPM b. Predictors: (constant), RPM, Blox Test *p < 0.05

191
Coefficient
Model Unstandardised coefficients
Standardised coefficients
t Sig.
B Std. error Beta
1 (Constant) 45.147 15.075 2.995 .006
RAVEN’S .723 .277 .470 2.609 .015
2 (Constant) 31.833 13.611 2.339 .028
RAVEN’S 1.523 .350 .989 4.350 .000
BLOX -.884 .284 -.707 -3.110 .005
a. Dependent variable: meteor *p < 0.05
The tables above indicate that by including only RPM only 19% of variance could be
explained. However, adding the Blox to the model, 40% (R2 change = 0.404) of variance
in the dependent variable could be explained. This indicates that both the RPM and the
Blox can be used to predict performance in meteorology. The beta values of both RPM
and the Blox are presented in the table above.
Adjusted R square = 0.404
The significant model, using the stepwise method, has the following significant variables:
Predictor variable Beta p
Raven’s 0.989 p < 0.0005
Blox - 0.707 p = 0.005

192
Table 5.29
Predicting performance in navigation
Model R R
square
Adjusted
R square
Std. error of the
estimate
1 .473(a) .224 .192 8.076926
a. Predictors: (constant), ABET
*p < 0.05
Model
Unstandardised coefficients
Standardised coefficients
t Sig.
B
Std. error
Beta
1 (Constant) 76.159 4.192 18.168 .000
ABET 3.104 1.326 .431 2.341 .028
a. Dependent variable: navigation *p < 0.05
The ABET level results were the only variable that had any relationship with the
dependent variable flying school module (navigation). The ABET levels explain
19.2% of the variance in the dependent variable.
Olea and Ree (in Carretta, et al., 1996), in their research on predicting situation
awareness, demonstrated the predictive power of general cognitive ability for
pilot and navigator criteria.
Adjusted R square = 0.224;
The significant model, using the stepwise method, has the following significant
variables:
Predictor variable Beta p
ABET 0.431 p = 0.028

193
Table 5.30
Predicting performance in radio
Model R R
square Adjusted R square
Std. error of the estimate
1 .431(a) .186 .152 8.154893
a. Predictors: (constant), Matric symbol *p < 0.05
Model Unstandardised coefficients
Standardised coefficients
t Sig.
B
Std. error
Beta
1 (Constant) 76.159 4.192 18.168 .000 MATRICSB 3.104 1.326 .431 2.341 .028
a. Dependent variable: radio *p < 0.05
The Matric symbol obtained by the candidates, who were finally selected for the training
programme, had a significant predictive relationship with the dependent variable flying
school module (radio). The Matric symbol explains 15.2% of the variance in the
dependent variable.
Adjusted R square = 0.152;
The significant model, using the stepwise method, had the following significant variables:
Predictor variable Beta p
Matric symbol 0.431 p = 0.028
Table5.31
Predicting performance in air law and procedures
Model R R square
Adjusted R square
Std. error of the estimate
1 .394(a) .155 .120 5.678382
a. Predictors: (constant), digit 90 *p < 0.05

194
Model Unstandardised coefficients
Standardised coefficients
t Sig.
B Std. error Beta
1 (Constant) 97.915 7.973 12.281 .000 DIGIT90 -.273 .130 -.394 -2.099 .047
a Dependent variable: air law *p< 0.05
The table indicates that digit 90 was the variable that had the strongest linear
relationship with the independent variable (air law and procedures) of all the
independent variables. Digit 90 explained 12% of the variance in the dependent variable.
Adjusted R squared = 0.120
The significant model, using the stepwise method, had the following significant variables:
Predictor variable Beta p
Digit 90 -0.394 p = 0.047
Table 5.32
Predicting performance in human performance
Model R R square
Adjusted R square
Std. error of the
estimate
1 .423(a) .179 .144 5.258605
a. Predictors: (constant), object assembly
*p < 0.05
Model Unstandardised coefficients
Standardised coefficients
t Sig.
B
Std. error
Beta
1 (Constant) 106.571 8.916 11.953 .000
OBJECT -1.146 .502 -.423 -2.284 .032
a. Dependent variable: human performance *p < 0.05

195
The object assembly subtest had the best relationship with the human performance of
the flying school of all the independent variables, but the adjusted R square of 0.144
indicated that object assembly explained only 14.4% of the dependent
variable.<,Adjusted R square = 0.144
The significant model, using the stepwise method, had the following significant variables:
Predictor variable Beta p
Object assembly -0.423 p = 0.032
Table 5.33
Predicting performance in aircraft technical
Model R R
square
Adjusted
R square
Std. error of
the estimate
1 .396(a) .157 .122 6.563980
(a) Predictors: (constant), comprehension
*p < 0.05
Model Unstandardised coefficients Standardised coefficients
t Sig.
B Std. error
Beta
1 (Constant) 70.083 6.601 10.617 .000 COMPR 1.023 .484 .396 2.114 .045
(a) Dependent variable: aircraft *p < 0.05
The linear relationship between with dependent variable (i.e. aircraft technical) and the
independent variable (i.e. comprehension subtest) was significant. The comprehension
subtest indicated 12.2% of variance in the dependent variable. In other words, a small
part of the variance of the dependent variable is explained by the adjusted R square.
Adjusted R square = 0.122
The significant model, using the stepwise method, had the following significant variables:

196
Predictor variable Beta p
Comprehension 0.396 p = 0.045
5.6 INTEGRATION OF RESULTS
The results of the research suggest that the psychometric batteries utilised in phases 1
and 2 of the selection process for the cadet pilot training programme do have some
benefits and value in identifying potential candidates who could successfully complete
the training programme. The conclusions of the research are as follows:
5.6.1 Descriptive statistics and group comparison
The whites in phase 1 of the selection processes performed better, followed by the
Asians, the Coloureds and the blacks (figure 5.1) in all the psychometric batteries.
The blacks in phase 2 of the selection process generally achieved lower scores in
the literacy levels compared with other race groups, which did not differ significantly
from one another, as measured by the ELSA subset 1 = 3.0526 for the blacks (see
table 5.19).
The blacks generally achieved lowers scores than the other race groups, which did
not differ significantly from one another, on the ABET levels as measured by the
ELSA subset 1 = 2.3158 for the blacks (see table 5.20).
The blacks and coloureds had similar results in Matric English. in subset 1, blacks =
2.00 and the coloureds = 2.79. However, the coloureds, Asians and whites did not
perform significantly differently from one another (see table 5.21).
5.6.2 Correlation analysis
The correlation between the RPM and the meteorology module of the flying school
results was statistically significant (r = 0.376; p < 0.05) (see table 5.26).
The literacy levels and the ABET indicated a statistically significant correlation with
the navigation module (r = 0.448 and 0.473; p < 0.05 respectively) (see table 5.26).
The Matric symbol, as indicated on the applicants’ application forms also had a
statistically significant correlation with the radio module (r = 0.431; p < 0.05) (see
table 5.26).

197
The correlation between comprehension and the aircraft technical module was
significant (r = 0.396; p < 0.05) (see table 5.27).
Despite the negative correlation between picture completion and the radio module,
object assembly and the human performance module as well as digit 90 and the air
law and procedures results, the correlation was significant (r = - 0.393, - 0.423 and –
0.394; p < 0.05) respectively (see table 5.27).
5.6.3 Stepwise regression analysis
The beta weighting indicated that overall, the RPM, Blox, Matric English symbol,
ABET levels and reading comprehension were good predictors for some of the
modules of the flying school results (see tables 5.28 to 5.33).
Some of the possible contributions of these results were discussed earlier. This forms
the foundation on which to test the hypotheses formulated in chapter 4.
5.7 TESTING OF THE RESEARCH HYPOTHESES
In this section, each hypothesis is either rejected or accepted on the basis of the results
of the empirical research as reported in this chapter. According to Anastasi and Urbina
(1997), a significance level of less than 0.01 or 0.05 indicates that the null hypothesis
should be rejected.
5.7.1 Hypotheses testing regarding the psychological tests
Table 5.34 represents the results of this research in terms of the hypotheses that were
stated in sections 4.6.1 and 4.6.2 in chapter four.

198
Table 5.34 Hypothesis testing of the results
Original hypotheses
Results Reasons/discussion
H11: The RPM scores correlate statistically
significantly and positively with the flying
school final examination results.
H10 is rejected. The results indicate that the RPM is valid for
the prediction of performance in the flying
school final examination results, namely the
instrumentation and meteorology modules in
cadet training programme.
H21: The Blox Test scores correlate
statistically significantly and positively with the
flying school final examination results,
H20 is not rejected. The results seem to indicate that the Blox Test
is not valid for the prediction of performance in
the flying school final examination results in
the cadet training programme.
H31: Reading comprehension in the
Intermediate Test Battery scores correlates
statistically significantly and positively with the
flying school final examination results.
H30 is not rejected. The results seem to suggest that there is no
relationship between the test and performance
in the flying school final examination results in
cadet training programme.

199
Table 5.34 Hypothesis testing of the results (continued)
Original hypotheses
Results Reasons/discussion
H41: The arithmetic (1 and 2) subtests scores
correlate statistically significantly and positively
with the flying school final examination results.
H40 is not rejected. The results indicate that the arithmetic 1 & 2
subtests are not valid for the prediction of
performance in the flying school final
examination results in the cadet training
programme. However, there is some indication
that arithmetic 1 does have a correlation with
the instrumentation module in the flying school
results.
H51: The literacy level scores of the ELSA
correlate statistically significantly and positively
with the flying school final examination results.
H50 is rejected. The results indicate that the literacy level
scores of the ELSA are valid for predicting
performance in the navigation module in the
flying school final examination results in the
cadet pilot training programme.
H61: The ABET level scores of the ELSA
correlate statistically significantly and positively
with the flying school final examination results.
H60 is rejected. The results indicate that the ABET level scores
of the ELSA are valid for predicting
performance in the navigation module in the
flying school final examination results in the
cadet pilot training programme.

200
Table 5.34 Hypothesis testing of the results (continued)
Original hypotheses
Results Reasons/discussion
H71: The Matric English symbol scores
correlate statistically significantly and positively
with the flying school final examination results.
H70 is rejected. The results indicated that the Matriculation
English symbol is valid for predicting
performance in the instrumentation and aircraft
technical modules in the flying school final
examination results in the cadet pilot training
programme.
H81: The comprehension subtest of the
WAIS scores correlates statistically
significantly and positively with the flying
school final examination results.
H80 is rejected. The results indicate that the comprehension
subtest of the WAIS is valid for predicting
performance in the aircraft module in the flying
school final examination results in the cadet
pilot training programme.
H91: The arithmetic subtest of the WAIS
scores correlates statistically significantly and
positively with the flying school final
examination results.
H90 is not rejected. The results indicate that the arithmetic subtest
of the WAIS is not valid for predicting
performance in the flying school final
examination results in the cadet pilot training
programme.

201
Table 5.34 Hypothesis testing of the results (continued)
Original hypotheses
Results Reasons/discussion
H101: The digit forward subtest of the WAIS
scores correlates statistically significantly and
positively with the flying school final
examination results.
H100 is not rejected. The results indicate that the digit forward
subtest of the WAIS is not valid for predicting
performance in the flying school final
examination results in the cadet pilot training
programme.
H111: The digit backward subtest of the WAIS
scores correlates statistically significantly and
positively with the flying school final
examination results
H110 is rejected. The results indicate that the digit backward
subtest of the WAIS is valid for predicting
performance in the flying school final
examination results in the cadet pilot training
programme.
H121: The digit combined subtest of the WAIS
scores correlates statistically significantly and
positively with the flying school final
examination results.
H120 is not rejected. The results indicate that the digit span subtest
of the WAIS is not valid for predicting
performance in the flying school final
examination results in the cadet pilot training
programme.

202
Table 5.34 Hypothesis testing of the results (continued)
Original hypotheses
Results Reasons/discussion
H131: The similarities subtest of the WAIS
scores correlates statistically significantly and
positively with the flying school final
examination results.
H130 is not rejected. The results indicate that the similarities subtest of the WAIS is not valid for predicting performance in the flying school final examination results in the cadet pilot training programme.
H141: The picture completion subtest of the
WAIS scores correlates statistically
significantly and positively with the flying
school final examination results.
H140 is rejected. The results indicate that the picture completion subtest of the WAIS is valid for predicting performance in the radio module in the cadet pilot training programme.
H151: The object assembly subtest of the
WAIS scores correlates statistically
significantly and positively with the flying
school final examination results.
H150 is rejected. The results indicate that the object assembly
subtest of the WAIS is valid for predicting
performance in the human performance
module in the flying school final examination
results in the cadet pilot training programme.

203
Table 5.34 Hypothesis testing of the results (continued)
Original hypotheses
Results Reasons/discussion
H161: The block design subtest of the WAIS
scores correlates statistically significantly and
positively with the flying school final
examination results.
H160 is not rejected. The results indicate that the block design
subtest of the WAIS is not valid for predicting
performance in the flying school final
examination results in the cadet pilot training
programme.
H171: The digit 90 subtest of the WAIS scores
correlates statistically significantly and
positively with the flying school final
examination results.
H170 is rejected. The results indicate that the digit 90 subtest of the WAIS is valid for predicting performance in the air law and procedures module in the flying school final examination results in the cadet pilot training programme.
H181: The picture arrangement subtest of the
WAIS scores correlates statistically
significantly and positively with the flying
school final examination results.
H180 is not rejected. The results indicate that the picture
arrangement subtest of the WAIS is not valid
for predicting performance in the flying school
final examination results in the cadet pilot
training programme.

204
5.7.2 Discussion
The results obtained highlight areas in which the psychological tests currently used in
the selection of cadet pilot are valid in predicting performance in the training programme
for specific modules. The RPM, which provides an indication of intelligence in the
context of the current research, was not consistently valid in all the modules of the flying
school.
The Blox Test results obtained indicated a poor correlation. However, the regression
analysis provided a different picture, which suggests that the Blox Test used in
conjunction with the RPM would provide a better prediction.
Further indications from the results obtained relate to the literacy and ABET levels of the
candidate as well as the English Matric symbol, which showed a statistically significant
correlation with some of the modules of the flying school, particularly those relating to
radio, navigation, instrumentation and aircraft technical.
It is interesting to note that the psychological tests, the Blox Test, reading
comprehension and arithmetic 2 in phase 1, did not indicate any statistically significant
correlations with the modules of the flying school final examination results. In phase 2 of
the selection process, the following subtests of the WAIS did not show statistically
significant correlations with the all the modules of the flying school final examination
results: arithmetic, digit forward and backwards, digit span, similarities, block design and
picture arrangement. A possible reason for this could be that the sample size is too small
or that general intelligence is not necessarily as critical as special abilities/aptitude for
performance as a pilot.
In studies conducted locally on military pilots, it was concluded that the predictive validity
of general cognitive ability (g) and specific abilities (sn) appears to differ (De Kock &
Schlechter, 2009). In their meta-analysis of predictors of pilot success, Hunter and Burke
(1994) found that general intelligence was not generalisable across studies as a
predictor; at most it had an influence moderated by other variables. However, Ree and
Carretta (1996) concluded that general cognitive ability has consistently been shown to

205
predict pilot training success, showing average statistically significant correlations of
0.33.
Damon (1996) reported that some evidence has been found that information processing
capability is an important indicator of fluid intelligence, thus predicting pilot success. A
South African study found that pilots could be differentiated from non-pilots on the basis
of the rate of information processing (Barkhuizen, Schepers & Coetzee, 2002; De Kock
& Schlechter, 2009). According to De Kock and Schlechter (2009), it can be argued that
fluid intelligence and information processing capability are two factors of intelligence that
drive transfer and automatisation of learning during flight training tasks.
As mentioned in chapter 2, according De Kock and Schlechter (2009), clearly the debate
on the role of intelligence and aptitude in the prediction of pilot training success is still
active and can be interpreted as an attestation of its dominance in pilot selection
batteries.
De Kock and Schlechter (2009), reported on a study by Burke, Hobson and Linsky
(1997), which found that psychomotor tests predicted pilot success and that their validity
generalised across samples. The above authors used validity generalisation analysis
(VGA) with three samples from different national air forces, with a large sample (N = 1
760). According to De Kock and Schlechter (2009), as a follow-up to these findings,
various other studies reported that measures of psychomotor abilities were able to
increase the predictive validity of a battery already measuring (g) (De Kock & Schlechter
2009; Ree & Carretta, 1996).
De Kock and Schlechter (2009) concluded that this construct might prove useful in future
pilot selection batteries.
According to Ree and Carretta (1996), some studies did in fact report that certain
aspects of personality had incremental predictive validity in traditional batteries, for
instance, attitude to risk. De Kock and Schlechter (2009) reported on a study by Carretta
(2000), who that found that a measure of conscientiousness increased the multiple
correlation coefficient of a battery measuring general mental ability, from 0.51 to 0.60.

206
In another study, pilot trainees completed a personality inventory measuring five
dimensions deemed to be associated with flight training performance. On completion of
the training, three of the measures were in fact significantly related to training outcome,
namely hostility, self-confidence and value flexibility. Disappointingly, incremental validity
analysis did not indicate that the inventory could enhance a selection model already
containing traditional aptitude scores (De Kock & Schlechter 2009).
Campbell, Castaneda and Pulos (2010, p. 97), in their meta-analysis studies using
personality constructs to predict military aviation outcomes, noted that of the 26 studies
reporting the effect of personality, excluding biographical inventories, “all but two studies
[utilized] military samples, suggesting the use of personality assessment in aviation
training contexts is even less applied in civil aviation”. Because of this comment, the
civilian samples were omitted in their study. This view further indicates the need for more
research in civilian/commercial airlines, as it can be argued that the personality profile of
a commercial pilot would differ significantly from that of a military pilot.
In conclusion, the results of these studies underscore the view that not only intelligence,
but also other domains, such as personality, information processing, and so forth, may
play a role in predicting flying training outcomes. It is clear that the current battery may
be deficient in the sense that it does not include personality, as suggested by a literature
study by De Kock and Schlechter (2009), which was also the case in the current
research. Personality was not considered in the present study.
These studies confirm that a thorough study should be undertaken to identify the critical
competencies of a pilot, which will ensure that appropriate and relevant psychological
instruments are used in the selection process. Campbell et al. (2010) concluded that the
implication of their study is that the differential relationship between specific personality
traits and aviation training success should move beyond applications using monolithic
“personality” as a predictor into a more theoretical modelling of the interaction between
specific personality constructs.
Overall, the aim of this research, namely to determine the predictive validity of the
current psychological test battery in order to measure successful completion of the cadet
training programme, has been achieved.

207
5.8 CHAPTER SUMMARY
The results of the empirical study were presented and discussed in this chapter. The
results indicated that there is a concern about the weak and/or small correlation between
the subtests in phase 2 and the performance in the cadet pilot training programme,
whereas, the test scores in phase 1 indicated a moderately positive correlation with the
performance in the cadet pilot training programme. However, the restriction of range as
well as the effect sample size may have contributed to these correlations. Furthermore,
the results of the empirical study supported the acceptance of the null hypotheses.
In the final chapter, conclusions will be drawn on the basis of the results. The limitations
of the research will also be discussed and recommendations made for possible future
research.

208
CHAPTER 6
CONCLUSIONS, LIMITATIONS AND RECOMMENDATIONS FOR FUTURE
RESEARCH
6.1 INTRODUCTION
The general aim was to ascertain the predictive validity of the psychological test battery
used in the selection of cadet pilots for successful completion of the cadet training
programme.
The corresponding general aim and specific aims of the literature review and the
empirical study, as stated in section 1.3 in chapter 1, will guide the discussion in the final
chapter.
6.1.1 General conclusions
In terms of the empirical study, the general aim of this research was to ascertain whether
the psychological tests, which are used for the selection of candidates for the cadet pilot
training programme in a commercial airline using the candidates’ final flying school
results as a criterion measure, are valid.
Based on the findings in the empirical study, it can be concluded that some of the
psychological tests that are used are valid for the prediction of the successful completion
of the cadet pilot training programme in both phases 1 and 2 of the selection process.
Although there was a positive correlation, it was moderately low for most modules of the
flying school results. De Kock and Schlechter (2009, p. 6) concluded in their study that
“since we have shown that sometimes special intelligence (Sn) has incremental validity
over ’g’, the implication is that, practically, such an (small) increase in predictive validity
translates into significant utility yields when considering the low selection ratios, high
costs associated with training and low base rates typical in pilot selection” (Murphy &
Davidshofer in De Kock & Schlechter, 2009). In terms of the current research, this may
imply that testing for specific types of ability and/or intelligence has benefits. However,
the costs associated with training outweigh the benefits.

209
6.1.2 Specific conclusions relating to the literature review
In terms of the literature review, the specific aims were as follows:
(1) To discuss the literature review of the concept of intelligence and aptitude
and explore the nature of these concepts, as well as how intelligence can
be measured using psychological instruments; also to discuss the
concept of selection
(2) To discuss the literature review of the concepts of literacy and numeracy
and describe the dimensions of these concepts; also to discuss the
psychological instruments used to measure literacy and numeracy.
6.1.2.1 Conclusions relating to intelligence, aptitude, psychological tests and selection
The review of literature reported in chapter 2 indicates that intelligence may be explained
as a general factor of intelligence, “g” (Spearman), or in terms of primary abilities, as
described by Thurstone (1938, 1948), or crystallised and fluid intelligence, as proposed
by Cattell. Theories of general factor “g” and separate abilities are combined into a
hierarchical model of intelligence as described by Gustafsson (1984). Carroll’s three-
stratum theory is similar to Cattell’s theory of fluid and crystallised intelligence, except
that it posits a “g” factor at the third stratum.
As a result, a configuration of the battery of tests aligned to the hierarchical model of
intelligence (Gustafsson, 1984) would be appropriate.
In conclusion, it was found that intelligence, whether as a general factor, “g”, or separate
abilities, can be measured using psychological tests, and as a construct, it is significant
in predicting success in the cadet pilot training programme. A similar conclusion was
drawn by Ree and Carretta (1996) in their investigation on general cognitive factor, “g”,
which accounted for 39% of the common variance, while the general psychomotor factor
accounted for 29% of variance, which was consistent with past research by Hunter

210
(1986), Jensen (1993) and Spearman (1904), showing that “g” can be measured in
numerous ways.
De Kock and Schlechter (2009) drew a similar conclusion in their research, which
confirms the widely held belief that measures of general cognitive ability remain
stalwarts in any selection programme for military pilots. They further concluded that their
research has shown that spatial ability can significantly enhance the ability to predict
pilot flight training success. These authors suggest that measures of specific forms of
intelligence (sn), such as spatial ability, could have an incremental validity over “g” and
should therefore not be discarded in favour of measures of general cognitive ability or
fluid intelligence.
Ree and Earles (1991) concluded that the psychometric “g” was the best predictor, and
measures of specific ability were not required to predict training success.
In general, the results of the current study are consistent with previous research on the
prediction of pilot training success in two ways: (1) fluid intelligence remains one of the
best predictors of flight training performance, and (2) the correlations obtained between
predictors and criteria are still only moderate at best (Burke et al., 1997; Damos, 1996;
Hilton & Dolgin, 1991; Hunter & Burke, 1994; De Kock & Schlechter, 2009).
6.1.2.2 Conclusions relating to literacy and numeracy
The review of literature reported in chapter 3, provides support that it is imperative to
examine literacy and numeracy relative to their social function. In South Africa, literacy is
complicated by the fact that knowledge of a second language, usually English, is as vital
for survival and development as the ability to read and write in an African language
(Hutton, 1992). The term “literacy” is therefore used to include basic competency in
English.
Hunter and Burke (1994) asserted that even with better construct data and improved
analytical techniques, differences in cultural context, say, English speaking versus non-
English speaking, may act to moderate validities for specific personality instruments.

211
It is thus concluded that literacy and numeracy skills are vital in the effective
functioning/performance of tasks, including performance in psychological tests and in
any training programme. This conclusion is supported by Downey, Suzuki and Van
Moere (2010, p. 29), who reported that “to prevent radiotelephony miscommunications
in international aviation, ICAO mandated that organizations that employ pilots and air-
traffic controllers have a plan in place to ensure that all such personnel can at least
demonstrate ’operational’ spoken-English proficiency as described in level 4 of the ICAO
rating scale”.
It is concluded that psychological tests that measure intelligence, literacy and numeracy,
are the best for predicting successful completion of the cadet training programme.
6.1.3 Specific conclusions relating to the empirical research
Conclusions, which correspond to the aims of the empirical research, as stated in
section 1.3.3 in chapter 1, will be discussed below regarding the predictive validity of the
psychological test battery used to predict successful completion of the cadet training
programme.
6.1.3.1 Conclusions relating to the psychological test battery
Based on the results of the empirical research reported in chapter 5, it can be concluded
that some of the psychological tests used in the selection battery for pilot selection are
valid for predicting the successful completion of the cadet training programme.
The results of a study by Van der Merwe (2002) indicated that psychometric tests are
not used in isolation, but as an additional aid in decision making and form part of a
defined procedure which includes different, interrelated, specific steps, as well as other
tools.
However, Bartram (2004) postulated that given the ongoing increase in the costs
associated with military and commercial flying, it is not surprising that the search for
more accurate predictions of success in training should continue to receive high priority.
Aptitude test batteries tend to have predictive validities of about .20 to .30 (Hunter &

212
Burke, 1993). Bartram (2004) further stated that if any substantial improvements are to
be made to these levels of validity, it will be necessary to look in domains other than
ability.
6.1.3.2 Conclusions relating to the importance of other variables: English Matric symbol
and literacy, as well as ABET levels, in determining the successful completion of
the cadet training programme
The results of the empirical research reported in chapter 5 show that there is a high
positive correlation with some of the flying school’s modules. In Van der Merwe’s (2003)
research on the extent to which Matric results could be used in a selection battery to
predict future academic performance, there was statistically significant correlation
between the Matric symbol point total (MSPT) and average first-year academic
performance (MPCM 1). The magnitude of the correlation, in terms of effect size, was
between small and medium.
This research supports the conclusion that Matric results have a limited predictive
validity for academic performance. Based on the results of their study, Campbell et al.
(2010) suggested that combining traditional academic ability, emerging psychomotor
assessments and specific personality traits might provide a more empirically derived
account of the “right stuff”.
6.1.4 Potential resolution of the research problem
The conclusion drawn in the current study is that the psychological tests described in the
empirical research (chapter 4) will enhance the selection process for the commercial
airline applicants for the cadet pilot training programme because the tests were found to
be valid for the criteria they are supposed to predict. However, a number of implications
are generated by the present empirical research. While the tests were evaluated as
valid, the manner in which they are used could have an adverse impact. The Uniform
Guidelines of 1978 in the USAS define adverse impact as a situation where there is a
selection rate less than four-fifths (or 80%) of the rate of the group with the highest
selection rate (Arvery & Faley, 1988). Given the differences between the black and white
mean scores in the present study, where the blacks scored lower (table 5.1), there is a

213
possibility that, even though there is no evidence of differential predictions, if tests are
used in a race-neutral, strictly top-down manner, this could have an adverse impact for
black group (Theron, 2009). Theron (2009) suggested that the adverse impact could be
alleviated (but not eliminated) by increasing the predictive validity of the selection
procedure and of the selection ratio.
Given the wide acknowledgement of the need for affirmative action in the developing
potential in a changing South Africa as well as the Employment Equity Act 56 of 1998,
there is increasing pressure on employers to place greater focus on integration across
positions in industry. To this end, South African employers need to develop alternative
selection procedures that will minimise the adverse impact of literacy and numeracy.
At this juncture it is important to re-emphasise that the scope of the present study was
limited and as such the relationships were only evaluated in terms of the predictor and
the criteria, which as indicated earlier, comprised the weighted measures of English
literacy and numeracy and successful completion of the cadet pilot training programme,
as measured by the psychological test battery. As noted in chapter 1, the procedure
adopted in the present study was consistent with the need to facilitate the business
objective of “aiding selection decision making” (Cascio, 1991).
6.2 LIMITATIONS OF THE PRESENT RESEARCH
In the research design, the purpose of the meta-theoretical perspective is to delimit the
boundaries of the research. While this delimitation serves the purpose of focusing and
protecting the researcher, it is restrictive in terms of finding solutions to problems. The
cognitive-behaviourist approach adopted in this research excludes factors such as
motivation, interest, determination and personality characteristics, which may be
hypothesised to be predictive performance in the psychological test battery.
This view is supported by Damos (1996) who stated that no military studies predicting
operational performance were found, although some studies have examined the
concurrent validity of selection tests and operational performance (e.g. Griffin, Morrison,
Amerson & Hamilton, 1987; Griffin & Shull, 1990).

214
6.2.1 Practical constraints
The economic pressures, industrial setting and time constraints tended to influence the
choices which were more practical in the context within which the research was
conducted, as against those that were scientifically and methodologically sound.
However, these limitations had an impact on the design of the research, the aim of which
was to maximise the reliability and validity of the research results.
6.2.2 Restriction of range
Another limitation to be considered is the occurrence of range restriction relating to both
the predictor and criterion variables. According to Cascio (1991), restriction can occur in
the predictor when, for example, only applicants who have survived an initial screening
are considered or when measures are used for selection prior to validation.
This view is shared by Martinussen (1996, p. 15) who reported that “restriction of range
is a major problem in estimating the true validity of psychological measures in pilot
selection, because the selection ratio is very low”. The author stated that restriction of
range can take two forms. Firstly, it can be direct. This occurs when the test in question
is actually used as a selection instrument and only applicants with scores above the cut-
off point are available for further studies. The second form is indirect when the selection
is based upon other predictors that appear to correlate with the test in question.
There may have been range restriction in the present study, because only candidates
who were found suitable in the final stages of the selection process, irrespective of the
test scores, may have been selected for the training programme. Hence this limitation
may have had the effect of lowering the validity estimates obtained for the predictors in
respect of overall effectiveness (Wheeler, 1993).
Cascio (1991) acknowledged that the concurrent design typically ignores the effect of
range restriction. Furthermore, in these designs, the influence of the uncontrolled
variables is also frequently overlooked. In particula, differences caused by motivation
and job experience may have the effect of enhancing or inhibiting the validity of both the
predictor and criteria used, with no way of knowing in advance the direction of such

215
influences (Cascio, 1991). In the current research, interest, motivation and flying
experience may have had either a positive or a negative influence on the scores
obtained by candidates.
According to Ree and Carretta (1996), when validation studies are conducted on
samples that have been systematically selected from the population, there are
restrictions in the variability of predictors (referred to as restriction of range). The above
authors stated that in the study of abilities, the systematic elimination of subjects may
occur as a result of selection on the basis of aptitude tests or personality scores or by
the requirement of having a bachelor’s degree. Restriction of range causes the estimate
of the correlation to be biased downwards.
This view seems to justify the results of this research where the correlations were small.
Ree and Carretta (1996) reported on a study by Thorndike (1949) in which a large group
of applicants were admitted to Army Air Force pilot training without consideration of the
score for the aptitude battery. Correlations with the criterion of pass-fail were computed
for the entire group of applicants and for a subsample that would have passed the
battery of tests on the basis of the selection standards in effect at the end of World War
II. The average decrease in the validity coefficient reported by Thorndike was .29, and
the rank order of validities of tests changed dramatically.
De Kock and Schlechter (2009) reported a similar limitation in their study, in that the
absence of psychometric data on non-successful applicants made estimates of the
population statistics impossible, which is a requirement for computation of adjustments
to the validity coefficient for restriction of range and reliability in the variables.
6.2.3 Sample
The manner in which the sample was selected was also one of the limitations of the
current study.
Ree and Earles (1991), in their study on predicting training success, concluded that in
pooling jobs in validity studies in order to compensate for small sample sizes and using
common regression equations will not cause a drastic reduction in prediction.

216
Carretta and Ree (1996) reported that other studies on information processing found that
it (information processing) could predict pilot training performance, whereas their study
using the BAT tests based on information processing was surprising. They concluded
that the lack of validity may have been the result of sampling error, but the fact that the
BAT tests were not incrementally valid, was not surprising because of their degree of “g”
saturation.
Flotman (2002) noted in his study that only candidates who had passed the
psychometric evaluation (the cut-off point determined by the Military Psychological
Institute, based on specific norms for black and white candidates) were included in the
Ground School Phase training.
The sample in the current study was preselected by the recruitment centre, based on the
information provided either on the application form or in the letter of application. The
actual criteria according to which the recruitment staff would have nominated the
individual applicants cannot be determined and may have ranged from personal
knowledge or the pre-screening interview to various other interpersonal constructs and
other objective or subjective criteria.
6.3 RECOMMENDATIONS
It is recommended that the following issues be incorporated into further research on the
prediction of successful completion of a training programme using psychological test
battery:
6.3.1 Incorporation of other psychological paradigms
When conducting research on predicting the successful completion of a training
programme using a psychological test battery, it would be beneficial to incorporate
variables from other paradigmatic perspectives such as job experience, personality,
attitudes and motivation.

217
This view is supported by Martinussen (1996), who recommended that a selection
battery for pilots should include tests measuring cognitive and psychomotor/information
processing abilities, as well as knowledge of aviation. Martinussen (1996) further
suggested that there should be less emphasis on tests of general intelligence and
academics and since the utility of personality tests is uncertain, they should not be
automatically be used in pilot selection.
Carretta et al. (1996, p. 31), in their study on the prediction of situation awareness in F15
pilots, “found that the first-order factors measuring the constructs verbal working
memory, spatial working memory, spatial reasoning, divided attention, aiming, reaction
time, and rate control showed validity”. They therefore recommended that test
measuring these constructs should be investigated for inclusion in an enhanced pilot
selection battery. It can be inferred from this statement that there are other constructs
that could enhance pilot selection in both the military and commercial environments.
Carretta and Ree (1996) recommended that future measurements of pilot aptitude,
which have been shown to be highly “g” loaded, could include tests based on cognitive
components, chronometric methods or neural conductive velocity, because the
incremental validity of “g” specific cognitive abilities (e.g. verbal, qualitative, spatial or
perceptual speed) has been shown to be small or nonexistent. However, the
incremental validity of pilot job knowledge such as knowledge of aircraft concepts,
instruments, principles and terms, psychomotor abilities and personality scores has also
been found to be small but significant.
Taking into account the influence of measures of literacy and numeracy results found in
the present study, it is recommended that such variables be included to enhance the
predictive power of such tests. Although the results of the present study indicate that the
literacy and numeracy scores obtained provide an indication of proficiency, from a
language perspective, this does not necessarily mean that the paricipants will perform
better in the psychological test battery and the training programme. Furthermore, the
incorporation of tests, such as the Learning Potential Computerised Adaptive Test
(LPCAT) could enhance the selection process. In a study conducted by De Beer (2006)
on dynamic testing, the results of this study showed that the LPCAT provided useful
information by indicating the level of general reasoning ability and learning potential of
218
an individual. It was also reported that LPCAT may indicate the academic level an
individual is likely to perform at or the amount of effort required from an individual to
achieve success at a particular level.
This view was emphasised by Carretta (1996) in the statement that new cognitive
components offer measurement of general cognitive ability with almost no content in the
usual sense because they do not require previous learning other than the language
requirements of the instruction. In the author’s view the problem of an adverse impact on
minorities and women could be reduced or avoided if the new cognitive tests were to be
added to the pilot selection system.
6.3.2 Cross-validation
It is recommended that cross-validation of the psychological tests be undertaken on a
second sample of the job applicants for the cadet pilot training programme. This is
essential, but rarely happens (Murphy, in Cascio, 1991). Cross-validations are preferred
for the following reasons:
All of the information contained in a sample can be used. This maximises the stability
of regression weights.
Statistical correction is faster and requires less effort on the part of the researcher.
Formula estimates appear to be highly accurate.
Coupled with this is the need to select the sample in such a way that it is possible to
minimise, even eliminate, pre-selection and restriction of range.
6.3.3 Longitudinal study of progress through performance
Owing to the existence of substantial group differences in average test scores,
particularly differences between black and white job applicants, the issue of fairness
needs to be addressed. A test may be fair in predicting performance, but still predict
performance rather poorly.

219
Human performance is far too complex to expect anything approaching perfect
prediction. Tests are at best only moderately good predictors of job performance
(Hartigan & Wigdor, 1989). One of the consequences of prediction errors is that certain
people who could perform well on the job, but who score in the lower ranges in the tests,
are screened out, whereas others who score well on the tests, and are thus selected,
could perform inadequately on the job (Hartigan & Wigdor, 1989).
It is further recommended that the effect of literacy levels, particularly English literacy
and numeracy, in psychological tests should be explored. Also, a thorough job analysis
should be conducted to identify critical skills and competences for a pilot, thus ensuring
that appropriate and relevant psychological instruments are used in the selection
process.
De Kock and Schlechter (2009) appeared to share similar sentiments when they
asserted that selection decision errors in pilot selection may be catastrophic. Such errors
could be minimised by using more accurate selection procedures that capture more of
the factors that influence performance in the cockpit.
With the advances in research in the military environment, it is strongly recommended
that future research on pilot selection be conducted in collaboration with the SAAF,
acknowledging that there could be differences in some of the specific variables these
environments would require of their personnel.
6.4 CHAPTER SUMMARY
The conclusions drawn on the basis the specific aims of the research were presented in
this chapter. The conclusions guided by the corresponding general and specific aims of
the literature review and the empirical research were also discussed.
The limitations of the present study were discussed in terms of practical constraints,
restriction of range and the sample, in determining the predictive validity of the
psychological tests, in so far as they hinder efforts to maximise the validity of the present
study. The results of a single study of this kind do not necessarily provide conclusive
evidence of the reliability and prediction power of the psychological tests used. However,
the findings of the present research study do form a foundation for further research.

220
Recommendations for further research were presented, taking into account the
incorporation into the research of other psychological perspectives and paradigms from
other disciplines. Cross-validation (and the reason for it) was recommended. The effect
of the longitudinal studies through literacy training programmes and performance, as
well as the contribution of literacy, numeracy and aptitude at a micro-economic level (i.e.
in terms of productivity), should be also be considered.

221
REFERENCE LIST
Aiken, L. R. (1991). Psychological testing and assessment (7th ed.). Boston: Allyn and
Bacon.
Aiken, L. R. (1997). Psychological testing and assessment (9th ed.). Boston: Allyn and
Bacon.
Aiken, L. R. (2003). Psychological testing and assessment (11th ed.). Boston: Pearson
Education Group, Inc.
Airline pilot job description and activities. (May 17, 2010). Retrieved from
http://www.prospects.ac.uk/p/types_of_job-description.jsp
Anastasi, A. (1990). Psychological testing (6th ed.). New York: MacMillan.
Anastasi, A. & Urbina, S. (1997). Psychological testing (7th ed.). New Jersey: Upper Saddler
River, Prentice Hall.
Anderson, J. (1976). Psycholinguistic experiments in foreign language testing. St Lucia,
Queensland: University of Queenslands Press.
Armour-Thomas, E. & Gopaul-McNicol, S. (1998). Assessing intelligence: Applying a bio-
cultural model . Thousand Oaks: Sage Publications.
Arvey, R.D. & Faley, R.H. (1988). Fairness in selecting employees (2nd ed.). Reading,
Mass.: Addison-Wesley.
Aspeling, E. G. (1990). Vlieenierskeuringstrategiee vir die 1990s. Pretoria: National Institute
for Personnel Research.

222
Avenant, T. J. (1988). The establishment of an individual intelligence scale for adult South
African. Report on an exploratory study conducted with the WAIS-R on a sample of
black prison warders (Report on an exploratory study conducted with the WAIS-R on a
sample of black prison warders No. P-91). Pretoria: Human Sciences Research Council.
Barkhuzen, W., Schepers, J., & Coetzee, J. (2002). Rate of information processing and
reaction time of aircraft pilots and non-pilots. South African Journal of Industrial
Psychology, 28(2), 67-76.
Bartholomew, D. J. (2004). Measuring intelligence. Cambridge: Cambridge University Press.
Bartram, D. (2004). Assessment in organizations. Applied Psychology: An International
Review, 53(2), 237-259.
Bartram, D. & Baxter, P. (1996). Validation of the Cathay pacific airways pilot selection
program. International Journal of Aviation Psychology, 6(2), 149-169.
Bedell, B., Van Eeden, R. & Van Staden, F. (1999). Culture as a moderator in psychological
test performance: Issues and trends in South Africa. South African Journal of Industrial
Psychology, 25(3), 1-7.
Bergh, Z. (2003). Methodology. In Z.C. Bergh & A.L. Theron, (Eds). Psychology in the work
context. (2nd ed., pp 17-43). Cape Town: Oxford University press, Southern Africa
(Pty) Ltd.
Bergh, Z. (2009). Assessment of personality and individual differences. In Z.C. Bergh, &
A.L. Theron (Eds.), Psychology in the work context (4th ed., pp. 406-432). Cape Town:
Oxford University press, Southern Africa (Pty) Ltd.

223
Bingham, W. (1937). Aptitude and aptitude testing. New York, N.Y.: Harper.
Birch, A. & Hayward, S. (1994). Individual differences. Houndmills: MacMillan.
Bloom, L. & Lahey, M. (1978). Language development and language disorder. New York:
MacMillan.
Blox Test Administrator manual. (1983). The National Institute of Personnel Research.
Johannesburg: Human Sciences Research Council.
Bohlmann, C.A. & Pretorius, E.J. (2002). Reading skills and mathematics. South African
Journal of Higher Education, 6(3), 196-206.
Bornstein, R., Schuster, C. S. & Ashburgn, (1992). Perception without awareness: cognitive,
clinical and social perspective. New York: Guilford Press.
Brace, N., Kemp, R. & Snelgar, R. (2009). SPSS for psychologists (4th ed.). Basingstole:
Palgrave Macmilla.
Breakwell, G. M., Hammond, S. & Fife-Schaw, C. (2000). Research methods in psychology.
London ; Thousand Oaks, Calif.: Sage Publications.
Burke, E., Hobson, C., & Linsky, C. (1997). Large sample validations of three general
predictors of pilot training success. International Journal of Aviation Psychology, 7(3),
225-234.
Butcher, J.N. (2002). Assessing pilots with ‘the wrong stuff’: A call for research on
emotional health factors in commercial aviators. International Journal of Selection and
Assessment, 10(1/2), 168- 184.

224
Calfee, R. (1993). Paper, pencil, potential and performance. Current Directions in
Psychological Science, 2, 6-7.
Campbell, J. S., Castaneda, M., & Pulos, S. (2010). Meta-analysis of personality
assessments as predictors of military aviation training success. The International
Journal of Aviation Psychology, 20(1), 92-109.
Careers offered by SAA (2010, October 21). Retrieved from http://www.caa.co.za./careers
in aviation.
Carpenter, P. A., Just, M. A. & Shell, P. (1990). What one intelligence test measures: A
theoretical account of the processing in the raven progressive matrices
test. Psychological Review, 97, 404-431.
Carretta, R.T. & Ree, M.J. (2003). Pilot selection methods. In P.S. Tsang & M.A. Vidulich
(Eds.), Principles and practice of aviation psychology (pp. 357-396). Mahwah:
Lawrence Erlbaum Associates, Inc.
Carretta, T. R. & Ree, M. J. (1996). U.S. Air force pilot selection tests: What is measured
and what is predictive? International Journal of Aviation Psychology, 67(3), 279-282.
Carretta, T. R., Perry, D.C. Jr. & Ree, M. J. (1996). Prediction of situation awareness in F-15
pilots. International Journal of Aviation Psychology, 6(1), 21-41.
Carretta, T.M. (1992). Recent developments in U.S, Air Force pilot candidate selection and
classification. Aviation, Space and Environmental Medicine, (December), 1112-1114.
Carretta, T.R. & Ree, M.J. (1989). Pilot - candidate selection method: Sources of
validity. International Journal of Aviation Psychology, 4(2), 103-117.

225
Carretta, T.R. & Ree, M.J. (1994). Pilot-candidate selection methods: Sources of
validity. The International Journal of Aviation Psychology, 4(2), 103-117.
Carretta, T.R. & Ree, M.J. (1996). U.S. air force pilot selection tests: What is measured and
what is predictive? Aviation, Space and Environmental Medicine, 67(3), 279-283.
Carroll, J. B. (1993). Human cognitive abilities: A survey of factor analytic studies.
Cambridge, England: Cambridge university press.
Cascio, W. F. (1991). Applied psychology in personnel management (4th ed.). Englewood
Cliff, New Jersey: Prentice-Hall.
Cashdan, A. (1986). Literacy: Teaching and learning language skills. Oxford, UK New York,
NY, USA : Blackwell.
Cattell, R. B. (1987). Intelligence: Its structure, growth and action. Amsterdam New York :
North-Holland New York: Elsevier Science Pub. Co.
Chew, C. R. (1992). Policies for literacy. In C. Hedley, D. Feldman & P. Antonacci
(Eds.), Literacy across the curriculum (pp. 3-14). Norwood, New Jersey: Ablex
Publishers. Corp.
Clark, H. H. (1996). Using language. England; New York: Cambridge University press.
Clayton, K. N. (1984). An introduction to statistics for psychology and education. Columbus:
C.E. Merrill Pub. Co.
Cohen, B. H. (2008). Explaining psychological statistics (3rd ed.). New Jersey: John Wiley
and Sons, Inc.

226
Cohen, J. (1992). Qualitative methods in psychology: A power primer. Psychological
Bulletin, 112(1), 155-159.
Cohen, R.J. & Swerdlink, M.E. (2002). Psychological testing and assessment: An
introduction to tests and measurement (5th ed.). Mountain View, Calif.: McGraw-Hall
Companies, Inc.
Cooper, D.R. & Schindler, P.S. (1998). Business research methods (6th ed.). Boston:
Irwin/McGraw-Hill.
Copans, G. (2007). Clear skies for South African aviation industry. (2010, April 31)
Retrieved from http://www.engineeringnews.co.za/article/clear-skies-for - South-
African-aviation industry.
Copeland, R. W. (1979). How children learn mathematics: Teaching implications of Piaget’s
research (3rd edition ed.). New York: MacMillan.
Cramer, R. L. (1978). Writing, reading and language growth: An introduction to language
arts. Columbus: Merill.
Cronbach, L. J. (1990). Essentials of psychological testing (5th ed.). New York: Harper
Collins Publishers, Inc.
Cunningham, G. K. (1986). Educational and psychological measurement. New York: Colliers
MacMillan.
Curwin, J. & Slater, R. with Hart, M. (1994). Numeracy skills for business. London, Chapman
Hall New York: Wisley.

227
Damos, D. L. (1996). Pilot selection batteries: Shortcomings and perspectives. The
International Journal of Aviation Psychology, 6(2), 199-209.
De Beer, M. (1994) Dynamic assessment – meeting new challenges in training and
development. Paper presented at the Sixth Conference of the South African Institute
for Management Scientists, University of the Western Cape, Cape Town.
De Beer, M. (1997). The construction of a dynamic, computerized adaptive test for
measuring Learning Potential (Preliminary report) Pretoria: Human Sciences Research
Council.
De Beer, M. (2000). The construct and evaluation of a dynamic computerised adaptive tests
for the measurement of learning potential. (Unpublished Doctoral thesis). University of
South Africa, Pretoria.
De Beer, M. (2006). Dynamic testing: Practical solutions to some concerns. South African
Journal of Industrial Psychology, 32(4), 8-14.
De Kock, F. & Schlechter, A. (2009). Fluid intelligence and spatial reasoning as predictors of
pilot training performance in the South African air force (SAAF). South African Journal
of Industrial Psychology, 35(1), 1-8.
De Montalk, R. J. (2008). Developing proficiency in air transport pilots: The case for
introduction of non - technical skills in basic pilot training programmes. (Unpublished
Doctoral thesis). Massey University Palmerston North, New Zealand.
De Vito, J. A. (1973). Language: Concepts and processes. Englewood Cliffs, New Jersey:
Prentice-Hall.

228
Department of Education. (1997). Numeracy learning programmes document: Foundation
phase. Pretoria: Department of Education.
Dillon, R. F. (1997). Handbook on testing. Westport, Conn.: Greenwood Press.
Downey, R., Suzuki, M. & Van Moere, A. (2010). High-stakes English-language assessments
for aviation professionals: Supporting the use of a fully automated test of spoken-
language proficiency. IEEE Transactions on Professional Communication, 53(1), 18-32.
Elkonin, D., Foxcroft, C., Roodt, G., & Astbury, G. (2005). The use of assessment measures
in various applied contexts. In C. Foxcroft, & G. Roodt (Eds.), An introduction to
psychological assessment in South African context (2nd ed., pp. 195-212). Cape Town:
Oxford University press Southern Africa.
Ellsworth, N.J., Hedley C.N. & Baratta N.A. (Eds). (1994). Literacy: a redefinition. Hillsdale:
NJ. L. Erlbaum Associate Publishers.
Employment Equity Act, 55, (1998). Government Gazette (19370).
Equal Employment Opportunity Commission (EEOC). (1978). Uniform Guidelines on
Employee Selection Procedures. Federal Register, 12333-12336.
Everette, J. E. (1991). Tertiary entrance predictors of first year university
performance. Austrian Journal of Education, 35(1), 24-40.
Feldhusen, J.F. & Jarwan, F. (1995). Predictors of academic success at state-supported
residenial school for mathematics and science: A validity study. Educational and
Psychological Measurement, 55, 505-512.

229
Ferdman, B. M., Weber, R. & Ramirez, E.D. (1994). Literacy across language and culture.
Albany, New York: State University of New York press.
Field, A. (2000). Discovering statistics using SPSS for windows: Advanced techniques for
beginners. London: Sage Publications Limited.
Field, A. P. (2005). Discovering statistics using SPSS: (and sex, drugs and rock 'n' roll).
London: Sage Publications.
Fillmore, C. J., Kempler, D. & Wang, W. (1979). Individual differences in language ability
and language behavior. New York: Academic press.
Flotman, A. P. (2002). The predictive validity of the selection battery for trainee pilot in the
South African air force. (Unpublished Master’s dissertation). University of South Africa,
Pretoria.
Foxcroft, C. & Roodt, G. (2005). An overview of assessment: Definition and scope. In C.
Foxcroft & G. Roodt (Eds.), An introduction to psychological assessment in the South
African context (2nd ed., pp. 3-7). Cape Town: Oxford university press, South Africa
(Pty) Ltd.
Foxcroft, C., Roodt, G. & Abrahams, F. (2005). Psychological assessment: A brief
retrospective overview. In C. Foxcroft & G. Roodt (Eds.), An introduction to
psychological assessment in the South African context (2nd ed., pp. 8-23). Cape Town:
Oxford university press, South Africa (Pty) Ltd.

230
Foxcroft, C.D. & Aston, S. (2006). Critically examining language bias in the South African
adaption of the WAIS-III. South African Journal of Industrial Psychology, 32(4), 97-
102.
Freedman, G. (2000). Validity of measures of cognitive ability for predicting literacy and
numeracy performance (Unpublished Master’s dissertation). Pretoria: University of
South Africa.
Ghiselli, R.D., Campbell, J.P. & Zedeck, S. (1981). Measurement theory for the behavioural
sciences. San Francisco, CA: Freeman.
Glass, G.V. & Stanley, J.C. (1984). Statistical methods in education and psychology
(2nd Ed.). Englewood Cliffs, N.J.: Prentice-Hall.
Green, B. (1999). The new literacy challenges? literacy learning: Second thoughts. A
Journal of the Australian Literacy Educator's Association, 7(1), 36-46.
Griffin, G., Morrison, T., Amerson, T. & Hamilton, P. (1987). Predicting air combat
maneuvering (ACM) performance: Fleet fighter ACM readiness program grades as
performance criteria (Tec. Rep. No. NAMRL-1333). Pensacola, FL: Naval Aerospace
Medical Research Laboratory.
Griffin, G. & Shull, R. (1990). Predicting F/A-18 fleet replacement squadron performance
using an automated battery of performance-based tests (Tech. Rep. No. NAMRL-
1354). Pensacola, FL: Naval Aerospace Medical Research Laboratory.
Groth-Marnat, G. (2003). Handbook of psychological assessment (4th ed.). New Jersey:
John Wiley and Sons, Inc.

231
Gustafsson, J. E. (1989). A unifying model for the structure of intellectual
abilities. Intelligence, 8, 179-203.
Halliday, M. A. K. (1973). Explorations in the functions of language. London: Edward Arnold.
Halliday, M. A. K. (1976). System and function in language: Selected papers. London:
Oxford University Press.
Halliday, M. A. K. & Mathiessen, C. M. I. M. (1999). Construing experience through
meaning: A language-based approach to cognition. London: Cassell.
Hamon, P. (2000). Reflecting on literacy in education. London; New York: Falmer Press.
Harris, T.L. & Hodges, R.E. (Eds.). (1995). The literacy dictionary. Newark, Del.:
International Reading Association ERIC Clearinghouse on Reading and Communication
Skills, National Institute of Education.
Hartigan, J.A. & Wigdor, A.K. (Eds.). (1989). Fairness in employment testing: Validity
generation, minority issues, and the general aptitude test battery. Washington D.C.:
National Academy press.
Hasan, R. & Martin J.R. (1989). Language development: Learning language, learning
culture, meaning and choice in language. Norwood, N.J.: Ablex Pub. Corp.
Hesketh, B. & Robertson, I. (1993). Validating personnel selection: A process model for
research and practice. International Journal of Selection and Assessment, 1(1), 3-17.
Heugh, K. (2001). Many languages in education. Perspectives in Education, 19(2), 17.

232
Hilton, T. F. & Dolgin, D. L. (1991). Pilot selection in the military of free world. In R. Gal, &
A. D. Mengelsdorf (Eds.), Handbook of military psychology (pp. 81-101). New York:
Wiley.
Holburn, P. T. (1992). Blox test administrator's manual. Pretoria: Human Sciences Research
Council.
Holburn, P. T. (1993). Psychometric assessment: Identifying appropriate assessment
techniques for specific jobs to ensure that the right person is selected. Paper presented
at the Congress in culture fair assessment.
Holme, R. (2004). Literacy: An introduction. Edinburgh: Edinburg University Press Ltd.
Hoole, C. & Vermuelen, L.P. (2003). Job satisfaction among South African aircraft
pilots. South Journal of Industrial Psychology, 29(1), 52-57.
Hough, B. & Horne, T.J. (2006a) ELSA-FET Intermediate Assessment Administration.
Unpublished.
Hough, B. & Horne, T.J. (1989). English literacy skills assessment (test manual). Natal:
Pinetown Printers.
Howitt, D. & Cramel, D. (2003). An introduction to statistics in psychology (Rev. 2nd ed.).
England: Pearson Education Limited.
Hughes, M. (1986). Children and numbers: Difficulties in learning mathematics. Oxford
[Oxfordshire], UK New York, NY, USA: B. Blackwell.
Hunter, D.R. & Burke, E.F. (1994). Predicting aircraft pilot-training success: A meta-analysis
of publish research. The International Journal of Aviation Psychology, 4(4), 297-313.

233
Hunter, J. E. (1986). Cognitive ability, cognitive attitude, for knowledge and job
performance. Journal of Vocational Behavior, 29, 340-362.
Hutchison, K. (March, 2009). Airline pilot: Entry requirements. Retrieved August, 07, 2010,
from http//www.prospects.ac.uk/p/types_of_job/airline_entry_requirements.jsp
Hutton, B. (Ed.). (1992). Adult basic education in south africa: Literacy, english as a second
language and numeracy. London: Oxford University press.
Huysamen, G. K. (1996). Psychological measurement: An introduction with South African
examples (3rd Rev. Ed.). Pretoria: van Schaik.
Insua, A. M. (1983). WAIS-R factor structures in two cultures. Journal of Cross-Cultural
Psychology, 14(4), 427-438.
Jackson, C. (1996). Understanding psychological testing. Leicester: The British Psychological
Society.
Jensen, A. R. (1993b). Test validity: G versus "tactical knowledge". Current Directions in
Psychological Science, 2, 9-10.
Johnston, N. (1996). Psychological testing and pilot licensing. The International Journal of
Aviation Psychology, 6(2), 179-197.
Jukes, M.C.H. & Grigorenko, E.L. (2010). Assessment of cognitive abilities in multiethnic
countries: The case of the Wolof and Mandinka in the Gambia. British Journal of
Educational Psychology, 80, 77-97.
Kerlinger, F. N. (1986). Foundations of behavioural research (3rd ed.). New York: CBS.

234
Kerlinger, F.N. & Lee, H.B. (2000). Foundations of behavioural research (4th ed.). USA:
Harcourt College Publishers.
Kline, P. (1998). The new psychometrics: Science, psychology and measurement. London:
Routledge.
Kriek, H. & Dowdeswell, K. (2010). Adverse impact in South Africa. In J. M. Outtz
(Ed.), Adverse impact: Implications for organizational staffing and high stakes
selection (pp. 375-399). New York: Routledge, Taylor and Francis Group.
Kriek, N. J. S. (1993). In a memo to Mnr. T.J. Horne (Ed.), English literacy skills assessment
(ELSA) project predictive validity at STD 6 level. Pretoria:
KrÜgel, R. (2006). The influence of the language proficiency of English teachers who are not
native speakers of English on language skills of their learners. (Unpublished Master’s
dissertation). North-West University, Vanderbijpark.
Labour Relations Act, No 66 (1995). Government Gazette 366 (16861).
Leong, F.T.L. & Austin, J.T. (2006). The psychology research book: A guide for graduate
students and research assistants. Thousand Oaks, Califonia: Sage Publications.
Lezak, M. D. (1995). Neuropsychological assessment (3rd ed.). New York, Oxford: Oxford
University press, Inc.
Lieberman, P. (1975). On the origins of language: An introduction to the evolution of human
speech. New York: MacMillan.

235
Loukopoulos, D., Dismukes, R.K. & Barshi, I. (2003, April). Concurrent task demands in the
cockpit: Challenges and vulnerabilities in routine flight operations. 12th International
Symposium on Aviation Psychology. 1- 6.
Louw, D. A. & Edwards, D. J. A. (1997). Psychology an introduction for students in South
Africa (2nd ed.). Johannesburg: Heinemann.
Lukin, A. & Ross, L. (1997). The numeracy handbook: A resource for literacy and numeracy
teachers. Sew South Wales: New South Wales AMES: NCELTR.
Marais, H. The impact of global recession on South Africa. (2010, June, 21). Retrieved from
http://www.amandlapublishers.co.za/home-menu-item/156
Martinussen, M. (1996). Psychological measures as predictors of pilot performance: A meta-
analysis. The International Journal of Aviation Psychology, 6(1), 1-20.
Martinussen, M. & Torjussen, T. (1998). Pilot selection in Norwegian air force: A validation
and meta-analysis of the test battery. The International Journal of Aviation
Psychology, 8(1), 33-45.
Mazak, C. (2007). Appropriation and resistance in the (English literacy practices of Puerto-
rican farmers. In V. Purcell-Gates (Ed.), Cultural practices of literacy: Case studies of
language, literacy, social practice and power. (pp. 25-40). Mahwah, N.J.: Lawrence
Erlbaum Associates, Inc.
McClelland, D.C. (1993). Intelligence is not the best predictor of job performance. Current
Directions in Psychological Science, 2, 5-6.

236
McCulloch, S. (1993). Professional forum: Recent trends in international
assessment. Internal Journal of Selection and Assessment, 1(1), 59-61.
Meiring,D., Van de Vijver, A.J.R., Rothman, S. & Barrick, M.R. (2005). Construct, item, and
method bias of cognitive and personality tests in South Africa. South African Journal of
Industrial Psychology, 31 (1), 1-8.
Moerdyk, A. (2009). The principles and practice of psychological assessment (First ed.).
Pretoria: Van Schaik Publishers.
Molosiwa, A. (2007). Language and literacy in Botswana. In V. Purcell-Gates (Ed.), Cultural
practices of literacy: Case studies of language, literacy, social practice and power (pp.
41-54). Mahwah, N.J.: Lawrence Erlbaum Associates, Inc.
Morgan, G. (1980). Paradigm, metaphors and puzzle solving in organizational
theory. Administrative Science Quarterly, 25(4), 605-622.
Moss, B. J. (1994). Literacy across communities. Cresskill, N.J.: Hampton Press.
Mouton, J. & Marais, H.C. (1990). Basic concepts in methodology of the social sciences.
Pretoria: Human Sciences Research Council.
Muller, J. & Schepers, J. (2003). The predictive validity of the selection battery used for
junior leaders training within the South African National Defense Force. South African
Journal of Industrial Psychology, 29(3), 87-98.
Mundy-Castle, C. A. (1974). Social and technological intelligence in western and non-
western cultures. In S. Pilowsky (Ed.), Cultures in collision (pp. 46-52). Adelaide:
Australian National Association for Mental Health.

237
Murphy, K. R. (1989). Is the relationship between cognitive ability and job performance
stable over time? Human Performance, 2, 183-200.
Murphy, K.R. & Davidshofer, C.O. (2005). Psychological testing: Principles and
applications (6th ed.). Upper Saddle River, New Jersey: Pearson/Prentice Hall.
Nell, V. (1999). Standardising the WAIS-III and WMS-III for South Africa: Legislative,
psychometric and policy issues. South African Journal of Psychology, 24(2), 100-108.
Nunan, D. (1999). Second language teaching and learning. Boston, Mass.: Heinle & Heinle
Publishers.
Nunns, C. & Ortlepp, K. (1994). Exploring predictors of academic success in psychology 1 at
Wits University as an important component of fair student selection. South African
Journal of Psychology, 24, 201-207.
Nzama, L., De Beer, M. & Visser, D. (2008). Predicting work performance through selection
interview rating and psychological assessment. South African Journal of Industrial
Psychology, 34(3), 39-47.
O'Hare, D. & Walsh, K. (2003). The shape of aviation psychology II: Inspiration and
continuation. International Journal of Aviation Psychology, 13(1), 23-32.
Oller, J. W. (1979). Language testing at school: A pragmatic approach. Harlow, Essex:
Longman.
Oller, J.W. & Perkins, K. (1980). Research in language testing. Boston: Newbury House.

238
Owen, K. (1991). Test bias: The validity of the junior aptitude tests (JAT) for various
population groups in South Africa regarding construct measured. South African Journal
of Psychology, 21(2), 112-118.
Owen, K. (1992). The suitability of raven's standard progressive matrices for various groups
in South Africa. Personality, Individual Differences Journal, 13(2), 149-159.
Owen, K. (1996). Aptitude tests. In K. Owen, & J. J. Taljaard (Eds.), Handbook for the use
of psychological and scholastic tests of the HRSC (pp. 191-270). Pretoria: Human
Science Research Council.
Owen, K. & Taljaard, J.J. (1989). Handbook for the use of psychological and scholastic test
of the IPER and NIPR. Pretoria: Human Sciences Research Council.
Papalia, C.K. & Olds, S.W. (1995). Human development (6th ed.). New York: McGraw-Hill.
Paterson, H. & Uys, K. (2005). Critical issues in psychological test use in the South African
workplace. South African Journal of Industrial Psychology, 31(2), 12-22.
Pierce, C. A., Block, R.A. & Aguinis, H. (2004). Cautionary note on eta-squared values from
multifactor ANOVA designs. Educational and Psychological Measurement, 64(6), 916-
924.
Pretoruis, E. & Naude, H. (2002). A culture in transition: Poor reading and writing ability
among children in South African township. Early Child Development and Care, 172(5),
439-449.
Price, H. (1997). The value of managing language diversity. People Dynamics, (January),
20-22.
239
Purcell-Gates, V. (Ed.). (2007). Cultural practices of literacy: Case studies of language,
literacy, social practices and power. Mahwah, N.J.: Lawrence Erbaum Associates
Publishers.
Pyle, D. W. (1979). Intelligence: An introduction. Boston: Routledge and Kegan Paul.
Raven, J. (2000). The Raven's progressive matrices: Change and stability over culture and
time. Cognitive Psychology, 41, 1-48.
Raven, J.C., Raven, R.C. & Court, J.H. (1998). Raven’s manual. Aseford: Oxford
Pyschologists press Ltd.
Raven, J.C., Court, J.H. & Raven, J. (1988). Manual for Raven’s Progressive Matrices and
Vocabulary Scales (Section 4). London: H.K. Lewis.
Raven, J.C. & Court, J.H. (1985). Manual for Raven’s progressive matrices. London: H.K.
Lewis.
Ree, M. J. & Carretta, T. M. (1996). Central role of g in military pilot selection. The
International Journal of Aviation Psychology, 6(2), 111-123.
Ree, M. J. & Earles, J. A. (1992). Intelligence is the best predictor of job
performance. Current Directions in Psychological Science, 1, 86-89.
Ree, M. J. & Earles, J. A. (1993). g is to psychology what carbon is to chemistry: A reply to
Sternberg and Wagner, McClelland and Calfee. Current Directions in Psychological
Science, 2, 11-12.
Ree, M.J. & Carretta, T.R. (1996). Central role of g in military pilot selection. International
Journal of Aviation Psychology, 6(2), 111-123.

240
Ree, M.J. & Carretta, T.R. (2002). g2K. Human Performance, 15(1), 3-23.
Ree, M.J. & Earles, J.A. (1991). Predicting training success: Not much more than
g. Personnel Psychology, 44, 321-332.
Reschly, D. J. & Robinson-Zanartu, C. (2002). In G. Goldstein, & M. Hersen
(Eds.), Handbook of psychological assessment (pp. 183-186). New York: Elsevier
Science.
Retzlaff, P. D. & Gibertini, M. (1987). Air force pilot personality: Hard data on the "right
stuff". Multivariate Behavioral Research, 22, 383-399.
Rogers, S. (1975). Children and language: Readings in early language and socialization.
London: Oxford University Press.
Rushton, J. P., Skuy, M. & Fridjhon, P. (2003). Performance on Raven's advanced
progressive matrices by African, East Indian, and white engineering students in South
Africa. Intelligence, 31(2), 123-137.
Samunda, R. J., Feuerstein, R., Kaufman Lewis, A. S. & Stenberg, R. A. (1998). Advances in
cross-cultural assessment. Thousand Oaks, California: Sage Publication.
Sattler, J. M. (1988). Assessment of children (3rd ed.). San Diego: J.M. Sattler.
Schepers, J.M. (1983), South African Wechsler Adult Intelligence Scale. (Manual ed.).
Pretoria: Human Sciences Research Council.
Schmidt, F.L. & Hunter, J.E. (1998). The validity and utility of selection methods in
personnel psychology and theoretical implications of 85 years research
findings. Psychological Bulletin, 124(2), 262-274.

241
Schoeman, H. S. (1991). In Messrs B. Hough & T.J. Horne (Eds.), English literacy skills test
(personal communication- memo, April 26, 1991). Pretoria:
Segal, M. H., Dasen, P. R., Berry, J. W. & Poortinga, Y. H. (1999). Human behavior in global
perspective (2nd ed.). Needham Heights M.A.: Allyn and Bacon.
Shaughnessy, J. J. (2000). Research methods in psychology. Boston: McGraw-Hill.
Shochet, I. M. (1994). The moderator effect of cognitive modifiability on a traditional
undergraduate admissions test for disadvantaged black students in South Africa. South
African Journal of Psychology, 24, 208-215.
Shum, D., O'Gorman, J. & Myors, B. (2006). Psychological testing and assessment. South
Melbourne, Australia; New York: Oxford university press.
Shuttleworth-Edwards, A. B., Kemp, R. D., Rust, A. L., Muirhead, J. G. L., Hartman, N.P. &
Radloff, S.E. (2004). Cross-cultural effect on IQ test performance: A review and
preliminary normative indications on WAIS-!!! test performance. Journal of Clinical and
Experimental Neuropsychology, 26(7), 903-920.
Shuttleworth-Jordan, A. B. (1996). On not reinventing the wheel: A clinical perspective on
cultural relevant test usage in South Africa. South African Journal of Psychology, 26(2),
96-102.
Skills Developments Act, 97, (1998) Government Gazette, (19420).
Society for Industrial Psychology. (1992). Guidelines for the validation and use of personnel
selection procedures. Psychological Association of South Africa.

242
Sommer, M., Olbrich, A. & Arendasy, M. (2004). Improvements in personnel selection with
neural networks: A pilot study in the field of aviation psychology. International Journal
of Aviation Psychology, 14(1), 103-115.
South African Airways. (2010) . South African Airways Employment opportunities. Retrieved
from http://www.flysaa.com.
Southwood, S., Spannerberg, R. & Stoker, J. (1997). Developing number sense. Pretoria:
Via Africa.
Spearman, C. (1904). General intelligence objectively determined and measured. American
Journal of Psychology, 15(2), 201-203.
SPSS base 9.0 application guide (1999). Chicago: SPSS Inc.
Statistics South Africa. (2006). Population statistics: Mid-year population
estimates. Retrieved from http://www.statssa.gov.za.
Stauffer, J. & Ree, M.J. (1996). Predicting with logistic or linear regression: Will it make a
difference in who is selected for pilot training. International Journal of Aviation
Psychology, 6(3), 233-240.
Sternberg, R. J. (1982). Handbook of human intelligence. Cambridge (Cambridgeshire) New
York: Cambridge University press.
Sternberg, R.J. & Wagner, R.K. (1993). The g-ocentric view of intelligence and job
performance is wrong. Current Directions in psychological Science, 2, 1-5.
Super, D.E. & Crites, J.O. (1965). Appraising vocational fitness by means of psychological
tests (Revised edition ed.). New York: Harper.

243
Taylor, T. R. (1994). A review of three approaches to cognitive assessment, and a proposed
integrated approach based on a unifying theoretical framework. South African Journal
of Psychology, 24(4), 184-157.
Theron, A. (2003). Perspectives on general and work behavior. In Z.C. Bergh & A.L.Theron
(Eds.), Psychology in the working context. (2nd ed., pp. 3-15). Cape Town: Oxford
University press Southern African.
Theron, C. (2009). The diversity-validity dilemma: In search of minimum adverse impact
and maximum utility. South African Journal of Industrial Psychology, 35(1), 1-13.
Thurstone, L. L. (1938). Primary mental abilities. London: University of Chicago press.
Tredoux, C. & Durrheim, K. (Eds.). (2002). Numbers, hypotheses and conclusions: A course
in statistics for social sciences. Landsdowne, Cape Town: UCT press.
Tsang, P. S. & Vidulich, M. A. (2003). Principles and practice of aviation psychology.
Mahwah, N.J.: Lawrence Erlbaum.
Van de Vijver, A. J.R. & Rothmann, S. (2004). Assessment in multicultural groups: The
South African case. South African Journal of Industrial Psychology, 30(4), 1-7.
Van den Berg, A. R. (1994). Intelligence tests. In K. Owen & J. J. Taljaard (Eds.), Handbook
for the use of psychological and scholastic tests of the IPER and NIPR . (83 – 136).
Pretoria: Human Sciences Research Council.
Van der Merwe, D. (2003). Predictive validity of a selection battery for technikon
students. (Unpublished Master’s dissertation). University of South Africa, Pretoria.

244
Van der Merwe, R. P. (1999). Psychological assessment in industry. South African Journal of
Industrial Psychology, 25(3), 8-11.
Van der Merwe, R. P. (2002). Psychometric testing and human resource
management. South African Journal of Industrial Psychology, 28(2), 77-86.
Van der Walt, H. S. (1998). Psychological tests: Refined instruments for reliable information
to decision-makers. In Focus Forum, 5(4), 16-17.
Van der Zanden, J. W. (1993). Human development (5th ed.). London: Oxford University
press.
Van Eeden, R. & De Beer, M. (2005). Assessment of cognitive functioning. In C. Foxcroft &
G. Roodt (Eds.), An introduction to psychological assessment in the South African
context (2nd Ed., pp. 119-139). Cape Town: Oxford university press, Southern Africa
(Pty) Ltd.
Van Eeden, R., De Beer, M. & Coetzee, C. H. (2001). Cognitive ability, learning potential,
and personality as predictors of academic achievement by engineering and other
science and technology students. South African Journal of Higher Education, 15(1),
171-179.
Van Rooyen, E. (2001). Die voorspelling van die akademisiese prestasie van studente in 'n
universitetsoorbruggingsprogram. South African Journal of Higher Education, 15(1),
180-188.
Vergnaud, G. (1997). Learning and teaching mathematics: An international perspective.
Hove, East Sussex: Psychology press.
245
Vermeulen, L.P. (2009). Flight instructor’s perception of pilot behavior related to gender.
South African Journal of Industrial Psychology. 35 (1), 1-8.
Vernon, P. E. (1969). Intelligence and cultural environment. London: Methen.
Viljoen, J. (1999). Education 121/EI. Johannesburg: Braamfontein College Publications.
Wagner, R. G. (1991). The psychology of reading: An introduction (2nd ed.). New York:
Oxford University press.
Walsh, W. & Betz, N. E. (1995). Tests and assessment. Englewood Cliffs: Prentice Hall.
Wechsler, D. (1997) Administration and scoring manual for the Wechsler Adult Intelligence
Scale-3rd Revision (WAIS-111). San Antonio: Psychological Corporation.
Wheeler, H. L. (1993). The fairness of an engineering selection battery in the mining
industry. (Unpublished Master’s dissertation). University of South Africa, Pretoria.
Wilcocks, A. (1973). Test administrator's Manual (Rev. ed.), Intermediate battery (B/77).
Johannesburg: Human Science Research Council.
Wilson, J. (2004). Gender - based issues in aviation, attitudes towards female pilots: A
cross - cultural analysis. (Unpublished Doctoral thesis). University of Pretoria, Pretoria.
Wray, D. & Medwell, J. (1993). Literacy and language in the primary years. London:
Routledge.
Zaaiman, H. (1998). Selecting students for mathematics and science: The challenge facing
higher education in South Africa. (Unpublished Doctoral thesis). Vrije Univeriteit,
Amsterdam.

246
Zevenbergen, R. (2001). Contexts in mathematics: Implications for literacy, literacy
learning, the middle years. A Journal of the Australian Literacy Educators
Association, 9(2), 21-28.
Zimmerman, C. H. (1957). Effective personnel selection procedures. London: Staple press.
Zindi, F. (1994). Differences in psychometric performance. The Psychologist, 7, 549-552.