an investigation into the predictive validity
TRANSCRIPT

INVESTIGATING THE PREDICTIVE VALIDITY OF CAP TEST
An Investigation Into the Predictive Validity
of the CAP Test
Anneline Taljaard
206526005
INVESTIGATING THE PREDICTIVE VALIDITY OF CAP TEST
Page 2
A dissertation submitted in partial fulfilment of the requirements for the degree of
MASTER OF EDUCATION
at the
UNIVERSITY OF KWAZULU-NATAL, SOUTH AFRICA
An Investigation Into the Predictive Validity
of the CAP Test
Anneline Taljaard
Student number: 206526005
March 2013
Supervisor: Ms Sandra Land

INVESTIGATING THE PREDICTIVE VALIDITY OF CAP TEST
Page 3
ABSTRACT
The Vocational Training landscape in South Africa changed in 2000 when the 153
Technical Colleges merged to form 50 macro Further Education and Training (FET)
Colleges with new vocational programmes. In an endeavour to assist prospective students
in making an appropriate choice of programme, placement tests prior to registration were
implemented. The Competency and Placement (CAP) test was developed to identify gaps
in the students’ knowledge of the grade 9 curriculum in order to identify high risk students
prior to registration. This study aims to discover whether results of the CAP test of
students at Boland Further Education and Training (FET) College correlate with their final
year-end results in numeracy and literacy, and to what extent the test could be used to
predict students’ future achievement.
Data from 710 students were used to determine the correlations between their CAP
scores and their year-end examination results. A Pearson product-moment coefficient (r)
was calculated to indicate the extent of correlation for different groups. The coefficients of
determination (r²), a coefficient used in the prediction of future outcomes, were also
calculated. It was found that there were correlations of different strengths for different
groups, but the coefficients of determination did not indicate that the CAP test could be
used to predict the outcomes of the final year-end examinations. Therefore it can be
concluded that the CAP test is not a valid instrument to predict academic success and
should be used only to identify grade 9 mathematics and English skills gaps, according to
the purpose of its design.
Keywords: placement test, correlation, prediction, National Curriculum (Vocational), NCV,
Mathematics, English, Further Education and Training Colleges, FET.

INVESTIGATING THE PREDICTIVE VALIDITY OF CAP TEST
Page 4
.
09 December 2009
Mrs A Taljaard PO Box 50147 WEST BEACH 7449
Dear Mrs Taljaard
L U UNIVERSITY OF
KWAZULU-NATAL University ofKlWlZulu-NtdaI
Resurch OjJkt G_ Mbeki Cemn
Wmvil1e Campus UrdversltyRlIt1d
Chiltern Hills
0'""." 36)9
SOIIIh Afrioo Tel No: '+1731 :MfJ 3517
Fax No: +1731260 2384 E-mail "ntlid!>OS:l@ukZ/f.acw
PROTOCOL: An invEStigation into the Reliability and Validity of a placement instrument for Colleges ETHICAL APPROVAL NUMBER: HSS/0886/2009: Faculty of Education
In response to your application dated 20 November 2009, Student Number: 206526005 the Humanities & SOcial Sciences Ethics Committee has considered the abovementioned applkation and the protocol has been given FULL APPROVAL.
PUEASE NOTE: Research data should be securely stored In the school/department for a period of 5 years.
I take this opportunity of wishing you everything of the best with your study.
~ Professor Steve Collings (Chair, HUMANITIES & SOCIAL SCIENCES ETHICS COMMITTEE
SCI,n
cc: Sandra land cc: Ms Rishandhani Govender
foundlng Campuses: - EdgflW()Qd Medical School -1'l~!t:rblll'lJ
INVESTIGATING THE PREDICTIVE VALIDITY OF CAP TEST
Page 5
Me A Taljaard Boland Konege Hoofkantoor Privaatsak 5068 STELLENBOSCH 7600
Geagte me Taljaard
1 Maart 2011
Ek verwys na u versoek om Boland Kollege as 'n ge\lalle studie te gebruik in u Meestersgraad verhandeling,
Hiermee verleen Boland Kollege aan u goedkeuring om voort te gaan met u navorsing soos versoek, op voolWaarde da1 dit nie in kollegetyd geskied nie.
Ons wens u sterkte toe en vertrou dat u navorsing ook tot voordeel van Boland Kollege sal wees.
DS FOURIE HOOF U1TVQERENDE BEAMPTE
(':)",PUSE'! KAMf"J>S<

INVESTIGATING THE PREDICTIVE VALIDITY OF CAP TEST
Page 6
ACKNOWLEDGEMENTS
Without much sacrifice and assistance from important people, it would not have been
possible to complete this work. The following people played a vital role throughout
the research and writing of this manuscript. I am humbled by your support.
Sandra Land: Thank you for your patience, encouragement, wisdom and the excellent way
in which you guided, supervised and motivated me throughout this long journey. I
have no words to express my gratitude for the extra mile that you have walked with
me.
Peet Taljaard: I cherish our numerous discussions about this book and your endless
motivation, constant support, and lots of patience to see it through.
Jacques and Annemi, Marno and Nelithe Taljaard: Thank you for allowing me to focus on
this research. Special thanks to Marno for assisting with the statistical analysis and
graphs, and Nelithe for checking all the references.
Arie en Tienks Korf: Mom and Dad, thank you for believing in me. I am proud to be your
daughter.
Antoinette Rossouw: Thank you for professional proof reading and editing.
Amanda De Villiers and the staff of Boland College: Thank you for emotional support and
encouragement.
Mr Frank Ingram and the Department of Education, KZN: Thank you for financial support.
Natasha Bothma & Dudley Dodd: Thank you for wonderful team work.
This book would not have been, but for the grace of God. Soli Deo Gloria.
I dedicate this work to my Oumie.

INVESTIGATING THE PREDICTIVE VALIDITY OF CAP TEST
Page 7
DECLARATION OF ORIGINALITY
I, ANNELINE TALJAARD, hereby declare that:
(i) The research reported in this dissertation, except where otherwise indicated, is my
original work.
(ii) This dissertation has not been submitted for any degree or examination at any other
university.
(iii) This dissertation does not contain any other author’s data, pictures, graphs or other
information, unless specifically acknowledged as being sourced from other authors.
(iv) This dissertation does not contain any other author’s written work,, unless specifically
acknowledged as being sourced from other researchers. Where other written sources
have been quoted, then: a) their words have been re-written but the information attributed
to them has been referenced; b) where their exact words have been used, their writing has
been placed inside quotation marks, and referenced.
(v) Where I have reproduced a publication of which I am an author, co-author or editor, I
have indicated in detail which part of the publication was actually written by myself alone
and have fully referenced such publications.
(vi) This dissertation does not contain text, graphics or tables copied and pasted from the
Internet, unless specifically acknowledged, and the source detailed in the dissertation and
in the List of References.
…………………………… ……………………………
ANNELINE TALJAARD DATE

INVESTIGATING THE PREDICTIVE VALIDITY OF CAP TEST
Page 8
ABBREVIATIONS
AARP Alternative Admissions Research Project
CAP Competence and Placement
DoE Department of Education
FET Further Education and Training (South Africa)
HESA Higher Education South Africa
NBT National Benchmark Test
NC(V) National Certificate (Vocational)
NQF National Qualifications Framework
NSFAS National Student Financial Aid Scheme
OBE Outcomes Based Education
RPL Recognition of Prior Learning
RSA Republic of South Africa
SAQA South African Qualifications Authority
SETA Sector Education and Training Authority

INVESTIGATING THE PREDICTIVE VALIDITY OF CAP TEST
Page 9
TABLE OF CONTENTS
Abstract 3
Ethical Clearance 4
Permission from Boland College 5
Acknowledgements 6
Declaration of Originality 7
Abbreviations 8
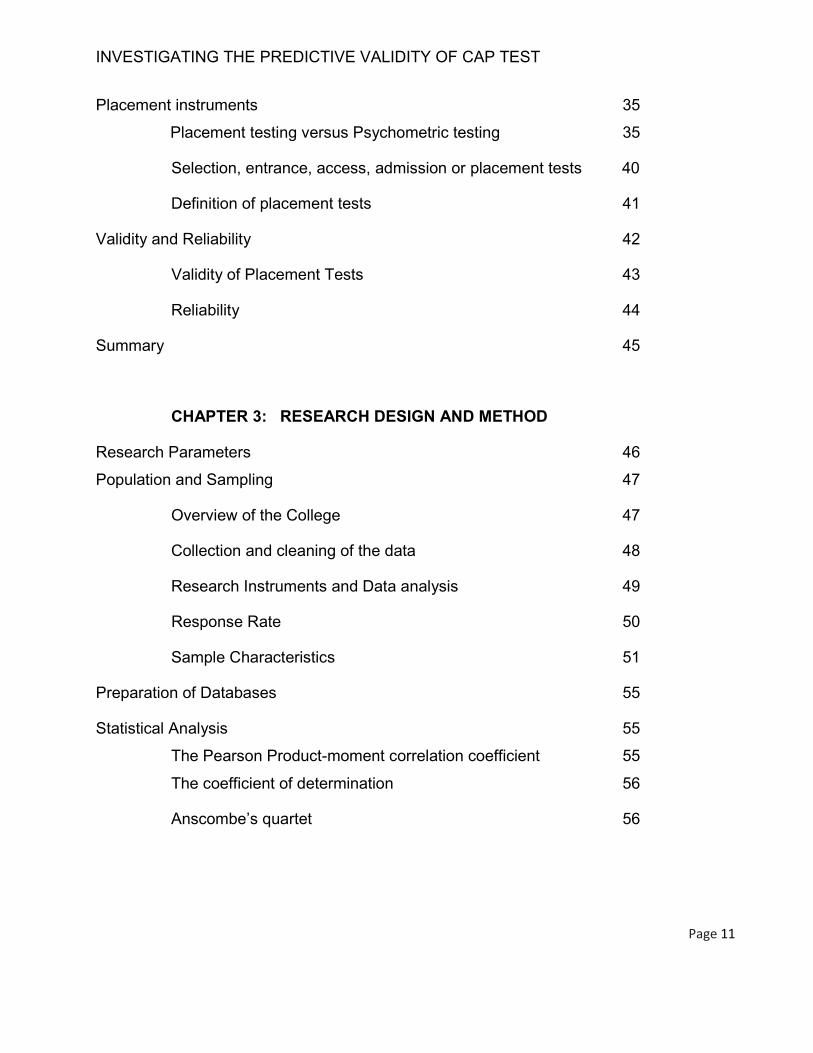
Table of Contents 10
List of References 12
List of Figures 13
List of Tables 14

INVESTIGATING THE PREDICTIVE VALIDITY OF CAP TEST
Page 10
CHAPTER 1: PURPOSE OF AND BACKGROUND TO THE RESEARCH
Background to the study 15
Motivation for the research 16
Statement of purpose 17
Key research questions 17
Background to Early Identification of High Risk Students 18
Unemployment and Skills Shortage 19
A new College qualification 19
National throughput of Students studying towards NC(V) 20
Causal factors for leaving college 23
Vocational guidance prior to registration 23
Rationale for the development of the CAP Test 24
Description of the CAP test 26
The NC(V) Programme Interest Questionnaire 26
Format of the questions 27
Summary 27
CHAPTER 2: CONCEPTUAL FRAMEWORK AND LITERATURE REVIEW
Conceptual Framework 29
Placement Testing in South Africa 32
Placement testing research in Higher Education 32
Placement testing research in Further Education 33
Vocational mobility and Job restriction 34
INVESTIGATING THE PREDICTIVE VALIDITY OF CAP TEST
Page 11
Placement instruments 35
Placement testing versus Psychometric testing 35
Selection, entrance, access, admission or placement tests 40
Definition of placement tests 41
Validity and Reliability 42
Validity of Placement Tests 43
Reliability 44
Summary 45
CHAPTER 3: RESEARCH DESIGN AND METHOD
Research Parameters 46
Population and Sampling 47
Overview of the College 47
Collection and cleaning of the data 48
Research Instruments and Data analysis 49
Response Rate 50
Sample Characteristics 51
Preparation of Databases 55
Statistical Analysis 55
The Pearson Product-moment correlation coefficient 55
The coefficient of determination 56
Anscombe’s quartet 56

INVESTIGATING THE PREDICTIVE VALIDITY OF CAP TEST
Page 12
CHAPTER 4: FINDINGS AND DISCUSSION OF FINDINGS
The correlation between the students’ CAP results and
the final year end results 59
Validity of the English and Mathematical competency tests 59
Reliability of the CAP English and Maths results 69
The use of the CAP test as a predictive tool to guide and place NC(V)
level 2 students. 74
CHAPTER 5: INFERENCES AND SUGGESTIONS
Progressive Interpretation of the Validity indicator 77
Inferences from the pattern of correlation between these results 78
Limitations of this research 81
Suggestions for research 82
Summary 84
List of REFERENCES 83
ADDENDUM A Example of CAP Student Report 89
ADDENDUM B Example of a Lecturers Report 90
INVESTIGATING THE PREDICTIVE VALIDITY OF CAP TEST
Page 13
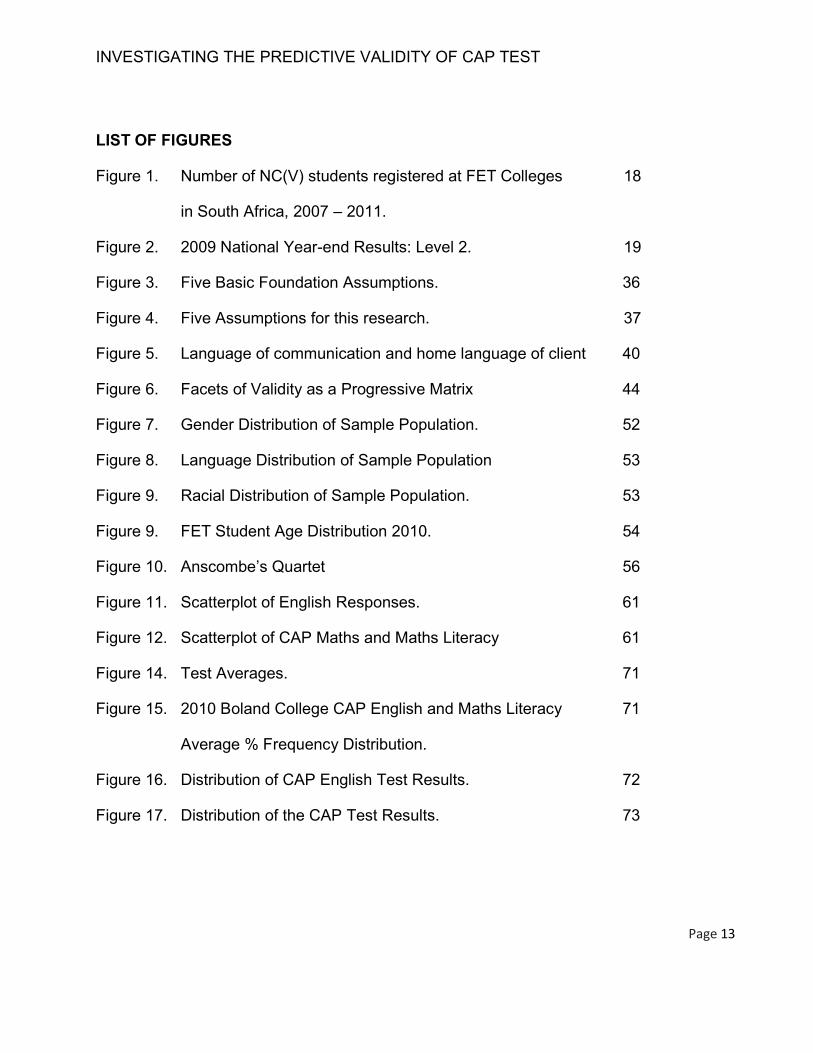
LIST OF FIGURES
Figure 1. Number of NC(V) students registered at FET Colleges 18
in South Africa, 2007 – 2011.
Figure 2. 2009 National Year-end Results: Level 2. 19
Figure 3. Five Basic Foundation Assumptions. 36
Figure 4. Five Assumptions for this research. 37
Figure 5. Language of communication and home language of client 40
Figure 6. Facets of Validity as a Progressive Matrix 44
Figure 7. Gender Distribution of Sample Population. 52
Figure 8. Language Distribution of Sample Population 53
Figure 9. Racial Distribution of Sample Population. 53
Figure 9. FET Student Age Distribution 2010. 54
Figure 10. Anscombe’s Quartet 56
Figure 11. Scatterplot of English Responses. 61
Figure 12. Scatterplot of CAP Maths and Maths Literacy 61
Figure 14. Test Averages. 71
Figure 15. 2010 Boland College CAP English and Maths Literacy 71
Average % Frequency Distribution.
Figure 16. Distribution of CAP English Test Results. 72
Figure 17. Distribution of the CAP Test Results. 73

INVESTIGATING THE PREDICTIVE VALIDITY OF CAP TEST
Page 14
LIST OF TABLES
Table 1. Initial Research Participant Numbers 49
Table 2. Final Research Participant Numbers 51
Table 3. Pearson Product-moment Correlation Coefficients (r) 60
Table 4. Language Groups. 62
Table 5. Population Groups. 64
Table 6. Programme Correlations. 67
Table 7. Grade 9 CAP/PACE Correlation. 68
Table 8. Campus Averages 70
Table 9. Total Averages for the Different Subtests. 72

INVESTIGATING THE PREDICTIVE VALIDITY OF CAP TEST
Page 15
CHAPTER 1 PURPOSE OF AND BACKGROUND TO THE RESEARCH
BACKGROUND TO THE STUDY
Vocational training in South Africa reflected the political ideology of its leaders.
Colleges offering technical and vocational education reflected apartheid and offered
qualifications to separate racial groups. Although most colleges were exclusively for
whites, the Ohlange College in Durban was established in 1907 for black students and
more black training colleges were established in the 80’s (Wedekind, 2008). Since the
merging of 153 Technical colleges into 50 Further Education and Training (FET) Colleges
in 2000, the number of black students increased to such an extent that the majority (96%)
of all students at FET Colleges in 2010 were black and the rest represent the White,
Coloured and Indian populations. In the apartheid years, the use of placement or
selection tests was common practice at some of the previously “white” colleges, for
example, the use of the Trade Aptitude Test to identify stronger aptitudes in different
technical fields (Mindmuzik, 2011). Due to many factors explained later, tests became
unpopular and were not replaced with any other tools to assist prospective students in
making a vocational choice. Fortunately, the Department of Education identified this need: Learner counselling and support services will be established to help new entrants to FET to
make meaningful choices about their direction of study and to ensure that all learners,
including previously excluded or disadvantaged groups, are given the opportunity to
succeed. Career guidance and support services will provide information on learning
programmes, education and training providers, qualifications and job opportunities.
(Department of Education, 2008b, p.4)
The newly developed Student Support Framework indicated the implementation of
a selection and placement activity as a key deliverable for phase 1 in 2008 – 2009, and
stated that “a clear selection and programme placement policy that focuses on redress
must be in place. Such a policy must assist in the appropriate choice of NC(V)
programme” (Department of Education, 2008, p. 25), and “Colleges should use a
INVESTIGATING THE PREDICTIVE VALIDITY OF CAP TEST
Page 16
placement and selection tool when admitting students.” (Department of Education, 2008b,
p. 14). Subsequently, for the past five years, colleges progressively increased the
administering of placement testing prior to registration of new students.
This chapter will provide background for the research to discover whether one such
placement instrument, the Competency and Placement Test (CAP) is a valid instrument to
predict the possible academic achievement of students at the end of the first year.
MOTIVATION FOR THE RESEARCH
As will be discussed later in this chapter, there is a need for an instrument to assist
prospective students when making a decision about which programme to register for. The
intention of the Competency and Placement test is clearly stated in the manual (CAP,
2007):
Act as a gauge for a student’s knowledge of grade 9 English and Mathematics: “The
purpose of this test will be to determine if the prospective FET College student has
the basic fundamental knowledge of the English language and numeracy skills to
cope with the learning material of NC(V) level 2” (CAP, 2007, p.1), and “ to assist
the College personnel in placing prospective students that have the fundamental
skills in appropriate vocational fields. Thus, the focus is to identify the level of
additional academic support some students may require
To identify a student’s vocational interest: The Placement Test will assist the
prospective student to choose a vocational field that is aligned with his/her interest
by providing information on the 14 different vocational fields available in NC(V).
The Placement Test will also guide the FET College personnel to place and advise
students in appropriate vocational fields”. (CAP, 2007, p. 1)
If the CAP test could also indicate whether a student is likely to complete the year
successfully, it would be an added advantage for the college to further identify possible
high risk students.

INVESTIGATING THE PREDICTIVE VALIDITY OF CAP TEST
Page 17
STATEMENT OF PURPOSE
A very important function of the newly developed student support divisions at FET
Colleges was to guide and support students to make an informed decision on their career
direction. The Department of Education identified this service in an endeavour to improve
the poor attrition of students. (Department of Education, 2008). A key delivery is that
prospective high risk students should be identified as early as possible in the year, so that
supporting strategies could be put in place as early as possible (Department of Education,
2008). Hence, an instrument that would empower students in their career choice process,
and simultaneously assist college personnel to identify the students who will probably
need support, would be advantageous to both college and students.
For the scope of this study, it was decided to focus on the predictive validity of the
Competency and Placement test. This test is used to identify prospective students at risk
to fail, by means of investigating if a correlation exists between CAP test scores and final
year-end results. As correlation is the “statistical concept used to describe the relationship
between two variables” (Ghiselli, Campbell & Zedeck, 1981, p. 76), the objective of this
research is to determine, by means of a Pearson product-moment correlation coefficient,
whether a student’s CAP test result is a valid indicator of his/her achievement in the final
year-end examinations in the corresponding subjects.
KEY RESEARCH QUESTIONS
As explained above, FET Colleges needed an instrument that would indicate the
capacity of a student to meet the demands of a specific programme. The manual of the
CAP test states: “The purpose of this test will be to determine if the prospective FET
College student has the basic fundamental knowledge of the English language and
numeracy skills to cope with the learning material of NC(V) level 2” (CAP, 2007, p. 3).
Because the CAP subtests are based strictly on the Grade 9 curriculum, it would be
possible to identify the extent of a student’s lack of skills and knowledge of the basic
foundation (grade 9) for the NC(V)programmes as set by the Department of Education.

INVESTIGATING THE PREDICTIVE VALIDITY OF CAP TEST
Page 18
The question that arises, though, is whether a student’s CAP results, showing levels of
skill and knowledge, can be used to predict year-end examination success.
The other side of the coin, therefore, is whether the CAP subtests can in actual fact
identify a student at risk to fail the first NC(V) year on the basis of his / her level of grade 9
background knowledge. As the CAP Test is still a relatively new instrument, clarity
regarding its predictive validity is needed. With data available from students who have
completed the test, and been through FET colleges, it is now appropriate to critically
evaluate the CAP test with the purpose of identifying its potential as a valid screening
instrument for high risk students. The decision was made to investigate the predictive
effectiveness of the English and Mathematics test by determining the extent of the
relationship between the CAP subtest results and the end-of-the-year results. Hence, the
focus is on investigating the following question:
Is the CAP test a valid predictor of FET College students’ academic success?
To find an answer, this research will focus on two sub questions:
What is the extent of the correlation between the students’ CAP results and the
final year-end results?
What inferences can be made from the pattern of correlation between these
results?
Findings from this research could be useful in improving and further developing a
standardised, valid and reliable placement instrument for the FET sector in South Africa.
EARLY IDENTIFICATION OF HIGH RISK STUDENTS AT FET COLLEGES.
In 2007, 368 217 young people wrote the final National Senior Certificate
examination at schools (Department of Education, 2009a). About 41600 or 11.3% passed
with merit and earned access to tertiary institutions. One would expect to find the
remainder of the cohort in institutions for Further Education, but in fact, the opposite is
true.

INVESTIGATING THE PREDICTIVE VALIDITY OF CAP TEST
Page 19
Unemployment and Skills Shortage
The majority of this group, about 327 000 students, are neither working nor in
training. MacGregor (2009) explains that: “There were 2.8 million young people not in
employment, education or training in South Africa in 2007 – two out of five, 18 to 24-year-
olds – and the number could have soared to 3.2 million now.” Cloete, Sheppard, Nel,
Stumpf, Papier, Needham, & Leibrandt (2009, p. 13) warned that “Having almost 3 million
youth between 18–24 unemployed and not in education or training, points not only to a
grave wastage of talent, but to the possibility of serious social disruption.” (Italics inserted).
Ironically, in spite of the fact that more than 300 000 school leavers completing high
school remain unemployed every year, the Department of Labour experiences a huge
deficiency in skilled labour, and it seems as if they opt to make use of foreign skilled
labour to meet those needs. The Department of Labour (2003, p. 2) stated that in order to
fill the need for skilled workers, they would: “Facilitate(ing) the recruitment of skilled
foreign workers in areas of critical skills shortages, while ensuring the concurrent
development of South Africans in those fields.” Cloete et al. (2009) also highlight the
importance of providing vocational guidance to support the unemployed school leavers to
help them select a career in line with their interest, according to the critical and scarce
skills shortages in South Africa.
A new College qualification
On a national level, the Department of Labour (2003) identified huge skills
shortages. The discrepancy between the enormous number of unemployed young people
and the skills shortage in South Africa (Skills Portal, 2008; Fin24.com, 2007; Daily
Dispatch, 2007) resulted in the Department of Education launching a new vocational
qualification, the National Certificate (Vocational). This National Certificate has as its
purpose to provide students with a training opportunity to obtain different vocational skills
on NQF level 2-4. Gower (2009, citing Cloete et.al., 2009,) explained that: “In 2007, 508
600 youths had not reached grade 10; and almost a million left school after completing
grade 10.” Because the minimum entry requirement to register for the NC(V) is the

INVESTIGATING THE PREDICTIVE VALIDITY OF CAP TEST
Page 20
possession of a grade 9 certificate, this is a much needed solution to the unemployment
and skills problem. Cloete et al. (2009, p.13), further supported the implementation of the
NC(V) as a post-grade 9 qualification: “This is not only an enormous waste of educational
resources, providing 10 years of education and then not completing the final two years,
but it is also the group that seems the most vulnerable to unemployment.” This is an
interesting shift in emphasis if one considers the fact that grade 9 was decided upon as
the official school leaving age a few years ago, and government decided that their
responsibility in education would end at grade 9.
When these new qualifications were introduced in 2007, it gave young people older
than 16 years the opportunity to study towards a specific, vocationally orientated
qualification. Unfortunately this also means that young people are now forced to make a
vocational choice at the tender age of 15 or 16 years.
National throughput of Students studying towards the NC(V)
The new NC(V) is a three-year qualification that is equivalent to a grade 12 Senior
Certificate level. Poor throughput and certification of students who have entered colleges
at NC(V) level 2 is a major issue, in addition to the problem of unemployed, uneducated
young people. Statistics of the enrolment numbers of students (see fig.1) at all the FET
colleges nationally reflect that about 80% of the level 2 students do not reach level 4 within
the allotted two years. Figure 1 below reflects the number of full time students who were
registered between 2007 and 2011, released by the Department of Education. The growth
in Level 2 registrations is mainly the result of the marketing initiative by colleges, but there
are a number of repeaters as well.
Of the 25 073 NC(V) students who registered for level 2 in 2007, less than 20%
(4991) registered for level 4 in 2009 which indicates a non-certification1 of about 80% of
the students for whom English is a second language (L2 students). The same applies to
the 51173 students who registered for level 2 in 2008 – only about 20% (9489) of the
1 Certification of students relates to the number of subjects passed in a year. Certification for NC(V) means
7 subjects passed and Progression means 5 or more subjects passed to move on to the next level.

INVESTIGATING THE PREDICTIVE VALIDITY OF CAP TEST
Page 21
original L2 students registered for level 4 in 2010. This indicates that only about 1 out of
every 5 students that registered for level 2 reaches level 4 within the prescribed time
Figure 1: Number of NC(V) students registered at FET Colleges in South Africa, 2007 – 2011. (Source:
Department of Education National statistics: 2007, 2008a, 2009a, p. 19, 2011a & 2011b)
frame. Four out of five students either failed the exams or dropped out during the three
year period. As table 1 only reflects the number of students who registered in January
every year, it is not possible to see, from this information, how many students are
repeaters, nor how many did not write the final examination.
Figure 2 below indicates an analysis of the throughput of students who registered
for NC(V) level 2 programmes at FET colleges in South Africa in 2009. For the three
subjects analysed, namely English First Additional Language, Mathematics and
Mathematical Literacy, it is evident that about a third of students who registered in January
were absent at the end-of-the-year final examination. When the difference between the
number of students registered in January on a national level, and the number of
examination papers written (as reflected in the national examination results for 2009,
25073
51173
93293
60691 51378
10147
24637 28533
32994
4991 9489
16958
2007 2008 2009 2010 2011
Number of NC(V) students registered at FET Colleges in South Africa
2007 - 2011 L2 Students L3 students L4 students
1014710147
25073
49914991

INVESTIGATING THE PREDICTIVE VALIDITY OF CAP TEST
Page 22
Department of Education, 2009), is analysed, it indicates a loss of about 35% of students
registered for English Language during the year, and reveals that about 30% of the
Mathematical and Mathematical Literacy students did not even attempt the final
examinations.
Figure 2 : 2009 National Year end Results: Level 2. (Source: Department of Education, 2010)
The passing rates indicate a similar trend. A little less than 1 out of 2 students of
this cohort passed the English examination, while about 2 out of 5 students passed the
Mathematical literacy examination, and only about 1 out of 4 students who registered for
Mathematics in January 2009, passed the final examination in November 2009.
If one could argue that the English first additional language examination numbers
reflect students who left colleges during the year, it implies that 35% or about 28 000
students failed in their bid to gain skills. Furthermore, if the students who failed left the
system and did not return to repeat the academic programme the following year, it implies
that more than 50% or about 42 000 students possibly returned to the unemployed status.
English First Additional Language L2
Mathematical Literacy L2 Mathematics L2
Entered 80394 45635 42345
Wrote 52715 32008 30975
Pass 38347 18613 10171
65%
70% 73% 48%
40% 24%
0
10000
20000
30000
40000
50000
60000
70000
80000
90000
Nu
mb
er
of
Stu
de
nts
2009 National Year end results: Level 2

INVESTIGATING THE PREDICTIVE VALIDITY OF CAP TEST
Page 23
The poor pass rate was also mentioned by Papier (2009) when she found that 80%
of the Level 2 students in 2007 were not certificated2 because they had not passed all 7
subjects. This means that about 20 000 young people experienced failure which could
have been prevented to a certain extent, if FET colleges could provide proper vocational
guidance and support.
Causal factors for leaving college.
Papier (2009, p.14), identified three categories of factors that “contributed to poor
academic performance and attrition.” These were programme- related factors, learner-
related factors and college related factors. Reasons found a year earlier by Maharaj
(2008, p. 65) can also be categorized under these headings:
o College related factors: Under-qualified lecturing staff and negative attitudes
among lecturers
o Learner related factors: Finances, health, attitude, problems at home, death,
and a job offer
o Programme related factors: Difficult subjects, poor results, teaching methods,
statistical methods used to calculate results and subject terminology. Contributing factors identified by other researchers also fall into the categories suggested
by Papier. For example, under ‘Learner related factors’ Kush & Cochran (1993)
investigated the effect that broken families have on student retention, and Meintjes, Hall,
Marera and Boulle, (2009) investigated the challenges of child-headed households relating
to retention of students. Grant and Hallman (2006) found a 60% drop out from school in
the age group 14-24 years related to the incidence of youth pregnancies.
Vocational guidance prior to registration
Because of the high unemployment rate or absence of significant supportive adults,
students have little knowledge of the world of work and hence, limited exposure to jobs.
2 Certification indicates a total pass of all 7 subjects per year.

INVESTIGATING THE PREDICTIVE VALIDITY OF CAP TEST
Page 24
As a consequence, they may decide on a study programme or vocational qualification
without knowing what the career really entails. This demonstrates the lack of proper support prior to registration, and the need for
an instrument to support students and colleges in guiding the students in the right
direction, is now emerging.
RATIONALE FOR DEVELOPMENT OF THE CAP TEST
A year before the publication of the Student Support Framework (2008) and only a
few weeks into the academic year after the new NC(V) intake in 2007, I was, in my role as
manager of Student Support services at a rural FET college, bombarded with non-
performing students referred to me by desperate lecturers. By interviewing the students, it
was discovered that:
Some students were emotionally immature and not yet ready to cope with the
freedom of the college time table.
Some students refrained from attending classes because they felt inadequate to
cope with the learning material. Students didn’t understand the work or they felt
they didn’t have the necessary knowledge and academic skills to cope with the
work.
When registering for a specific programme, some students didn’t realise exactly
what the field of work entailed, and, when they did discover what the
programme involved, decided that they didn’t like what they were doing. During
my professional career as career guidance counsellor I had many interactions
with young people who had misconceptions about a vocation. Arguments such
as “I want to study Hospitality because I want to work in a hospital” was not
uncommon, and when asked why a student wanted to become a chartered
accountant, students often explained that the reason for their choice lay in the
fact that the chartered accountants that they knew, owned expensive motor
cars. Sadly, usually these explanations come from students who had dismally
failed Mathematics, English or accounting. It was obvious that the majority of

INVESTIGATING THE PREDICTIVE VALIDITY OF CAP TEST
Page 25
students came to register for programmes without having a full understanding of
what exactly they would do after completing the qualification. The lack of
knowledge of the world of work could not be addressed in the short interaction
that lecturers have with them during the registration period.
Some students enrolled for a specific programme out of obedience to a parent,
or following advice from lecturers. Some lecturers themselves were ill-equipped
to guide prospective students. A senior lecturer was once overheard - advising
a young lady to register for a management assistant programme simply
because, according to him, she ‘looked like a secretary’.
It was in the early weeks of 2007 that the need for a screening and placement
instrument became evident. The instrument should address the two challenges
highlighted in figure 2 and 3 above: Firstly, that students tended to exit the college before
the end of the academic year, and secondly that they would attempt to write the
examination but fail the year (possibly because their academic foundation was not
adequate). Avoiding this was precisely what the Department wanted the following year,
namely to help the students to make an informed career or study programme choice, and
to assist the colleges in the early identification of students who were at risk of failing the
year-end examinations. Hence, a tool was needed to become part of a guidance process
to identify and eliminate most of the possible hurdles as early as possible, so that students
would be able to complete the qualification (Kim & Suen, 2003).
This tool should have four characteristics: It should be a screening instrument, not a
registered standardised psychometric instrument, mainly because of the large number of
students and the small number of registered testing professionals. Secondly, the
instrument should not take as long as psychometric evaluations to administer, and thirdly,
it should be able to identify high risk students with the focus on remediation rather than
selection. Lastly, of course, the purpose of this instrument should be, in the words of
Bohlmann (2005, p. 363): “not to function as a gate-keeping device, but to be able to
advise potential students...”

INVESTIGATING THE PREDICTIVE VALIDITY OF CAP TEST
Page 26
Description of the CAP test.
The CAP Test consists of three subtests: The English Competency test, the
Mathematics Competency test and the Career Interest Questionnaire. The English and
Mathematics Competency Tests measure which NQF Level 1 outcomes a prospective
student has mastered, as the Department of Education (2006) determined NQF Level 1
(or school grade 9) as the entry criteria for NC(V) Level 2. The Career Interest
questionnaire indicates a student’s interest in one or more of the 14 vocational
programmes offered by the FET Colleges.
The test can be administered as a pen-and-paper test or a computer-based test. It
takes about two hours to complete, and consists of multiple choice questions. These
responses have to be captured by the test administrator, onto the computerised data
base, in order to be marked. In administering the computer-based test, the results are
immediately available after the completion of the test.
The NC(V) Programme Interest Questionnaire3
The current situation in the FET sector is that students may enter the FET colleges
after passing grade 9. In South Africa, the average student turns 15 years old in grade 9.
Because students can, at that point, exchange the main stream high school grades for the
vocational qualifications at FET colleges, it becomes progressively more difficult for them
to reverse a wrong decision later by returning to main stream education. After taking the
option of vocational training, it is very difficult for them to take another direction if they feel
that the direction chosen was not an appropriate choice. Unfortunately, at this tender age,
young people are not likely to be emotionally equipped, nor have they the necessary
exposure to the world of work to make proper and informed career choices. A young
person, finding her- / himself in this situation, needs all the support that s/he can get in
order to make this significant decision.
3 The Interest Questionnaire was outside the focus of this study, but this description is included as it was
part of the development of the CAP test.
INVESTIGATING THE PREDICTIVE VALIDITY OF CAP TEST
Page 27
The test developers understood that an informed choice can be made once a
person has, and understands information about different careers. Therefore the career
questionnaire provides, as a point of departure, as much information as possible, before
asking a student if he would be interested in a specific career. The Career Interest test
items enhance the understanding of career information by including coloured photographs
of people engaged in such jobs. Care was given to cultural diversity and to the language
levels of the questions.
Format of the questions.
The Mathematics test and the English test have multiple choice-questions.
Amongst standardised tests globally, the practicality and time efficiency of multiple choice
questions make this pen-and-paper format the most popular way to test individuals.
(Wagner-Welsh, 2008). It is just too mammoth a task to test a huge number of students,
and to mark and interpret their results in the short registration period, if the placement
instrument requires answers in students’ own words, although that would give a more
reliable indication of the candidates’ expressive language skills. Where students select
one out of four possible answers, there is always a 25% possibility that the response to a
question is correct because the candidate has guessed it rather than selected the correct
option based on knowledge. However, the multiple choice format was chosen because
the many advantages outweighed the disadvantages.
SUMMARY
This chapter explained the need for an instrument that would help students to
identify their career of choice, as well as early identification of students at risk of failing the
first NC(V) year. Research into the validity of CAP test as an early high-risk screening
instrument is guided by one main research question:
Is the CAP test a valid predictor of FET College students’ academic success?
Two sub questions will be investigated, namely
INVESTIGATING THE PREDICTIVE VALIDITY OF CAP TEST
Page 28
What is the extent of the correlation between the students’ CAP results and the
final year-end results?
What inferences can be made from the pattern of correlation between these
results?
In the next chapter, five basic assumptions that serve as a foundation for aptitude
testing as well as some fundamental research paradigms will be discussed, followed by a
closer investigation into placement testing as a popular international phenomenon. Lastly,
literature on the validity of placement instruments will be briefly explored.

INVESTIGATING THE PREDICTIVE VALIDITY OF CAP TEST
Page 29
CHAPTER 2
CONCEPTUAL FRAMEWORK AND LITERATURE REVIEW
This section explores what has been written on the topic of placement assessment,
by focusing on three issues. First, the conceptual framework of this research will be
discussed. Secondly, placement testing is investigated as a common topic that is
internationally discussed in psychological and humanities literature. Although the use of
placement instruments is a common phenomenon internationally, it is a new occurrence in
the FET sector in South Africa, and the limited available literature on local research in the
field, will be explored. The chapter ends with a brief discussion on the validity of
placement instruments.
CONCEPTUAL FRAMEWORK
Much has been said about quantitative, qualitative and mixed method approaches
to research in education, and the consequential “paradigm war“ (Niglas, 1999), that
peaked in the 1980’s. Thomas Kuhn (1962, cited in Johnson & Onwuegbuzie, 2004)
defines paradigm as “…a general concept…” which “…included a group of researchers
having a common education and an agreement on ‘exemplars’ of high quality research or
thinking”. In transcribing century-old ideas, Mkele (1953) identified a framework for
understanding aptitude testing as a prediction of achievement. This articulates the
assumptions that form a basis for understanding and interpreting all testing relating to
learning since the Chinese began with the earliest recorded ‘competency testing’. In 2200
B.C. Chinese scripts recorded “formal oral tests of knowledge; after three such
examinations, officials were either promoted or fired” (DuBois, 1970, cited in Sax &
Newton, 1997, p. 3). Figure 3 below shows Mkele’s basic assumptions.

INVESTIGATING THE PREDICTIVE VALIDITY OF CAP TEST
Page 30
1. Different tasks require different
abilities or acquired
knowledge for successful
performance
2. People have different levels
of skills / knowledge /
ability that are relatively stable
at least in the short term.
3. These attributes can be
measured
4. Valid inferences can be made based
on these measurements
5. These inferences can
be useful to facilitate
effective delivery of training
1. NCV Level 2 requires
specific skills levels for specific
programs
2.Prospective students have different levels of knowledge
and skills - relatively
stable in the short term
3. Knowledge and skills can be measured
by the competency
subtests of the CAP test.
4. Validity of the subtests
and inferences drawn from
results will be explored by
this research.
5. Inferences drawn from research can
improve future placement and
training of students.
Figure 3: Mkele’s Basic Foundation Assumptions. (Adapted from Mkele, 1953, p. 2)
The same assumptions apply to different jobs or educational levels that require
different skills or knowledge, today. The CAP manual states that “A prerequisite of the
National Certificate (Vocational) (NC(V)) Level 2 is that prospective students must have
passed Grade 9 or achieved an equivalent qualification on NQF Level 1” (CAP, 2007, p.
2). Based on Mkele’s framework, it can be concluded that in order to embark on the
NC(V) level 2 programmes, a student needs a certain level of knowledge and skills, which
Figure 4: Five Assumptions for this research. (Adapted from Mkele, 1953, p. 2)

INVESTIGATING THE PREDICTIVE VALIDITY OF CAP TEST
Page 31
could be demonstrated by successfully completing a grade 9 examination. Mkele’s third
assumption speaks to the issue of measurement of competencies. Jaggers and Hodara
(2011) also address this issue in an “opposing forces framework” (Jaggers & Hodara,
2011, p. 3) for understanding developmental assessment and placement. Developmental
assessment and placement imply assessment for referring prospective students to a
bridging or foundation programme prior to registration for the full time formal qualifications,
and as such has a similar purpose to that of placement testing at FET Colleges. Of the
three continuums that form the basis of the opposing forces framework, the second one is
very relevant to Mkele’s third assumption:
(Jaggers & Hodara, 2011, p. 6-7)
The second continuum of opposing forces addressed the issue of Effective versus
Efficient assessment. A massive administrative exercise of testing a large number of
students during a very short period at the beginning of a registration cycle can be a very
effective exercise, because most of the students will be assessed. The weakness of this
exercise is that standardised testing does not allow for the individual differences and
identification of each student’s strengths and weaknesses. Effective assessment where
the needs of individuals will be properly identified is a time-consuming process which is
costly in terms of manpower as well as resources.
For the purpose of this thesis, the second differentiation between the effectiveness
and the efficiency of the CAP test is relevant as it gives a qualitative and reliability
meaning to the assumptions of Mkele. As indicated in figure 4 above, Mkele’s
assumptions form a conceptual framework for this research. The Pearson product-
moment correlation between students’ scores on the CAP test and their scores in year-
end results indicate the extent to which these scores are linked. It can be inferred that the
2. Effective Assessment Efficient Assessment
INVESTIGATING THE PREDICTIVE VALIDITY OF CAP TEST
Page 32
higher the correlation between the CAP score and year-end results, the more closely they
are linked and the more certain a conclusion of prediction can be made.
Furthermore as Mkele explains, inferences can be drawn from the assessment
results. These inferences can be criterion-referenced, norm-.referenced, or based on
Messick’s progression matrix4 (which will be described later in this chapter in the section
on validity). For the purposes of this research report, can the information based on the
inferences be used not only in the placement process, but also to improve the training of
the students.
PLACEMENT TESTING IN SOUTH AFRICA
Placement testing research in Higher Education
In this country, studies on placement testing have mainly been carried out at
universities. The need to predict academic achievement in South Africa was echoed in
studies by Zaaiman (1998, p. 9) and Jacobs (2010) who both found that grade 12 school
results are “…not to be viewed as a flawless predictor of university achievement” (Jacobs,
2010, p. 214). In an endeavour to improve throughput and academic success by
exercising enrolment management and following international trends, academic
institutions in South Africa started to research the implementation of placement testing as
a predictor of academic performance (Zaaiman, 1998; Koch, Foxcroft & Watson, 2001;
Wagner-Welsh, 2008; Bohlmann, 2009; Jacobs, 2010, and Lemmens, 2010). Well known
studies by the College of Science at the University of Witwatersrand (1990 & 1997), the
Teach-Test-Teach programme of the University of Natal (1993) and the Alternative
Admissions Research Project of the University of Cape Town (1997) (Zaaiman, 1998) did
groundbreaking work in moving the focus from using senior certificate results to pre-
registration testing of disadvantaged students.
4 Messick focuses on the validity of inferences made in the interpretation of scores, and suggests that
validity is viewed as a progressive matrix.

INVESTIGATING THE PREDICTIVE VALIDITY OF CAP TEST
Page 33
Apart from focusing on the prediction of academic success with the aim of
improving the success rate of first year students at universities, researchers in the field
also explored topics such as academic predictors at schools (Scherman, Archer & Howie,
2006, and Marais, 2007), placement test for Recognition of Prior Learning (Blunt, 2000)
and research on the shift from selection to placement testing at the University of Port
Elizabeth (Koch et al., 2001). Most of the above research projects focused on placement
in Higher Education at universities and Universities of Technology. As the majority of
school leavers do not qualify for programmes at Higher Education Institutions, the issue of
placement testing at FET Colleges is highly relevant.
Placement testing research in Further Education.
There is almost no empirical research that has been done on placement testing in
the Further Education and Training Colleges, except for a very recent study by Adams
(2011) which was an impact study of the CAP test. That there is so little research
available on placement testing in the FET sector is primarily due to the fact that placement
testing was only introduced to FET Colleges in November, 2008. Unfortunately the
research study by Adams (2011) has some flaws which compromise the findings. For
example, although the dissertation apparently sets out to examine the impact of the CAP
test, the initially stated objectives were to “…obtain evidence of the apparent poor
performance of learners within the NC(V) programme” and “to ascertain whether the CAP
intervention was implemented effectively so as to improve the current learner
performance” (Adams, 2011, p.19). Instead of carrying out these aims, Adams primarily
focuses on the shortcomings of the CAP test. This is unfortunate, as there is very little
academic research available on the FET sector and a better directed study would have
made a stronger contribution to the field. The implementation of placement testing at FET
Colleges is still at a very early stage and much empirical research and forthcoming
development is needed.

INVESTIGATING THE PREDICTIVE VALIDITY OF CAP TEST
Page 34
Vocational mobility and Job restriction.
Vocational guidance was hampered by racial and gender discrimination. Career
development opportunities and promotional positions were in the main implicitly
earmarked for white men. For a very long time women could not break through the glass
ceiling in their work environments, and even when they were promoted, they did not earn
salaries equal to their male counterparts (Winter,1999).
The Employment Equity Act No. 55 of 1998 ensures access for all population
groups to all the different career fields at all levels, in contrast with the tradition of “job
exclusivity” that was established by historical factors and legislation. For example, acts
such as the The Group Areas Act, Act No 41 of 1950, Extension of University Education
Act, Act No 45 of 1959 and Bantu/Native Building Workers Act, Act No 27 of 1951 made
provision for selective training and employment based on population and ethnic
classification. Hence the way in which people were forced to spend their days and lives,
depended on decisions made by other people. These decisions were based on colour,
race, gender or belief, and serve as a sad foundation for vocational guidance today.
Access policies in tertiary institutions now favour previously disadvantaged groups, and
there is emphasis on the employment of the previously disadvantaged. However, the
basic supporting actions in the process of making a career choice have not yet received
much attention, and with little state provision of psychological services to schools, it is
obvious that professional career guidance is still restricted to higher income groups that
can afford the services of registered career guidance counsellors.
To address this shortcoming and support prospective students in selecting a
career, the Department of Education emphasised ‘Pre-entry support’ in the Student
Support Framework, published in 2008.

INVESTIGATING THE PREDICTIVE VALIDITY OF CAP TEST
Page 35
PLACEMENT INSTRUMENTS
The use of a placement instrument to support students before they enter tertiary
institutions is common international practice. These placement instruments predominantly
focus on academic support. However, until 2007 it was not common practice amongst
FET Colleges in South Africa to use placement tests to guide students in making a career
choice, although a few questionnaires, such as the MENTOR and ELSA were used at one
or two colleges. Universities had by then already embarked on validity and reliability
research on the use of placement instruments, such as the Teach-Test-Teach (TTT)
programme of the University of Natal and the Alternative Admissions Research
Programme (AARP) of the University of Cape Town (Zaaiman, 1998). In response to this
lack, the Competency and Placement (CAP) instrument was developed in 2007 with the
purpose of identifying skills gaps so that colleges would be able to render focused
academic support to students, and to help students to make an informed career choice.
Placement tests versus Psychometric tests
The question arises as to what the difference between a psychometric test and for
example a school Mathematics test used for placement purposes is. Psychometric
instruments reveal relative stable valuable information about the individual that can assist
in training choices opposed to levels or the extent of knowledge gained. The use of
psychometric instruments in vocational guidance is common practice all over the world but
cultural bias and its implications for validity is constantly a hotly debated issue. In South
Africa there has been little change in the development and use of psychometric
instruments in vocational guidance services since the end of apartheid, and issues
regarding the validity of the tests for different population groups, remain a profound
concern. Ten years after the end of apartheid, Foxcroft, Paterson, Le Roux and Herbst
(2004) found that psychologists still experienced a need for tests that are valid and fair in a
cross-cultural context. There are very few tests available in African languages: “We use
tests for training of psychometrists. A wide variety of tests are used. The problem is that
very few tests are available for use with the Sotho-speaking population” (Foxcroft et al.,

INVESTIGATING THE PREDICTIVE VALIDITY OF CAP TEST
Page 36
2004, p. 56). They found that there is often a difference between the language of the
practitioner and the client. If the client doesn’t understand the practitioner or the test
questions, the validity is compromised and the results are unlikely to reflect the true ability
of the client. According to Foxcroft et al. (2004), this seriously compromises the practice
of fair assessment. The graph below indicates the difference between the client’s home
language and the test communication language. The question that immediately comes to
mind is that if this is the case 10 years post-apartheid, how much more did language
restrict vocational guidance prior to 1994?
The figure clearly demonstrates that almost no testing is done for speakers of
indigenous South African languages although they are the majority of the population. For
the Xhosa and the Zulu group there is some testing and the graph indicates that for them
testing takes place in a language other than their vernacular.
Apart from language, there are other reasons that make the use of psychometric
instruments very difficult. We scrutinised different psychometric tests that appeared on
the Health Professions Council of South Africa (HPCSA) list of registered tests, but found
that there were no tests that could be used for placement testing purposes, due to the
following reasons:
Figure 13: Language of communication and home language of client. (Foxcroft et al., 2004, p. 14)

INVESTIGATING THE PREDICTIVE VALIDITY OF CAP TEST
Page 37
o Most of the psychometric tests are standardised for middle class western
culture respondents, and thus not suitable for students who come from
backgrounds that are different from this. For example, many of the prospective
students from the rural parts of KwaZulu-Natal have grown up without a television
set or a computer in their homes, and without much exposure to newspapers or
other media. If a psychometric test contains a question e.g. on Human Resources
Management, the individual might have no background knowledge to bring to bear
in understanding the question. If a question states “I would rather create
advertisements for magazines”, how much does the potential student understand of
careers in the printed media?
o Only people registered with the HPCSA as registered psychologists,
psychometrists or counsellors may administer these tests. Very few of these
professionals were appointed within FET Colleges at that time, thus the services
had to be outsourced, with high cost implications. Although a psychometrist or
registered counsellor could administer the tests, it is virtually impossible for one
person to test an intake of 500 – 600 students during the very short period of
registration. Computerised tests might have solved this problem, but imposes a
new challenge, namely that most of the prospective students were, at the time of
testing, unfamiliar with computers and simply did not have the skills required to take
computerised tests.
o During the apartheid years, psychometric tests were used to identify the right
employee for a specific job, but these tests became instrumental in excluding
people. Perhaps partly as a result of this, and partly because of a general fear of
testing, there is a negative perception amongst the public relating to the purpose
and use of psychometric tests.
o Individual psychological testing is costly, which implies the exclusion of lower
income groups. As the pre-1994 income spread reflected the racial differentiation,

INVESTIGATING THE PREDICTIVE VALIDITY OF CAP TEST
Page 38
these services were generally used by higher income groups and were not within
the reach of financially depressed members of the public. The Colleges and
students cannot afford these expensive tests.
o Administration of the tests is time consuming – proper career guidance
assessments can take up to 5 hours or more.
In South Africa, the Health Professions Act Nr 56 of 1974 section 37(2) addresses
the issue of psychological practices such as psychological testing and assessment. The
Health Professions Council of South Africa (HPCSA) guards the classification and the use
of psychological instruments, and published a policy (Form 208, updated 01 June 2010)
on the classification of psychometric measuring devices, instruments, methods and
techniques. Form 208 further elaborates on the classification of psychological tests.
Neither Act 56 (1974) nor Form 208 clearly differentiates between psychological tests and
non-psychological tests, but form 208 (2010, p. 2) explains that tests that measure a
psychological construct, such as cognitive functioning, interest, aptitude and attitude, must
be classified as psychological tests. The Psychometric Committee of the HPCSA should
advise the Board according to the following considerations:
Classify and advise on regular revision of any device, instrument, method, technique or test
aimed at aiding persons or groups of persons in the adjustment of personality, emotional or
behavioural problems or at the promotion of positive personality change, growth and
development or for the determination of intellectual abilities, personality make-up,
personality functioning, aptitude or interests (HPCSA, 2010, p. 2) (Italics inserted)
Form 207 (HPCSA, updated June 2009, p. 3) lists all the classified and registered
psychometric instruments in South Africa. Furthermore, it highlights the responsibilities of
test administrators regarding non-classified tests: 1. Some important issues need to be pointed out to the users of psychological tests,
measures, and instruments: Test users may find that many tests that are currently in use
are not on the list. In such an instance it means that they are either currently under
classification consideration or they might not have been submitted for classification

INVESTIGATING THE PREDICTIVE VALIDITY OF CAP TEST
Page 39
purposes to the Psychometrics Committee. The onus rests on test users to refer such tests
to the Psychometrics Committee, even if they were developed overseas; and
2. It needs to be noted that even though a test may be classified as a psychological
test, the onus rests on the test user to ensure that:
* the test is valid for the purposes for which it is being used;
* appropriate norms are consulted; and
* where tests that have been developed in other countries are concerned, appropriate
research studies need to be undertaken to investigate whether the test is culturally biased
and special care should be taken when interpreting the results of such tests (HPCSA,
updated June 2009, p. 3).
Within this study, psychometric tests are defined as tests that measure a
psychological construct, such as cognitive functioning, interest, aptitude and attitude, in
line with the policy of the Health Professions Council of South Africa (HPCSA). Naglieri et
al. (2004, p.14) made an important differentiation in the context of computerised
psychological testing. According to them, testing refers to the administrative function of
completing of the questionnaire, with the focus on the individual test itself. Psychological
assessment refers to the process which may include more than one tool such as tests and
interviews as well as interpretation of different sources of information, such as educational
qualification and personal history in addition to the profile developed by the test
questionnaire. The focus here is on the integration and interpretation of data in the
assessment process with the goal to answer the referral question/s. (Naglieri et al., 2004,
p.15).
Of course, the ideal in placement testing would be to make use of standardised
psychometric instruments but amongst the 30 colleges who participated in the survey
mentioned above, there were only three (10%) who had trained professionals (i.e. a
psychologist, psychometrist or registered counsellor) on their staff to oversee the testing
process. The result was that at 90 percent of the participating colleges, testing as part of
advisory services was administrated by people who were not professionally qualified.
Furthermore, testing with the purpose of admitting or excluding students from programmes
was done by staff members who were not trained to do this.
INVESTIGATING THE PREDICTIVE VALIDITY OF CAP TEST
Page 40
It is clear that there is no uniform, standardised way of testing prior to registration at
FET colleges in South Africa and this highlights the inconsistency of admission criteria
amongst the colleges. It is possible that a student, who is excluded from one college for a
particular reason, may easily be accepted at another. One of the advantages of
placement testing is that it serves as a standardized form of measurement. Nevertheless,
in spite of this advantage, the legacy of South Africa’s sad political history is that students
who are making important life decisions have very erratic levels of support. A large
portion of the student population in South Africa, especially at Further Education and
Training Colleges, are either not guided in the process, or guided by unethical processes
and unqualified people.
Selection, entrance, access, admission or placement tests
Tests as gate-keeping tools: As can be deduced from the extensiveness of
research reports by Scherman et al. (2006); Marais (2007); Blunt (2000); Lemmens (2010)
and Bohlmann (2009), a lot of money has already been spent to ensure the development
of a useful, valid and reliable South African placement instrument, with the purpose of
predicting academic achievement. Clearly, institutions nationally and internationally have
placed a high value on the predictive nature of the placement test, in other words, the
tests’ ability to give an indication of the likelihood that a student will successfully complete
his/her course. Many institutions use such tests¸ commonly known as Selection,
Entrance, Access or Admission Tests, as part of their admission protocol. For example,
the selection policy of the Health Sciences faculty of the Johannesburg University, states
that:
If you are applying to the Health Sciences, you will not be selected solely on
your school leaving results, although they are very important. A composite
index is calculated, taking into consideration (1) your academic results for FIVE
subjects; (2) Health Sciences Consortium Test scores; (3) the score achieved
for the Biographical Questionnaire. (Wits University website, 2010)

INVESTIGATING THE PREDICTIVE VALIDITY OF CAP TEST
Page 41
Tests as diagnostic tools: Some researchers find the exclusion of students from
programmes, unacceptable. Koch et al. (2001) and Bohlman (2009) argue that placement
testing should oppose gate-keeping at entry, and should focus on the developmental and
enabling value that it could have for a student. For these researchers, the predictive
function of a placement test should be utilised as a supportive academic indicator, rather
than an exclusion indicator. They advocate the use of placement tests to assist a student
to select a specific vocational field, and/or to identify the skills gap that must be closed in
order to complete the course. The focus is to identify the level of support a student might
need in order to bridge the skills gaps. Higher Education South Africa (HESA) endorses
the use of the standardised National Benchmark Test (NBT) to identify the level of a
prospective students’ readiness to enter Higher Education but “The NBT also provides
information to assist in the placement of students in appropriate curricular routes (e.g.
regular, augmented, extended, bridging or foundation programmes) and with the
development of curriculum for Higher Education programmes.” (NBT website, 2011).
Lemmens (2010) supports the stance on a placement test as a diagnostic supportive
instrument. The Academic Readiness Questionnaire developed by him is aimed at early
identification of possible high risk students, and should be administered early in the
academic year. The purpose is that identified students can be supported as soon as
possible in order to minimize attrition, improve throughput and the successful completion
of their qualifications.
Definition of placement tests
Although selection, entrance, access or admission tests focus on exclusion of some
students, South African policy is that placement tests should focus on inclusion of all
students. Sax and Newton (1997) differentiate between selection and placement tests on
the basis of when they are administered. Selection tests are administered prior to
placement, and acceptance is based on the results. According to them, placement tests
are administered after selection, and are used for the purpose of differentiating placement
levels or categories. This is a popular practice, for example at the International House in

INVESTIGATING THE PREDICTIVE VALIDITY OF CAP TEST
Page 42
Newcastle, in Newcastle upon Tyne, UK (2006) where the placement test is used to
identify the correct level at which a student should be placed.
The definition of a placement test should lie in its purpose. As it could be utilised
for a dual purpose, it is suggested that a placement instrument will be defined as: a
diagnostic evaluation of a person’s skills and competencies at a specific moment, with the
purpose to predict possible achievement in future. Once the prediction is determined, a
decision can be made to either take supportive action, or to consider exclusion.
Therefore, although selection, entrance, access or admission tests focus on
exclusion of some students, placement tests should focus on inclusion of all students, and
on academically supporting the student. With the main focus on supporting the student,
the CAP test was developed as a placement instrument:
The purpose of the test is not to exclude students from the FET sector, but rather to
assist the College in placing prospective students that have the fundamental skills in
appropriate vocational fields. Thus, the focus is to identify the level of additional
academic support some students may require (CAP, 2007, p. 2).
It should be noted here that the same instrument could be used as both a selection
and a placement tool. Although the Academic Readiness test of Lemmens (2010) has as
its purpose to determine the readiness and support the non-ready students, it is
unavoidable that it would also identify students who need so much support that the
financial investment needed to educate them is not viable. In the FET sector in South
Africa, there is continuous pressure from lecturing staff to use placement tests at FET
colleges in South Africa as part of a selection process in order to exclude such students,
although exclusion is currently not part of the admissions policy at most colleges.
VALIDITY AND RELIABILITY
For a test to be effective, it needs to be valid and reliable. Validity, according to many
authors (Ghiselli, Campbell & Zedeck, 1981; Walsh & Betz, 2001; Popham, 2000)

INVESTIGATING THE PREDICTIVE VALIDITY OF CAP TEST
Page 43
basically means that a test measures what it is supposed to measure. Types of validity
particularly relevant to this study are:
Content validity, which is generally understood as whether a test measures
what it aims to measure,
Construct validity, which is generally understood as the extent to which what
is measured matches people’s understanding of what it measures, and
Predictive validity, which is where criteria that are available or easily acquired
(for example test scores) can be confidently used to predict some future
outcome (Walsh & Betz, 2001).
Validity of Placement Tests.
Although differentiation between, and classification of the different types of validity
support the endeavour to come as close to true validity as possible, Kane (2001, p. 319-
342) points out that “the criteria for evaluating validity evidence were still in doubt”, and
therefore suggests that there should rather be a broad, general definition of validity. The
concept of validity has evolved extensively over the last few years (Moss, 1992, in Gere et
al., 2010), and according to Gere et al. (2010), this shift developed to include evidence of
social and personal consequences and values. This stance was also supported by
Cronbach (1988, as in Gere et al., 2010) and Messick (1995). It was specifically Messick
who supported the idea of a broad general view on validity and criticized the classification
of validity as insufficient because it “fails to take into account both evidence of the value
implications of score meaning as a basis for action, and the social consequences of score
use.” (Messick, 1995, p. 741). This is relevant as this research, focusing on placement
tests as a predictive tool of future achievement of students in a college, would be
senseless if the knowledge is not used in the interpretation of validity. The underlying
ethical question is always: on what basis can this instrument be used to guide and place
students? Does this instrument measure what it is expected to, and to what extent can the
measured results be used to guide a student’s future?

INVESTIGATING THE PREDICTIVE VALIDITY OF CAP TEST
Page 44
Figure 6: Facets of Validity as a Progressive Matrix (Messick, 1995, p. 748)
Messick’s suggestion evolved from the earlier understanding that a test is valid if it
measures what it is supposed to measure. He argues that this is a limited viewpoint and
that validity is actually a unification of contextual, substantive, structural, generalizable,
external and consequential dimensions (Messick, 1995, p. 741). Messick’s Progressive
Matrix suggests that construct validity is a culmination of evidence in the interpretation of
the test results.
Reliability
Many authors use the analogy of a ruler versus a stretchable tape measure to
explain that a test should get the same results if it is administered repetitively under the
same conditions. (Walsh & Betz, 2001; McQueen & Knussen, 2006). A plastic ruler would
indicate the same length if something is measured under the same circumstances, but if a
tape measure that expands in wet or hot conditions is used, the readings would not
remain consistent despite the unchanged length of the object. If the measuring
instrument stays the same, one could say that it measures in a stable, repeatable or
consistent way and is thus reliable (Walsh & Betz, 2001, p. 47).
It is therefore important, as noted by McQueen and Knussen (2006, p. 139) that to
be reliable, a measuring instrument:
• Must be able to measure and detect changes in the variable
• Should not indicate change where there is no change
Facets of Validity as a Progressive Matrix
Test Interpretation Test Use
Evidential Basis Construct Validity (CV) CV + Relevance/Utility (R/U)
Consequential Basis CV + Value Implications (VI) CV + R/U + VI + Social Consequences

INVESTIGATING THE PREDICTIVE VALIDITY OF CAP TEST
Page 45
• Must demonstrate consistency and stability of test results
Therefore, if a variable changes, the reliable measuring instrument should indicate the
change accordingly.
Summary
In this chapter, Mkele’s assumptions for testing were discussed and adapted to
serve as a foundational framework, and the opposing forces framework of Jaggers and
Hodara has accentuated an effective versus efficient interpretation of Mkele’s third
assumption. An extensive literature search revealed very little research about placement
testing in FET, but differences or similarities between selection, entrance, access,
admission or placement tests were discussed. The reason for choosing placement tests
rather than psychometric tests was investigated, and a summary of how literature
expounds valid and reliable placement tests was included.
It is necessary to point out that both the research design and methods should be
valid and reliable, and this will be discussed in chapter 3. Population and sampling
selection will be discussed and the preparation and statistical analysis of the data will be
explained.

INVESTIGATING THE PREDICTIVE VALIDITY OF CAP TEST
Page 46
CHAPTER 3
RESEARCH DESIGN AND METHOD
Prospective students who want to register for NC(V) level 2 must have a certain
level of knowledge of English and Mathematics to cope with the academic content of the
level 2 curriculum. The CAP test was developed as a diagnostic test with the objective of
identifying gaps in the required prerequisite-knowledge. Furthermore, it is useful if a
placement test can predict future academic achievement as reliably as possible, in order
to plan for the assistance and support of students who are likely to be at risk. The
underlying question is always: on what basis can an instrument such as this predict future
academic success? If it can do so, can it be used to guide and place students? In other
words, does this instrument measure what it is expected to, and to what extent can the
measured results be used to guide a student’s future?
The reason for finding answers to the aforementioned questions is that it is not only
important to know if the test measures what it is supposed to measure, but also whether it
can be useful; measurement alone has little value if it cannot be applied. The goal of this
correlation study is to determine the extent to which the CAP placement test has predictive
value in relation to the NC(V) level 2 students if at all, and to make certain inferences
about the correlation patterns. The research value is that this knowledge could be used in
the implementation of strategies to improve the throughput of NC(V) level 2 students.
RESEARCH PARAMETERS
There are three different subtests in the CAP test, namely an English competency
test, a Mathematics competency test and a Career Interest Questionnaire. This study is
concerned with the correlation between the subtests of the CAP English and Mathematics
competency test and the final year-end results for the Mathematics literacy and the
English subjects.

INVESTIGATING THE PREDICTIVE VALIDITY OF CAP TEST
Page 47
POPULATION AND SAMPLING
For the purpose of this study, population refers to the entire group of people who
might complete the CAP test. The targeted population group comprises all the
prospective students who want to register for an NC(V) qualification at any of the Further
Education and Training Colleges in South Africa. In 2010, 60 691 students registered
nationally for NC(V) level 2 (Department of Education, 2011b). These numbers do not
differentiate between first registrations and students who register for a subsequent time.
As this study focuses on Boland College, the population for this research is the 1050
prospective NC(V) level 2 students in January 2012 at Boland College.
The sample used in this study is made up of students at one FET College who
wrote the CAP test in January 2010 and year-end exams in November 2010, and whose
test scores form the basis of this research. Findings will reflect validity only in terms of this
group, although it possibly reflects the truth for other colleges where students share
characteristics with students at Boland College, and where there is commonality between
these other colleges and Boland College.
Boland College was approached with a request to make its data available for this
research in 2010, and acquiesced to this request. One of the reasons why the data
generated by Boland College in January 2010 and November 2010 are used for the
research is because of the personal involvement of the researcher at the college, which
made data collection unproblematic, and allowed for good control over the testing
procedures and processes.
Overview of the College
Boland College is a rural FET College situated in the Winelands District of the
Western Cape Province. It consists of 5 campuses and 2 satellite campuses. Students
speak predominantly Afrikaans and for the majority of students English is the first
additional language. A lesser number of students speak isiXhosa at home and many of
them come from the rural areas in the Eastern Cape, Ciskei and Transkei. There are a
number of immigrant students from different countries, amongst them from Namibia,

INVESTIGATING THE PREDICTIVE VALIDITY OF CAP TEST
Page 48
Botswana, Greece and China. Students are drawn mainly from the rural towns in the
Boland, an area stretching across Struisbaai, Strand, Wellington, Ceres and Robertson.
There are hostels at three of the five campuses, and bus transport is also provided to the
campuses. The main economic activities in the area are farming such as wine, crop and
fruit farming, and related industries such as food processing, export and tourism.
About 4000 full time students are registered in all the programmes of the college. A range
of full time programmes are offered on the 5 campuses. There are two entry levels
namely post-grade 12 and post-grade 9. Programmes for which the minimum entry
requirement is grade 12 include: Management Programmes, Assistant Management
Programmes, Hospitality and Catering Services, Early Childhood Development, Tourism,
Engineering Studies and Agricultural Studies. National Certificate (Vocational)
programmes for which the minimum entry requirement is grade 9 are also offered in the
following areas: Civil Engineering and Building Construction, Engineering and Related
Design, Electrical Infrastructure Construction, Finance, Economics and Accounting,
Marketing, Office Administration, Hospitality, Primary Agriculture, Tourism, Information
Technology and Computer Science, and Safety in Society. One specific achievement of
note is that the college produced its first batch of wine in 2010, cultivated from vines that
were grown by the students.
Part time learnerships and skills training programmes are also available, mainly in
response to specific demands of the community and in partnership with SETAs and other
small, medium and macro organizations.
Collection and cleaning of the data
Computerised printouts of responses from 1050 students who wrote the CAP test
during the registration cycle of 2010 were collected. Some of the results were incomplete
and therefore eliminated as spoilt results. Students who obtained a zero per cent score (in
the case of the competency tests) or who made incomplete responses (in the case of the
interest questionnaire), were eliminated from the original database because this indicated

INVESTIGATING THE PREDICTIVE VALIDITY OF CAP TEST
Page 49
that they either did not attempt to answer the test items, or failed to enter their responses
correctly on the computer.
The English data: Eventually the data of 320 students who wrote both the CAP
test and the final year end examinations in English were used. This comprises 29.8% of
the total number of NC(V) level 2 students at Boland College in 2010.
The Mathematics data: Four hundred and ninety students wrote the CAP
Mathematics test and Mathematical literacy final year -end examinations. This comprises
45.4% of the Boland College 2010 level 2 cohort. However, the situation for the
Mathematics results differs because only 20 students (0.19% of the cohort) wrote both the
CAP test and the final year-end Mathematics assessments in 2010. Since 20 is too small
a sample for statistical significance, the correlation between the CAP Mathematics and the
final year-end Mathematics has been omitted, and only data of the 490 students who
wrote both the CAP Mathematical and the final year end Mathematical literacy
assessments have be taken into account in judging the predictive validity of this
instrument.
Table 1: Initial Research Participant Numbers
Research Instruments and Data analysis
One of the most ideal methods to find answers to the kind of research questions
that characterise this study, is that of the correlation study. McQueen and Knussen (2006)
explain that a correlation study is not only a research method, but also a statistical
procedure. A correlation design is an accepted method to investigate validity (McQueen &
Knussen, 2006) and the bivariate method is used in this research to determine the
BOLAND
COLLEGE
2010
Students who
wrote the CAP
test
Number of students
with unspoilt
ENGLISH test results
Number of students with
unspoilt MATHEMATICS test
results
Total 1050 1029 1018

INVESTIGATING THE PREDICTIVE VALIDITY OF CAP TEST
Page 50
relationship between two variables, namely the results that prospective students achieved
in the CAP test and their year-end scores. The strength of the correlation between these
variables indicates the degree of predictive validity of the test.
In this study, the predictive validity of different variables is determined by calculating the
Pearson Product-moment correlation between CAP scores and year -end results. The
following categories were identified:
The results of the CAP English subtest and the results of the final year-end
English Language examination.
The results of the CAP Mathematics subtest and the results of the final year
end Mathematics Literacy examination.
The above correlations were calculated for different gender, language and
culture groups.
In 2011, a Pearson product moment correlation of the results of grade 9
learners who completed both the CAP test and the PACE test was also calculated. As the
CAP test and the PACE test both consists of three subtests, namely English, Numeracy
and a Career Interest questionnaire, this correlation indicates validity in that it measures
the extent of correlation of the CAP test with another placement test. Both the CAP and
PACE English tests are multiple choice and both instruments can be administered as pen-
and-paper tests, or as a computerised tool. Both English tests include components of
language and comprehension, and no written or oral work is tested. The main difference
between the two instruments lies in the numeracy subtest. The CAP subtest is based on
grade 9 Mathematics, while the PACE subtest is a Mathematical literacy test.
Response Rate
Many students who wrote the CAP test did not complete the year and were absent
during the final examinations. Of the students who wrote both the CAP English and CAP
Mathematics tests in January 2010, only 320 attempted the English year-end examination,

INVESTIGATING THE PREDICTIVE VALIDITY OF CAP TEST
Page 51
only 20 attempted the Mathematics year-end examination, and only 490 attempted the
Mathematics Literacy year-end examination. Table 3 indicates the number of students
who wrote both the CAP test in January 2010, and the final year-end examination in
November 2010.
Test / Examination Written Number of students
CAP: Mathematics 710
Final year-end examination: Mathematics 20
Final year-end examination: Mathematic Literacy 490
CAP: English 710
Final year-end examination: English First Additional
Language 320
Because of the small number of students who wrote the final Mathematics
examination, it is clear that the Mathematics database was not big enough to establish a
reliable statistic. However, because of the nature of the non-probability sampling model, it
could be possible to include test results from other academic years or other groups in
future studies, something which was not done for this study.
Sample Characteristics
A critical trait of a good sample is that it should be representative of the total
population. (Fox & Bayat, 2007). As data of 710 (67%) of the 1050 students who wrote
the CAP test, were used, this is a highly representative sample. According to national
statistics (Department of Education, 2011a) this sample is 1% of the total population of
approximately 60 000 level 2 students. The following precautions were taken to eliminate
sampling errors as far as possible:
Table 2: Final Research Participant Numbers

INVESTIGATING THE PREDICTIVE VALIDITY OF CAP TEST
Page 52
Gender – The number of male and female participants in this study was
almost even. This echoes the national statistics of students at FET colleges in 2010,
where it is reported that 52% of the students are female and 48% are males (Cosser et al.,
2011).
Figure 7: Gender Distribution of Sample Population.
Language - The majority of the students in the sample (70%) spoke Afrikaans as a
first language, while the rest spoke either English (11%) or isiXhosa (19%). Although 29%
students were Black, many of them indicated their home language as either Afrikaans or
English and only 1 student indicated his home language as Sesotho. The CAP test was
administered in English which probably was the second language for 89% of the
participants. English is the medium of instruction and the respondents on the CAP test
scored an average of 50% on the English test.
357
353
Gender distribution of sample population FEMALE MALE

INVESTIGATING THE PREDICTIVE VALIDITY OF CAP TEST
Page 53
Figure 8: Language Distribution of Sample Population.
Population Groups – the majority of the students were Coloured (67%) and
just less than a third (29%), were Black students. There was only one Indian student and
one Asian student, and 4% of the students were White. The national statistics for students
at FET colleges indicate 96% black students (Cosser et al., 2010). It is not clear whether
this percentage includes Indian, Coloured and Asian students. If so, the racial distribution
of the sample groups similarly reflects the national distribution.
Figure 9: Racial Distribution of Sample Population
70%
19%
11% 0%
Language distribution of sample population Afr Xhosa Eng Sotho
67%
29%
4% 0% 0%
Racial distribution of sample population
Coloured Black White Asian Indian

INVESTIGATING THE PREDICTIVE VALIDITY OF CAP TEST
Page 54
Age – When comparing all the students in South Africa at FET Colleges and Boland
College, there are differences between colleges in relation to the percentages of students
younger than 20 years. Boland College has 46%, almost half of the cohort in this age
group, while on a national level there are only 20%. Only 11% of the Boland College
students are over the age of 24 compared with the 24% (almost 1 out of every 4 students)
nationally that falls in this older age group.
Figure 10: FET Student Age Distribution 2010.
Educational background – All the students who wrote the test had passed
at least grade 9. Some of them were still busy with grade 9 when they wrote the CAP test
in September 2009. Others completed grade 12, but opted to take Mathematical literacy in
grade 10 - 12. The implication is that they had not studied pure Mathematics for the three
years prior to taking the CAP test, which may also have influenced the test results
negatively.
Socio-economic background – candidates were included from rural
farming areas, from semi-urban industrial areas and from urban environments. Because
there is no financial cost for candidates to complete placement testing, no discrimination
took place on the ground of economic affordability and all students were included.
20%
56%
24%
46% 43%
11%
<20 years 20-24 years >24 years
FET Student Age Distribution 2010
National Student Age Boland Student Age

INVESTIGATING THE PREDICTIVE VALIDITY OF CAP TEST
Page 55
PREPARATION OF DATABASES
Two sets of data were used. The first set contained the CAP test results and the
second set contained the final year-end marks of the students. These two sets of
information had to be merged into one sheet, containing all the relevant data. Zero scores
were removed as the reasons for zero values were unknown, but could possibly be
because some students really could not answer any question correctly, or because some
students did not complete the test by accident or on purpose, or because of computer
programming errors, or other unknown reasons, such as absenteeism.
Annually, colleges register new students in January. Boland College started with
the CAP testing in September 2009, and the last students completed the test at the end of
January 2010. After completing the test, students registered at the college for the NC(V)
programme of their choice.
STATISTICAL ANALYSIS
This research compares the scores that a student obtained for CAP Mathematics
and English tests in the beginning of the year, with his or her final results at the end of the
year. The data were statistically analysed to ascertain the extent of correlation between
these two sets of scores, and to reveal patterns of correlation. From the results it can be
determined whether the CAP test can be used as an instrument to predict future academic
achievement.
The Pearson Product-moment correlation coefficient.
Microsoft Excel serves as a convenient database, as Excel has many advantages.
One of the functions of Excel is that it contains programmed formulas for certain statistical
calculations, such as the Pearson Product-moment correlation coefficient. All the
statistical calculations in this study were done in Excel.

INVESTIGATING THE PREDICTIVE VALIDITY OF CAP TEST
Page 56
The equation that Excel used to calculate the Pearson coefficient is:
where r indicates the correlation coefficient, and x and y are the sample means
AVERAGE(array1) and AVERAGE(array2).
The coefficient of determination
To determine if the CAP tests have predictive value, the coefficient of determination
was calculated. This coefficient, r2, is the square of the Pearson Product-moment
correlation coefficient between outcomes and predicted values
Anscombe’s quartet.
Apart from the magnitude of a correlation coefficient, which indicates the strength of
the relationship between two variables, is it also important to observe the pattern of
distribution of results, as indicated in Anscombe’s quartet. Anscombe (1970)
demonstrated the danger of only taking statistical calculations into consideration when
interpreting data, and not the visual pattern as well, by noting that in the four very different
scatterplots, the correlation coefficient r and other statistical data were almost identical
(van Rensburg, 2011).

INVESTIGATING THE PREDICTIVE VALIDITY OF CAP TEST
Page 57
Figure 11: Anscombe’s Quartet (1970, in Van Rensburg, 2011)
The importance of scatterplot patterns is significant for this study, and the
scatterplot distribution patterns are taken into consideration in the interpretation of the
correlation analysis.
SUMMARY
This chapter described the research method, procedure and data processing. In
the next chapter the research findings will be discussed, as guided by the research
questions.

INVESTIGATING THE PREDICTIVE VALIDITY OF CAP TEST
Page 58
CHAPTER 4
FINDINGS AND DISCUSSION OF FINDINGS
The purpose of the research was to find answers to the research question: Is the
CAP test a valid predictor of FET College students’ academic success? It is important to
understand the placement test’s predictive nature as this instrument is used as an early
identification of students at risk to fail the first year at college. In this chapter, only one
focus area will be explored in order to discover an answer to this research question,
namely: What is the extent of the correlation between the students’ CAP results and the
final year-end results? The second focus area will be discussed in chapter 5: What
inferences can be made from the pattern of correlation between these results?
These questions are answered through a statistical analysis of the students’ scores
on the CAP results and their final year-end results, and a discussion of patterns revealed
in this analysis. It is important to take cognizance of the following aspects before the
findings are explored:
In the interpretation of the Mathematics results, the proverbial comparison of apples
with apples was not possible. The CAP Mathematics scores could not be compared to the
final year-end Mathematics scores, because the number of students in the 2010 cohort
who wrote both Mathematics assessments (n=20), was not big enough for statistical
significance. Hence, the discussion of the results refers to the students who wrote CAP
Mathematics and the final year-end assessment for Mathematical Literacy (n=485). This
is, proverbially, comparing apples with pears as Mathematics and Mathematic Literacy are
two different subjects. Nonetheless, as explained in chapter 2, the CAP test is based on
the outcomes of grade 9 Mathematics because grade 9 is the minimum entry requirement
set by the department to enter NC(V) Level 2. Grade 9 Mathematics serves as the
foundation for both subjects, although Mathematical Literacy relates more to everyday
contexts than pure Mathematics does.

INVESTIGATING THE PREDICTIVE VALIDITY OF CAP TEST
Page 59
THE CORRELATION BETWEEN THE STUDENTS’ CAP RESULTS AND THEIR FINAL YEAR-END RESULTS
Correlation studies are frequently concerned with validity. It is imperative to note
that many variables could influence the correlation of a placement test and final year-end
results, such as health, socio-economic, personal and other factors. Identification of those
factors, although briefly discussed in chapter 2, falls outside the scope of this document.
Validity of the English and Mathematical competency tests
FET colleges need to identify students who are unlikely to be academically successful, as
early as possible. Apart from knowing what academic gaps a student has, the importance
of measures of predictive validity in this research is that the college may have an early
indication of the likelihood that a student will be academically successful.
Predictive Validity: To determine if the CAP test has predictive validity for
students’ success in their first year at an FET college, Pearson Product-moment
correlation coefficients were calculated for the relationships between the CAP English test
and the NC(V) English year-end results, and the CAP Mathematics test and the
Mathematical Literacy final year-end results. An important aspect in determining the
extent of correlation is the role that sample size plays in interpreting the correlation
coefficient. In relation to this, critical values of r are taken into account. Furthermore, the
coefficient of determination (r²) which is a coefficient used in the prediction of future
outcomes, is calculated.
The critical value of r indicates the minimum correlation coefficient value that is
needed to state with confidence that there will be a relationship between the two variables
in at least 95% of the cases with a sample of that specific size. It is understandable that
the critical value is influenced by the number of cases. The bigger the n, the lower the
critical value of r is needed for statistical significance. Table 3 indicates the values of the
Pearson Product-moment correlation coefficients (r):

INVESTIGATING THE PREDICTIVE VALIDITY OF CAP TEST
Page 60
Table 3: Pearson Product-moment Correlation Coefficients (r)
The value of r is significant at the p = .05 level for both these correlations, since the
crucial value of r for a sample of 315 is 0.113 and for a sample of 485, it is 0.088.
However, for the CAP English scores and final year-end English results, there was a
slightly stronger positive correlation (r = 0.505) than there was between CAP Mathematics
scores and year-end Mathematical Literacy results (r = .462). The coefficient of
determination (r²) is in the region of .25 for English which means that only 25% of the
factors contributing to each score correlate. This is far too low for the CAP test to be
counted upon as having predictive validity. Referring to Anscombe’s quartet, the scatter
diagram of the CAP English/final year-end English results (figure 12) displays a linear
relationship and the size and the shape of the distribution shows a statistically significant,
but only moderately strong correlation.
The coefficient of determination (r²) is only in the region of .21 for Mathematics,
which means that 21% of the factors contributing to each score, correlate. The predictive
value of the CAP test is even less here than it is for English. The scatter diagram of the
CAP Mathematics/final year-end Mathematical Literacy results (figure 13) also indicated a
positive linear relationship but the shape and size and the scattering of the results suggest
a weaker correlation than the English test.
English N = 315 Critical value of r: 0.113 at
p=0.05 r = 0.505 r² 0.25
Mathematical Literacy N =484
Critical value of r: 0.088 at
p=0.05 r = 0.462 r² 0.21

INVESTIGATING THE PREDICTIVE VALIDITY OF CAP TEST
Page 61
Figure 12: Scatterplot of English Responses.
Figure 13: Scatterplot of CAP Mathematics and Mathematical Literacy
y = 0.6122x + 16.035 R² = 0.2561
0
10
20
30
40
50
60
70
80
90
100
0 10 20 30 40 50 60 70 80 90 100
Fin
al y
ear
en
d r
esu
lts
CAP results
Scatterplot of English Responses n=315
y = 0.7395x + 24.133 R² = 0.2133
0
10
20
30
40
50
60
70
80
90
100
0 10 20 30 40 50 60 70 Fin
al y
ear
en
d M
ath
em
atic
al L
ite
racy
CAP Mathematics
Scatterplot of CAP Maths and Math Literacy n=478

INVESTIGATING THE PREDICTIVE VALIDITY OF CAP TEST
Page 62
Language groups:
Pearson Product-moment correlation coefficients for the relationships between
scores of students representing different home language and population groups of the
English and Mathematics subtests, were calculated. Although some Black student
indicated that English or Afrikaans was their first language, it is assumed that there is a
strong link between home language (e.g. isiXhosa) and population groups (e.g. the Xhosa
people) as indicated in the college registers. Therefore, it could be argued that the results
of r should be more or less of similar strength for both the population and the language
analysis.
Table 4: Language Groups
English correlation: For students who indicated English (n=61) as their first
language on the college registers, a positive correlation was found between the CAP
English test and year-end results at the p = .05 level (r = .534). A positive correlation (r =
LANGUAGE n=
Critical value of r
ENG tests
r =
r² n=
Critical value of r
.Maths
tests r =
r²
XHOSA & SOTHO
91 .205 0.317 0.100 =
10% 87 .205 0.195 0.038 =
3.8%
ENG 61 .250 0.534
0.285 =
28% 52 .273 0.578
0.334 =
33.4%
AFR 163 .159 0.495
0.245 =
24.5% 345 .113 0.483
0.233 =
23.3%

INVESTIGATING THE PREDICTIVE VALIDITY OF CAP TEST
Page 63
.495) was also found for Afrikaans first language speakers (n=163) between the CAP
English test and year-end results at the p = .05 level.
For students indicating Xhosa and Sotho (n=91) as their first language on the college
registers, a positive correlation (r = 0.317) was found between the CAP English test and
year end results at the p = .05 level.
In the understanding of ‘strength of the correlations’, it should be remembered that
the differences in strength of the correlations are shown in how much greater r is than the
critical value. For r, narrow gaps show correlations that are only just significant (just over
the bar) and wider gaps (well over the bar) show stronger correlations as r gets closer to
1. Therefore, it is clear from the table above that although there are positive correlations
for all population groups, the correlations for the Afrikaans-speaking (indicated by the
difference between 0.250 and 0. 534) and English speaking (difference between 0.159
and 0.495) groups are much stronger than the correlations for the Xhosa and Sotho
speaking groups (difference between 0.205 and 0.317)
Although there are significant differences between these language groups, the
coefficient of determination is not high enough for the predictive value of the CAP test for
any of the language groups.
Mathematics correlation: Since (r = .578) at the p = .05 level, a positive correlation
was found between the CAP Mathematics test and year-end results for Mathematical
Literacy for the English first language speakers (n= 52).
For the Afrikaans speaking group (n= 345), there is a positive correlation ( r = .483)
at p = .05 level between the CAP Mathematics test and Mathematical Literacy results for
the 2010 students at Boland college. In spite of the statistical significance of the
correlation coefficients for both of these language groups, the coefficient of determination
shows that in terms of the prediction of future outcomes, the CAP test cannot be relied
upon (33% for English and 23% for Afrikaans).
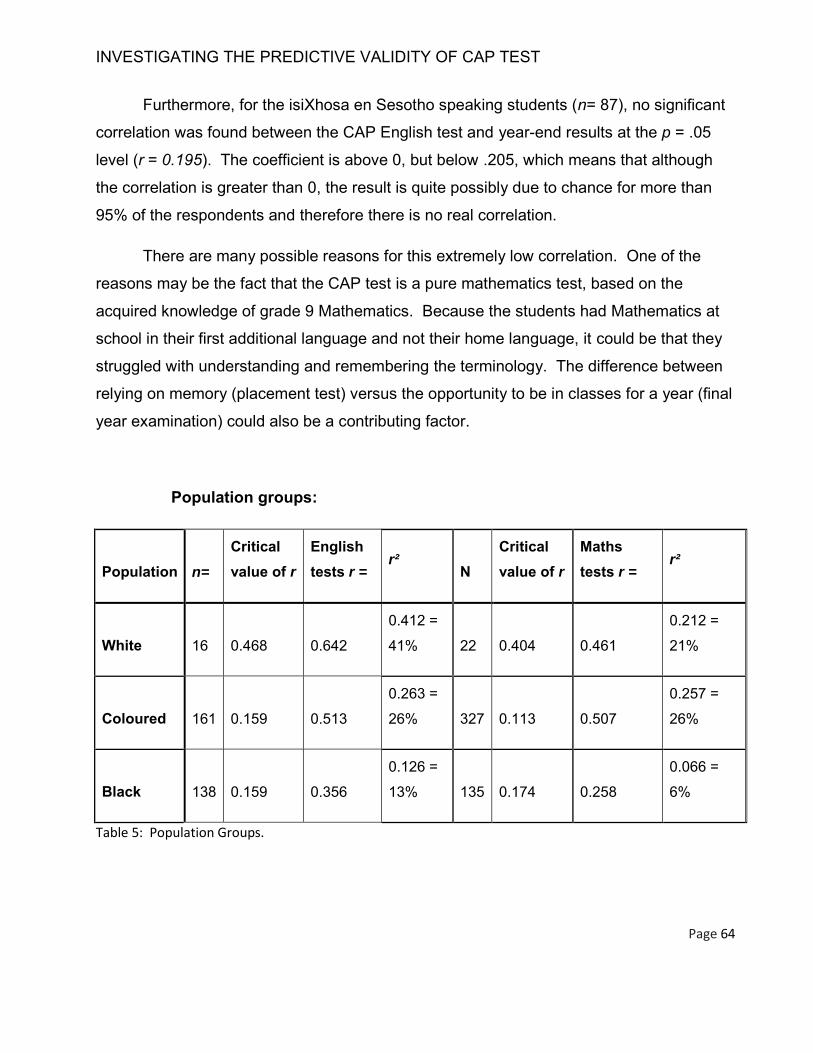
INVESTIGATING THE PREDICTIVE VALIDITY OF CAP TEST
Page 64
Furthermore, for the isiXhosa en Sesotho speaking students (n= 87), no significant
correlation was found between the CAP English test and year-end results at the p = .05
level (r = 0.195). The coefficient is above 0, but below .205, which means that although
the correlation is greater than 0, the result is quite possibly due to chance for more than
95% of the respondents and therefore there is no real correlation.
There are many possible reasons for this extremely low correlation. One of the
reasons may be the fact that the CAP test is a pure mathematics test, based on the
acquired knowledge of grade 9 Mathematics. Because the students had Mathematics at
school in their first additional language and not their home language, it could be that they
struggled with understanding and remembering the terminology. The difference between
relying on memory (placement test) versus the opportunity to be in classes for a year (final
year examination) could also be a contributing factor.
Population groups:
Population n= Critical value of r
English tests r =
r² N
Critical value of r
Maths tests r =
r²
White 16 0.468 0.642 0.412 =
41% 22 0.404 0.461 0.212 =
21%
Coloured 161 0.159 0.513 0.263 =
26% 327 0.113 0.507 0.257 =
26%
Black 138 0.159 0.356 0.126 =
13% 135 0.174 0.258 0.066 =
6%
Table 5: Population Groups.

INVESTIGATING THE PREDICTIVE VALIDITY OF CAP TEST
Page 65
English correlation: For students who indicated that they are White (n=16) on the
college registers, a moderate positive correlation was found between the CAP English test
and year-end results at the p = .05 level (r = 0.642). A slightly weaker but still positive
correlation was found for students who indicated that they are Coloured, Asian and Indian
(n=161), between the CAP English test and year-end results at the p = .05 level (r =
0.513).
For students who indicated that they are Black (n=138, a weak but still significant
positive correlation (r = 0.356) was found between the CAP English test and year-end
results at the p = .05 level. Although these levels are above the critical value of r for all
these samples, the coefficient of determination shows that in terms of the prediction of
future outcomes, the CAP text cannot be relied upon for any of them.
Mathematics correlation: Since r = .461 at the p = .05 level, a moderate positive
correlation was found between the CAP Mathematics test and year-end results for
Mathematical Literacy for the White population group (n= 22). The significance here is only
just over the bar or cut off point, with the critical value being = 0.404 compared with the
value of r = 0.461. In terms of the prediction of future outcomes, the coefficient of
determination is only be 21% which is obviously far too low for a trustworthy predictive
test.
For the Coloured population group (n= 327), there is a moderate positive
correlation ( r = .507) at p = .05 level between the CAP Mathematics test and Mathematics
Literacy year-end results. This significance for the coloured population is slightly stronger
than the significance for the white population, indicated by the difference between 0.461
and 0.507. However, the coefficient of determination is only 26% and although it is a
higher indicator than that for the White population group, it is still not high enough for the
predictive value of the CAP test to be counted upon. For students who indicated that they
are Black (n= 135) the coefficient of (r= .258) is above the critical value of .174, but still

INVESTIGATING THE PREDICTIVE VALIDITY OF CAP TEST
Page 66
very low, and means that the result is possibly due to chance for more than 95% of the
respondents. Thus the correlation between the CAP Mathematics test and Mathematical
Literacy year-end results is not significant. The coefficient of determination is an
extremely low 6% for Black students.
In summary, it can be concluded that the correlation between CAP tests and year -
end results are weaker for Black students than White and Coloured students, and weaker
for speakers of South African indigenous languages than for speakers of Afrikaans and
English. In terms of the prediction of future outcomes, the coefficient of determination for
all three these groups is too low for the CAP test to be seen as a trustworthy predictive
test.
Programme Correlations:
Table 6 below shows significant positive correlations between the CAP test and the
final year-end results for English and Mathematics for most of the programmes. Data of
all the students who were part of the sample group were used, based on the programmes
they enrolled for. The + sign indicates a significant correlation and the 0 indicates that
there is no significant correlation. It is interesting that there is no end of the year
Mathematical Literacy mark for the Electrical students (n=18) who wrote the CAP test in
January 2010.
The exact reason is unknown and further investigation into this occurrence is
needed. A possible reason, in retrospect, could be that there was an administrative error
with the results such as that the Mathematical Literacy results were still unavailable from
the Department, or the continuous assessment marks accumulated during the year, were
not yet processed. The CAP results ranged between 15% and 79% which minimizes the
possibility that the zero scores is a true reflection of the students’ results. However, there
is no correlation between the English placement test and the final year-end results for this
group. The r is below .444, which indicates that the result is quite possibly due to chance
and there is no real correlation. Further investigation into the results of this and other
Electrical Engineering groups should be done to bring some clarity.

INVESTIGATING THE PREDICTIVE VALIDITY OF CAP TEST
Page 67
NC(V) Level 2 Programmes
Maths +/
0 Eng +/0
Critical value of r n r r²
Critical value of r n r r²
Tourism 0.273 57 0.506 0.25 + 0.25 56 0.638 0.40 +
Safety in Society 0.288 43 0.369 0.13 + 0.666 7 0.77 0.59 +
Office Administration
0.304 169 0.387 0.14 + 0.195 90 0.474 0.22 +
Marketing 0.325 33 0.286 0.08 0 0.355 28 0.485 0.23 +
IT 0.273 49 0.67 0.44 + 0.381 24 0.407 0.16 +
Hospitality 0.288 45 0.452 0.20 + 0.349 29 0.404 0.16 +
Finance 0.456 17 0.512 0.26 + 0.325 34 0.678 0.45 +
Engineering and Related Design
0.325 37 0.488 0.23 + 0.707 6 0.892 0.79 +
Electrical Engineering
0 0 0 0 0 0.444 18 -
0.087 0.01 0
Civil Construction
0.325 34 0.56 0.31 + 0.388 23 0.73 0.53 +
Table 6: Programme Correlations.

INVESTIGATING THE PREDICTIVE VALIDITY OF CAP TEST
Page 68
Some of the programmes have a very small number of participants, such as Safety
in Society (only 7 students participated in the English correlational study), and the
Engineering and Related Design (n= 6). Although there might be positive correlations, the
validity of these results cannot be proven as the numbers are too small to reflect
correlations of statistical significance. In terms of predictive validity, only these two
programmes yielded coefficients of determination that would be high enough to place
confidence in the CAP test, but for both of these the sample size is too small to reach
statistical significance.
Correlation between the CAP test and the PACE test:
As discussed earlier, there are currently only two placement tools available that are
in frequent use at FET colleges, namely the CAP test and the PACE test. For purposes of
triangulation, a Pearson product moment coefficient of these tests was calculated to
gauge the extent of correlation between students’ scores on these two placement tests,
both of which are used as placement tools prior to registration at FET colleges. An
analysis of the results of grade 9 learners (n = 33) at a school that completed both the
CAP test and the PACE test was done in September 2011. Both instruments consist of
three subtests: an English subtest, Mathematics or Numeracy subtest and a Career
Interest Questionnaire, and both instruments have been used by different schools and/or
colleges. For the purpose of this study, only the scores from the English and Numeracy
subtests were used.
Grade 9 CAP / PACE Correlation
n=33, critical value = .325
English Mathematics
0.485 0.276
Table 7: Grade 9 CAP/PACE Correlation.

INVESTIGATING THE PREDICTIVE VALIDITY OF CAP TEST
Page 69
English correlation: For the CAP and PACE English Tests, the level of statistical
significance of the correlation was moderate r = 0.485 indicating that a positive correlation
was found between the CAP English test and the PACE English test (n= 33) at the p = .05
level.
Mathematics correlation: For this group (r = .276), there is no correlation between
the CAP Mathematics Test and PACE Numeracy Test results for the grade 9 learners (n=
33) at the p = 0.05 level. It is possible that, as above, the comparison of the CAP
Mathematics Test and the final year-end Mathematical Literacy results could explain the
weak correlation between the two instruments. The PACE test is a general Numeracy
Test which focused on Mathematical Literacy, while the CAP test is a pure Mathematics
test, designed to be a diagnostic tool to identify the prospective student’s strengths and
weaknesses based on the outcomes of the grade 9 Mathematics curriculum. It was
decided to include this correlation study to find what correlation, if any, there would be with
the only other current alternative tool used at FET Colleges.
Reliability of the CAP English and Mathematics results
The consistency of CAP test results can be measured by comparing the averages
of the different campuses, as shown in table 8 and figure 14 below.
Averages of the CAP English results have a standard deviation of 1.605 which is
relatively small compared with the standard deviation of the English final year-end results
of 4.691. This indicates that the consistency of results for the CAP test is greater than the
consistency of the final year-end English results across the different campuses. There are
factors influencing the greater standard deviation of the final results. For example, the
different qualifications and experience of the lecturers. Another reason might be that
because the different campuses offer different programmes, they draw students from
different schooling backgrounds, for example Caledon offer Safety in Society with grade
12 as an entry criteria. Paarl and Stellenbosch offer Hospitality and Tourism where it is
compulsory to take Mathematical Literacy as a subject, whereas Strand offers engineering

INVESTIGATING THE PREDICTIVE VALIDITY OF CAP TEST
Page 70
programmes with Mathematics as a compulsory subject. Students also come from
different socio-economic areas such as Stellenbosch which draw post matriculants from all
over the country because of the specific “student life character” of the town, compared to
Caledon which is a small rural area catering mainly for children of workers in the
agricultural sector.
Campus averages
Campus n= CAP English n= CAP Maths n=
Final English n=
Final Maths Lit
Caledon 104 50.22 103 29.3 25 66.4 57 47.03
Paarl 118 47.3 116 28.1 56 53.24 86 41.45
Stellenbosch 158 50.36 157 29.3 130 59.51 131 45.93
Strand 118 50.56 117 29.6 75 59 68 42.36
Worcester 204 47.63 206 28.9 39 60.66 149 48,9
Standard Dev 1.605 0.581 4.691 2.704
Table 8: Campus Averages
A similar pattern is found between the CAP Mathematics results with a standard
deviation of 0.581, and the final year-end Mathematical Literacy results with a standard
deviation of 2.704.

INVESTIGATING THE PREDICTIVE VALIDITY OF CAP TEST
Page 71
Figure 14: Test Averages per Campus.
In this research, the analysis of the total averages for the combined subtests
reveals the following:
Figure 15: 2010 Boland College CAP English and Mathematical Literacy Average % Frequency Distribution.
50.22
29.3
66.4
47.03
47.3
28.1
53.24
41.45
50.36
29.3
59.51
45.93
50.56
29.6
59
42.36
47.63
28.9
60.66
48.9
CAP English
CAP Maths
Final English
Final Maths Lit
Test Averages per Campus
Worcester Strand Stellenbosch Paarl Caledon
0
50
100
150
200
250
2010 Boland College CAP English and Maths Literacy Average % Frequency Distribution
Frequency

INVESTIGATING THE PREDICTIVE VALIDITY OF CAP TEST
Page 72
0
50
100
150
200
250
[00:9) [10:19) [20:29) [30:39) [40:49) [50:59) [60:69) [70:79) [80:89) [90:100)
2010 Boland College CAP English Distribution of CAP test results
The CAP average frequency distribution displays a normal distribution with the
larger percentage of students achieving a percentage between 30% and 50%.
The analysis of the total averages for the different subtests reveals the following:
Figure 16: Distribution of CAP English Test
Results from students with zero values were excluded from the database in the
calculation of the averages as the reason for the zero value is unknown.
When the CAP English test average 49.21% is compared with the English final
year-end results average of 59.76% one could conclude that students’ competence
increased after they attended college instructional classes for a year, although some
differences should be expected since they are different tests.
The poor level of Mathematics in South Africa is well known. Following the
discussion of the comparison between the CAP Mathematics Test and the final year-end
results, the context of the national situation must be borne in mind. However, although the
Table 9: Total Averages for the Different Subtest Results
Figure 14: Total Averages of Different Subtests.
Campus n= CAP English n= Final English n= CAP
Maths n=
Final Maths
Lit
Total/Averages 702 49.21 325 59.76 699 29.04 491 44.19

INVESTIGATING THE PREDICTIVE VALIDITY OF CAP TEST
Page 73
0 50
100 150 200 250 300 350 400 450
[00:9) [10:19) [20:29) [30:39) [40:49) [50:59) [60:69) [70:79)
2010 Boland College CAP Maths Distribution of the CAP test results
Figure 17: Distribution of the CAP Test Results
TIMSS studies (Howie, 2000; HRSC, 2003) and other research (Bohlmann, 2005; De
Beer, 2010, and Wagner-Welsh, 2008) confirm the poor state of Mathematics in South
Africa, it is still important to ask whether the skewness in the CAP results could suggest
that the standard of the CAP Mathematics Test is too high for the grade 9 learners, if a
function of the test would be to predict their success in the year-end results, as it is based
on the outcomes of the grade 9 curriculum. Still, considering the coefficients of
determination discussed above, there can be no confidence that the CAP Mathematics
test has any predictive validity.
A few reasons could be suggested for these differences:
The CAP test, being written in the beginning of the year, measures the
knowledge of the students after / during their holiday time, whereas the final year-
end results reflect the results after exposure to classes for 10 months prior to the
examination.
Students matured during the year.
The final year-end results reflect the formative and summative assessment
marks, while the CAP reflects the students’ knowledge at one specific moment.

INVESTIGATING THE PREDICTIVE VALIDITY OF CAP TEST
Page 74
Students studied for the final year-end results whereas they didn’t study for
the CAP test.
Testing conditions differ: Students know what to expect in and from the final
year-end examination. Students completed the CAP tests on computers. Some
of them might have been extremely unfamiliar with computers and although care
was taken to assist them in completing the test, the effect of using computers for
the first time might have had a negative impact. It is also possible that excitement
and interest in the technology might have affected results.
Tests are different. The CAP test is a standardised test used prior to
registration in order to determine the level of a student’s skills in Mathematics and
English, while the year-end examinations are set by officials of the department of
education, and marked externally at examination centres all over the country.
USE OF THE CAP TEST AS A PREDICTIVE TOOL TO GUIDE AND PLACE NC(V) LEVEL 2 STUDENTS
The internet version (version 2.0, 2007, p.1) of the CAP manual states the following:
A prerequisite of the National Certificate (Vocational) (NC(V)) Level 2 is that prospective
students must have passed Grade 9 or achieved an equivalent qualification of NQF Level
one. The purpose of this test will be to determine if the prospective FET College student
has the basic fundamental knowledge of the English language and numeracy skills to cope
with the learning material of NC(V) level 2. This section of the test is not dependent on
his/her desired vocational field. The Placement Test will assist the prospective student to
choose a vocational field aligned to his/her interest and guide the College to place the
student in an appropriate field. The purpose of the test is not to exclude students from the
FET sector, but rather to assist the College in placing prospective students that have the
fundamental skills in appropriate vocational fields. Thus, the focus is to identify the level of
additional academic support some students may require. This test is not a psychometric
test. (CAP, 2007)

INVESTIGATING THE PREDICTIVE VALIDITY OF CAP TEST
Page 75
According to the manual, one of the two uses of the test is to determine the
previously acquired knowledge and career interests of the student and to provide this
information for decision making. The CAP test measures acquired knowledge of grade 9
English and Mathematics syllabuses and identify the outcomes not yet mastered. They
are not psychometric tools to indicate English or Mathematical aptitude, or measure
interest as psychological constructs. It is also not a “placement intervention” as referred to
by Adams (2011, p.16) that will ensure academic success. Certainly the issue of
academic success is much more complex and dependent on the culmination of many
different influential factors, and not the single results of one pre-placement assessment.
In evaluating the CAP instrument, an evaluator should take care to ensure that s/he has a
thorough understanding of the complexity of placement testing and other factors such as
the time frame after the implementation of the NC(V) programme, as well as the specific
logistical problems with implementation on college level. One of the key principles in
psychometrics is that instruments should be used for the purpose that they were designed
for, and it is unethical to use a test for another purpose (Smit, 1991; Murphy &
Davidshofer, 2001). The purpose of the CAP test is simply to provide more information
that might be helpful in supporting a student prior to registration, as well as identifying
those specific areas in the grade 9 curriculum which they have not yet completely
mastered. This information enables the college to support students for example with.
College managements can make decisions and implement supportive and specific
remedial interventions based on this information.
In this study different types of correlations were calculated between the CAP test
and the final year-end results, with the aim of investigating the predictive value of the CAP
test. Although some of the coefficients point towards moderate correlations, the
coefficients of determination were never high enough to indicate that the CAP test can be
used to predict year-end results. These findings echo those of a number of researchers
(Lee & Greene, 2007) who studied correlations between placement instruments and
academic success rate. Kim and Suen (2003, p. 561) found that although there is “a
relatively small coefficient…early assessment measures are not predictive”. Gere, Aull,

INVESTIGATING THE PREDICTIVE VALIDITY OF CAP TEST
Page 76
Green and Porter (2010) found in their research that the Directed Self-Placement
instrument at their university does not have a strong predictive validity. Armstrong (2002),
in Mattern and Packman (2009), studied the correlation between the ACCUPLACER test
prior to registration and the success rate of students at colleges in the USA. Initial studies
generally found that there is a weak relationship when the predictive validity coefficients of
placement test scores and final academic results are compared. “For English courses, the
observed correlation was approximately 0.25 for full-time and part-time instructors, and the
correlations for Mathematics were 0.14 for full-time and 0.19 for part-time instructors”
(Armstrong, 2002, p. 1). Hughes and Scott-Clayton (2011), in Jaggars and Hodara
(2011), confirm that standardised placement tests only weakly predict students’ future
academic achievement.
Based on the correlations done, the overall finding in this research similarly finds
that the correlations between the CAP test and the year-end results, although stronger
than those of Armstrong (2002), tend to be weak. However, it is interesting to note is that,
similar to the findings of Armstrong, this research found that the English correlations are
much stronger than the Mathematics correlations.
SUMMARY
As placement testing is a very complex matter and many other variables play a role
in the eventual successful academic achievement, it is imperative to use an instrument for
the purpose that it was developed. In this chapter, correlations were calculated between
the CAP test and the final year-end results, for different gender, language and culture
groups within the sample, with the aim of investigating the predictive value of the CAP test
for each of these subgroups.. Although some of the coefficients point to moderate
correlations, the coefficients of determination were never high enough to indicate that the
CAP test can be used to predict year-end results. The CAP test was primarily developed
as an instrument to identify skills or knowledge gaps in the mastering of the grade 9
curricula, and should therefore be used for this purpose. Inferences drawn from these
research results will be discussed in the next chapter.

INVESTIGATING THE PREDICTIVE VALIDITY OF CAP TEST
Page 77
CHAPTER 5
INFERENCES AND SUGGESTIONS
This research is a correlation study and the purpose thereof is to determine if there
is any predictive value in the CAP test in relation to the final year-end marks of NC(V) level
2 students. Walsh and Betz (2001), explain that predictive validity exists where data that is
available or can be easily acquired (for example test scores), can be used to predict some
future outcome, with confidence. In the understanding of the predictive value of an
instrument it must be noted that a true value, or stable characteristic over time, cannot be
a fixed constant, and should rather be interpreted in terms of a trend.
PROGRESSIVE INTERPRETATION OF VALIDITY INDICATOR.
As noted in earlier chapters, Messick (1995) explained that validity can be
interpreted by means of a progressive matrix.
The first step or phase: The test is interpreted based on the basic evidence.
Construct Validity (CV) refers to the extent to which what a test measures matches
people’s idea of what it should measure. This study investigates the validity of the CAP
tool as a predictive test. In that case, the extent of its construct validity is the extent to
which it matches what people expect of a predictive test. General expectation of a
predictive instrument is that if a student achieves well in the placement test, the student
would also do well in the year-end assessments, and poor achievement in the placement
test, would indicate a high risk student who will struggle with the academic curriculum.
Evidence of validity is gained by the Pearson correlation and (r2 )
The second step or phase: If there is some evidence of construct validity, it is
interpreted in relation to the relevance or the utility thereof. In the case of this study on the
CAP test, the different r and (r2) indicate that the test cannot be used as a prediction
instrument.

INVESTIGATING THE PREDICTIVE VALIDITY OF CAP TEST
Page 78
The third step or phase: The content validity is now interpreted in relation to the
value implications thereof. For this study, the value of (r ) and ( r2) lies in the knowledge
that CAP cannot predict success in college examinations, and hence it would be unethical
if the test results were applied as such. Furthermore, it indicates that there are
differences in the extent of correlation between the language groups, and care should be
exercised in the interpretation of an individual’s results.
The final step or phase in the interpretation of validity: This takes place when
the Content Validity is interpreted in relation to the utility or relevance thereof, as well as
the value implications and the social consequences thereof. The social consequences of
the validity coefficient are relevant when the CAP test is used prior to registration at
college. When using CAP results, focus should not be on whether the student will pass
NCV Level 2 because there is no significant correlation. Focus should rather be on
identifying the skills gaps and deciding how best the institution can assist the student.
Further research is imperative to determine whether grade 9 is indeed sufficient
background for NCV Level 2, or if there are deficiencies and/or omissions in the grade 9
curriculum.
INFERENCES FROM THE PATTERN OF CORRELATION BETWEEN THESE RESULTS.
Mkele’s first assumption states that all jobs or tasks need a specific level of skills
or knowledge. To study English and Mathematics on NCV level 2, it is assumed that a
student needs the necessary foundational skills and knowledge. The Department of
Education identified this level of knowledge as that acquired during the first 9 years at
school, hence the entry criteria of grade 9. Unfortunately, Grade 9 examinations are set
and marked at schools and therefore the standard is inconsistent and subjective. The use
of a single instrument aligned to the grade 9 curriculum content would be useful as a
standardized measure. The CAP test is such a measure.

INVESTIGATING THE PREDICTIVE VALIDITY OF CAP TEST
Page 79
Mkele’s second assumption is that all individuals possess relatively stable
attributes, at least over a short period of time. In this case these attributes would be the
extent of students’ mastery of grade 9 Mathematics and English outcomes.
Mkele’s third assumption is that these attributes can be measured. The rationale
is that the CAP test should be used as a valid and reliable measurement tool to measure
the extent of a person’s abilities/ skills/ knowledge relating to the grade 9 Mathematics and
English outcomes. However, Jaggers and Hodara’s (2011) opposing forces framework
adds a qualitative dimension to the measurement of attributes. The tension between
efficiency of placement testing versus the effectiveness thereof can severely influence the
correlation, and hence the measurement of validity. The validity of the CAP computer-
based test needs investigation because one cannot be sure whether students who have
no computer skills, would have achieved the same results when responding to the CAP
paper-based testing.
Mkele’s fourth assumption is that inferences can be made based on the
measurements. Here the inferences relate directly to the extent to which mastery of grade
9 Mathematics and English outcomes (as shown by scores on the CAP test) predict year-
end examination scores. In this study the statistical analysis indicated that the CAP test
cannot be used as a valid instrument to predict future outcomes in the form of year-end
NC(V) level 2 examination results. This finding echoes results of other research in
different disciplines which indicated that placement testing has a low correlation with
academic achievement. It seems that the “secret ingredient”, or that specific “it” that
ensures successful academic achievement in the first year, has not yet been discovered
by developers of predictive tests.
The CAP test is designed to measure students’ knowledge and skills pertaining to
the grade 9 curriculum, and is therefore strictly based on the outcomes of the grade 9
curriculum. A student who does well on the CAP test but poorly in the final year-end
examination could have mastered all she should in grade 9, but yet be the victim of any of
the many factors that cause attrition, as indicated by Papier (2009) and Maharaj (2008).

INVESTIGATING THE PREDICTIVE VALIDITY OF CAP TEST
Page 80
On the other hand, a student who does poorly in the CAP test (implying poor grade 9
knowledge) but who passes well at college could have benefitted from excellent lecturers
and possibly could have made up for not having mastered what she should have in grade
9, by working very hard.
Hence, it can be concluded that if grade 9 was needed for successful learning and
passing of the level 2 curriculum, the extremely poor coefficient of determination could
actually indicate that the grade 9 prerequisite-knowledge of the students do not suffice as
a foundation. Therefore the articulation of grade 9 with learning at level 2 is questioned.
To conclude the discussion of the research questions, “What is the correlation
between the student’s CAP results and the final year end results?” and “To what extent
can the Competency and Placement Test be used as a predictive tool to guide and place
National Qualification Framework level 2 students of FET Colleges” the following
statement can be made: The correlations between the CAP English and the English year-
end results indicate that there is a statistically significant correlation between the CAP test
and the English year-end results but the coefficient of determination indicates that this
correlation is not strong enough for the CAP test to be used as a predictive test.
Sample sizes in this study (see Figure 19 above) are large enough to allow
generalisation of the results within the context of Boland college students. Values of ( r )
for correlations between the CAP Mathematics and year-end Mathematical Literacy results
indicate that there is a statistically significant but only moderately positive correlation
between the CAP scores and the final year-end results of the Afrikaans and English
speaking students for both Mathematics and English. In contrast, there is no correlation
between the CAP Mathematics scores and year-end Mathematical Literacy results of
isiXhosa and Sesotho speaking students. While the relatively low correlations between
CAP scores and year-end examination results spell a lack of predictive validity for the CAP
tests, this does not imply that the test has no value as a placement instrument since it has
a diagnostic value in identifying grade 9 outcomes not yet mastered. The CAP test is
constructed on these outcomes and can be compared to a year-end examination of the

INVESTIGATING THE PREDICTIVE VALIDITY OF CAP TEST
Page 81
grade 9 curriculum. It is not an indication of an innate ability to work with numbers or
English, but rather an indication of the level of the acquired knowledge and skills relating
to this specific curriculum.
The last assumption is that these inferences can be used to improve the
academic or training opportunity. Here the findings clearly indicate that the CAP test
cannot predict students’ future success in year-end NCV level 2 examinations, but show
particular patterns of higher and lower levels of correlation. These patterns, specifically the
differences between the language groups, point towards issues that need further
clarification for possible future improvements in the academic training in question.
LIMITATIONS OF THIS RESEARCH.
This research has a number of limitations.
Personal involvement of the researcher:
First, the researcher was one of the developers of the CAP test which could imply
bias. Simultaneously, however, it could indicate a strength since there is first- hand
knowledge and understanding of the purpose of the CAP test and the developmental
processes. Attempts to limit bias were made by approaching this study as a structured
empirical research project as part of the M Ed degree, and thus subject to scrutiny, and
also requiring a thorough literature review which enhanced objectivity. Furthermore, the
researcher ceased being part of the CAP Company in 2010 and this has given her some
distance from the project.
Sampling.
The sample, albeit statistically large enough for valid application of findings to Boland
College, could have been more representative of the national student population if
students from different colleges in different provinces were included. A more
representative national sample would provide answers to these research questions for
FET students in other contexts in South Africa.

INVESTIGATING THE PREDICTIVE VALIDITY OF CAP TEST
Page 82
Testing procedure.
Although the computerised format is more standardised than the pen and paper test,
research should be done to determine if students would obtain the same marks on both
formats. Being unfamiliar with the equipment is bound to have an effect. For future
development of the CAP test, it could be useful to include a short computer skills program
such as a game, before starting with the actual test. This “ice-breaker exercise” would
serve as a short induction to the basic computer skills that they might need.
The test.
The CAP test is based on the Grade 9 syllabus and hence is not geared for students
who have done ABET level 4 or NQF Level 1, nor for students with a grade 12
qualification. Students with these accepted entry qualifications have not been taken into
account in the development of the tests. A shortcoming of the instrument is thus that it
caters for only a specific portion of the target population and can therefore not be an
effective assessment method for all possible Level 2 candidates.
SUGGESTIONS FOR RESEARCH
A number of related research topics can be identified.
The identified differences between the language and population groups point
towards issues that need further clarification for possible future improvements in the
academic training in question.
Research into the factors of academic non- completion or failure. It is
imperative to investigate the reasons why none of the Electrical Engineering students
passed Mathematical Literacy at the end of the year. One of the questions that come to
mind is whether they had sufficient prior knowledge to cope with the academic content of
the programme. Another question that arises is whether they were aware that the

INVESTIGATING THE PREDICTIVE VALIDITY OF CAP TEST
Page 83
programme is highly theoretical, or whether they expected to learn only practical electrical
engineering skills. Another factor to investigate is the role of lecturing staff.
As the CAP test identifies gaps in the prospective student’s background
knowledge relating to the grade 9 curriculum, it is necessary to investigate best ways to
address these gaps. The nature of a bridging programme could be investigated. For
example, would a bridging programme that links to the identified gaps be sufficient to
address the poor Mathematical skills of the student, or should the bridging programme
rather address more general foundational concepts?
The CAP interest questionnaire has not been investigated within the
parameters of this study. Research on the degree of satisfaction with a career field
chosen on the basis of indications from the CAP interest questionnaire after involvement
for a few months or a year, might reveal interesting information relating to the validity of
the questionnaire.
The value that a diagnostic test such as the CAP placement test has is that it
could be used to assess RPL (recognition of prior learning) in terms of placement in a
Mathematics or remedial Mathematics programme. This deserves further investigation.
The CAP test is a multiple choice questionnaire. The possibility that its
predictive validity in relation to academic success would be enhanced if the English test
included a writing component, could be investigated.
Career guidance in the FET sector and the validity of an interest
questionnaire. Researchers need to investigate a prospective student’s concept of the
world of work, and the effect of unemployment in South Africa.
INVESTIGATING THE PREDICTIVE VALIDITY OF CAP TEST
Page 84
SUMMARY
This study investigated the correlation between the English and Mathematical
subtests of the CAP test and the English and Mathematical Literacy final year-end
examination results of NC(V) level 2 students at Boland College with the purpose of
determining whether the CAP test could predict future achievement. Findings from this
research indicated that the CAP English test has a statistically significant but only
moderate correlation with the English final year-end results for all population groups, but
the low coefficients of determination indicate that the CAP English test scores cannot be
used to predict year end scores. It was also found that the CAP Mathematics test has no
statistically significant correlation with the Mathematical Literacy final year end results for
the Xhosa and Sotho speaking groups, and that therefore the CAP Mathematics scores
can also not be used to predict year-end scores for Mathematical Literacy.

INVESTIGATING THE PREDICTIVE VALIDITY OF CAP TEST
Page 85
REFERENCES
Adams, G. (2011). An Impact Study of the Competency and Placement (CAP) Test
Intervention at Further Education And Training (FET) Colleges. Published MTech
thesis, University of South Africa: Pretoria.
Armstrong, W .B. (2000). The Association Among Student Success In Courses,
Placement Test Scores, Student Background Data, And Instructor Grading
Practices. Community College Journal of Research and Practice, 24(8), 681-695.
Blunt, S.V. (2000). The interpretation of ABET placement tests in the recognition of prior
learning. Published Master’s thesis, Rhodes University: Grahamstown.
Bohlmann, C.A. (2005). An Investigation into ways of improving the effectiveness of
Access-Level Mathematics courses at the University of South Africa. Published
doctoral thesis, University of South Africa: Pretoria.
CAP Test Manual, (2007). Retrieved from http://www.captesting.com/downloads/CAP%20
User%20Manual%20(TO%20PRINT).pdf
Cloete, N., Sheppard, C., Nel, H., Stumpf, R., Papier, J., Needham, S., Leibrandt, M.
(June 2009). Responding to the Educational Needs of Post-school Youth:
Determining the Scope of the Problem and Developing a Capacity-Building Model.
First Draft Synthesis Report. Centre For Higher Education Transformation and The
Further Education And Training Institute.
Cosser, M., Kraak, A. & Winnaar, L. (2011). Further Education and Training Colleges in
South Africa at a glance in 2010. HSRC Press. Retrieved from www.hsrc.ac.za/
document-4382.
De Beer, M. (2010) Using a positive psychological approach to improve attitudes towards
and proficiency in Mathematics amongst High School Learners. Poster presented
at 15th SA Psychological Conference, August 12-14, 2010, Cape Town.
Department of Education (2006). Statistics retrieved from http://www.education.gov.za/
emis/emisweb/07stats/Education%20Statistics%20in%20South%20Africa%202007.
Department of Education. (2007). Annual Report 2006/2007. Pretoria.
INVESTIGATING THE PREDICTIVE VALIDITY OF CAP TEST
Page 86
Department of Education. (2008a). Education for All (EFA) Country Report: South Africa.
Pretoria.
Department of Education. (2008b). Student Support Services Framework. Pretoria.
Department of Education. (2009a). Further Education and Training Colleges, National
Certificate (Vocational) and Report 190/191, Report on the Conduct of National
Examinations. Pretoria: Department of Higher Education and Training.
Department of Education. (2009b). Student Support Services Manual. Pretoria.
Department of Higher Education and Training. (2011a). Further Education and Training
College Programmes on Levels 2 to 4 on the National Qualifications Framework.
Pretoria.
Department of Higher Education and Training (2011b). Presentation to the Portfolio
Committee on Higher Education and Training. Public FET Colleges, 25 January
2011. Retrieved from http://www.pmg.org.za/node/24878
Department of Labour (2003) State of Skills in South Africa. Pretoria, Department of
Labour. Pretoria.
ELSA, 2010. Information retrieved from http://www.elsanet.org/site/what-is-elsa
FIN24.com. (June 06, 2007) Skills shortage real – survey. 14(8). Retrieved from
www.fin24.com/articles.
Gere, A.R., Aull, L., Green, T & Porter, A.(2010). Assessing the validity of directed self-
placement at a large university. Assessing Writing, 15(3), 154-176.
Ghiselli, E.E., Campbell, J.P., & Zedeck, S. (1981). Measurement Theory for the
Behavioural Sciences. San Francisco: W.H. Freeman and Company.
Gonzales, P., Guzmán, J. C., Partelow, L., Pahlke, E., Jocelyn, L., Kastberg, D., &
Williams, T. (2004). Highlights from the Trends in International Mathematics and
Science Study (TIMSS) 2003 (NCES 2005–005). U.S. Department of Education,
National Center for Education Statistics. Washington, DC: U.S. Government
Printing Office. Retrieved from http://nces.ed.gov.
Gower, P. (2009, July 31). Idle minds, social time bomb. Mail & Guardian Online.
Retrieved from http://www.mg.co.za/article/2009-07-31-idle-minds-social-time-
bomb. Grant, M. & Hallman, K. (2006). Pregnancy-related School Dropout and Prior
INVESTIGATING THE PREDICTIVE VALIDITY OF CAP TEST
Page 87
School Performance in South Africa. (Population Council Policy Research Division
Working Paper no. 212). New York, Population Council. Higher Education South Africa. Information on the National Benchmark Test. Retrieved
from http://www.nbt.ac.za
Howie, S.J. (2000) Third International Mathematics and Science Study-Repeat (TIMSS-R):
What has changed in South African pupils’ performance in Mathematics between
1995-1998. Retrieved from http://academic.sun.ac.za/mathed/ames a/TIMSSR.htm
HPCSA, 2007. Form 207: List of tests classified as being psychological tests. Retrieved
from www.hpcsa.co.za
HPCSA, 2010. Form 208: Policy on the classification of psychometric measuring devices,
instruments, methods and techniques. Retrieved from www.hpcsa.co.za
HSRC, 2003. Fact Sheet 3: Comparing South African performance TIMSS 1999 to TIMSS
2003. Retrieved from http://www.hsrc.ac.za /ResearchProgramme-Page-62.phtml
Jacobs, M. (2010). A Framework for the placement of university students in science
programmes. Published doctoral thesis, University of Johannesburg.
Jaggars, S. & Hodara, M. (2011). The Opposing Forces that Shape Developmental
Education: Assessment, Placement, and Progression at CUNY Community
Colleges. (CCRC Working Paper no. 36) Retrieved from
http://ccrc.tc.columbia.edu/publications/opposing-forces-developmental-
education.html
Johnson, R.B & Onwuegbuzie, A.J. (2004). Mixed Methods Research: A Research
Paradigm Whose Time Has Come. Educational Researcher, Oct, 33(7),14-26.
American Educational Research Association.
Kane, M.T. (2001). Current Concerns in Validity Theory. Journal of Educational
Measurement, 38(4), 319-342. Retrieved from http://www.jstor.org/stable/1435453
Kim, J. & Suen, H.K. (2003). Predicting children’s academic achievement from early
assessment scores: a validity generalization study. Early Childhood Research
Quarterly 18, 547-566.

INVESTIGATING THE PREDICTIVE VALIDITY OF CAP TEST
Page 88
Koch, E., Foxcroft, C. & Watson, A. (2001). A developmental focus to student access at
the University of Port Elizabeth : Process and preliminary insights in placement
assessment. [Abstract]. South African Journal of Higher Education, 15(2), 126-131.
Kush, K. & Cochran, L. Enhancing a sense of agency through career planning.
Journal of Counseling Psychology, October 1993, 40(4), 434-439.
Lee, Y.-J. & Greene, J. (2007) The Predictive Validity of an ESL Placement Test: A Mixed
Methods Approach. Journal of Mixed Methods Research, 1(4),366-389.
MacGregor, K. (2009, December 20). Scoping the need for post-school education.
University World News AFRICA, 106. Retrieved from http://www.university
worldnews.com
MacGregor, K. (2009, August 16). South Africa: Shocking results from university tests.
University World News AFRICA, 35. Retrieved from http://www.university
worldnews.com
Maharaj, R. (2008) An investigation into the retention and dropout of mechanical
engineering students at a FET College. Published Master’s thesis, University of
KwaZulu Natal.
Mattern, K.D. & Packman, S. (2009) Predictive Validity of ACCUPLACER® Scores for
Course Placement: A Meta-analysis. The College Board, New York. Retrieved on
from http://professionals.collegeboard.com/profdownload/pdf/09765_PredValidity_
WEB_091124.pdf
McQueen R.A. & Knussen, C. (2006). Introduction to Research methods and Statistics in
Psychology. Essex: Pearson Education.
Messick, S. (1995,). Validity of Psychological Assessment. American Psychologist,
September, 741-749.
Mkele, N. (1953) The Validation of Test Procedures for the selection of African
Mechanical-Operatives on the Witwatersrand Gold mines. (Published Masters
thesis) University of South Africa, Pretoria
Mindmuzik (2011) Information retrieved from www.mindmuzik.com
Murphy, K.R. & Davidshofer, C.O. (2001). Psychological testing: Principals and
Applications. (5th Ed.). Upper Saddle River: Prentice-Hall.

INVESTIGATING THE PREDICTIVE VALIDITY OF CAP TEST
Page 89
Naglieri, J.A., Drasgow, F., Schmit, M., Handler, L., Prifitera, A., Margolis, A., and
Velasquez, R. (2004) Psychological Testing on the Internet: New Problems, Old
Issues. American Psychologist, 59(3), 150-162.
National Benchmark Test, (2011) Retrieved from http://nbt.ac.za
Niglas, K. (1999, September 22-25). Quantitative and Qualitative Inquiry in Educational
Research: Is There A Paradigmatic Difference Between Them? Paper presented
at the European Conference on Educational Research, Lahti, Finland. Retrieved
from http://www.leeds.ac.uk/educol/documents/00001487.htm
PACE Test (s.a.) Retrieved from http://www.pacecareers.com/ disclaimer.html
Papier, J. (2009). Getting the right learners into the right programmes: An investigation
into factors that contributed to the poor performance of FET College Learners in
NC(V) 2 and NC(V) 3 programmes in 2007 and 2008. FET Institute, University of
the Western Cape.
Placement test. (2006). International House Newcastle. Retrieved from
http://www.ihnewcastle.com
Popham, W.J. (2000). Educational Measurement. Allyn & Bacon, Needham MA.
Republic of South Africa. (1951). Bantu/Native Building Workers Act, Act No 27 of 1951.
Retrieved from http://www.sahistory.org.za/article/liberation-struggle-south-africa-44
Republic of South Africa. (1974) Health Professions Act, Act 56 of 1974. Pretoria:
Government Printers
Republic of South Africa. (1998) Employment Equity Act, No . 55 Of 1998. Department of
Labour. Pretoria: Government Printers
Republic of South Africa. (2006). Draft policy for the National Certificate (Vocational) : a
Qualification at level 2 on The national qualifications Framework (NQF).
Government Gazette 28677 of 29 March 2006
Republic of South Africa. (2006). Further Education and Training Act No. 16 of 2006.
Pretoria: Government Printers.
Sax, G., & Newton, J.W. (1997) Principles of Educational and Psychological measurement
and evaluation. Belmont: Wadsworth Publishing Company.

INVESTIGATING THE PREDICTIVE VALIDITY OF CAP TEST
Page 90
Sentence Skills Study Guide for the ACCUPLACER (CPT) Community College of Aurora.
Retrieved September 12, 2007 from http://www.ccaurora.edu/students/academic/
tutoringlab.shtml
Smit, G.J. (1991). Psigometrika. Pretoria: HAUM..
s.n. SA has world’s worst skills shortage. (2008, April 14.) Skills Portal.
Staff Reporter. (2007). Addressing Skills shortage. Daily Dispatch, March 2, p. 10.
University of Johannesburg Retrieved from http://www.wits.ac.za/prospective
/undergraduate/admissionrequirements
Van Rensburg, A. (2011). Complexity Management – A Crystal Ball For Executives.
ISEM Proceedings, September 21-23, Stellenbosch, South Africa.
Wagner-Welsh, S. (2008) The Identification of criteria to be utilised in Mathematical
Diagnostic Tests. (Published doctoral thesis) Nelson Mandela Metropolitan
University.
Walsh, W.B. & Betz, N.E. (2001). Tests and Assessments. Upper Saddle River: Prentice
Hall.
Wedekind, V. (2008) Report On The Research On Further Education And Training (FET)
Colleges In South Africa. University of KwaZulu-Natal, England-Africa Partnerships
In Higher Education. Retrieved from http://www.uwc.ac.za/usrfiles/users/
7727090728/FET_Research_Report.pdf
Winter, C. (1999). Women Workers in South Africa: Participation, Pay and Prejudice in the
Formal Labour Market. South Africa: Poverty and Inequality: informal discussion
paper series. World Bank.
World Health Organization. Retrieved from http://www.who.int/countries/zaf/en/
Zaaiman, H. (1998). Selecting students for Mathematics and Science: The Challenge
facing Higher Education in South Africa. Pretoria: HSRC Publishers.
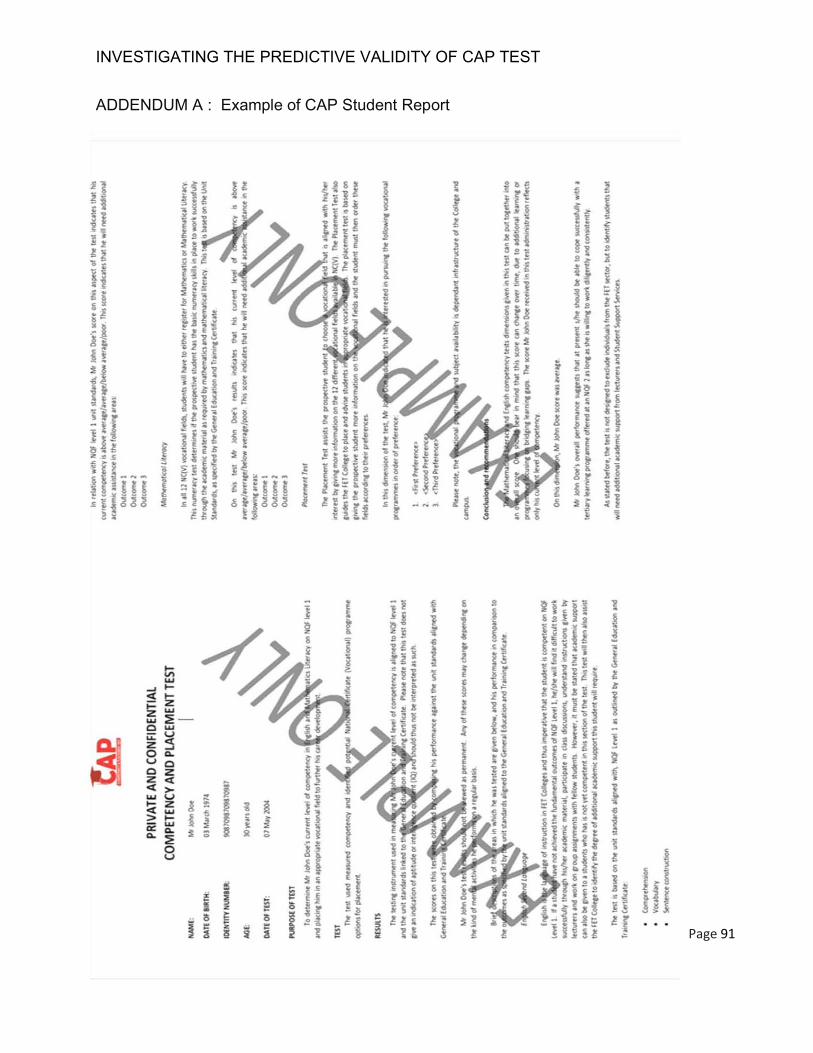
INVESTIGATING THE PREDICTIVE VALIDITY OF CAP TEST
Page 91
ADDENDUM A : Example of CAP Student Report
t; w
~ ..... « ..... -z ..... w 15::;: -Ow - U ~:5 ~<>. Uo Oz z« «> w U ..... z «w > ..... - w ""<>. <>.::;:
o U
"j 11 h ji if ~ .
" E ~ = ~ I ! i r § ~ t
-, f f Ii • t ~ i , • .- . I j~1 i .. s: ~
1!"'2 I ~, . • l lit ~ -.~ ~ .. ;,
t f I ~
! II l~ ~!
§ ~I
6 ~
~Hlj f I Ii - -.v
!~ p p ~ f d • ~ :q ~ q .. ~
I ] ~ II~ ·f ld B:§
~ r . .. "

INVESTIGATING THE PREDICTIVE VALIDITY OF CAP TEST
Page 92
ADDENDUM B: Example of a Lecturers Report
~ 0
~ ~
:3 ~ a ~
" ~
.. ~
in ~
d
'" w
'" '" t; w -'
-------------