the power of discovery - tnr gold corp power of discovery february 2018 becoming a green energy...
TRANSCRIPT

The Power of Discovery
February 2018
Becoming a Green Energy Metals Royalty Company

TSXV: TNR www.tnrgoldcorp.com

TSXV: TNR www.tnrgoldcorp.com

TSXV: TNR www.tnrgoldcorp.com
LEADERSHIP
Directors
Kirill Klip, MBA, Executive Chairman
Maurice Brooks B.Sc., FCA (ICAEW)
Greg Johnson B.Sc.
Ross Thompson
Management
Kirill Klip, MBA – President and CEO
Maurice Brooks – Special Adviser Strategic Risk Management and Interim CFO
Anthony Kovacs – Chief Operating Officer
Nancy LaCouvée – Corporate Secretary
Roberto Lara – Managing Director (South America)
Dr. Frederick Breaks, P.Geo – Technical Adviser
Natalia Lobanova – CEO EA, PR, Marketing

TSXV: TNR www.tnrgoldcorp.com
CORPORATE CULTURE
a growing energy metals royalty company with strong management ownership
“
Experienced Management TeamProject Portfolio
ManagementStrategic energy metals focus: lithium and copper
Gold and precious metal assets
Proven Business Model Identify and acquire projects at an early stage
Selectively advance projects
Use JV partnerships to mitigate costs and risk
Maximize value, minimize success time
2/3 ownership by insiders and management

TSXV: TNR www.tnrgoldcorp.com
GLOBAL ASSETS
CURRENT HOLDINGS
Los Azules, Argentina
• World Class Cu-Au deposit
• 0.36% NSR Royalty
• 100% owned by McEwen Mining
Shotgun Gold, Alaska
• Porphyry gold deposit
• Multi-million oz potential
• Well defined mineralization model
International Lithium Corp. (“ILC”)
• TNR spin out in 2011
• TNR holds 14.1% equity interest in ILCafter convertible debenture and warrants are exercised
• TNR holds 1.8% NSR Royalty in ILC’s Mariana Lithium Project
• Strategic partners advancing four lithium projects
LondonVancouver
San Juan
Shotgun
Los Azules
Office
Project
ILC Lithium ProjectsMariana
Mavis / FairserviceRaleighForgan
Avalonia

ASSETS ►Argentina
TSXV: TNR www.tnrgoldcorp.com
Fin
anci
al T
imes
“People are more confident in the future, the economy, in making investments. They are tired of corruption and populism,” Cecilia de Francesca. REUTERS

ASSETS► Los Azules
Argentina is one of the largest economies in Latin America.
Argentina is currently undergoing an economic transformation and integration into the global economy.
Presidential elections at the end of 2015 led to a significant change in Argentine economic policy.
The results of the mid-term elections in October 2017 prove that the new administration is gaining more support for its economic policies in Argentina.
TSXV: TNR www.tnrgoldcorp.com
US $3.3 BAllocated by the World Bank for the execution of the Country Partnership Strategy with Argentina
McEwen Mining
World Bank
100% owned byMcEwen Mining Inc.
TNR holds a 0.36% NSR royalty
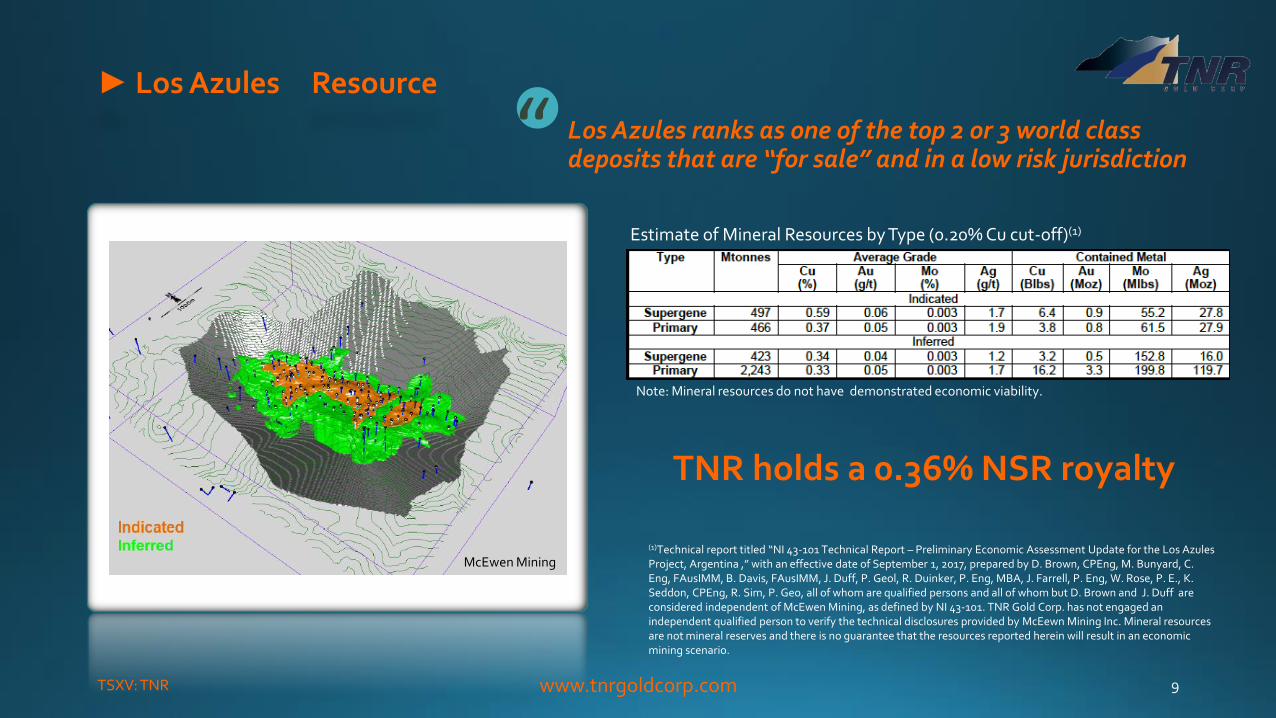
Los Azules ranks as one of the top 2 or 3 world class deposits that are “for sale” and in a low risk jurisdiction
TNR holds a 0.36% NSR royalty
“
Note: Mineral resources do not have demonstrated economic viability.
Estimate of Mineral Resources by Type (0.20% Cu cut-off)(1)
(1)Technical report titled “NI 43-101 Technical Report – Preliminary Economic Assessment Update for the Los AzulesProject, Argentina ,” with an effective date of September 1, 2017, prepared by D. Brown, CPEng, M. Bunyard, C. Eng, FAusIMM, B. Davis, FAusIMM, J. Duff, P. Geol, R. Duinker, P. Eng, MBA, J. Farrell, P. Eng, W. Rose, P. E., K. Seddon, CPEng, R. Sim, P. Geo, all of whom are qualified persons and all of whom but D. Brown and J. Duff are considered independent of McEwen Mining, as defined by NI 43-101. TNR Gold Corp. has not engaged an independent qualified person to verify the technical disclosures provided by McEewn Mining Inc. Mineral resources are not mineral reserves and there is no guarantee that the resources reported herein will result in an economic mining scenario.
McEwen Mining
TSXV: TNR www.tnrgoldcorp.com
► Los Azules Resource

Total contained copper is 4.6Mt (Indicated) and 8.8Mt (Inferred)2
Total contained gold is 1.7Moz (Indicated) and 3.8Moz (Inferred)
Total contained silver is 56Moz (Indicated) and 136Moz (Inferred)
TSXV: TNR www.tnrgoldcorp.com
► Los Azules Resource
McEwen Mining
Longitudinal Section Through the Los Azules Deposit (looking west – southwest)
The copper resource contains 10.2 billion pounds Indicated and 19.3 billion pounds Inferred2“
(2)Please refer to technical disclosure statement (1) regarding the resource estimate.

TSXV: TNR www.tnrgoldcorp.com
► Los Azules Preliminary Economic Assessment
2017 PEA Highlights(1,3)
Base Case ($3.00/lb copper, $1,300/oz gold, $17/oz silver)
• $2.2 billion After-Tax NPV (8% discount rate) and 20.1% After-Tax IRR
• 3.6 year payback and a 36 years Life of Mine (LOM);
• 415 million lb average annual copper production for the first 10 years.
• $1.11/lb average cash copper production costs (C1*) for the first 10 years, $1.28/lb average C1 costs over LOM.
McEwen Mining
(3) The PEA reported and documented by McEwen Mining is preliminary in nature, it includes inferred mineral resources that are considered too geologically speculative to have the economic considerations applied to them that would enable them to be categorized as mineral reserves, and there is no certainty that the preliminary economic assessment will be realized. Mineral resources, including those categorized as “measured and indicated” as well as “inferred” are not mineral reserves and the economic viability of these mineral resources have not been demonstrated by this economic analysis.
McEwen Mining's press releases and website material appear to be prepared by Qualified Persons and the procedures, methodology and key assumptions disclosed by McEwen Mining are those adopted and consistently applied in the mining industry, but no Qualified Person engaged by TNR has done sufficient work to analyze, interpret, classify or verify McEwen Mining's information, nor to determine the current mineral reserve or resource or any other information referred to in their press releases. Accordingly, the reader is cautioned in placing any reliance on these disclosures.

TSXV: TNR www.tnrgoldcorp.com 12
► Los Azules PEA: Commodity Price Assumptions
$3.00/lb copper
$1,300/oz gold
$17/oz silver
Undiscounted net smelter return, over the life of the mining project
$35.2 billion
Undiscounted Cash Flow Waterfall Diagram for the Life of Project(4)
McEwen Mining
(4)Please refer to technical disclosure statements (1 and 3) regarding the PEA.

TSXV: TNR www.tnrgoldcorp.com 13
► Los Azules Potential Value of TNR’s NSR Royalty
(4)Please refer to technical disclosure statements (1 and 3) regarding the PEA.
Discounted Cash Flow Waterfall Diagram for the Life of Project(4)
McEwen Mining
TNR holds a 0.36% NSR royalty on the entire Los Azules project
PEA estimates undiscounted cash flow for the life of mine Net Smelter Return over $35B (4)
PEA estimates discounted cash flow (8%) for the life of mine with the Net Smelter Return over $10.5B (4)

► Los AzulesSummary
Argentina is open for business
Los Azules deposit is massive
100% owned by McEwen Mining
TNR has 0.36% NSR royalty
PEA shows favorable results
Project is moving forward
Increased Value for TNR!
TSXV: TNR www.tnrgoldcorp.com 14

ASSETS ►Alaska
TSXV: TNR www.tnrgoldcorp.com
Ala
skam
iner
s.o
rg
“Alaska is a state steeped in a tradition of exploration, mining, and production,” Alaska Miners Association.
Alaskaminers.org
Shotgun
Pebble
Donlin
Fort Knox
Pogo
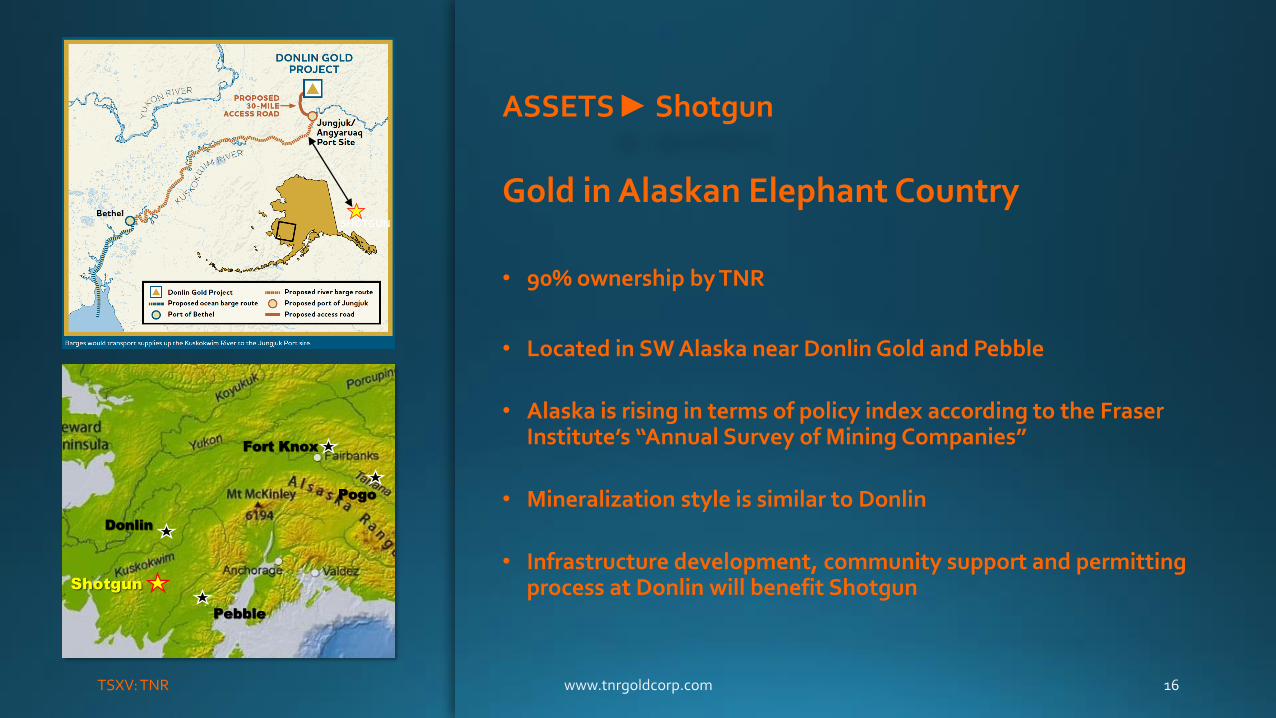
ASSETS► Shotgun
• 90% ownership by TNR
• Located in SW Alaska near Donlin Gold and Pebble
• Alaska is rising in terms of policy index according to the Fraser Institute’s “Annual Survey of Mining Companies”
• Mineralization style is similar to Donlin
• Infrastructure development, community support and permitting process at Donlin will benefit Shotgun
TSXV: TNR
SHOTGUN
Gold in Alaskan Elephant Country

TSXV: TNR www.tnrgoldcorp.com 17
► Shotgun Ridge – Mineralized Intervals
27.4m of 2.3 g/t Au
NE-Zone
Mid-Zone
SW-Zone22m of 2.86 g/t Au
18.4m of 2.03 g/t Au
Significant Drill Hole Intercepts(5)
12-56: 242m of 1.25g/t Au(over all three mineralized zones)
12-57: 209m of 1.02g/t Au(over all three mineralized zones)
12-58: 46.55m of 1.14 g/t Au(hole ended prior to intersecting
MID and NE-zones)
(5) All widths reported are drill core widths and are not converted into true widths. True widths of the drill hole intercepts, which may be shorter than those reported, are currently unknown.

TSXV: TNR www.tnrgoldcorp.com 18
► Shotgun Ridge – Room to Grow
OPENMineralization not included in resource estimate(6).
(6) See slides at the end of this presentation for a full description of the resource estimate.
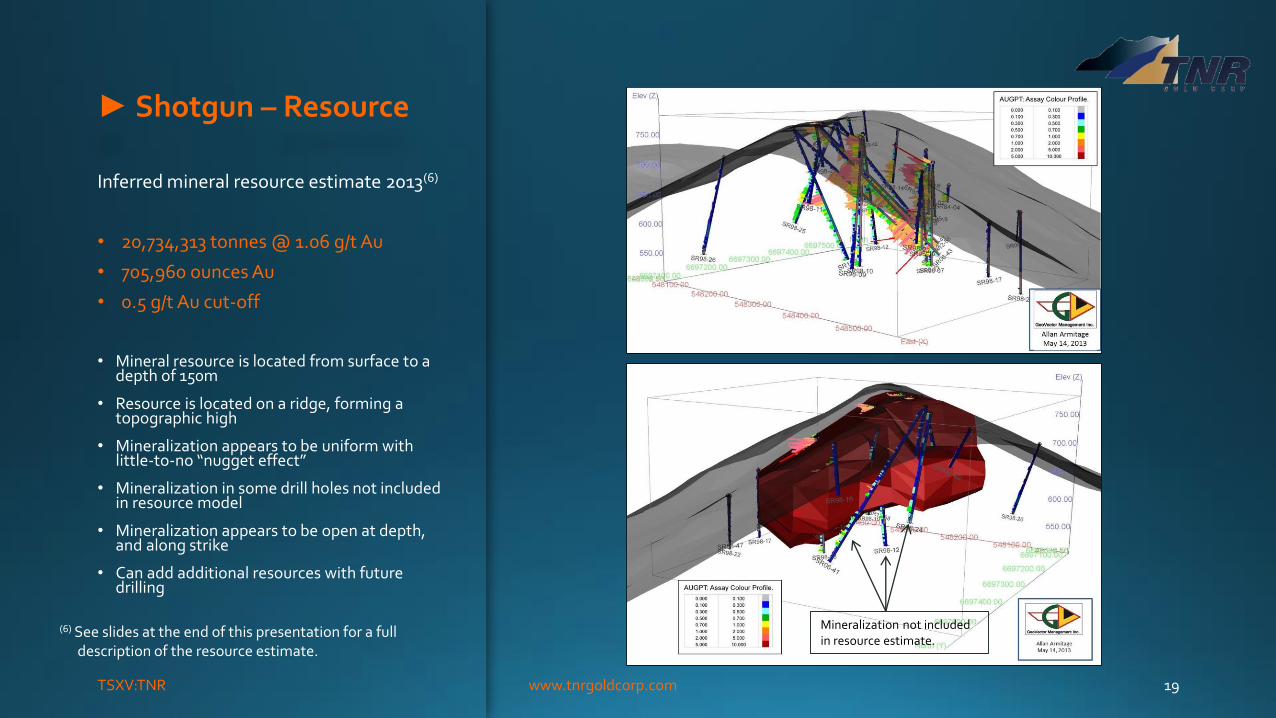
► Shotgun – Resource
Inferred mineral resource estimate 2013(6)
• 20,734,313 tonnes @ 1.06 g/t Au
• 705,960 ounces Au
• 0.5 g/t Au cut-off
• Mineral resource is located from surface to a depth of 150m
• Resource is located on a ridge, forming a topographic high
• Mineralization appears to be uniform with little-to-no “nugget effect”
• Mineralization in some drill holes not included in resource model
• Mineralization appears to be open at depth, and along strike
• Can add additional resources with future drilling
TSXV:TNR www.tnrgoldcorp.com 19
Mineralization not included in resource estimate.
(6) See slides at the end of this presentation for a full description of the resource estimate.

TSXV: TNR www.tnrgoldcorp.com 20
► Shotgun – Understanding Targets
TSX.V : TNR 200 m
Area of current resource
and drilling
Undrilled targets have potential to host multi-million oz deposits of gold
IP surveys and drilling only cover a small portion of intrusive complex

► Shotgun –Opportunity
Camp Scale Opportunity
TSXV: TNR www.tnrgoldcorp.com 21
25 k
m
ASSETS ►International Lithium Corp.
TSXV: TNR www.tnrgoldcorp.com
“Lithium will power humans for the next 50 years, then robots”

TSXV: TNR www.tnrgoldcorp.com
TNR Gold Holds 14.1% Equity Stake in ILC after convertible debenture and warrants are exercised
In 2010, TNR identified and acquired a global portfolio of lithium projects
TNR spun-out ILC for the development of these lithium resources internationally
International Lithium Corp. was listed on the TSX Venture Exchange on May 24, 2011
Avalonia - $10M work plan funded by strategicpartner
Mariana – Strategic partner fast-track to production
Mavis / Fairservice Raleigh – Strategic partner actively exploring
TNR holds 1.8% NSR Royalty on the Mariana Lithium Project
LondonVancouver
San Juan
Office
ILC Lithium ProjectsMariana
Mavis / FairserviceRaleighForgan
Avalonia
► International Lithium TSXV: ILC
TSXV: TNR www.tnrgoldcorp.com 24
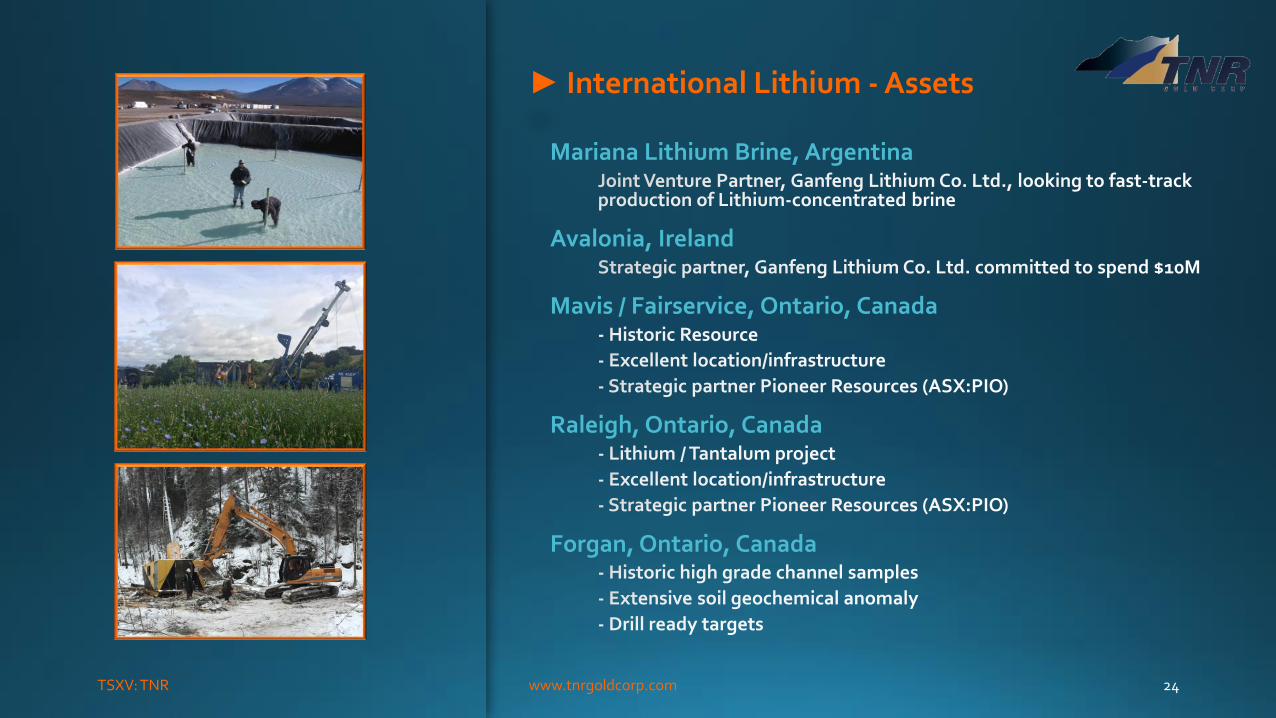
Mariana Lithium Brine, Argentina
Avalonia, Ireland
Mavis / Fairservice, Ontario, Canada
Raleigh, Ontario, Canada
Forgan, Ontario, Canada
► International Lithium - Assets

TSXV: TNR
CONTACT
Joint Venture Partnerships
Financing
- We welcome your inquiries -Investor Relations hub
https://tnrgoldcorp.com/investors/
1111 Melville Street, Suite 1100Vancouver, BC, V6E 3V6
Phone: +1 604-700-8912Fax: +1 604-484-7143
www.tnrgoldcorp.com

TSXV: TNR www.tnrgoldcorp.com 26
► Technical Disclosure Statements
Certain Information in this presentation is based on studies conducted by McEwen Mining Inc. and their consultants and “Qualified Persons” as defined by National Instrument 43-101. Statements in the presentation referring to Resource Estimates and a Preliminary Economic Assessment are taken from the information publicly provided by McEwen Mining Inc.
The technical report, which includes the results of the preliminary economic analysis (“PEA”), is available on the McEwen Mining website and under the profile of McEwen Mining on SEDAR at www.sedar.com.
The following notes are referenced in this presentation.
(1)Technical report titled “NI 43-101 Technical Report – Preliminary Economic Assessment Update for the Los Azules Project, Argentina ,” with an effective date of September 1, 2017, prepared by D. Brown, CPEng, M. Bunyard, C. Eng, FAusIMM, B. Davis, FAusIMM, J. Duff, P. Geol, R. Duinker, P. Eng, MBA, J. Farrell, P. Eng, W. Rose, P. E., K. Seddon, CPEng, R. Sim, P. Geo, all of whom are qualified persons and all of whom but D. Brown and J. Duff are considered independent of McEwen Mining, as defined by NI 43-101. TNR Gold Corp. has not engaged an independent qualified person to verify the technical disclosures provided by McEewn Mining Inc. Mineral resources are not mineral reserves and there is no guarantee that the resources reported herein will result in an economic mining scenario.
(3) The PEA reported and documented by McEwen Mining is preliminary in nature, it includes inferred mineral resources that are considered too geologically speculative to have the economic considerations applied to them that would enable them to be categorized as mineral reserves, and there is no certainty that the preliminary economic assessment will be realized. Mineral resources, including those categorized as “measured and indicated” as well as “inferred” are not mineral reserves and the economic viability of these mineral resources have not been demonstrated by this economic analysis.
McEwen Mining's press releases and website material appear to be prepared by Qualified Persons and the procedures, methodology and key assumptions disclosed by McEwen Mining are those adopted and consistently applied in the mining industry, but no Qualified Person engaged by TNR has done sufficient work to analyze, interpret, classify or verify McEwen Mining's information, nor to determine the current mineral reserve or resource or any other information referred to in their press releases. Accordingly, the reader is cautioned in placing any reliance on these disclosures.
Jonathan Findlay, P.Geo, Geological Consultant of the Company, and a “Qualified Person” for the purposes of National Instrument 43-101-Standards of Disclosure for Mineral Projects of the Canadian Securities Administrators, has reviewed and approved the scientific and technical information contained in this Presentation.

TSXV: TNR www.tnrgoldcorp.com 27
► Shotgun Zone Resource Estimate: effective date May 27, 2013
The Shotgun Zone mineral resource estimate is based on 34 diamond drill holes (NQ) totaling 4,932.3 metres, with 2,481 assays (0.2 up to 10 metres in length). Holes were drilled byseveral operators in five drill campaigns conducted between 1984 and 2012. The 34 drill holes are spaced primarily 40 to 100 metres apart in an area of approximately 375 x 300 metres.The drill holes tested mineralization to a vertical depth up to 150 metres.
The Shotgun gold mineralization is associated with intrusions of various compositions (incl. granite porphyry) which intruded the Cretaceous sedimentary rocks of the Kuskokwim Group.Mineralization was emplaced within a compressional environment evidenced by northeast oriented right lateral strike slip faulting and open folding with northwest oriented axes. In theShotgun Zone, northwest oriented dilational jogs or relay zones host mineralized quartz breccias. A resource model for the Shotgun Zone was constructed based on the distribution ofthe gold mineralization (> 0.3 to 0.5 g/t Au) and this model was used to constrain the composite values chosen for interpolation, and the ore blocks reported in the mineral resource. Ablock model (x – 548000, y – 6697000, z – 800, no rotation) with block dimensions of 5 x 5 x 5 metres in the x, y and z directions was placed over resource model solids with only thatproportion of each block below the topographic/overburden surface and inside the solid recorded.
Grades for gold were interpolated into the blocks by the inverse distance squared (ID2) method using a minimum of 2 and maximum of 12 composites to generate block grades in theInferred resource category. The search ellipse used to interpolate grade into the blocks measured 110 x 60 x 110 (Principle Az – 235°, Principle Dip - 25°, Intemediate Az.- 325°). The sizeand orientation of the search ellipse approximates the strike, dip and thickness of the resource model and takes into account the limited drilling and relatively wide spacing of the drilling.
Two metre composite samples were used in the resource estimation. An average specific gravity (SG) of 2.60 was used for the resource estimate. The average SG value is based onlimited SG testing (18 samples) of representative mineralized core from 11 drill holes which intersect the resource model. Gemcom GEMS 6.4.1 software was used to complete theresource estimate.
GeoVector has estimated a range of Inferred resources at various Au g/t cut-off grades (COG) for the Shotgun Zone. The current inferred resource is stated using a grade cut-off of 0.50g/t Au. A cut-off grade of 0.50 is considered a reasonable economic cut-off grade for the Shotgun zone to maximize the grade of the resource while maintaining a coherent model of theresource. A COG of 0.50 is a reasonable cut-off for this type of Au deposit in this region (Donlin, Livengood).
The inferred mineral resource estimate was prepared in compliance with the standards of NI 43-101 by Allan Armitage, PhD., P.Geol., of GeoVector Management Inc., and is responsiblefor the technical comments related to the resource estimate and its parameters. Armitage is an “independent qualified person” for the purposes of National Instrument 43-101 Standardsof Disclosure for Mineral Projects of the Canadian Securities Administrators and has verified the data disclosed in this document.
For more information see TNR Gold Corp. news releases dated April 22 and May 30, 2013 and filed on www.SEDAR.com

TSXV: TNR www.tnrgoldcorp.com 28
► Shotgun Zone Resource Estimate: effective date May 27, 2013
For more information see TNR Gold Corp. news releases dated April 22 and May 30, 2013 and filed on www.SEDAR.com.
Shotgun Ridge Inferred Resource Estimate – Au (g/t) cut-off
Cut-off Tonnes Grade (g/t) Grams Ozs<0.1 g/t 24,551,029 0.96 23,628,833 759,7700.1 g/t 24,545,917 0.96 23,628,825 759,7690.2 g/t 24,545,917 0.96 23,628,825 759,769
0.3 g/t 24,509,842 0.96 23,618,643 759,4420.5 g/t 20,734,313 1.06 21,955,342 705,9600.7 g/t 14,779,225 1.24 18,367,655 590,6001.0 g/t 9,101,458 1.49 13,602,038 437,3651.5 g/t 3,722,669 1.90 7,081,574 227,7032.0 g/t 874,455 2.52 2,203,359 70,8483.0 g/t 63,168 3.16 199,328 6,4094.0 g/t 1,300 5.46 7,096 2285.0 g/t 650 6.53 4,243 136
Modeled based on a 0.3 – 0.5 g/t Au cut-off