the potential socio-economic implications of licensing the ... · 2.0 possible exploration,...
TRANSCRIPT

The Potential Socio-EconomicImplications of Licensing the SEA3
Area
Professor Alex Kemp andLinda Stephen
August, 2002

The Potential Socio-Economic Implications of Licensing the SEA3 Area
Contents Page
1.0 Introduction ..............................................................................................................1
2.0 Possible Exploration, Discoveries and Field Developments.......................................2
3.0 Size and Costs of New Discoveries ...........................................................................6
4.0 Development of Technical Reserves Plus New Discoveries ......................................6
5.0 Economic Modelling.................................................................................................9
6.0 Availability of Offshore Infrastructure ......................................................................9a) Carboniferous Trend .....................................................................................9b) London Brabant ..........................................................................................10c) Rotliegen Flank Trend.................................................................................11d) Mid North Sea High ....................................................................................11
7.0 Oil and Gas Production and Availability of Onshore Infrastructure.........................12
8.0 Potential Employment in UK from Licensing of SEA3 Area...................................20
9.0 Possible Investment, Operating an Decommissioning Expenditures ........................34
10.0 Potential Tax Revenues...........................................................................................49
11.0 General Conclusions ...............................................................................................54
Appendix 1 ....................................................................................................................56

1
The Potential Socio-Economic Implications of Licensing the SEA3 Area
1.0 Introduction
1.1 The UK Department of Trade and Industry (DTI) is conducting a sectoral StrategicEnvironmental Assessment (SEA) of the implications of licensing parts of the UKCSfor oil and gas exploration and production. This SEA (SEA 3) is the third in a seriesplanned by the DTI, which will in stages, address the whole of UK waters. As part ofthe SEA 3 process, a study of the potential socio-economic implications is required.This report fulfils that requirement.
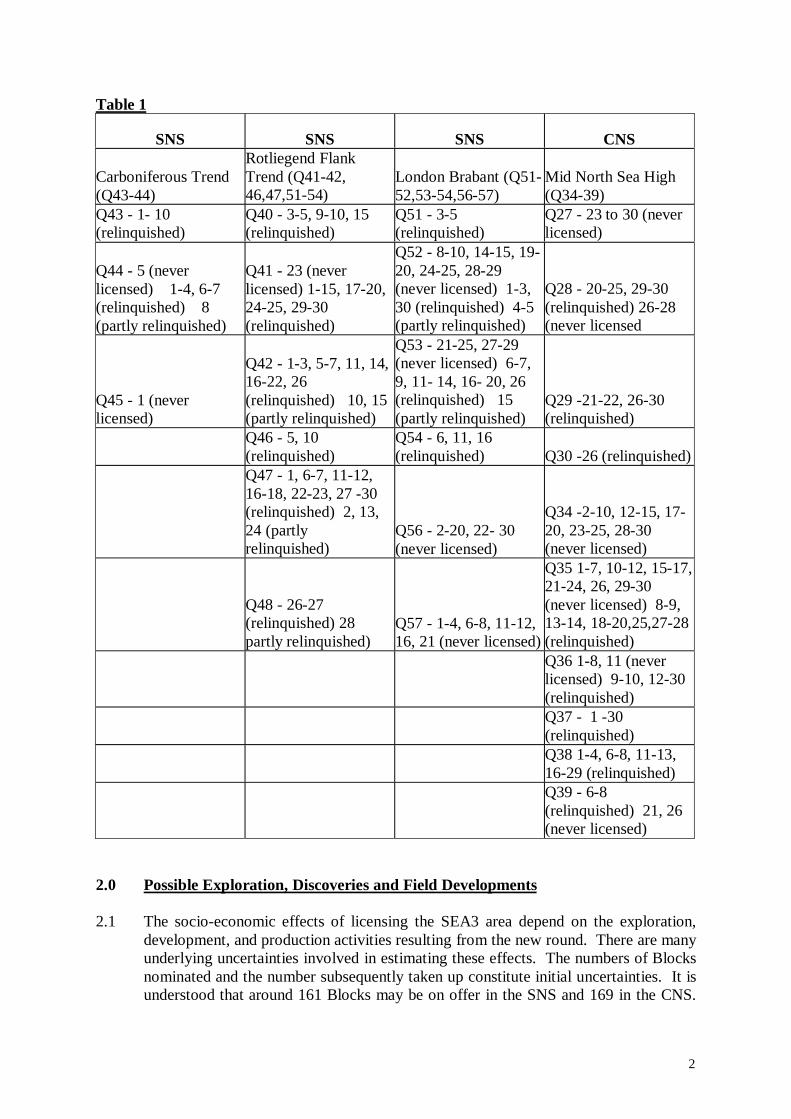
1.2 The whole SEA3 area covers four distinct sub-areas of the UKCS. In the CentralNorth Sea approximately 169 Blocks or Part Blocks in Quadrants 27 to 30 andQuadrants 34 to 39 are open. In the Southern North Sea 161 Blocks or Part Blocksare open. Table 1 gives the details of the SEA3 areas.
1.3 The scope of the study includes estimates of the reserves which might be discoveredand developed, and the related exploration, appraisal, development anddecommissioning costs. The possible phasing of these activities through time is alsoexamined. The effects of the development of new fields in extending the lives ofexisting ones and the implications for the provision of necessary infrastructureonshore are also discussed. The employment generated directly and indirectly in the 2sub-areas is estimated. The distinction is made between employment at the variousstages in the exploration, development and production activities. The significance ofthe employment opportunities provided for the long-term maintenance of a skilledworkforce is also considered.
1.4 In preparing a study of this type many assumptions had to be made. In formulatingsome of the assumptions regarding the likely numbers and types of newdevelopments, the views of the relevant experts in the DTI were fully taken intoaccount. The number of possible new field developments emanating from the roundreflects a cautious view of the possibilities.
2
Table 1
SNS SNS SNS CNS
Carboniferous Trend(Q43-44)
Rotliegend FlankTrend (Q41-42,46,47,51-54)
London Brabant (Q51-52,53-54,56-57)
Mid North Sea High(Q34-39)
Q43 - 1- 10(relinquished)
Q40 - 3-5, 9-10, 15(relinquished)
Q51 - 3-5(relinquished)
Q27 - 23 to 30 (neverlicensed)
Q44 - 5 (neverlicensed) 1-4, 6-7(relinquished) 8(partly relinquished)
Q41 - 23 (neverlicensed) 1-15, 17-20,24-25, 29-30(relinquished)
Q52 - 8-10, 14-15, 19-20, 24-25, 28-29(never licensed) 1-3,30 (relinquished) 4-5(partly relinquished)
Q28 - 20-25, 29-30(relinquished) 26-28(never licensed
Q45 - 1 (neverlicensed)
Q42 - 1-3, 5-7, 11, 14,16-22, 26(relinquished) 10, 15(partly relinquished)
Q53 - 21-25, 27-29(never licensed) 6-7,9, 11- 14, 16- 20, 26(relinquished) 15(partly relinquished)
Q29 -21-22, 26-30(relinquished)
Q46 - 5, 10(relinquished)
Q54 - 6, 11, 16(relinquished) Q30 -26 (relinquished)
Q47 - 1, 6-7, 11-12,16-18, 22-23, 27 -30(relinquished) 2, 13,24 (partlyrelinquished)
Q56 - 2-20, 22- 30(never licensed)
Q34 -2-10, 12-15, 17-20, 23-25, 28-30(never licensed)
Q48 - 26-27(relinquished) 28partly relinquished)
Q57 - 1-4, 6-8, 11-12,16, 21 (never licensed)
Q35 1-7, 10-12, 15-17,21-24, 26, 29-30(never licensed) 8-9,13-14, 18-20,25,27-28(relinquished)Q36 1-8, 11 (neverlicensed) 9-10, 12-30(relinquished)Q37 - 1 -30(relinquished)Q38 1-4, 6-8, 11-13,16-29 (relinquished)Q39 - 6-8(relinquished) 21, 26(never licensed)
2.0 Possible Exploration, Discoveries and Field Developments
2.1 The socio-economic effects of licensing the SEA3 area depend on the exploration,development, and production activities resulting from the new round. There are manyunderlying uncertainties involved in estimating these effects. The numbers of Blocksnominated and the number subsequently taken up constitute initial uncertainties. It isunderstood that around 161 Blocks may be on offer in the SNS and 169 in the CNS.
3
Many of the Blocks on offer will have been relinquished from earlier rounds or havenever been licensed.
2.2 In the 20th Round the take-up was not very high in relation to the number of Blocksput on offer reflecting declining prospectivity.
2.3 The numbers of commitment wells likely to be offered in the new round are alsosubject to considerable uncertainty. These will reflect both the numbers of Blockssought and the perceptions of the expected success rates. Exploration success rates,while less than in the 1970’s and 1980’s, have held up quite well given the maturity ofthe UKCS acreage in question. One reason for this has been the advances in seismictechnology.
2.4 In the present context it is also relevant that much data on previously licensed acreagewill be available to new applicants. It is also relevant that in some of the acreagediscoveries have already been made. This could enhance the overall success rate,taking into account appraisal as well as exploration.
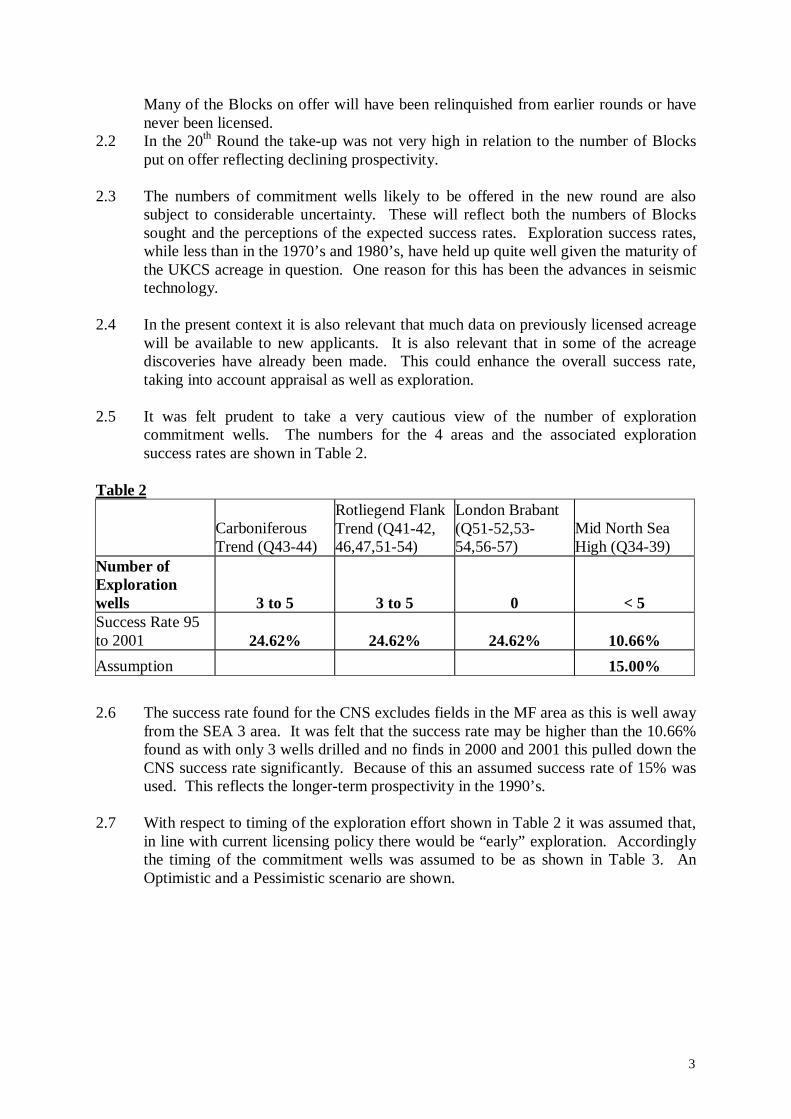
2.5 It was felt prudent to take a very cautious view of the number of explorationcommitment wells. The numbers for the 4 areas and the associated explorationsuccess rates are shown in Table 2.
Table 2
CarboniferousTrend (Q43-44)
Rotliegend FlankTrend (Q41-42,46,47,51-54)
London Brabant(Q51-52,53-54,56-57)
Mid North SeaHigh (Q34-39)
Number ofExplorationwells 3 to 5 3 to 5 0 < 5Success Rate 95to 2001 24.62% 24.62% 24.62% 10.66%
Assumption 15.00%
2.6 The success rate found for the CNS excludes fields in the MF area as this is well awayfrom the SEA 3 area. It was felt that the success rate may be higher than the 10.66%found as with only 3 wells drilled and no finds in 2000 and 2001 this pulled down theCNS success rate significantly. Because of this an assumed success rate of 15% wasused. This reflects the longer-term prospectivity in the 1990’s.
2.7 With respect to timing of the exploration effort shown in Table 2 it was assumed that,in line with current licensing policy there would be “early” exploration. Accordinglythe timing of the commitment wells was assumed to be as shown in Table 3. AnOptimistic and a Pessimistic scenario are shown.

4
Table 3
Number and Timing of Exploration Wells
PessimisticScenario
CarboniferousTrend (Q43-44)
Rotliegend FlankTrend (Q41-42,46,47,51-54)
London Brabant(Q51-52,53-54,56-57)
Mid North SeaHigh (Q34-39)
2003 3 3 1200420052006
Total 3 3 0 1
Optimistic Scenario2003 3 3 12004 2 2 320052006
Total 5 5 0 4
2.8 This timing and the exploration success rate determines the timing of the fields foundas shown in Table 4.
Table 4
Discoveries
PessimisticScenario
CarboniferousTrend (Q43-44)
Rotliegend FlankTrend (Q41-42,46,47,51-54)
London Brabant(Q51-52,53-54,56-57)
Mid North SeaHigh (Q34-39)
2003 1 1 1200420052006
Total 1 1 0 1
OptimisticScenario
2003 1 1 1200420052006
Total 1 1 0 1
2.9 For both the Pessimistic and the Optimistic Scenarios, only 3 exploration finds arelikely. It is, however, expected that in total there will be 1 - 5 subsea developmentsand 2 stand-alone developments in the whole SEA 3 area.

5
Table 5
Number and Timing of Appraisal Wells
PessimisticScenario
CarboniferousTrend (Q43-44)
Rotliegend FlankTrend (Q41-42,46,47,51-54)
London Brabant(Q51-52,53-54,56-57)
Mid North SeaHigh (Q34-39)
2003 Technical reserve2004 Exploration find Exploration find Exploration find20052006
Total 1 2 1
OptimisticScenario
2003 Technical reserve2004 Exploration find Exploration find Exploration find2005 Technical reserve2006
Total 1 3 1
2.10 Given 3 discoveries, the remaining developments come from known technicalreserves. These discoveries are then appraised, but it is also assumed that only 50%of the SNS technical reserve fields may require further appraisal. The timing isshown in Table 5.
Table 6
Possible Developments
PessimisticScenario
CarboniferousTrend (Q43-44)
Rotliegend FlankTrend (Q41-42,46,47,51-54)
London Brabant(Q51-52,53-54,56-57)
Mid North SeaHigh (Q34-39)
20032004 Technical reserve2005 Exploration find Exploration find2006 Exploration find
Total 1 2 1
OptimisticScenario
2003 Technical reserve
2004Technicalreserves*2
2005 Exploration find Exploration find2006 Technical reserve Exploration find
Total 1 5 1
2.11 Table 6 shows the profiles of the number of possible developments.

6
3.0 Size and Costs of New Discoveries
3.1 The significant discoveries in the SEA 3 quadrants over the last 10 years as reportedin the “Brown Book” along with the reserve size from the authors’ own databases ofsanctioned, probable, and possible fields as reported by the operators, plus a databaseof known technical reserves was used to calculate the mean discovery size.
3.2 The size and costs of new discoveries was estimated with the employment of theMonte Carlo technique. With respect to size of discoveries the historical evidencewas examined. In line with historic experience the distribution of field sizes wastaken to be lognormal. The standard deviation (SD) was set at 50% of the meanvalue.
3.3 With respect to the development and operating costs of new discoveries the meandevelopment cost for the SNS was set at $3 per boe, and for the CNS $4 per boe.Annual operating costs (including tariffs) were assumed to be in the range 8%-15% ofaccumulated development costs depending on field size. The lower percentages applyto the larger sizes reflecting the economy of scale. Decommissioning costs were setat 10% of field development costs. Table 7 gives the mean discovery size and cost foreach of the SEA3 areas.
3.4 The Monte Carlo technique was then used to draw from these distributions todetermine the size of fields found. An 8.72 Mboe field was found in theCarboniferous Trend, a 24.3 Mboe field in the Rotliegend Flank area, and a 15.71Mboe oil field in the Mid North Sea High area.
4.0 Development of Technical Reserves Plus New Discoveries
4.1 For the technical reserve fields it was felt that the largest technical reserves in theBlocks on offer would be the most likely to be developed. There were relatively fewtechnical reserves in the Carboniferous, London Brabant or Mid North Sea Highareas, and so the technical reserves in the Rotliegend Flank Trend area have beenused. Table 8 shows the potential exploration and technical reserve fields for the Sea3 area

7
Table 7
Mean Size ofrecoverablereserves
CarboniferousTrend (Q43-44)
Rotliegend FlankTrend (Q41-42,46,47,51-54)
London Brabant(Q51-52,53-54,56-57)
Mid North SeaHigh (Q34-39)
Mean Discoverysize Mboe (10year averagebased on BrownBook Significantdiscoveries) 15.57 17.45 16.8 49.77Lognormal distribution: SD 50% of meanvalueMean DevexDiscoveries $3 $3 $3 $4Mean DevexTechnicalReserves $5 $5 $5 $6Normal Distribution: SD 20%of mean value
Table 8
Development Size (Mboe)
PessimisticScenario
CarboniferousTrend (Q43-44)
Rotliegend FlankTrend (Q41-42,46,47,51-54)
London Brabant(Q51-52, 53-54,56-57)
Mid North SeaHigh (Q34-39)
20032004 78.32005 8.72 24.302006 15.71
OptimisticScenario
2003 8.972004 78.3
5.62005 8.72 24.302006 26.2 15.71

8
Table 9
Development Costs $/bbl
PessimisticScenario
CarboniferousTrend (Q43-44)
Rotliegend FlankTrend (Q41-42,46,47,51-54)
London Brabant(Q51-52,53-54,56-57)
Mid North SeaHigh (Q34-39)
20032004 4.012005 3.18 2.512006 5.24
OptimisticScenario
2003 3.932004 4.01
4.282005 3.18 2.512006 5.90 5.24
4.2 The Monte Carlo technique was also used to obtain values from the development costdistributions. The resulting values are shown in Table 9.
4.3 The expenditures on E and A (including associated seismic) are based on costs of £7million per well in the SNS and £12 million per well in the CNS. In conjunction withthe numbers of wells discussed above the total expenditures (at 2002 prices) areshown in Table 10.
Table 10
Expenditures on Exploration and Appraisal (£m, 2002 prices)PessimisticScenario SNS CNS
Real ExplorationCost
Real AppraisalCost
Real ExplorationCost
Real AppraisalCost
2003 42 7 122004 14 1220052006
Total £m 42 21 12 12
Optimistic Scenario2003 42 7 122004 28 14 36 122005 72006
Total £m 70 28 48 12

9
5.0 Economic Modelling
5.1 The exploration finds and the technical reserves fields were then profiled through timewith respect to production and costs. Economic modelling using the financialsimulation technique was then employed to calculate for each development grossrevenues, development costs, operating costs, and decommissioning costs. Theallowances for corporation tax were calculated and the post-tax cash flowssubsequently calculated. Exploration and appraisal costs and the tax reliefs availablewere also calculated. Here we assume the investor is in a position which allowsimmediate relief. Production was subject to economic cut-off when post-tax profitsfor 3 consecutive years were negative. The investment decision rule adopted was thatif a field had a positive NPV at 10% or 15% real discount rate then developmentwould proceed. Otherwise the field would not be developed. (Further details of thefinancial modelling are discussed in Kemp and Stephen (2002(a)).
5.2 The results of the economic modelling were undertaken for different oil and gasprices. In the results emphasis was given to the results at (a) $20/bbl and 18pence/therm, (b) $15 bbl and 12 pence/therm and (c) $25/bbl and 24 pence/therm.
6.0 Availability of Offshore Infrastructure
6.1 In the SNS it was felt that under the Pessimistic Scenario there could be 2developments via sub-sea completions and 1 via platform whilst for the OptimisticScenario there may be 4 developments via sub-sea and 2 via platforms. Thedevelopments have implications for the field lives of existing potential hostinstallations.
6.2 The SNS is a mature area with a proliferation of infrastructure. In a few cases theSEA3 Blocks or part Blocks to be relicensed are close to a number of existinginstallations, but in most cases they are relatively remote.
a) Carboniferous Trend
6.3 The Carboniferous Trend Area consists of Quadrant 43 Blocks 1 to 10, Quadrant 44Blocks 1-8 and Quadrant 45 Block 1. Quadrant 43 contained the nowdecommissioned fields Forbes (43/8-1), Gordon (43/20-1), and Esmond (43/13a-1).The gas from these fields was transported to Bacton via Esmond. The Trent and Tynefield group entered a joint venture with the Esmond transportation system. This isnow known as the EAGLES (East Anglia Gas and Liquids Evacuation System).Forbes was in Block 8 but it ceased production in 1993, Gordon was in Block 20 butit ceased production in 1995 along with Esmond which was in Block 13. TheCavendish field is in Block 19 and Cavendish East is in Block 20. The gas from thesefields will most likely be transported to Bacton via Trent. These fields are likely tostill be producing in 2012. Trent is in Block 24 and Johnstone is in Block 27 but thismay be too far to tie in any exploration find. Johnstone gas is transported toRavenspurn North then onwards through the Cleeton/Ravenspurn South pipeline toDimlington. There is no close infrastructure in Quadrants 37, 42, or 44.

10
6.4 Quadrant 44 contains the Caister and Hunter fields in Block 23, Ketch in Block 28,Boulton in Block 21, Murdoch and Watt in Block 22, and Schooner in Block 26, butthese fields may be too far away to enable a tie in. Caister/Murdoch, Hunter, Ketch,Boulton, and Schooner gas is transported to Theedlethorpe via the Caister Murdochpipeline. McAdam and Hawksley in Block 17, Tyne North and South in Block 18 arenearer, but the tie in distance is still quite long. McAdam gas is likely to betransported to Theedlethorpe via the Caister/Murdoch pipeline, whilst Tyne gas istransported to Trent then on through the EAGLES system to Bacton. There is nonearby infrastructure in Quadrants 38, 43 or 45.
6.5 There is no nearby infrastructure for any field discovered in Quadrant 45.
b) London Brabant
6.6 The London Brabant area consists of Quadrant 51 Blocks 3 to 5, Quadrant 52 Blocks1 to 5, 8 to 10, 14, 15, 19, 20, 24, 25 and 28 to 30, Quadrant 53 Blocks 6, 7, 9, 11 to29, Quadrant 54 Blocks 6, 11 and 16, Quadrant 56 Blocks 2 to 20 and 22 to 30 andQuadrant 57 Blocks 1 to 4, 6 to 8, 11,12,16 and 21.
6.7 Quadrant 51 has no infrastructure but is close to land. The nearest discoveries are inQuadrant 48 Blocks 21 and 22 which contain Dudgeon and Blythe.
6.8 Part of the Hewett field lies in Block 52 and the Bacton terminal is very near. Hewettgas is transported in a 32 kilometre pipeline to Bacton. Hewett’s gas maybe depletedby 2006. The Camelot fields are in Quadrant 53 Block 1 and Camelot South is inBlock 2. Camelot gas is transported to Bacton via Leman. Camelot may ceaseproduction by 2007. The Wissey field and Welland South and NW are in Quadrant53 Block 4 and Davy is in Block 5, but these fields may be too far away to act as hostfields for any technical reserves or exploration finds in Quadrant 52. Welland gas iscurrently transported to Bacton via the Thames field, but Welland is nearly depleted.Davy gas is transported to Indefatigable 43 kilometres away then on to Bacton.
6.9 Quadrant 53 contains Wissey, Welland South and NW in Block 4, the Camelot fieldsin Blocks 1 and 2, Davy in Block 5. Leman is in Quadrant 49 Blocks 26 and 27, andYare, Thames, Bure, Wensum and Deben are in Block 28, Tristan and Gawain inBlock 29, North Davy and Brown in Quadrant 49 Block 30. These fields may be toofaraway to tie in any technical reserves or exploration finds in Quadrant 53. Lemangas is landed at Bacton and the Leman field will still be in production after anydevelopments from the SEA 3 area have ceased production. Thames Yare, Wensumand Deben gas is landed at Bacton, but Yare, Bure and Wensum have ceasedproduction. Tristan gas is transported to Welland then to Thames, and then to Bactonwhilst Gawain’s gas goes to Thames.
6.10 Quadrant 54 has no discoveries. Block 6 might be able to tie in to Davy in Quadrant53 Block 5 or to Orwell, a field in Quadrant 50 Block 26. Orwell’s gas is piped 34kilometres to Thames.
6.11 Quadrants 56 and 57 have never been licensed and there is no nearby fields orinfrastructure.

11
c) Rotliegen Flank Trend
6.12 The Rotliegend Flank Trend consists of Quadrant 41 Blocks 1 to 15, 17 to 20, 23 to25, 29 and 30, Quadrant 42 Blocks 1 to 3, 5 to 7, 10, 11, 14, 15 to 22 and 26,Quadrant 46 Blocks 5 and 10, Quadrant 47 Blocks 1,2, 6, 7, 11 to 13, 16 to 18, 22, 23,24 and 27 to 30, and Quadrant 48 Blocks 26, 27 and 28.
6.13 Quadrant 41 has 2 technical reserve fields but there are no potential host fields nearbyin Quadrants 35, 46, 42 or 47.
6.14 Quadrant 42 Block 30 contains the Ravenspurn gas field, Block 29 contains Cleeton,Block 28 contains Wollaston and Whittle. Cleeton gas was transported to Dimlingtonbut it ceased production in 1999. Whittle and Wollaston gas will be transported to theCleeton/Ravenspurn pipeline. A gas field found in Block, 22, 23 or perhaps 26 maybe able to be developed with Whittle and Wollaston.
6.15 The Quadrant 46 Blocks are close to land and the Dimlington terminal is near.
6.16 The Quadrant 47 Blocks are close to the Dimlington and Theddlethorpe terminals.Rough is in Blocks 3 and 8 of Quadrant 47. Amethyst West is in Block 13, AmethystEast is in Block 14, Artemis, Apollo and York are in Block 3, Neptune is in Block 5,Mercury is in Block 9, and Helvellyn and Rose are in Block 10. Amethyst gas istransported 46 kilometres to Easington. Mercury gas is transported to Neptune thenon to Cleeton along with gas from Artemis, Apollo and York.
6.17 The Bacton terminal is close to the SEA 3 Quadrant 48 Blocks. The Dawn fieldwhich ceased production in late 1999 and Big Dotty are in Block 29 of Quadrant 48,Hewett is also partly in Block 29, Delilah, Deborah, Della and Little Dotty are inBlock 30, Blythe is in Block 22 and Dudgeon is in Block 21.
d) Mid North Sea High
6.18 The Mid North Sea High area consists of Quadrant 27 Blocks 23 to 30, Quadrant 28Blocks 20 to 30, Quadrant 29 Blocks 21, 22 and 26 to 30, Quadrant 30 Block 26,Quadrant 34 Blocks 2 to 10, 12 to 15, 17 to 20, 23 to 25 and 28 to 30, Quadrant 35Blocks 1 to 30, Quadrant 36 Blocks 1 to 30, Quadrant 37 Blocks 1 to 30, Quadrant 38Blocks 1 to 4, 6 to 8, 11 to 13 and 16 to 30 and Quadrant 39 Blocks 6, 7, 8, 21 and 26.
6.19 There are no fields or infrastructure in or around the SEA 3 Quadrant 27, 28, 29, 34,35 and 36 Blocks.
6.20 The Auk and the Fulmar fields are in Quadrant 30 Block 16. Auk may be accessiblefrom Block 26, but this is the only infrastructure available. Fulmar gas is transportedto St Fergus.
6.21 The decommissioned Forbes field is in Quadrant 43 Block 8 but this may be too far totie in any field discovered in Quadrant 37. Forbes gas was transported to Esmond.

12
6.22 The decommissioned Argyll, Innes, and Duncan fields are in Quadrant 30 Block 24 sothere are no nearby fields or infrastructure for any field discovered in the SEA 3Quadrant 38 area. Argyll is to be redeveloped.
6.23 Fergus is in Quadrant 39 Block 2, Flora Angus and Fife are in Quadrant 31 Block 26.Fergus may cease production in 2003 as may Flora and Fife whilst Angus whichceased production in 1993 is now producing again. None of these fields export gas.
6.24 The general findings are that there is little scope for the further utilisation of theexisting infrastructure in all parts of the SEA3 area from the development of newdiscoveries and technical reserves in Blocks being made available in the 21st Round.The precise location of any new discoveries is, of course, not known, and thus thespecific offshore infrastructure which might be utilised cannot be specified.Accordingly this has not been modelled.
7.0 Oil and Gas Production and Availability of Onshore Infrastructure
7.1 To estimate the effects of the new fields on the capacity of the onshore infrastructurefull economic modelling was undertaken. The potential gas production from the SNSexploration finds and new developments at 18p/therm under the Optimistic Scenarioare shown in Table 11.
Table 11Potential Gas Production @ $20/bbl and 18p/therm, Hurdle Rate 15% Real 2002(Optimistic Scenario)
Gas (average mmcf/d)SNS
Total
Exploration Find Technical Reserves
YearPassing 15% HurdleRate
Passing 15% HurdleRate
2003 0.00 6.89 6.892004 0.00 29.07 29.072005 21.50 40.99 62.502006 79.62 100.47 180.092007 79.62 233.89 313.522008 71.90 229.33 301.232009 65.52 221.31 286.832010 54.10 203.61 257.712011 44.02 166.00 210.022012 38.98 141.14 180.122013 30.24 124.98 155.222014 23.32 107.33 130.652015 12.87 97.38 110.252016 0.00 87.44 87.442017 0.00 72.34 72.342018 0.00 35.75 35.752019 0.00 26.82 26.82
Total Bcf 190.43 702.53 892.96

13
7.2 The oil potential production profile for the CNS exploration and technical reservefield development are shown in Table 12 below. Again, for economic modelling, adecline rate is added to the production profile.
Table 12Potential Oil Production @ $20/bbl and18p/therm, Hurdle Rate 15% Real 2002
CNSOil (averagetb/d) Exploration FindYear Passing 15% Hurdle
Rate2003 0.002004 0.002005 0.002006 0.002007 3.442008 7.752009 7.752010 6.462011 4.742012 3.872013 3.442014 3.012015 2.582016 1.552017 0.002018 0.002019 0.00Total mmbbls 16.28
7.3 Potential gas production under the Optimistic Scenario (Table 11) amounts to 892.96Bcf with an 18p/therm gas price. The same results are found with a 10% hurdle rate.With the Pessimistic Scenario and an 18p/therm gas price only 648.26 Bcf is likely tobe produced (Table 13).
7.4 According to Transco’s 2001 10-year Statement there should be sufficient capacity atTeesside, Easington, Dimlington, Theddlethrope and Bacton to absorb this volume ofgas which may be produced from the SEA3 area even with substantial imports.
7.5 Tables 14 and 15 show the potential gas production from the SNS exploration findsand new discoveries at 12p/therm and the Optimistic and Pessimistic Scenarios.

14
Table 13Potential Gas Production @ $20/bbl and 18p/therm, Hurdle Rate 15% Real 2002(Pessimistic Scenario)Gas (average mmcf/d) SNS Total
Exploration Find Technical Reserves
YearPassing 15% HurdleRate
Passing 15% HurdleRate
2003 0.00 0.00 0.002004 0.00 0.00 0.002005 21.50 0.00 21.502006 79.62 47.67 127.292007 79.62 143.01 222.642008 71.90 143.01 214.922009 65.52 143.01 208.542010 54.10 131.10 185.202011 44.02 107.26 151.282012 38.98 95.34 134.322013 30.24 89.38 119.622014 23.32 83.42 106.752015 12.87 77.47 90.332016 0.00 71.51 71.512017 0.00 59.59 59.592018 0.00 35.75 35.752019 0.00 26.82 26.82
Total Bcf 190.43 457.84 648.26
Table 14Potential Gas Production @ $15/bbl and 12p/therm, Hurdle Rate 15% Real 2002
(Optimistic Scenario)Gas (average mmcf/d) SNS SNS Total
Exploration FindTechnicalReserves
YearPassing 15%Hurdle Rate
Passing 15%Hurdle Rate
2003 0.00 6.89 6.892004 0.00 24.82 24.822005 21.50 24.82 46.322006 79.62 20.68 100.302007 79.62 17.92 97.552008 71.90 13.79 85.692009 65.52 11.03 76.552010 54.10 9.65 63.752011 44.02 8.27 52.292012 38.98 0.00 38.982013 30.24 0.00 30.242014 18.50 0.00 18.50
Total Bcf 183.97 50.32 234.29

15
7.6 With the Optimistic Scenario and a 12p/therm gas price likely gas production may beonly 234.29 Bcf and with the Pessimistic Scenario only 183.97 Bcf is likely to beproduced as the technical reserve field would not pass the 15% hurdle rate.
Table 15Potential Gas Production @ $15/bbl and 12p/therm, Hurdle Rate 15% Real 2002(Pessimistic Scenario)Gas (average
mmcf/d) Exploration Find Technical Reserves
YearPassing 15% HurdleRate
Passing 15% HurdleRate
2003 0.00 0.002004 0.00 0.002005 21.50 21.502006 79.62 79.622007 79.62 79.622008 71.90 71.902009 65.52 65.522010 54.10 54.102011 44.02 44.022012 38.98 38.982013 30.24 30.242014 18.50 18.50
Total Bcf 183.97 0.00 183.97
7.7 There are no onshore infrastructure capacity problems associated with these possibledevelopments.
7.8 Tables 16 and 17 show the potential gas production from the SNS exploration findsand new discoveries at 24p/therm under the Optimistic and Pessimistic Scenarios.

16
Table 16Potential Gas Production @ $25/bbl and 24p/therm, Hurdle Rate 15% Real 2002(Optimistic Scenario)Gas (average mmcf/d) SNS Total
Exploration Find Technical Reserves
YearPassing 15% HurdleRate
Passing 15% HurdleRate
2003 0.00 6.89 6.892004 0.00 29.07 29.072005 21.50 40.99 62.502006 79.62 100.47 180.092007 79.62 233.89 313.522008 71.90 229.33 301.232009 65.52 221.31 286.832010 54.10 203.61 257.712011 44.02 166.00 210.022012 38.98 141.14 180.122013 30.24 128.71 158.952014 23.32 110.12 133.442015 12.87 97.38 110.252016 9.65 87.44 97.092017 0.00 72.34 72.342018 0.00 45.95 45.952019 0.00 34.97 34.972020 0.00 20.11 20.11
Total Bcf 193.95 718.96 912.90

17
Table 17Potential Gas Production @ $25/bbl and 24p/therm, Hurdle Rate 15% Real 2002(Pessimistic Scenario)Gas (averagemmcf/d) SNS Total
Exploration Find Technical Reserves
YearPassing 15% HurdleRate
Passing 15% HurdleRate
2003 0.00 0.00 0.002004 0.00 0.00 0.002005 21.50 0.00 21.502006 79.62 47.67 127.292007 79.62 143.01 222.642008 71.90 143.01 214.922009 65.52 143.01 208.542010 54.10 131.10 185.202011 44.02 107.26 151.282012 38.98 95.34 134.322013 30.24 89.38 119.622014 23.32 83.42 106.752015 12.87 77.47 90.332016 9.65 71.51 81.162017 0.00 59.59 59.592018 0.00 35.75 35.752019 0.00 26.82 26.822020 0.00 20.11 20.11
Total Bcf 193.95 465.18 659.13
7.9 With the Optimistic Scenario and a 24p/therm gas price aggregate gas production maybe 912.9 Bcf, and with the Pessimistic Scenario 659.13 Bcf is likely to be produced.
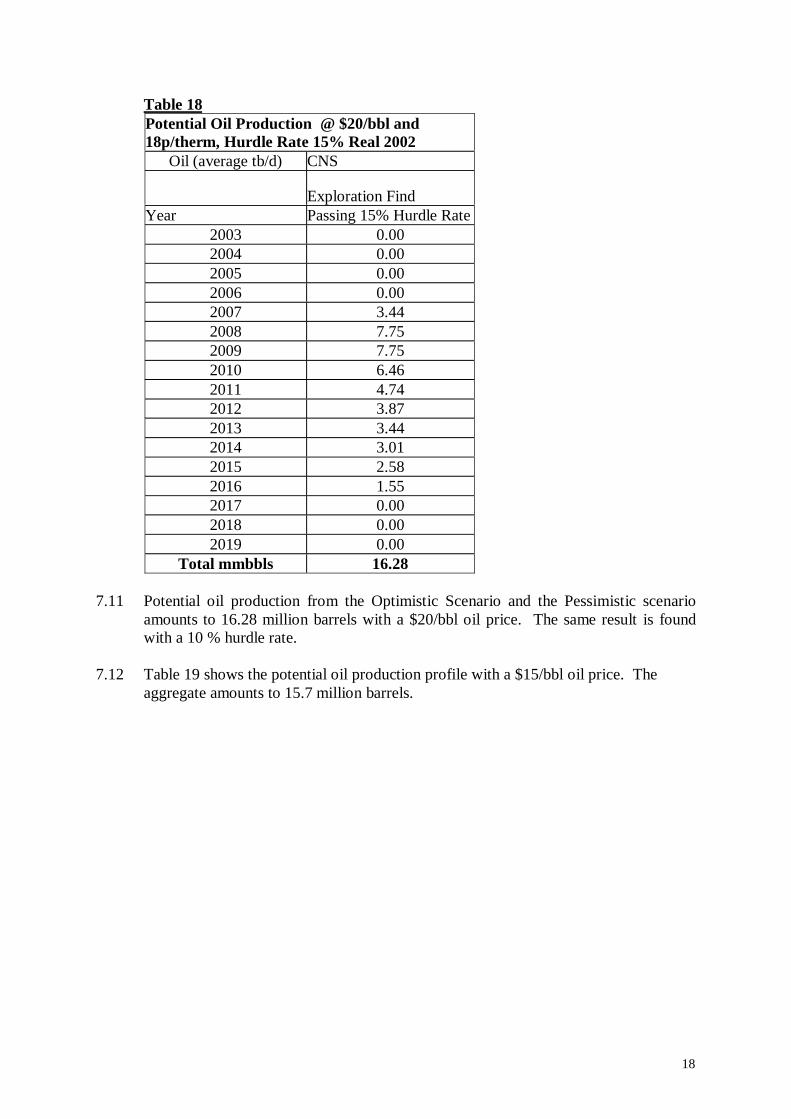
7.10 Table 18 shows the potential oil production profile with a $20/bbl oil price and a 15%hurdle rate.
18
Table 18Potential Oil Production @ $20/bbl and18p/therm, Hurdle Rate 15% Real 2002
Oil (average tb/d) CNS
Exploration FindYear Passing 15% Hurdle Rate
2003 0.002004 0.002005 0.002006 0.002007 3.442008 7.752009 7.752010 6.462011 4.742012 3.872013 3.442014 3.012015 2.582016 1.552017 0.002018 0.002019 0.00
Total mmbbls 16.28
7.11 Potential oil production from the Optimistic Scenario and the Pessimistic scenarioamounts to 16.28 million barrels with a $20/bbl oil price. The same result is foundwith a 10 % hurdle rate.
7.12 Table 19 shows the potential oil production profile with a $15/bbl oil price. Theaggregate amounts to 15.7 million barrels.

19
Table 19Potential Oil Production @ $15/bbl and12p/therm, Hurdle Rate 15% Real 2002
Oil (tb/d) CNS
Exploration FindYear Passing 15% Hurdle Rate
2003 0.002004 0.002005 0.002006 0.002007 3.442008 7.752009 7.752010 6.462011 4.742012 3.872013 3.442014 3.012015 2.582016 0.002017 0.002018 0.002019 0.00
Total mmbbls 15.71
7.13 Table 20 shows the potential oil production profile with a $25/bbl oil price.

20
Table 20
Potential Oil Production @ $25/bbl and24p/therm, Hurdle Rate 15% Real 2002
Oil (average tb/d) CNS
Exploration Find
YearPassing 15% HurdleRate
2003 0.002004 0.002005 0.002006 0.002007 3.442008 7.752009 7.752010 6.462011 4.742012 3.872013 3.442014 3.012015 2.582016 1.552017 1.162018 0.002019 0.00
Total mmbbls 16.70
7.14 Potential oil production amounts to 16.7 million barrels with a $25/bbl oil price.
8.0 Potential Employment in UK From Licensing of SEA3 Area
8.1 The licensing of the SEA3 areas will have an impact on the level of employment inthe UK. The methodology used to calculate the employment effects broadly followsthat used by PACEC (PACEC (2002)). Essentially the approach in that reportestimates employment from the levels of expenditure using the national input-outputtables to estimate all the indirect and induced employment. Direct employment refersto direct employment in exploration, development, production and decommissioning.Indirect employment refers to employment generated by the initial expendituresthroughout the supply chain. The input-output tables are used to calculate thisemployment. Induced employment (or trickle-down employment) refers to theemployment generated by the spending of employment income in the direct andindirect categories.

21
8.2 The study by COGENTSI and PACEC estimated multipliers from which the indirectand induced employment was calculated. The procedure adopted for the presentstudy was to base the calculation on the average multipliers for the period 1999-2003.The multipliers for the direct employment as estimated by COGENTSI and PACECwas modified to reflect the likelihood that, because the great majority of newdevelopments resulting from licensing in the SEA3 area will be with sub-sea systemsor not normally manned platforms, the direct employment from the expenditures willbe less than the 1999-2003 average.
8.3 The possible total employment generated in the whole SEA3 area under theOptimistic, $20, 18 pence case is shown in Table 21. The Pessimistic result is shownin Table 22. Employment peaks at just under 6,854 in 2007 when developmentactivity reaches its peak under the Optimistic Scenario, and 4,713 under thePessimistic Scenario. The estimates for the SNS under the 18 pence case are shownin Table 23. It is seen that the peak is also in 2007 with 6,063 jobs. The estimates forthe CNS under the $20, 18 pence case are shown in Table 24. Peak employment is1,208 in 2004.
8.4 Total possible employment for the whole SEA3 area under the $15, 12 pence scenariois shown in Table 25. Peak employment is over 2,713 in 2004 under the OptimisticScenario or 1,733 in 2006 under the Pessimistic Scenario. There is thus a verysubstantial sensitivity to the employment prospects. The Pessimistic result is shownin Table 26. The estimates for the SNS under the 12 pence case are shown in Table27. Employment peaks in 2003 at 1,519. The results for the CNS under the $12, 12pence scenario are shown in Table 28. Employment peaks at 1,208 in 2004.
8.5 Total possible employment for the whole SEA3 area under the $25, 24 pence scenariois shown in Table 29. Peak employment is over 6,854 in 2007 under the OptimisticScenario or 4,713 in 2007 under the Pessimistic Scenario. There is thus a verysubstantial sensitivity to the employment prospects. The Pessimistic result is shownin Table 30. The estimates for the SNS under the 12 pence case are shown in Table31. Employment peaks in 2007 at just under 6,063. The results for the CNS under the$12, 12 pence scenario are shown in Table 32. Employment peaks at 1,208 in 2004.

22
Table 21Number of Jobs Created from SEA 3$20/bbl and18p/therm OptimisticScenario 2003 2004 2005 2006 2007 2008 2009 2010 2011 2012 2013 2014 2015 2016 2017 2018 2019 2020DirectExploration 201 297 23 0 0 0 0 0 0 0 0 0 0 0 0 0 0 0Development +Decommissioning 21 80 206 408 445 293 149 32 0 0 6 8 0 21 19 36 0 73Opex 4 15 35 105 185 200 204 190 172 163 146 129 125 99 72 53 53 0
Total Direct Jobs 226 392 264 513 631 493 353 222 172 163 152 137 125 120 91 89 53 73
Indirect jobs(supply chain)Operations 10 41 93 280 496 536 546 509 459 435 391 345 336 265 192 142 142 0
Development +Decommissioning 169 647 1,672 3,315 3,618 2,380 1,212 263 0 0 45 67 0 169 158 293 0 596Exploration 661 975 76 0 0 0 0 0 0 0 0 0 0 0 0 0 0 0
Total direct andindirect 1,066 2,055 2,105 4,108 4,745 3,409 2,112 995 631 598 588 550 461 553 441 523 194 669
Induced jobs(trickle down) 755 1,311 882 1,715 2,109 1,649 1,182 744 574 543 507 459 419 400 305 297 177 245
Total 1,821 3,366 2,987 5,822 6,854 5,057 3,294 1,739 1,204 1,141 1,095 1,009 880 953 746 821 371 914

23
Table 22Number of Jobs Created from SEA 3$20/bbl and18p/thermPessimistic Scenario 2003 2004 2005 2006 2007 2008 2009 2010 2011 2012 2013 2014 2015 2016 2017 2018 2019 2020DirectExploration 201 86 0 0 0 0 0 0 0 0 0 0 0 0 0 0 0 0
Development +Decommissioning 0 37 166 283 305 261 84 0 0 0 0 0 0 21 19 0 0 73Opex 0 0 12 70 129 144 147 136 121 115 109 104 102 76 49 53 53 0
Total Direct Jobs 201 122 177 352 434 405 232 136 121 115 109 104 102 96 68 53 53 73
Indirect jobs(supply chain)Operations 0 0 31 186 345 385 394 363 323 307 293 279 273 202 130 142 142 0
Development +Decommissioning 0 298 1,344 2,295 2,481 2,117 685 0 0 0 0 0 0 169 158 0 0 596Exploration 661 282 0 0 0 0 0 0 0 0 0 0 0 0 0 0 0 0
Total direct andindirect 862 702 1,553 2,833 3,260 2,907 1,312 499 444 422 402 383 375 467 356 194 194 669
Induced jobs(trickle down) 673 409 593 1,177 1,452 1,353 775 453 404 383 366 349 341 322 227 177 177 245
Total 1,535 1,112 2,146 4,010 4,713 4,259 2,087 952 848 805 768 732 717 789 583 371 371 914

24
Table 23Number of Jobs Created from SEA 3 in SNS$20/bbl and18p/thermOptimistic Scenario 2003 2004 2005 2006 2007 2008 2009 2010 2011 2012 2013 2014 2015 2016 2017 2018 2019 2020DirectExploration 162 139 23 0 0 0 0 0 0 0 0 0 0 0 0 0 0 0
Development +Decommissioning 21 80 206 365 389 233 114 32 0 0 6 8 0 21 0 36 0 73Opex 4 15 35 105 173 179 179 165 149 140 123 106 103 76 72 53 53 0
Total Direct Jobs 186 234 264 470 562 412 293 197 149 140 129 115 103 97 72 89 53 73
Indirect jobs (supplychain)Operations 10 41 93 280 462 480 479 441 398 374 330 284 275 204 192 142 142 0
Development +Decommissioning 169 647 1,672 2,968 3,161 1,892 929 263 0 0 45 67 0 169 0 293 0 596Exploration 531 455 76 0 0 0 0 0 0 0 0 0 0 0 0 0 0 0
Total direct andindirect 896 1,377 2,105 3,718 4,185 2,784 1,701 902 547 514 505 466 377 469 264 523 194 669
Induced jobs (trickledown) 623 781 882 1,572 1,878 1,379 980 660 498 468 431 383 343 324 240 297 177 245
Total 1,519 2,158 2,987 5,290 6,063 4,163 2,681 1,562 1,045 982 936 849 721 793 504 821 371 914

25
Table 24Number of Jobs Created from SEA 3 in CNS$20/bbl and18p/therm OptimisticScenario 2003 2004 2005 2006 2007 2008 2009 2010 2011 2012 2013 2014 2015 2016 2017DirectExploration 40 158 0 0 0 0 0 0 0 0 0 0 0 0 0
Development +Decommissioning 0 0 0 43 56 60 35 0 0 0 0 0 0 0 19Opex 0 0 0 0 13 21 25 25 23 23 23 23 23 23 0
Total Direct Jobs 40 158 0 43 69 81 60 25 23 23 23 23 23 23 19
Indirect jobs(supply chain)Operations 0 0 0 0 34 55 67 67 61 61 61 61 61 61 0
Development +Decommissioning 0 0 0 347 457 488 284 0 0 0 0 0 0 0 158Exploration 130 520 0 0 0 0 0 0 0 0 0 0 0 0 0
Total direct andindirect 170 678 0 389 560 625 411 93 83 83 83 83 83 83 177
Induced jobs(trickle down) 132 530 0 143 231 270 201 84 76 76 76 76 76 76 65
Total 302 1,208 0 532 791 895 612 177 159 159 159 159 159 159 242

26
Table 25Number of Jobs Created from SEA 3$15/bbl and12p/thermOptimistic Scenario 2003 2004 2005 2006 2007 2008 2009 2010 2011 2012 2013 2014 2015 2016DirectExploration 201 297 23 0 0 0 0 0 0 0 0 0 0 0Development +Decommissioning 21 29 76 130 85 96 48 0 0 8 0 7 14 19Opex 4 12 25 51 64 70 71 67 59 50 47 39 23 0
Total Direct Jobs 226 338 125 181 150 166 119 67 59 59 47 46 37 19
Indirect jobs(supply chain)Operations 10 33 68 137 172 189 190 178 159 134 126 105 61 0
Development +Decommissioning 169 236 619 1,056 694 776 388 0 0 67 0 53 116 158Exploration 661 975 76 0 0 0 0 0 0 0 0 0 0 0
Total direct andindirect 1,066 1,582 887 1,373 1,016 1,131 697 245 218 260 173 204 213 177
Induced jobs(trickle down) 755 1,131 417 605 501 555 397 222 199 196 157 153 123 65
Total 1,821 2,713 1,304 1,978 1,517 1,686 1,094 467 417 456 330 358 337 242

27
Table 26Number of Jobs Created from SEA 3$15/bbl and12p/thermPessimistic Scenario 2003 2004 2005 2006 2007 2008 2009 2010 2011 2012 2013 2014 2015 2016DirectExploration 201 86 0 0 0 0 0 0 0 0 0 0 0 0
Development +Decommissioning 0 0 55 118 85 96 48 0 0 0 0 7 14 19Opex 0 0 12 38 53 61 62 58 52 50 47 39 23 0
Total Direct Jobs 201 86 67 156 138 156 110 58 52 50 47 46 37 19
Indirect jobs(supply chain)Operations 0 0 31 102 142 162 167 156 139 134 126 105 61 0
Development +Decommissioning 0 0 451 954 694 776 388 0 0 0 0 53 116 158Exploration 661 282 0 0 0 0 0 0 0 0 0 0 0 0
Total direct andindirect 862 367 549 1,212 974 1,095 664 214 191 185 173 204 213 177
Induced jobs(trickle down) 673 287 225 520 463 522 368 195 174 168 157 153 123 65
Total 1,535 654 774 1,733 1,437 1,617 1,032 409 365 352 330 358 337 242

28
Table 27Number of Jobs Created from SEA 3 in SNS$15/bbl and12p/therm OptimisticScenario 2003 2004 2005 2006 2007 2008 2009 2010 2011 2012 2013 2014 2015DirectExploration 162 139 23 0 0 0 0 0 0 0 0 0 0
Development +Decommissioning 21 29 76 87 29 35 13 0 0 8 0 7 14Opex 4 12 25 51 52 50 46 41 37 28 24 17 0
Total Direct Jobs 186 180 125 138 81 85 59 41 37 36 24 23 14
Indirect jobs(supply chain)Operations 10 33 68 137 138 133 123 111 98 74 65 45 0
Development +Decommissioning 169 236 619 709 237 288 104 0 0 67 0 53 116Exploration 531 455 76 0 0 0 0 0 0 0 0 0 0
Total direct andindirect 896 904 887 984 455 506 286 152 135 177 90 121 130
Induced jobs(trickle down) 623 601 417 462 270 285 196 138 123 120 81 78 48
Total 1,519 1,505 1,304 1,446 725 791 482 290 258 297 171 199 177

29
Table 28Number of Jobs Created from SEA 3 in CNS
$15/bbl and12p/therm OptimisticScenario 2003 2004 2005 2006 2007 2008 2009 2010 2011 2012 2013 2014 2015 2016DirectExploration 40 158 0 0 0 0 0 0 0 0 0 0 0 0
Development +Decommissioning 0 0 0 43 56 60 35 0 0 0 0 0 0 19Opex 0 0 0 0 13 21 25 25 23 23 23 23 23 0
Total Direct Jobs 40 158 0 43 69 81 60 25 23 23 23 23 23 19
Indirect jobs(supply chain)Operations 0 0 0 0 34 55 67 67 61 61 61 61 61 0
Development +Decommissioning 0 0 0 347 457 488 284 0 0 0 0 0 0 158Exploration 130 520 0 0 0 0 0 0 0 0 0 0 0 0
Total direct andindirect 170 678 0 389 560 625 411 93 83 83 83 83 83 177
Induced jobs(trickle down) 132 530 0 143 231 270 201 84 76 76 76 76 76 65
Total 302 1,208 0 532 791 895 612 177 159 159 159 159 159 242

30
Table 29Number of Jobs Created from SEA 3
$25/bbl and24p/thermOptimistic Scenario 2003 2004 2005 2006 2007 2008 2009 2010 2011 2012 2013 2014 2015 2016 2017 2018 2019 2020 2021DirectExploration 201 297 23 0 0 0 0 0 0 0 0 0 0 0 0 0 0 0 0
Development +Decommissioning 21 80 206 408 445 293 149 32 0 0 0 6 8 0 21 19 0 36 73Opex 4 15 35 105 185 200 204 190 172 163 156 136 125 123 95 76 76 53 0
Total Direct Jobs 226 392 264 513 631 493 353 222 172 163 156 142 134 123 115 96 76 89 73
Indirect jobs(supply chain)Operations 10 41 93 280 496 536 546 509 459 435 417 365 336 330 253 204 204 142 0
Development +Decommissioning 169 647 1,672 3,315 3,618 2,380 1,212 263 0 0 0 45 67 0 169 158 0 293 596Exploration 661 975 76 0 0 0 0 0 0 0 0 0 0 0 0 0 0 0 0
Total direct andindirect 1,066 2,055 2,105 4,108 4,745 3,409 2,112 995 631 598 573 552 537 453 537 457 280 523 669
Induced jobs(trickle down) 755 1,311 882 1,715 2,109 1,649 1,182 744 574 543 521 474 447 412 385 319 255 297 245
Total 1,821 3,366 2,987 5,822 6,854 5,057 3,294 1,739 1,204 1,141 1,094 1,027 983 865 922 776 534 821 914

31
Table 30Number of Jobs Created from SEA 3
$25/bbl and24p/thermPessimistic Scenario 2003 2004 2005 2006 2007 2008 2009 2010 2011 2012 2013 2014 2015 2016 2017 2018 2019 2020 2021DirectExploration 201 86 0 0 0 0 0 0 0 0 0 0 0 0 0 0 0 0 0
Development +Decommissioning 0 37 166 283 305 261 84 0 0 0 0 0 0 0 21 19 0 0 73Opex 0 0 12 70 129 144 147 136 121 115 109 104 102 100 71 53 53 53 0
Total Direct Jobs 201 122 177 352 434 405 232 136 121 115 109 104 102 100 92 72 53 53 73
Indirect jobs(supply chain)Operations 0 0 31 186 345 385 394 363 323 307 293 279 273 267 191 142 142 142 0
Development +Decommissioning 0 298 1,344 2,295 2,481 2,117 685 0 0 0 0 0 0 0 169 158 0 0 596Exploration 661 282 0 0 0 0 0 0 0 0 0 0 0 0 0 0 0 0 0
Total direct andindirect 862 702 1,553 2,833 3,260 2,907 1,312 499 444 422 402 383 375 367 451 371 194 194 669
Induced jobs(trickle down) 673 409 593 1,177 1,452 1,353 775 453 404 383 366 349 341 334 308 242 177 177 245
Total 1,535 1,112 2,146 4,010 4,713 4,259 2,087 952 848 805 768 732 717 702 759 613 371 371 914

32
Table 31Number of Jobs Created from SEA 3 in SNS
$25/bbl and24p/therm OptimisticScenario 2003 2004 2005 2006 2007 2008 2009 2010 2011 2012 2013 2014 2015 2016 2017 2018 2019 2020 2021DirectExploration 162 139 23 0 0 0 0 0 0 0 0 0 0 0 0 0 0 0 0
Development +Decommissioning 21 80 206 365 389 233 114 32 0 0 0 6 8 0 21 0 0 36 73Opex 4 15 35 105 173 179 179 165 149 140 133 114 103 100 72 76 76 53 0
Total Direct Jobs 186 234 264 470 562 412 293 197 149 140 133 119 111 100 93 76 76 89 73
Indirect jobs(supply chain)Operations 10 41 93 280 462 480 479 441 398 374 356 304 275 269 192 204 204 142 0
Development +Decommissioning 169 647 1,672 2,968 3,161 1,892 929 263 0 0 0 45 67 0 169 0 0 293 596Exploration 531 455 76 0 0 0 0 0 0 0 0 0 0 0 0 0 0 0 0
Total direct andindirect 896 1,377 2,105 3,718 4,185 2,784 1,701 902 547 514 489 469 453 370 454 280 280 523 669
Induced jobs(trickle down) 623 781 882 1,572 1,878 1,379 980 660 498 468 445 399 371 336 310 255 255 297 245
Total 1,519 2,158 2,987 5,290 6,063 4,163 2,681 1,562 1,045 982 934 867 824 706 763 534 534 821 914

33
Table 32Number of Jobs Created from SEA 3 in CNS
$25/bbl and24p/therm OptimisticScenario 2003 2004 2005 2006 2007 2008 2009 2010 2011 2012 2013 2014 2015 2016 2017 2018DirectExploration 40 158 0 0 0 0 0 0 0 0 0 0 0 0 0 0
Development +Decommissioning 0 0 0 43 56 60 35 0 0 0 0 0 0 0 0 19Opex 0 0 0 0 13 21 25 25 23 23 23 23 23 23 23 0
Total Direct Jobs 40 158 0 43 69 81 60 25 23 23 23 23 23 23 23 19
Indirect jobs(supply chain)Operations 0 0 0 0 34 55 67 67 61 61 61 61 61 61 61 0
Development +Decommissioning 0 0 0 347 457 488 284 0 0 0 0 0 0 0 0 158Exploration 130 520 0 0 0 0 0 0 0 0 0 0 0 0 0 0
Total direct andindirect 170 678 0 389 560 625 411 93 83 83 83 83 83 83 83 177
Induced jobs(trickle down) 132 530 0 143 231 270 201 84 76 76 76 76 76 76 76 65
Total 302 1,208 0 532 791 895 612 177 159 159 159 159 159 159 159 242

34
9.0 Possible Investment, Operating and Decommissioning Expenditures
9.1 Capital expenditure (excluding drilling) for the SEA3 field developments with$20/bbl and 18p/therm price are shown in Tables 33 and 34 below.
Table 33
Potential Capex @ $20/bbl and 18p/therm, Hurdle Rate 15%Real 2002 (Optimistic Scenario)
Capital Costs(£m real 2002)CNS SNS Total
ExplorationFind
ExplorationFind
TechnicalReserves
YearPassing 15%Hurdle Rate
Passing 15%Hurdle Rate
Passing 15%Hurdle Rate
2003 0.00 0.00 6.29 6.292004 0.00 0.00 21.64 21.642005 0.00 16.81 32.02 48.842006 12.93 16.81 57.83 87.572007 6.47 0.00 57.83 64.292008 12.93 0.00 16.67 29.602009 0.00 0.00 0.00 0.00
Total £mReal 2002 32.33 33.63 192.28 258.24
Table 34Potential Capex @ $20/bbl and 18p/therm, Hurdle Rate 15%Real 2002 (Pessimistic Scenario
Capital Costs(£m real 2002)CNS SNS Total
ExplorationFind
ExplorationFind
TechnicalReserves
YearPassing 15%Hurdle Rate
Passing 15%Hurdle Rate
Passing 15%Hurdle Rate
2003 0.00 0.00 0.00 0.002004 0.00 0.00 11.11 11.112005 0.00 16.81 27.79 44.602006 12.93 16.81 27.79 57.532007 6.47 0.00 27.79 34.252008 12.93 0.00 16.67 29.602009 0.00 0.00 0.00 0.00
Total £mReal 2002 32.33 33.63 111.15 177.11
9.2 With the Optimistic Scenario under the medium price and the high price cases likelycapital expenditure (excluding drilling costs) may be £258.24 million (real 2002) andwith the Pessimistic Scenario it may be £177.11 million.

35
9.3 Development drilling expenditures for the SEA3 exploration and technical reservefield developments with an 18p/therm price are shown in Tables 35 and 36 below.
Table 35Potential Drilling @ $20/bbl and 18p/therm, Hurdle Rate 15% Real 2002(Optimistic Scenario)
Drilling Costs(£m real 2002)CNS SNS Total
Exploration FindExplorationFind
TechnicalReserves
YearPassing 15%Hurdle Rate
Passing 15%Hurdle Rate
Passing 15%Hurdle Rate
2003 0.00 0.00 0.00 0.002004 0.00 0.00 2.52 2.522005 0.00 0.00 13.54 13.542006 0.00 5.86 30.24 36.102007 10.58 8.84 51.27 70.692008 5.29 10.74 43.18 59.202009 10.58 3.88 30.78 45.242010 0.00 0.00 9.83 9.832011 0.00 0.00 0.00 0.00
Total £mReal 2002 26.45 29.32 181.35 237.13
Table 36Potential Drilling @ $20/bbl and 18p/therm, Hurdle Rate 15% Real 2002(Pessimistic Scenario)
Drilling Costs(£m real 2002)CNS SNS Total
Exploration FindExplorationFind
TechnicalReserves
YearPassing 15%Hurdle Rate
Passing 15%Hurdle Rate
Passing 15%Hurdle Rate
2003 0.00 0.00 0.00 0.002004 0.00 0.00 0.00 0.002005 0.00 0.00 5.56 5.562006 0.00 5.86 22.23 28.092007 10.58 8.84 38.90 58.322008 5.29 10.74 33.34 49.372009 10.58 3.88 11.11 25.582010 0.00 0.00 0.00 0.002011 0.00 0.00 0.00 0.00
Total £mReal 2002 26.45 29.32 111.15 166.92

36
9.4 With the Optimistic Scenario under the medium and the high price likely drillingexpenditure may be £273.13 million (real 2002) and with the Pessimistic Scenario itmay be £166.92 million.
9.5 The results indicate that over the period, total development expenditure at an $20/bbland 18p/ therm price could amount to more than £495 million in real 2001 terms forthe SEA3 area.
9.6 Operating expenditures for the SEA3 fields with an 18p/therm price are shown inTable 37 below and 38.
Table 37Potential Operating Cost @ $20/bbl and 18p/therm, Hurdle Rate 15% Real 2002(Optimistic Scenario)
Operating CostCosts (£m real2002) CNS SNS Total
ExplorationFind
ExplorationFind
TechnicalReserves
YearPassing 15%Hurdle Rate
Passing 15%Hurdle Rate
Passing 15%Hurdle Rate
2003 0.00 0.00 1.16 1.162004 0.00 0.00 4.63 4.632005 0.00 3.57 7.00 10.562006 0.00 11.56 20.17 31.732007 3.90 12.17 40.12 56.202008 6.27 12.10 42.26 60.622009 7.64 11.24 42.96 61.852010 7.64 9.99 39.95 57.592011 6.88 8.89 36.22 51.992012 6.88 8.34 34.04 49.262013 6.88 7.38 30.02 44.282014 6.88 7.38 24.81 39.072015 6.88 7.38 23.72 37.982016 6.88 0.00 23.07 29.952017 0.00 0.00 21.77 21.772018 0.00 0.00 16.02 16.022019 0.00 0.00 16.02 16.02
Total £m Real2002 66.70 100.02 423.96 590.68

37
Table 38
Potential Operating Cost @ $20/bbl and 18p/therm, Hurdle Rate 10% Real2002 (Pessimistic Scenario)
Operating CostCosts (£m real2002) CNS SNS Total
ExplorationFind
ExplorationFind
TechnicalReserves
YearPassing 15%Hurdle Rate
Passing 15%Hurdle Rate
Passing 15%Hurdle Rate
2003 0.00 0.00 0.00 0.002004 0.00 0.00 0.00 0.002005 0.00 3.57 0.00 3.57
2006 0.00 11.56 9.52 21.082007 3.90 12.17 22.99 39.06
2008 6.27 12.10 25.27 43.642009 7.64 11.24 25.77 44.662010 7.64 9.99 23.46 41.092011 6.88 8.89 20.85 36.612012 6.88 8.34 19.54 34.762013 6.88 7.38 18.89 33.152014 6.88 7.38 17.33 31.592015 6.88 7.38 16.68 30.942016 6.88 0.00 16.02 22.90
2017 0.00 0.00 14.72 14.722018 0.00 0.00 16.02 16.02
2019 0.00 0.00 16.02 16.02
Total £m Real 2002 66.70 100.02 263.08 429.80
9.7 With the Optimistic Scenario and the medium price likely operating expenditures maybe £590.68 million (real 2002) and with the Pessimistic Scenario they may be £429.8million.
9.8 Decommissioning costs for the SEA3 exploration and technical reserve fielddevelopments with an 18p/therm price are shown in Table 39 and 40 below.

38
Table 39Potential Decommissioning Cost @ $20/bbl and 18p/therm, HurdleRate 15% Real 2002 (Optimistic Scenario)
DecommissioningCosts (£m real2002) CNS SNS Total
ExplorationFind
ExplorationFind
TechnicalReserves
YearPassing 15%Hurdle Rate
Passing 15%Hurdle Rate
Passing 15%Hurdle Rate
2003 0.00 0.00 0.00 0.002004 0.00 0.00 0.00 0.002005 0.00 0.00 0.00 0.002006 0.00 0.00 0.00 0.002007 0.00 0.00 0.00 0.002008 0.00 0.00 0.00 0.002009 0.00 0.00 0.00 0.002010 0.00 0.00 0.00 0.002011 0.00 0.00 0.00 0.002012 0.00 0.00 0.00 0.002013 0.00 0.00 1.69 1.692014 0.00 0.00 2.52 2.522015 0.00 0.00 0.00 0.002016 0.00 6.29 0.00 6.292017 5.88 0.00 0.00 5.882018 0.00 0.00 10.92 10.922019 0.00 0.00 0.00 0.002020 0.00 0.00 22.23 22.23
Total £m Real2002 5.88 6.29 37.36 49.54

39
Table 40Potential Decommissioning Cost @ $20/bbl and 18p/therm, HurdleRate 15% Real 2002 (Pessimistic Scenario)
DecommissioningCosts (£m real2002) CNS SNS Total
ExplorationFind
ExplorationFind
TechnicalReserves
YearPassing 15%Hurdle Rate
Passing 15%Hurdle Rate
Passing 15%Hurdle Rate
2003 0.00 0.00 0.00 0.002004 0.00 0.00 0.00 0.002005 0.00 0.00 0.00 0.002006 0.00 0.00 0.00 0.002007 0.00 0.00 0.00 0.002008 0.00 0.00 0.00 0.002009 0.00 0.00 0.00 0.002010 0.00 0.00 0.00 0.002011 0.00 0.00 0.00 0.002012 0.00 0.00 0.00 0.002013 0.00 0.00 0.00 0.002014 0.00 0.00 0.00 0.002015 0.00 0.00 0.00 0.002016 0.00 6.29 0.00 6.292017 5.88 0.00 0.00 5.882018 0.00 0.00 0.00 0.002019 0.00 0.00 0.00 0.002020 0.00 0.00 22.23 22.23
Total £m Real2002 5.88 6.29 22.23 34.40
9.9 With the Optimistic Scenario and the medium price likely decommissioningexpenditure may be £49.54 million (real 2002) and with the Pessimistic Scenario itmay be £34.4 million.
9.10 Capital expenditures (excluding drilling) for the SEA3 field developments with a$15/bbl and 12p/therm are shown in Tables 41 and 42 below.

40
Table 41Potential Capex @ $15/bbl and 12p/therm, Hurdle Rate 15% Real2002 (Optimistic Scenario)
Capital Costs(£m real 2002) CNS SNS Total
ExplorationFind
ExplorationFind
TechnicalReserves
YearPassing 15%Hurdle Rate
Passing 15%Hurdle Rate
Passing 15%Hurdle Rate
2003 0.00 0.00 6.29 6.292004 0.00 0.00 6.29 6.292005 0.00 16.81 0.00 16.812006 12.93 16.81 0.00 29.752007 6.47 0.00 0.00 6.472008 12.93 0.00 0.00 12.932009 0.00 0.00 0.00 0.00
Total £m Real2002 32.33 33.63 12.58 78.54
Table 42Potential Capex @ $15/bbl and 12p/therm, Hurdle Rate 15% Real2002 (Pessimistic Scenario)
Capital Costs(£m real 2002) CNS SNS Total
ExplorationFind
ExplorationFind
TechnicalReserves
YearPassing 15%Hurdle Rate
Passing 15%Hurdle Rate
Passing 15%Hurdle Rate
2003 0.00 0.00 0.002004 0.00 0.00 0.002005 0.00 16.81 16.812006 12.93 16.81 29.752007 6.47 0.00 6.472008 12.93 0.00 12.932009 0.00 0.00 0.00
Total £m Real2002 32.33 33.63 0.00 65.96
9.11 With the Optimistic Scenario and the low price likely capital expenditure (excludingdrilling costs) may be only £78.54 million (real 2002) and with the PessimisticScenario they may be only £65.96 million.
9.12 Drilling expenditures for the SEA3 field developments with a $15/bbl and 12p/thermprice are shown in Tables 43 and 44 below.

41
Table 43Potential Drilling @ $15/bbl and 12p/therm, Hurdle Rate 15%Real 2002 (Optimistic Scenario)
Drilling Costs(£m real 2002)CNS SNS Total
ExplorationFind
ExplorationFind
TechnicalReserves
YearPassing 15%Hurdle Rate
Passing 15%Hurdle Rate
Passing 15%Hurdle Rate
2003 0.00 0.00 0.00 0.002004 0.00 0.00 2.52 2.522005 0.00 0.00 6.29 6.292006 0.00 5.86 3.77 9.642007 10.58 8.84 0.00 19.422008 5.29 10.74 0.00 16.032009 10.58 3.88 0.00 14.462010 0.00 0.00 0.00 0.002011 0.00 0.00 0.00 0.00
Total £mReal 2002 26.45 29.32 12.58 68.35
Table 44Potential Drilling @ $15/bbl and 12p/therm, Hurdle Rate 15%Real 2002 (Pessimistic Scenario)
Drilling Costs(£m real 2002)CNS SNS Total
ExplorationFind
ExplorationFind
TechnicalReserves
YearPassing 15%Hurdle Rate
Passing 15%Hurdle Rate
Passing 15%Hurdle Rate
2003 0.00 0.00 0.002004 0.00 0.00 0.002005 0.00 0.00 0.002006 0.00 5.86 5.862007 10.58 8.84 19.422008 5.29 10.74 16.032009 10.58 3.88 14.462010 0.00 0.00 0.002011 0.00 0.00 0.00
Total £mReal 2002 26.45 29.32 0.00 55.77
9.13 With the Optimistic Scenario and the low price likely drilling expenditure may beonly £68.35 million (real 2002) and with the Pessimistic Scenario they may be £55.77million.

42
9.14 The results indicate that over the period the total development expenditure at $15/bbland 12p/therm price could amount to more than £146 million in real 2002 terms forthe SEA3 area.
9.15 Operating expenditures for the SEA3 field developments with a $15/bbl and12p/therm price are shown in Tables 45 and 46 below.
Table 45Potential Operating Cost @ $15/bbl and 12p/therm, Hurdle Rate 15% Real 2002(Optimistic Scenario)
Operating CostCosts (£m real2002) CNS SNS Total
ExplorationFind Exploration Find
TechnicalReserves
YearPassing 15%Hurdle Rate
Passing 15%Hurdle Rate
Passing 15%Hurdle Rate
2003 0.00 0.00 1.16 1.162004 0.00 0.00 3.70 3.702005 0.00 3.57 4.11 7.672006 0.00 11.56 3.90 15.462007 3.90 12.17 3.43 19.512008 6.27 12.10 2.98 21.352009 7.64 11.24 2.68 21.562010 7.64 9.99 2.53 20.162011 6.88 8.89 2.23 18.002012 6.88 8.34 0.00 15.212013 6.88 7.38 0.00 14.262014 6.88 5.05 0.00 11.932015 6.88 0.00 0.00 6.88
Total £m Real2002 59.82 90.30 26.72 176.85

43
Table 46Potential Operating Cost @ $15/bbl and 12p/therm, Hurdle Rate15% Real 2002 (Pessimistic Scenario)
Operating Costs(£m real 2002) CNS SNS Total
ExplorationFind
ExplorationFind
TechnicalReserves
YearPassing 15%Hurdle Rate
Passing 15%Hurdle Rate
Passing 15%Hurdle Rate
2003 0.00 0.00 0.002004 0.00 0.00 0.002005 0.00 3.57 3.572006 0.00 11.56 11.562007 3.90 12.17 16.072008 6.27 12.10 18.372009 7.64 11.24 18.882010 7.64 9.99 17.632011 6.88 8.89 15.772012 6.88 8.34 15.212013 6.88 7.38 14.262014 6.88 5.05 11.932015 6.88 0.00 6.88
Total £m Real2002 59.82 90.30 0.00 150.13
9.16 With the Optimistic Scenario and the low price likely operating expenditures may beonly £176.85 million (real 2002) and with the Pessimistic Scenario they may be only£150.13 million.
9.17 Decommissioning costs for the SEA3 exploration and technical reserve fielddevelopments with a $15/bbl and 12p/therm price are shown in Tables 47 and 48below.

44
Table 47Potential Decommissioning Cost @ $15/bbl and 12p/therm, Hurdle Rate15% Real 2002 (Optimistic Scenario)
DecommissioningCosts (£m real2002) CNS SNS Total
ExplorationFind
ExplorationFind
TechnicalReserves
YearPassing 15%Hurdle Rate
Passing 15%Hurdle Rate
Passing 15%Hurdle Rate
2003 0.00 0.00 0.00 0.002004 0.00 0.00 0.00 0.002005 0.00 0.00 0.00 0.002006 0.00 0.00 0.00 0.002007 0.00 0.00 0.00 0.002008 0.00 0.00 0.00 0.002009 0.00 0.00 0.00 0.002010 0.00 0.00 0.00 0.002011 0.00 0.00 0.00 0.002012 0.00 0.00 2.52 2.522013 0.00 0.00 0.00 0.002014 0.00 1.98 0.00 1.982015 0.00 4.31 0.00 4.312016 5.88 0.00 0.00 5.88
Total £m Real2002 5.88 6.29 2.52 14.69

45
Table 48Potential Decommissioning Cost @ $15/bbl and 12p/therm, HurdleRate 15% Real 2002 (Pessimistic Scenario)
DecommissioningCosts (£m real2002) CNS SNS Total
ExplorationFind
ExplorationFind
TechnicalReserves
YearPassing 15%Hurdle Rate
Passing 15%Hurdle Rate
Passing 15%Hurdle Rate
2003 0.00 0.00 0.002004 0.00 0.00 0.002005 0.00 0.00 0.002006 0.00 0.00 0.002007 0.00 0.00 0.002008 0.00 0.00 0.002009 0.00 0.00 0.002010 0.00 0.00 0.002011 0.00 0.00 0.002012 0.00 0.00 0.002013 0.00 0.00 0.002014 0.00 1.98 1.982015 0.00 4.31 4.312016 5.88 0.00 5.88
Total £m Real2002 5.88 6.29 0.00 12.17
9.18 With the Optimistic Scenario and the low price likely decommissioning expendituresmay be £14.69 million (real 2002) and with the Pessimistic Scenario they may be£12.17 million.
9.19 Operating costs for the SEA3 field developments under the $25/bbl and 24p/thermscenario are shown in Tables 49 and 50. With the Optimistic Scenario and the highprice likely operating expenditures may be £640.22 million (real 2002) and with thePessimistic Scenario they may be £460.09 million.
9.20 Decommissioning costs for the SEA3 fields under the $25/bbl and 24p/therm scenarioare shown in Tables 51 and 52. With the Optimistic Scenario and the high pricelikely decommissioning expenditure may be £49.54 million (real 2002) and with thePessimistic Scenario it may be £34.4 million.

46
Table 49Potential Operating Cost @ $25/bbl and 24p/therm, Hurdle Rate 15%Real 2002 (Optimistic Scenario)
Operating Cost(£m real 2002) CNS SNS Total
Exploration FindExplorationFind
TechnicalReserves
YearPassing 15%Hurdle Rate
Passing 15%Hurdle Rate
Passing 15%Hurdle Rate
2003 0.00 0.00 1.16 1.162004 0.00 0.00 4.63 4.632005 0.00 3.57 7.00 10.562006 0.00 11.56 20.17 31.732007 3.90 12.17 40.12 56.202008 6.27 12.10 42.26 60.622009 7.64 11.24 42.96 61.852010 7.64 9.99 39.95 57.592011 6.88 8.89 36.22 51.992012 6.88 8.34 34.04 49.262013 6.88 7.38 32.95 47.212014 6.88 7.38 27.04 41.302015 6.88 7.38 23.72 37.982016 6.88 7.38 23.07 37.332017 6.88 0.00 21.77 28.642018 0.00 0.00 23.07 23.072019 0.00 0.00 23.07 23.072020 0.00 0.00 16.02 16.02
Total £m Real2002 73.58 107.41 459.24 640.22

47
Table 50Potential Operating Cost @ $25/bbl and 24p/therm, Hurdle Rate 15%Real 2002 (Pessimistic Scenario)
OperatingCosts (£m real2002) CNS SNS Total
Exploration FindExplorationFind
TechnicalReserves
YearPassing 15%Hurdle Rate
Passing 15%Hurdle Rate
Passing 15%Hurdle Rate
2003 0.00 0.00 0.00 0.002004 0.00 0.00 0.00 0.002005 0.00 3.57 0.00 3.572006 0.00 11.56 9.52 21.082007 3.90 12.17 22.99 39.062008 6.27 12.10 25.27 43.642009 7.64 11.24 25.77 44.662010 7.64 9.99 23.46 41.092011 6.88 8.89 20.85 36.612012 6.88 8.34 19.54 34.762013 6.88 7.38 18.89 33.152014 6.88 7.38 17.33 31.592015 6.88 7.38 16.68 30.942016 6.88 7.38 16.02 30.282017 6.88 0.00 14.72 21.592018 0.00 0.00 16.02 16.022019 0.00 0.00 16.02 16.022020 0.00 0.00 16.02 16.02
Total £m Real2002 73.58 107.41 279.10 460.09
9.21 With the Optimistic Scenario and the high price likely operating expenditures may be£640.22 million (real 2002) and with the Pessimistic Scenario they may be £460.09million.

48
Table 51Potential Decommissioning Cost @ $25/bbl and 24p/therm, Hurdle Rate15% Real 2002 (Optimistic Scenario)
DecommissioningCosts (£m real2002) CNS SNS Total
ExplorationFind Exploration Find
TechnicalReserves
YearPassing 15%Hurdle Rate
Passing 15%Hurdle Rate
Passing 15%Hurdle Rate
2003 0.00 0.00 0.00 0.002004 0.00 0.00 0.00 0.002005 0.00 0.00 0.00 0.002006 0.00 0.00 0.00 0.002007 0.00 0.00 0.00 0.002008 0.00 0.00 0.00 0.002009 0.00 0.00 0.00 0.002010 0.00 0.00 0.00 0.002011 0.00 0.00 0.00 0.002012 0.00 0.00 0.00 0.002013 0.00 0.00 0.00 0.002014 0.00 0.00 1.69 1.692015 0.00 0.00 2.52 2.522016 0.00 0.00 0.00 0.002017 0.00 6.29 0.00 6.292018 5.88 0.00 0.00 5.882019 0.00 0.00 0.00 0.002020 0.00 0.00 10.92 10.922021 0.00 0.00 22.23 22.23
Total £m Real2002 5.88 6.29 37.36 49.54

49
Table 52Potential Decommissioning Cost @ $25/bbl and 24p/therm, Hurdle Rate15% Real 2002 (Pessimistic Scenario)
DecommissioningCosts (£m real2002) CNS SNS Total
ExplorationFind Exploration Find
TechnicalReserves
YearPassing 15%Hurdle Rate
Passing 15%Hurdle Rate
Passing 15%Hurdle Rate
2003 0.00 0.00 0.00 0.002004 0.00 0.00 0.00 0.002005 0.00 0.00 0.00 0.002006 0.00 0.00 0.00 0.002007 0.00 0.00 0.00 0.002008 0.00 0.00 0.00 0.002009 0.00 0.00 0.00 0.002010 0.00 0.00 0.00 0.002011 0.00 0.00 0.00 0.002012 0.00 0.00 0.00 0.002013 0.00 0.00 0.00 0.002014 0.00 0.00 0.00 0.002015 0.00 0.00 0.00 0.002016 0.00 0.00 0.00 0.002017 0.00 6.29 0.00 6.292018 5.88 0.00 0.00 5.882019 0.00 0.00 0.00 0.002020 0.00 0.00 0.00 0.002021 0.00 0.00 22.23 22.23
Total £m Real2002 5.88 6.29 22.23 34.40
9.22 With the Optimistic Scenario and the high price likely decommissioning expendituremay be £49.54 million (real 2002) and with the Pessimistic Scenario it may be £34.4million.
10.0 Potential Tax Revenues
10.1 The potential tax take from the exploration, development and production activitieswas calculated under the existing tax arrangements. The expenditure figures are thosediscussed above. Thus the tax take takes no account of deductions for loan interest,overheads, and R and D expenditures. Accordingly, the tax revenue figures will beoverstated.

50
10.2 Tables 53 and 54 below shows the tax revenues from production under the $20/bbland 18p/therm case. Negative tax take reflects the relief of ongoing expenditure onnew projects against income received from non-SEA 3 fields.
Table 53
Potential Production Taxbill @ $20/bbl and 18p/therm, Hurdle Rate 15%Real 2002Taxbill (£m real2002) CNS SNS Total
ExplorationFind
ExplorationFind
TechnicalReserves
YearPassing 15%Hurdle Rate
Passing 15%Hurdle Rate
Passing 15%Hurdle Rate
2003 -4.80 -16.80 -3.97 -25.572004 -19.20 -16.80 -3.87 -39.872005 0.00 -2.50 -13.05 -15.552006 -5.17 7.23 -16.89 -14.842007 -1.19 12.52 1.78 13.102008 6.37 9.76 19.43 35.552009 8.87 11.17 28.66 48.712010 10.41 10.22 33.59 54.232011 7.13 8.01 29.14 44.282012 5.33 6.91 23.47 35.712013 4.43 4.99 20.16 29.592014 3.53 3.18 17.27 23.992015 2.64 0.43 16.10 19.172016 0.48 -2.52 13.75 11.722017 -2.35 0.00 10.30 7.952018 0.00 0.00 -1.38 -1.382019 0.00 0.00 0.64 0.642020 0.00 0.00 -8.89 -8.89
Total £m Real 2002 16.48 35.80 166.24 218.52

51
Table 54
Potential Production Taxbill @ $20/bbl and 18p/therm, Hurdle Rate 15%Real 2002 (Pessimistic Scenario)
Taxbill (£m real2002) CNS SNS Total
ExplorationFind Exploration Find
TechnicalReserves
YearPassing 15%Hurdle Rate
Passing 15%Hurdle Rate
Passing 15%Hurdle Rate
2003 -4.80 -16.80 -2.80 -24.402004 -4.80 -5.60 -4.45 -14.852005 0.00 -2.50 -13.34 -15.842006 -5.17 7.23 -11.29 -9.232007 -1.19 12.52 1.71 13.042008 6.37 9.76 7.47 23.602009 8.87 11.17 22.83 42.872010 10.41 10.22 25.07 45.702011 7.13 8.01 19.85 34.992012 5.33 6.91 17.24 29.482013 4.43 4.99 15.93 25.362014 3.53 3.18 14.99 21.702015 2.64 0.43 13.69 16.752016 0.48 -2.52 12.38 10.352017 -2.35 0.00 9.77 7.422018 0.00 0.00 2.99 2.992019 0.00 0.00 0.64 0.642020 0.00 0.00 -8.89 -8.89
Total £m Real2002 30.88 47.00 123.80 201.68
10.3 With the Optimistic Scenario and the medium price aggregate, tax revenues may be£218.52 million (real 2002) when allowance is given for exploration and appraisalexpenditures. With the Pessimistic Scenario tax revenue may be £201.68 million(real 2002).
10.4 Tables 55 and 56 show the take under the $15/bbl and 12p/therm case.

52
Table 55Potential Total Taxbill @ $15/bbl and 12p/therm, Hurdle Rate 15%Real 2002Taxbill (£m real2002) CNS SNS Total
ExplorationFind
ExplorationFind
TechnicalReserves
YearPassing 15%Hurdle Rate
Passing 15%Hurdle Rate
Passing 15%Hurdle Rate
2003 -4.80 -16.80 -4.57 -26.172004 -19.20 -16.80 -0.65 -36.652005 0.00 -4.39 -2.61 -7.002006 -5.17 0.25 0.55 -4.362007 -2.99 5.54 1.77 4.322008 2.33 3.46 1.22 7.012009 4.83 5.43 0.86 11.122010 7.05 5.48 0.68 13.212011 4.66 4.16 0.56 9.372012 3.31 3.49 -1.01 5.802013 2.64 2.34 0.00 4.982014 1.96 0.43 0.00 2.392015 1.29 -1.72 0.00 -0.432016 -2.35 0.00 0.00 -2.35
Total £m Real 2002 -6.45 -9.11 -3.20 -18.77

53
Table 56Potential Production Taxbill @ $15/bbl and 12p/therm, Hurdle Rate15% Real 2002 (Pessimistic Scenario)Taxbill (£m real2002) CNS SNS Total
ExplorationFind
ExplorationFind
TechnicalReserves
YearPassing 15%Hurdle Rate
Passing 15%Hurdle Rate
Passing 15%Hurdle Rate
2003 -4.80 -16.80 -2.80 -24.402004 -4.80 -5.60 0.00 -10.402005 0.00 -4.39 -4.392006 -5.17 0.25 -4.922007 -2.99 5.54 2.552008 2.33 3.46 5.792009 4.83 5.43 10.262010 7.05 5.48 12.532011 4.66 4.16 8.812012 3.31 3.49 6.802013 2.64 2.34 4.982014 1.96 0.43 2.392015 1.29 -1.72 -0.432016 -2.35 0.00 -2.35
Total £m Real 2002 7.95 2.09 -2.80 7.23
10.5 With the Optimistic Scenario and the low price tax revenues may be negative £18.77million (real 2002) when allowance is given for exploration and appraisalexpenditures. With the Pessimistic Scenario tax revenues may be £7.23 million (real2002).
10.6 The tax takes under the $25/bbl and 24p/therm are shown in Tables 57 and 58.

54
Table 57
Potential Production Taxbill @ $25/bbl and 24p/therm, Hurdle Rate 15% Real2002
Taxbill (£mreal 2002) CNS SNS Total
ExplorationFind Exploration Find
TechnicalReserves
YearPassing 15%Hurdle Rate
Passing 15%Hurdle Rate
Passing 15%Hurdle Rate
2003 -4.80 -16.80 -3.37 -24.972004 -19.20 -16.80 -1.33 -37.332005 0.00 -0.62 -9.46 -10.082006 -5.17 14.20 -8.09 0.942007 0.60 19.49 22.27 42.362008 10.41 16.06 39.52 65.982009 12.91 16.91 48.05 77.872010 13.78 14.96 51.43 80.172011 9.60 11.87 43.68 65.142012 7.35 10.32 35.84 53.512013 6.23 7.64 31.92 45.792014 5.11 5.22 27.09 37.422015 3.98 1.56 23.63 29.172016 1.29 0.43 21.41 23.132017 0.28 -2.52 16.64 14.402018 -2.35 0.00 6.87 4.522019 0.00 0.00 3.03 3.032020 0.00 0.00 -3.73 -3.732021 0.00 0.00 -8.89 -8.89
Total £mReal 2002 40.02 81.93 336.50 458.45

55
Table 58Potential Production Taxbill @ $25/bbl and 24p/therm, HurdleRate 15% Real 2002 (Pessimistic Scenario)
Taxbill (£mreal 2002) CNS SNS Total
ExplorationFind
ExplorationFind
TechnicalReserves
YearPassing 15%Hurdle Rate
Passing 15%Hurdle Rate
Passing 15%Hurdle Rate
2003 -4.80 -16.80 -2.80 -24.402004 -4.80 -5.60 -4.45 -14.852005 0.00 -0.62 -13.34 -13.962006 -5.17 14.20 -7.11 1.922007 0.60 19.49 14.24 34.342008 10.41 16.06 20.00 46.472009 12.91 16.91 35.36 65.182010 13.78 14.96 36.55 65.292011 9.60 11.87 29.24 50.712012 7.35 10.32 25.59 43.272013 6.23 7.64 23.76 37.642014 5.11 5.22 22.30 32.632015 3.98 1.56 20.47 26.012016 1.29 0.43 18.65 20.372017 0.28 -2.52 14.99 12.762018 -2.35 0.00 6.12 3.772019 0.00 0.00 2.99 2.992020 0.00 0.00 0.64 0.642021 0.00 0.00 -8.89 -8.89
Total £m Real2002 54.42 93.13 234.32 381.87
10.7 With the Optimistic Scenario and the high price tax revenues may be £458.45 million(real 2002) when allowance is given for exploration and appraisal expenditures.With the Pessimistic Scenario tax revenues may be £381.87 million (real 2002).
11.0 General Conclusions
11.1 With real oil prices of $20 per barrel and gas prices of 18 pence per therm licensing ofthe SEA3 area could lead to the cumulative production of over 16 million extrabarrels of oil and 890 billion extra cubic feet of gas. Total extra developmentexpenditure could amount to around £495 million at 2002 prices. Extra operatingexpenditures could amount to over £590 million at 2002 prices. Extra employmentwill be generated throughout the industry supply chain in the period 2002-2020 withthe peak being in 2007 at nearly 6,850 jobs under the Optimistic Scenario and 4,700under the Pessimistic Scenario.

56
11.2 Over the last few years the employment trend in the North Sea industry has beendownwards. The planned licensing round would make a modest but worthwhilecontribution towards moderating the pace of employment decrease. Currently theindustry is facing serious skill shortage and recruitment problems. One of the reasonsfor the recruitment problem is the perception that the North Sea industry is mature or“sunset”, and does not offer interesting long-term employment opportunities. Theeffects of the proposed round would be to extend the employment time horizons for amodest number of employees in the industry. This could also result in a smallincrease in the rate of return from investment in training.
References
PACEC (2002), UK Oil and Gas Supply Chain: Employment, Competitiveness, Innovationand Exports, Cambridge and LondonKemp A, and Stephen L, (2002(a)), The Prospects for Activity Levels in the UKCS: The2002 Perspective, University of Aberdeen, Department of Economics, North Sea Study PaperNo. 86, AberdeenKemp A, and Stephen L, (2002(b)), UK Gas Production, Imports and Networks: Response tothe PIU Report, University of Aberdeen, Department of Economics, North Sea Study PaperNo. 88, AberdeenKemp A, and Stephen L, (2001), Prospects for Gas Supply and Demand and theirImplications with Special Reference to the UK, Oxford Review of Economic Policy, Issue onEuropean Network Infrastructures, Vol. 17, No. 3, Autumn 2001Transco (2001), Transportation Ten-Year Statement, 2001, Solihull

57
Appendix I
Abbreviations
Boe: Barrels of oil equivalentCapex: Development costs excluding development drilling.CNS: Central North SeaDevelopment Costs (Devex): All field development costs including drilling and other capital
expenditure.
Mmcfd: Million cubic feet per dayNNS: Northern North SeaNPV: Net Present ValueOpex: Operating costsSNS: Southern North Seatb/d: Thousand barrels per dayTechnical reserves: Discovery not yet developed nor currently being considered for
development.